Embed Size (px)
Citation preview

Food Chemistry 127 (2011) 1273–1279
Contents lists available at ScienceDirect
Food Chemistry
journal homepage: www.elsevier .com/locate / foodchem
Analytical Methods
Ultrasound-assisted extraction of polysaccharides from mulberry leaves
Zhi Ying, Xiaoxiang Han ⇑, Jianrong Li ⇑College of Food Science and Biotechnology Engineering, Zhejiang Gongshang University, Hangzhou 310035, PR China
a r t i c l e i n f o a b s t r a c t
Article history:Received 28 August 2008Received in revised form 31 December 2010Accepted 22 January 2011Available online 27 January 2011
Keywords:Ultrasound-assisted extractionPolysaccharidesMulberry leavesChemical methods
0308-8146/$ - see front matter � 2011 Elsevier Ltd. Adoi:10.1016/j.foodchem.2011.01.083
⇑ Corresponding authors. Tel.: +86 571 88071024 7(X. Han).
E-mail addresses: [email protected] (X. Han), lijianr
Ultrasound-assisted extraction (UAE) of polysaccharides from mulberry leaves was studied. The effects offour factors on the yield of polysaccharides were investigated. The results showed that optimum condi-tions were extraction power of 60 W, extraction temperature of 60 �C, extraction time of 20 min and ratioof water to raw material of 15:1 (ml/g). The three different methods (UAE, MAE and CSE) were comparedfor extracting polysaccharides from the mulberry leaves by SEM images. Totally, UAE had the largest yieldof polysaccharides. The crude polysaccharides obtained from UAE were purified and two components(MPS-1 and MPS-2) were obtained. Their structure was analysed with chemical methods. From FT-IR,they were polysaccharides. MPS-1 had more functional groups than MPS-2. From HP GPC analysis, molec-ular weights of MPS-1 and MPS-2 were 24898D and 61131D, respectively. From GC analysis, MPS-1 wascomposed of Sor, Ara, Xyl and Glc, and MPS-2 was composed of Rha, Ara, Xyl, Glc, Gal and Man.
� 2011 Elsevier Ltd. All rights reserved.
1. Introduction ciency, reduces the consumption of solvents and shortens the
Mulberry is a Chinese traditional herbal medicine and growswell all over the year. In most mulberry-growing countries, mul-berry foliage is used to feed silkworms (Bombyx mori L.). As mul-berry has significant bioactivities (Asano et al., 2001; Jia, Tang, &Wu, 1999; Katsube et al., 2006), it is widely used to produce vari-ous functional foods, such as mulberry leaf carbonated beverage(Yan, Tu, Zheng, & Song, 2003) and healthy beverage mulberry leafchrysanthemum (Li & Zhang, 1998). Polysaccharides from the mul-berry leaves have significant antihyperglycaemic and antihyperli-pidemia activities (Wang & Li, 2005; Xue et al., 2005).
Conventional solvent extraction (CSE) is the most commonlyused method to extract polysaccharides. Although CSE is simpleand safe, high temperature and long extraction time of CSE leadto the degradation of polysaccharides and the decrease of the phar-macological activity of polysaccharides (Hromádková, Ebringerová,& Valachovic, 2002). Recently some new extraction methods havebeen developed to improve the extraction process, such as micro-wave-assisted extraction (MAE) and ultrasound-assisted extraction(UAE). Ganzler, SalGó, and Valkó (1986) initially used a domesticmicrowave oven for MAE for utilising microwave energy. Micro-wave energy in MAE is a non-ionising radiation. The radiationcauses motion of molecule and rotation of dipoles to heat solventsto promote targeted compounds to move from the sample matrixinto the solvent. However, the radiation does not induce changesin molecular structure (Wang, Meng, Lu, Liu, & Tao, 2007; Wanget al., 2007) Compared with CSE, MAE improves the extraction effi-
ll rights reserved.
581; fax: +86 571 88056656
[email protected] (J. Li).
extraction time. MAE has been widely applied to extract ginsengcomponents (Kwon, Bélanger, Paré, & Yaylayan, 2003; Kwon, Lee,Kim, Bélanger, & Paré, 2004; Vongsangnak, Gua, Chauvatcharin, &Zhong, 2004). UAE is another advanced method. The acoustic cav-itation in UAE causes disruption of the cell walls, reduction of theparticle size and enhancement on contact between solvents andtargeted compounds (Rostagno, Palma, & Barroso, 2003). As UAEhas lower energy consumption, lower consumption of solvents,higher extraction efficiency and higher level of automation, UAEis preferable to CSE. UAE has been used to extract the organic com-pounds from soil, animal and plant tissues (Hromádková &Ebringerová, 2003; Hromádková, Ebringerová, & Valachovic,1999; Paniwnyk, Beaufoy, Lorimer, & Mason, 2001; Tor, Aydin, &Özcan, 2006). CSE with low yield of polysaccharides has been com-monly used to extract polysaccharides from the mulberry leaves,but few researches regarding MAE and UAE of polysaccharidesfrom the mulberry leaves have been reported.
The aim of the present work was to determine the effects ofextraction power, extraction temperature, extraction time and ratioof water to raw material in UAE on the yield of polysaccharides fromthe mulberry leaves. Three different methods (CSE, MAE and UAE)were compared on the yields of polysaccharides from the mulberryleaves. In addition, isolation, purification, and chemical character-isation of polysaccharides obtained from UAE were also researched.
2. Materials and methods
2.1. Materials and chemicals
The mulberry leaves were given by Huzhou Daybreak Import &Export Co., Ltd. (Zhejiang, China). The mulberry leaves were ground

Table 1bCentral composite rotatory design (CCRD) and responsea of MAE.
Run Independent variables Response (%) Yb
Extractiontime (min)
Power ofmicrowave (W)
Ratio of water toraw material (ml/g)
1 11 240 25:1 7.822 9 360 20:1 7.993 10 480 30:1 9.724 9 480 25:1 8.695 10 480 20:1 7.196 10 240 30:1 6.657 9 360 30:1 8.258 11 360 20:1 6.829 9 240 25:1 7.01
10 11 480 25:1 8.7411 11 360 30:1 8.5912 10 240 20:1 7.8313 10 360 25:1 8.7514 10 360 25:1 8.6515 10 360 25:1 8.45
a Non-randomised.b y ¼ polysaccharides weight
mulberry leaves powder weight� 100.
Table 1cCentral composite rotatory design (CCRD) and responsea of UAE.
1274 Z. Ying et al. / Food Chemistry 127 (2011) 1273–1279
to fine powder, then defatted with petroleum ether and pretreatedwith 80% ethanol for two times prior to experiments. D-Glucose,standard dextran (Dextran T10, T40, T70, T500) and standardmonosaccharide (Sor, Rha, Ara, Xyl, Man, Gal and Glc) were ob-tained from Sigma–Aldrich (St. Louis, MO, USA), whilst DEAE Se-pharose Fast Flow and Sephadex G-100 were from the PharmaciaCo. (Sweden). All other chemicals used were of analytical grade.
2.2. Extraction methods
2.2.1. CSE of polysaccharides from mulberryConventional solvent extraction was carried out in a HH-6
water bath (Guohua Wiring Company, Shanghai, China). About10.0 g of the ground powder was mixed with distilled water in around bottomed flask. Extractions were carried out referring toconditions in Table 1a. Debris fragments of polysaccharides ex-tracts were removed by centrifugation. The solution of polysaccha-rides was concentrated with a rotary evaporator and precipitatedwith four volumes of 95% (V/V) ethanol for 48 h at 4 �C. The precip-itates were obtained by centrifugation (6000 r/min, 30 min),washed with acetone and then dried under reduced pressure at�40 �C to get crude polysaccharides.
2.2.2. MAE of polysaccharides from mulberryAbout 10.0 g of the ground powder was mixed with distilled
water in a plastic bag and then placed in a MEI-3L microwave extrac-tion apparatus (Wuxi Pulaima Instrument Co., Ltd., Jiangsu, China).Extractions were carried on referring to conditions in Table 1b.The following processes were similar to the CSE of polysaccharides.
2.2.3. UAE of polysaccharides from mulberryThe procedure of UAE was developed by Wu, Ling, and Chau
(2001) with some modifications. The powder of the mulberry leaves
Table 1aCentral composite rotatory design (CCRD) and responsea of CSE.
Run Independent variables Response(%) Yb
Ratio of water toraw material(ml/g)
Extractiontime(min)
Extractionfrequency(n)
Extractiontemperature(�C)
1 15:1 30 2 70 2.612 15:1 30 1 80 3.293 20:1 60 2 70 3.594 15:1 90 2 70 3.315 15:1 60 3 90 3.396 10:1 30 2 80 2.307 10:1 60 1 80 2.258 20:1 60 2 90 3.399 15:1 30 2 90 2.48
10 20:1 60 1 80 2.7211 20:1 60 3 80 3.9212 15:1 60 3 70 3.3213 15:1 90 3 80 4.7714 20:1 30 2 80 2.8915 15:1 60 1 70 2.2516 10:1 60 2 90 2.3117 15:1 90 2 90 3.8718 10:1 90 2 80 3.2719 15:1 60 1 90 3.2620 10:1 60 2 70 2.4121 10:1 60 3 80 3.3922 15:1 30 3 80 2.6723 20:1 90 2 80 5.1024 15:1 90 1 80 3.6725 15:1 60 2 80 3.5926 15:1 60 2 80 3.5727 15:1 60 2 80 3.89
a Non-randomised.b y ¼ polysaccharides weight
mulberry leaves powder weight� 100.
(10.0 g) was extracted with distilled water in a KQ-2200DB ultra-sonic cleaner bath (Kunshan Ultrasound Instrument Co., Ltd., Jiang-su, China). Extractions were carried out referring to conditions inTable 1c. The following processes were similar to the CSE ofpolysaccharides.
2.3. Isolation and purification of polysaccharides
Firstly, macroporous resin D3520 was used to decolour anddeproteinise crude polysaccharides from UAE, then isolated with
Run Independent variables Response(%) Yb
Extractiontemperature(�C)
Power ofultrasound(W)
Extractiontime(min)
Ratio of waterto rawmaterial (ml/g)
1 50 50 15 10:1 3.062 50 50 15 20:1 7.393 50 50 25 10:1 4.604 50 50 25 20:1 4.595 50 70 15 10:1 3.726 50 70 15 20:1 3.657 50 70 25 10:1 5.878 50 70 25 20:1 3.309 70 50 15 10:1 7.49
10 70 50 15 20:1 9.9011 70 50 25 10:1 7.3712 70 50 25 20:1 7.4513 70 70 15 10:1 7.5514 70 70 15 20:1 7.3115 70 70 25 10:1 9.4016 70 70 25 20:1 7.0317 40 60 20 15:1 3.2918 80 60 20 15:1 10.9919 60 40 20 15:1 6.5120 60 80 20 15:1 5.9421 60 60 10 15:1 3.7922 60 60 30 15:1 4.5223 60 60 20 5:1 5.9624 60 60 20 25:1 6.7925 60 60 20 15:1 7.4626 60 60 20 15:1 8.3327 60 60 20 15:1 8.1328 60 60 20 15:1 8.1829 60 60 20 15:1 7.8130 60 60 20 15:1 7.9031 60 60 20 15:1 7.93
a Non-randomised.b y ¼ polysaccharides weight
mulberry leaves powder weight� 100.

Z. Ying et al. / Food Chemistry 127 (2011) 1273–1279 1275
DEAE Sepharose Fast Flow ion exchange column (16 � 200 mm).The column was eluted with distilled water for 50 min, followedby 0.5 M NaCl for 80 min, at a flow rate of 0.5 ml/min. The majorpolysaccharide fractions were collected with a fraction collectorand concentrated using a rotary evaporator at 65 �C. A 0.2 ml sam-ple of the fraction with the largest amount of polysaccharide mate-rial was then loaded onto a Sephadex G-100 gel column(16 � 300 mm) and eluted with 50 ml of distilled water at a flowrate of 0.25 ml/min. The fraction with the highest polysaccharidecontent was collected and then freeze dried. The purity of the frac-tion was determined by HP GPC. All of these fractions were assayedfor sugar content by the phenol–sulfuric acid method.
2.4. Analytical methods
2.4.1. General methodsThe total carbohydrate was determined by phenol–sulfuric acid
colorimetric method and D-glucose was used as the standard (Du-bois, Gilles, Hamilton, Rebers, & Smith, 1956). The protein wasexamined by using Coomassie Brilliant Blue. The starch was exam-ined by iodination. The reducing sugar was examined by Fehling’stest. The shape and surface characteristics of the samples afterextraction (CSE, MAE or UAE) were measured by scanning electronmicroscope (Philips XL 30 ESEM, Philips, Holland).
2.4.2. Determination of the molecular weightThe molecular weight of the purified fraction of polysaccharide
was determined by gel-permeation chromatography (GPC), incombination with a high-performance liquid chromatographyinstrument (Angilent1100, USA) equipped with an Ultrahydrogelcolumn. The purified fraction of polysaccharide was dissolved indistilled water (2 ml) and passed through a 0.45 lm filter, appliedto a gel-filtration chromatographic column of ZORBAX PSM 1000GPC-SEC maintained at a temperature of 30 �C, eluted with the dis-tilled water at a flow rate of 1.0 ml/min and detected by a refrac-tive index detector. Preliminary calibration of the column wasconducted using dextrans of different molecular weight (Dextran
Fig. 1. Effects of four factors on the yield of polysaccharides: (a) extraction power, (b)
T10, T40, T70, T500, and glucose). The molecular weight was calcu-lated by the calibration curve obtained by using various standarddextrans (Wang, Liang, & Zhang, 2001).
2.4.3. FT-IR analysisThe polysaccharides were ground with KBr powder and then
pressed into pellets for FT-IR measurement in the frequency rangeof 4000–400 cm�1 to detect functional groups.
2.4.4. Monosaccharide compositionThe polysaccharide (10 mg) was dissolved in 2 M trifluoroacetic
acid (TFA, 2 ml), was hydrolysed at 120 �C for 6 h and then hydro-lysed products were evicted TFA by ethanol and dried. Monosac-charide alditol acetate was prepared using a method describedpreviously (Blakeney, Harris, Henry, & Stone, 1983). Derivationwas loaded onto a HP-5 (30 m � 0.32 mm � 0.25 um) capillarygas chromatography (GC) column equipped with a flame-ionisa-tion detector (FID), using inositol as the internal standard. Theoperation was performed using the following conditions: H2:30 ml/min; air: 300 ml/min; N2: 25 ml/min; injection tempera-ture: 235 �C; detector temperature: 280 �C; column temperatureprogrammed from 165 to 170 �C at 1 �C/min, holding for 1 min at170 �C, then increasing to 175 �C at 1 �C/min, holding for 1 min at175 �C, and finally increasing to 190 �C at 1 �C/min.
3. Results and discussion
3.1. Effects of operation parameters of UAE on the yield
3.1.1. Effects of extraction power on the yield of polysaccharidesThe extraction efficiency of UAE was influenced by various fac-
tors. Fig. 1a listed the effect of extraction power on the yield of poly-saccharides and other extraction conditions were fixed as follows:extraction temperature of 60 �C, extraction time of 15 min, ratioof water to raw material of 15:1 (ml/g). The results showed thatthe yield of polysaccharides increased significantly with increasingextraction power, and then decreased when the extraction power
extraction temperature, (c) extraction time and (d) ratio of water to raw material.
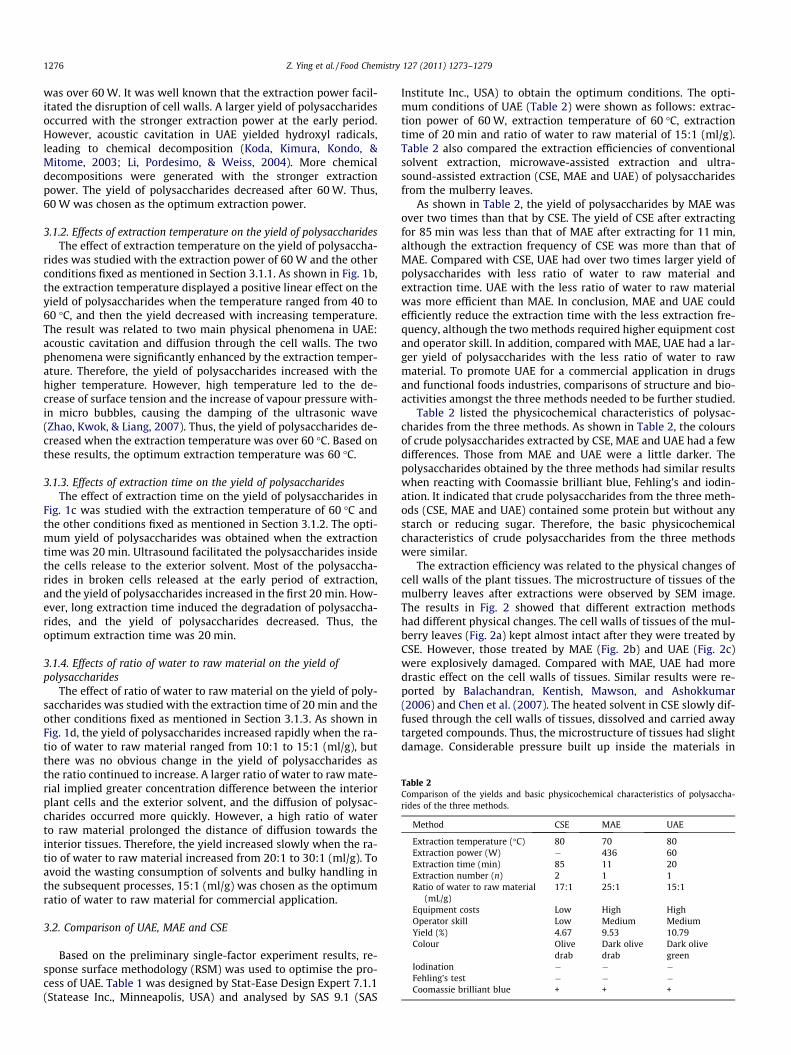
Table 2Comparison of the yields and basic physicochemical characteristics of polysaccha-rides of the three methods.
Method CSE MAE UAE
Extraction temperature (�C) 80 70 80Extraction power (W) � 436 60Extraction time (min) 85 11 20Extraction number (n) 2 1 1Ratio of water to raw material
(mL/g)17:1 25:1 15:1
Equipment costs Low High HighOperator skill Low Medium MediumYield (%) 4.67 9.53 10.79Colour Olive
drabDark olivedrab
Dark olivegreen
Iodination � � �Fehling’s test � � �Coomassie brilliant blue + + +
1276 Z. Ying et al. / Food Chemistry 127 (2011) 1273–1279
was over 60 W. It was well known that the extraction power facil-itated the disruption of cell walls. A larger yield of polysaccharidesoccurred with the stronger extraction power at the early period.However, acoustic cavitation in UAE yielded hydroxyl radicals,leading to chemical decomposition (Koda, Kimura, Kondo, &Mitome, 2003; Li, Pordesimo, & Weiss, 2004). More chemicaldecompositions were generated with the stronger extractionpower. The yield of polysaccharides decreased after 60 W. Thus,60 W was chosen as the optimum extraction power.
3.1.2. Effects of extraction temperature on the yield of polysaccharidesThe effect of extraction temperature on the yield of polysaccha-
rides was studied with the extraction power of 60 W and the otherconditions fixed as mentioned in Section 3.1.1. As shown in Fig. 1b,the extraction temperature displayed a positive linear effect on theyield of polysaccharides when the temperature ranged from 40 to60 �C, and then the yield decreased with increasing temperature.The result was related to two main physical phenomena in UAE:acoustic cavitation and diffusion through the cell walls. The twophenomena were significantly enhanced by the extraction temper-ature. Therefore, the yield of polysaccharides increased with thehigher temperature. However, high temperature led to the de-crease of surface tension and the increase of vapour pressure with-in micro bubbles, causing the damping of the ultrasonic wave(Zhao, Kwok, & Liang, 2007). Thus, the yield of polysaccharides de-creased when the extraction temperature was over 60 �C. Based onthese results, the optimum extraction temperature was 60 �C.
3.1.3. Effects of extraction time on the yield of polysaccharidesThe effect of extraction time on the yield of polysaccharides in
Fig. 1c was studied with the extraction temperature of 60 �C andthe other conditions fixed as mentioned in Section 3.1.2. The opti-mum yield of polysaccharides was obtained when the extractiontime was 20 min. Ultrasound facilitated the polysaccharides insidethe cells release to the exterior solvent. Most of the polysaccha-rides in broken cells released at the early period of extraction,and the yield of polysaccharides increased in the first 20 min. How-ever, long extraction time induced the degradation of polysaccha-rides, and the yield of polysaccharides decreased. Thus, theoptimum extraction time was 20 min.
3.1.4. Effects of ratio of water to raw material on the yield ofpolysaccharides
The effect of ratio of water to raw material on the yield of poly-saccharides was studied with the extraction time of 20 min and theother conditions fixed as mentioned in Section 3.1.3. As shown inFig. 1d, the yield of polysaccharides increased rapidly when the ra-tio of water to raw material ranged from 10:1 to 15:1 (ml/g), butthere was no obvious change in the yield of polysaccharides asthe ratio continued to increase. A larger ratio of water to raw mate-rial implied greater concentration difference between the interiorplant cells and the exterior solvent, and the diffusion of polysac-charides occurred more quickly. However, a high ratio of waterto raw material prolonged the distance of diffusion towards theinterior tissues. Therefore, the yield increased slowly when the ra-tio of water to raw material increased from 20:1 to 30:1 (ml/g). Toavoid the wasting consumption of solvents and bulky handling inthe subsequent processes, 15:1 (ml/g) was chosen as the optimumratio of water to raw material for commercial application.
3.2. Comparison of UAE, MAE and CSE
Based on the preliminary single-factor experiment results, re-sponse surface methodology (RSM) was used to optimise the pro-cess of UAE. Table 1 was designed by Stat-Ease Design Expert 7.1.1(Statease Inc., Minneapolis, USA) and analysed by SAS 9.1 (SAS
Institute Inc., USA) to obtain the optimum conditions. The opti-mum conditions of UAE (Table 2) were shown as follows: extrac-tion power of 60 W, extraction temperature of 60 �C, extractiontime of 20 min and ratio of water to raw material of 15:1 (ml/g).Table 2 also compared the extraction efficiencies of conventionalsolvent extraction, microwave-assisted extraction and ultra-sound-assisted extraction (CSE, MAE and UAE) of polysaccharidesfrom the mulberry leaves.
As shown in Table 2, the yield of polysaccharides by MAE wasover two times than that by CSE. The yield of CSE after extractingfor 85 min was less than that of MAE after extracting for 11 min,although the extraction frequency of CSE was more than that ofMAE. Compared with CSE, UAE had over two times larger yield ofpolysaccharides with less ratio of water to raw material andextraction time. UAE with the less ratio of water to raw materialwas more efficient than MAE. In conclusion, MAE and UAE couldefficiently reduce the extraction time with the less extraction fre-quency, although the two methods required higher equipment costand operator skill. In addition, compared with MAE, UAE had a lar-ger yield of polysaccharides with the less ratio of water to rawmaterial. To promote UAE for a commercial application in drugsand functional foods industries, comparisons of structure and bio-activities amongst the three methods needed to be further studied.
Table 2 listed the physicochemical characteristics of polysac-charides from the three methods. As shown in Table 2, the coloursof crude polysaccharides extracted by CSE, MAE and UAE had a fewdifferences. Those from MAE and UAE were a little darker. Thepolysaccharides obtained by the three methods had similar resultswhen reacting with Coomassie brilliant blue, Fehling’s and iodin-ation. It indicated that crude polysaccharides from the three meth-ods (CSE, MAE and UAE) contained some protein but without anystarch or reducing sugar. Therefore, the basic physicochemicalcharacteristics of crude polysaccharides from the three methodswere similar.
The extraction efficiency was related to the physical changes ofcell walls of the plant tissues. The microstructure of tissues of themulberry leaves after extractions were observed by SEM image.The results in Fig. 2 showed that different extraction methodshad different physical changes. The cell walls of tissues of the mul-berry leaves (Fig. 2a) kept almost intact after they were treated byCSE. However, those treated by MAE (Fig. 2b) and UAE (Fig. 2c)were explosively damaged. Compared with MAE, UAE had moredrastic effect on the cell walls of tissues. Similar results were re-ported by Balachandran, Kentish, Mawson, and Ashokkumar(2006) and Chen et al. (2007). The heated solvent in CSE slowly dif-fused through the cell walls of tissues, dissolved and carried awaytargeted compounds. Thus, the microstructure of tissues had slightdamage. Considerable pressure built up inside the materials in

Fig. 2. Scanning electron micrographs of mulberry leaves after extraction: (a)treated by CSE, (b) treated by MAE and (c) treated by UAE.
Fig. 3. Elution curve of polysaccharide on DEAE Sepharose FF ion exchange column.
Z. Ying et al. / Food Chemistry 127 (2011) 1273–1279 1277
MAE (Kratchanova, Pavlova, & Panchev, 2004). The high pressuredrastically changed the physical properties of the cell walls of tis-sues, broke down the cell structure and improved the capillary-porous structure of the tissues. In addition, many hollow openingsin UAE led to explosive disruption of the physical structure of cellwalls of tissues.
The polysaccharides extracted by the three methods were ana-lysed by FT-IR to detect functional groups. An intense peak at3423 cm�1 was –OH stretching peak and the band at around2925 cm�1 was C–H stretching vibration. The peak at 2367 cm�1
was C–H transiting angle. The carbonyl (C@O) stretching was at1732 and 1625 cm�1. The bands at 1312 and 1252 cm�1 indicated
ring breathing with C–O stretching (Sandula, Kogan, Kacurakova, &Machova, 1999). The peak at 1252 cm�1 was unsymmetrical car-bonyl stretching. Two absorptions between 1100 and 1010 cm�1
was the stretching vibration of furanose. A characteristic absorp-tion at 915 cm�1 indicated the existence of a-D-glucan (Sun &Tomkinson, 2002). Polysaccharides extracted by MAE and UAEhad less functional groups than polysaccharides extracted by CSE.There was only one peak (1100 and 1010 cm�1) in both figures,which indicated the existence of pyranose. a-D-Glucan at915 cm�1 did not exist in polysaccharides extracted by MAE andUAE. Polysaccharides extracted by MAE did not have the C–Htransiting angle peak at 2367 cm�1. In conclusion, FT-IR spectraof three polysaccharides were similar.
3.3. Isolation and structural characterisation of polysaccharides
3.3.1. Isolation, purification and molecular weight f MPS-1 and MPS-2The crude polysaccharides obtained from UAE were further iso-
lated with DEAE Sepharose Fast Flow ion exchange column andSephadex G-100 column, and two fractions were obtained(Fig. 3), they were named MPS-1 and MPS-2, respectively. Theywere determined pure by HP GPC.
From HP GPC analysis, the calibration curve was got by usingvarious standard dextrans. After calculating, the molecular weightsof MPS-1 and MPS-2 were 24898D and 61131D, respectively.
3.3.2. FT-IR analysis of MPS-1 and MPS-2The IR spectra of MPS-1 and MPS-2 were basically indistinguish-
able only with some difference in the intensity of bands (Fig. 4).Intense peaks at 3425 cm�1 (Fig. 4a) and 3437 cm�1 (Fig. 4b) were–OH stretching peak. The bands at around 2927 cm�1 (Fig. 4a) and2925 cm�1 (Fig. 4b) were C–H stretching vibration. The peak ofMPS-1 at 1242 cm�1 was unsymmetrical carbonyl stretching. Thepeak at 2368 cm�1 (Fig. 4a) and 2366 cm�1 (Fig. 4b) were C–Htransiting angle. Two absorptions (Fig. 4a) between 1100 and1010 cm�1 were indicating the stretching vibration of furanose.There was only one peak (1100 and 1010 cm�1) of MPS-2, whichindicated the existence of pyranose. a-D-glucan at 920 cm�1
(Fig. 4a) did not exist in MPS-2 (Sun & Tomkinson, 2002). In conclu-sion, MPS-1 and MPS-2 were both polysaccharides, and MPS-1 hadmore functional groups than MPS-2.
3.3.3. Monosaccharide composition of MPS-1 and MPS-2According to the retention time of standard monosaccharides,
MPS-2 was composed of Rha, Ara, Xyl, Glc, Gal and Man with a

550.331036.52
1410.96
1614.34
2366.55
2853.38
2925.87
3437.64
23
24
25
26
27
28
29
30
31
32
33
34
Tra
nsm
ittan
ce%
532.11
920.21
1019.781099.18
1242.42
1325.62
1411.48
1614.92
1741.65
2368.34
2856.22
2927.83
3425.29 1920
212223242526272829303132
1000 2000 3000 4000
%T
rans
mitt
ance
Wavenumbers (cm-1)
1000 2000 3000 4000
Wavenumbers (cm-1)
Fig. 4. IR spectrum: (a) MPS-1 and (b) MPS-2.
1278 Z. Ying et al. / Food Chemistry 127 (2011) 1273–1279
molar ratio of 13.8:9.7:14.4:9.6:9.3:13.5. The ratio of Sor:Ara:Xyl:Glcwas 3:2:17:110, and Rha and Gal were not detected in MPS-1.
4. Conclusion
The factors of UAE on the yield of polysaccharides from the mul-berry leaves were studied. The results showed that an optimumyield of polysaccharides could be obtained when conditions wereset as follows: extraction power was of 60 W, extraction tempera-ture of 60 �C, extraction time of 20 min and ratio of water to rawmaterial of 15:1 (ml/g). Compared with CSE, MAE and UAE werebetter to extract polysaccharides from the mulberry leaves. Thetwo methods showed larger yield of polysaccharides, less extrac-tion time and extraction frequency, although equipment costsand operator skill of MAE and UAE were higher. Polysaccharidesextracted by the three methods showed similar physicochemicalcharacteristics and FT-IR spectra. However, SEM images of tissuesof the mulberry leaves after extractions were significantly differ-ent. Based on the review of extraction methods, the most promis-ing technique was UAE for extracting polysaccharides from themulberry leaves.
The crude polysaccharides were isolated with macroporous re-sin D3520, DEAE Sepharose Fast Flow ion exchange column andSephadex G-100 column, and two components were obtained(MPS-1 and MPS-2). The structure of MPS-1 and MPS-2 was ana-lysed with different chemical methods. From FT-IR, MPS-1 andMPS-2 were polysaccharides. MPS-1 had more functional groupsthan MPS-2. From HP GPC analysis, molecular weights of MPS-1and MPS-2 were 24898D and 61131D, respectively. From GC anal-ysis, MPS-1 was composed of Sor, Ara, Xyl and Glc with a molar ra-tio of 3:2:17:110. MPS-2 was composed of Rha, Ara, Xyl, Glc,Galand Man with a molar ratio of 13.8:9.7:14.4:9.6:9.3:13.5.
Acknowledgements
This research was supported by functional foods research anddevelopment in the Eleventh Five Years Plan of PR China (GrantCode 2006BAD27B03).
References
Asano, N., Yamashita, T., Yasuda, K., Ikeda, K., Kizu, H., Kameda, Y., et al. (2001).Polyhydroxylated alkaloids isolated from mulberry trees (Morus alba L.) andsilkworms (Bombyx mori L.). Journal of Agricultural and Food Chemistry, 49,4208–4213.
Balachandran, S., Kentish, S. E., Mawson, R., & Ashokkumar, M. (2006). Ultrasonicenhancement of supercritical extraction from ginger. Ultrasonics Sonochemistry,13, 471–479.
Blakeney, A. B., Harris, P. J., Henry, R. J., & Stone, B. A. (1983). A simple and rapidpreparation of alditol acetates for monosaccharides analysis. CarbohydrateResearch, 113, 291–299.
Chen, F., Sun, Y. Z., Zhao, G. H., Liao, X. J., Hu, X. S., Wu, J. H., et al. (2007).Optimisation of ultrasound-assisted extraction of anthocyanins in redraspberries and identification of anthocyanins in extract using high-performance liquid chromatography–mass spectrometry. UltrasonicsSonochemistry, 14, 767–778.
Dubois, M., Gilles, K. A., Hamilton, J. K., Rebers, P. A., & Smith, F. (1956). Colorimetricmethod for determination of sugars and related substances. AnalyticalChemistry, 28, 350–356.
Ganzler, K., SalGó, A., & Valkó, K. (1986). Microwave extraction: A novel samplepreparation method for chromatography. Journal of Chromatography A, 371,299–306.
Hromádková, Z., & Ebringerová, A. (2003). Ultrasonic extraction of plant materialsinvestigation of hemicellulose release from buckwheat hulls. UltrasonicsSonochemistry, 10, 127–133.
Hromádková, Z., Ebringerová, A., & Valachovic, P. (1999). Comparison of classicaland ultrasound-assisted extraction of polysaccharides from Salvia officinalis L..Ultrasonic Sonochemistry, 5, 163–168.
Hromádková, Z., Ebringerová, A., & Valachovic, P. (2002). Ultrasound-assistedextraction of water-soluble polysaccharides from the roots of valerian(Valeriana officinalis L.). Ultrasonics Sonochemistry, 9, 37–42.
Jia, Z., Tang, M., & Wu, J. (1999). The determination of flavonoid contents inmulberry and their scavenging effects in superoxide radicals. Food Chemistry,64, 555–559.
Katsube, T., Imawaka, N., Kawano, Y., Yamazaki, Y., Shiwaku, K., & Yamane, Y.(2006). Antioxidant flavonol glycosides in mulberry (Morus alba L.) leavesisolated based on LDL antioxidant activity. Food Chemistry, 97, 25–31.
Koda, S., Kimura, T., Kondo, T., & Mitome, H. (2003). A standard method to calibratesonochemical efficiency of an individual reaction system. UltrasonicsSonochemistry, 10(3), 149–156.
Kratchanova, M., Pavlova, E., & Panchev, I. (2004). The effect of microwave heatingof fresh orange peels on fruit tissue and quality of extracted pectin.Carbohydrate Polymers, 56(2), 181–185.
Kwon, J. H., Bélanger, J. M. R., Paré, J. R. J., & Yaylayan, V. A. (2003). Application of themicrowave-assisted process (MAPTM) to the fast extraction of ginsengsaponins. Food Research International, 36, 491–498.
Kwon, J. H., Lee, G. D., Kim, K., Bélanger, J. M. R., & Paré, J. R. J. (2004). Monitoring andoptimisation of microwave-assisted extraction for total solid, crude saponin,and ginsenosides from ginseng roots. Food Science and Biotechnology, 13,309–314.
Li, H., Pordesimo, L., & Weiss, J. (2004). High intensity ultrasound-assistedextraction of oil from soybeans. Food Research International, 37, 731–738.
Li, L., & Zhang, Q. Y. (1998). Healthy beverage mulberry leaf chrysanthemum. HubeiForestry Science and Technology, 1, 19–21.
Paniwnyk, L., Beaufoy, E., Lorimer, J. P., & Mason, T. J. (2001). The extraction ofrutin from flower buds of Sophora japonica. Ultrasonics Sonochemistry, 8,299–301.
Rostagno, M. A., Palma, M., & Barroso, C. G. (2003). Ultrasound-assisted extraction ofsoy isoflavones. Journal of Chromatography A, 1012, 119–128.
Sandula, J., Kogan, G., Kacurakova, M., & Machova, E. (1999). Microbial (1 ? 3)-b-D-glucans, their preparation, physico-chemical characterisation andimmunomodulatory activity. Carbohydrate Polymers, 38, 247–253.
Sun, R. C., & Tomkinson, J. (2002). Comparative study of lignins isolated by alkaliand ultrasound-assisted alkali extractions from wheat straw. UltrasonicsSonochemistry, 9, 85–93.
Tor, A., Aydin, M. E., & Özcan, S. (2006). Ultrasonic solvent extraction of pesticidesfrom soil. Analytica Chimica Acta, 559, 173–180.
Vongsangnak, W., Gua, J., Chauvatcharin, S., & Zhong, J. J. (2004). Towards efficientextraction of notoginseng saponins from cultured cells of Panax notoginseng.Biochemical Engineering Journal, 18, 115–120.
Wang, S. J., Chen, F., Wu, J. H., Wang, Z. F., Liao, X. J., & Hu, X. S. (2007). Optimisationof pectin extraction assisted by microwave from apple pomace using responsesurface methodology. Journal of Food Engineering, 78, 693–700.
Wang, F., & Li, J. R. (2005). Research progression chemical constituents,physiological function and application of mulberry leaves. Food Science, 26,111–117.

Z. Ying et al. / Food Chemistry 127 (2011) 1273–1279 1279
Wang, G. Y., Liang, Z. Y., & Zhang, L. P. (2001). Studies on the structure of JS1 – thewater soluble polysaccharide isolated by alkaline from Hippophae rhamnoides L..Chemical Journal of Chinese Universities, 22, 1688–1690.
Wang, W. T., Meng, B. J., Lu, X. X., Liu, Y., & Tao, S. (2007). Extraction of polycyclicaromatic hydrocarbons and organochlorine pesticides from soils: A comparisonbetween Soxhlet extraction, microwave-assisted extraction and acceleratedsolvent extraction techniques. Analytica Chimica Acta, 602, 211–222.
Wu, J. Y., Ling, L. D., & Chau, F. T. (2001). Ultrasound-assisted extraction of ginsengsaponins from ginseng roots and cultured ginseng cells. UltrasonicsSonochemistry, 8, 347–352.
Xue, C. Y., Teng, J. Y., Qiu, J. H., Ou, Y. H., Zheng, Z. X., & Zhang, R. X. (2005). Thehypoglycemic and hypolipidemic effects of glyco-peptides complex frommulberry leaves. Acta Nutrimenta Sinica, 27, 167–168.
Yan, Z., Tu, D. W., Zheng, S. C., & Song, L. Q. (2003). The production of mulberryleaf carbonated beverage. Guangzhou Food Science and Technology, 19, 49–50.
Zhao, S. N., Kwok, K. C., & Liang, H. H. (2007). Investigation on ultrasound assistedextraction of saikosaponins from Radix Bupleuri. Separation and PurificationTechnology, 55, 307–312.

本文献由“学霸图书馆-文献云下载”收集自网络,仅供学习交流使用。
学霸图书馆(www.xuebalib.com)是一个“整合众多图书馆数据库资源,
提供一站式文献检索和下载服务”的24 小时在线不限IP
图书馆。
图书馆致力于便利、促进学习与科研,提供最强文献下载服务。
图书馆导航:
图书馆首页 文献云下载 图书馆入口 外文数据库大全 疑难文献辅助工具