Embed Size (px)
Citation preview

141
ULTRASOUND
Hedvig Hricak, M.D.2
Cosme Cruz, M.D.Raymond Romanski, M.D.M. H. Uniewski, R.N.
N. W. Levin, M.D.
Beatrice L. Madrazo, M.D.Michael A. Sandler, M.D.William R. Eyler, M.D.
Renal Parenchymal Disease:
Sonographic-Histologic Correlation1
A retrospective study of 109 patients whounderwent renal biopsy was designed tocorrelate the sonographic appearance ofthe kidney with the histologic changesand clinical and laboratory findings invarious renal parenchymal diseases. Theclinical, pathologic, and sonographic datawere analyzed blindly and independentlyby a team from each corresponding disci-pline. There was no correlation betweenthe specific sonographic appearance andthe type of renal disease. There was a sig-nificant correlation between renal lengthand the prevalence of global sclerosis,focal tubular atrophy, and the number ofhyaline casts per glomerulus. A signifi-cant positive correlation was also foundbetween cortical echogenicity and the se-verity of global sclerosis, focal tubular at-rophy, the number of hyalin#{231} casts perglomerulus, and focal leukocytic infiltra-tion. While there was overall significantcorrelation between the degree of corticalechogenicity and blood urea nitrogen andcreatinine concentrations in each group, awide range of variance was present. It isnot currently feasible to distinguish dif-ferent types of renal medical disordersusing diagnostic ultrasound.
Index terms: Kidney, diseases #{149}Kidney. ultrasound
studies, 8(1)1298
Radiology 144: 141-147, July 1982
1 From the Departments of Diagnostic Radiology(H.H., B.L.M., M.A.S., W.R.E.), Medicine (CC.,M.H.U., N.W.L.), and Pathology (R.R.), Henry FordHospital. Detroit, MI. Presented at the Sixty-sixth Sci-entific Assembly and Annual Meeting of the Radio-
logical Society of North America, Dallas. TX. Nov.16-21, 1980. Received June 22, 1981; revision request-
ed Sep. 18, 1981; revision received and accepted Nov.10, 1981.
2 Present address: University of California, Schoolof Medicine, San Francisco, CA. ht
R EFINEMENTS in ultrasound technology have advanced the use of
this modality beyond the simple display of anatomy, anatomic
relationships, and spatial localization of lesions. Ultrasound yields
gross anatomic information, but by imaging the interfaces between
tissue structures it also reflects the histopathologic characteristics of
an organ.There are reports of the specific sonographic appearance of the
kidney and liver in different parenchymal diseases (1-6). At present,
specific tissue characterization by sonography is a field of active re-search. This retrospective study was designed to correlate the sono-graphic appearance of the kidney with the histologic changes andthe clinical and laboratory findings in patients with various renal
medical diseases.
MATERIALS AND METHODS
Between January 1978 and October 1980, 180 renal biopsies wereperformed at our hospital. In each patient, an ultrasound examination
was attempted prior to biopsy. The gray-scale images were analyzedretrospectively in all 180 patients. Fifty-six patients had technically
inadequate ultrasound images and were therefore excluded from thestudy. When all tissue sections were reviewed, only those that had
at least 10 glomeruli per level were included in the study, eliminatingfifteen additional patients. This investigation therefore is based onthe results of 109 patients, aged from 8-78 (mean 39.8). There were
55 females, aged 11-78 (mean 40.0), and 54 males, aged 8-75 (mean
39.6).The renal diseases included in this study were lupus nephritis
(N = 31), focal segmental glomeruloscierosis (N 12), membranous
glomerulonephritis (N = 12), focal glomenulonephnitis (N 15),
membranoproliferative glomeruionephnitis (N = 5), chronic gb-
merubonephritis (N 5), diabetic gbomerubosclerosis (N 1 1), chronicinterstitial nephritis (N 9), acute tubular necrosis (N 2), amyboi-
dosis (N = 1), myeloma kidney (N = 1), and miscellaneous and un-classified (N 5).
The clinical, pathologic, and sonographic data were analyzedblindly and independently by three different teams of corresponding
specialists.
The clinical and laboratory examinations included serum creati-nine, blood urea nitrogen (BUN), serum albumin, and total serumprotein levels, 24-hour urine protein excretion, and urinary sedimentanalysis with enumeration of red cells, white cells, and cellular casts
per high-power field.The paraffiii-embedded sections of the biopsy specimens, including
multiple hematoxylin and eosin, periodic acid Schiff, tnichnome, and
silver stained slides, were reviewed. The examinations were confined
to the renal cortex, and the following observations and estimations

Figure 1
142 July 1982 Volume 144, Number 1 Hnicak and Others
a. b.
Acute tubular necrosis in a 25-year-old man.a. Parasagittal scan of the right kidney. The echo intensity of the renal cortex is less than that of the adjacent liver. The
cortical echogenicity is classified normal-Grade 0.
b. Photomicrograph (periodic acid-silver methenamine, X158). Mild tubular epithelial changes. uneven tubular dilatation,cellular debris within the lumen of a few tubules, and mild interstitial edema are seen.
were recorded: the maximum numberof gbomeruli in one level; the percent-age of gbomeruli showing global scle-rosis; presence and degree of tubularatrophy, expressed either as percentageof tubules showing overt atrophywhen changes were focal or on a scaleof 0 to 4+ when tubular atrophy wasdiffuse; the number of hyaline castswithin cortex, per level, expressed asthe number of casts per glomerulus.The degree of diffuse interstitial fi-brosis was expressed on a scale of 0 to4+. Focal interstitial fibrosis associated
Figure 2
with focal tubular atrophy was not re-corded. Interstitial leukocytic infiltra-tion, when present, was recorded asmainly focal or mainly diffuse, and thedegree of such infiltration was ex-pressed on a scale of 0 to 4+. Interstitialedema and arteriosclerosis were ex-pressed on a scale of 0 to 4+. The pres-ence of microcalcifications and of in-tratubular crystals was recorded asnumber of such structures per level. Tofacilitate the computer analysis, the 0to 4+ recordings were converted topercentage figures (TABLE I).
The sonograms were obtained using
commercially available units with3.5-MHz transducers. The variablesincluded in the evaluation of the ul-
trasound images were: renal length
(normal 10 cm); appearance of the renalsinus; detectability and size of renal
pyramids; distinctness of the cortico-
medullary boundary; cortical echoge-
nicity. The cortical echogenicity was
analyzed on longitudinal supine scans
by comparing the image echo strength
of the renal cortex with image echostrength of the adjacent liver. None of
a. b.
Interstitial nephnitis in a 75-year-old man.
a. Parasagittal scan of the right kidney. The echogenicity of the renal cortex is equal to that of the liver and is classified
Grade I.b. Photomicrograph (periodic acid-Schiff, X158). A 10% global sclerosis, diffuse interstitial fibrosis, and moderate diffuse
tubular atrophy are seen. There are atheroma emboli in rare vessels.
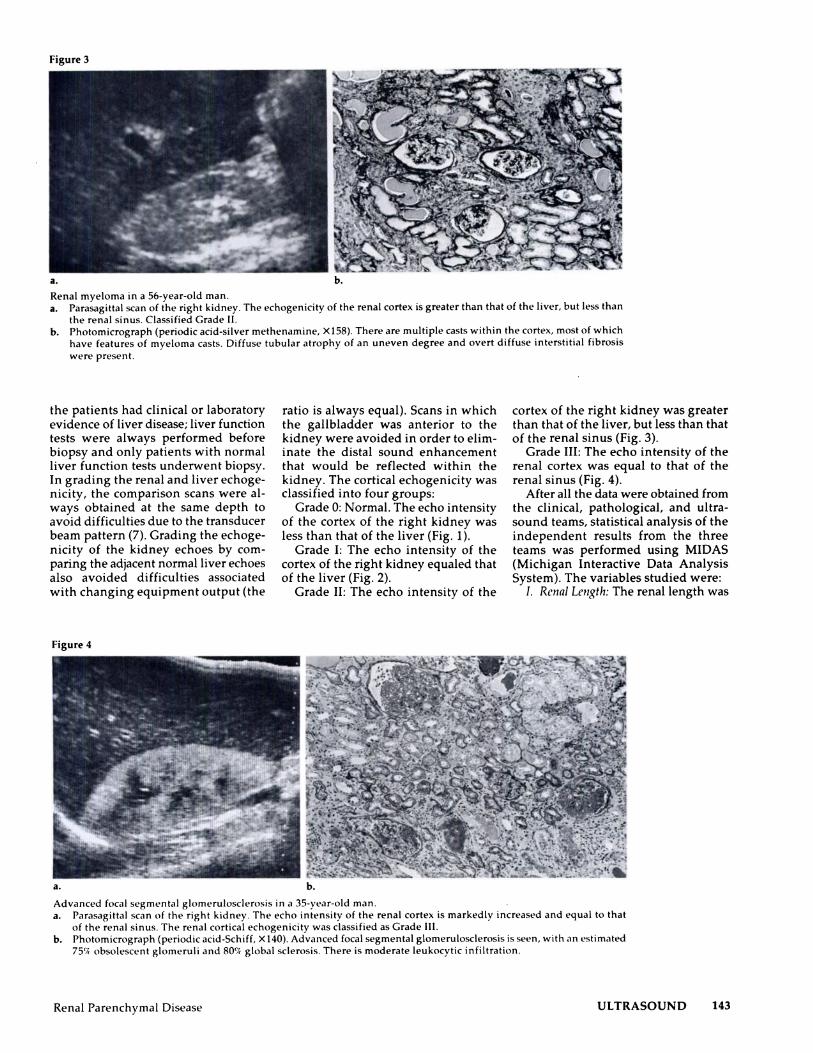
Figure 3
Renal Parenchymal Disease ULTRASOUND 143
b.
Renal myeboma in a 56-year-old man.a. Parasagittal scan of the right kidney. The echogenicity of the renal cortex is greater than that of the liver, but less than
the renal sinus. Classified Grade II.b. Photomicrograph (periodic acid-silver methenamine, X158). There are multiple casts within the cortex, most of which
have features of myeboma casts. Diffuse tubular atrophy of an uneven degree and overt diffuse interstitial fibrosis
were present.
the patients had clinical or laboratory
evidence of liven disease; liver functiontests were always performed before
biopsy and only patients with normal
liver function tests underwent biopsy.
In grading the renal and liver echoge-nicity, the comparison scans were al-
ways obtained at the same depth to
avoid difficulties due to the transducer
beam pattern (7). Grading the echoge-
nicity of the kidney echoes by com-
paring the adjacent normal liver echoes
also avoided difficulties associated
with changing equipment output (the
Figure 4
ratio is always equal). Scans in which
the gallbladder was anterior to the
kidney were avoided in order to elim-
mate the distal sound enhancementthat would be reflected within the
kidney. The cortical echogenicity wasclassified into four groups:
Grade 0: Normal. The echo intensityof the cortex of the right kidney was
less than that of the liver (Fig. 1).
Grade I: The echo intensity of thecortex of the right kidney equaled thatof the liver (Fig. 2).
Grade II: The echo intensity of the
cortex of the right kidney was greaterthan that of the liver, but less than that
of the renal sinus (Fig. 3).Grade III: The echo intensity of the
renal cortex was equal to that of the
renal sinus (Fig. 4).
After all the data were obtained fromthe clinical, pathological, and ultra-sound teams, statistical analysis of theindependent results from the three
teams was performed using MIDAS(Michigan Interactive Data AnalysisSystem). The variables studied were:
I. Renal Length: The renal length was
b.
Advanced focal segmental glomerubosclerosis in a 35-year-old man.a. Parasagittal scan of the right kidney. The echo intensity of the renal cortex is markedly increased and equal to that
of the renal sinus. The renal cortical echogenicity was classified as Grade III.
b. Photomicrograph (periodic acid-Schiff, X140). Advanced focal segmental gbomerubosclerosis is seen, with an estimated
75(4 obsolescent glomeruli and 80’� global sclerosis. There is moderate leukocytic infiltration.

144 July 1982 Volume 144, Number 1 Hnicak and Others
TABLE I: Pathological Examination
Factors Analyzed
Number of gbomeruli per levelGlobal sclerosis (%)Tubular atrophy (%)
FocalDiffuse
Hyaline casts per gbomerulusDiffuse interstitial fibrosis (%)Leukocytic infiltration (%)
FocalDiffuse
Edema(%)Calcifications per levelCrystals per levelArteriosclerosis (%)
ArteryA rt�rinl�
TABLE II: Renal Length and Disease
Type of Renal Disease
No. of Patients
Renal Length*
TotalNormal Small
Lupus nephritisFocal segmental glomerubosclerosisMembranous gbomerubonephritisFocal glomerubonephritisMembranoproliferative gbomerubonephritisChronic glomerulonephritis
23 810 21 1 1
7 85 0
1 4
31121215
5
5Diabetic gbomerulosclerosisChronic interstitial nephritisAcute tubular necrosis
9 24 52 0
1192
AmyloidosisMyeboma kidneyMiscellaneous and unclassified
1 01 04 1
115
Total 78 31 109
* Normal � lOcm;Small < 10cm
correlated with (A ) the type of renal
disease, by each type separately andalso by diseases grouped into two majorgroups (gbomerular and nongbomeru-bar); in both instances, the statistical testused was a two-way cross-tabulationmethod, (B) each histopathologicfinding, using a two-sample test, and(C) each laboratory finding, using thetwo-way cross-tabulation method.
II. Renal Sinus: The appearance of therenal sinus was correlated with (A ) the
type of renal disease, (B) the histo-
pathologic findings, and (C) the labo-
ratony findings. The statistical test used
was the two-way cross-tabulationmethod.
Ill. Medullary Pyramids: The detect-
ability and the size of the renal pyra-mids were correlated with (A ) the type
of renal disease, (B) the histopathologic
findings, and (C) the laboratory find-
ings. The statistical test used was thetwo-way cross-tabulation method.
1V. Corticomedullari� Boundarii: The
distinctness of the conticomedullany
boundary was correlated with (A ) the
type of renal disease, (B) the histo-
pathologic findings, and (C) the labo-
ratony findings. The statistical test used
was the two-way cross-tabulationmethod.
V. Cortical Ecliogenicity: The corticalechogenicity was correlated with (A)
the type of renal disease, using thetwo-way cross-tabulation method; (B)
each histopathobogic finding sepa-nately, using the rank-order correlation
method with calculation of both SIC
and RHO (the coefficient of rank cor-relation [Spearman rho] was correlated
to show a positive or negative rela-
tionship between two variables); (C)
the laboratory findings, using analysis
of variance (ANOVA test).
In addition, each clinical variablewas separately correlated with eachpathologic finding, using the rank-order correlation test with calculationof both SIC and RHO.
RESULTS
Statistical Analysis
I. Renal Length: 78/109 kidneys had
a length of 10 cm or greaten and there-fore were considered normal. 31/109patients had small kidneys, with a
renal length of less than 10 cm. (A) No
statistically significant correlation was
present between renal length and the
type of renal disease when compared
separately (TABLE II) or when the dis-
eases were grouped into gbomerularand nongbomerubar categories. (B)
There was a significant correlationbetween renal length and the preva-lence of global sclerosis, focal tubularatrophy, and the number of hyalinecasts per gbomerulus (TABLE III). (C) No
statistically significant correlation was
found between the renal length andany laboratory findings.
II. Renal Sinus: A normal-appearingrenal sinus was present in 93/ 109 pa-tients. In 7/109 patients, it appeared
distorted, and in 9/ 109 patients, therenal sinus could not be identified, and
its echogenicity was equal to the sur-
rounding renal parenchyma. No sta-tistically significant correlation was
found between the appearance of therenal sinus and (A ) the type of renaldisease, (B) the histopathobogic find-ings, or (C) the laboratory findings.
III. Medullary Pyramids: The medul-lary pyramids were identified in 66/
109 patients. In 5/66 patients, theywere prominent. The medullary pyra-mids were not seen in 43/109 patients.
No statistically significant correlation
was found between the detectabilityand the size of the medullary pyramidsand (A) the type of renal disease, (B)
the histopathobogic findings (there was
TABLE III: Renal Len gth and Histop athobogic Findings
Median(Renal
GlobalSclerosis
TubularAtrophy.
Focal
TubularAtrophy.
DiffuseHyaline
CastsInterstitial
Fibrosis
LeukocyticInfiltration,
Focal
LeukocyticInfiltration,
Diffuse Edema
Length) Normal Small Normal Small Normal Small Normal Small Normal Small Normal Small Normal Small Normal Small
N< 42 11 36 9 0 0 39 8 0 0 27 11 0 0 0 0
N> 31 20 30 20 18 4 20 13 29 5 11 6 5 4 10 5
N= 5 0 12 2 60 27 19 10 49 26 40 14 73 27 68 26p*
.0041 .0085 .0727 .0471 .0888 .9192 .7573 .5239
* p <.05 is significant
Renal Parenchymal Disease ULTRASOUND 145
a tendency toward correlation betweenthe number of hyaline casts per gb-
merulus and nonvisualization of themedullary pyramids, but this did not
reach statistical significance), or (C) thelaboratory findings.
IV. Corticomedullary Boundary: Adistinct corticomedullary junction wasidentified in 66/ 109 patients. No sta-Listically significant correlation was
found between the distinctness of thecorticomedullary boundary and (A) thetype of renal disease, (B) the histo-pathologic findings, or (C) the labora-
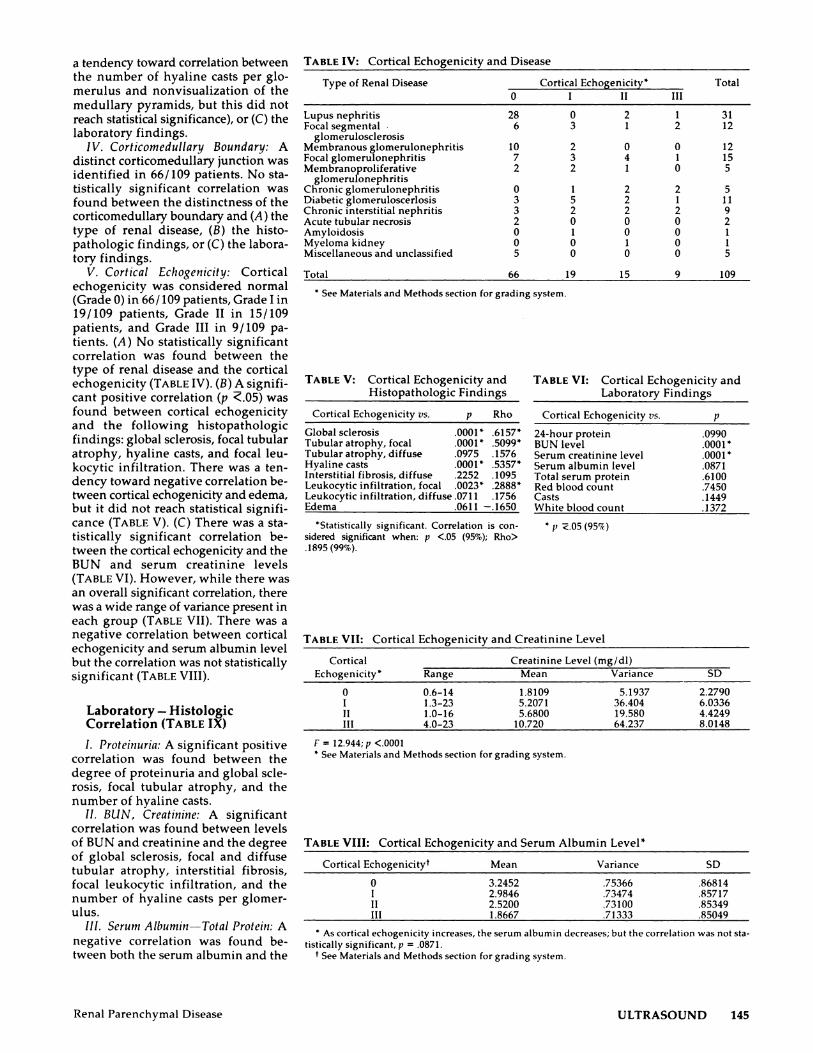
tory findings.V. Cortical Echogenicity: Cortical
echogenicity was considered normal(Grade 0) in 66/ 109 patients, Grade I in19/109 patients, Grade II in 15/109patients, and Grade III in 9/ 109 pa-tients. (A ) No statistically significant
correlation was found between the
type of renal disease and the cortical
echogenicity (TABLE IV). (B) A signifi-cant positive correlation (p �.05) wasfound between cortical echogenicity
and the following histopathologicfindings: global sclerosis, focal tubular
atrophy, hyaline casts, and focal leu-
kocytic infiltration. There was a ten-
dency toward negative correlation be-tween cortical echogenicity and edema,
but it did not reach statistical signifi-cance (TABLE V). (C) There was a sta-tistically significant correlation be-
tween the cortical echogenicity and theBUN and serum creatinine levels
(TABLE VI). However, while there was
an overall significant correlation, there
was a wide range of variance present in
each group (TABLE VII). There was anegative correlation between cortical
echogenicity and serum albumin level
but the correlation was not statistically
significant (TABLE VIII).
Laboratory - HistologicCorrelation (TABLE IX)
I. Proteinuria: A significant positivecorrelation was found between the
degree of proteinunia and global scle-rosis, focal tubular atrophy, and the
number of hyabine casts.
II. BUN, Creatinine: A significantcorrelation was found between levelsof BUN and creatinine and the degreeof global sclerosis, focal and diffusetubular atrophy, interstitial fibrosis,
focal leukocytic infiltration, and thenumber of hyaline casts per gbomer-ulus.
III. Serum Albumin-Total Protein: A
negative correlation was found be-
tween both the serum albumin and the
TABLE IV: Cortical Echogenicity and Disease
Type of Renal Disease Cortical Echogenicity* Total
0 I II III
Lupus nephritis 28 0 2 1 31Focal segmental . 6 3 1 2 12
glomerulosclerosisMembranous glomerubonephritis 10 2 0 0 12Focal glomerulonephritis 7 3 4 1 15Membranoproliferative 2 2 1 0 5
glomerulonephritisChronic gbomerulonephnitis 0 1 2 2 5Diabetic gbomeruboscerlosis 3 5 2 1 11Chronic interstitial nephritis 3 2 2 2 9Acute tubular necrosis 2 0 0 0 2Amyloidosis 0 1 0 0 1Myeboma kidney 0 0 1 0 1Miscellaneous and unclassified 5 0 0 0 5
Total 66 19 15 9 109
* See Materials and Methods section for grading system.
TABLE V: Cortical Echogenicity and TABLE VI: Cortical Echogenicity andHistopathobogic Findings Laboratory Findings
Cortical Echogenicity vs. p Rho Cortical Echogenicity vs. p
Global sclerosis .0001k .6157* 24-hour protein .0990Tubular atrophy, focal .0001k .5099* BUN level .0001kTubularatrophy, diffuse .0975 .1576 Serum creatinine level .0001*Hyaline casts .0O01� 5357* Serum albumin level .087 1Interstitial fibrosis, diffuse .2252 .1095 Total serum protein .6100Leukocytic infiltration, focal .0023* .2888* Red blood count .7450Leukocytic infiltration, diffuse .071 1 .1756 Casts .1449Edema .0611 -.1650 Whitebboodcount .1372
*Statistically significant. Correlation is con- � p �.05 (95’4)
sidered significant when: p <.05 (95%); Rho>.1895 (99%).
TABLE VII: Cortical Echogenicity and Creatinine Level
Cortical Creatinine Level (mg/dl)Echogenicity* Range Mean Variance SD
0 0.6-14 1.8109 5.1937 2.2790I 1.3-23 5.2071 36.404 6.0336II 1.0-16 5.6800 19.580 4.4249III 4.0-23 10.720 64.237 8.0148
F = l2.944;p <.0001* See Materials and Methods section for grading system.
TABLE VIII: Cortical Echogenicity and Serum Albumin Level*
Cortical Echogenicityt Mean Variance SD
0 3.2452 .75366 .86814
I 2.9846 .73474 .85717II 2.5200 .73100 .85349
III 1.8667 .71333 .85049
* As cortical echogenicity increases, the serum albumin decreases; but the correlation was not sta-
tistically significant, p .0871.t See Materials and Methods section for grading system.

TABLE IX: Laboratony-Histopathobogic Correlation (expressed in p values)
146 July 1982 Volume 144, Number 1 Hricak and Others
HistopathologicFinding Proteinuria
BUNlevel
SerumCreatinine Level
Hypo-albuminemia
Hypo-proteinemia
Urinary SedimentRed Blood Cells
Globalsclerosis .0026* .0001* .0001* .7134 .4283 .4486Focaltubularatrophy
Diffuse tubular atrophyHyalinecastsInterstitial fibrosis
.0060*
.2551
.0193*
.0731
.0006*
.0324*
.0001*
.0251*
.0001*
.0845
.0001*
.0226*
.3147
.0208*
.9458
.2604
.5208
.0175*
.9951
.0364*
.8776
.2079
.4598
.4321LeukocyticfocalinfiltrationDiffuseleukocyticinfiltrationInterstitial edema
.1177
.9096
.8946
.0042*
.1194
.2592
.0014*
.1101
.3053
.6760.6091.2590
.8925
.2249
.1748
.3679
.2031
.0987
* p <.05; Significant at 5� level.
total serum protein levels and the de-gree of diffuse tubular atrophy. Anegative correlation was also foundbetween the total serum protein leveland the degree of interstitial fibrosis.
IV. Urinary Sediment: No correlation
was found between any of the histo-logic findings and the various cellularelements in the urinary sediment (redcells, white cells, and casts).
DISCUSSION
Renal diseases in the main involvethe nephron, vascular, or interstitialtissues; these are all interrelated.
Nephron changes will result fromvascular disease, and in turn, vasculardisease will cause nephron and inter-stitial tissue changes. In a similarfashion, interstitial tissue changes in-evitably accompany and follow vas-cular and nephron disease. The kidneythat has been seriously injured for along period of time will lose the dis-tinguishing features of specific disease
regardless of whether the originaldisease was glomerular, tubular, in-
tenstitial, or vascular. All compartments
of the kidney show atrophy and scar-ring. In end-stage kidney disease rec-
ognition of the primary renal disease
is often not possible.
Percutaneous renal biopsy is the
single most important tool in the di-
agnosis of renal parenchymal disease.
Adequate analysis of the biopsy speci-men requires light microscopic, elec-tron microscopic, and immunofluo-
rescent study. The reported success rateof renal biopsy ranges between 89.8%
and 94.9% (8, 9).The percutaneous renal biopsy has
a definite attendant risk, with the rateof complication ranging from 0.7-8.1%
(9, 10). The complications include oh-gunia, decrease in hematocnit 44% (11),hematuria 10-40% (8), arteniovenous
fistuba, renal abscess, gram-negative
septicemia, and perforation of hollow
viscera (12). Hematomas, either sub-capsular, penirenal, or posterior para-renal, are seen in over 50% of the pa-tients, as documented by computedtomographic monitoring (13, 14).Massive bleeding following renal bi-opsy necessitated the performance of
nephrectomies in five out of 8,000 casesand splenectomies in two out of 8,000cases (8). Reported cases of mortalityrange from 0.7-0.17% (8, 12).
As progression of renal disease mustbe monitored closely, particularly whenthere is a discrepancy between the ap-parent diagnostic features and thecourse of the disease or when the ef-fects of therapy need to be monitoredclosely, as in lupus nephnitis, a nonin-
vasive method reducing or obviatingthe need for serial biopsies would as-sume great importance. The use of di-agnostic ultrasound in monitoring theprogression of the disease in these pa-tients therefore is an important ad-vance.
Sonographic characterization of tis-sue is at present an area of active re-search. Measurements of the degree ofabnormality and the definition ofunique tissue signatures are the goals(15). Only a small part of the availableultrasonic data is currently being used.Analysis of the echo amplitude of agiven organ can be performed usingthree basic techniques: B scans, allow-ing visual interpretation by compari-son of two adjacent organs on the samescan or by comparing the same region
using a study performed on two dif-ferent occasions; A-mode analysis; orcomputerized evaluation. Each of themethods has its limitations but, as inthe initial experience of Rosenfield et
a!. (5), each has produced similar re-suits. The visual interpretation by B-
scan analysis is a subjective method oftissue characterization . However, ifcomparison of the adjacent organs isalways done at the same depth, if the
scans with overlying organs throughwhich an ultrasound beam must pass
are eliminated, and if a control organis not diseased, the method has proved
to be adequate (5).The value of sonography in
displaying size and anatomic featuresof an organ is well accepted. Ideally,renal volume should be calculated (16).Our study was retrospective and serialtransverse scans were not recorded inevery patient. However, display of therenal length was always optimal, andsince this measurement of kidney sizeis well accepted in the radiobogic lit-
erature, we chose to assess the kidneysize on the basis of length. The kidneywas considered small when its lengthwas less than 10 cm. Correlating the
type of renal disease with renal length,there was a tendency toward a normalrenal length with membranous gb-merubonephnitis and membranoprohi-
ferative gbomerulonephritis, and gen-erally a prevalence of small kidneylength in chronic gbomerulonephritis.The number of patients in each of thesethree groups was too small to makecorrelation statistically significant.When renal length was correlated withthe histopathobogic changes, there wasa statistically significant correlationbetween length and prevalence ofglobal sclerosis, focal tubular atrophy,and the number of hyaline casts pergbomerulus, suggesting that renal fi-brosis is associated with this finding.
When the sonognaphic appearanceof the renal sinus, the meduhlary pyr-amids, and the distinctness of the cor-ticomedullany boundary were ana-lyzed, no statistically significant cor-relation was present between thosevariables and the type of renal disease,histopathologic findings, or laboratoryvalues.
There was no statistically significantcorrelation between the specific typeof renal disease and cortical echogeni-city. In our experience, and in reports
in the literature (3, 17, 18), there are a
number of renal medical diseases thatcause increased cortical echogenicity,

Renal Parenchymal Disease ULTRASOUND 147
but the finding is not specific to thedisease; rather it reflects the degree of
histopathobogic change within the
renal parenchyma. As the corticalechogenicity was correlated with eachhistopathobogic finding separately,
there was a direct, statistically signifi-cant correlation between the corticalechogenicity and the degree of global
sclerosis, focal tubular atrophy, num-
ben of hyaline casts pen glomerulus,
and focal leukocytic infiltrate. Thecorrelation of cortical echogenicity andtubular interstitial changes was re-ported by Rosenfield et a!. (17). In
contrast to the observations of Rosen-
field et al. , but in agreement with Le-Quesne (3), we found a significantcorrelation between the degree ofglobal sclerosis and cortical echogeni-city. In the normal kidney, the glom-
eruli occupy only 8.6 ± 1.5% of the
renal cortex (18). However, changeswithin the gbomeruli are not isolated,as tubular and interstitial changes
usually follow the gbomerular changes.
The degree of involvement in the twoanatomic areas is similar. The increasein cortical echogenicity is thereforeprobably the result of changes withinthe gbomeruli, tubules, and intersti-titum. The positive correlation of in-creased leukocytic infiltration and
cortical echogenicity is in accord withthe observations reported by LeQuesne(3) and Rosenfield et al. (5) of change in
the cortical echogenicity in response totherapy in acute poststreptococcal
glomerubonephritis and active inter-
stitial disease (the promiuent feature of
any active disease is leukocytic infil-
tration). There was a negative correla-tion between the degree of interstitial
edema and cortical echogenicity, in-dicating that edema in any given organwill cause increased transonicity.
When the cortical echogenicity wascorrelated with laboratory data, anoverall significant accord was foundbetween cortical echogenicity and thevalue of BUN and serum creatinine
levels. This is in contrast to the report
by Moccia, et al. (19). There was, how-
ever, a wide range of variance presentin each group and a normal corticalechogenicity was seen in patients withserum creatinine levels ranging from0.6 to 14 mg/dl.
Correlation of clinical data withhistopathobogic findings yielded anoverall positive significant correlationbetween the degree of glomerular andtubular interstitial changes and pro-teinuna and BUN and serum creatininelevels.
SUMMARY
Histopathologic analysis of the bi-opsy specimen is indispensable for the
initial diagnosis of medical renal dis-ease. Attempts have been made in thepast to identify specific sonographicappearances for individual renalmedical diseases (1, 2, 4). In our expe-
nience such specificity was not found.The lack of specificity of the sonogramsand the limited responses of the kidneyto various pathological insults maywell remain a limitation to specific so-nographic diagnosis, even when ac-curate quantitative measurements byultrasound become available. How-ever, after the initial diagnosis hasbeen made by biopsy, a good correla-tion between cortical echogenicity andthe severity of histopathologic changesprovides a promising noninvasivemethod of monitoring the progressionof the renal disease.
William R. Eyler, M.D.
Department of Diagnostic RadiologyHenry Ford HospitalDetroit, MI 48202
References
1. Edell SL, Bonavita JA. The sonographicappearance of acute pyelonephritis. Radi-ology 1979; 132:683-685.
2. Kay CJ, Rosenfield AT, Taylor KJW, Rosen-
berg MA. Ultrasonic characteristics ofchronic atrophic pyelonephritis. AJR 1979;132:47-49.
3. Le Quesne GW. Assessment of glomeru-lonephritis in children by ultrasound. In:White D, Lyons EA, eds. Ultrasound in
medicine. Vol 4, New York: Plenum Press,1978: 205-207.
4. Rochester D, Aronson AJ, Bowie JD,Kunzmann A. Ultrasonic appearance of
acute poststreptococcal glomerulonephritis.
J Clin Ultrasound 1978; 6:49-50.5. Rosenfield AT, Taylor KJW, Jaffe CC.
Clinical applications of ultrasound tissue
characterization. Radiol Clin North Am1980; 18:31-58.
6. Gosink BB, Lemon 5K, Scheible W, LeopoldCR. Accuracy of ultrasonography in diag-nosis of hepatocellular disease. AJR 1979;
133: 19-23.7. Jaffe CC, Taylor KJW. The clinical impact
of ultrasonic beam focusing patterns. Radi-ology 1979; 131:469-472.
8. Welt L. Cited in Kark RM. Renal biopsy.JAMA 1968; 205:226.
9. Diaz-Buxo JA, Donadio JV Jr. Complica-
tions of percutaneous renal biopsy: Ananalysis of 1,000 consecutive biopsies. ClinNephrol 1975; 4:223-227.
10. Slotkin EA, Madsen P0. Complications of
renal biopsy: Incidence in 5,000 reported
cases. J Urol 1962; 87:13-15.1 1 . Bolton WK. Nonhemorrhagic decrements
in hematocrit values after percutaneousrenal biopsy. JAMA 1977; 238:1266-1268.
12. Kark RM. Renal biopsy. JAMA 1968; 205:220-226.
13. Alter AJ, Zimmerman 5, Kirachaiwanich C.Computerized tomographic assessment ofretroperitoneal hemorrhage after percuta-neous renal biopsy. Arch Intern Med 1980;140:1323-1326.
14. Rosenbaum R, Hoffsten PE, Stanley RJ,
Klahr S. Use of computerized tomographyto diagnose complications of percutaneousrenal biopsy. Kidney Int 1978; 14:87-92.
15. Ziskin MC, Wells PNT. Tissue character-ization. In: Wells PNT, Ziskin MC, eds. New
techniques and instrumentation in ultraso-nography. New York: Churchill Living-
stone, 1980:186-201.16. Moskowitz PS, Carroll BA, McCoy JM.
Ultrasonic renal volumetry in children.
Radiology 1980; 134:61-64.17. Rosenfield AT, Taylor KJW, Siegel NJ.
Histopathologic-ultrasonic correlation inrenal parenchymal disease. Presented at thesixty-fifth Scientific Assembly and Annual
Meeting of The Radiological Society ofNorth America, Atlanta, GA, Nov. 25-30,1979.
18. Dunnill MS. Halley W. Some observationson the quantitative anatomy of the kidney.
J Pathol 1973; 110:113-121.19. Moccia WA, Kaude JV, Wright PC, Gaffney
EF. Evaluation of chronic renal failure bydigital gray-scale ultrasound. Urol Radiol1980; 2:1-17.


![Interstitial lung disease (ILD), or diffuse parenchymal lung disease … · 2018-10-28 · Interstitial lung disease (ILD), or diffuse parenchymal lung disease (DPLD),[[1] is a group](https://img.pdfslide.net/doc/110x75/5e7d31d2ec5074254471c7d0/interstitial-lung-disease-ild-or-diffuse-parenchymal-lung-disease-2018-10-28.jpg)


![f6publishing.blob.core.windows.net · Web viewPeliosis is a rare disease entity characterized by widespread blood-filled cystic cavities within the parenchymal organs[1]. The word](https://img.pdfslide.net/doc/110x75/613f7939f0f55d448e4cd13d/web-view-peliosis-is-a-rare-disease-entity-characterized-by-widespread-blood-filled.jpg)