Embed Size (px)
Citation preview
Louisiana State UniversityLSU Digital Commons
LSU Historical Dissertations and Theses Graduate School
1966
Ultraviolet Spectroscopic and Nuclear MagneticResonance Studies of the Enol-Keto Tautomerismin Beta-Diketones.Jang KuoLouisiana State University and Agricultural & Mechanical College
Follow this and additional works at: https://digitalcommons.lsu.edu/gradschool_disstheses
This Dissertation is brought to you for free and open access by the Graduate School at LSU Digital Commons. It has been accepted for inclusion inLSU Historical Dissertations and Theses by an authorized administrator of LSU Digital Commons. For more information, please [email protected].
Recommended CitationKuo, Jang, "Ultraviolet Spectroscopic and Nuclear Magnetic Resonance Studies of the Enol-Keto Tautomerism in Beta-Diketones."(1966). LSU Historical Dissertations and Theses. 1202.https://digitalcommons.lsu.edu/gradschool_disstheses/1202
UV SPECTROSCOPIC AND NUCLEAR MAGNETIC RESONANCE STUDIES OF THE ENOL-KETO
TAUTOMERISM IN £-DIKETONES
A Dissertation
Submitted to the Graduate Faculty of the Louisiana State University and
Agricultural and Mechanical College in partial fulfillment of the requirements for the degree of
Doctor of Philosophyin
The Department of Chemistry
by Jang Kuo
B.S., National Taiwan University, 1958 M.S., Louisiana State University, 1963
August, 1966
ACKNOWLEDGMENT
The author wishes to express his appreciation to Dr* B* V. Nauman, under whose direction this work was carried out.
The author would like to thank the numerous fellow graduate students whose aid was generously given. He also wishes to acknowledge the aid of Mr. W. E. Wegner in obtaining the NHR spectra and that of Hr* K. G. Stolzle in obtaining the phosphorescence half-life time measurements.
The author expresses his appreciation to the Dr. Charles E. Coates Memorial Fond for the financial assistance pertinent to the publication of this doctoral dissertation.
ii
TABLE OF CONTENTSPAGE
ACKNOWLEDGMENTS . . . . ..................... iiLIST OF TABLES.......................................... ivLIST OF FIGURES........... . ........... vABSTRACT................. xCHAPTER
1. UV SPECTROSCOPIC STUDIES OF THE ENOI -KETO TAUTOMERISMIN p-DIKETONES............................. 1I. INTRODUCTION. . ....................... 1II. EXPERIMENTAL.................. 16
A. Compounds. • • • • • • • . . • • • . . 16B. Spectral Measurements. . . » • • • • • 17
HI. RESULTS AND DISCUSSION.................... 22IV. SUMMARY............................... 84
2. NUCLEAR MAGNETIC RESONANCE STUDIES OF THE ENOL-KETOTAUTOMERISM IN -DIKETONES..................... 87
/I. INTRODUCTION................ 87II. EXPERIMENTAL.......... 94
III. RESULTS AND DISCUSSION.................... 96
IV. SUMMARY...............................113SELECTED BIBLIOGRAPHY......... 114VITA................................................. 118
iii
LIST OF TABLES
CHAPTER 1. UV SPECTROSCGPIC STUDIES OF THE ENOL-KETOTAUTOMERISM IN p-DIKETGNES
TABLE PAGE1. Absorption Spectra in Cyclohexane at Room
Temperature ............... . . . . . . . . . . 252. Absorption Sjpectra in Isopropylalcohol at
Room Temperature........................ • • • 26
3. Intramolecular Charge Transfer Bands. • • • • • • • • 304* Energy Levels of {3-Diketones................. 82
CHAPTER 2. NUCLEAR MAGNETIC RESONANCE STUDIES OF THEENOL-KETO TAUTOMERISM IN {3-DIKETONES
TABLE PAGE1# Proton Ghsmican Shifts in Pure {3-Diketones. . . . . . 97
2. Percentage of Enol Tautomers, Equilibrium Constants,AG°, As° of the Keto-Enol Tautomerism . . . . • • 105
iv
LIST OP FIGURES
CHAPTER 1. UV SPECTRQOSCCPIC STUDIES OF THE ENOL-KETOTAUTOMERISM IN |3-DIKETONES
FIGURE PAGE1* Term-level Diagram ............ 72. A. Apparatus Arrangement for Phosphorescence
Measurement. • • • • ........ • • • • • • 21B. Apparatus Arrangement for Total Eknission
Measurement. 21
3. Absorption Spectra in Cyclohexane at RoomTemperature• • • • . • • • • • ....... •• 23
a. Benzoylacetoneb. Benzoyltrifluoroacetonec. Dibenzoylmethaned. 2-Bromo-l,3-diphenyl-1,3-propanedione e• Dibenzalacetone
4* Absorption Spectra in Isopropylalcohol at RoomTemperature.................. 24
a. Benzoylacetoneb. Benzoyltrifluoroacetone c • Dibenzoylmethaned • 2-Bromo-l ,3-diphenyl-1,3-propanedionee. Dibenzalacetone
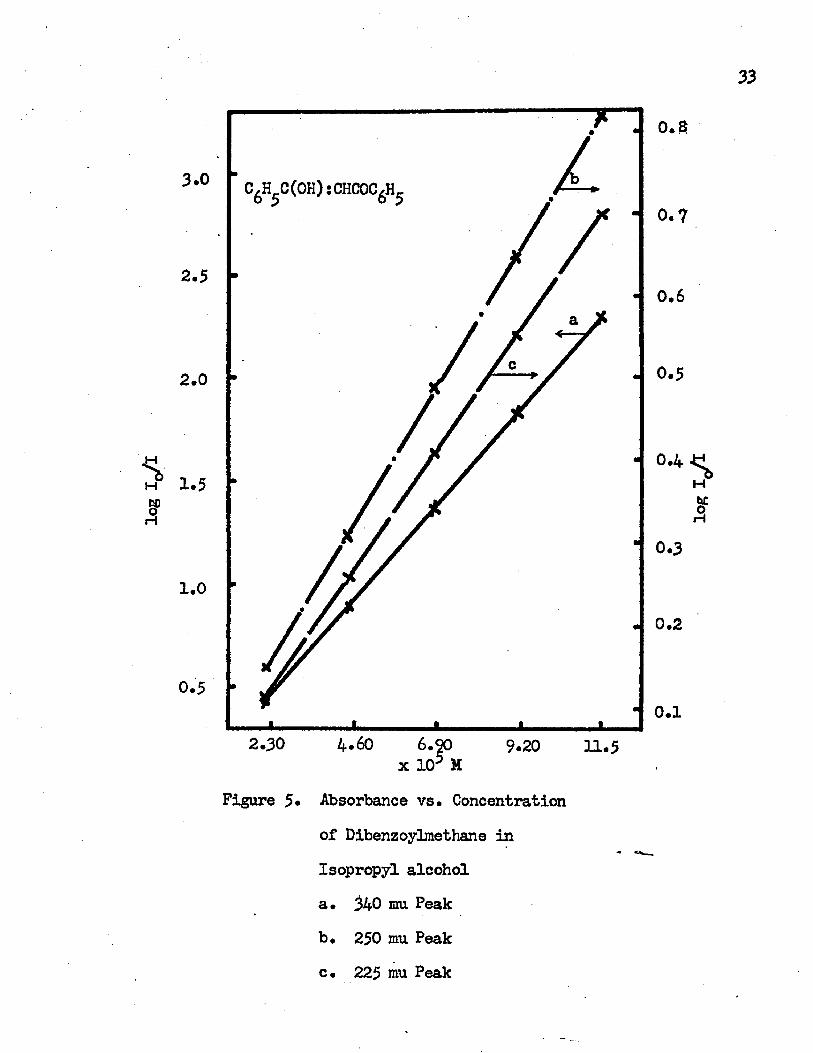
5* Absorbance vs. Concentration of DibenzoyMethane inIsopropylalcohol . . . . . . •• 33
a. 340 mu peakb. 250 mu peakc. 225 mu peak
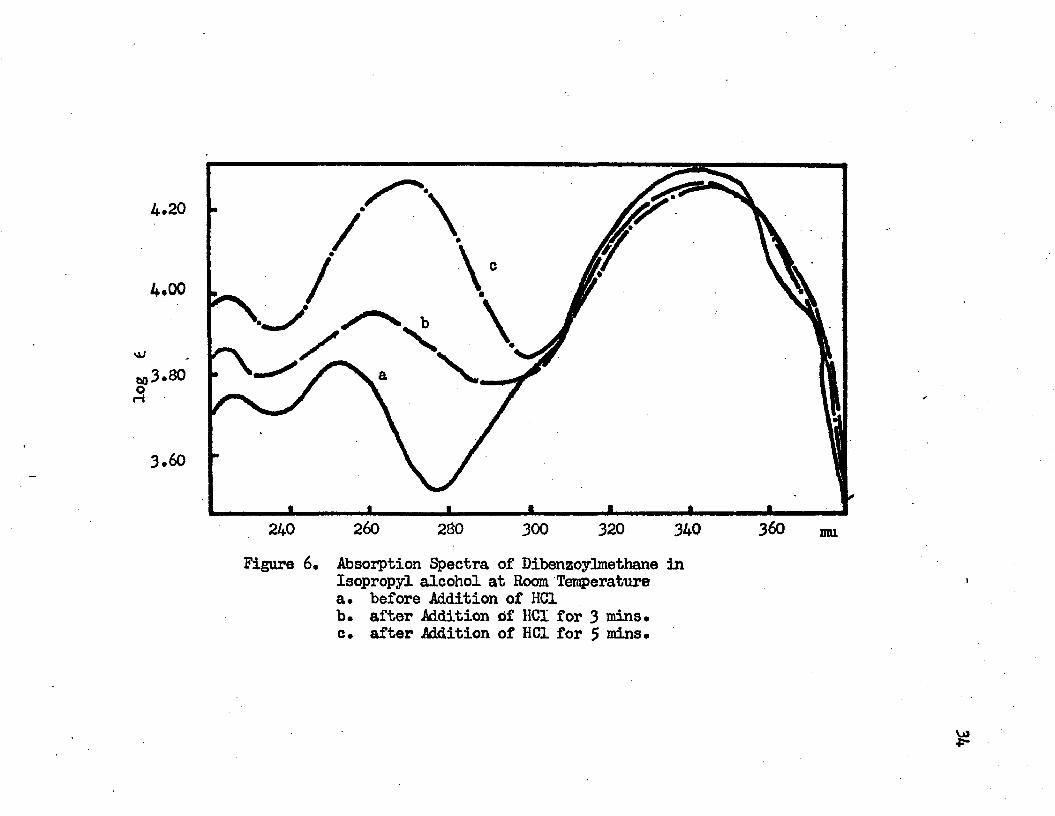
6. Absorption Spectra of Dibenzoylmethane inIsopropylalcohol at Room Temperature • • • • 34
a. Before Addition of HC1b. After Addition of HC1 for 3 minutesc. After Addition of HC1 for 5 minutes
v
LIST OF FIGURES(continued)
FIGURE PAGE7* Absorption Spectra of Dibenzoylmethane in IPMP. • • • . 37
a. at 25°Gb. at 77°Kc. at 77°K after Irradiation with the A-H6
for 60 minutesd. at 25°C after Irradiation at 77°K
8. Absorption Spectra of Dibenzoylmethane in EPA . • • • . 36a. at 25°Gb. at 77°Kc. at 77°K after Irradiation with the A-H6
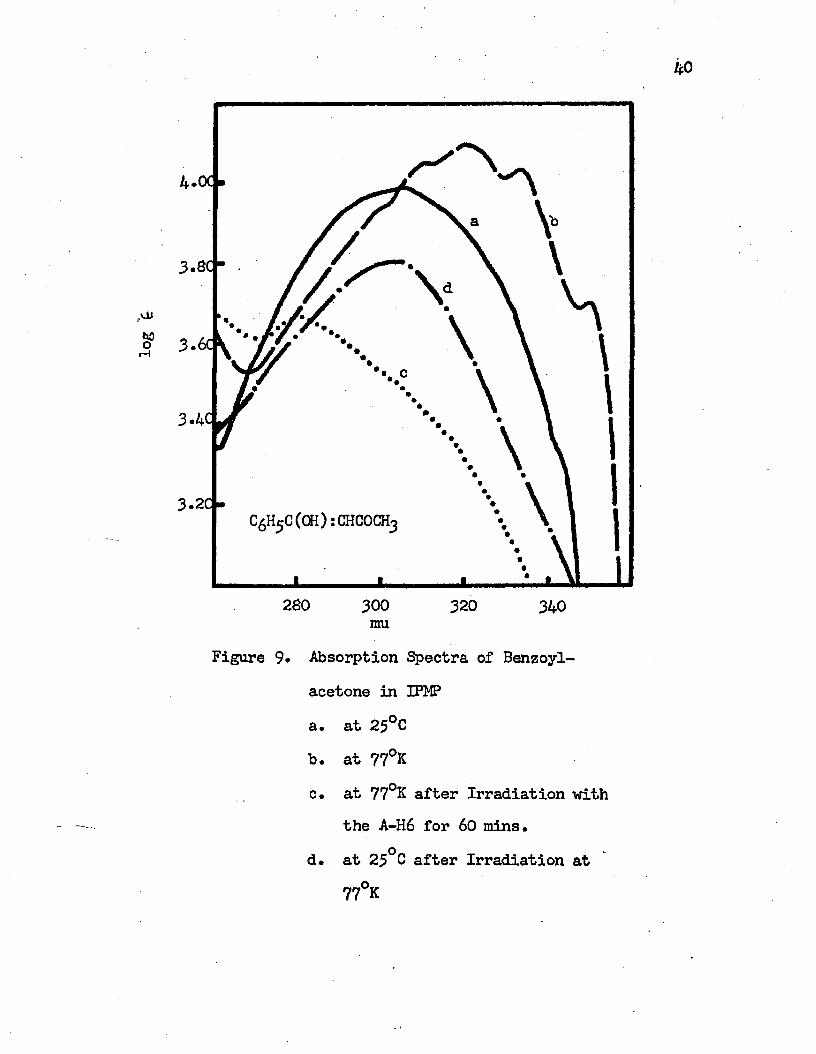
for 60 minutes9. Absorption Spectra of Benzoylacetone in IPMP. . . . . . 40
a. at 25°Cb. at 77°Kc. at 77°K after Irradiation with the A-H6
for 60 minutesd. at 25°C after Irradiation at 77°K
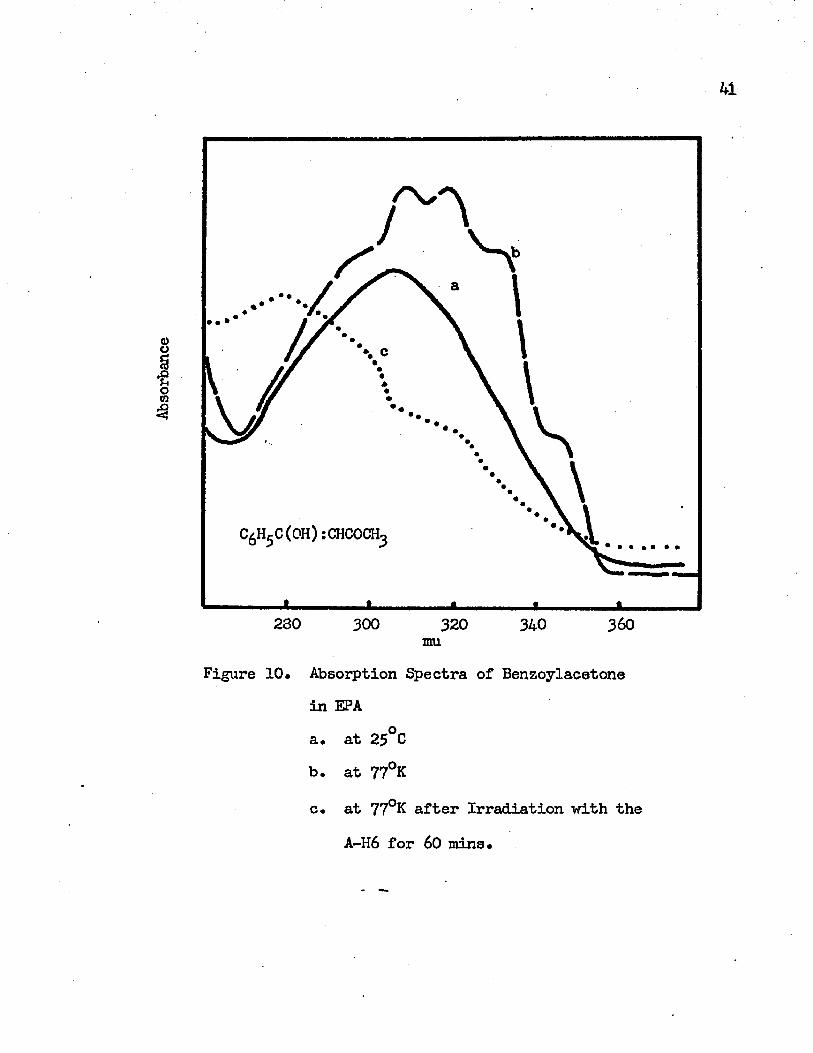
10. Absorption Spectra of Benzoylacetone in EPA . . . • • • 41
a. at 25°Gb. at 77°Kc. at 77 K after Irradiation with the A-H6
for 60 minutes
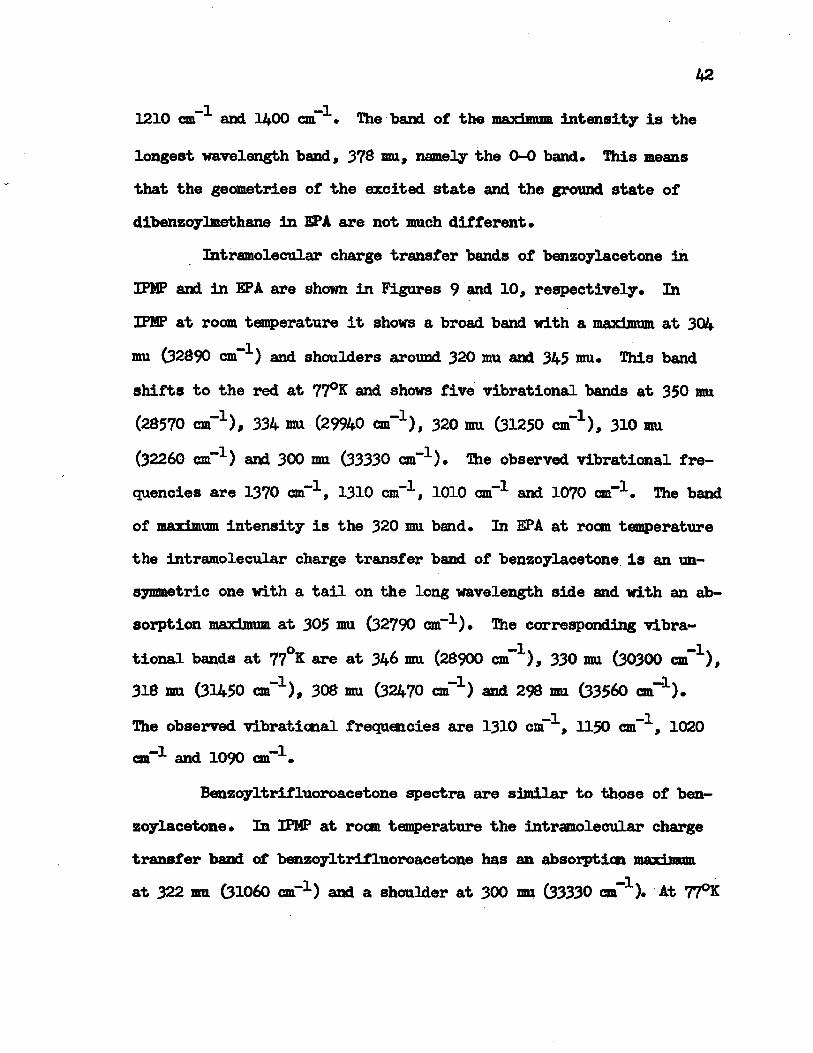
11. Absorption Spectra of Benzoyltrifluoroacetone in IPMP . 43a. at 25°Cb. at 77°Kc. at 77°K after Irradiation with the A-H6
for 60 ml m itesd. at 25°C after Irradiation at 77°K
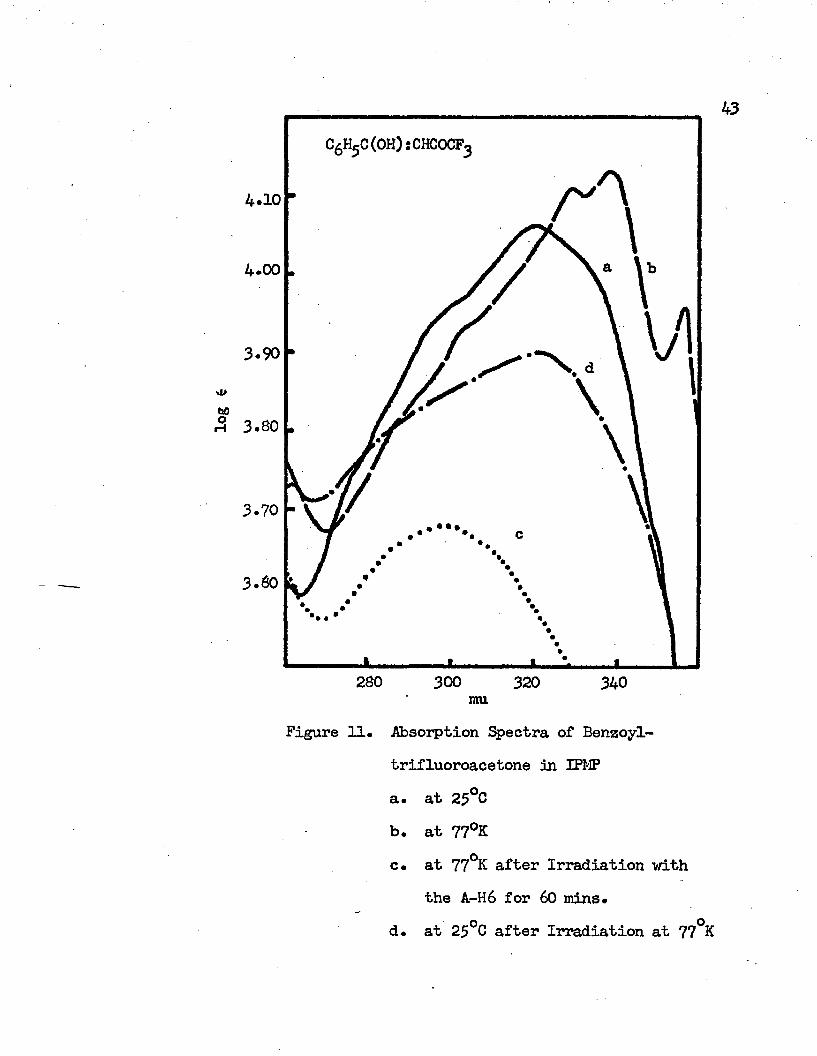
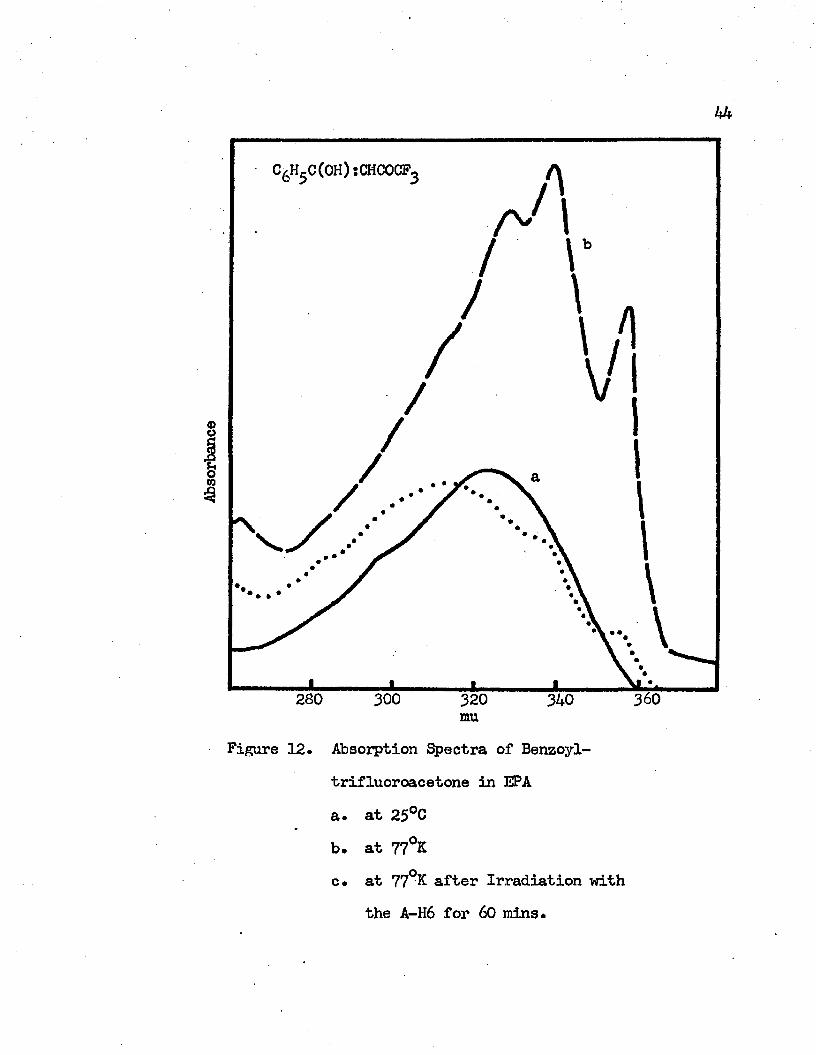
12. Absorption Spectra of Benzoyltrifluoroacetone in EPA. . 44a. at 25°Cb. at 77°Kc. at 77°K after Irradiation with the A-H6
for 60 minutes
LIST OF FIGURES (continued)PAGE
Absorption Spectra in IPMP at Room Temperature....... 49a. 2-Bromo-l,3-diphenyl-l,3 -propanedioneb. 2-Brcmo-l,3-diphenyl-l ,3-propanedicne after
Irradiation at Room Temperature c • Dibenzoylmethane
Absorption Spectra in IPMP at 77°K......... • • • • • 5 0
a. Dibenzoylmethaneb. Irradiated 2-Bromo-l,3-diphenyl-l,3-propanedionec. Irradiated Dibenzoylmethane
Absorption Spectra of Dibenzoylmethane in IPMP at77°K...................... . ........... 52
a* before Irradiationb • after Irradiation with the A-H6 for 15 minutesc. after Irridiation with the A-H6 for 25 minutesd. after Irradiation with the A-H6 for 35 minutese. after Irradiation with the A-H6 for 60 minutes
Absorption Spectra of Acetylacetone in IPMP.........53
a. at 25°Cb. at 77 K before Irradiationc. at 77°K after Irradiation with the A-H6 for
10 minutesd. at 77°K after Irradiation with the A-H6 for
30 minutesBlue Phosphorescence Spectra in EPA...........•••57a* Dibenzoylmethaneb. Benzoylacetonec. Benzoyltrifluoroacetoned. 2-Bromo-l ,3-diphenyl-1,3 -propanedione e• Benzaldehyde
Green Phosphorescence Spectra in EPA Exciting at theIntramolecular Charge Transfer Band • • • • • • • 5 9
a. Dibenzoylmethane b« Benzoylacetonec. Benzoyltrifluoroacetone
LIST Ofc* FIGURES (continued)FIGURE FACT)
19* Phosphorescence Spectra of Irradiated Dibenzoylmethane
a* Blue and Green Phosphorescences in 3-Methylpentane b« Blue Phosphorescence in EPA c* Green Phosphorescence in EPA
20* Phosphorescence Spectra of Benzoylacetone in3—Methylpentane • • « • • • • • • • • • • • • • • 6 4
a* Before Irradiationb. After Irradiation with the A—H6 for 10 minutes at 77°K21* Phosphorescence Spectra of Benzoyltrifluoroacetone
in 3-Methylpentane • • • • • • • • • • • • • • • • 6 5a.: Initiallyb. After 10 minutes of Irradiation with the Excitinglightc. After 25 minutes of Irradiation with the Excitinglight
22. Excitation Spectra of Blue Phosphorescence in EPA. . • . 67a* Benzoylacetoneb. Benzoyltrifluoroacetonec. Dibenzoylmethaned. Benzaldehyde
23• Excitation Spectra of the Green Phosphorescence in EPA • 68a. Dibenzoylmethaneb. Benzoylacetonec• Benzoyltrifluoroacetone
24* A. Absorption Spectrum of Dibenzoylmethane in EPAat 77°K.........................................69B. Green Phosphorescence Excitation Spectrum of
Dibenzoylmethane in EPA at 77°K • • • • • • • • • 6 9
viii
LIST OF FIGURES (continued)FIGURE PA<$
25* Fluoroesceuce and Absorption Spectra of Dibensoyl-methane at 77°A • • • • • • • • • • • • • • • • 73
a* Absorption Spectrum in IPMPb. Fluorescence Spectrum in IPMP c* Absorption Spectrum in EPAd. Fluorescence Spectrum in EPA
CHAPTER 2. NUCLEAR MAGNETIC RESONANCE STUDIES OF KETO-ENOLTAUTOMERISM IN p-DIKETONES
1. Chemical Shifts of OH Signal vs* Temperature • • • • • 1022* Temperature vs* Enol Contents * • • • » • • • • * * • 1063* Temperature Dependence of the Equilibrium
Constants • • • # • • • • • • • • • • • • • • • 10S
ABSTRACT
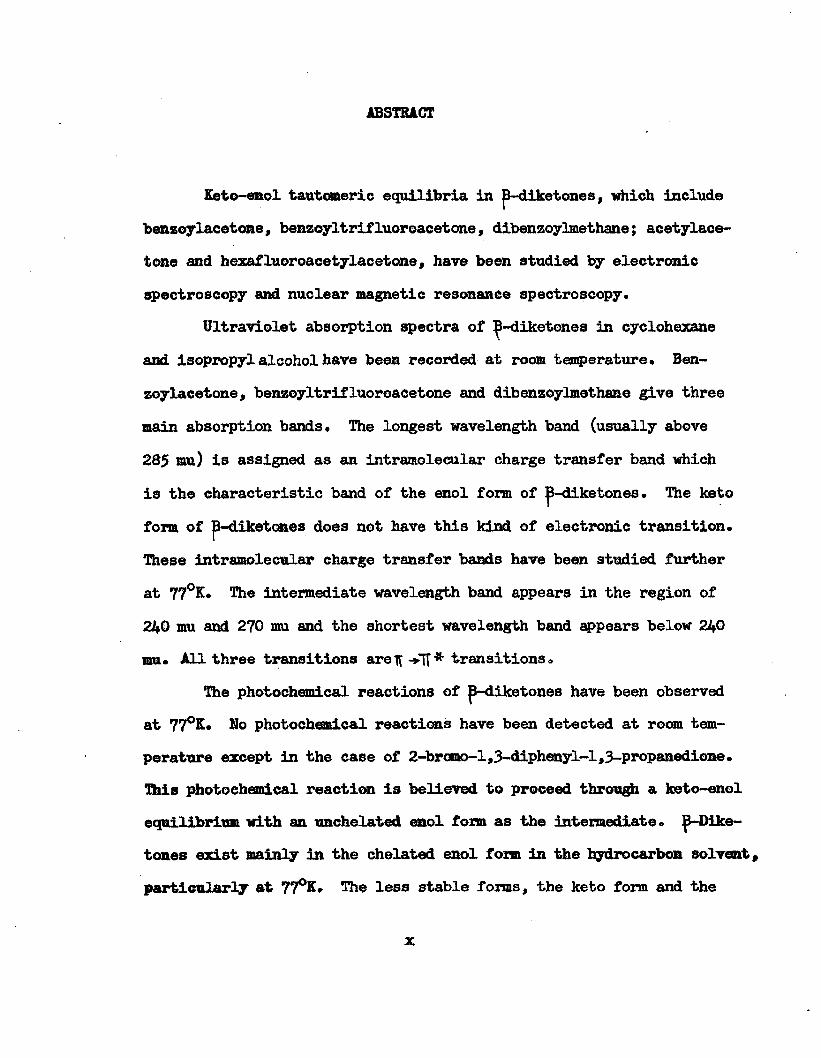
Keto-enol tautomeric equilibria in , which includebenzoylacetone, benzoyltrifluoroacetone, dibenzoylmethane; acetylace tone and hexafluoroacetylacetone, have been studied by electronic spectroscopy and nuclear magnetic resonance spectroscopy.
and isopropyl alcohol have been recorded at room temperature. Benzoylacetone, benzoyltrifluoroacetone and dibenzoylmethane give three main absorption bands. The longest wavelength band (usually above 285 mu) is assigned as an intramolecular charge transfer band which
These intramolecular charge transfer bands have been studied further at 77°K. The intermediate wavelength band appears in the region of 240 mu and 270 mu and the shortest wavelength band appears below 240
mu. All three transitions areH VU* transitions.The photochemical reactions of p-diketones have been observed
at 77°K. No photochemical reactions have been detected at room temperature except in the case of 2-bromo-l, 3-diphenyl-l ,3-propanedione. This photochemical reaction is believed to proceed through a keto-enol equilibrium with an unchelated enol form as the intermediate. p-Dike- tones exist mainly in the chelated enol form in the hydrocarbon solvent, particularly at 77°&. The less stable forms, the keto form and the
Ultraviolet absorption spectra of in cyclohexane
is the characteristic band of the enol form of p-dike tones. The keto form of B-diketones does not have this kind of electronic transition.
x
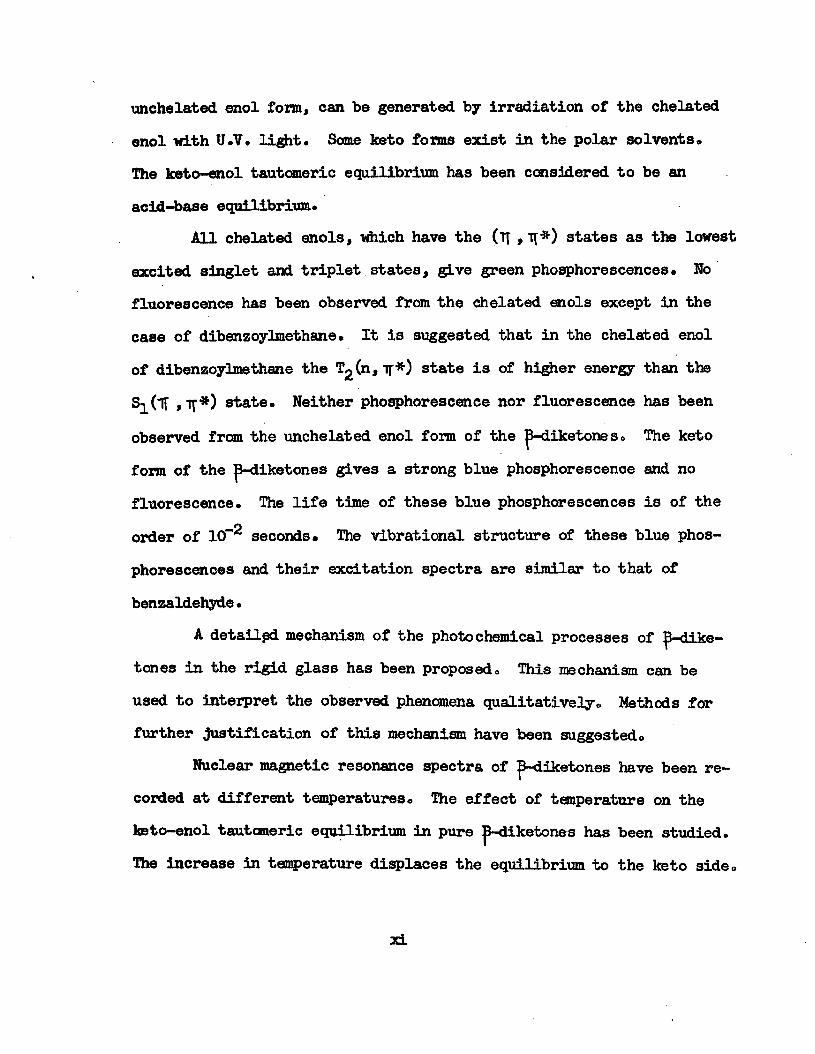
unchelated enol form, can he generated by Irradiation of the chelated enol Kith U.V. light. Same keto forms exist in the polar solvents.The keto-enol tautomeric equilibrium has been considered to be an acid-base equilibrium.
All chelated enols, which have the (Tf , states as the lowest excited singlet and triplet states, give green phosphorescences. No fluorescence has been observed from the chelated enols except in the case of dibenzoylmethane. It is suggested that in the chelated enol of dibenzoylmethane the Tg(n, ir*) state is of higher energy than the Si (IT state. Neither phosphorescence nor fluorescence has beenobserved from the unchelated enol form of the j3-diketones. The keto form of the |3-diketones gives a strong blue phosphorescence and no fluorescence. The life time of these blue phosphorescences is of the order of 10“2 seconds. The vibrational structure of these blue phosphorescences and their excitation spectra are similar to that of benzaldehyde.
A detailed mechanism of the photochemical processes of |3-dike- tcnes in the rigid glass has been proposed. This mechanism can be used to interpret the observed phenomena qualitatively. Methods for further justification of this mechanism have been suggested.
Nuclear magnetic resonance spectra of 3-diketones have been recorded at different temperatures. The effect of temperature on the keto-enol tautomeric equilibrium in pure j3-diketones has been studied. The increase in temperature displaces the equilibrium to the keto side.
y±
From the melting point of the compound to the maximum temperature limit of the instrument, 190°C, the major component in the equilibrated system is the chelated enol form. Equilibrium constants for the keto-enol tautomeric equilibrium have been determined at different temperatures. The changes of the standard enthalpies of the keto-enol equilibria have been calculated to be -2.3 Kcal/mole, -3*7 Kcal/mole, -3.6 Kcal/mole and -4.0 Kcal/mole for acetylaeetone, hexa- fluoroacetylacetone, benzoylacetone and dibenzoylmethane, respectively. Other thermodynamic quantities have been obtained at different temperatures. These values are interpreted in terms of the molecular structures.
CHAPTER 1
UV SPECTROSCOPIC STUDIES OF THE ENOL-KETO TAUTOMERISM IN -DIKETONES
I* Introduction
This study is a continuation of the author’s previous work. 1
In the previous study it was shown that dibenzoylmethane exists exclusively in an enol form which is chelated by an intramolecular hydrogen bond. Effects of the intramolecular hydrogen bond on both the absorption spectra and the emission spectra of dibenzoylmethane have been studied. The electronic transition which occurs in the 2S0 mu region of the spectrum at roem temperature has been assigned to be the chiromophore band of the cinnamoyl group in the compound. Transitions characteristic of the benzoyl group and the styrene group have been found around the regions of 260 mu and 220 mu, respectively. All of these transitions have been shown to be it—»-ir* transitions. Solvent studies have shown that the solvent does not affect the electronic transitions substantially. The absorption bands of the tt — ►IT *
-4cuo, J., M.S. thesis, Louisiana State University, Baton Rouge, La. (1963).
1
2
transitions in the chelated dibenzoylmethane were red-shifted in comparison with the similar bands in jp-methoxybenzalacetophenone which coaid not fora an intramolecular hydrogen bond* The electronic transition of the cinnamoyl chromophore at liquid nitrogen temperature (77°K) was red-shifted in comparison with the same transition at room temperature. This has been explained by an increase in the dispersion forces that accompany the increase in solvent density that occurs when the temperature decreases* Upon irradiation with the full intensity of an A-H6 mercury arc this it —> it * band of the spectruji at 77°K is blue- shifted, while the same band at room temperature is not affected by irradiation* These results have been explained by suggesting that the intramolecular hydrogen bond breaks upon irradiation at 77°K and is prevented from recombination by the solvent rigidity, while at room, temperature any photochemical breaking of the intramolecular hydrogen bond results in recombination and the energy is liberated and is lost through thermal collisions with solvent molecules*
It has been found that dibenzoylmethane in hydrocarbon glass gives two different phosphorescences, one blue and one green. The intensity of the blue phosphorescence builds up with time of excitation, while the intensity of the green phosphorescence decreases slightly as the time of excitation increases* In EPA glass the blue phosphorescence appears as soon as the exciting light strikes the sample, and the green phosphorescence is too weak to be detected. The blue phosphorescence has been suggested to result from a transition primarily localized
3
in the benzoyl group, and the green phosphorescence is believed to come from a transition characteristic of the cinnamoyl group. Dibenzoylmethane exists entirely in the chelated form in hydrocarbon glass at 77°K. This form does not emit the blue phosphorescence, but absorption of light can convert it to the unchelated form which is capable of emission. The formation of the chelated form does not affect the appearance of the green phosphorescence.
In order to understand the mechanism of the photochemical reactions in dibenzoylmethane at liquid nitrogen temperature and to identify the species which correspond to the blue and the green phosphorescence this study was undertaken. In addition to dibenzoylmethane several other -diketones including aromatic and aliphatic -diketones have been investigated.
One of the key problems in photochemistry is the identification of high-energy intermediates formed during reactions. The use of rigid or glassy solvents affords a good method for stabilizing labile products. The usefulness of rigid solvent techniques in studying the photochemistry and spectroscopy of complex molecules has been most
2-5clearly brought out in die beautiful work of G-.U. Lewis and his school,
Lewis, G. N. and D« Lip kin, J. Am. Ghem<> Soc. 64 2301 (1942).3Lewis, G. N., D. Lipkin, and T. T. Magel. J. Am. Chem. Soc. 63
3005 (1%1).Lewis, G. H. and J. Bigeleisem, J. Am. Chem. Soc. 65. 2419(1943}*Lewis, G. H. and H. Kasha, J. Am. Chem. Soco 66 2100 (1944)»
4
in which a variety of photo-processes were established and studied by this means. The photoprocesses were photo-oxidation by the loss of an electron, photodissociation into two uncharged radicals, photoioniza- tion into a positive ion and a negative ion, triplet-state excitation, etc. Photo-enolization and photochemical cis-trans isomerism? reactions have been observed.
Upon illumination in rigid media at 77°K, the activated molecule from many organic materials loses an electron and becomes a free radical or a positive ion. Hie free electron becomes attached to a solvent molecule, to a group of molecules or even to some unique point in the solvent that is determined by its rigid structure. The electionlies in a potential hole which is deep enough so that the large electrostatic field of the ion is unable to dislodge it. This photo- oxidation reaction has been studied further by Linschitz, sj* al.They have postulated that the recombination of radicals and electrons formed initially by photo-oxidation of the original molecule will result in the formation of triplet state. The recombination is viscosity dependent, and at liquid nitrogen temperature may be very slow.
Tang, N. C. and C. Rivas, J. Am. Chem. Soc. 82 2213 (1961).?Hammond, G. S., et al., Jo Am. Chem. Soc. 86 3197 (1964)»Linchitz, H., M. G. Berry and D. Schweitzer, J. Am. Chem. Soc.
Ik 5$33 (1954)o
Voorst and Hoijtink? have observed the photoejection of electrons from negative hydrocarbon ions in a glassy solution of 2-methyl- tetrahydrofuran at 77°K. McClain and Albrecht1 have studies N, N,N*, Nf - tetramethylparaphenylene diamine in 3-®e thylpentane solution« The solution was frozen to a rigid state in liquid nitrogen and irradiated with ultraviolet light in the absorption band of the amine.The amine undergoes a one-electron ionization to give its colored radical cation and an electron trapped in the solvent matrix. Subsequent infrared illumination caused a burst of blue-green luminescence called stimulated emission which was a recombination luminescence composed of the fluorescence and phosphorescence bands of the amine.They have shown that the system possesses electron traps of several different depths, ranging frcm shallow, thermally ionizable levels to depths of more than 3 eV.
Symons and Townsend^ have found that the ultraviolet irradiation of a variety of photochemically active compounds, dissolved in rigid (77°K) glasses that contain ethanol as a major component, produced an intense violet coloration which is lost as soon as the glass softens. They postulated that this violet compound is a free radical
Voorst, J. D. tf. and G. J. Hoijtink, J. Chem. Phys. 42 3995 (1965).
®McClain, W. M. and A. C. Albrecht, J. Chem. Phys., 41 463(1965).
llSymons, M. C. R. and M. Townsend, J. Chem. Phys. 2£ 1299(1956).
6
formed from the ethanol by hydrogen atom abstraction* Radical and radical anions have been found in the flash photolysis of benzaldehyde,
t o iacetophenone and benzil in alcoholic solutions* Photoenolization13has been studied by Tang and his coworkers* O-Methylbenzophenone
and O-benzal-benzophenone undergo intramolecular hydrogen transfer to give their corresponding enols under the influence of ultraviolet light at roam temperature. They postulated that this photoenolization involved an (n, ir*) triplet state as an intermediate. An (n, tt*) triplet intermediate was postulated for the photolysis of appropriate 1 ,2 diketones to 2-hydroxy-cyclobutanones.1 Photoisomerization of stilbene has been investigated. A simple model of cis strans photo- isomerization was developed by postulating two forms of different
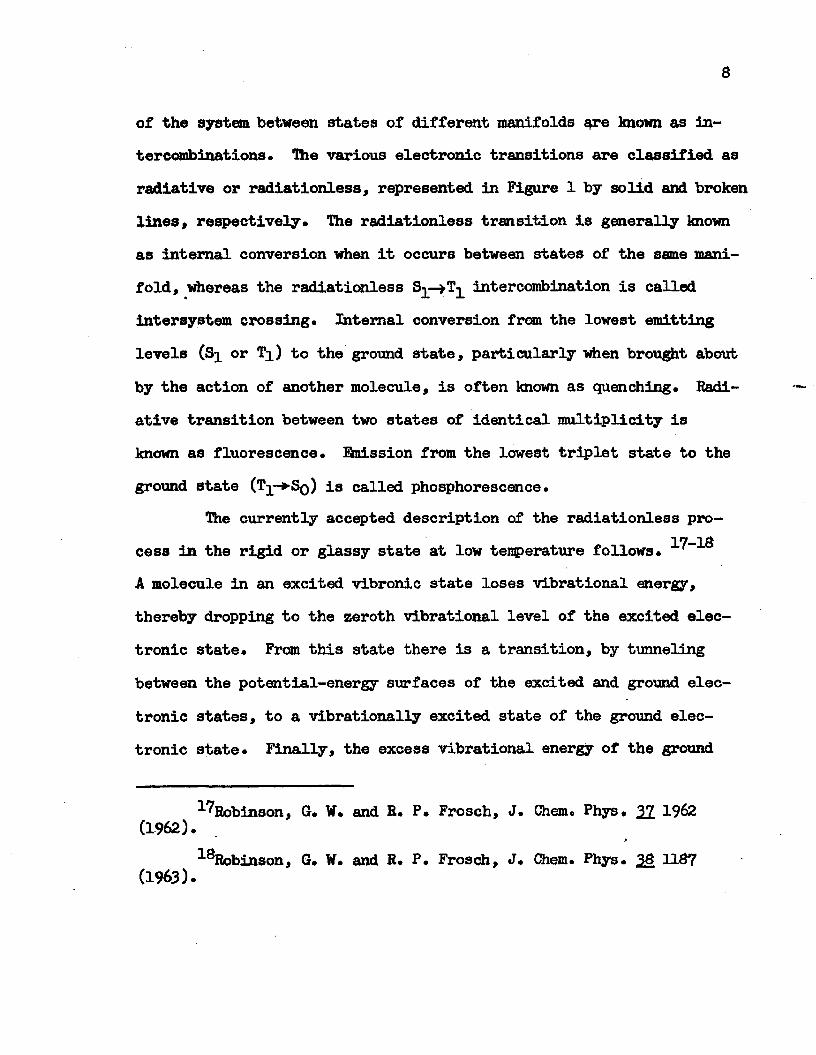
15energies in the intermediate state involved during isomerization.16Figure 1 is a modem elaboration of Jablonski’s diagram, re
presenting the energies of the various low-lying state of an organic molecule with respect to the ground state SQ. The two sets of vibro- nic states superimposed on S^ • • . and Tj_, • «” • con_" stitute the singlet and triplet manifolds, respectively; transitions
■ Beckett, A., A* D. Osborne and G; Porter, Trans. Faraday Soc.60 873 (196A).
■ Yang, N. C. and C. Rivas, op. cit.•^rry, W. H. and D. J. Trecker, J. Am. Chem. Soc. 8^ 118 (1962).^Hammond, G. S., et al., op. cit.■ Lower, S. K. and M. A. El-Sayed, Chem. Rev. 66 199 (1966).
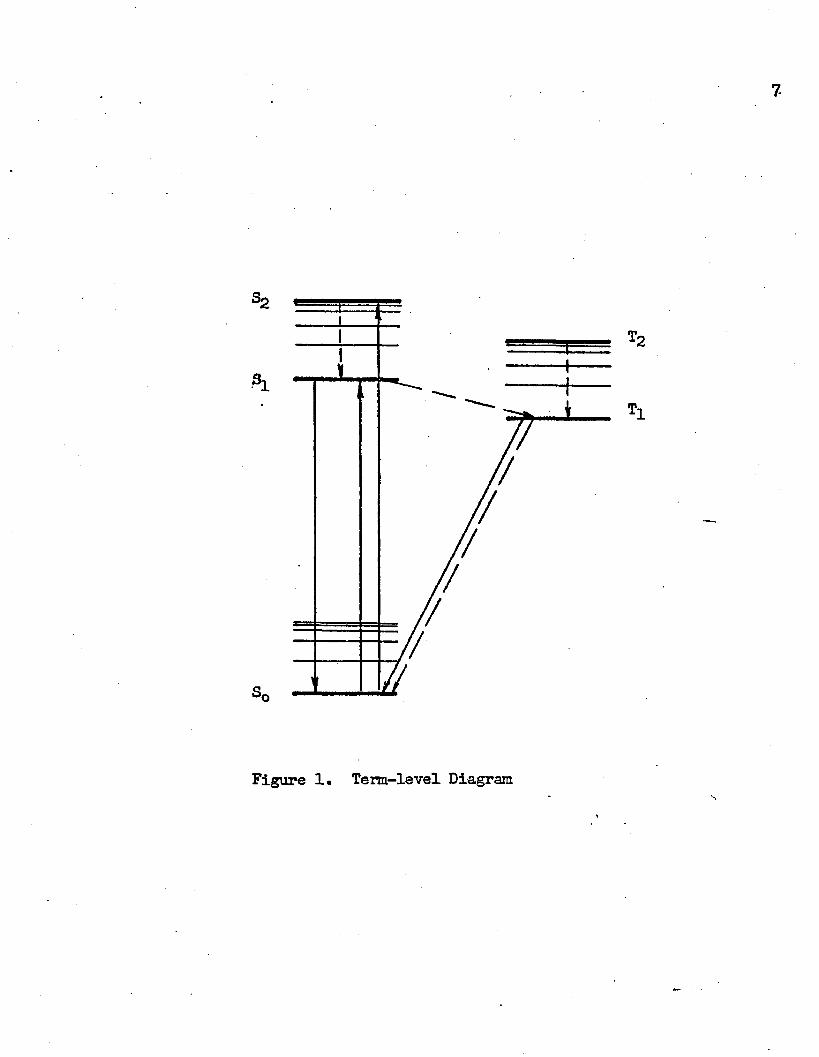
Figure 1. Term-level Diagram
8
of the system between states of different manifolds qre known as in- tercombinations. The various electronic transitions are classified as radiative or radiationless, represented in Figure 1 by solid and broken lines, respectively. The radiationless transition is generally known as internal conversion when it occurs between states of the same manifold, whereas the radiationless S-j— intercombination is called intersystem crossing. Internal conversion from the lowest emitting levels (Si or T ) to the ground state, particularly when brought about by the action of another molecule, is often known as quenching. Radiative transition between two states of identical multiplicity is known as fluorescence, finission from the lowest triplet state to the ground state (Tj-^Sq) is called phosphorescence.
The currently accepted description of the radiationless pro-17—18cess in the rigid or glassy state at low temperature follows. '
A molecule in an excited vibronie state loses vibrational energy, thereby dropping to the zeroth vibrational level of the excited electronic state. From this state there is a transition, by tunneling between the potential-energy surfaces of the excited and ground electronic states, to a vibrationally excited state of the ground electronic state. Finally, the excess vibrational energy of the ground
■ Robinson, G. W. and R. P. Frosch, J. Chem. Phys. 2Z 1962(1962).*
1SRobinson, G. W. and R. P. Frosch, J. Chem. Phys. 2® H &7(1963).
9
electronic state is removed by the surrounding medium. It is usually assumed that the loss of vibrational energy is very rapid, so that the rate of radiationless transition is determined by the tunneling step* Except under unusual circumstances, involving strong solute-solvent interaction, it is a consequence of this last assumption that the rate of radiationless transition will be independent of the nature of the surrounding (dense) medium* Recently, Rice, et al.^ have postulated that the rate of transfer of vibrational energy is not rapid relative to the rate of intersystem crossing.
Two rules concerning radiative emission have been formulated which summarize a vast number of observations: (l) the emitting levelof a given multiplicity is the lowest excited level of the multiplicity; (2 ) the character of the emission spectrum of a substance does not depend on the exciting wavelength.2® The essential reason why luminescence from electronic levels other than the lowest excited states is not observed under noxmal conditions is concerned with the greater efficiency of the competing process of internal conversion between the states of a given multiplicity. Hochstrasser21 has given the following further interpretations: (i) As the exciting radiation
^Sun, H. Y. , J. Jortner and S. T. Rice, J. Chem. Phys. £4 2539 (1966).
2®Seybold, P. and M. Gouterman, Chem. Rev. 6*[ 413 (1965)•^-Hochstrasser, R. M., Spectrochemica Acta 16 497 (i960).
10
must necessarily be in the high-energy bands, the probability of uni- molecnlar photochemical reactions is greater than if the lower energy levels were initially populated. Such dismutaticns necessarily give rise to species which have less extended conjugation and which will therefore absorb and emit at higher energies than does the parent molecule. These emissions may obscure the Srj-*S0 emission; (ii) the initial sample purity must be very high* If, for example, there are
-2present 10 mole percent of impurity with a unit quantum yield of luminescence, then the emission from this impurity may be as strong as the Sjj->SQ emission, (iii) At normal temperatures the S^Sq emission will necessarily be quite strongly reabsorbed into the lower singlet electronic states. From the second rule one can deduce that the excitation spectrum, which is obtained by monitoring emission as a function of exciting wave length, should be identical with the absorption spectrum. This has been demonstrated for many compounds and Implies that relaxation rates from higher states are much faster than competing intersystem crossing or predissociation. Exceptions have been found in several cases.^ If the excited molecule is free to isom- erize, it was found that the quantum yield of fluorescence was considerably lower when the higher electronic states of the molecule were excited. Other exceptions are found with certain substances at very low pressure in the vapor phase. Under these conditions the
^Hochstrasser, R. M., Can. J. Chem. 8 233 (i960).
11
molecule may photodissociate before the excess of vibrational energy Is removed by collision. Another possible exception is that of intramolecular energy transfer processes -which may occur within very short times (10“ second). Should such a process as intersystem crossing, for example, occur at this rate it would probably compete favorably with the internal conversion process between electronic states.If intersystem crossing between higher states occurs, it should cause a variation in the ratio of the phosphorescence and the fluorescence quantum yields with exciting wave length. Such a variation has beeninterpreted to be due to an efficient intersystem crossing between a
23higher singlet state and a close-lying triplet.Interest in the triplet states of molecules has grown con
siderably since Lewis and Kasha2 identified the phosphorescent metastable state as a triplet state. The lowest triplet state of a molecule has particular importance because of three distinguishing features:2 (l) It is usually the lowest excited state of the molecule. (2) It has a very long lifetime in comparison with other excited states. (3) It is a distinct chemical species, which is often very reactive. Lewis and Kasha discussed several features which distinguish
2^0fDwyer, H. F., M. A. El-Bayoumi, and S. J. Strickler, J.Chem. Phys. 36 1395 (1962).
^Lewis, G. N. and H. Kasha, J. Am. Chem. Soc. 66 2100 (l%4).25Porter, G. and H. R. Wright, Discussions Faraday Soc. 22 IS
(1959).
12
this triplet emission from fluorescence: e.g. the phosphorescencebands (as observed in a low temperature glass) are narrower and generally show different vibrational structure; and within a given class of molecules, the phosphorescence lifetime is shorter the longer the wavelength of the emission. Phosphorescence is not to be expected from saturated molecules because of the disruptive effect which the production of two electrons with parallel spins would have upon the bonding structure in this type of molecule. Consequently, phosphorescence is more or less confined to molecules with double bonds, which can more easily accommodate the unpaired electrons. Also, this emission is greatly enhanced when the lowest singlet is the (n,ir#) type. For most molecules phosphorescence may be observed only in a rigid glass enviomment at low temperature, but some substances also phosphoresce in the liquid or gas phases. One reason that so few substances phosphoresce in liquid solution is that the long lifetime of the triplet makes it highly susceptible to quenching before it radicates. In molecules such as the aromatic hydrocarbons, radiationless crossing from the upper singlet state S-j_ to the triplet T- occurs with a rate which is typically of the order of 10 sec in rigid medium, while the apparently similar conversion from to the ground state SQ is not observed in rigid media and must have a rate less than 10”1
sec- in benzene and other molecules with similar radiative triplet lifetime. If the rates of the two radiationless conversions were of comparable magnitude, no phosphorescence would be observed, and this
13
is the reason for the absence of phosphorescence in ordinary solutions and gases*
It is well known that whereas the aromatic hydrocarbons such as benzene, napthalene and anthracene fluoresce fairly well or strongly in the near ultraviolet or visible spectral region, the corresponding aza-derivatives and carbonyl-derivatives are completely non-fluo- rescent or emit very weakly in spite of their comparable or stronger absorption intensity compared with the analogous aromatic hydrocarbons* In N-heterocyclics or carbonyl compounds, the lowest singlet-singlet transition has been characterized as a transition corresponding to the excitation of a non-bonding (nitrogen or oxygen) electron to an antibonding it molecular orbital. These transitions were designated as n— » tv * transitions, and their corresponding excited states as (n, tv*) singlet states* As demonstrated by Kasha,2 molecules with an (n,ff*) state as their lowest excited singlet state are generally nonfluores- cent because the properties of such a state are favorable for nonradi- ative deactivation. It is commonly accepted that this nonradiative deactivation occurs by an intercombination process which finally populates the lowest triplet state of the molecule* Such a crossing can result in emission from the triplet, or more generally in an absence of luminescence* Nitrogen heterocyclics possess both T — tir* and n— * TV * transitions; in small ring compounds, the lowest singlet is
^Kasha, M*, Discuss. Faraday Soc. 2 14 (1950).
14
(n, if*) state* Most of these molecules show no fluorescence but27have strong phosphorescences* El-Sayed f has calculated that inter-
system crossings between singlet and triplet states of the same con
figuration are forbidden in first order* He has suggested that S (n, -it*)— *T is the radiationless process which makesthe intersystem crossing from the lowest (n, it*) singlet state of the nitrogen hetercyclics very efficient. Complete examination of carbonyl compounds has not as yet been carried out* However, the existing data suggested that they resemble N-heterocyclics in theirbehavior* Aromatic aldehydes and ketones, e*g. benzophenone and
28benzaldehyde, show strong phosphorescence but no fluorescence* In these systems, the triplet states of the aromatic ring might lie between the (n, tt*) singlet and the triplet states of the carbonyl group. Aliphatic ketones and aldehydes, e.g* formaldehyde, show both fluorescence and phosphorescence* In these systems, the absence of a low (ir, if*) triplet state retards the inter system crossing process so that fluorescence competes successfully*2 Higher aromatic aldehydes are fluorescent*3° In benzaldehyde the n— * absorption
2?E1-Sayed, M. A., J. Chem. Phys. 28 2834 (1963).2%anda, Y., H* Kaseda and T* Matumura, Spectrochim* Acta 20,
1387 (1964).2%ower, S* K. and M* A* El-Sayed, op* cit.^ Bredereck, K*, Th. Forster and H* G* Oesterlin, "luminescence
of Organic and Inorganic Materials" (Edited by H* P. Kollman and G. M* Spruch), John Wiley and Sans, Inc., New York, N* Y* (1962), p. l6l*
15
(0 - 0 band in heptane at 27*0 x 10 cm"*1) is well separated from the next it— >v* absorption (0 - 0 band at 34*6 x lCp cm“‘L) so that the (n, t\*) singlet state is the lowest excited one in all reasonable solvents. Both kinds of states are shifted to lower energies in the higher members of the aromatic series, but, by their very nature, the (n, it*) states are shifted less than the (ir»ir*) states so that ("IT , ir*) finally becomes the lowest singlet state and the higher aromatic aldehydes are therefore fluorescent. Solvent effects that shift the (it, IT*) singlet state until it becomes the lowest excited singlet state have been observed in some aromatic aldehydes. In suitable molecules in inert solvents, the quenching (n, tt *) state may be the lower, but the radiating (tt , tt*) state may be lower in other solvents. In inert solvents these molecules will be nonfluorescent, but fluorescence will occur in polar admixtures or in pure polar sol-
*vent.
16
II* ExperimentalA. Compounds and Solvents:
Dibenzoylmethane was provided by Professor J* L. E* Erickson of the Department of Chemistry, Louisiana State University* Benzoyl- acetone, benzolytrifluoroacetone, 2-bromo-l ,3-diphenyl-l ,3-propane- dione, dibenzalacetone, were commercial products of Eastman Organic Chemicals* All of these compounds were purified by two or three recrystallizations from spectral grade isopropyl alcohol followed by vaccuum sublimation.
Acetylacetone was obtained from Fisher Scientific Company, hexafluoroacetylacetone was obtained from Peninsular Che®. Research Inc*, and benzaldehyde was the product of Hatheson Coleman and Bell* They were distilled before using.
Phillips pure grade isopentane and 3-methylpentane were washed by stirring them twice with fuming sulfuric acid for three hours* Then they were rinsed with water, saturated sodium carbonate solution and then water again* The solvents were dried over anhydrous magnesium sulfate for at least 24 hours and then distilled at the rate of 10 to 20 drops per minute* All hydrocarbon solvents showed no ab- sorption at wavelengths greater than 210 mu* Cyclohexane and isopropyl alcohol were spectroquality reagents of Hatheson Coleman and Bell* They were used without further purification*
Solvents used in the liquid nitrogen temperature (77°K) studies were 3-methylpentane, IPHP, a 6:1 mixture by volume of isopentane and 3-methylpentane, and EPA, a mixture by volume of 5 parts
17
isopentane, 5 parts ethyl ether and 2 parts of ethyl alcohol* EPA mixed solvent from Hartman Leddon Co* was used without further purification* All these solvents showed no emission and absorption in the wavelength range of interest and formed rigid glasses at liquid nitrogen temperature*
B. Spectral Measurement:A Cary model 14 spectrophotometer produced by the Applied
Physics Corporation was used to obtain the room temperature absorption spectra* The absorption spectra at 77°K were determined by the same instrument with the following modification: the cell holder in the sample compartment was removed and the sample compartment lid was replaced by a wood plate which provided support for the quartz dewar which contained liquid nitrogen* A Beckman standard 1 cm retangular quartz absorption cell was suspended in the center of the dewar, namely, in the path of the light beam* The suspension of the sample cell in the path of the light beam was accomplished by means of a length of Pyrex rod which was fused to the ground glass stopper of the cell* The cell was held firmly to the stopper by a £ inch length of tygon tubing which was split for half its length* The Pyrex rod was inserted in a cork stopper which fit firmly in the top of the dewar* The sample compartment was continually flushed with dry nitrogen gas to prevent the condensation of moisture on the dewar surface* When the low temperature absorption spectra were determined the instrument was run as a double beam instrument, but the
18
solvent in an identical Beckman 1 cm rectangular quartz cell at room temperature -was used in the reference beam* Since the quartz dewar absorbed light below 245 mu, the absorption spectra were studied in the region above this wavelength* The absorbance values determined by this system were reproducible* The extinction coefficients in XPMP solvent at 77°K were obtained after the concentration of the sample was converted from its room temperature value to thatat 77°K. The specific volume ratio of IPMP at 77°K and 293°K has
31been shown to be 0*76* This volume correction was the only one which was taken into consideration in the determination of the extinction coefficient at 77°K.
The irradiated species were obtained by irradiating the sample with the full intensity of a 1000 watts General Electric A-H6
high pressure mercury arc operated from an A*C. power supply*At room temperature photoproducts were obtained by irradi
ating the samples in the empty dewar. In order to carry out the irradiation at 77°K, liquid nitrogen was added to the dewar* The species were kept in a rigid glass by adding liquid nitrogen to the dewar from time to time to keep the glass rigid all the time* A blower was used to prevent the condensation of the moisture on the outside surface of the dewar*
All emission spectra reported here were obtained from rigid
^ R o s e n g r e n , K., Acta Ghem* Scand. 16 1421 (1962)*
19
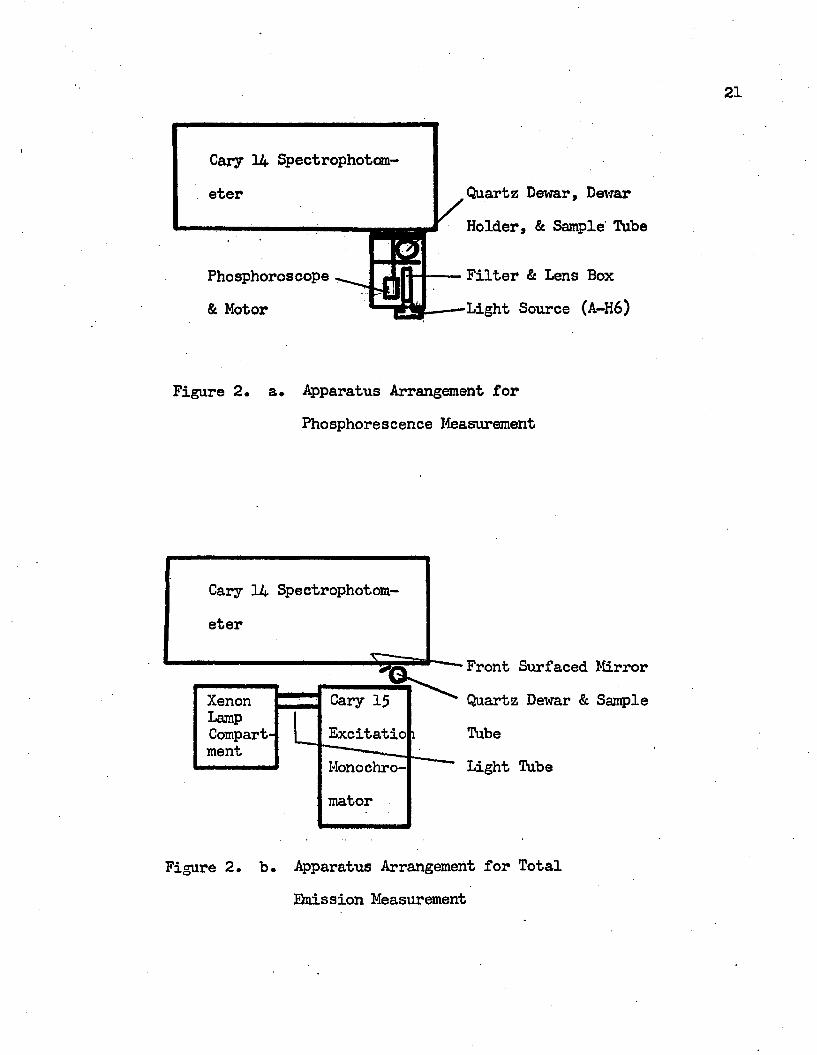
glassy solutions at liquid nitrogen temperature, 77°K. The phosphorescence spectra were obtained by means of either an Aminco-Keirs spectrophosphorimeter produced by the American Instrument Co*, or the Cary Model 14 spectrophotometer. The techniques of utilization of the Cary Model 14 to detect phosphorescence spectra have been described in detail by Harris 2 and Williamson*^ A phosphoroscope was fitted flush to the back of the spectrophotometer after the visible light source, the tungsten lamp, was removed* The sample was approximately at the normal position of the tungsten lamp. The phosphoroscope was a double blade type which, by means of offset slits in co-axial disks, alternately exposed the sample to the exciting light source, a 1000 watts General Electric A-H6 high pressure mercury arc, and then as an emitting sample to the Cary spectrophotometer* The spectrophotometer was operated in the total energy, single beam reference mode, and the spectra were recorded by using the percent transmission slide wire* The apparatus arrangement for phosphorescence measurement by utilizing the Cary 14 spectrophotometer is shown in Figure 2 (a)* All phosphorescence excitation spectra and the phosphorescence decay half lifes were obtained by means of the Aminco-Keirs spectrophosphorimeter* The excitation
3 2 H a r r i s , J. L., Ph. D* Dissertation, Louisiana State University, Baton Rouge, Louisiana, 1965*
33Williamson, H* L*, Ph. D. Dissertation, Louisiana State University, Baton Rouge, Louisiana, 1965*
20
source was a Xenon XBO 150 W lamp (Osram), and the detector was an RCA 1P28 photomultiplier tube. The phosphorescences and the phosphorescence excitation spectra were recorded with an Electro Instruments X-T recorder. The phosphorescence decay was displayed on the screen of a Tektronix 585 oscilloscope and photographed.
Hie fluorescence emission spectra were recorded with the Cary Model 14 spectrophotometer to which a total emission apparatus was attached. The total emission apparatus, see Figure 2 (b), was designed to give front surface excitation. The monochrometer used to isolate the desired exciting wavelength was a Cary Model 15 excitation monochromator. The excitation source was a Xenon XBO 450 W lamp (Osram). An aluminum tube was placed between the lamp compartment mounting plate and the monochromator to seal the monochromator from extraneous room light and the outside atmosphere. The U. V * filter (Coming #7910), which was located at the entrance of the light tube from the lamp compartment, was removed in order to permit operation in the U.V. region. In detecting the total emission spectra, the sample tube was placed at the position of the tungsten lamp of the Cary 14 spectrophotometer and the spectrophotometer was operated in the same mode as it was in detecting the phosphorescence spectra.
Cary 14 Spectrophotom-Quartz Dewar, DewareterHolder, & Sample' Tube
Filter & Lens BoxPhosphoroscopeLight Source (A-H6)& Motor
Figure 2. a* Apparatus Arrangement forPhosphorescence Measurement
Cary 14 Spectrophotom-
Xenon Cary 15LampCompart Excitatioment
Monochromator
Front Surfaced Mirror Quartz Dewar & Sample TubeLight Tube
Figure 2. b. Apparatus Arrangement for Total Qnission Measurement
I 22
III. RESULTS AND DISCUSSION
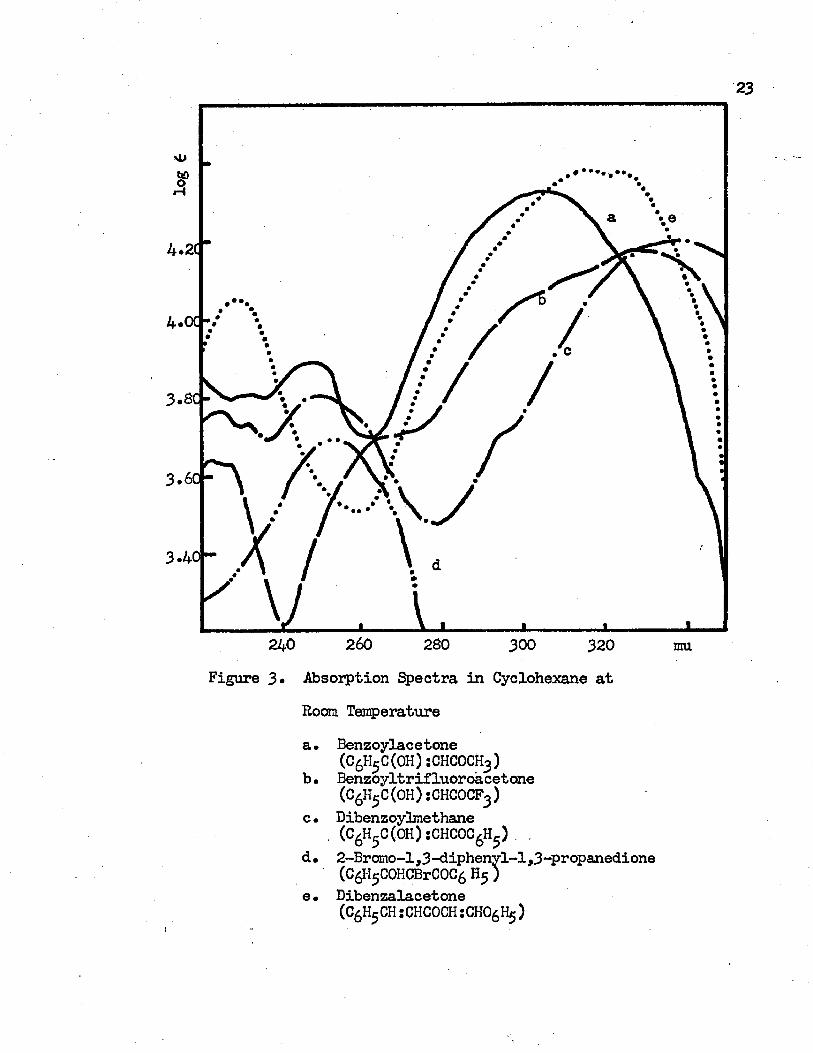
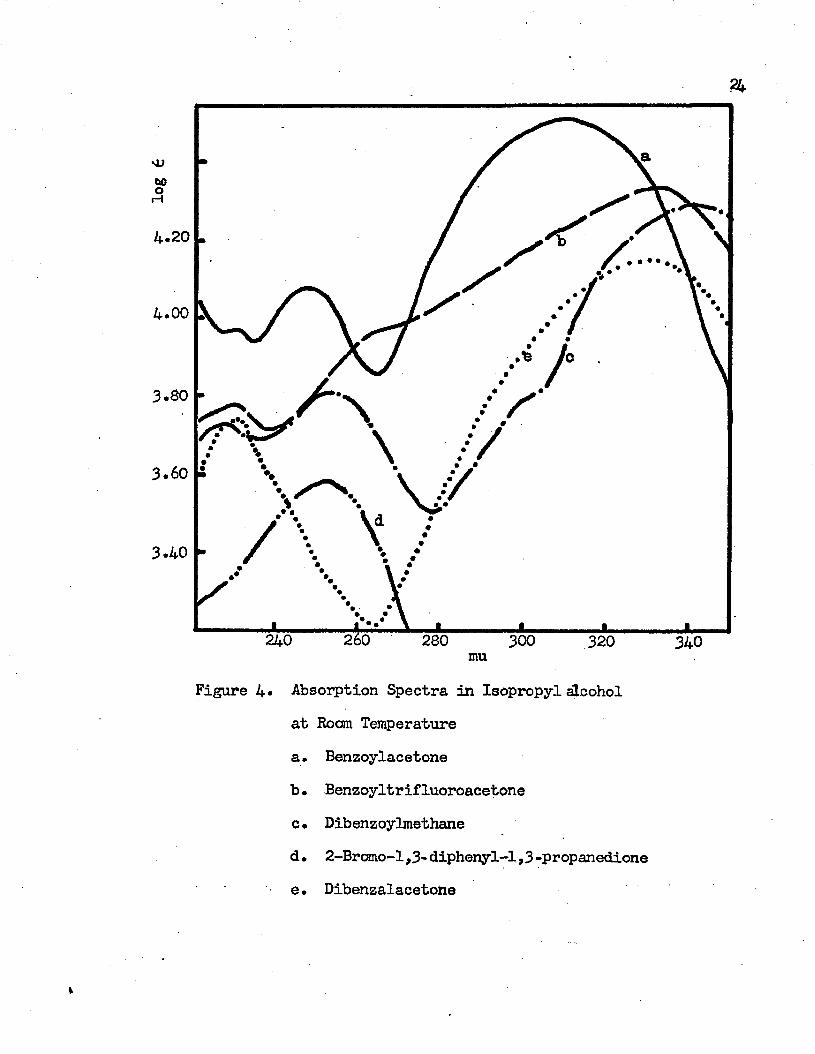
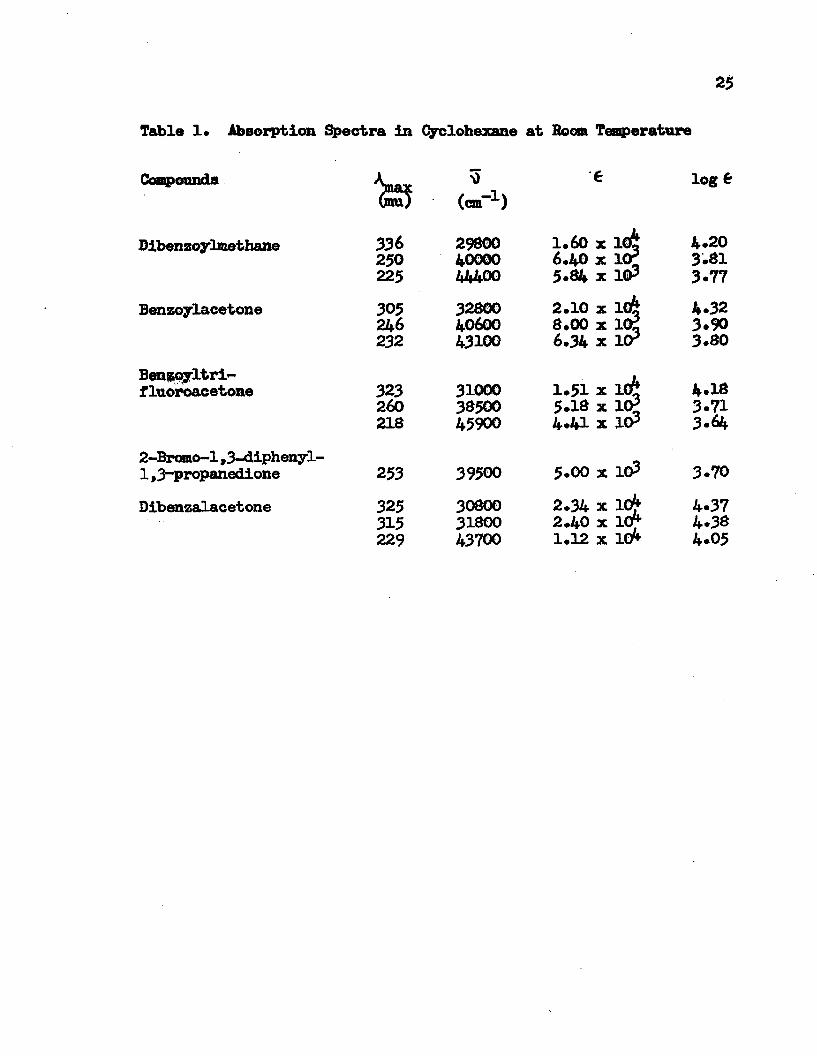
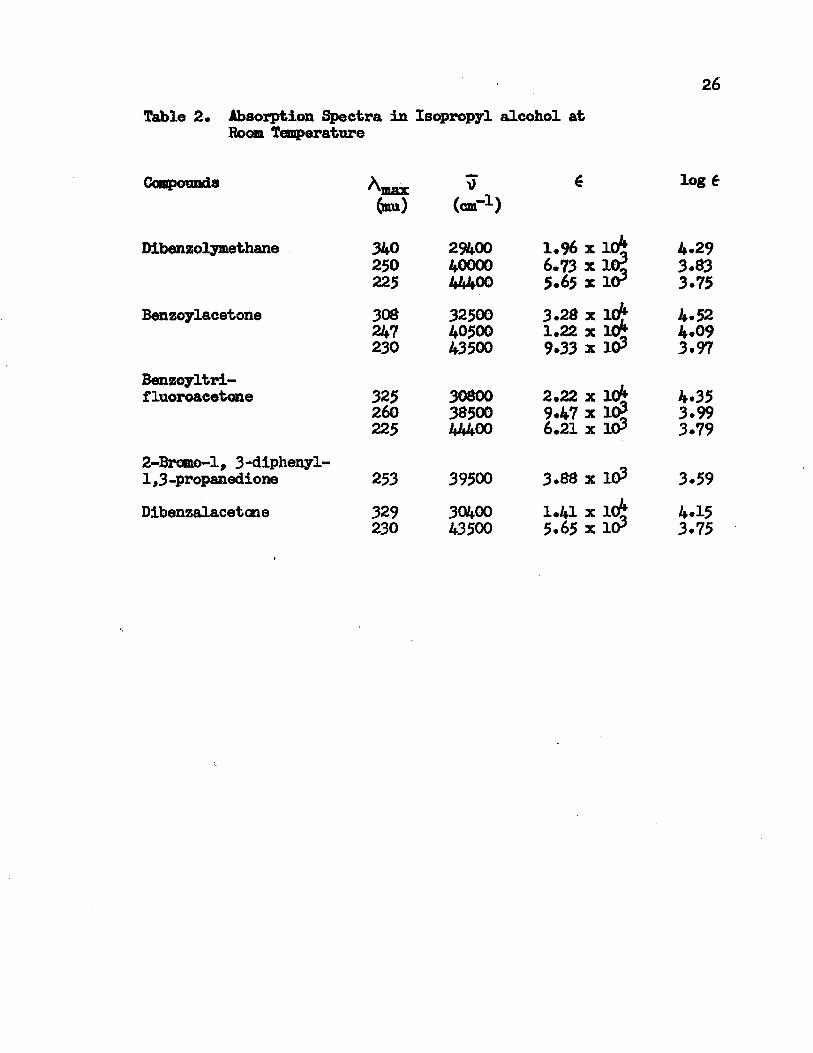
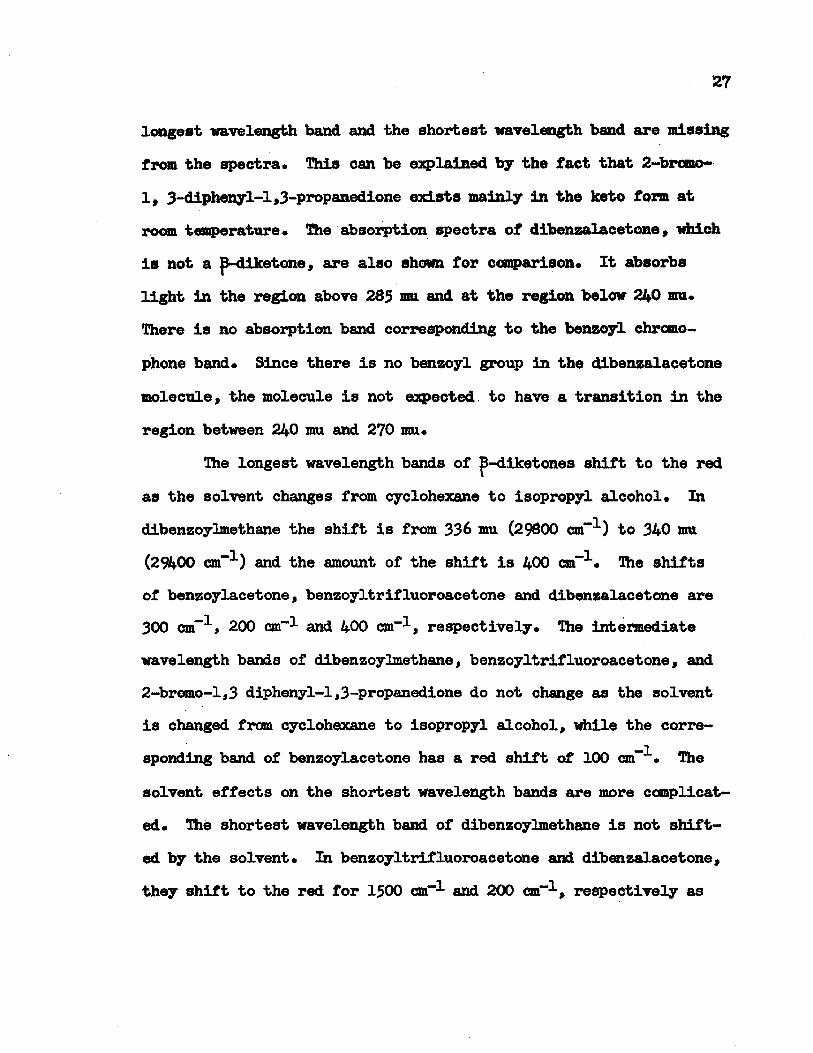
The absorption spectra of benzoylacetone, benzoyltrifluoro- acetone, dibenzoylmethane , 2-bromo-l ,3-diphenyl-l ,3-propanedione, and dibenzalacetone at room temperature in cyclohexane and in isopropyl alcohol are shown in Figure 3 and Figure 4, respectively.The wavelength and frequency of the absorption maximum and its molar extinction coefficient are given in Table 1 and Table 2. Most of the |3-diketones exist mainly in the chelated enol form at room temperature. The formation of an intramolecular hydrogen bond in the chelated enol fora stabilizes the molecule. The absorption spectraobserved at room temperature are the spectra of the chelated enol
34tautcmer of -diketones. In the previous study, the longest wavelength band (usually above 285 mu) was assigned to the cinnamoyl chromophere and the band in the intermediate region (240 mu to 270 mu) was considered to be due to the presence of the benzoyl group in the molecule. The shortest wavelength band, which appears below 240 mu, has been assigned to be the result of an electronic transition due to the presence of the styrene like moiety. Most of the aromatic jp-diketones have these three main bands in the ultraviolet region. 2-Bromo-1,3-diphenyl-l,3-propanedione is a f-dike- tone with the ^-hydrogen substituted by a bromo group. It shows only one electronic transition in the ultraviolet region. The
^Kuo, J., op. cit.
23
rl
4.2C"
4.0C
3.60 “
260 230 300 320 muFigure 3» Absorption Spectra in Cyclohexane at
Room Temperaturea. Benzoylacetone
(CgH5C(0H)sCHCOCH )b. Benzoyltrifluoroacetone
(C6H5C(OH):CHCOCF3)c• Dibenzoylmethane
. (C6H5C(OH):CHCOC6H5) . .
d• 2-Brcmo-l,3-diphenyl-l,3-propanedione (CgPjCOHCBrCOCfi H5 )
e. Dibenzalacetone(CgHgCH :CHC0CH: CHO^ )
log 6
7k
4.20
4 .0 0
3.80
3.60
3.40
260240 280 300 320 340muFigure 4« Absorption Spectra in Isopropyl alcohol
at Room Temperaturea. Benzoylacetoneb. Benzoyltrifluoroacetonec. Dibenzoylmethaned. 2-Bromo-l ,3- diphenyl-1,3 -propanedionee. Dibenzalacetone
25
Table 1* Absorption Spectra in Cyclohexane at Boom Temperature
Compounds
Dibenzoylmethane
Benzoylacetone
Benzoyltri~fluoroacetone
2-Bromo-l ,3-diphenyl- 1,3~propanedioneDibenzalacetone
'VaxC o
336250225
305246232
323260218
253
325315229
)S)
(cm”1
298004000044400
328004060043100
310003850045900
39500
308003180043700
e
1.60 x ldi6 .4 0 X 10? 5.84 x 10?
2.10 x 10&: 8.00 x 10? 6.34 x 10*
1.51 x 1€& 5.18 x 10?4 .4 1 x icy
log €-
4*203.813.77
4.323.903.80
4*183.713.64
5 .0 0 x 103 3 .7 0
2.34 x 10j> 4.372 .4 0 x 1<T 4 .3 01.12 x 10* 4.05
26Table 2. Absorption Spectra in Isopropyl alcohol at
Bom Temperature
Compoundsfora)
\>(cm-1)
6 log 6
Dibenzolymethane 340250225
294004000044400
1 .9 6 x 10% 6.73 x 10*5.65 x 10*
4.293.833.75
Benzoylacetone 308247230
325004050043500
3.28 x let 1 .2 2 x 10j 9 .33 x 10*
4.524.093.97
Benzoyltrifluoroacetone 325
260225
308003850044400
2 .2 2 x 10 9.47 x 10* 6 .2 1 x 1(P
4.353.993.79
2-Bromo-l, 3-diphenyl- 1,3-propanedione 253 39500 3 .8 8 x 1(£ 3.59Dibenzalacetcne 329
2303Q40043500
1.41 x lot 5.65 x 10*
4.153.75
27
longest wavelength band and the shortest wavelength band are missing from the spectra. This can be explained by the fact that 2-brcmo- 1, 3-diphenyl-l ,3-propanedione exists mainly in the keto form at room temperature. The absorption spectra of dibenzalacetone, which is not a ]J-diketone, are also shown for comparison. It absorbs light in the region above 2&5 mu and at the region below 240 mu. There is no absorption band corresponding to the benzoyl chromo- phone band. Since there is no benzoyl group in the dibenzalacetone molecule, the molecule is not expected to have a transition in the region between 240 mu and 270 mu.
The longest wavelength bands of p-diketones shift to the red as the solvent changes from cyclohexane to isopropyl alcohol. In dibenzoylmethane the shift is from 336 mu (29800 cm”1) to 340 mu (29400 cm"1) and the amount of the shift is 400 cm”1. The shifts of benzoylacetone, benzoyltrifluoroacetone and dibenzalacetone are 300 cm"1, 200 cm”1 and 400 cm”1, respectively. The intermediate wavelength bands of dibenzoylmethane, benzoyltrifluoroacetone, and 2-bromo-l,3 diphenyl-1,3-propanedione do not change as the solvent is changed from cyclohexane to isopropyl alcohol, while the corresponding band of benzoylacetone has a red shift of 100 cm"1. The solvent effects on the shortest wavelength bands are more complicated. The shortest wavelength band of dibenzoylmethane is not shifted by the solvent. In benzoyltrifluoroacetone and dibenzalacetone, they shift to the red for 1500 cm”-*- and 200 cm”-*-, respectively as
2dthe solvent varies from hydrocarbon to alcohol* On the contrary the corresponding band in benzoylacetone Is blue shifted 400 cm-'1' from the cyclohexane solvent to the isopropyl alcohol solvent* From the behavior of the absorption band upon change of the solvent and their molar extinction coefficients, which have values higher than 5000, we conclude that all the observed transitions are tT-*ti** The weak n if* transitions must be hidden under the much stronger ir_»ir* transitions and they can not be detected*
In a series of papers, Nagakura et al*^“ have developed atheory of intramolecular charge transfer* According to these authors, in molecules or ions in which electron donating and accepting groups combine with each other directly or through a bridge of conjugated double bonds, electron transfer takes place easily between the groups and strong bands characertistic of the interaction between the two groups appear* This kind of band is called an intramolecular charge transfer band* They have applied this theory to the interpretation of 285 nru band of benzalacetone in alcohol* This transition has been suggested to be the result of the migration of a T-electron in the highest occupied tt-level of styrene, which acts as a donor,
35Nagakura, S. and J. Tanaka, J* Chem* Phvs.22 236 (1954)*^ Nagakura, S., J. Chem* Phys* 22. 1441 (1955).37Hashimoto, F., J* Tanaka and S. Nagakura, J* Mol* Spectry*
10 401 (1963).
29
into the lowest vacant IT -level of acetone, which Is an acceptor, and the excitation energy corresponding to the ultraviolet absorption is given by
E«ccit. = [ - V s - * «** ca2 P8] 4
in which and Va are energies of the highest occupied TT -orbitalof styrene and of the lowest vacant tc-orbital of acetone, respectively* Cx is the coefficient of the atomic orbital of the carbon atom of the styrene (with the highest If-orbital occupied) to which the acetone is attached, and Ca is the coefficient of the atomic orbital of the acetone (with the lowest IT-orbital vacant) to which the styrene is attached. p is the exchange integral between the carbon atoms linking the styrene and acetone. We can apply this theory to the interpretation of the longest wavelength bands in p- diketones. The donor and the acceptor for each molecule and the corresponding intramolecular charge transfer band are given in Table 3 . For the same donor, the intramolecular charge transfer band shifts to the red as the acceptor is varied from acetone to aceto- phenone. This conclusion was reached by comparing the intramolecular charge transfer bands between the pairs of benzalacetone and benzalacetophenone, and benzoylacetone and dibenzoylmethane. In the former the donor group for both molecule? is styrene, while the acceptor for benzalacetone is acetone and the acceptor for benzalacetophenone is acetophenone. The intramole cular charge transfer band of benzalacetophenone is red-shifted compared with that of
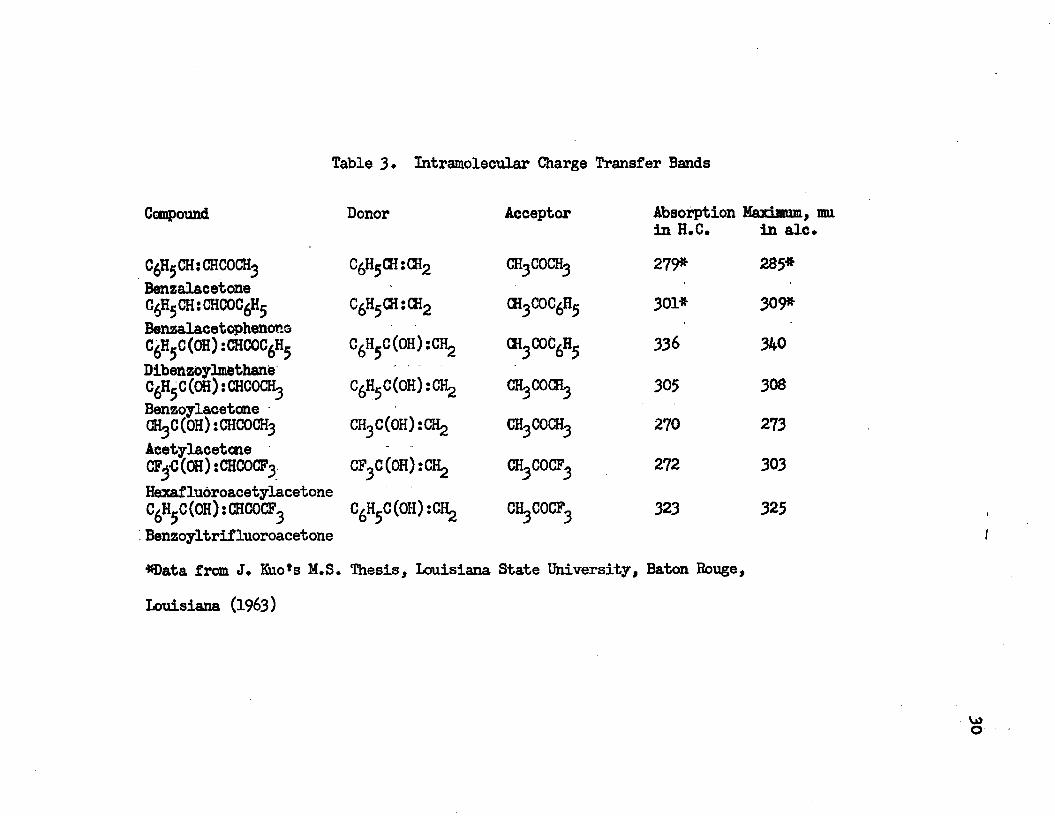
Table 3* Intramolecular Charge Transfer Bands
Compound Donor Acceptor Absorption Maximum,
C HjjCHsCHCOCH C6H5CH:CH2 ch3coch3
in H.C. 279*
in ale 285*
BenzalacetoneC6H5CH:CHCOC6H5 C6H5CH:CH2 ch3coc6h5 301* 309*BenzalacetophenoneC6H5C(OH):CHCOC6H5 C6H5C(OH):CH2 ch3coc6h5 336 340DibenzoylmethaneC6H5C(OH):CHCOCH3 C6H5C(OH):CH2 CK COCRj 305 308BenzoylacetoneGH3C(OH):CHCOCH3 CH3C(0H):GH2 ch3coch3 270 273Acetylacetcne CF C (OH): CHCOCF3 CF3C(0H):CH2 272 303HexafluoroacetylacetoneC6H5C(OH):CHCOCF3 C^C^HjiCHg ch3cocf3 323 325Benzoyltrifluoroacetone #Data from J. Kuo*s M.S. Thesis, Louisiana State University, Baton Rouge»Louisiana (1963)
VjJo
31
benzalacetone* The intramolecular charge transfer band of dibenzoylmethane is red-shifted compared with that of benzoylacetone* They have the same donor group, C H C(OH) while the acceptor for benzoylacetone is acetone and the acceptor for dibenzoylmethane is acetophenone* The acceptor group of CH COCF causes the intramolecular charge transfer band of benzoyltri£Luoroaceton% which has C H G(OH) :CH2 as an acceptor, to fall between that of benzoylacetone and dibenzoylmethane* By comparing the intramolecular charge transfer bands of acetylacetone, benzalacetone and benzoylacetone, it is found that they shift to the red as the donor groups vary from CH CCOlOrCH, to CgH GHsCEg and to C H C(CH) rGHLj, while the acceptor group in all the three molecules is acetone* Hexafluoroacetylacetone and benzoyltrifluoroacetone have trifluoro-acetone as an acceptor, while the former has CF CCOH):CH2 as a donor and the latter has C H C(OH):CH2 as a donor* The difference in the donor group causes that the intramolecular charge transfer band of benzoyltrifluoroacetone to shift to the red from that of hexafluoroacetylacetone* |J- Diketcnes in the enol-form can have this intramolecular charge transfer band* This transition can not occur in the keto form of |3-dike- tones because of the lack of the conjugated system in the molecule* This is a criterion for distinguishing the enolic -d ike tone from the -diketone in the keto form*
The absorption spectrum of dibenzoylmethane in isopropyl alcohol has been measured at different concentrations. The absorption spectra
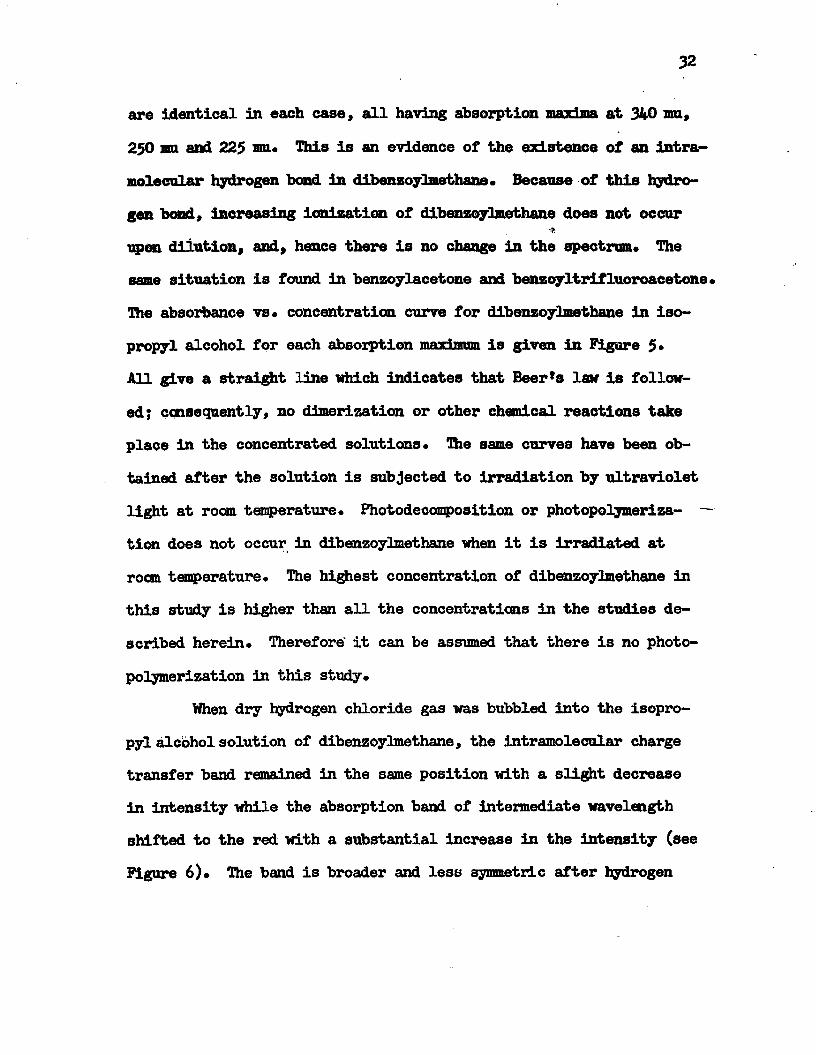
32
are Identical in each case, all having absorption maxima at 340 mu, 250 mn and 225 mu* This is an evidence of the existence of an intramolecular hydrogen bond in dibenzoylmethane* Because of this hydrogen bond, increasing ionisation of dibenzoylmethane does not occur
*upon dilution, and, hence there is no change in the spectrum* The same situation is found in benzoylacetone and benzoyltrifluoroacetone* The absorbance vs* concentration curve for dibenzoylmethane in isopropyl alcohol for each absorption maximum is given in Figure $•All give a straight line which indicates that Beer's lair is followed; consequently, no dimerization or other chemical reactions take place in the concentrated solutions* The same curves have been obtained after the solution is subjected to irradiation by ultraviolet light at roam temperature. Photodecomposition or photopolymeriza- — tion does not occur in dibenzoylmethane when it is irradiated at room temperature. The highest concentration of dibenzoylmethane in this study is higher than all the concentrations in the studies described herein* Therefore it can be assumed that there is no photopolymerization in this study*
When dry hydrogen chloride gas was bubbled into the isopropyl alcohol solution of dibenzoylmethane, the intramolecular charge transfer band remained in the same position with a slight decrease in intensity while the absorption band of intermediate wavelength shifted to the red with a substantial increase in the intensity (see Figure 6). The band is broader and less symmetric after hydrogen
log V
1
33
3.0 C,H_C(0H):CHC0C,H
2.5
2.0
1.5
1.0
0.5
2.30 9.20 11.5
o.a
0.7
0.6
0.5
0.4HI
0.3
0.2
0.1
Figure 5* Absorbance vs. Concentration of Dibenzoylmethane in Isopropyl alcohola. 340 mu Peakb. 250 mu Peakc. 225 mu Peak
4.20
4.00
3.60
260 360280240 300 320 340 muFigure 6* Absorption Spectra of Dibenzoylmethane in
Isopropyl alcohol at Room Temperaturea. before Addition of HC1b. after Addition of HCI for 3 mins.c. after Addition of HCI for 5 mins.
chloride gas is babbled into the solution* It is suspected that this band results from an overlapping of two closely spaced bands* The intensity of the band at the longer wavelength side increases when hydrogen chloride is added, while the intensity of the band at the shorter wavelength side decreases or remains the same* As a result the summation of effects causes the observed band shifts to the red and broadens the band width* The separation of these two bands seems to be in the neighborhood of 20 mu* The shorter wavelength band has its maximum at around 255 »u and the maximum of the longer wavelength band is in the region of 270 mu* Before hydrogen chloride gas is added the shorter wavelength band is predominant* After hydrogen chloride gas is added the intensity of the longer wavelength band increases* Finally the longer wavelength band overtakes the shorter wavelength band and the former becomes the main contributor to the observed band* The slight decrease in the intensity of the intramolecular charge transfer band suggests that the enol tautcmer decreases when hydrogen chloride gas is bubbled into the dibenzoylmethane in isopropyl alcohol* The 255 mu band is assigned to the second TT—*TT* transition of the enolic tautomer of dibenzoylmethane, and the band in the region of 270 mu is assigned to the keto tautomer of the dibenzoylmethane* This assignment is based on the blue phosphorescence excitation spectrum of dibenzoylmethane in EPA, which has a transition at 273 mu* The observed spectral change upon the addition of hydrogen chloride gas to the isopropyl alcohol solution of
36
dibenzoylmethane can be explained to be that resulting from the displacement of the keto-enol equilibrium towards the keto fora. We can consider the keto-enol tautomeric equilibrium in solution to be an acid-base equilibrium of two acids— the keto and enol forms which yield by ionization, the same, common anion of enolate structure. Proton transfer from enol to keto and back is affected by the participation of proton-carrier molecules S, which can unite reversibly with a proton,
EH + S ^ E" t HS+ KH + S
in which EH and KH are the enol and the keto tautomers and ET is the anion. The part of the proton carriers may be played by any species having an affinity for a proton. They can be solvent molecules, e.g. isopropyl alcohol, ethyl alcohol and ether in EPA, or the molecules of the keto-enol themselves. Normally one would expect that the enol tautomer has a higher acid dissociation constant that the keto tautomer. This is true in the case of the unchelated enol. In the case of the chelated enol the keto form is expected to be stronger acid than the enol form. This results from the presence in the enol form of an intramolecular hydrogen bond, which stabilizes the undissociated enol molecule. Addition of protons displaces the equilibrium toward the keto tautomer.
The intramolecular charge transfer bands have been studied further at liquid nitrogen temperature, 77°K. The substances were dissolved either in IFMP or EPA which form transparent rigid glasses
37
4.00
3-80Cz He C (OH ): CHCOC/H|
360 380320 340300mu
Figure 7. Absorption Spectra of Dibenzoylmethane • in XPKPa. at 25°Cb. at 77°Kc. at 77°K after Irradiation with
the A-H6 for 60 mins.d. at 25°C after Irradiation
at 77°K.
38
fflog■883
/IC6H5C(OH):CHCOC6H5
I
N//
J 1//
Figure 8.
320 340mu
Absorption Spectra of Dibenzoylmethane in EPAa. at 25°Cb. at 77°Kc. at 77°K after Irradiation with
the A-H6 for 60 mins.
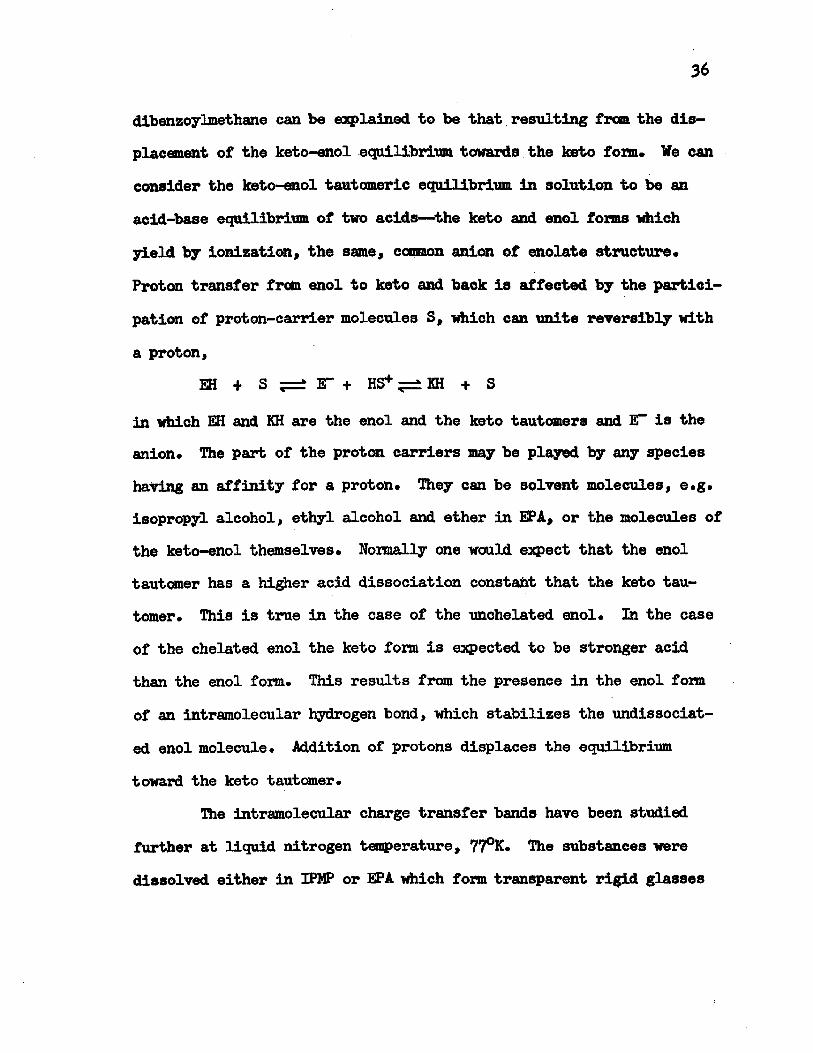
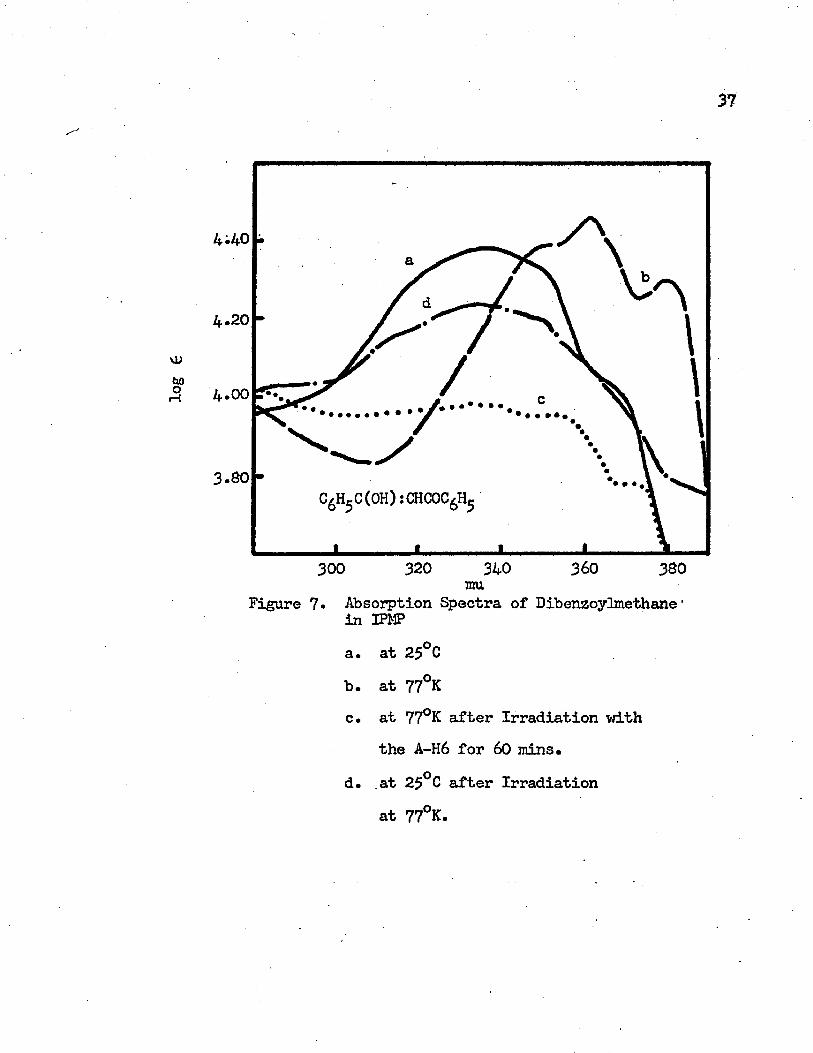
at 77°K. The intramolecular charge transfer band of dibenzoylmethane in IPMP is given in Figure 7* At room temperature it shows a broad band with the maximum at 335 mu (29850 cm"*1) and two shoulders at 295 mu (33900 cm”1) and 365 mu (27400 cm”*1) in the ultraviolet region. As the temperature decreases to the liquid nitrogen temperature, 77°K, the band shifts to the red and three distinct vibrational bands with maxima at 379 mu (26390 cm-1), 362 mu (27620 cm”1) and 350 mu (28570 cm-1) appear. The observed vibrational frequencies in the first excited singlet state are 1230 cm-1 and 950 cm”1. The 362 mu vibrational band has the greatest intensity. The 0-0 band, which is the transition between the vibrational levels of the ground state and the first excited singlet state or the vibrational band with the longest wavelength maximum, occurs at 379 mu. According to the Franck-Condon principle, if the first excited singlet state and the ground state have significantly different geometries, the 0-0 band may not be the band of maximum intensity. The intramolecular hydrogen bond is the main factor which causes the different geometries in the ground and the first excited singlet states. In the EPA solvent at room temperature, the intramolecular charge transfer band of dibenzoylmethane has a maximum at 340 mu (29410 cm-"1) with shoulders at 295 mu, 330 mu and 365 mu. Four vibrational structures with maxima. at 378 rau (26460 cm-1), 359 mu (27860 cm"1), 344 mu (29070 cm"1), and 300 mu (33330 cm"1) appear at 77°K as shown in Figure 8. The observed vibrational frequencies are 4260 cm”1,
3.6C
3.4'
3.2C •
280 300 320 340mu
Figure 9- Absorption Spectra of Benzoyl- acetone in IPMPa. at 25°Cb. at 77°Kc. at 77°K after Irradiation with
the A-H6 for 60 mins.d. at 25°C after Irradiation at
77°K
Absorbance
41
• •
360280 300 340320mu
Figure 10. Absorption Spectra of Benzoylacetonein EPAa. at 25°Cb. at 77°Kc. at 77°K after Irradiation with the
A-H6 for 60 mins.
42
1210 cm-'*' and 1400 cm-’*'. The band of the maximum intensity is the
longest wavelength band, 37$ mu, namely the 0-0 band. This means that the geometries of the excited state and the ground state of dibenzoylmethane in EPA are not much different.
Intramolecular charge transfer bands of benzoylacetone in IPMP and in EPA are shown in Figures 9 and 10, respectively. In IPMP at roam temperature it shows a broad band with a maximum at 304 mu (32890 cm-1) and shoulders around 320 mu and 345 mu. This band shifts to the red at 77°K and shows five vibrational bands at 350 mu (28570 cm-1), 334 mu (29940 cm-1), 320 mu (31250 cm"1), 310 mu (32260 cm-1) and 300 mu (33330 cm-1). The observed vibrational frequencies are 1370 cm""1, 1310 cm”1, 1010 cm”1 and 1070 cm-1. The bandof maximum intensity is the 320 mu band. In EPA at room temperaturethe intramolecular charge transfer band of benzoylacetone is an un- symmetric one with a tail on the long wavelength side and with an absorption maximum at 305 mu (32790 cm-1). The corresponding vibrational bands at 77°K are at 346 mu (28900 cm”1), 330 mu (30300 cm”1),318 mu (31450 cm-1), 308 mu (32470 cm-1) and 298 mu (33560 cm"1).The observed vibrational frequencies are 1310 cm-1, 1150 cm"1, 1020 cm-1 and 1090 cm”1.
Benzoyltrifluoroacetone spectra are similar to those of benzoylacetone • In IPMP at room temperature the intramolecular charge transfer band of benzoyltrifluoroacetone has an absorption lwnHnrnin at 322 mu (31060 cm”1) and a shoulder at 300 mu (33330 cm”1). At 77°K
4.10
4-00
3.90
3.60
3.70• •••
» «
280 300 320 340mu
Figure 11* Absorption Spectra of Benzoyltrifluoroacetone in IPMPa. at 25°Cb. at 77°Kc. at 77°K after Irradiation with
the A-H6 for 60 mins.d* at 25°C after Irradiation at 77°K
44
C/H,-C(OH) sCHCOCF,
©o
&013
360280 300 320mu
340
Figure 12. Absorption Spectra of Benzoyltrifluoroacetone in EPAa. at 25°Cb. at 77°Kc. at 77°K after Irradiation with
the A-H6 for 60 mins.
45
vibrational bands appear at 356 mu (28090 cm”1), 338 mu (29590 cm”1), 328 mu (30490 cm”1) and 305 mu (32790 cm”1) as shown in Figure 11*In EPA at room temperature the absorpticn maximum of this band is at 324 mu (30860 cm”1), while at 77°K this charge transfer band shows vibrational structures with the maxima at 35& mu (27930 cm”1), 339
mu (29500 cm” ), 328 mu (30490 cm” ) and a shoulder around 312 mu (32050 cm”1)* The observed vibrational frequencies of the first excited singlet state of benzoyltrifluoroacetone at 77° K are 1$00 cm"1, 900 cm”1 and 2300 cm- 1 at IPMP and they are 1530 cm”1 and 990 cm”1 at EPA. I
The temperature dependent change in the absorption spectra has been suggested to result from a temperature effect on the refractive index of a solvent, a temperature effect on the Boltzmann distribution amoung vibrational and rotational energy levels of thesolute molecule, and temperature-dependent interactions of the mole-
38cules in the system. The temperature-dependence of the IPMP and EPA solvents does not change the absorption spectra substantially; this has been demonstrated by Williamson. The tenperature-depen- dence of the vibrational and rotational energy levels can be interpreted in terms of the Franch-Condon principle. In view of the spectral width of the bands at room temperature, it is evident that
3®Ito, M., J. Mol. Spectry., 106 (i960).39Williamson, H. L., op. cit.
46
they contain more than a single vibrational transition* They are superpositions of numerous vibrational bands, all of which belong to the same electronic transition, smeared into a continuous band by the action of the fields of neighboring molecules* These vibrational transitions involve changes in the quantum numbers of several norami vibrations* As the temperature rises, the light absorbing molecules are raised into higher vibrational quantum states, in accord with the Boltzmann distribution law* The most probable transitions for these molecules involve, by the Franck-Condon principle, different changes of vibrational quantum numbers from those of molecules in the lowest level. The superposition of all these transitions must result in a broadening and flattening of the over-all absorption curve* Therefore, absorption band sharpness increases and position of absorption maximum does not shift or shifts very little to the longer wave length side with decreasing temperature. In our case the band sharpness does increase and vibrational structure appears as the temperature decreases to 77°K and the position of the absorption maximum does shift to the longer wavelength side a substantial amount. This shift must be caused by the formation of more intramolecular hydrogen bond at the low temperature*
The red-shift of the absorption spectrum upon the formation of an intramolecular hydrogen bond can be interpreted by the intramolecular charge transfer theory and by the Franck-Condon principle* According to the intramolecular charge transfer model the excitation
energy is dependent on Hg, Va, Cx, Ca and ji (see Equation (l) )•This excitation energy depends on the value of Ca if the other quantities are constant* A decrease in the Ca value is correlated with a red shift in the absorption spectrum* This occurs in a molecule upon the fonnation of an intramolecular hydrogen bond between the C:0 and OH groups* In the course of formation of an intramolecular hydrogen bond, charge distribution in the carbonyl group must be greatly affected and the contribution of ionic forms 0 - & and ti - 5 to the bond resonance is increased; consequently the electrostatic attraction between the positively charged hydrogen atom of the OH group and the negatively charged oxygen atom of the C:0 group increases* As a result the carbon atom of the carbonyl group becomes more positive on the formation of an intramolecular hydrogen bond* This decreases the Ca value and causes that the intramolecular charge transfer band to shift to the red* Pimentel ® has interpreted the spectrum change upon the fonnation of a hydrogen bond in terms of the Franck-Condon principle* The spectrum change is dependent on the difference of the energy of the hydrogen bond in the excited state of the molecule and the energy of the hydrogen bond in the ground state of the molecule* The absorption spectrum shifts to the red if the energy of the hydrogen bond in the excited state of the molecule is higher than that in the ground state of the molecule*
°Pimentel, G. C., J. Am. Chem. Soc. 22 3323 (1957)
AS>7he observed absorption spectra of benzoylacetone, benzoyl-
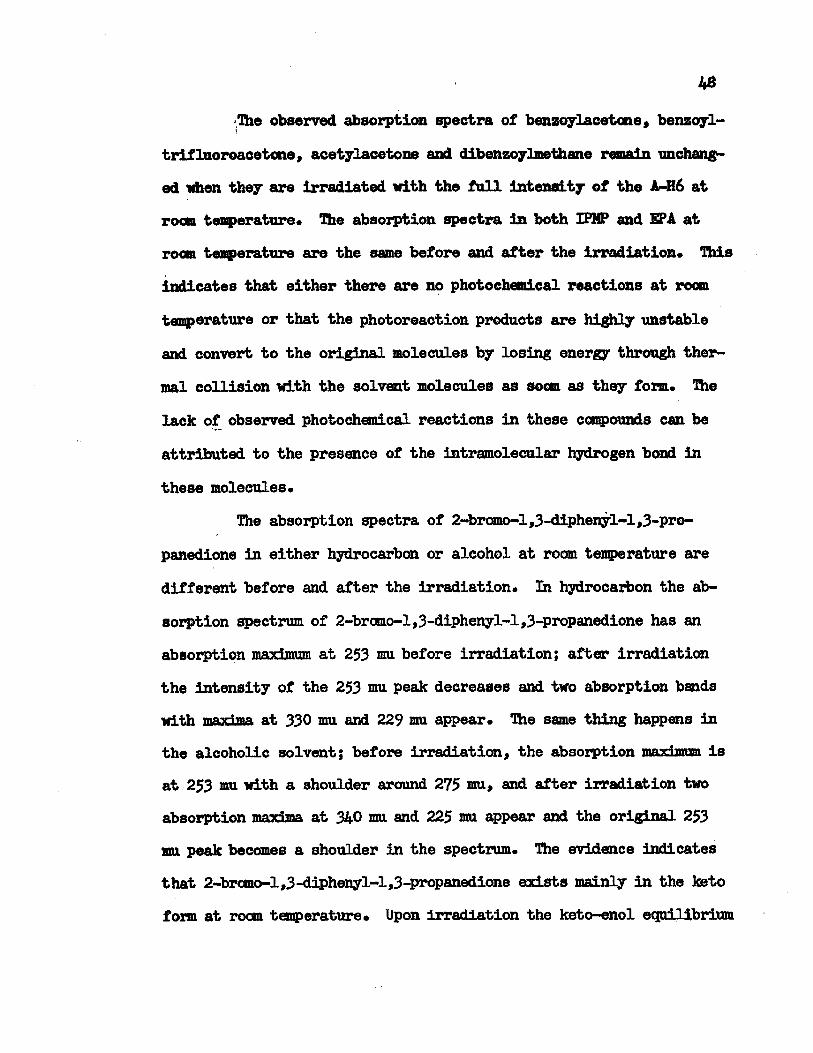
trifluoroacetcne, aeetylacetone and dibenzoylmethane remain unchanged when they are irradiated with the fall intensity of the A-H6 at room temperature. The absorption spectra in both IPMP and EPA at room temperature are the same before and after the irradiation* This indicates that either there are no photochemical reactions at room temperature or that the photoreaction products are highly unstable and convert to the original molecules by losing energy through thermal collision with the solvent molecules as soom as they form. The lack of observed photochemical reactions in these compounds can be attributed to the presence of the intramolecular hydrogen bond in these molecules*
The absorption spectra of 2-bromo-l ,3-diphenyl-1,3-pro- panedione in either hydrocarbon or alcohol at room temperature are different before and after the irradiation* In hydrocarbon the absorption spectrum of 2-bromo-l ,3-dipheny 1-1,3-propanedione has an absorption maximum at 253 mu before irradiation; after irradiation the intensity of the 253 mu peak decreases and two absorption bands with wftTriwa at 330 mu and 229 mu appear* The same thing happens in the alcoholic solvent; before irradiation, the absorption maximum is at 253 mu with a shoulder around 275 mu, and after irradiation two absorption wa^wa at 340 mu and 225 mu appear and the original 253
mu peak becomes a shoulder in the spectrum* The evidence indicates that 2-brcmo-l,3-diphenyl-1,3-propanedione exists mainly in the keto form at room temperature* Upon irradiation the keto-enol equilibrium
log t
49
4.20
4.00
3.80
3.60
3.40
3.20
260 280 320240 300mu
Figure 13* Absorption Spectra in IPMP atRoom Temperaturea• 2-Bromo-l,3-diphenyl-l,3-propanedione b • 2-Bromo-l ,3-d.ipbenyl-l ,3-propane
dione after Irradiation at 25°Cc. Dibenzoylmethane
50
C/H,C(0H) :CHCOC/H(4.20
4.00
3.80
3.60
3.40
360340 380mu
Figure 14* Absorption Spectra in IPMP at 77°Ka. Dibenzoylmethaneb. Irradiated 2-Bramo-l,3-diphenyl-
1,3-propanedionec. Irradiated Dibenzoylmethane.
51
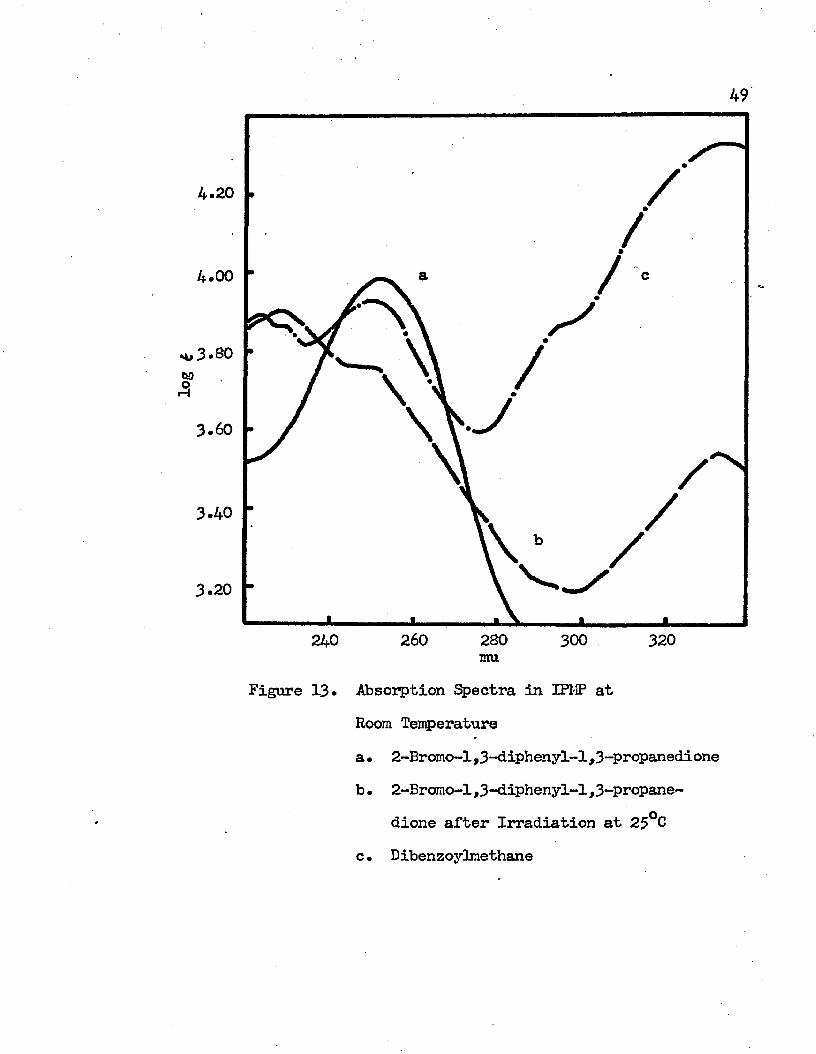
is displaced towards the enol tautcmer* The presence of the intramolecular charge transfer band and the band below 230 mu indicates the presence of the enol tautcmer in the irradiated molecule* A comparison of the absorption spectra of dibenzoylmethane, 2-bromo-l, 3-diphenyl-l ,3-propanedione, and the irradiated 2-brcmo-l ,3-diphenyl-1,3-propanedione in IPMP at room temperature is shown in Figure 13* The intramolecular charge transfer bands of these molecules at 77°K are shown in Figure 14* Except for the intensity, the absorption spectrum of the irradiated 2-bromo-l,3-diphenyl-l ,3-propanedione is almost identical with the absorption spectrum of dibenzoylmethane*
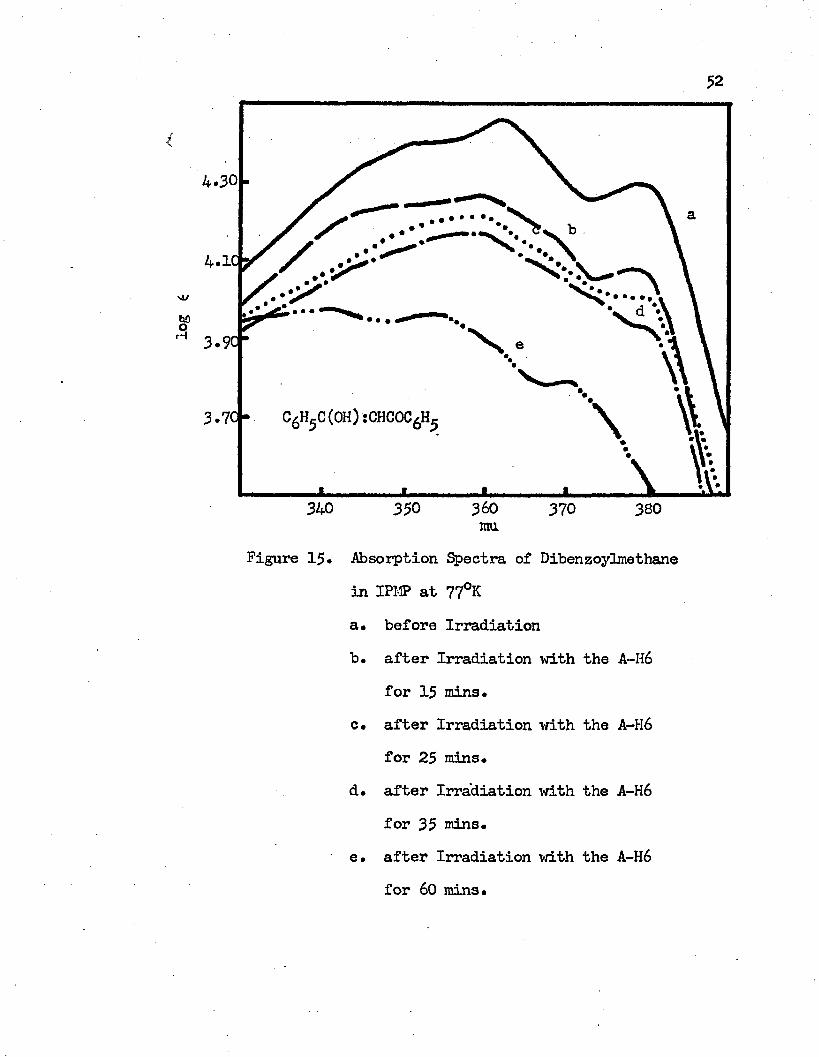
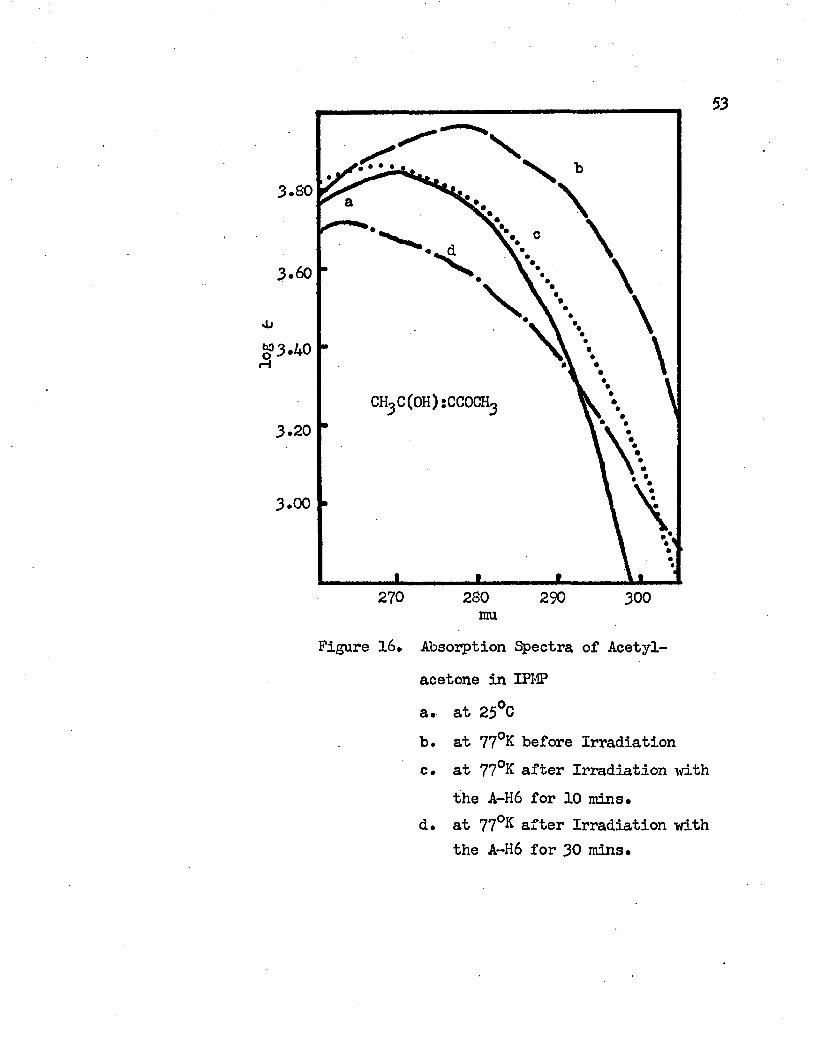
The observed absorption spectra of -diketones are different before and after irradiating the molecules at 77°K* At 77°K, the intramolecular charge transfer band of the molecules is blue shifted and its intensity decreases after irradiation* (see Figures 7 through 12). The decrease in the intensity and the degree of the blue-shift of the absorption maximum of the intramolecular charge transfer band at 77°K is proportional to the time of the irradiation. The longer the molecule at 77°K is exposed to the A-H6 light the lower the intensity of the intramolecular charge transfer band and the more the band maximum shifts to the blue* Two examples are shown in Figures 15 and 16 for the IPMP solutions of dibenzoylmethane and acetylacetone, respectively* In acetylacetone, the absorption maximum at 77°K is 277 mu before irradiation* After irradiation for 10 minutes the absorption maxi mum shifts to 260 mu and its intensity is very close to the intensity of the absorption band at roam
Sot
52
4.1<
3.7c • C6H5C (OH): chcoc6h.
360340 350 370 380mu.
Figure 15. Absorption Spectra of Dibenzoylmethane in IPMP at 77°Ka. before Irradiationb. after Irradiation with the A-H6
for 15 mins.c. after Irradiation with the A-H6
for 25 mins*d. after Irradiation with the A-H6
for 35 mins.e. after Irradiation with the A-H6
for 60 mins.
53
3.80
3.60
3.20
3.00
270 280 290 300nru
Figure 16. Absorption Spectra of Acetylacetone in IPMP a• at 25°Cb. at 77°K before Irradiationc. at 77°K after Irradiation with
the A-H6 for 10 mins.d. at 77°k after Irradiation with
the A-H6 for 30 mins.
temperature, which has an absorption maximum at 269 mu. Farther irradiation for 20 minutes shifts the absorption to 264 mu andits intensity to lower than that of the band at room temperature.The spectra of the molecules at room temperature before irradiation and the spectra of the irradiated molecules at room temperature are different. The latter were taken after irradiating the samples with the A-H6 for 60 minutes at 77°K and then warming them to room temperature. The intensity of the intramolecular charge transfer bands of the irradiated molecules is lower than that of the molecules before irradiation as shown in Figures 7, 9 and 11. The ratio of the intensities of the intermediate wavelength band and of the intramolecular charge transfer band in the irradiated molecule is larger than that of the same molecule before irradiation.
Photochemical reactions took place upon irradiation of the molecule in the rigid glass solvent at 77°K. The spectra of the molecules in the rigid glass were recorded from the region of visible light into the region of infrared, 1500 mu. The spectra of the region above 400 mu do no change upon irradiation. No trapped free electron, which absorbs light in the region of near infrared, has been detected. Photooxidation of the molecule in the rigid glass upon irradiation by ejecting an electron does not occur in these systems. This can be supported further by the observation of the change in the absorption spectrum of the original molecule and the irradiated molecule at room temperature. In a photoelectron ejection
reaction the ejected electron should recombine with the radical, which is formed initially by photooxidaticii of the original molecule, on raising the temperature to room temperature and the original molecule should be restored* That means that the original spectrum is restored by softening the glass, which is not the case observed in this work* The impossibility of the photoejection reaction in p- diketones can be attributed to the presence of the intramolecular hydrogen bond in these molecules* The fonnation of an intramolecular hydrogen bond ties down the lone pair electrons of the oxygen atom in the molecule and prohibits the oxidation reaction from occurring easily* It has already been mentioned that photopolymerization does not occur in these systems. The blue shift of the intramolecular charge band upon irradiation verifies this assumption further* It is unlikely that photodecomposition occurs upon irradiation of p-dike- tones in the rigid glass. This is supported by the facts that although the intensity of the spectrum of the original molecule and that of the Irradiated molecule at room temperature are different, the positions of their absorption maxima are the same* If there were permanent photodecomposition products the absoxption maxima of the irradiated products should shift to the blue with respect to that of the original molecule*
In order to study the photoreactions of p-diketones in the rigid glasses more thoroughly, luminescences of these compounds in the rigid glass have been investigated* Neither phosphorescence nor
fluorescence spectra of {3-diketones have been observed at room temperature. At 77°K, all {3-diketones studied in this work gave observable phosphorescences. {3-Diketones in EPA glass give blue phosphorescences as soon as the exciting light, the full intensity of the A-H6, impinged upon the sample. They show another phosphorescence in the region around 500 mu but these phosphorescences are very weak.
The blue phosphorescence spectra of some {3-diketones in EPA are given in Figure 17. The blue phosphorescence of dibenzoylmethane in EPA has four vibrational bands at 475 mu (21000 cm-'*'), 440 mu (22700 cm-'*'), 407 mu (24600 cm-'*') and 380 mu (26300 cm 1). The band of
maximum intensity is the 407 mu band. This phosphorescence decayed_2exponentially with a half life of 3*2 x 10 sec. The observed vib
rational frequencies of the ground state of dibenzoylmethane are1700 cm-'*', 1900 cm-1 and 1700 cm-'*'. The blue phosphorescence of ben-
-2zoylacetone decayed expoentially with a half life time of 3*0 x 10 sec. and its spectrum has an intensity maximum at 415 mu, the band of shortest wavelength being at 390 mu. The observed vibraticnal frequencies of benzoylacetone are 1700 can-'*', 1400 cm-'*' and 1500 cm-'*'.The half life times of the blue phosphorescences of benzoyltrifluoroacetone and of 2-bromol,3-diphenyl-l ,3-propanedione are 1.2 x 10- sec. and 2.5 x 10” sec., respectively. The blue phosphorescence spectrum of benzoyltrifluoroacetone has vibrational bands at 490 mu (20410 cm-1), 455 urn (22000 cm-1), 425 mu (23500 cm-1) and 400 mu (25000 cm-1) with the 425 mu being the band of maximum intensity.
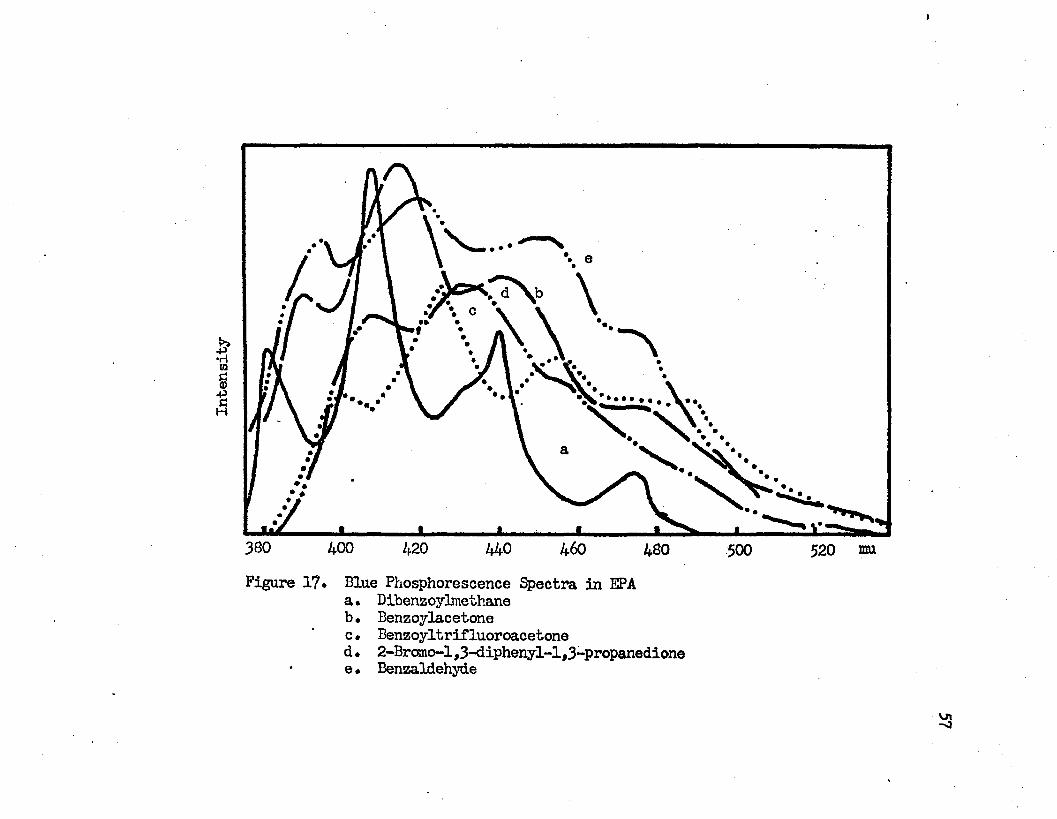
Figure 1?. Blue Phosphorescence Spectra in EPAa. Dibenzoylmethaneb. Benzoylacetonec. Benzoyltrifluoroacetoned. 2-Bromo-l,3-diphenyl-l,3-propanedione e• Benzaldehyde
53—1 —1The observed vibrational frequencies are 1590 cm , 1500 cm and
1500 cm""-*-. Two peaks at 430 mu (23260 cm--*-) and 407 mu (24570 cm"*-*-) and a shoulder at 460 mu (21740 cm"'1') appear in the blue phosphorescence spectrum of 2-bromo-l, 3-diphenyl-l ,3-propanedione in EPA glass.
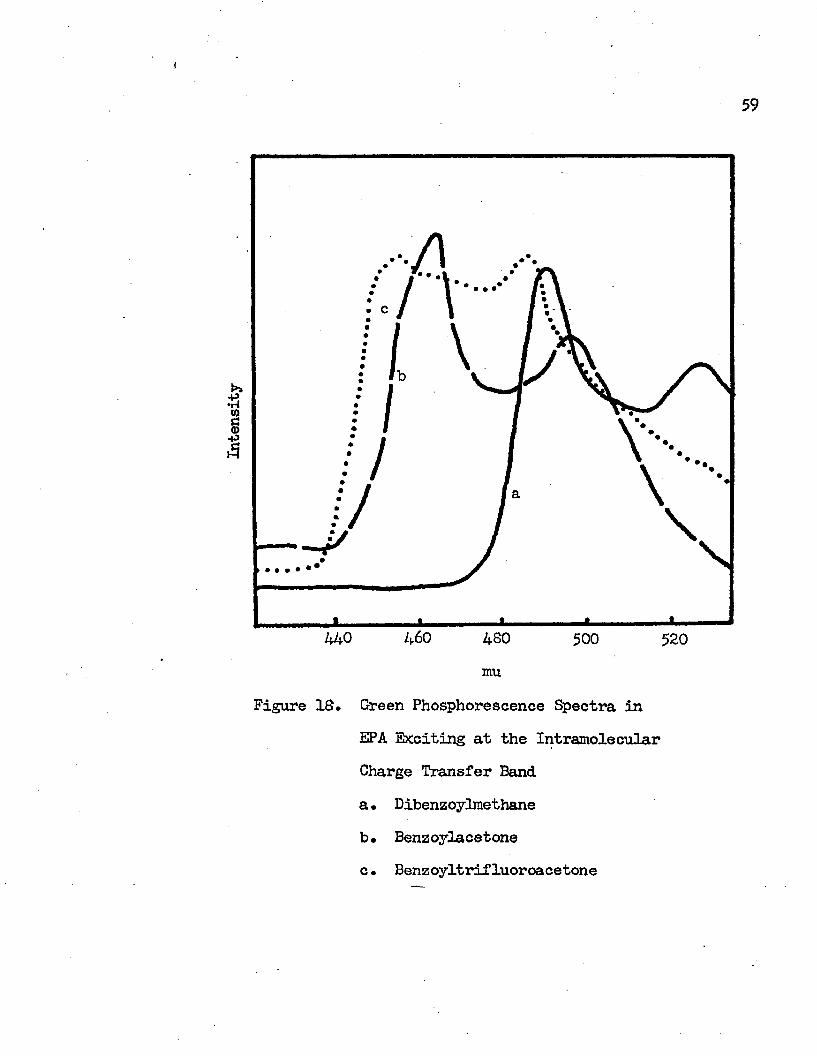
n -1The observed vibrational frequencies are at 1520 cm and 1310 cm . The 430 mu band is the band of maximum intensity. The phosphorescence spectrum of benzaldehyde in EPA is shown in Figure 17 for comparison. It gives four vibrational bands at 473 mu (21120 cm-1),453 mu (22100 cm"1), 422 mu (23700 cm"1) and 394 mu (25360 cm"1) with vibrational frequencies of 930 cm"1, 1600 cm"1 and 1660 cm"1. The 422 mu band is the band of maximum intensity. The phosphorescences in the region around 500 mu are so weak that measurement of their half lifes was not possible. Green phosphorescences can be observed after the sample glasses were removed from the exciting light, but not the blue phosphorescences. It is possible that the green phosphorescence has a longer half life than the blue phosphorescence. When a selected wavelength of the exciting light is used, the green phosphorescence of -diketones in EPA can be measured independently. These phosphorescence spectra were obtained by means of the Aminco- Keirs spectrophosphorimeter. The exciting wavelength, which is at wavelength greater than 300 mu, is the wavelength of the vibrational band of the intramolecular charge transfer band. With this low energy excitation no blue phosphorescence was observed in the spectrum, the only phosphorescence present in the spectrum was the green
59
23
440 460 4SO 500 520mu
Figure IS. Green Phosphorescence Spectra inEPA Exciting at the Intramolecular Charge Transfer Band a • Dibenzoylmethaneb. Benzoylacetone c• Benzoyltrifluoroacetone
60phosphorescence. These green phosphorescences of -d ike tone s in EPA are shown in Figure Id. When dibenzoylmethane in EPA was subjected to an exciting light of 359 mu, it showed a green phosphorescence with vibrational structures at 527 mu (I698O carl) and 490 mu (201+10 om-3). The observed vibrational frequency is 1430 cm”1. The 490 mu peak is the band of maximum intensity. Benzoylacetone and benzoyltrifluoroacetone in EPA gave green phosphorescence when irradiated with light of 318 mu and 339 mu respectively. The green phosphorescence of benzoylacetone has vibrational peaks at 495 mu (20200 cm”1) and 464 mu (21550 cm-1) with vibraticnal frequency of 1350 cm \ Vibrational structures of 485 mu (20620 cm"1) and 455 mu (21980 cm”1) with vibraticnal frequency of 1360 cm"1 make up the green phosphorescence spectrum of benzoyltrifluoroacetone in EPA. Green phosphorescence has not been observed frcm 2-bromo-l,3-diphenyl-l ,3-propanedione in EPA.
In the hydrocarbon glass -diketones give initially a green phosphorescences in a very weak blue phosphorescences. The intensity of the blue phosphorescences builds up gradually, while the intensity of the green phosphorescence decreases slightly with time. Because of the small solubilities of j3-diketones in hydrocarbon, the determination of half life of phosphorescences of -diketones in this solvent fails. When the exciting light was in the region of the intramolecular charge transfer band, no blue phosphorescence has been observed but only the green phosphorescence can be observed from the
61fl-dlketones either before or after irradiation* The irradiated |3- diketones in the hydrocarbon glass gave a strong blue phosphorescence when they are excited with the full intensity of the A-H6* In 3~ methylpentane the irradiated dibenzoylmethane gives a blue and a green phosphorescences* The green phosphorescence with vibrational bands at 530 mu (18870 cm""1) and 497 mu (20120 cm"1) is weaker than the blue phosphorescence which has vibrational bands at 452 mu (22120 cm-1), 421 mu (23750 cm"1) and 393 mu (25450 cm"1)* The vibrational band, which corresponds to the 475 mu band of the blue phosphorescence in EPA, is submerged in the green phosphorescence and cannot be found*
The phosphorescences of dibenzoylmethane in 3-methylpentane are displaced toward longer wavelengths in comparison with the phosphorescences of the compound in EPA; this is shown in Figure 19* Solvents affect the blue and the green phosphorescences differently. The shortest wavelength band of the blue phosphorescence shifts from 393 mu (25450 cm"1) to 380 mu (263OO cm-1) as the solvent varies from 3-methylpentane to EPA* The shift caused by the difference in solvents is 950 cm-1* The shortest wavelength band of the green phos- porescence shifts from 497 mu (20120 cm"1) to 490 mu (20410 cm-1) as the solvent varies from 3-*nsthylpantane to EPA* The amount of the shift from 3-methylpentane to EPA is 290 cm"1, which is about three times less than the shift of the blue phosphorescence*
Phosphorescences of benzoylacetone and benzoyltrifluoroacetone
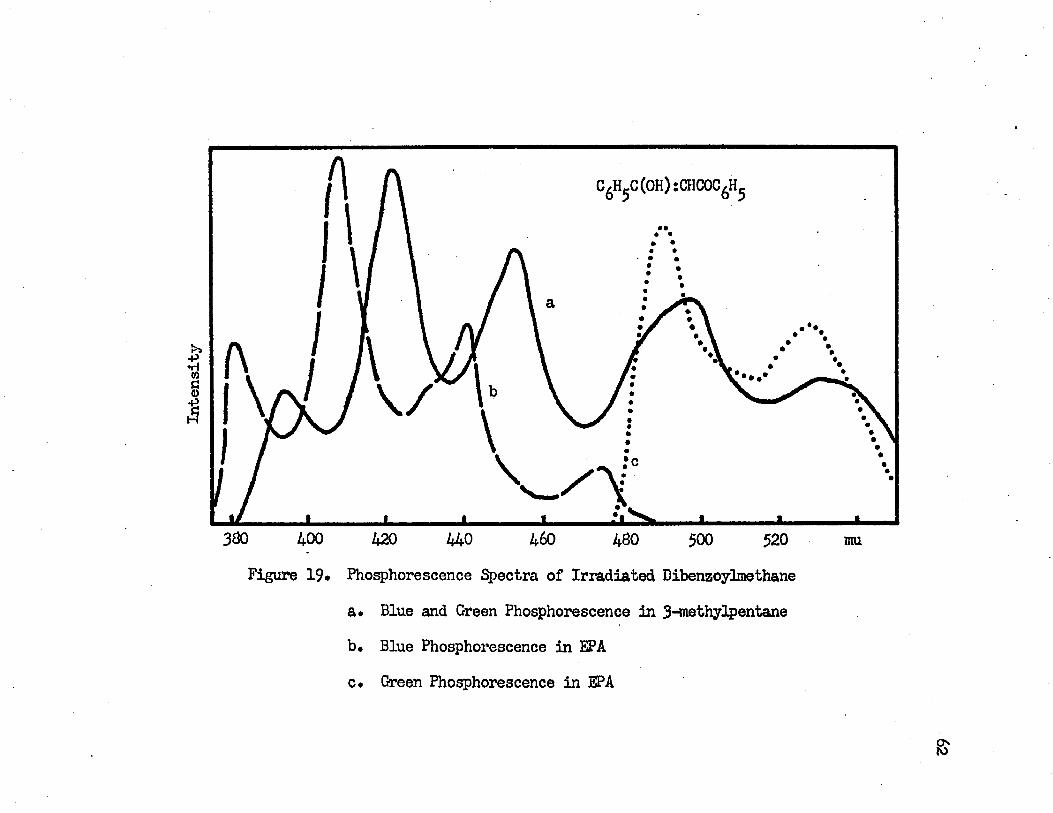
Intensity
C/H-C(OH)jCHCOC/H
• •
380 400 440 500 520 muFigure 19* Phosphorescence Spectra of Irradiated Dibenzoylmethane
a* Blue and Green Phosphorescence in 3-methylpentaneb. Blue Phosphorescence in EPAc. Green Phosphorescence in EPA
in 3-methylpentane are shown in Figure 20 and Figure 21, respectively. Both give the blue and the green phosphorescences. The original benzoylacetone in 3-methylpentane has a stronger green phosphorescence with vibrational bands at 510 mu (19610 can”1) and 480 mu (20830 cm”1) and a weaker blue phosphorescence with vibrationalbands at 455 mu (21980 cm”1), 422 mu (23700 cm”1) and 395 uni (25320—1cm” ). After benzoylacetone in the 3-methylpentane glass was expos
ed to the full intensity of the A-H6 for 10 minutes, the intensity of the blue phosphorescence becomes stronger than that of the green phosphorescence. The relative intensity and the positions of the vibrational bands of each phosphorescence do not change upon irradiation. Benzoyltrifluoroacetone behaves in a manner similar to that of benzoylacetone. When the exciting light is turned on it gives a strong green phosphorescence with vibrational bands at 520 mu (19320 cm”1) and 488 mu (20490 cm”1), and a weak blue phosphorescence with vibrational bands at 445 mu (22470 cm”1), 4 2 0 mu (23810 cm”1) and 395 mu (25320 cm”1). The intensity of the blue phosphorescence increases with the time of excitation, while the intensity of the green phosphorescence remains almost constant. In 3-methylpentane irradiated 2-bromo-l,3-diphenyl-l ,3-propanedione gives a green and a blue phosphorescences.
In order to understand the origin of the different phosphorescences in more detail, the phosphorescence excitation spectrum has been studied for each phosphorescence of every compound. The vibraticnal bands in each phosphorescence gave the same excitation
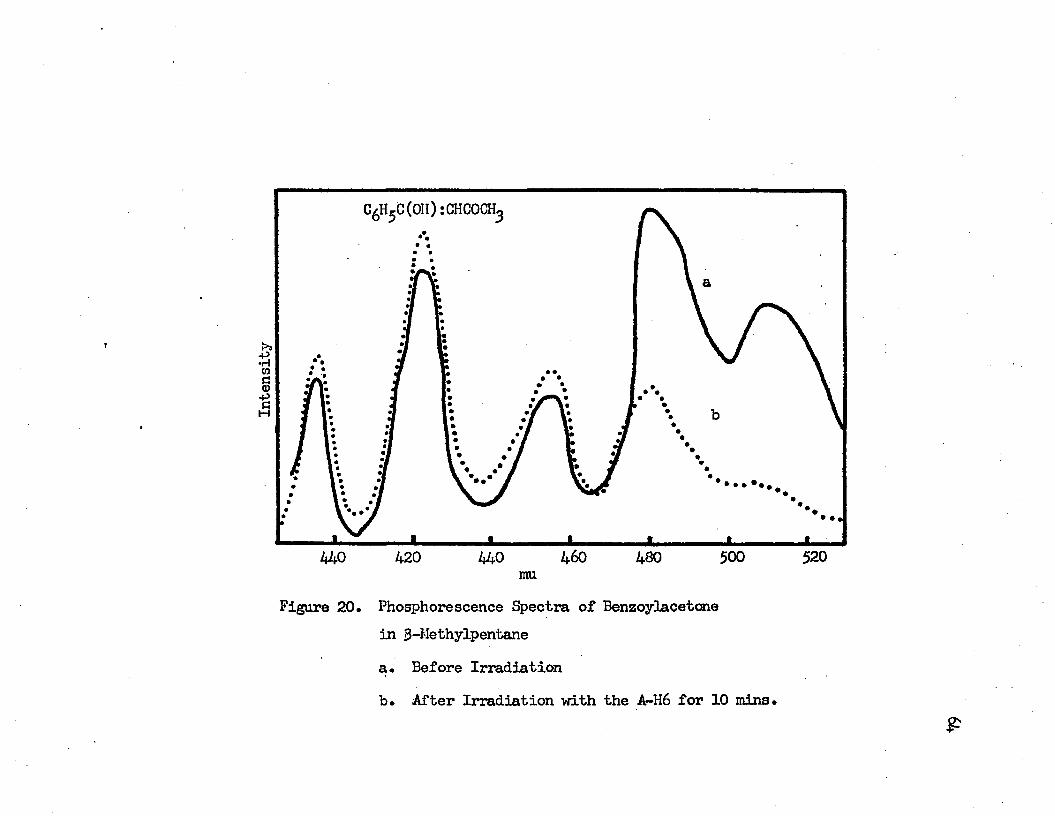
Intensity
C Hi-C(OII) :CHCOCH.
• •• •
460420 520480 500mu
Figure 20. Phosphorescence Spectra of Benzoylacetonein 3-Methylpentanea. Before Irradiationb. After Irradiation with the A-H6 for 10 mins.
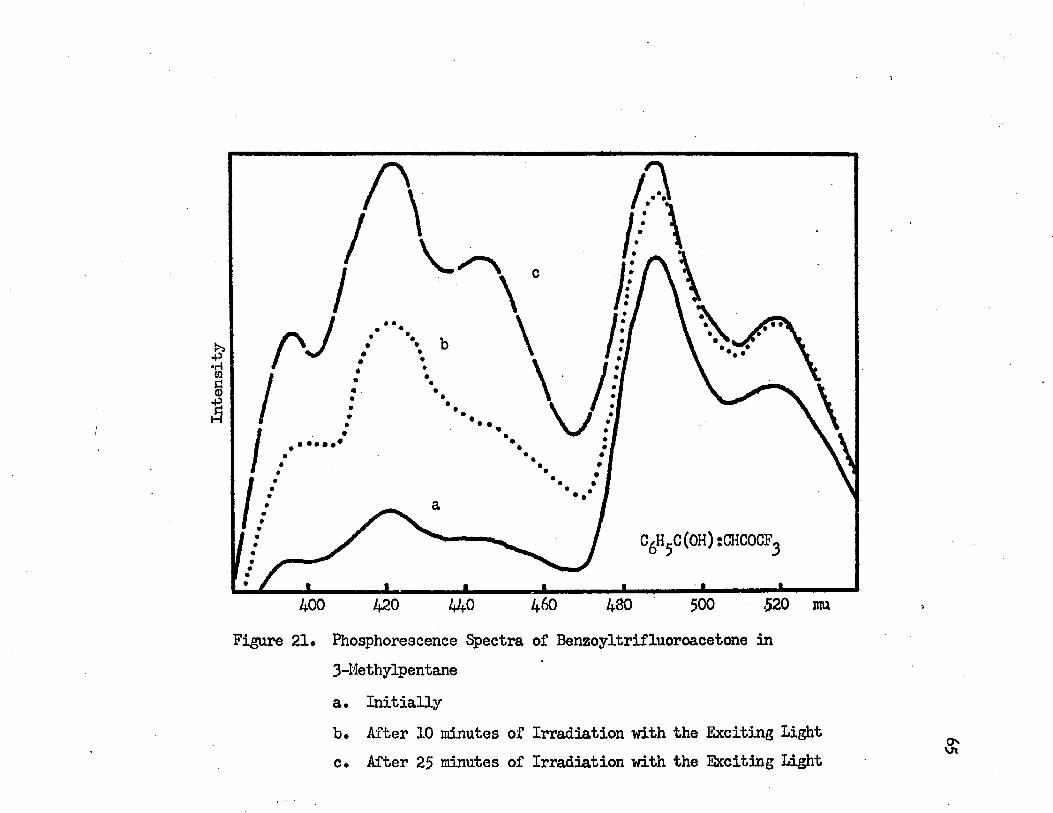
460 <520 mu480 500400 420Figure 21. Phosphorescence Spectra of Benzoyltrifluoroacetone in
3-Methylpentanea. Initiallyb. After 10 minutes of Irradiation with the Exciting Light
vnc. After 25 minutes of Irradiation with the Exciting light
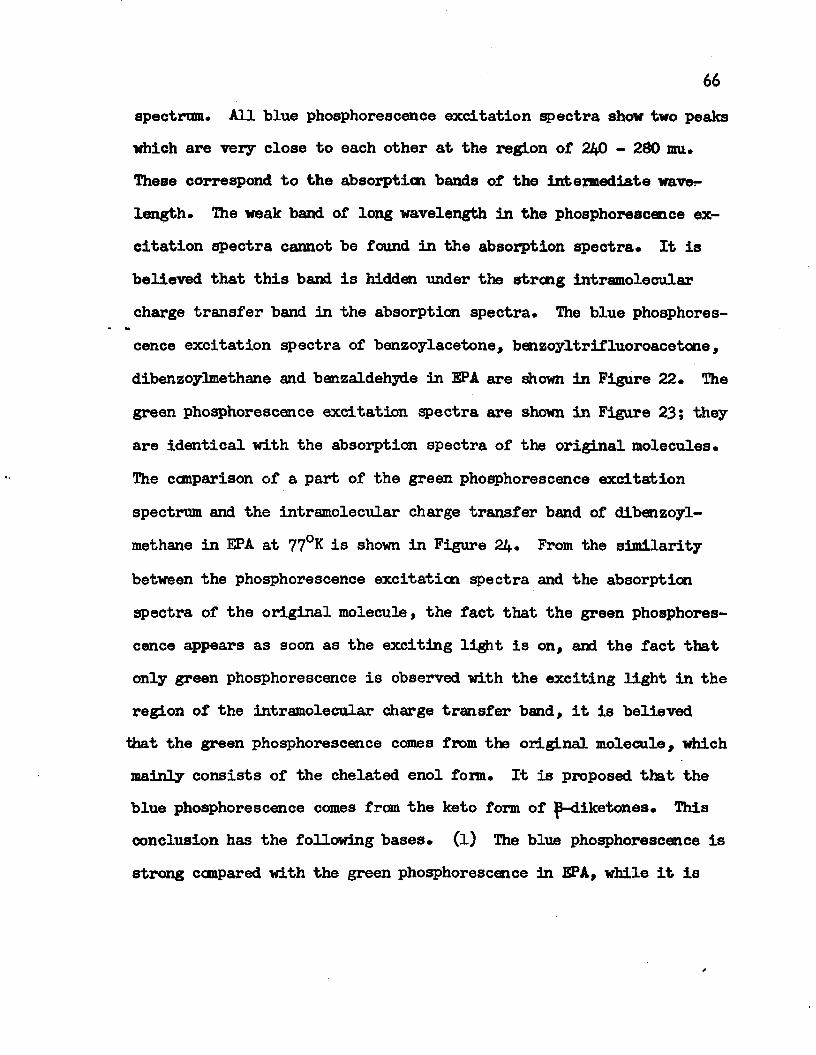
66spectrum* All blue phosphorescence excitation spectra show two peaks which are very close to each other at the region of 240 - 280 mu. These correspond to the absorption bands of the intermediate wavelength. The weak band of long wavelength in the phosphorescence excitation spectra cannot be found in the absorption spectra* It is believed that this band is hidden under the strong intramolecular charge transfer band in the absorption spectra. The blue phosphores-
•»cence excitation spectra of benzoylacetone, benzoyltrifluoroacetone, dibenzoylme thane and benzaldehyde in EPA are shown in Figure 22* The green phosphorescence excitation spectra are shown in Figure 23; they are identical with the absorption spectra of the original molecules* The comparison of a part of the green phosphorescence excitation spectrum and the intramolecular charge transfer band of dibenzoyl- methane in EPA at 77°K is shown in Figure 24* From the similarity between the phosphorescence excitation spectra and the absorption spectra of the original molecule, the fact that the green phosphorescence appears as soon as the exciting ligit is on, and the fact that only green phosphorescence is observed with the exciting light in the region of the intramolecular charge transfer band, it is believedthat the green phosphorescence comes from the original molecule, which mainly consists of the chelated enol form* It is proposed that the blue phosphorescence comes from the keto form of p-diketones. This conclusion has the following bases* (l) The blue phosphorescence is strong compared with the green phosphorescence In EPA, while it is
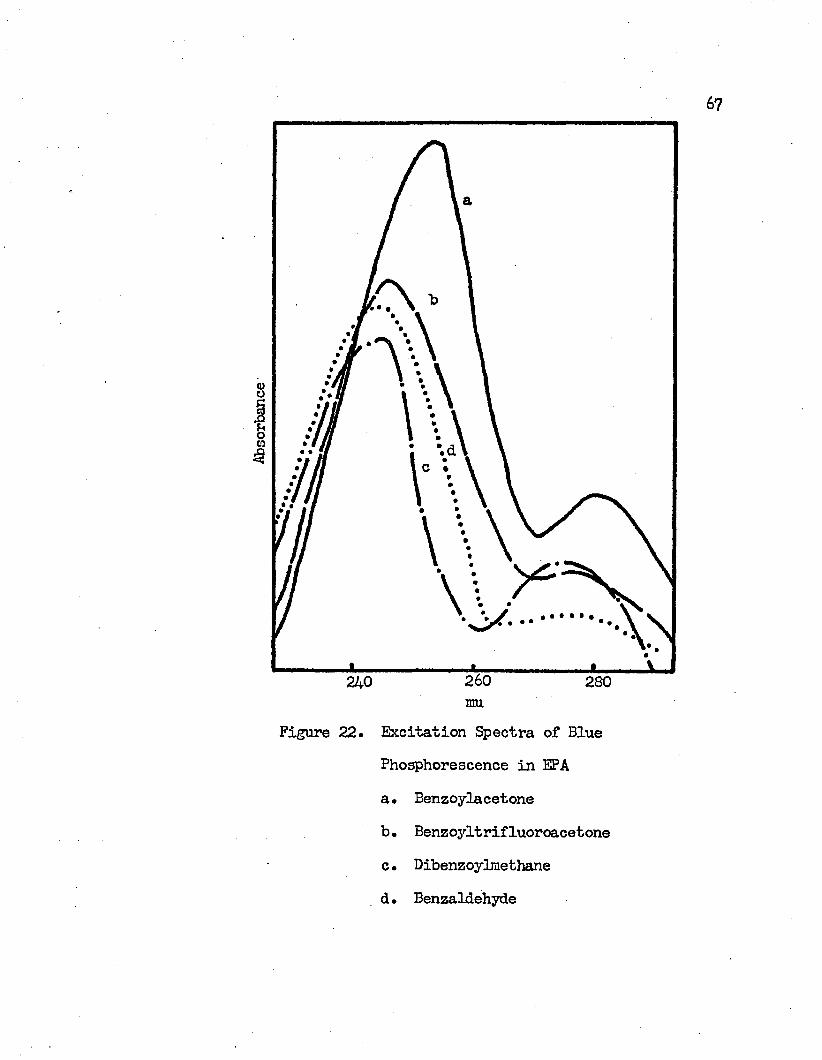
67
a>ouoto
s
260240 280nru
Figure 22. Excitation Spectra of BluePhosphorescence in EPAa. Benzoylacetoneb. Benzoj'-ltrifluoroacetone c • Dibenzoylmethaned• Benzaldehyde
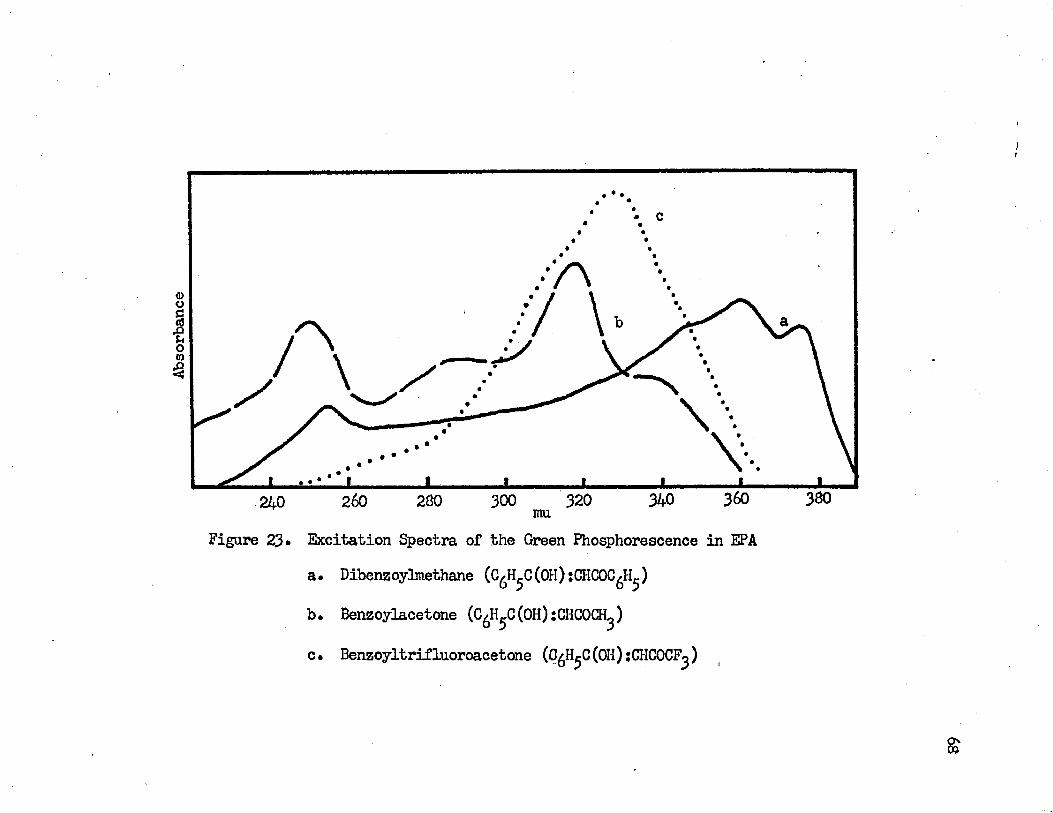
<DOS•so0)3
w ± m m ^ - m «■^ J m240 260 280 300 320 340 360 330mu
Figure 23* Excitation Spectra of the Green Phosphorescence in EPAa. Dibenzoylmethane (C H C(0H):CHC0C H )
b. Benzoylacetone (C H C(OH):CHC0CH )
c. Benzoyltrifluoroacetone (G H C(OH)jCHCOCF )
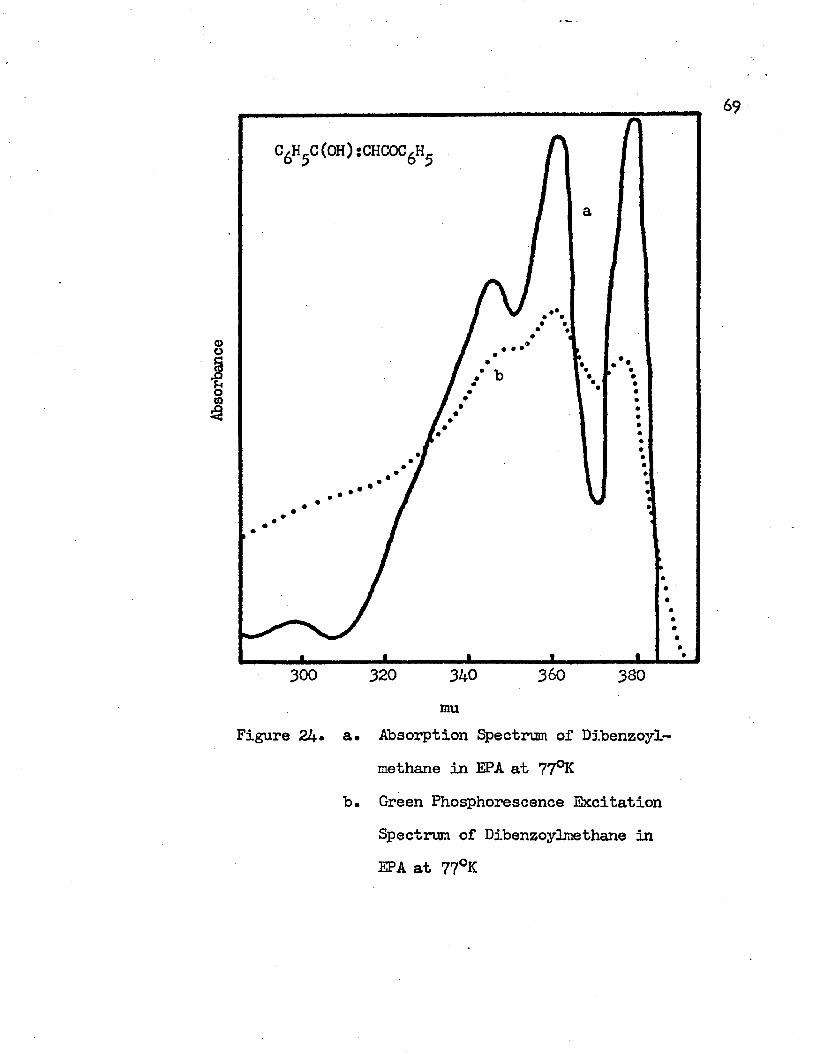
69
C/H_C(OH):CHCOC/H
©o
oCOs
360320 340 3 SO300mu
Figure 24* a. Absorption Spectrum of Dibenzoylmethane in EPA at 77°K
b. Green Phosphorescence Excitation Spectrum of Dibenzoylmethane in EPA at 77°K
very weak in hydrocarbon and its intensity builds up in the latter solvent. The keto-enol tautomeric equilibrium can be considered to be an acid-base equilibrium of two acids - the keto form, a stronger acid, and the chelated enol form, a weaker acid. In hydrocarbon, a non-polar solvent, the equilibrium should displace to the chelated enol form: it is solvated more readily in the non-polar solvent. InEPA, which is a polar solvent, the equilibrium should be displaced toward the keto foxm, which is more readily solvated in the polar solvent. p-Diketones exist mainly in the chelated enol form. There are some keto forms in EPA. Irradiation with the UV light will convert the chelated enol into the less stable keto form. The conversion causes the increase in intensity of the blue phosphorescences of jJ- diketones in the hydrocarbon solvent. The larger shift of the blue phosphorescence than of the green phosphorescence of dibenzoylmethane as solvents vary from hydrocarbon to EPA also supports this mechanism. The chelated enol form, which causes the green phosphorescence, should be less affected by the solvent because of the presence of the intramolecular hydrogen bond in the molecule. The keto form, which gives the blue phosphorescence, should be affected more as the solvent changes from hydrocarbon to a polar solvent, EPA. (2) Consider thehalf life of the blue phosphorescences, their values are in the order
—•2of 10 sec. which is a reasonable magnitude for a (n, it*) phosphorescence. It is thought that all the keto forms of p-diketones have
a lowest (n, 7[*) excited singlet state. This argument can be
supported further by considering the vibrational frequencies of the blue phosphorescence* The C = 0 stretching band in the ground state, which has a value around 1650 cm can be observed in the blue phosphorescences* This indicates that the blue phosphorescence involve an excitation of a non-bonding electron on the carbonyl group. The similarities between the blue phosphorescences of a p-diketones and the phosphorescence of benzaldehyde and between their phosphorescence excitation spectra leads one to believe that the blue phosphorescences are from a slightly perturbed benzaldehyde molecule* This confirms our assignment that the blue phosphorescences come from the keto tautomer of p-diketones. (3) The fact that no blue phosphorescence is observed when the exciting light is in the region of the intramolecular charge transfer band indicates that the blue phosphorescence does not come from the unchelated enol form* The unchelated enol form still has the intramolecular charge transfer band, which is slightly displaced to the short wavelength side in comparison with the intramolecular charge transfer band of the chelated enol. The buildup of the blue phosphorescence also excludes the possibility that the blue phosphorescence ccmes from the unchelated enol. The intramolecular hydrogen bond should be broken as soon as the UV excitation occurs* The conversion of the enol form into the keto form involves a migration of a hydrogen atom, which is a diffusion-controlled pro-
^Bratoz, S., D. Hadzi and G* Rossmy, Trans* Faraday Soc* 2, 464 (1956)*
72
cess* That causes the intensity of the blue phosphorescence in the hydrocarbon solvent to increase gradually* (4 ) The presence of the blue phosphorescence and the absence of the green phosphorescence in 2-bromo-l ,3-diphenyl-l ,3-propanedione support our mechanism* This compound exists mainly in the keto form which gives only the blue phosphorescence. The presence of the green phosphorescence and the blue phosphorescence from the irradiated 2-bromo-l ,3-diphenyl-l, 3- propanedione in 3-methylpentane also verifies the assignments*
Of all the p-diketones studied at 77°K only dibenzoylmethane has a fluor©scene. Dibenzoylmethane has a strong blue fluorescence in either hydrocarbon or EPA* Hie fluorescence spectrum is not affected by the presence of oxygen* The degassed sanple and the sample without degassing gave the same fluorescence* In IPMP the fluorescence spectrum of dibenzoylmethane has four peaks at 445 mu (22470 cm-"*-), 433 mu (23090 cm-"*"), 420 mu (23810 and 400 mu(25000 cm- ) as shown in Figure 25* The observed vibrational frequencies of the ground state of dibenzoylmethane in IPMP are 620 cm-1, 720 cm-1 and 1190 cm-1. The spectra were taken with exciting light at wavelengths of 379 mu, 361 mu, 350 mu, and 250 mu* The positions and relative intensity of the fluorescence maxima do not change by varying the wavelength of the exciting light* This indicates that the fluorescence comes from the lowest excited singlet state of the molecule* The intensity of the fluorescence spectra decreases as the exciting wavelength decreases* This is caused by the
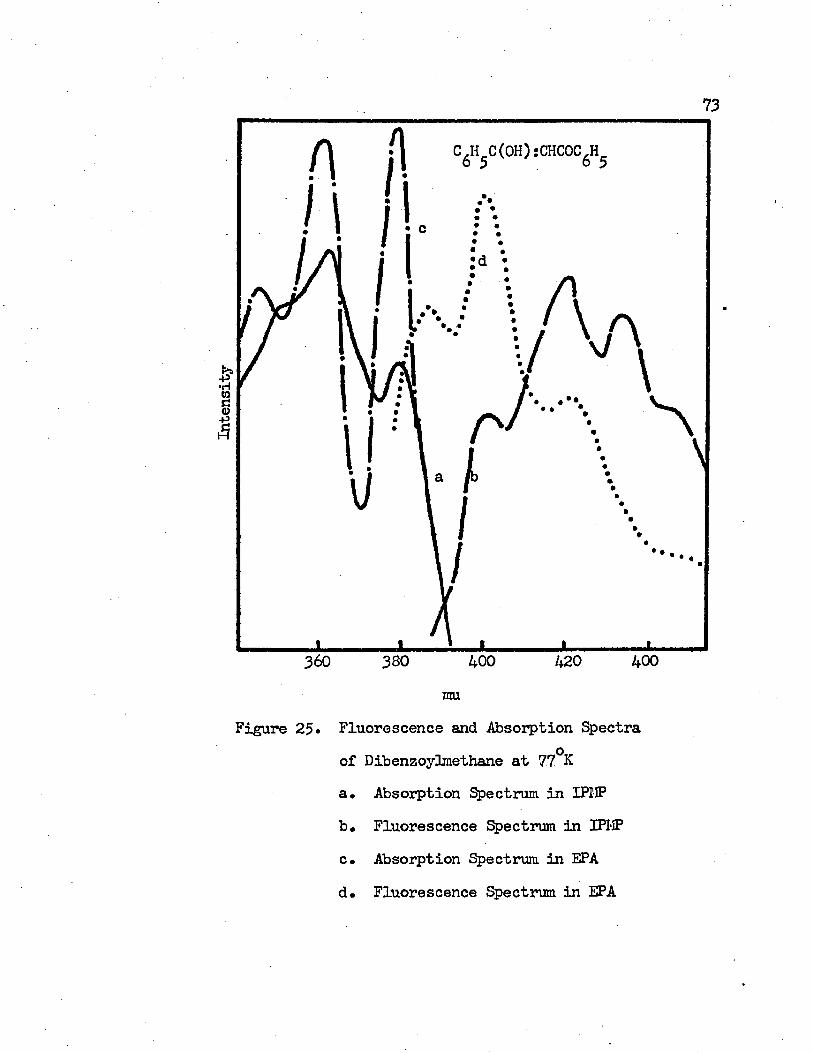
73
C,H C(OH):CHCOC,H
•H
360 380 400 420 400nru
Figure 25* Fluorescence and Absorption Spectraoof Dibenzoylmethane at 77 K
a. Absorption Spectrum in IPMPb. Fluorescence Spectrum in IPMPc. Absorption Spectrum in EPAd. Fluorescence Spectrum in EPA
74fact that the output intensity of the Cary 15 monochromator decreases as the wavelength decreases. No green or blue phosphorescence has been observed in the total emission spectrum* The intensity of the exciting light through the monochromator is too weak to have observed the phosphorescence spectrum in the total emission spectrum* The exciting wavelengths utilized in obtaining the fluorescence spectra of dibenzoylmethane in EPA are 378 mu, 359 mu, 344 mu, and 250 mu. They all gave identical fluorescences with different total intensities but identical relative band intensities* The fluorescence spectrum of dibenzoylmethane in EPA has four peaks at 445 mu (22470 cm~ ), 420 mu (23810 cm-'1"), 400 mu (25000 cm-1) and 386 mu (25910 cm-1). The observed vibrational frequencies are 1340 cm-1, 1190 cm"1 and 910 cm-1. No 1650 cm-1 vibrational frequency, which corresponds to the stretching of the C " 0 group has been observed in the fluorescence spectra. The fluorescence spectra of dibenzoylmethane in XPMP and EPA are shown in Figure 25 with the intramolecular charge transfer band of the molecule in IPMP and EPA at 77°K* The absorption spectrum and its corresponding fluorescence have approximate mirror-image relationship. This indicates that the geometries of the ground state and of the first excited singlet state are similar.' Since the intramolecular hydrogen bond exists in the ground state of dibenzoylmethane it would be expected that it exists in the first excited singlet state also.
Normally an aromatic compound with a lowest excited singlet
75state which is (n, if*) does not fluoresce. A comparison between the absorption spectra of the chelated {3-diketones and their corresponding green phosphorescences leads to the conclusion that the lowest excited singlet state of the chelated {3-diketone s is a (lT,ir*) state rather than an (n,ir*) state. If one considers the 0-0 band of the intramolecular charge transfer band of the chelated dibenzoylmethane in EPA at 77°K, which is at 37® mu (26450 cm”1) and the 0-0 band of the green phosphorescence of dibenzoylmethane in EPA, which is at 490 mu (20410 cm"1), he finds that the singlet-triplet separation is 6040 cm”1. The similar singlet-triplet separations of the chelated benzoylacetone and benzoyltrifluoroacetone in EPA are 7070 cm-1 and 5990 cm”1, respectively. These values are too large for an (n, ir*) singlet-triplet separation. Therefore the lowest exdted singlet state of the chelated enol form of {3-diketones is a (ir, ir*) state. This assignment may be supported by the fact that the green phosphorescence is weaker relative to the blue phosphorescence, which is an (n,ir*) phosphorescence. In the hsto form the electronic structures of benzoylacetone, benzoyltrifluoroacetone and diben- zoylmethane are similar to those of benzaldehyde but they are slightly perturbed by the substituents. There exists a great similarity between both the blue phosphorescences and the excitation spectra of these compounds. On the basis of data for the singlet- triplet separations of a group of aromatic ketones (1765 cm”1 for benzaldehyde, 1820 cm”1 for acetophenone and 2135 cm 1 for
-42benzophenone) , it seems reasonable to assume that the separationof the singlet-triplet levels of the (n, tt *) states of benzoylacetone, benzoyltrifluoroacetone and dibenzoylmethane is approximately 2000 cm”1. The approximate positions of the (n, if*) singlet states can be obtained by adding the singlet-triplet separation to the 0-0 band of the blue phosphorescence of the appropriate molecules* The calculation suggests that the n-y.it* transitions should occur around 360 mu for benzoylacetone, 370 mu for benzoyltrifluoroacetone and 350 mu for dibenzoylmethane; it does occur at 371 mu in the case of benzaldehyde* The firstTT »TT* transitions of these compounds are near 280 mu and are observed in the blue phosphorescence excitation gpectra* Therefore, the lowest excited singlet states of |J-dike- tones in the keto form are (n, i f * ) states* There is no data available with which to estimate the approximate positions of the (n,ir*) states of jJ-diketones in the unchelated enol form* But it can be safely assumed that the n-*7T* transitions of these molecules are at lower energies than the n-yir* transition of benzaldehyde, which is at 371 mu* This assignment is based on the fact that in benzoylacetone, benzoyltrifluoroacetone and dibenzoylmethane the G - 0 group is connected to both a phenyl ring and a vinyl group, while in benzaldehyde the C = 0 group is connected to a phenyl ring only* The 0-0 band of the intramolecular
^Kanda, ?*, H* Kaseda and T. Matumura, Spectrochimica Acta 2fi, 1387 (1964).
77'
charge transfer band of {3-diketcnes In the unchelated enol form Is at wavelengths smaller than 375 It is reasonable to assume that the lowest excited singlet state of -diketcnes in the unchelated enol fora is an (n, if*) state. In the chelated enol fora of {3-diketones the situation is different. By formation of the intramolecular hydrogen bond in the chelated enol fora, the non-bonding character of the electron on the oxygen atom is lost almost completely or to some extent and the level of (n, if*) singlet state is raised remarkably. The formation of the intramolecular hydrogen bond lowers the the level of the first (t , it*) singlet state also. This is indicated in the red-shift of the intramolecular charge transfer band upon the formation of the intramolecular hydrogen bond. For this reason the first excited singlet state of {3-diketcnes in the chelated enol form is a Or, IT*) state.
The lack of observable fluorescence in benzoylacetone and benzoyltrifluoroacetone can be explained that in these two molecules the radiationless transitions compete more effectively and no fluorescence can be observed. A possible interpretation, which has been applied byEL-Sayed to nitrogen heterocyclics^, is given. In benzoylacetone and benzoyltrifluoroacetone the energy level of the (n, Tf*) singlet state is higher than that of the first (lT, IT*) singlet state, and the energy level of the (n, T[*) triplet state is
^EL-Sayed, M. A., J. Chem. Phys. 28, 2834 (1963).
higher than that of the first (if, it*) triplet state. It is probable that the (if, it*) singlet state is higher than the (n, Tf*) triplet state. If this is the case the efficient intersystem crossing between the first (iT, tv*) singlet state and the (n, if*) triplet state occurs and no fluorescence can be observed. In dibenzoylmethane, the energy level of the (n,if*) singlet state is higher than that of the first (lT, it*) singlet state, and the (n, it*) triplet state is higher than the first (tt» TT*) triplet state. It is possible that the first (it, U*) singlet excited state has a lower energy value than the (n,ir*) triplet level. This would lead to a retardation of the intersystem crossing process and allow the fluorescence to be observed,
A possible mechanism of the photochemical process of -dike- tanes in the rigid glass is proposed and summarized in Figure 26.In this figure the energy levels with solid line are obtained from the experiments, the energy levels with the dotted line are hypothetical and have not been obtained from experiment. The absorption and radiative transitions between energy levels are expressed with solid lines and the radiationless transitions are represented by the broken lines,
fMDiketones can exist as the chelated enol fora, the keto form, and the unchelated enol form. The chelated enol fora is the most stable one, the unchelated enol is the least stable one and the keto form has an intermediate stability. This assignment will be
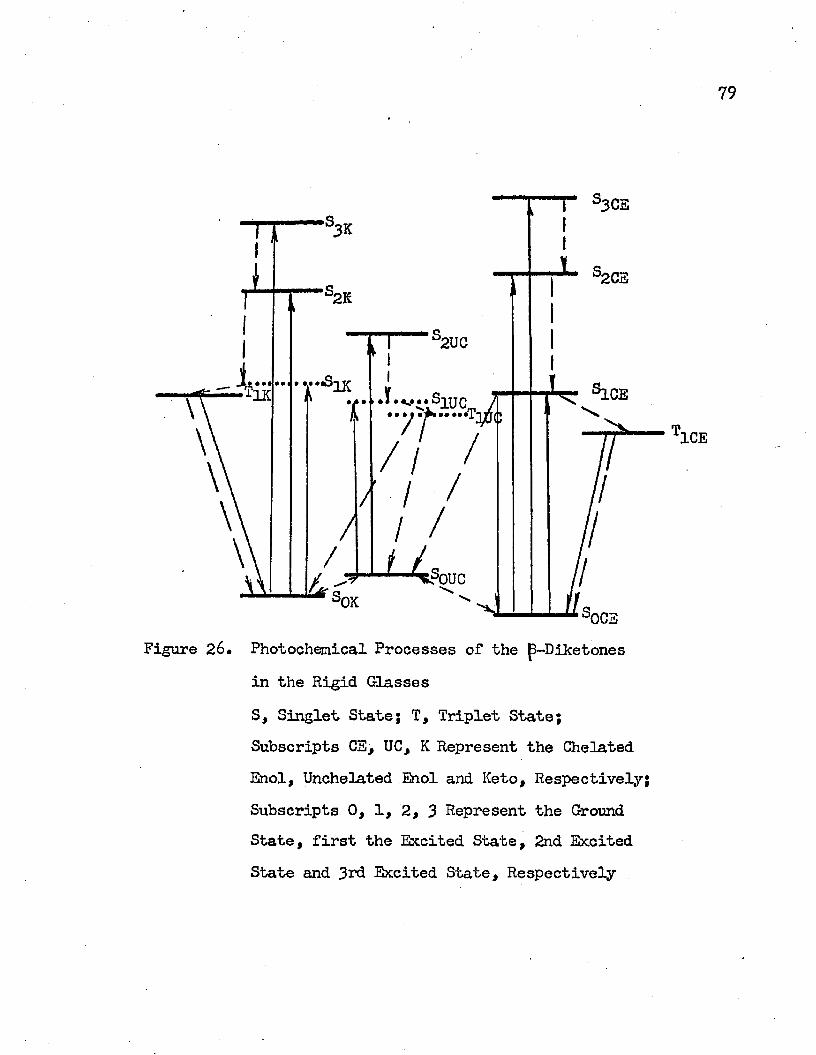
Figure 2 6. Photochemical Processes of the p-Diketones in the Rigid Glasses S, Singlet State; T, Triplet State; Subscripts CE, UC, K Represent the Chelated Enol, Unchelated Enol and Keto, Respectively Subscripts 0, 1, 2, 3 Represent the Ground State, first the Excited State, 2nd Excited State and 3rd Excited State, Respectively
80
justified by the nuclear magnetic resonance study in Chapter 2. In hydrocarbon solvent p-diketones exist almost exclusively in the chelated enol form. This form is stabilized by the formation of an intramolecular hydrogen band. The lower the temperature is, the stronger is the intramolecular hydrogen bond. Ihis causes the red- shift of the intramolecular charge transfer band as the temperature decreases from the roan temperature to the liquid nitrogen temperature. Upon irradiation, the chelated enol foxm will be excited from the ground state, S0CE to the first excited singlet state, S- g, the second excited singlet state, SgQg, etc. The higher excited singlet states lose their energy through radiationless transitions to the first excited Singlet state. The degradation of S-^ can be through the fluorescence to the ground state or through the intersystem crossing to the excited triplet state of the chelated enol, T-j g, from which the green phosphorescence is emitted. The T1CE state can be degraded through the radiationless transition also. S1CE can lose energy by transferring it to the ground state of the unchelated enol, SqUC. It is believed that the lowest excited singlet state of the unchelated enol to be an (n, T■5,) state, which is not observable in these experiments. The only observable transition in the unchelated enol is the Sqjjq— which corresponds to the intramolecular charge transfer band in the chelated enol form. The separation of these two states is larger than the separation of SqqE and S Qg. This means that the intramolecular hydrogen bond stabilize the first excited singlet state more than the ground state of
aip-diketones. Internal conversion between SgyQ and S^ q takes place very fast. Since is an (n,ir*) state, intersystam crossing to T1UC is very probable. T1UC is the intemediate state from which the energy transfer between the enol form and the keto form takes place. Non-radiative transition from to S^q is also possible. Because of these two competitive processes no phosphorescence from T-jjjq has been observed. Sq , which is the ground state of the keto form, can be excited into different excited states. The transition between the ground state of the keto foxm, Sq , and its first excited singlet state, S- , which is an (n, Tf*) state, has not been observed. The SqK~* 2K 0K~*’“’3K transitions can be obtained from the blue phosphorescence excitation spectra. Internal conversions between Spy+S-jK, and take place. Intersystemcrossing between S1K and T1K occurs relatively easily. Blue phosphorescence is observed from the T1K state. The process of UC^OK is the diffusion controlled process which involves the migration of a hydrogen atom. In EPA glass there are some molecules in the keto form. It is not necessary to have xUC OK on*er to obtain the blue phosphorescence. That is the reason that p-diketones in EPA emit the blue phosphorescences as soon as the molecule receives the initial excitation. The separation of the energy levels are given In Table 4* In Table 4 £>0CE";S1CE,S are obtained frcm the 0-0 bands of the intramolecular charge transfer band of p-diketones In IPMP (H.C.) and EPA at 77°K, soCE“'*2CE and S0CE S3CE 8X6 obtained from
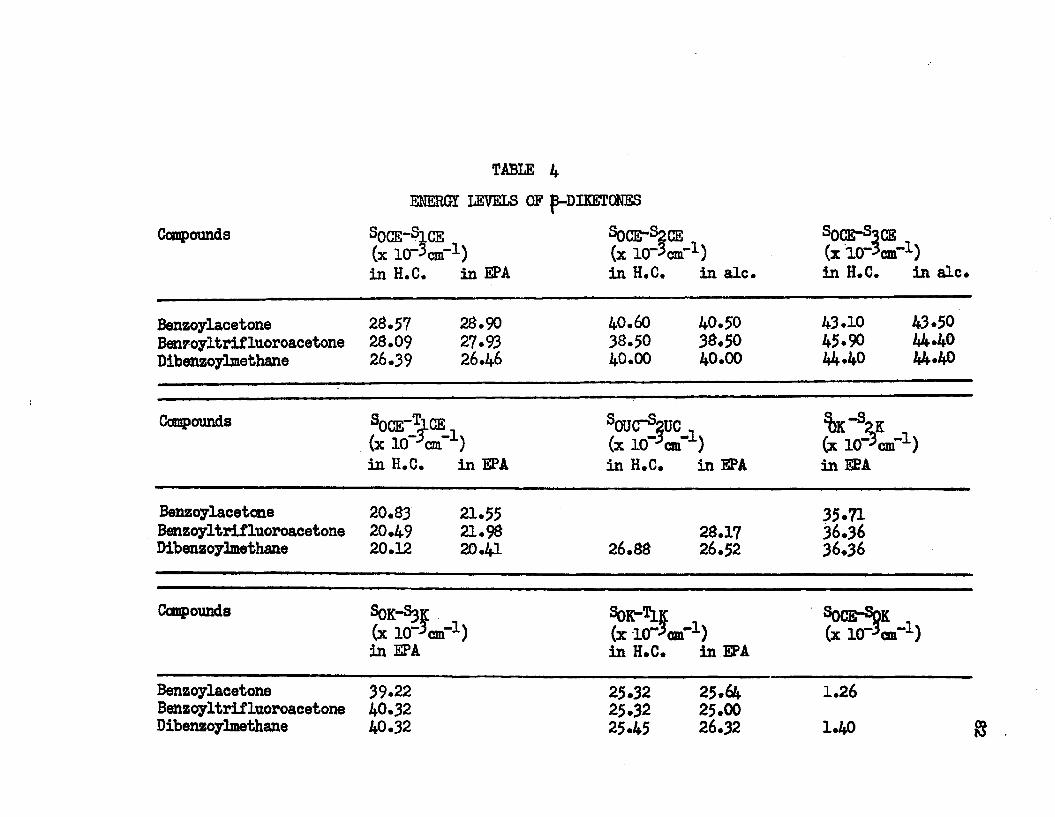
TABLE 4
CompoundsENERGY LEVELS OF p-DIKETONES
S0CE“S1CE SqCE“s2CE „(x lO^cm"1) (x 10“ cm) in H.C. in EPA in H.C. in ale.
S0CE~S3CE ,(x 10" cm-1) in H.C. in ale.
BenzoylacetoneBenzoyltrifluoroacetoneDibenzoylmethane
28.57 28.90 28.09 27.93 26.39 26.46
40.60 40.50 38.50 38.5040 .00 4 0 .00
43.10 43.50 45.90 44*40 44*40 44 .40
Compounds S0CE"T~LCE (x 10~ cm” ) in H.C. in EPA
^ucr^auc(x 10 cm" ) in H.C. in EPA
'bic'V(x 10" c m) in EPA
BenzoylacetoneBenzoyltrifluoroacetoneDibenzoylmethane
20.83 21.55 20.49 21.98 20.12 20.41
28.17 26.88 26.52
35.7136.3636.36
Compounds SOK-^K (x 10“ cm"1) in EPA
Sok-Tlk(x 10" cm") in H.C. in EPA
Sqce-Sok
Benzoylacetone 39.22 25.32 25.64 1.26Benzoyltrifluoroacetone 40.32 25 .32 25.00Dibenzoylmethane 40.32 25.45 26.32 1.40 g
the absorption spectra at room temperature in cyclohexane (H.C.) and isopropyl alcohol (ale.). 0CE“ 1CE S he band the greenphosphorescence and K is the 0-0 band of the blue phosphorescence. quc~ 2UC obtained from the 0-0 band of the intramolecular charge transfer band of the irradiated molecules, which has been irradiated with the A-H6 for 60 minutes at 77°K» 0IT 2K an(* OK” 3K are obtained, from the blue phosphorescence excitation spectra. S0CETS0Kfs are A °*s °* the keto-enol tautomeric reaction, which are obtained from the nuclear magnetic resonance experiments.
IV. SUMMARY
By means of electronic spectroscopic studies photochemical reactions of p-diketones at 77°K have been observed* These photochemical reactions are believed to be the results of keto-enol tautomeric equilibria which have unchelated enols as intermediates • p~ Diketones exist mainly in the chelated enol form in the hydrocarbon solvent especially at 77°K. The less stable forms, the keto form and the unchelated enol form, can be generated by irradiation of the chelated enol form. Some keto form exists in EPA* All. chelated enols give green phosphorescences* Fluorescence is observed in the chelated enols only in the case of dibenzoylmethane. This has been interpreted to indicate that in the chelated enol of dibenzoylmethane the energy level of T2 (n, TT*) state is higher than the Si(lf, ip*) state* No phosphorescences or fluorescences are observed from the unchelated enols which have (n,IT*) lowest singlet states* The absence of the phosphorescence is explained by energy transfer frcm the T-njC state to the ground state of the keto form and a non-radia- tive transition from its T1UC state to its Sq^q state which occurs more readily than does the radiative transition* Die keto form gives a strong blue phosphorescence and no fluorescence* A detailed mechanism of the photochemical processes, which can interpret the observed phenomena qualitatively, has been proposed* Further justification of this mechanism has to be done*
Some experiments which may help to Justify the mechanism are suggested. A detailed kinetic study to determine the absolute or the relative reaction rate constants of each process is necessary* It is a quite complicated problem* It can be approached through the quantum yield studies of the green phosphorescence, the blue phosphorescence and the fluorescence* These experiments should be carried out in the different concentrations with respect to the chelated enol form* The rate of decrease of the enol form, which is directly proportional to the rate of the decrease in the intensity of the intramolecular charge transfer band of the enol form, should be measured. Electronic spin resonance studies of the irradiated p-diketones in the rigid glass should be carried out to identify the metastable excited triplet states of each species* The assumption that no free radicals occur as intermediates can be verified by the E*S*R* studies* Flash photolysis experiments should be carried out* The observable triplet-triplet transition of the chelated enol form can further verify that the lowest excited triplet state of the chelated enol is a (it, T*) state* This triplet-triplet absorption study can determine the concentration of the triplet as a function of time* Phosphorescence polarization measurements should be carried out on the blue and the green phosphorescence* If the assignments are correct the blue phosphorescence, which comes from the (n, if*) triplet state, should be polarized in the molecular plane and the green phosphorescence, which comes from the (ir> TT*) triplet state, should be polarized
perpendicular to the molecular plane*The main problem left to be solved is to locate the (n,ir*)
state of each species* This can not be done experimentally* Because the weak n-»ir* transition is hidden under the strong ir-»ir* transitions and it is not observable* k semiempirical method of resonance can be applied to calculate the n -»ir* transitions and the transition of the longest wavelength band of p-diketones*
Glynn, S. P., Seminar on Computational Methods, Department of Chemistry, Louisiana State University, Baton Rouge, Louisiana (1966)*
87
CHAPTER 2
NUCLEAR MAGNETIC RESONANCE STUDIES OF THE ENOL-KETO TADTCMERISM IN p-DIKETCNES
I. Introduction
Nuclear magnetic resonance studies of p-diketones have been carried out by several authors* Reeves-*- has studied the keto-enol tautomerism of pure liquid acetylacetone, and he has assigned all the chemical shifts in the spectrum* From the equilibrium constants of the keto—enol tautomerism at different temperatures he has estimated the enthalpy change of the keto-enol conversion* Hay and Williams^ have studied the hydroxyl proton shifts of acetylacetone, dibenzoylmethane and benzoylacetone at room temperature and have determined the enol composition of each compound* These compounds have been studied by Burdett and Rogers at roam temperature and various other temperatures* They have calculated the thermodynamic quantities for the keto-enol tautomerism of acetylacetone and its derivatives S*
•‘■Reeves, L. W., Can. J. Chem. 2£ 1351 (1957).2Hay, R* W. and P* P* Williams, J* Chem* Soc* (1964) 2270*
/ . ^Burdett, J* L. and M* T. Rogers, J. Am* Chem* Soc* 86 2105(1964)*^Burdett, J* L* and M* T. Rogers, J* Phys* Chem* 2Q 939(1966).
88
The proton with a spin of i has a magnetic moment of magnitude
? = g/JN j m r r y = ^ g^ ^The quantity /ljj is the nuclear magneton and g is the g -
factor of the proton. When the proton is placed in a magnetic field H0, the energy of the proton in the field, is given by the equation
W s p. • Hc = ja H0 cos 9 (2)in which 9 is the angle between p and H0. W can assume two values;i.e. there are two orientations of proton spin with respect to the applied field. Each nuclear moment has two components, one of magnitude + gpjj/2 parallel to the field, and the other of magnitude
PerPendi-cular the The ± sign in front of theparallel components denotes the two possible nuclear magnetic energy levels, one in which the component is parallel and the other in which it is antiparallel to the field, the latter having the higher energy. The actual moment, of a magnitude given by equation (l), is inclined
-Aat an angle to HQ and processes around the field vector. As a result of this magnetic quantization, when a molecule containing a hydrogen atom is placed in a magnetic field, apart from rotational and vibrational transitions which occur in the ground electronic state, there is also the possibility of magnetic transitions between the two nuclear magnetic energy levels defined by their antiparallel compon
ents t gpft/2 and - gpjj/2 . The Bohr frequency condition states that this difference in energy between the two levels is equivalent to
89
frequency S) given byhi) = gp$l0 (j)
^ aThe precession of p. around HQ will itself give rise to a magnetic field, which may be resolved into two components, a staticcomponent Hz along H0 and a rotating component perpendicular to H0.The processional movement of the nuclear magnetic about the applied field is familiar from Larmor's classical theorem; any magnet of moment p. in a field H0 will process around the direction of the field with an angular velocity given by
hft> = airgpjjHo (4)The frequency of the rotating field produced by this processing magnet at right angles to H0 is If there is superimposed on this
-X -Isystem perpendicular to H0 an oscillatory magnetic field, H , of the same periodicity, the processing nucleus and the oscillatory field can exchange energy and the nuclear magnet can be made to 'flop* between the parallel and the antiparallel states* This system of a
-Xstatic field HQ and an oscillatory field %, applied perpendicular to Hq, produces the essential conditions for the nuclear magnetic resonance experiment.
From what has been said so far, it might be supposed that at any particular radio frequency t) , all proton nuclei would resonante at the same value of H0* Actually, resonance occurs at different values of HQ for each type of proton* The effective magnetic field which is measured in the resonance experiment is
9©
H = H0 (1 - O' )
in which <r, which is usually referred to as the screening constant, is a dimensionless constant independent of HQ but dependent on the chemical (electronic) environment. The screening field ( -<rHQ) is the secondary magnetic field due to the electronic currents induced by the primary field HQ. If we measure the proton magnetic resonance spectra of the hydrogen atom in various chemical enviornments, either in different molecules or in different chemical positions in the same molecule, there will be a corresponding set of different values of the screening constants. As a result, resonance will occur in a different part of the spectrum for each chemically distinct position. This displacement of a signal for different chemical enviroments due to variations in screening constants is referred to as a chemical shift.
Factors which contribute to the proton magnetic screening constant can be attributed both to chemical terms, which originated from the different chemical environments, and to physical terms re-
5suiting from the influence of the surrounding medium. The chemical contribution has been divided for singlet state molecules into sub- teras such as
<TC = fa + ffp + <T + TeThe Lamb diamagnetic contribution,^, results from the uniform
, ^Grant, D. M., Annual Review of Physical Chemistry, 15, 489 (1964).
circulation of atomic electrons in a magnetic field* To correct for the effect of molecular environment upon this free flow of electrons, a localized paramagnetic term,^, is introduced* This paramagnetic perturbation of an atom results from an admixture by the applied magnetic field of electronic states into the ground state wave function* The third teim<ra represents the magnetic screening due to anistopropic groups which may be present in a molecule* Typical of such groups are aromatic ring systems and magnetically anisotropic chemical bonds in which the difference between the perpendicular and parallel magnetic susceptibilities are significant* The reaction field effect,o , results from intramolecular electrical dipole-dipole interaction or contributions from interatomic current*
Chemical shifts due to the influence of the surrounding medium are related to the physical interactions by
<r*= 'Tb',+ ®wf ■+ + 0"nfaThe bulk diamagnetic susceptibility influence is denoted by (Tbt« Dispersion forces of the van der Waals type create magnetic field shifts represented byf *, and the intramolecular reaction field term is given by <rEf* Magnetic anisotropic shifts have been observed between neighboring molecules and those terms are represented by 0"n,a*
It is well documented that hydrogen bond foxmation causes the proton magnetic resonance signal of the involved proton to shift to lower fields* The principal contributions to this shift were suggested seme time ago and are easily summarized* (l) A contribution to
92
the proton screening (always negative) due to the distortion of the electronic structure of the chemical bond in which the proton is involved* (2) A contribution (negative or positive) to the proton screening due to any magnetic anisotropy of the molecule to which the proton is hydrogen-bonded.
For a given kind of nucleus, the area under the resonance curve is expected to be closely proportional to the number of nuclei per unit volume, or the concentration of the nuclei involved* Actually, the area under the absorption signal is^
A r Xo Hi( 1 ♦ y2^ 2^ ) 2
in which H-j_ is the oscillatory field, y is magnetogyric ratio:, T- and T£ are the spin-lattice relaxation time and the spin-spin relaxation time, respectively, and XQ is the magnetic susceptibility which
is directly proportional to the number of nuclei per unit volume*The present study has involved two aliphatic ^-diketones,
acetylacetone and hexafluoroacetylacetone, and two aromatic {3-dike- tones, benzoylacetane and dibenzoylmethane* The keto-enol tautomeric equilibrium which is considered in this study is:
^Pope, J* A*, W. 6* Schneider and H* J* Bernstein **High- Resolution Nuclear Magnetic Resonance1* McGraw-Hill Book Co*, Inc., New York (1959)*
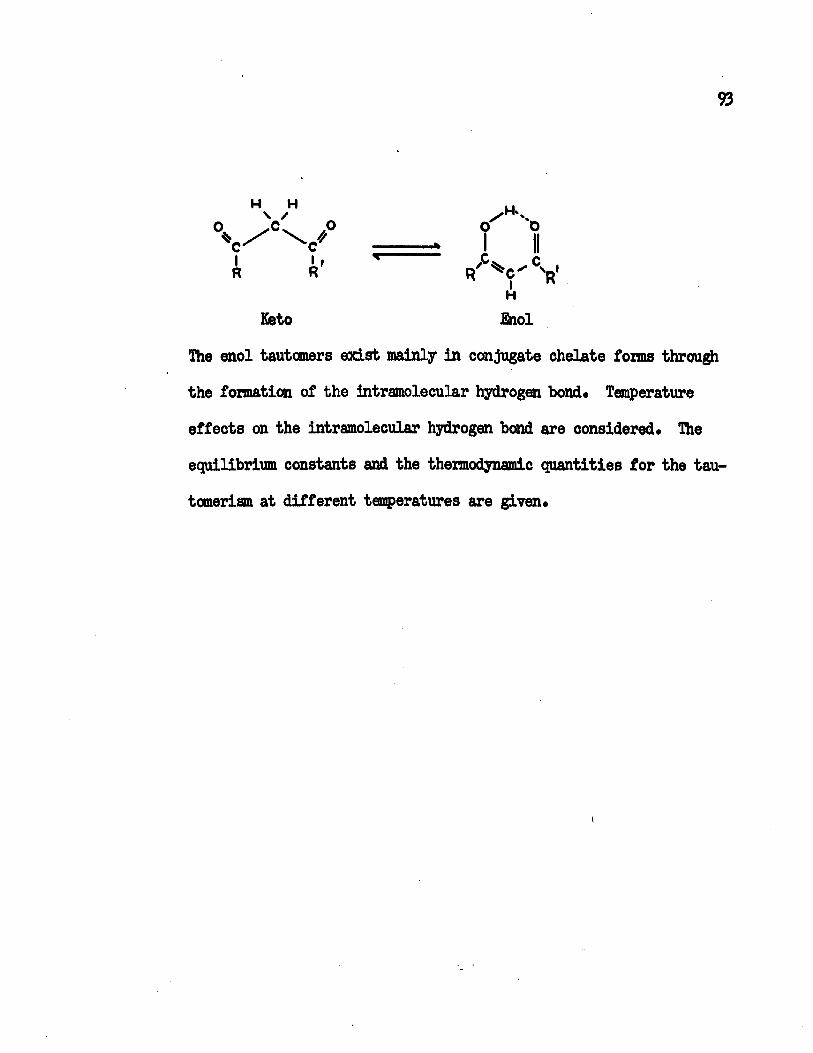
93
H HO. ,oc cR
Keto EtaolThe enol tautcmers exist mainly in conjugate chelate forms through the formation of the intramolecular hydrogen bond* Temperature effects on the intramolecular hydrogen bond are considered* The equilibrium constants and the thermodynamic quantities for the tau- tomerism at different temperatures are given*
%I I . KXFKKTMEHTAT.
The sources of acetylacetone, hexafluoroacetylacetone, ben - zoylacetone and dibenzoylmethane and their procedures of purification were given in the experimental part of Chapter 1*
Proton magnetic resonance spectra were obtained with a Varian HA-60 spectrometer, V-4340 variable temperature probe accessory and V-4331-THR spinning sample dewar probe insert. Samples were sealed in a 5 mm* 0,D. cylindrical glass tube, Tetramethylsilane was used as an internal reference. Before they were sealed, the sample and the internal reference were degassed by subjecting them to repeated cycles of freezing, pumping and thawing. In order to ensure thermal equilibrium, spectra were taken at least 30 minutes after the sample system reached the desired temperature. The temperature range studied was above the melting point of the compound and below the maximum temperature limit of the instrument. All compounds were studied in pure liquid states.
The concentrations of keto and enol tautcmers were obtained by integrating the intensity of CHg and CH peaks in the keto and enol forms respectively. At least three integrations were performed, and the percentages of enol tautomer were accurate to within - 2%, The radiofrequency power was kept well below saturation and above the threshold at which signal intensity becomes proportional to the proton concentration.
In order to rule out the possibility of thermal decomposition
of the sample, UV absorption spectra of each sample were taken before and after heating the sample. No changes in the spectra were observed.
96
m . RESULTS AMD DISCUSSION
Proton magnetic chemical shifts of acetylacetone, hexafluoroacetylacetone, benzoylacetone and dibenzoylmethane are given in Table 1 in c.p.s. units with respect to the internal reference tetramethyl- silane at 60 MC. Of all the protons in these compounds the. GH protons in acetylacetone and benzoylacetone resonate at the highest magnetic fields* Their signals appear around 120 c.p.s. for CHj in the enol tautomer and 130 c.p.s* for CH in the keto tautomer* Their assignments are based upon the relative magnitude of the intensity of the peaks and the temperature effects on the intensity of the peak. Since both acetylacetone and benzoylacetone are more stable in the enol tautomer, the intensity of the CH3 peak in enol tautomer should be larger than the intensity of the GH peak in keto tautomer.The 120 c*p*s* peak is larger than the peak of 130 c.p*s. The peak around 130 c.p.s. increases with increase in temperature, while the 120 c.p.s* decreases as temperature increases* On increasing the temperature the tautomerism shifts to the keto side and increases the keto content* In the case of either the keto form or enol fora the resonance position of GH proton does not shift too much in going from acetylacetone to benzoylacetone* The methyl group in acetylacetone and the phenyl group in benzoylacetone are too remote from the acetyl methyl proton to cause a substantial difference in the position of the CH resonance* The CH shifts are essentially independent of temperature*
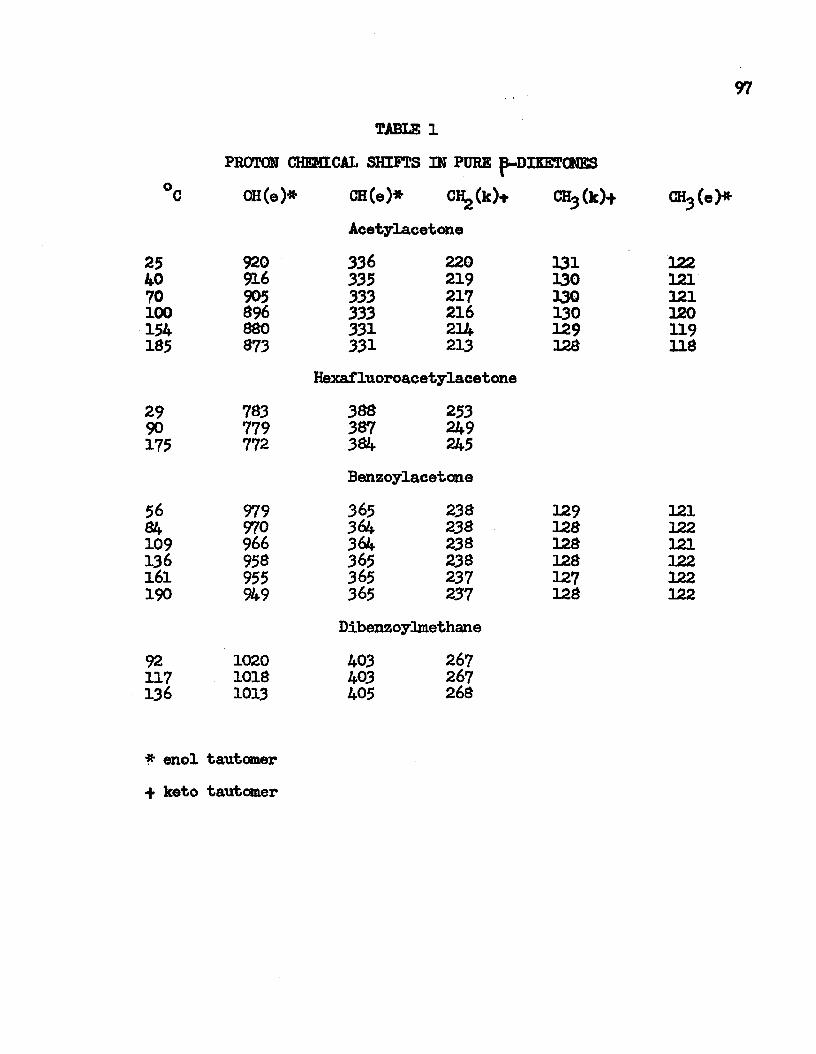
97
TABLE 1PROTON CHEMICAL SHIFTS IN PURE
254070100154185
2990175
5684109136161190
92117136
OH(e)*
920916905896880873
783779772
979970966958955949
102010181013
CH(e)* CR^k)* Acetylacetone336335333333331331
220219217216214213
Hexafluoroacetylacetone388387384
253249245
Benzoylacetone365364364365 365 365
238238238238237237
Dibenzoylmethane
CH3(k)+ CH3(e)*
131130130130129128
129128128128127128
403403405
267267268
122121121120119118
121122121122122122
* enol tautomer + keto tautomer
The ^-proton of GH in the keto tautomer of acetylacetone, benzoylacetone, hexaf luoroacetylacetone and dibenzoylmethane reeo- nates in the regions of 215 c.p.s., 23d c.p.s., 250 c.p.s. and 267 c.p.s., respectively. The corresponding 4-protan signals in the enol tautomer occur near 333 c.p.s., 365 c.p.s., 307 c.p.s. and 403 c.p.s., respectively. The deshielding effect on the -proton increases in the order of acetylacetone, benzoylacetone, hexaf luoroacetylacetone and dibenzoylmethane. The phenyl ring in benzoylacetone deshields the U -proton, which is two atoms away from the substitutent and shifts the resonance signal of -proton to a lower field than that of the corresponding signal, in acetylacetone. The fluoro groups, which have a high electronegativity, withdraw electrons from the rest of the molecule and consequently decrease the electron density of the neighborhood of o(-proton. This inductive effect is greater than the phenyl ring current effect; consequently the tk -proton signal of hexafluoroacetylacetone appears at a lower field than does that of the <k -proton of benzoylacetone. There are two phenyl rings in dibenzoylmethane. The phenyl ring current effects will augment one other and have the greatest deshielding effect on o(-proton. Enolic dl-proton peaks appear at lower magnetic fields than do the peaks of the -protons in the keto form. This is understandable when the types of bond between carbon and proton in the enol tautomer and in the keto tautomer are compared. In the enol tautomer the -proton is bound to the carbon via
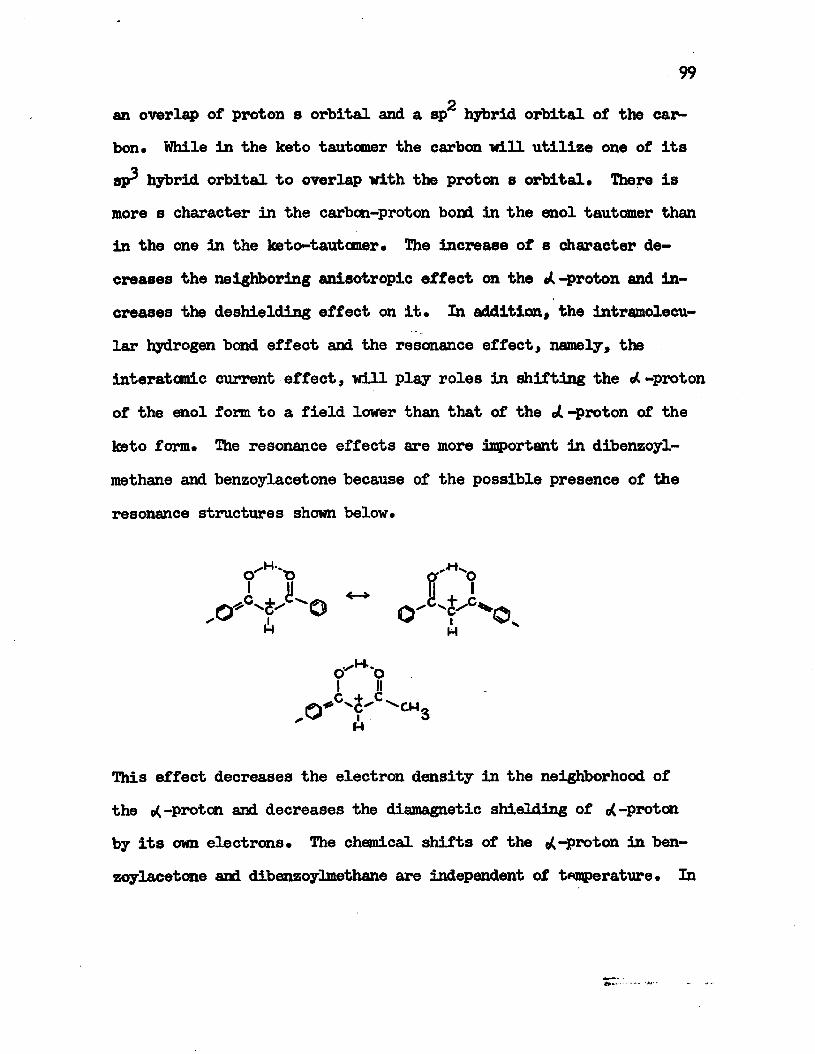
99oan overlap of proton 8 orbital and a sp hybrid orbital of the car
bon. While In the keto tautomer the carbon will utilize one of its sp hybrid orbital to overlap with the proton s orbital. There is more s character in the carbon-proton bond in the enol tautomer than in the one in the keto-taut cmer• The increase of s character decreases the neighboring anisotropic effect on the «(.-proton and increases the deshielding effect on it. In addition, the intramolecular hydrogen bond effect and the resonance effect, namely*, the interatomic current effect, will play roles in shifting the -proton of the enol form to a field lower than that of the JL -proton of the keto form. The resonance effects are more important in dibenzoylmethane and benzoylacetone because of the possible presence of the resonance structures shown below.
o ^Hvtd o''""©I J $ 1
H H
O
w
This effect decreases the electron density in the neighborhood of the -proton and decreases the diamagnetic shielding of o( -proton by its own electrons. The chemical shifts of the -proton in benzoylacetone and dibenzoylmethane are independent of temperature. In
acetylacetone and hexafluoroacetylaCetone they shift to higher magnetic fields with increase in temperature. The shift which is caused by increasing temperature is more pronounced in the keto taut cmer. When the temperature increases from 25°C to 1&5°C the -proton peak shifts from 220 c.p.s. to 213 c.p«s. in the case of
the keto tautomer of acetylacetone and from 336 c.p.s. to 331 c.p.s. in the case of the enol tautomer. The shift is 7 c.p.s. in the keto tautomer and 5 c.p.s. in the enol tautomer. For hexafluoroacetyl- acetone there are shifts of S c.p.s. and 4 c.p.s. for the enolic •C -proton and keto -proton respectively as temperature increases from 29°C to 175°C. These shifts have been explained by the effectsof the rupture of the intermole cular hydrogen bonds and long range
7shielding.The chemical shifts of the ring proteins in benzoylacetone and
dibenzoylmethane are independent of temperature. Two groups of resonance signals appear in each compound indicating the presence of two different kinds of ring protons. In benzoylacetone the two groups resonate at ca. 469 c.p.s. and at ca. 441 c.p.s. There are spin-coupling splittings associated with each group of the resonance, lhe splittings associated with the ca. 469 c.p.s. group are at 475 c.p.s., 473 c.p.s., 469 c.p.s., 465 c.p.s. and 463 c.p.s. The coupling constants are 4 c.p.s. and 2 c.p.s. The splittings
7Burdett, J. E. and M. T. Rogers, og>. cit.
101
associated with the ca. 441 c.p.s. group are at 447 c.p.s., 443 c.p.s., 441 c.p.s. and 437 c.p.s. Their coupling constants are 4 c.p.s. and 2 c.p.s. In dibenzoylmethane, one group of the ring protons resonates at 480 c.p.s., 478 c.p.s., 475 c.p.s, 474 c.p.s.,472 co.p.s, 470 c.p.s., the other group of the ring protons resonate at 445 c.p.s., 442 c.p.s., 439 c.p.s., 438 c.p.s. and 435 c.p.s. In the first group the coupling constants are 3 c.p.s.,2 c.p.s. and 1 c.p.s. They are 1 c.p.s. and 3 c.p.s. for the second group of the ring protons.
The hydroxyl proton peak of acetylacetone in the enol tautomer shifts from 920 c.p.s. to 873 c.p.s. as the temperature increases from 25°C to 185°C. The shift is from 783 c.p.s. to 772 c.p.s. for hexafluoroacetylacetone as the temperature increases from 29°C to 175°C. In benzoylacetone it shifts from 979 c.p.s. to 949c.p.s. with the increase of temperature from 56°C to 190°C. This shift is from 1020 c.p.s. to 1013 c.p.s. for dibenzoylmethane as the temperature increases from 92°C to 136°C. The shift of the hydroxyl proton to higher magnetic fields is directly proportional to the temperature. A plot of the shifts vs. temperature gives a straight line for each compound as shown in Figure 1. The breaking of the intramolecular hydrogen bonds contributes to this deshielding effect. The higher the temperature the more the intramolecular hydrogen bonds are broken. It is well known that the foxmation of hydrogen bonds shifts the resonance position of the proton, which is involved
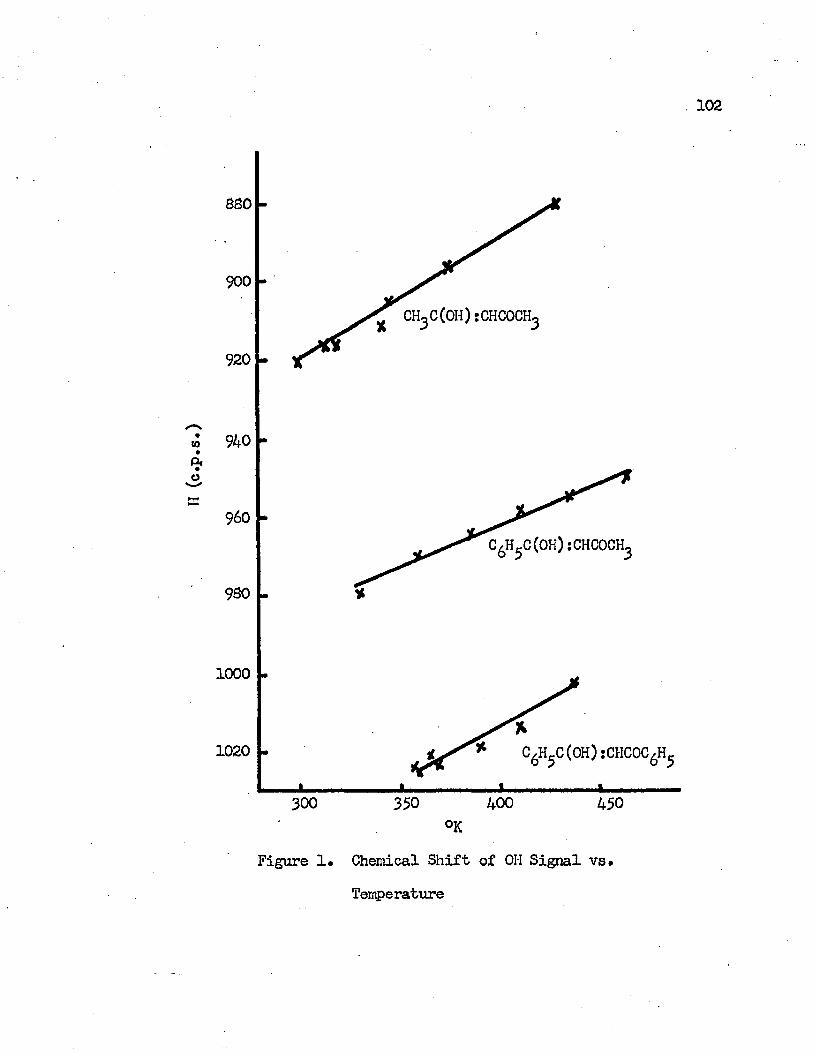
H (c
.p.s
.)
102
880
900
920
940
960
930
1000
C /H j-C (O H ) :C H C 0 C /H1020
350300 400 450°K
Figure 1. Chemical Shift of OH Signal vs. Temperature
103
in the hydrogen bonding, to lower magnetic fields.Gutowsky, et al. have observed the deshielding effects on hy
droxyl proton in the derivatives of phenols and naphthols when an in-g
tramolecular hydrogen bond is formed. They have related these chemical shifts to the strengths of the intramolecular hydrogen bonds and have shown that they are lineraly proportional to the bond multiplicity of the ring bonds between the carbon atoms holding the chelated substitutents. Similar arguments can be applied to the |3- diketones. On formation of the intramolecular hydrogen bond the molecule undergoes quantitative change due to polarisation. The approaching non-bonding electrons of the 0^ atom will repel those forming the covalent 0-H bond. This causes the OH resonance to shift to a lower magnetic field. Similarly, the attraction of the non-bonding 01 electrons by the proton will be accompanied by a repulsion of the 01 nucleus which will weaken its hold on these electrons. The effective nuclear charge of the 0 atom with regard to its other electrons will increase, resulting in electron shifts toward O*-. Since the effects of both the increased electron-repelling character of the hydrogen atom and the increased electron attracting power of the 0(or 0) atom that form part of a ring system will superimpose on and reinforce each other, the polarization will be transmitted along the whole molecular system as shown by the arrows.
^orte, A. L., H. S. Gutowsky and I. M. Hunsberger, J. Am. Ghem. Soc., & 5057 (i960).
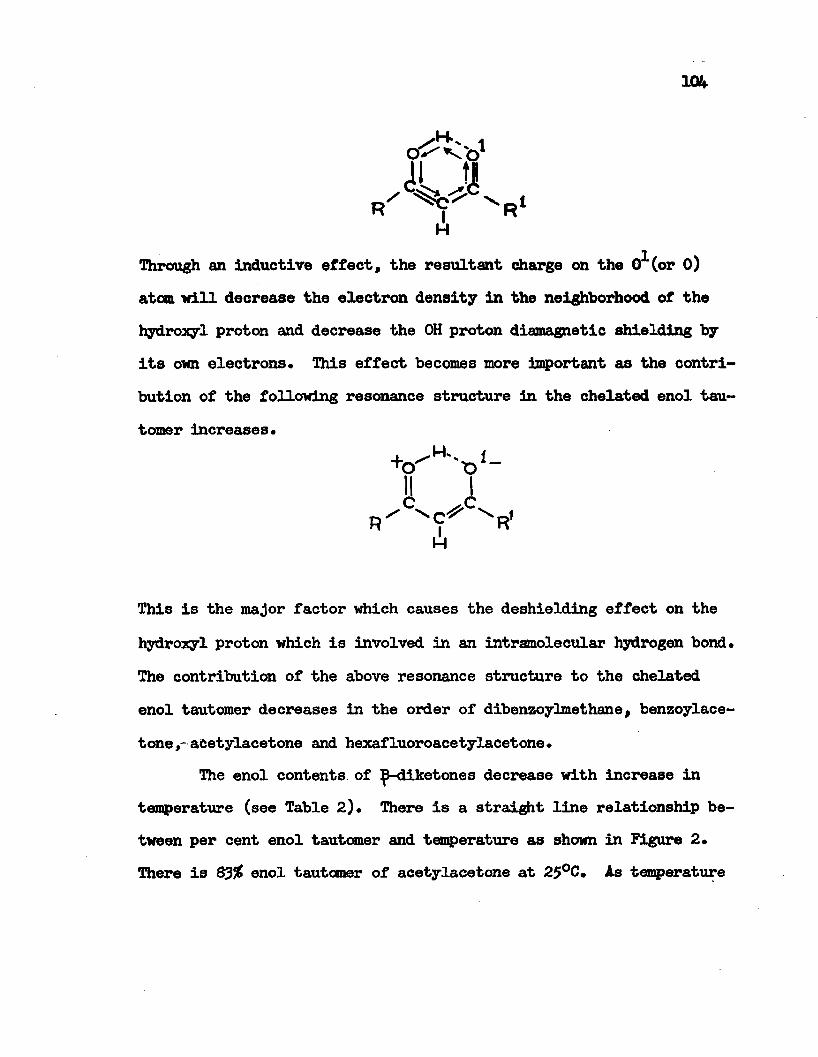
104
HXThrough an inductive effect, the resultant charge on the 0 (or 0)
atom will decrease the electron density in the neighborhood of the hydroxyl proton and decrease the OH proton diamagnetic shielding by its own electrons. This effect becomes more important as the contribution of the following resonance structure in the chelated enol tautomer increases.
+ i+o r>11 ic
r " v'<f^ ^ r ’M
This is the major factor which causes the deshielding effect on the hydroxyl proton which is involved in an intramolecular hydrogen bond. The contribution of the above resonance structure to the chelated enol tautomer decreases in the order of dibenzoylmethane, benzoylacetone,- acetylacetone and hexafluoroacetylacetone.
The enol contents, of -diketones decrease with increase in temperature (see Table 2). There is a straight line relationship between per cent enol tautomer and temperature as shown in Figure 2. There is 83% enol tautomer of acetylacetone at 25°C. As temperature
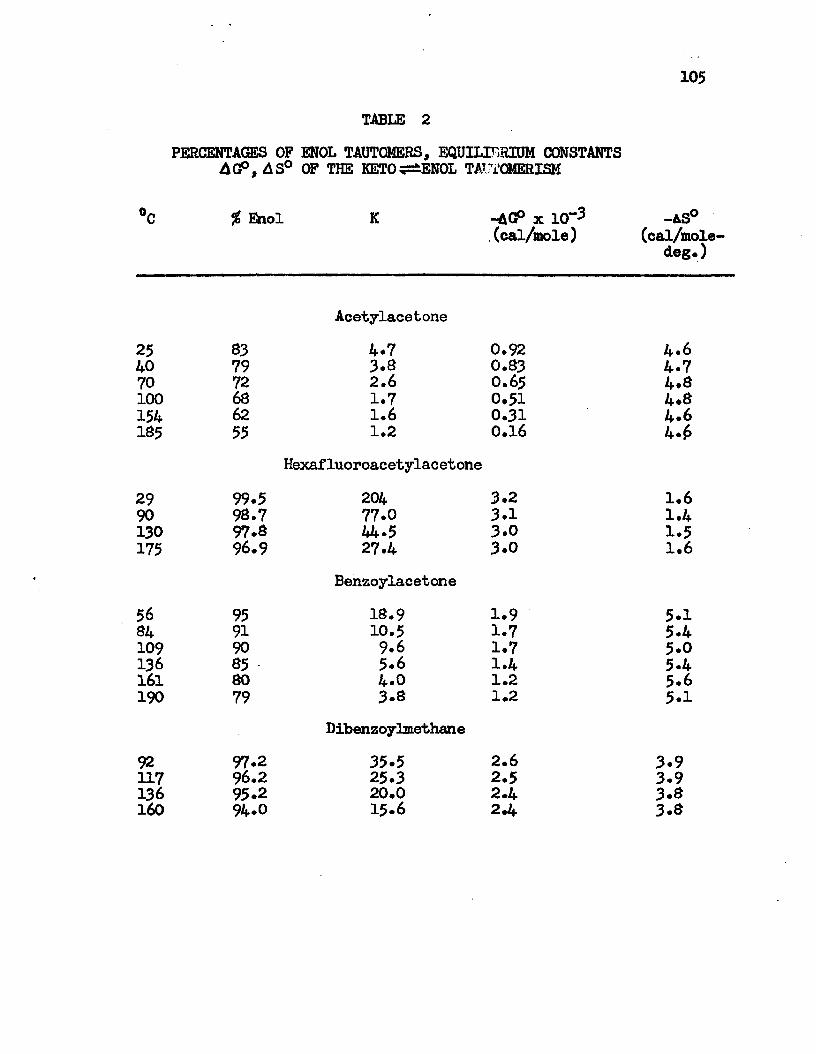
105
TABLE 2PERCENTAGES OF ENOL TAUTCMERS, EQUILIBRIUM CONSTANTS
AGP , AS° OF THE KETO^ENOL TAXJTCMERISM
°C % Enol K -AGP x 10“3(cal/mole)
Acetylacetone25 83 4.7 0.9240 79 3.8 0.8370 72 2.6 0.65100 68 1.7 0.51154 62 1.6 0.31185 55 1.2 0.16
Hexafluoroacetylacetone29 99.5 204 3.290 98.7 77.0 3.1130 97.8 44.5 3.0175 96.9 27.4 3.0
Benzoylacetone56 95 18.9 1.984 91 10.5 1.7109 90 9.6 1.7136 85 5.6 1.4161 80 4-0 1.2190 79 3.8 1.2
Dibenzoylmethane92 97.2 35.5 2.6117 96.2 25.3 2.5136 95.2 20.0 2.4160 94.0 15.6 2*4
-LS°(cal/mole-
deg.)
4*64.74.8 4*8 4.6 4*£
1.61.41.51.6
5.15.45.05.4 5.65.1
3.93.93.83.8
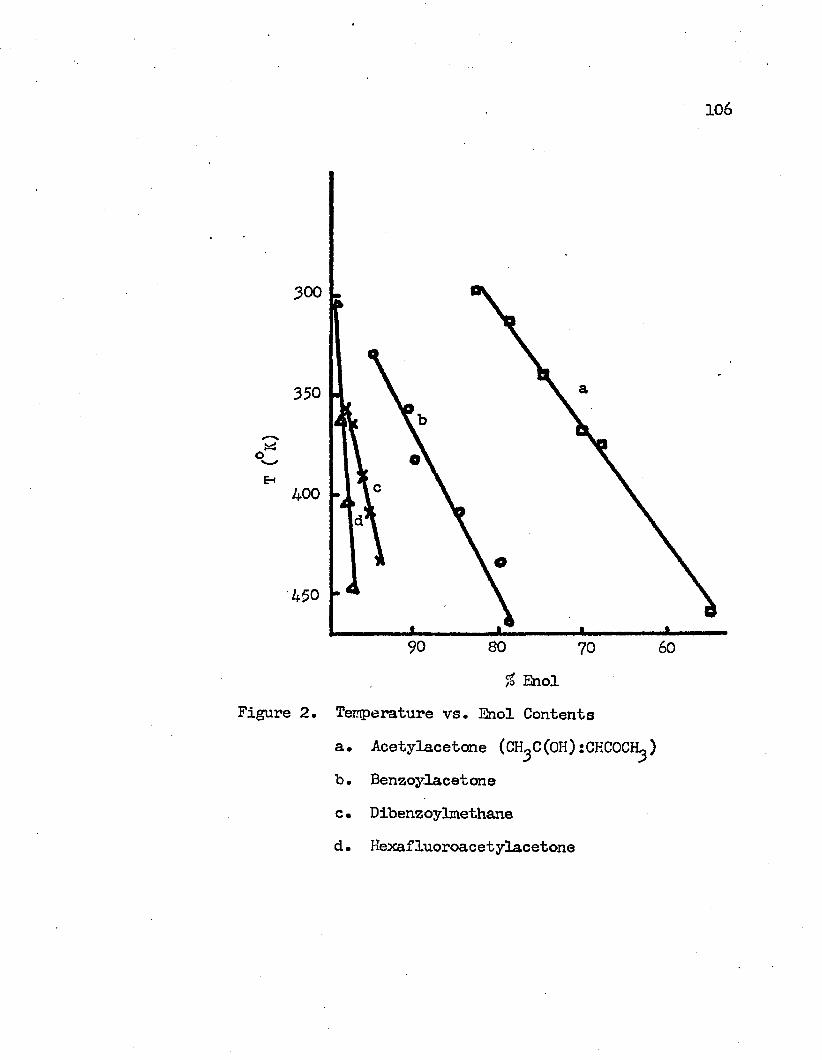
106
300
350
o
400
90 80 6070% Enol
Figure 2. Temperature vs. Enol Contentsa. Acetylacetone (CH CCOH)tCKCOCH )b. Benzoylacetonec • Dibenzoylmethaned. Hexafluoroacetylacetone
107
increases to 185°C the enol tautomer decreases to 55$* For hexa- fluoroacetylacetone the effect of temperature on the enol-content is not too great* The enol-content of hexafluoroacetylacetone decreased from 99*5% to 96.9$ with increase of temperature from 29°C to 175° C. As the temperature increases from 56°C to 190°C, the enol percentage of benzoylacetone decreases from 95$ to 79$* The effect of temperature on the enol-content of dibenzoylmethane is that the enol tautomer decreases from 97*2$ to 94*0$ as the temperature increases from 92°C to 160°C. Data from this study show that the enol tautomer is more stable at low temperatures. If the data are extrapolated, the temperatures that acetylacetone, benzoylacetone, hexafluoroacetylacetone and dibenzoylmethane become 100$ liquid enol tautomer can be predicted to be -85°C, 15°C, 21°C, and 47°C, respectively. As the temperature increases the tautcmerism will shift toward the keto tautomer and the keto-content in the tautomeric mixture increases.
The equilibrium constant of the keto?±enol tautomeric equilibrium, K, is defined as
[enol] integrated intensity of CH[keto] integrated intensity of CE^
in which [enol] and [keto] indicate the concentration of pure liquid enol and pure liquid keto, respectively. The K values for acetylacetone, hexafluoroacetylacetcne, benzoylacetone and dibenzoylmethane at different temperatures are given in Table 2. A plot of log K vs.1/T gives a straight line for each compound as shown in Figure 3*
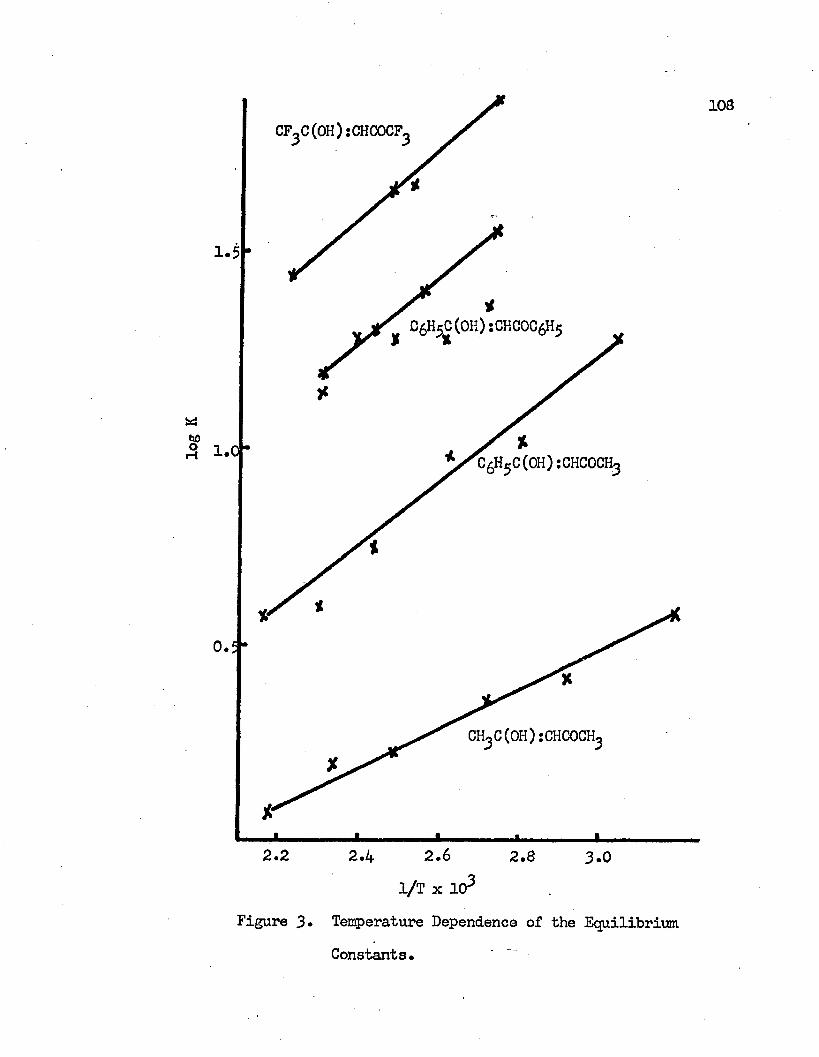
2.62.2 2.4 2.8 3.01/T x 103
Figure 3. Temperature Dependence of the Equilibrium Constants.
109
In the dibenzoylmethane case there are some points that do not lie on the straight line. These points were obtained from the first series of experiments. All the signals corresponding to these points had a tail on the high field side which indicates that the resolution of the instrument was poor. They were taken about 10 minutes after the system reached the measuring temperature. It is throught that the time was too shoft for the establishment of thermal equilibrium.These are the factors which probably caused inaccurate results.
By means of the van’t Hoff equationdin K
- A H° = R . -----dCVT)
the change of standard enthalpy, A H°, for keto enol tautomerism can be calculated from the slope of the curve of the log K vs. V^. Pure liquid enol tautomer and pure liquid keto tautomer are taken to be the standard states. AH0 for acetylacetone, hexafluoroacetylacetone, benzoylacetone and dibenzoylmethane are -2*3 Kcal/mole, -3*7 Kcal/ mole, -3*6 Kcal/mole and -4*0 Kcal/mole respectively. Burdett and Rogers have obtained a value of -2840 200 cal/mole for AH° of acetylacetone. AH0 of acetylacetone was -2705- 100 cal/nole according to Reeves Powling and Bernstein have determined A H° of acetylacetone to be -2.4 Kcal/mole by use of an infrared analytical
burdett, J. S. and M. T. Rogers, op. cit.
10Reeves, L. W., op. cit.
1X0XXmethod. A H° can be subdivided into AH° - AHg-ANq in which AHg
is the change of enthalpy due to the conversion of keto tautomer to open enol tautomer which does not form intramolecular hydrogen bond and a H is the intramolecular hydrogen bond energy* In the forma- tion of an intramolecular hydrogen bond, an energy, which is equivalent to the intramolecular hydrogen bond energy, will be released from the molecule* Since the enol tautcmers exist exclusively in the chelated form, a Hq has to be taken into consideration* Normally, A Hq will have a value higher than 5 Kcal/mole, that means AHjg is greater than zero for all cases in this study* This indicates that the open enol tautomer which does not form intramolecular hydrogen bond is less stable than the keto tautomer thermodynamically* It is the formation of the six-member ring via the intramolecular hydrogen bond in the enol tautomer that causes the enol tautomer to be more stable than the keto tautomer*
Values of the change of standard free energy, AG°, and the change of standard entropy, A S° can be calculated from,
a Gf3 = - RTInkAH° = a g° - T a s °
Their values at different temperatures are given in Table 2. Acetylacetone has a agP value of ca* -0.6 Kcal/mole* The ag° forhexaf luoroacetylacetone is around -3*1 Kcal/mole, which is the
Pawling, J. and H. J* Bernstein, J. Am* Chern* Soc*, 73 4353 (1951)*
Ill
largest change among all the compounds in this study. Benzoylacetone and dibenzoylmethane have A G°*s of about -1.7 Kcal/mole and -2.5 Kcal/mole respectively. All the acPTs are negative. Their absolute values decrease as temperature increases. Since the change of free energy is a measurment of the degree of spontaneity of the reaction one expects that pure enol tautomer is more stable than the pure keto tautomer and the stability of the enol tautomer decreases with increase in temperature.
AS°*s are in the neighborhoods of -4*7 cal/mole-deg., -1.5 cal/mole-deg., -5.4 cal/mole-deg. and -3.8 cal/mole-deg. for acetylacetone, hexaf luoroacetylacetone, benzoylacetone and dibenzoylmethane respectively. There is no direct relationship between A S° and temperature . The negative values of A S° indicate that the degree of randomness is higher in the keto tautomers than in the enol tautomers. This can be explained in the following ways: (l) In keto tautomerthe orbitals of A -carbon are sp? hybrids. They form r -bonds with the neighboring atoms • In enol tautomer the orbitals of oC -carbon are sp hybrids. They form two <r single bonds and one if double bond with the neighboring atoms. The formation of a double bond between A -carbon and its neighboring carbon atom in the enol tautomer decreases the rotational freedom about this bond, the molecule becomes
- imsai
more rigid and consequently decreases the A S° value. (2) In the enol tautomer there is a six-membered ring formed through intramolecular hydrogen bonding. In order to form the chelated structure the
112
0* atom and the 0-H group have to be very close to each other and all the six members in the ring have to be in a plane* This eliminates some of the configurations which are possible in the keto tautomer.
Hie change of A S° in hexaf luoroacetylacetone is small compared to the changes of a s° in other three compounds. This may be due to the presence of high electronegative fluoro groups in the hexafluoroacetylacetone. Fluoro groups in a molecule will strongly repel each other. They have to stay away from each other as far as possible. No matter whether they are in the keto tautomer or in enol tautomer the CF groups have to be trans to each other. This causes other configurations in the keto tautomer to be highly improbable and decreases its entropy.
IV. SUMMARY
Nuclear magnetic resonance spectra of pure -diketones have been studied at different temperatures. The effect of the temperature on the keto-enol tautomeric equilibrium has been studied. The increase in temperature displaces the equilibrium to the keto side.From the melting point of the compound to the maximum temperature
olimit of the instrument, 190 C, the major component in the equilibrium is the chelated enol form. Equilibrium constants of the keto- enol tautomeric equilibria have been determined at different temperatures. The highest temperatures at which -diketones exist as 100$ enol have been predicted to be -85°C, 15°C, 21°C and 47° c for acetylacetone, benzoylacetone, hexaf luoroacetylacetone and dibenzoylmethane, respectively. The change of the standard enthalpies of the keto-enol tautomerism have been calculated to be -2.3 Kcal/mole,-3.7 Kcal/mole, -3.6 Kcal/mole and -4.0 Kcal/mole for acetylacetone, hexaf luoroacetylacetone, benzoylacetone and dibenzoylmethane, respectively. Other thermodynamic quantities have been obtained at different temperatures. Their values depend on the different molecular structures.
U4
SELECTED BIBLIOCSAPHT
Beckett, A., A. D. Osborne and 6* Porter, "Primary Photochemical Processes in Aromatic Molecules* Part II* Radical and Radical Anions Derived from Benzaldehyde, Acetophenone and Benzil." Transactions of the Faraday Society, jjQ, 873 (1964)*
Bratoz, S., D. Harzi and 6* Rossmy, "The Infrared Absorption Bands Associated the the Chelated Ring on Some Unsaturated Hydroxy- carbonyl Compounds," Transactions of the Faraday Society, *|2, 464 (1956).
Bredereck, K*, Th* Forster and H* G. Oesterlin, "Fluorescence of Aromatic Aldehydes, " H*P* Kallmann and G* M* Spurch, ’Luminescence of Organic and Inorganic Materials’ John Wiley and Sons, Inc*, New York (1962) p. l6l*
Burdett, J* L. and M* T. Rogers, "Keto-Enol Tautomerism in ip-Dicarbonyls Studied by Nuclear Magnetic Resonance Spectroscopy I* Proton Chemical Shifts and Equilibrium Constants of Pure Compounds." The Journal of the American Chemical Society, 86.2105 (1964).
Burdett, J* L. and M* T. Rogers, "Keto-Enol Tautomerism in J-Dicar- bonyls Studied by Nuclear Magnetic Resonance Spectroscopy III. Studies of Proton Chemical Shift and Equilibrium Constants at Different Temperatures," Journal of Physical Chemistry, 22»939 (1966).
El-Sayed, M. A., "Spin-Grbit Coupling and the Radiationless Processes in Nitrogen Hetercyclics," Journal of Chemical Physics, 38.2834 (1963)*
Grant, D. M., "High Resolution Magnetic Resonance," Annual Review of Physical Chemistry, 1£, 4&9 (1964)*
Harris, J. L., "Spectroscopy of Composite Molecules Having Weakly Interacting Systems," Ph.D. Dissertation. Louisiana State University, Baton Rouge, Louisiana (19655•
Hashimoto, F., S. Tanaka and S* Nagakura, "Dissociation Constants of Some Pseudo-Acids and Ultraviolet Absorption Spectra of Their Anions," The Journal of Molecular Spectroscopy, 10, 401 (1963).
115
Hay* R. W. and P. P. Williams, "Proton Magnetic Resonance of Hydrogen-Bonded Chelate Rings ,* Journal of the Chemical Society, (I960 2270.
Hochstrasser, R. M., "The Luminescence of Complex Molecules in Relation to the Internal Conversion of Excitation Energy, Part I" Canadian Journal of Chemistry, 22» 1367 (1959) •
Hochstrasser, R. M., "The Luminescence of Complex Molecules in Relation to the Internal Conversion of Excitation Energy. Part II, N-Heteroaromatics," Canadian Journal of Chemistry, 2fi* 233 (I960).
Hochstrasser, R. M., "On the Problem of Radiative Combination Between Upper Singlet States and the Ground State in Aromatic Molecules," Spectrochimica Acta, 16. 497 (i960).
Ito, M., "The Effect of Temperature on Ultraviolet Absorption Spectra and Its Relation to Hydrogen Bonding," The Journal of Molecular Spectroscopy, 106 (I960).
Kanda, 7., H. Kaseda and T. Matumura, "Singlet-Triplet Absorption Spectra of Several Carbonyl Compounds," Sjpectrochimica Acta, 20, 13S7 (1964).
Kasha, M., "Characterization of Electronic Transitions in Complex Molecules," Discussions of Faraday Society, 2.* 14 (1950).
. Kuo, J., "Electronic Transitions of Dibenzoyimethane and Related Compounds," M.S. Thesis, Louisiana State University, Baton Rouge, Louisiana (1963)
Lewis, G. N. and J. Bigeleisen, "The Orientation of Molecules Produced Photochemically in Rigid Solvents," The Journal of the American Chemical Society. 65. 520 (1943).
Lewis, G. N. and D. Lipkin, "Reversible Photochemical Processes in Rigid Media. The Dissociation of the Organic Molecules into Radicals and Ions," The Journal of the American Chemical Society, 6± 2801 (1942).
Lewis, G. N. and M. Kasha, "Phosphorescence and the Triplet State," The Journal of the American Chemical Society, 66 . 2100 (1944).
Lins chit z, H«, M. G. Berry and D. Schweitzer, "The Identification of Solvated Electrons and Radicals in Rigid Solutions of Photooxidized Organic Molecules: Recombination Luminescence in Organic Phosphors," The Journal of the American Chemical Society, 76.5$33 (1954).
116Lower, S. K. and M. A. El-Sayed, "The Triplet State and Molecule
Electronic Processes in Organic Molecules," Chemical Reviews, £6, 199 (1966).
McClain, W. H. and A. C. Albrecht, "On the Nature of Stimulated Eknis- sion in Rigid Organic Solutions," The Journal of Chemical Physics, t£, 465 (1965).
Me Glynn, S. P., "The Method of Resonance," Seminar on Computational Methods, Department of Chemistry, Louisiana State University, Baton Rouge, Louisiana (1966).
Nagakura, S. and S. Tanaka, "The Relation Between Energy Levels ofSubstituent Group and Electron Migration Effects in Seme Monosubstituted Benzenes," The Journal of Chemical Physics, 22.236 (1954).
Nagakura, S., "Intramolecular Charge Transfer Spectra Observed with Some Compounds Containing the Nitro or the Carbonyl Group," The Journal of Chemical Physics, 22., 1441 (1955).
0’Dwyer, M. F., M. A. El-Bayoumi and S. J. Strickler, "Observation of Anomalous Phosphorescence - Fluorescence Intensity Ration in Excitation of Upper Electronic States of Certain Aromatic Hydrocarbons," The Journal of Chemical Physics, 1395 . (1962).
Pimentel, G. C., "Hydrogen Bonding and Electronic Transitions: TheRole of the Franck-Condon Principle," The Journal of the American Chemical Society, 22* 3323 (1957).
Pople, J. A., W. G. Schneider and H. J. Bernstein, "High Resolution Nuclear Magnetic Resonance," McGraw-Hill Book Co., Inc., New York (1959).
Porte, A. L., H. S. Gutowsky and I. M. Hunsberger, "The Determination of Double-bond Character in Cyclic System V. Proton Chemical Shifts in Chelated Derivatives of Benzene, Naphthalene and Phenanthrene," The Journal of the American Chemical Society,
5057 (I960).Powling, J. and H. J. Bernstein, "The Effect of Solvents on Tautomer
ic Equilibria," The Journal of the American Chemical Society, 22, 4353 (1951).
Reeves, L. V., "Nuclear Magnetic Resonance Measurement in Solutions of Acetylacetone. The Effect of Solvent Interactions on the Tautomeric Equilibrium,” Canadian Journal of Chemistry, 35. 1351 (1957).
117
Rosengren, K.} "A Study on Contraction, Relative Viscosity and Melting Curves of Same Glass-forming Hydrocarbon Mixtures," Acta Chemica Scandinavica, 16. 1421 (1962).
Seybold, P. and M. Gouterman, "Radiationless Transitions in Gases and Liquid," Chemical Reviews, 6£, 413 (1965)*
Sidman, J. W., ■'Electronic Transitions Due to Nonbonding Electrons in Carbonyl, Aza-Aromatic and Other Compounds," Chemical Re*-’ views, jj&, 689 (1956).
Sun, H. Y., J. Jortner and S. T. Rice, "Conjecture on Resonant Transfer of Vibrational Energy and Radiationless Transitions in the Solid Phase : The Life Time of Triplet Anthracene," The Journal of Chemical Physics, 44 . 2539 (1966).
Symons, M. C. R. and M. Towns and, ■'Electronic Spectrum of Trapped Ethanol Radicals," The Journal of Chemical Physics, 25.1299 (1956).
Urry, W. H. and D. J. Trecker, "Photochemical Reactions of 1,2 Diketones." The Journal of the American Chemical Society, 84. 118 (1962).
van Voorst, J. D. W. and G. J. Hoijtink, "Photoelectron Ejection from Aromatic Negative Ions in Rigid Media," The Journal of Chemical Physics, kg, 3995 (1965).
Williamson, L. H., "The Effect of Low Temperature and Irradiation on the Electronic Spectra of the Conjugated Chelate System and Related Aromatic Compounds," Ph.D. Dissertation, Louisiana State University, Baton Rouge, Louisiana (1965).
Yang, N. C. and C. Rivas, "A New Photochemical Primary Process, The Photochemical Enolization of O-Substituted Benzophenones,"The Journal of the American Chemical Society, 83. 2213 (1961).
Yang, N. C., E. F. Zwicker and L. I. Qrossweiner, "The Role of"n -.v* Triplet in the Photochemical Enolization of O-Benzylbenzo- phenone," The Journal of the American Chemical Society, 85. 2671 (1963).
118
VITA
Jang Kao was bom In Shanghai, the Republic of China on August 15, 193 * He attended public schools in different cities in China*He graduated from the High School of Taiwan Normal University,Taipei, Formosa in 1954* He attended National Taiwan University, Taipei, Formosa from 1954 to 195®, when he received the degree of Bachelor of Science in Chemical Engineering. He was called to active duty in the Chinese army from 195® to I960*
He entered the Graduate School of Louisiana State University in 1961, and received the Master of Science degree in Chemistry in 1963* He spent one semester in the Department of Chemistry, University of California, Berkeley, California and came back to Louisiana State University in 1964* He is now a candidate for the degree of Doctor of Philosophy*
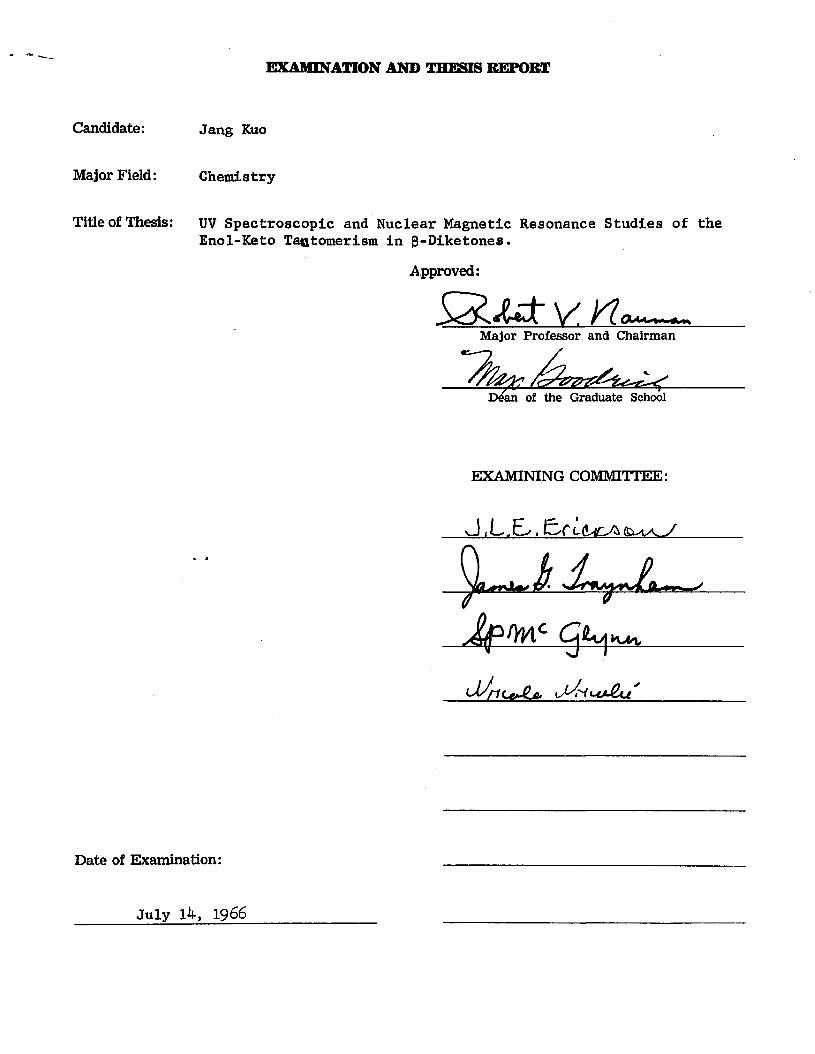
EXAMINATION AND THESIS REPORT
Candidate: Jang Kuo
Major Field: Chemi s try
Title of Thesis: UV Spectroscopic and Nuclear Magnetic Resonance S tudies o f theEnol-Keto Tatjtomerism in |3-D ik eton es.
Approved:
Major Professor and Chairman
D^an of the Graduate School
EXAMINING COMMITTEE:
J i L j £>* i L/f t. ii cA ./
Date of Examination:
July 14, 1966