Embed Size (px)
Citation preview
UMASS LOWELLUMASS LOWELL2016 Report Card
MISSION AND PILLARS OF EXCELLENCE FOR UMASS LOWELL 2020
MISSION: The University of Massachusetts Lowell is a nationally ranked public research university committed to excellence in teaching, research and community engagement. We strive to prepare students to succeed in college, and to become lifelong learners and informed citizens in a global environment. UMass Lowell offers affordable, experience-based undergraduate and graduate academic programs taught by internationally recognized faculty who conduct research to expand the horizons of knowledge. The programs span and interconnect the disciplines of business, education, engineering, fine arts, health and environment, humanities, sciences and social sciences. The university continues to build on its founding tradition of innovation, entrepreneurship and partnerships with industry and the community to address challenges facing the region and the world.
UMASS LOWELL 2020—PILLARS AND COMMITTEES:Strategic Planning Steering Committee: Don Pierson, Joanne Yestramski, John Ting, Lauren Turner
I. TRANSFORMATIONAL EDUCATION
Experiential and transdisciplinary learning prepare UMass Lowell students for fulfillment and making a difference in the world.
Committee on Transformational Education: Charlotte Mandell, Anita Greenwood, Co-chairs
Subcommittee on Advising
Subcommittee on Pedagogy
Subcommittee on Assessment
Committee on NCAA Division I Institutional Performance: Don Pierson, Chair
Academic Sustainability Committee: Mark Hines, Rich Lemoine, Co-chairs
Academic Technology Committee: Michael Cipriano, George Hart, Co-chairs
Academic Effectiveness and Efficiency Committee: Steve O’Riordan, John Ting, Co-chairs
II. GLOBAL ENGAGEMENT & INCLUSIVE CULTURE
Dynamic, global collaborations around the world support student and faculty exchanges, research and other entrepreneurial enterprises. These initiatives will contribute to the development of an inclusive campus culture.
Committee on Global Engagement and Inclusive Community: Luis Falcon, Lauren Turner, Co-chairs
Committee on Title IX: Ann Ciaraldi, Clara Orlando, Co-chairs
III. INNOVATIVE RESEARCH & ENTREPRENEURSHIP
UMass Lowell fosters innovative and creative research and scholarship that seek sustainable solutions to the major challenges in today’s world.
Committee on Innovative Research: Julie Chen, Andrew Harris, Co-chairs
Subcommittee on University Research and Engagement Centers and Institutes
Subcommittee on Faculty Honors and Awards
Subcommittee on Dissemination and External Visibility
Subcommittee on Intellectual Property and Technology Transfer
Subcommittee on Research Infrastructure and Faculty Support
River Hawk New Venture Fund Advisory Board: Jack Wilson, Don LaTorre, Co-chairs
IV. LEVERAGE OUR LEGACY AND OUR PLACE
UMass Lowell is a public enterprise committed to building on our legacy by creating partnerships locally, regionally, nationally and internationally that enrich and sustain the human experience.
Committee on Economic Development, Entrepreneurship and Corporate Relations: James Sherwood, Steve Tello, Jack Wilson, Co-chairs
Subcommittee on Corporate Relations
Marketing Committee: Joseph Hartman, Patricia McCafferty, Co-chairs
Web Advisory Committee: Mark Hines, Gerry Nelson, Co-chairs
Deans’ Alumni Advisory Councils
V. ENTREPRENEURIAL STEWARDSHIP
An entrepreneurial approach to stewardship of academic, human, physical and financial resources will be the hallmark of UMass Lowell’s approach to building a healthy and sustainable future.
Committee on Financial Planning: Michael Carter, Steve O’Riordan, Co-chairs
Facilities Renewal and Master Planning Committee: Thomas Dreyer, John Ting, Co-chairs
Climate Action Plan Committee: Mark Hines, Rich Lemoine, Co-chairs
UMASS LOWELL2016 Report Card
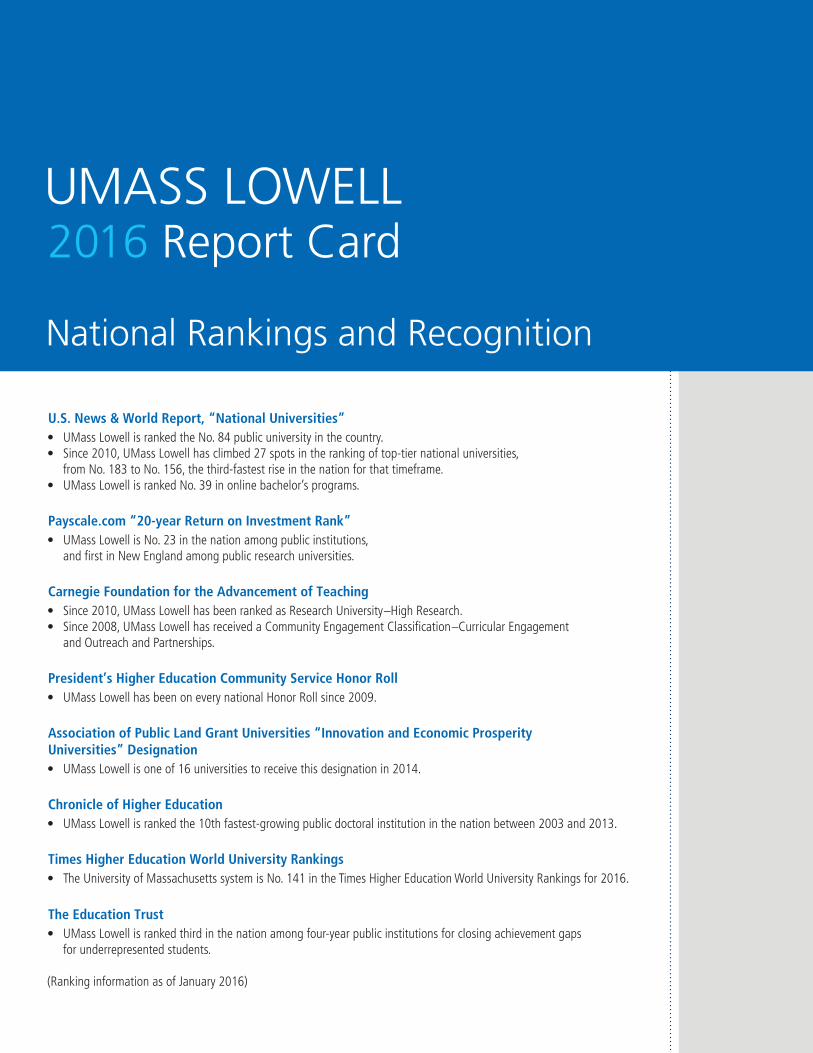
National Rankings and Recognition
U.S. News & World Report, “National Universities”• UMass Lowell is ranked the No. 84 public university in the country. • Since 2010, UMass Lowell has climbed 27 spots in the ranking of top-tier national universities,
from No. 183 to No. 156, the third-fastest rise in the nation for that timeframe. • UMass Lowell is ranked No. 39 in online bachelor’s programs.
Payscale.com “20-year Return on Investment Rank”• UMass Lowell is No. 23 in the nation among public institutions, and first in New England among public research universities. Carnegie Foundation for the Advancement of Teaching• Since 2010, UMass Lowell has been ranked as Research University–High Research. • Since 2008, UMass Lowell has received a Community Engagement Classification–Curricular Engagement
and Outreach and Partnerships.
President’s Higher Education Community Service Honor Roll• UMass Lowell has been on every national Honor Roll since 2009.
Association of Public Land Grant Universities “Innovation and Economic Prosperity Universities” Designation• UMass Lowell is one of 16 universities to receive this designation in 2014.
Chronicle of Higher Education• UMass Lowell is ranked the 10th fastest-growing public doctoral institution in the nation between 2003 and 2013.
Times Higher Education World University Rankings • The University of Massachusetts system is No. 141 in the Times Higher Education World University Rankings for 2016.
The Education Trust • UMass Lowell is ranked third in the nation among four-year public institutions for closing achievement gaps for underrepresented students.
(Ranking information as of January 2016)
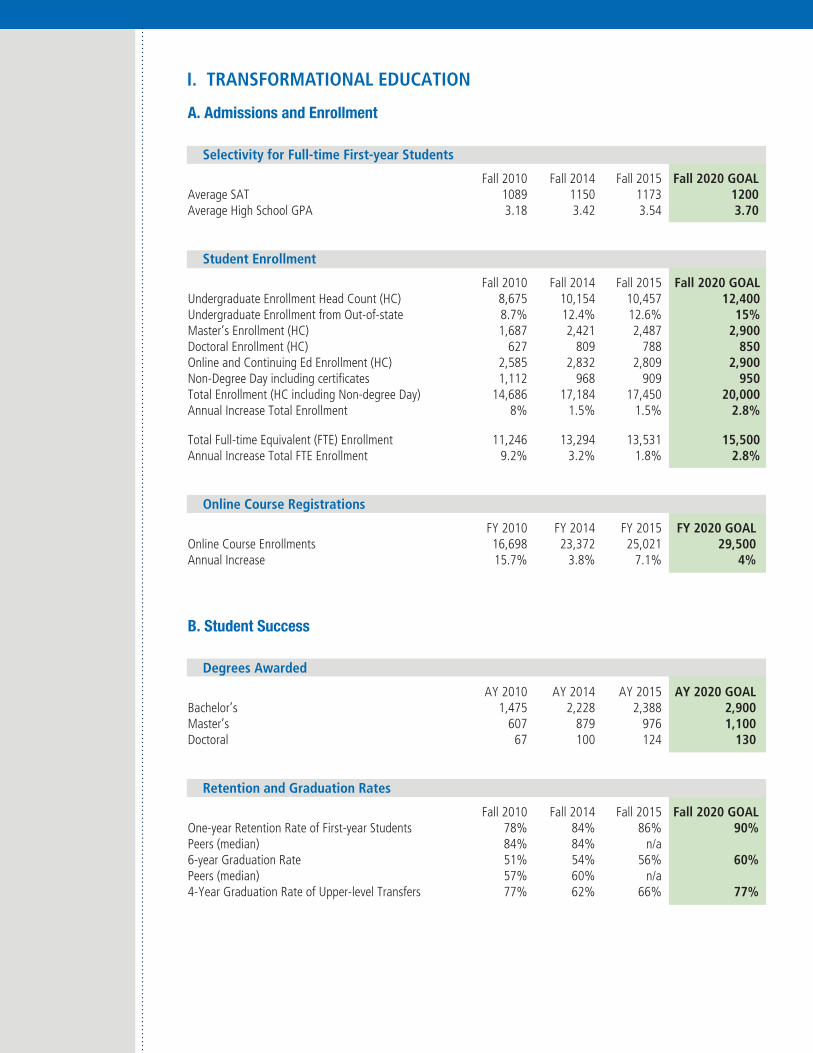
I. TRANSFORMATIONAL EDUCATION
A. Admissions and Enrollment
Selectivity for Full-time First-year Students
Fall 2010 Fall 2014 Fall 2015 Fall 2020 GOALAverage SAT 1089 1150 1173 1200Average High School GPA 3.18 3.42 3.54 3.70
Student Enrollment
Fall 2010 Fall 2014 Fall 2015 Fall 2020 GOALUndergraduate Enrollment Head Count (HC) 8,675 10,154 10,457 12,400Undergraduate Enrollment from Out-of-state 8.7% 12.4% 12.6% 15%Master’s Enrollment (HC) 1,687 2,421 2,487 2,900Doctoral Enrollment (HC) 627 809 788 850Online and Continuing Ed Enrollment (HC) 2,585 2,832 2,809 2,900Non-Degree Day including certificates 1,112 968 909 950Total Enrollment (HC including Non-degree Day) 14,686 17,184 17,450 20,000Annual Increase Total Enrollment 8% 1.5% 1.5% 2.8%
Total Full-time Equivalent (FTE) Enrollment 11,246 13,294 13,531 15,500 Annual Increase Total FTE Enrollment 9.2% 3.2% 1.8% 2.8% Online Course Registrations
FY 2010 FY 2014 FY 2015 FY 2020 GOALOnline Course Enrollments 16,698 23,372 25,021 29,500Annual Increase 15.7% 3.8% 7.1% 4% B. Student Success
Degrees Awarded
AY 2010 AY 2014 AY 2015 AY 2020 GOALBachelor’s 1,475 2,228 2,388 2,900Master’s 607 879 976 1,100Doctoral 67 100 124 130 Retention and Graduation Rates
Fall 2010 Fall 2014 Fall 2015 Fall 2020 GOALOne-year Retention Rate of First-year Students 78% 84% 86% 90% Peers (median) 84% 84% n/a 6-year Graduation Rate 51% 54% 56% 60% Peers (median) 57% 60% n/a 4-Year Graduation Rate of Upper-level Transfers 77% 62% 66% 77%
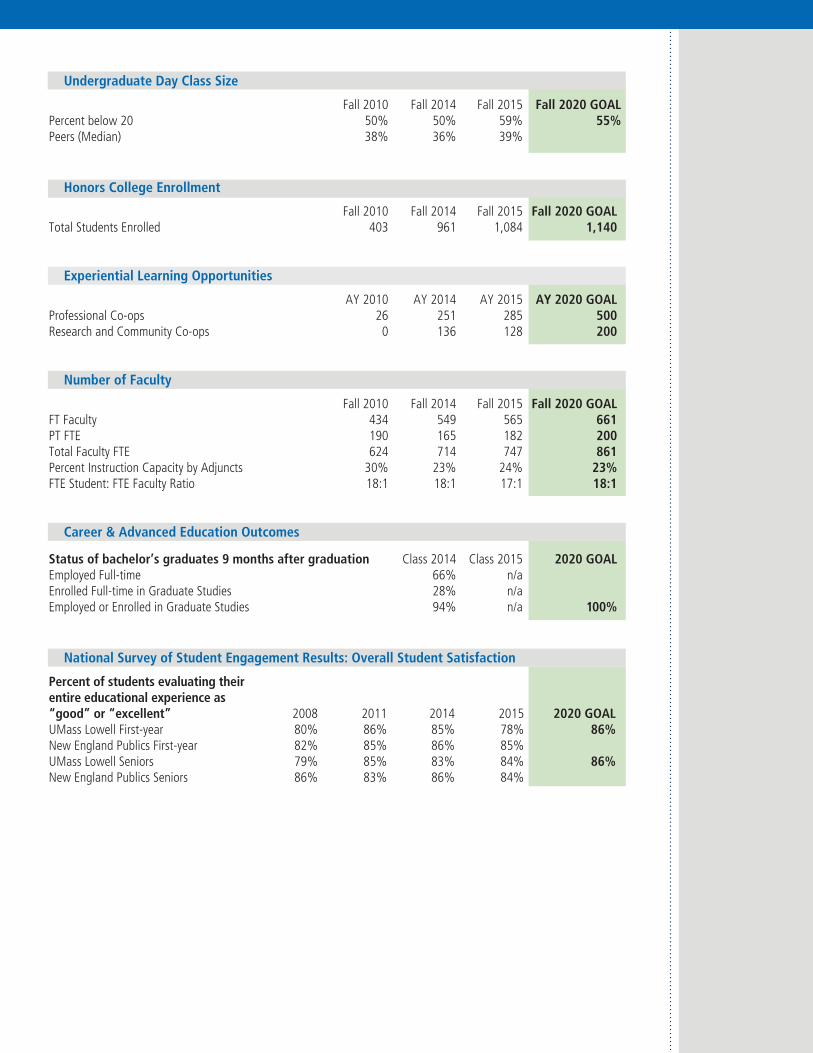
Undergraduate Day Class Size Fall 2010 Fall 2014 Fall 2015 Fall 2020 GOALPercent below 20 50% 50% 59% 55%Peers (Median) 38% 36% 39%
Honors College Enrollment Fall 2010 Fall 2014 Fall 2015 Fall 2020 GOALTotal Students Enrolled 403 961 1,084 1,140
Experiential Learning Opportunities
AY 2010 AY 2014 AY 2015 AY 2020 GOALProfessional Co-ops 26 251 285 500Research and Community Co-ops 0 136 128 200
Number of Faculty
Fall 2010 Fall 2014 Fall 2015 Fall 2020 GOALFT Faculty 434 549 565 661PT FTE 190 165 182 200Total Faculty FTE 624 714 747 861Percent Instruction Capacity by Adjuncts 30% 23% 24% 23%FTE Student: FTE Faculty Ratio 18:1 18:1 17:1 18:1 Career & Advanced Education Outcomes
Status of bachelor’s graduates 9 months after graduation Class 2014 Class 2015 2020 GOALEmployed Full-time 66% n/a Enrolled Full-time in Graduate Studies 28% n/a Employed or Enrolled in Graduate Studies 94% n/a 100% National Survey of Student Engagement Results: Overall Student Satisfaction
Percent of students evaluating their entire educational experience as “good” or “excellent” 2008 2011 2014 2015 2020 GOALUMass Lowell First-year 80% 86% 85% 78% 86%New England Publics First-year 82% 85% 86% 85% UMass Lowell Seniors 79% 85% 83% 84% 86%New England Publics Seniors 86% 83% 86% 84%
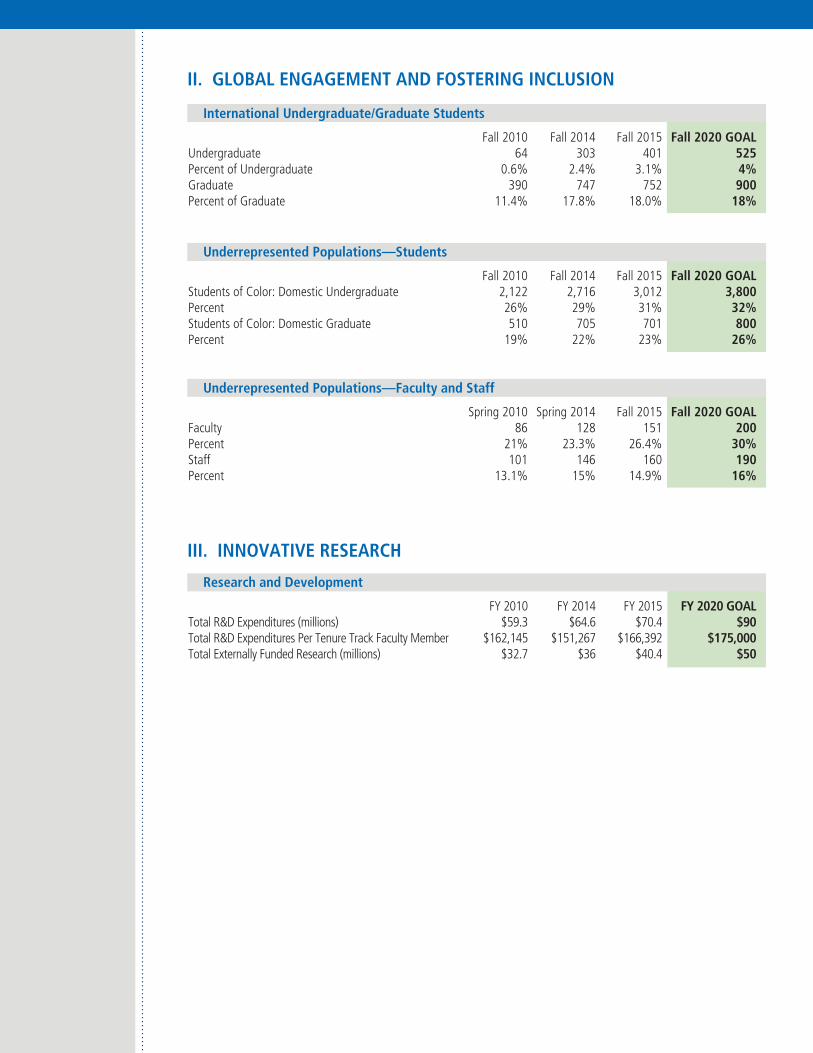
II. GLOBAL ENGAGEMENT AND FOSTERING INCLUSION
International Undergraduate/Graduate Students
Fall 2010 Fall 2014 Fall 2015 Fall 2020 GOALUndergraduate 64 303 401 525Percent of Undergraduate 0.6% 2.4% 3.1% 4%Graduate 390 747 752 900Percent of Graduate 11.4% 17.8% 18.0% 18% Underrepresented Populations—Students
Fall 2010 Fall 2014 Fall 2015 Fall 2020 GOALStudents of Color: Domestic Undergraduate 2,122 2,716 3,012 3,800Percent 26% 29% 31% 32%Students of Color: Domestic Graduate 510 705 701 800Percent 19% 22% 23% 26%
Underrepresented Populations—Faculty and Staff
Spring 2010 Spring 2014 Fall 2015 Fall 2020 GOALFaculty 86 128 151 200Percent 21% 23.3% 26.4% 30%Staff 101 146 160 190Percent 13.1% 15% 14.9% 16%
III. INNOVATIVE RESEARCH
Research and Development
FY 2010 FY 2014 FY 2015 FY 2020 GOALTotal R&D Expenditures (millions) $59.3 $64.6 $70.4 $90Total R&D Expenditures Per Tenure Track Faculty Member $162,145 $151,267 $166,392 $175,000Total Externally Funded Research (millions) $32.7 $36 $40.4 $50
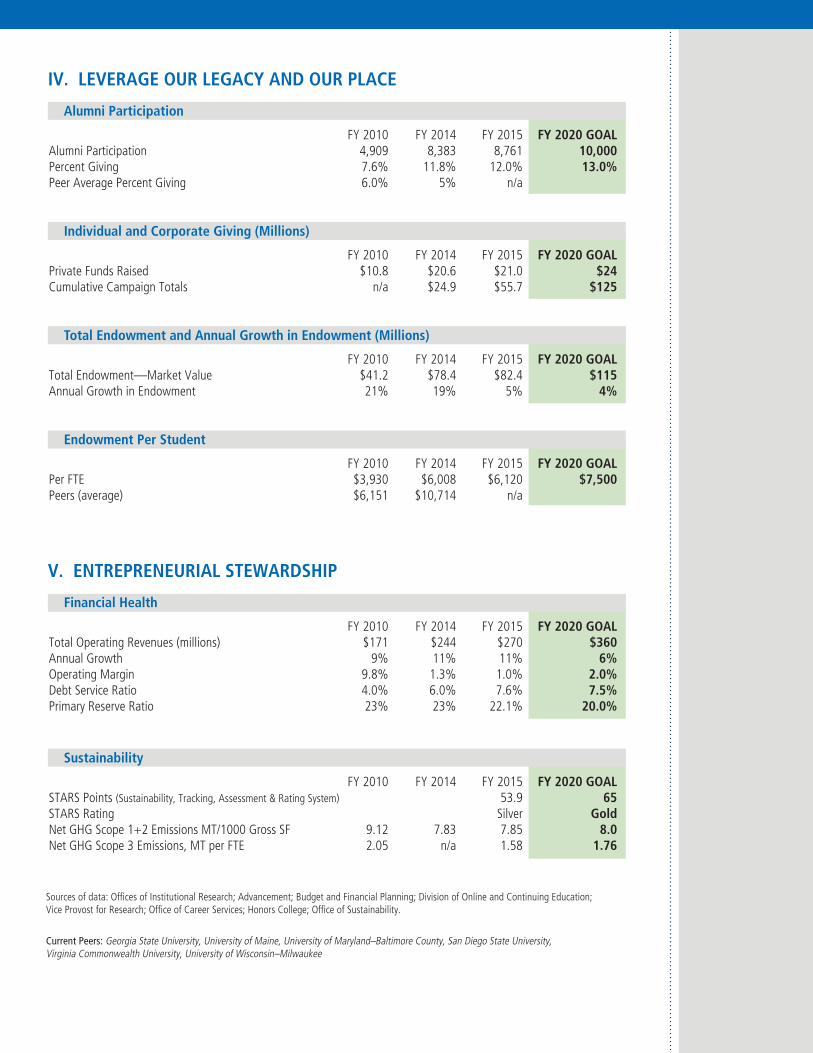
IV. LEVERAGE OUR LEGACY AND OUR PLACE
Alumni Participation
FY 2010 FY 2014 FY 2015 FY 2020 GOALAlumni Participation 4,909 8,383 8,761 10,000Percent Giving 7.6% 11.8% 12.0% 13.0%Peer Average Percent Giving 6.0% 5% n/a
Individual and Corporate Giving (Millions)
FY 2010 FY 2014 FY 2015 FY 2020 GOALPrivate Funds Raised $10.8 $20.6 $21.0 $24Cumulative Campaign Totals n/a $24.9 $55.7 $125 Total Endowment and Annual Growth in Endowment (Millions)
FY 2010 FY 2014 FY 2015 FY 2020 GOALTotal Endowment—Market Value $41.2 $78.4 $82.4 $115Annual Growth in Endowment 21% 19% 5% 4%
Endowment Per Student
FY 2010 FY 2014 FY 2015 FY 2020 GOALPer FTE $3,930 $6,008 $6,120 $7,500Peers (average) $6,151 $10,714 n/a
V. ENTREPRENEURIAL STEWARDSHIP
Financial Health
FY 2010 FY 2014 FY 2015 FY 2020 GOALTotal Operating Revenues (millions) $171 $244 $270 $360 Annual Growth 9% 11% 11% 6%Operating Margin 9.8% 1.3% 1.0% 2.0%Debt Service Ratio 4.0% 6.0% 7.6% 7.5%Primary Reserve Ratio 23% 23% 22.1% 20.0%
Sustainability
FY 2010 FY 2014 FY 2015 FY 2020 GOALSTARS Points (Sustainability, Tracking, Assessment & Rating System) 53.9 65STARS Rating Silver GoldNet GHG Scope 1+2 Emissions MT/1000 Gross SF 9.12 7.83 7.85 8.0Net GHG Scope 3 Emissions, MT per FTE 2.05 n/a 1.58 1.76
Sources of data: Offices of Institutional Research; Advancement; Budget and Financial Planning; Division of Online and Continuing Education; Vice Provost for Research; Office of Career Services; Honors College; Office of Sustainability.
Current Peers: Georgia State University, University of Maine, University of Maryland–Baltimore County, San Diego State University, Virginia Commonwealth University, University of Wisconsin–Milwaukee
rankings & recognition
KF/R
MG
/022016/1M
uml.edu