Embed Size (px)
Citation preview
Page 1D:\WP\PAPERS\P60.PS, November 17, 1995
Presented at the 1995 SPIE Conference on Mobile Robots, Philadelphia, October 22-26, 1995
UMBmark: A Benchmark Test for Measuring Odometry Errors in Mobile Robots
byJohann Borenstein and Liqiang Feng
The University of MichiganAdvanced Technologies Lab
1101 Beal Ave.Ann Arbor, MI 48109-2110
Corresponding author: Johann Borenstein
Ph.: (313) 763-1560Fax: (313) 944-1113
Email: [email protected]
ABSTRACT
This paper introduces a method for measuring odometry errors in mobile robots and for expressing theseerrors quantitatively. When measuring odometry errors, one must distinguish between (1) systematic errors,which are caused by kinematic imperfections of the mobile robot (for example, unequal wheel-diameters),and (2) non-systematic errors, which may be caused by wheel-slippage or irregularities of the floor.Systematic errors are a property of the robot itself, and they stay almost constant over prolonged periodsof time, while non-systematic errors are a function of the properties of the floor.
Our method, called the University of Michigan Benchmark test (UMBmark), is especially designed touncover certain systematic errors that are likely to compensate for each other (and thus, remain undetected)in less rigorous tests. This paper explains the rationale for the UMBmark procedure and explains theprocedure in detail. Experimental results from different mobile robots are also presented and discussed.Furthermore, the paper proposes a method for measuring non-systematic errors, called extended UMBmark.Although the measurement of non-systematic errors is less useful because it depends strongly on the floorcharacteristics, one can use the extended UMBmark test for comparison of different robots under similarconditions.
Keywords: mobile robots, dead-reckoning, odometry, errors, error correction, systematic errors, UMBmark,encoders

Page 2
1. INTRODUCTION
Odometry is the most widely used method for determining the momentary position of a mobile robot. Inmost practical applications odometry provides easily accessible real-time positioning information in-betweenperiodic absolute position measurements. The frequency at which the (usually costly and/or time-consuming)absolute measurements must be performed depends to a large degree on the accuracy of the odometrysystem. It is therefore important for practical mobile robot applications to be aware of the actual odometricaccuracy of the platform, in order to space the absolute position updates optimally.
The well known disadvantage of odometry is that it is inaccurate with an unbounded accumulation oferrors. Typical odometry errors will become so large that the robot's internal position estimate is totallywrong after as little as 10 m of travel [Caterpillar, 1991; Gourley and Trivedi, 1994]. For this reason, manyresearchers develop algorithms that estimate the position uncertainty of a odometry robot (e.g., [Crowleyand Reignier, 1992; Tonouchi et al., 1994; Komoriyah and Oyama, 1994; Rencken [1994]). With thisapproach each computed robot position is surrounded by a characteristic "error ellipse," which indicates aregion of uncertainty for the robot's actual position [Tonouchi et al., 1994; Adams et al., 1994]. Typically,these ellipses grow with travel distance, until an absolute position measurement reduces the growinguncertainty and thereby "resets" the size of the error ellipse. These error estimation techniques must rely onerror estimation parameters derived from observations of the vehicle's odometry performance. Clearly, theseparameters can take into account only systematic errors, because the magnitude of non-systematic errorsis unpredictable.
This paper introduces a method for the quantitative measurement of systematic odometry errors. Thismethod, called the University of Michigan Benchmark test (UMBmark), prescribes a simple testingprocedure designed to quantitatively measure the odometric accuracy of a mobile robot with just an ordinarytape measure. Section 2 presents a brief review of key-properties of typical odometry errors . Section 3describes a commonly used but flawed calibration method, here called the "uni-directional square path."Section 3 then discusses how these shortcoming can be overcome with the "bi-directional square path test,"which is the basis of UMBmark. Also discussed in Section 3 is a method for measuring non-systematicerrors, although this method is of limited use for practical applications. Section 4 presents experimentalresults for both methods.

deadre05.ds4, .wmf, 10/19/94
Page 3
Figure 1 : A typical differential-drive mobile robot.
2. CHARACTERISTICS OF ODOMETRY ERRORS
In this paper we will focus on differential-drive vehicles like the LabMate platform manufactured by [TRC] (see Fig. 1). Other kinematicarrangements, such as Ackerman steering (i.e., the typical configuration of almost all automobiles) or the synchro-drive (used in theCybermotion K2A and K3A platforms, as well as the Denning robots) may have different sources of errors.
In the differential-drive design of Fig. 1 incremental encoders are mounted onto the two drive motors to count the wheel revolutions.Using simple geometric equations, it is straight-forward to compute the momentary position of the vehicle relative to a known startingposition. This computation is called odometry. The basic odometry equations are given, for example, in [Crowley and Reignier, 1992] andin our companion paper included in these Proceedings, [Borenstein and Feng, 1995].
When investigating odometry errors, one should realize that there are two substantially different categories: (1) systematic and (2) non-systematic error sources. Below we list all relevant sources of odometry errors according to these two categories.
I. Systematic errors are caused by:
a. Unequal wheel diameters
b. Average of both wheel diameters differs from nominal diameter
c. Misalignment of wheels
d. Uncertainty about the effective wheelbase (due to non-point wheel contact with the floor)
e. Limited encoder resolution
f. Limited encoder sampling rate
II. Non-systematic errors are caused by:
a. Travel over uneven floors
b. Travel over unexpected objects on the floor
c. Wheel-slippage due to:
• slippery floors
• over-acceleration
• fast turning (skidding)
• external forces (interaction with external bodies)
• internal forces (e.g., castor wheels)
• non-point wheel contact with the floor
Systematic errors are particularly grave because they accumulateconstantly. On most smooth indoor surfaces systematic errors contribute much more to odometry errors than non-systematic errors.However, on rough surfaces with significant irregularities, non-systematic errors may be dominant.
Systematic errors are usually caused by imperfections in the design and mechanical implementation of a mobile robot. In the courseof over 12 years of experimental work with mobile robots we observed that in differential-drive robots, the two most notorious systematicerror sources are unequal wheel diameters and the uncertainty about the effective wheelbase. This opinion is reflected in the literature,where these two error sources are named most often [Borenstein and Koren, 1985; Crowley, 1989; Komoriya and Oyama, 1994; Everett,1995]. We will denote these errors E and E , respectively.d b
1) Unequal wheel diameters. Most mobile robots use rubber tires to improve traction. These tires are difficult to manufacture to exactlythe same diameter. Furthermore, rubber tires compress differently under asymmetric load distribution. Either one of these effects cancause substantial odometry errors.
2) Uncertainty about the wheelbase. The wheelbase is defined as the distance between the contact points of the two drive wheels ofa differential-drive robot and the floor. The wheelbase must be known in order to compute the number of differential encoder pulsesthat correspond to a certain amount of rotation of the vehicle. Uncertainty in the effective wheelbase is caused by the fact that rubbertires contact the floor not in one point, but rather in a contact area. The resulting uncertainty about the effective wheelbase can be onthe order of 1% in some commercially available robots.
An additional potentially significant error is what we call the scaling error E . E is the error caused by the average wheel-diameter Ds s avrg
differing from the nominal wheel-diameter D . The effect of E during straight line motion is quite clear: if, for example, D is largernom s avrg
than D , then the robot will always travel further than programmed. Similarly, when turning on the spot, the robot will turn too much ifnom
D is larger than D . Interestingly, we could not find reference to the scaling error E in the literature — perhaps because this error isav rg nom s
so obvious.

\designer\doe94\deadre30.ds4, deadre31.wmf, 06/21/95
Reference wall
Robot93o
Robot
Robot
Reference wall
Reference wall
\desi gner\doe94\deadre20.ds4, .wmf, 07/26/94
Page 4
Figure 2 : The effect of the two dominantsystematic odometry errors E and E . Noteb d
how both errors may cancel each other outwhen the test is performed in only onedirection.
Figure 3 : The unidirectional square pathexperiment.a. The nominal path.b. Either one of the two significant errors E or Eb d
can cause the same final position error.
However, even though E can be a significant error, E is exceedingly easy tos s
measure with just an ordinary tape measure. For this reason we will assume that Es
has been measured and corrected in software before any of the proceduresdescribed in this paper is performed. Once corrected in software, E is not as
dominant error, because E can be measured and corrected with an accuracy of 0.3-s
0.5% of full scale, even with an unsophisticated tape measure.
3. MEASUREMENT OF SYSTEMATIC ODOMETRY ER-RORS
In this section we introduce methods for isolating and measuring odometryerrors. We discuss two test sequences (benchmark tests), which allow theexperimenter to draw conclusions about the systematic odometric accuracy of therobot. A third variation, designed for non-systematic errors, is discussed at the endof this section.
The first benchmark test is called the "uni-directional square path" test. This test,or some variations of this test, have been mentioned in the literature [Cybermotion,1988; Komoriya and Oyama, 1994], but we will show that this test is unsuitable fordifferential drive vehicles. An "unsuitable" test in this context is a test that mightproduce a "perfect" score, even though the robot has potentially huge odometryerrors. To overcome the shortcomings of the uni-directional square path test, weintroduce in Section 3.2 the "bi-directional square path test," called "UMBmark."
3.1 The Uni-directional Square Path as a benchmark?
Figure 2a shows a 4×4 m uni-directional square path. The robot starts outat a position x , y , � , which is labeled START. The starting area should be0 0 0
located near the corner of two perpendicular walls. The walls serve as a fixedreference before and after the run: measuring the distance between three specificpoints on the robot and the walls allows accurate determination of the robot'sabsolute position and orientation.
The robot is programmed to traverse the four legs of the square path. Thepath will return the vehicle to the starting area, but, because of odometry andcontroller errors, not precisely to the starting position. Since this test aims atdetermining odometry errors and not controller errors, the vehicle does not needto be programmed to return to its starting position precisely — returningapproximately to the starting area is sufficient. Upon completion of the squarepath, the experimenter again measures the absolute position of the vehicle, usingthe fixed walls as a reference. These absolute measurements are then comparedto the position and orientation of the vehicle as computed from odometry data.The result is a set of return position errors caused by odometry and denoted �x,�y, and ��.
�x = x - x abs calc
�y = y - y (1)abs calc
�� = � - � abs calc
where
�x, �y, �� — Position and orientation errors due to odometry.
x , y , � — Absolute position and orientation of the robot.abs abs abs
x , y , � — Position and orientation of the robot as computed fromcalc calc calc
odometry.
The path shown in Fig. 2a comprises of four straight line segments and fourpure rotations about the robot's center point, at the corners of the square. Therobot's end position shown in Fig. 2a visualizes the dead-reckoning error.
Reference wall \designer\doe94\deadre30.ds4, deadre32.wmf, 09/28/94
xc.g.,cw/ccw1nM
n
i1
�xi ,cw/ccw
yc.g.,cw/ccw1nM
n
i1
�yi ,cw/ccw
Page 5
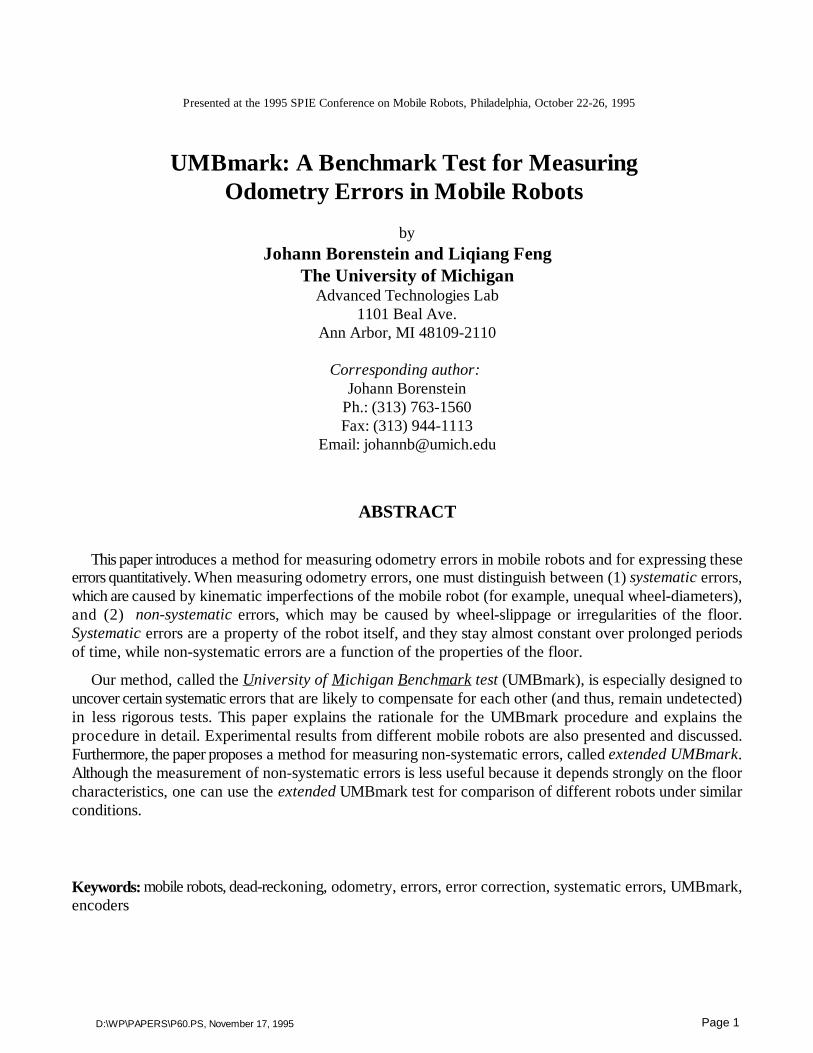
Figure 4 : The effect of the two dominant systematicodometry errors E and E : When the square path isb d
performed in the opposite direction one may find thatthe errors add up.
(2)
While analyzing the results of this experiment, the experimenter may draw two different conclusions: (1) The odometry error is the resultof unequal wheel diameters, E , as shown by the slightly curved trajectory in Fig. 2b (dotted line); or, (2) the odometry error is the resultd
of uncertainty about the wheelbase, E . In the example of Fig. 2b, E caused the robot to turn 87 instead of the desired 90 (dashedb bo o
trajectory in Fig. 2b).
As one can see in Fig. 2b, either one of these two cases could yield approximately the same position error. The fact that two differenterror-mechanisms might result in the same overall error may lead an experimenter toward a serious mistake: correcting only one of the twoerror sources in software. This mistake is so serious because it will yield apparently "excellent" results, as shown in the example in Fig. 3.In this example, we assume that the experimenter began "improving" performance by adjusting the wheelbase b in the control software. Forexample, it is easy to see that the experimenter needs only to increase the value of b to make the robot turn more in each nominal 90 turn.o
In doing so, the experimenter will soon have adjusted b to the "ideal" value that will cause the robot to turn 93 , thereby effectivelyo
compensating for the 3 orientation error introduced by each slightly curved (but nominally straight) leg of the square path. o
We should note that another popular test path, the "figure-8" path [Tsumura et al., 1981; Borenstein and Koren, 1985, Cox 1991] canbe shown to have the same shortcomings as the uni-directional square path.
3.2 The bi-directional square path experiment: "UMBmark"
The detailed example of the preceding section illustrates that the uni-directional square path experiment is unsuitable for testing odometryperformance, because it can easily conceal two mutually compensating odometry errors. To overcome this problem, we introduce the Bi-di rectional Square Path experiment, called University of Michigan Benchmark (UMBmark). UMBmark requires that the square pathexperiment is performed in both clockwise and counter-clockwise direction. Figure 4 shows that the concealed dual-error from the examplein Fig. 3 becomes clearly visible when the square path is performed in the opposite direction. This is so because the two dominantsystematic errors, which may compensate for each other when run in only one direction, add up to each other and increase the overall errorwhen run in the opposite direction.
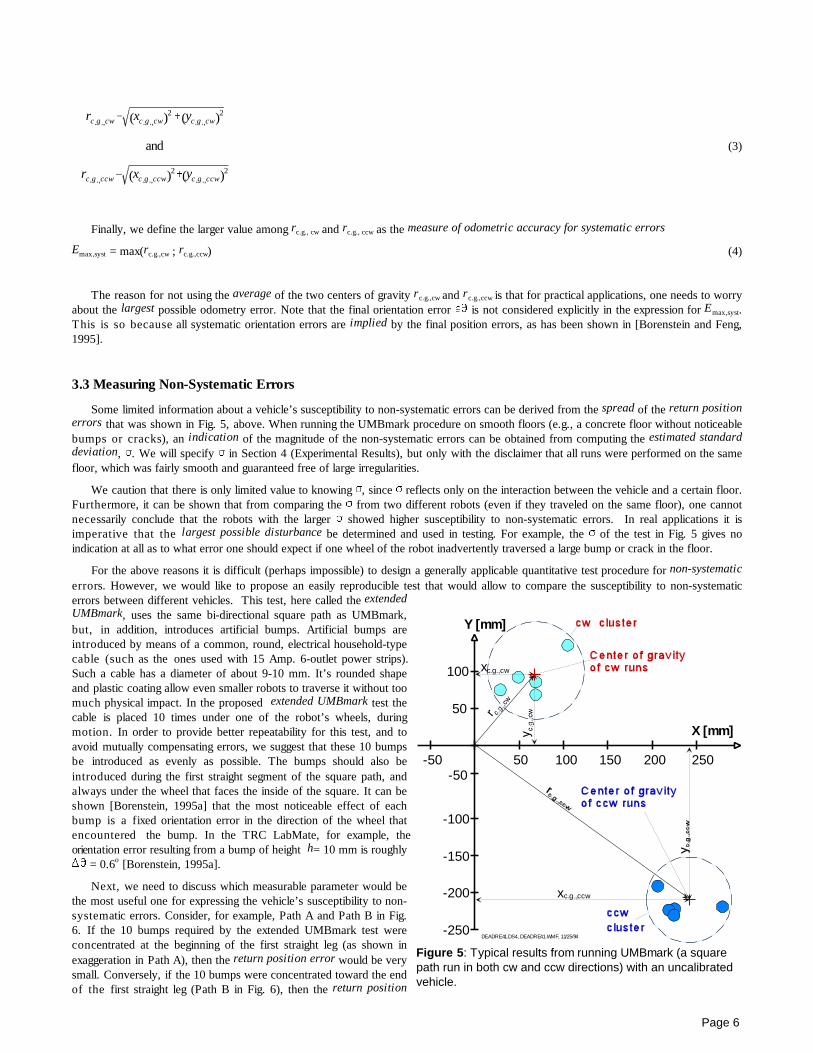
The result of the bi-directional square path experiment might look similar to the one shown in Fig. 5, which shows actual results withan off-the-shelf LabMate robot carrying an evenly distributed load. In this experiment the robot was programmed to follow a 4×4 m squarepath, starting at (0,0). The stopping positions for five runs each in clockwise (cw) and counter-clockwise (ccw) directions are shown inFig. 5. Note that Fig. 5 is an enlarged view of the target area. The results of Fig. 5 can be interpreted as follows:
a. The stopping positions after cw and ccw runs are clustered in two distinctareas.
b. The distribution within the cw and ccw clusters are the result of non-systematic errors, as mentioned in Section 2.2. However, Fig. 5 shows thatin an uncalibrated vehicle, traveling over a reasonably smooth concretefloor, the contribution of systematic errors to the total odometry error isnotably larger than the contribution of non-systematic errors.
After conducting the UMBmark experiment, one may wish to derive asingle numeric value that expresses the odometric accuracy (with respect tosystematic errors) of the tested vehicle. In order to minimize the effect of non-systematic errors, we suggest to consider the center of gravity of each clusteras representative for the odometry errors in cw and ccw directions.
The coordinates of the two centers of gravity are computed from theresults of Eq. (1) as
where n = 5 is the number of runs in each direction.
The absolute offsets of the two centers of gravity from the origin aredenoted r and r (see Fig. 5) and are given byc.g., cw c.g., ccw
rc.g.,cw (xc.g.,cw)2�(yc.g.,cw)2
and
rc.g.,ccw (xc.g.,ccw)2�(yc.g.,ccw)
2
X [mm]
-250
-200
-150
-100
-50
50
100
-50 50 100 150 200 250
Y [mm]
DEADRE41.DS4, DEADRE41.WMF, 11/25/94
xc.g.,ccw
xc.g.,cw
Page 6
(3)
Figure 5 : Typical results from running UMBmark (a squarepath run in both cw and ccw directions) with an uncalibratedvehicle.
Finally, we define the larger value among r and r as the measure of odometric accuracy for systematic errors c.g., cw c.g., ccw
E = max(r ; r ) (4)max,syst c.g.,cw c.g.,ccw
The reason for not using the average of the two centers of gravity r and r is that for practical applications, one needs to worryc.g.,cw c.g.,ccw
about the largest possible odometry error. Note that the final orientation error �� is not considered explicitly in the expression for E .max,syst
This is so because all systematic orientation errors are implied by the final position errors, as has been shown in [Borenstein and Feng,1995].
3.3 Measuring Non-Systematic Errors
Some limited information about a vehicle’s susceptibility to non-systematic errors can be derived from the spread of the return positionerrors that was shown in Fig. 5, above. When running the UMBmark procedure on smooth floors (e.g., a concrete floor without noticeablebumps or cracks), an indication of the magnitude of the non-systematic errors can be obtained from computing the estimated standarddeviation, ). We will specify ) in Section 4 (Experimental Results), but only with the disclaimer that all runs were performed on the samefloor, which was fairly smooth and guaranteed free of large irregularities.
We caution that there is only limited value to knowing ), since ) reflects only on the interaction between the vehicle and a certain floor.Furthermore, it can be shown that from comparing the ) from two different robots (even if they traveled on the same floor), one cannotnecessarily conclude that the robots with the larger ) showed higher susceptibility to non-systematic errors. In real applications it isimperative that the largest possible disturbance be determined and used in testing. For example, the ) of the test in Fig. 5 gives noindication at all as to what error one should expect if one wheel of the robot inadvertently traversed a large bump or crack in the floor.
For the above reasons it is difficult (perhaps impossible) to design a generally applicable quantitative test procedure for non-systematic
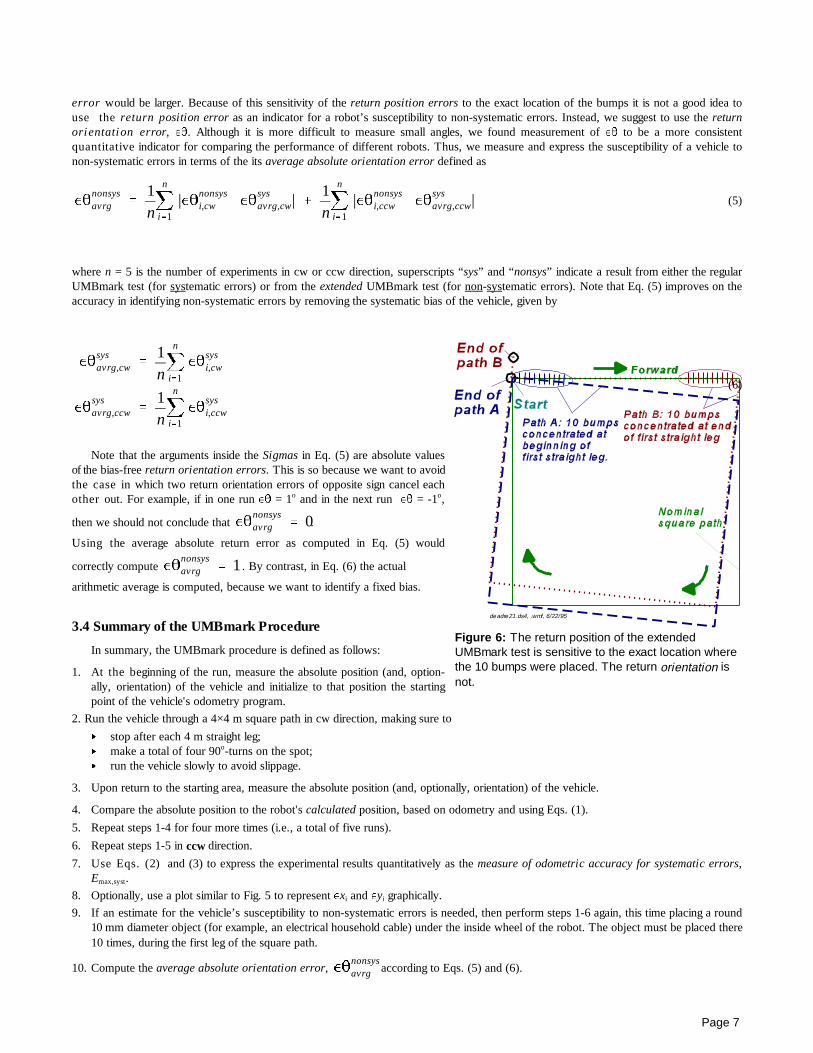
errors. However, we would like to propose an easily reproducible test that would allow to compare the susceptibility to non-systematicerrors between different vehicles. This test, here called the extendedUMBmark, uses the same bi-directional square path as UMBmark,but, in addition, introduces artificial bumps. Artificial bumps areintroduced by means of a common, round, electrical household-typecable (such as the ones used with 15 Amp. 6-outlet power strips).Such a cable has a diameter of about 9-10 mm. It’s rounded shapeand plastic coating allow even smaller robots to traverse it without toomuch physical impact. In the proposed extended UMBmark test thecable is placed 10 times under one of the robot’s wheels, duringmotion. In order to provide better repeatability for this test, and toavoid mutually compensating errors, we suggest that these 10 bumpsbe introduced as evenly as possible. The bumps should also beintroduced during the first straight segment of the square path, andalways under the wheel that faces the inside of the square. It can beshown [Borenstein, 1995a] that the most noticeable effect of eachbump is a fixed orientation error in the direction of the wheel thatencountered the bump. In the TRC LabMate, for example, theorientation error resulting from a bump of height h= 10 mm is roughly�� = 0.6 [Borenstein, 1995a]. o
Next, we need to discuss which measurable parameter would bethe most useful one for expressing the vehicle’s susceptibility to non-systematic errors. Consider, for example, Path A and Path B in Fig.6. If the 10 bumps required by the extended UMBmark test wereconcentrated at the beginning of the first straight leg (as shown inexaggeration in Path A), then the return position error would be verysmall. Conversely, if the 10 bumps were concentrated toward the endof the first straight leg (Path B in Fig. 6), then the return position
��nonsysavrg
1nM
n
i1
|��nonsysi,cw ��
sysavrg,cw| �
1nM
n
i1
|��nonsysi,ccw ��
sysavrg,ccw|
��sysavrg,cw
1nM
n
i1
��sysi,cw
��sysavrg,ccw
1nM
n
i1
��sysi,ccw
deadre21.ds4, .wmf, 6/22/95
��nonsysavrg 0
��nonsysavrg 1
��nonsysavrg
Page 7
(5)
(6)
Figure 6: The return position of the extendedUMBmark test is sensitive to the exact location wherethe 10 bumps were placed. The return orientation isnot.
error would be larger. Because of this sensitivity of the return position errors to the exact location of the bumps it is not a good idea touse the return position error as an indicator for a robot’s susceptibility to non-systematic errors. Instead, we suggest to use the returnorientation error, ��. Although it is more difficult to measure small angles, we found measurement of �� to be a more consistentquantitative indicator for comparing the performance of different robots. Thus, we measure and express the susceptibility of a vehicle tonon-systematic errors in terms of the its average absolute orientation error defined as
where n = 5 is the number of experiments in cw or ccw direction, superscripts “sys” and “nonsys” indicate a result from either the regularUMBmark test (for systematic errors) or from the extended UMBmark test (for non-systematic errors). Note that Eq. (5) improves on theaccuracy in identifying non-systematic errors by removing the systematic bias of the vehicle, given by
Note that the arguments inside the Sigmas in Eq. (5) are absolute valuesof the bias-free return orientation errors. This is so because we want to avoidthe case in which two return orientation errors of opposite sign cancel eachother out. For example, if in one run �� = 1 and in the next run �� = -1 ,o o
then we should not conclude that .
Using the average absolute return error as computed in Eq. (5) would
correctly compute . By contrast, in Eq. (6) the actual
arithmetic average is computed, because we want to identify a fixed bias.
3.4 Summary of the UMBmark Procedure
In summary, the UMBmark procedure is defined as follows:
1. At the beginning of the run, measure the absolute position (and, option-ally, orientation) of the vehicle and initialize to that position the startingpoint of the vehicle's odometry program.
2. Run the vehicle through a 4×4 m square path in cw direction, making sure to
� stop after each 4 m straight leg;� make a total of four 90 -turns on the spot;o
� run the vehicle slowly to avoid slippage.
3. Upon return to the starting area, measure the absolute position (and, optionally, orientation) of the vehicle.
4. Compare the absolute position to the robot's calculated position, based on odometry and using Eqs. (1).
5. Repeat steps 1-4 for four more times (i.e., a total of five runs).
6. Repeat steps 1-5 in ccw direction.
7. Use Eqs. (2) and (3) to express the experimental results quantitatively as the measure of odometric accuracy for systematic errors,E . max,syst
8. Optionally, use a plot similar to Fig. 5 to represent �x and �y graphically.i i
9. If an estimate for the vehicle’s susceptibility to non-systematic errors is needed, then perform steps 1-6 again, this time placing a round10 mm diameter object (for example, an electrical household cable) under the inside wheel of the robot. The object must be placed there10 times, during the first leg of the square path.
10. Compute the average absolute orientation error, according to Eqs. (5) and (6).

Page 8
Name of vehicleor configuration
Tested Platform Result in [mm]
Platform Name Modification Calibration E max,syst )
1. TRC-nomod/nocal
TRC LabMate none none(b=340.0, D /D =1)R L
310 50
2. TRC-3loop/nocal
TRC LabMate 3 loops of masking tapeon right wheel
none(b=340.0, D /D =1)R L
423 31
3. TRC-nomod/docal
TRC LabMate none yes (b=337.2,D /D =1.00121)R L
26 32
4. TRC3loop/docal
TRC LabMate 3 loops of masking tapeon right wheel
yes(b=337.1,D /D =1.00203)R L
20 49
5. CLAPPER University ofMichiganCLAPPER
4-DOF vehicle, madefrom 2 TRCswith compliant link
yes22 11
6.Cybermotion CybermotionK2A
Slightly worn-out, inservice since 1987
Original, from manufacturer
63 60
Table I: Summary of properties and UMBmark results for the six different vehicles tested
Figure 7: One of the four TRC LabMates at theUniversity of Michigan. The system shown here isequipped with 8 ultrasonic sensors that were not usedin the UMBmark experiment.
4. EXPERIMENTAL RESULTS
In this section we present experimental results from testing three different mobile robot platforms with the UMBmark procedure. Theplatforms were the TRC LabMate, the Cybermotion K2A, and a unique 4-degree-of-freedom (4-DOF) platform developed at the Universityof Michigan, called CLAPPER [Borenstein, 1994, 1995a, 1995b]. The TRC platform was modified in four different ways, resulting in fourdifferent odometry characteristics. We will treat these four different characteristics as though they were different vehicles. Table I belowsummarizes the properties of the six different vehicles that were tested, and the following sections discuss each vehicle and result in detail.
4.1 TRC-nomod/nocal
This configuration represents the basic TRC LabMate, without kinematic modifications and without any special calibration (i.e., usingthe nominal wheelbase b=340 mm and a wheel diameter ration of D /D = 1.000). The LabMate shown in Fig. 7 is equipped with ultrasonicR L
sensors that were not used in this experiment. An onboard 486/50 MHZ PC compatible single board computer controls the LabMate. Onour LabMate platforms we bypass TRC's original onboard control computer completely. This is done by means of a set of two HCTL1100 [Hewlett Packard] motion control chips that connect our 486 computer directly to the motors' PWM amplifiers. Generally we do thisin order to achieve a very fast control loop, one that is not impeded by the relatively slow serial interface required by the original onboardcomputer. In the particular case of the UMBmark experiments described here, the bypass assures that the measurements are not affectedby the manufacturer's odometry method and, possibly, software-embedded calibration factors. However, we emphasize that our bypassof the original onboard computer is in no way necessary for performing the UMBmark procedure.
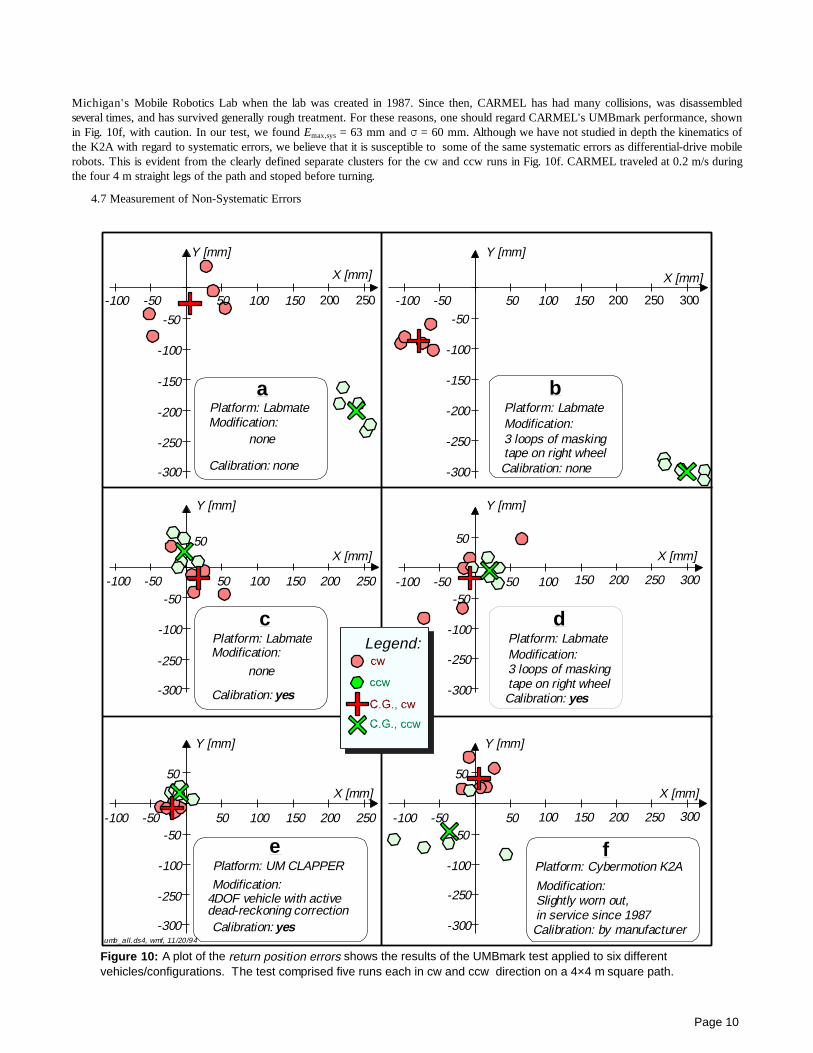
In the 4×4 m square path experiments, the robot traveled at 0.2 m/sduring the four 4 m straight legs of the path and stopped before turning.During the four on-the-spot turns the robot's wheels had a maximum linearspeed of ±0.2 m/s. Figure 10a shows the return position errors (defined inSection 3.1.) for the unmodified/ uncalibrated TRC LabMate. In this testE = 310 mm and ) = 50 mm.max,sys
4.2 TRC-3loop/nocal
In this configuration we modified the kinematic characteristics of theoriginal LabMate by winding three loops of masking tape around the rightwheel. The tape increased the diameter of the wheel and may or may nothave changed the effective wheelbase of the vehicle. Figure 10b shows thereturn position errors for the TRC-3loop/nocal configuration. In this testE = 423 mm and ) = 31 mm.max,sys

Page 9
Figure 8: The CLAPPER is a unique 4-DOF mobile robotdeveloped at the University of Michigan. The CLAPPER canmeasure and correct non-systematic odometry errors duringmotion.
Figure 9: CARMEL, the University of Michigan'soldest mobile robot, has been in service since1987.
4.3 TRC-nomod/docal
In this configuration the LabMate's two main odometry parameters (i.e., the wheel-diameter ratio, and the effective wheelbase) had beencalibrated before the run. As we mentioned above, such calibration is often performed in a trial-and-error fashion, in an attempt to improveoverall odometry performance. In our case here, we used the calibration technique described in our companion paper included in theseProceedings [Borenstein and Feng, 1995]. The correction factors used for calibration were b=337.2 mm (instead of the nominal b = 340nom
mm) and D /D =1.00121. Note that a vehicle with properly implemented calibration factors acts (with respect to odometry) like a totallyR L
different vehicle. The results of the UMBmark test with this configuration are shown in Fig. 10c. In this test E = 26 mm andmax,sys
) = 32 mm.
4.4 TRC-3loop/docal
In this configuration we used the same modification as in Section 4.2 above: 3 loops of masking tape wound onto the right wheel.However, this time the vehicle was calibrated, using the procedure described in [Borenstein and Feng, 1995]. The correction factors usedfor calibration were b=337.1 mm (instead of the nominal 340 mm) andD /D =1.00203. The results of the UMBmark test with this configura-R L
tion are shown in Fig. 10d. In this test E = 20 mm and ) = 49 mm.max,sys
4.5 CLAPPER
The Compliant Linkage Autonomous Platform with PositionError Recovery (CLAPPER) is a 4-Degree-of-Freedom (4DOF)vehicle developed and built at the University of Michigan (see Fig. 8).The CLAPPER comprises two off-the-shelf TRC LabMates (herecalled "trucks") connected by a so-called compliant linkage. Thevehicle is instrumented with two rotary absolute encoders that measurethe rotation of the trucks relative to the compliant linkage. And a linearencoder measures the relative distance between the centerpoints of thetwo trucks. The CLAPPER has the unique ability to measure andcorrect non-systematic odometry errors during motion. The systemalso corrects the systematic odometry errors discussed in this paper(i.e., unequal wheel-diameters and uncertainty about the effectivewheelbase). However, the CLAPPER also introduces some newsystematic errors related to its unique configuration [Borenstein, 1994;1995a, 1995b]. These new systematic errors were reduced by extensivetrial-and-error calibration before running the UMBmark test. Figure 10eshows the results of the UMBmark test with the CLAPPER. In thistest E = 22 mm and ) = 11 mm . Note that ) = 11 mm ismax ,sys
substantially lower than the results for the other vehicles. This factdemonstrates the successful correction of non-systematic errors.
We should note that the test path for the CLAPPER was of rectangularshape with 7×4 m dimensions. The vehicle also made some additional maneuversin order to approach the stopping position properly (see [Borenstein, 1995] fordetails). The CLAPPER's average speed was 0.45 m/s and the vehicle did notcome to a complete halt before turns. These deviations from the UMBmarkspecifications are of little impact for a well calibrated system, and they didprobably not improve the CLAPPER's UMBmark performance.
4.6 Cybermotion
The Cybermotion K2A platform is a very smart implementation of thesynchro-drive (see [Everett, 1995] for a more detailed discussion on synchro-drives). We believe that the implementation of the synchro-drive on theCybermotion K2A provides the inherently best odometry performance amongall commonly used mobile robot drive kinematics. This is especially true withregard to non-systematic errors. For example, if the K2A encounters a bump onthe ground, then the wheel in contact with the bump would have to turn slightlymore than the other two wheels. However, since all the wheels are powered bythe same motor and have the same speed, the wheel on the bump will slip (atleast, this is more likely than to assume that both other wheels on the ground willslip). Thus, if slippage occurs in the wheel that is "off," then the odometryinformation from the "correct" wheels remains valid, and only a small error (if atall) is incurred.
The Cybermotion K2A platform shown in Fig. 9 is called CARMEL.CARMEL was the first robot to be placed into service at the University of
X [mm]
-100
-50
50
-100 -50 50
X [mm]
-300
-250
-200
-150
-100
-50-100 -50 50 100 150
-50
50
-100 -50
-100
X [mm]
-100
-50
50
-100 -50 50 100 150
X [mm]
-250
-200
-150
-100
-50
-100 -50 50 100 150
200 250 300200 250
Y [mm]
X [mm]
-100
-50
50
-100 -50 50 100
Y [mm]
Y [mm] Y [mm]
Y [mm] Y [mm]
50 100 150
150
100 150
umb_all.ds4, wmf, 11/20/94
-300
-300
-250-250
-300
-300
-250-250
-300
X [mm]
200 250 300200 250
Legend:
Platform: Labmate
Calibration: none
Platform: Labmate
Calibration: none
Modification:3 loops of maskingtape on right wheel
a b
Platform: Labmate
Calibration: yes
cPlatform: Labmate
Calibration: yes
Modification:3 loops of maskingtape on right wheel
d
Modification:none
Modification: none
Platform: UM CLAPPER
Calibration: yes
ePlatform: Cybermotion K2A
Calibration: by manufacturer
Modification:Slightly worn out,in service since 1987
f
4DOF vehicle with activedead-reckoning correction
Modification:
250 300200 250 200
Page 10
Figure 10: A plot of the return position errors shows the results of the UMBmark test applied to six differentvehicles/configurations. The test comprised five runs each in cw and ccw direction on a 4×4 m square path.
Michigan's Mobile Robotics Lab when the lab was created in 1987. Since then, CARMEL has had many collisions, was disassembledseveral times, and has survived generally rough treatment. For these reasons, one should regard CARMEL's UMBmark performance, shownin Fig. 10f, with caution. In our test, we found E = 63 mm and ) = 60 mm. Although we have not studied in depth the kinematics ofmax,sys
the K2A with regard to systematic errors, we believe that it is susceptible to some of the same systematic errors as differential-drive mobilerobots. This is evident from the clearly defined separate clusters for the cw and ccw runs in Fig. 10f. CARMEL traveled at 0.2 m/s duringthe four 4 m straight legs of the path and stoped before turning.
4.7 Measurement of Non-Systematic Errors

��nonsysi,cw
��nonsysi,ccw
��sysavrg,cw
��sysavrg,ccw
��nonsysavrg
��nonsysi,cw/ccw
��nonsysavrg
��sysavrg,cw ��
sysavrg,ccw
Page 11
Return Orientation Errors [ ]o
TRCLabMate
Cyber-motion
U of MCLAPPER
0.28 3.77 -0.2
-2.03 0.97 -0.14
cw 1 7.10 7.78 0.10
cw 2 6.40 4.17 0.10
cw 3 5.60 1.72 0.10
cw 4 6.60 4.23 -0.70
cw 5 5.90 3.55 0.20
ccw 1 -7.50 -11.35 -0.60
ccw 2 -8.80 -2.48 -0.40
ccw 3 -6.60 -4.61 -0.50
ccw 4 -8.80 -6.34 0.10
ccw 5 -8.70 -2.31 0.20
8.35 3.91 0.35
Table II: Experimental results of non-systematic error measurementswith the extended UMBmark test.
In this section we present results of measurements of non-systematic errors using the extended UMBmark test (explained inSection 3.3). Table II lists the results for the three robots thatwere tested. As explained in Section 3.3, ten 10-mm bumps wereintroduced during the first leg of each run. The resulting return
orientation errors (5 each in cw and ccw direction)
are shown in Table II. The average return orientation error
was computed according to Eq. (5). Note that this
computation requires the average of the systematic return
orientation errors, and , in order to remove
the systematic bias from the result of the non-systematic errortests, as shown in Eq. (5). The results in Table II show that theCybermotion with its inherently resilient synchro-drive is only halfas sensitive to non-systematic errors than the LabMate. However,the CLAPPER with active error correction is one order ofmagnitude less sensitive than the Cybermotion.
5. CONCLUSIONS
This paper proposes a benchmark test for the quantitativemeasurement of odometry errors in mobile robot. This test, calledUMBmark, assures that different dead-reckoning errors don'tcompensate for each other, as may be the case with otherodometry tests. The UMBmark procedure yields a single numericvalue, E , that represents a quantitative measure of a vehicle'smax,sys
systematic odometry errors. This makes the UMBmark test aneffective tool for evaluating or tuning different odometry parame-ters of a vehicle, and for the comparison of odometry perfor-mance between different mobile robots.
Six different vehicles (or vehicle configurations) were testedwith the UMBmark test and the results were discussed. TheUMBmark test clearly shows how well each vehicle performed with respect to odometry. Results of the UMBmark test are meaningful— whether presented as a graph of return position errors or as a single numeric quantity, E . The standard deviation ) of eachmax,sys
of the two sets (cw and ccw) of raw-data collected from the UMBmark test can be used as a rough indicator for a vehicle'ssusceptibility to non-systematic odometry errors. However, because of the nature of non-systematic errors one should not use ) asan estimate for non-systematic errors, except when relatively smooth floors without major irregularities can be assumed.
An additional test, called the extended UMBmark test, was also discussed in this paper. The extended UMBmark test is designedto measure a vehicle’s susceptibility to non-systematic errors. This test is of limited utility, because non-systematic errors depend toa large degree on floor characteristics. However, the extended UMBmark test can be used to compare the performance of differentvehicles under the same test conditions.
Acknowledgments:
This research was funded in part by NSF grant # DDM-9114394 and in part by Department of Energy Grant DE-FG02-86NE37969.
6. REFERENCES
1. Adams, M. et al., 1994, "Control and Localization of a Post Distributing Mobile Robot." 1994 International Conference onIntelligent Robots and Systems (Laos '94). München, Germany, September 12-16, pp. 150-156.
2. Borenstein, J. and Koren, Y., 1985, "A Mobile Platform For Nursing Robots." IEEE Transactions on Industrial Electronics,Vol. 32, No. 2, pp. 158-165.

Page 12
3. Borenstein, J., 1994, "The CLAPPER: a Dual-drive Mobile Robot With Internal Correction of Dead-reckoning Errors."Proceedings of the 1994 IEEE International Conference on Robotics and Automation, San Diego, CA, May 8-13, pp. 3085-3090.
4. Borenstein, J., 1995a, "Internal Correction of Dead-reckoning Errors With the Compliant Linkage Vehicle." Journal of RoboticSystems, vol. 12, no. 4, April, pp. 257-273.
5. Borenstein, J., 1995b, "The CLAPPER: A Dual-drive Mobile Robot With Internal Correction of Dead-reckoning Errors." VideoProceedings of the 1995 IEEE International Conference on Robotics and Automation, Nagoya, Japan, May 21-27.
6. Borenstein, J. and Feng. L, 1995, "Correction of Systematic Odometry Errors in Mobile Robots." Proceedings of the 1995International Conference on Intelligent Robots and Systems (IROS '95), Pittsburgh, Pennsylvania, August 5-9, pp. 569-574.
7. CATERPILLAR, 1991, Product Literature, SGV-1106/91, Caterpillar Self Guided Vehicle Systems, Mentor, OH.
8. Cox, I. J., 1991, "Blanche — An Experiment in Guidance and Navigation of an Autonomous Robot Vehicle." IEEE Transactionson Robotics and Automation, vol. 7, no. 2, April, pp. 193-204.
9. Crowley, J. L., 1989, "Asynchronous Control of Orientation and Displacement in a Robot Vehicle." Proceedings of the 1989IEEE International Conference on Robotics and Automation. Scottsdale, Arizona, May 14-19, pp. 1277-1282.
10. Crowley, J.L. and Reignier, P., 1992, "Asynchronous Control of Rotation and Translation for a Robot Vehicle." Robotics andAutonomous Systems, Vol. 10, 1992, pp. 243-251.
11. Cybermotion, 1987, "K2A Mobile Platform." Commercial Sales Literature, 5457 JAE Valley Road, Roanoke, VA 24014.
12. Everett, H.R., 1995, "Sensors for Mobile Robots," A K Peters, Ltd., Wellesley, MA.
13. Gourley, C. and Trivedi, M., 1994, "Sensor Based Obstacle Avoidance and Mapping for Fast mobile Robots." Proceedingsof the 1994 IEEE International Robotics and Automation, San Diego, CA, May 8-13, pp. 1306-1311.
14. Hewlett Packard, "Optoelectronics Designer's Catalog, 1991-1992."
15. Komoriya, K. and Oyama, E., 1994, "Position Estimation of a Mobile Robot Using Optical Fiber Gyroscope (OFG)."International Conference on Intelligent Robots and Systems (IROS '94). München, Germany, September 12-16, pp. 143-149.
16. Rencken, W. D., 1994, "Autonomous Sonar Navigation in Indoor, Unknown, and Unstructured Environments."1994International Conference on Intelligent Robots and Systems (IROS '94). München, Germany, September 12-16, pp. 431-438.
17. Tonouchi, Y., Tsubouchi, T., and Arimoto, S., 1994, "Fusion of Dead-reckoning Positions With a Workspace Model for aMobile Robot by Bayesian Inference." International Conference on Intelligent Robots and Systems (IROS '94). Munich,Germany, September 12-16, pp. 1347-1354.
18. TRC (Transition Research Corporation), Shelter Rock Lane, Danbury, CT, 06810-8159.
19. Tsumura T., Fujiwara, N., Shirakawa, T. and Hashimoto, M., 1981, "An Experimental System for Automatic Guidance ofRoboted Vehicle Following the Route Stored in Memory." Proc. of the 11th Int. Symp. on Industrial Robots, Tokyo pp. 180-193.


![Edinburgh Research Explorer · and evaluation criteria for the stereo, optical flow, visual odometry and 3D object recognition. The ICL-NUIM dataset [6] and TUM RGB-D benchmark [7]](https://img.pdfslide.net/doc/110x75/5f4ddfcde209cf18167df669/edinburgh-research-explorer-and-evaluation-criteria-for-the-stereo-optical-iow.jpg)