Embed Size (px)
Citation preview

UML profiles for non-functional properties at work:analyzing reliability, availability and performance ?
Luca Berardinelli†, Simona Bernardi§, Vittorio Cortellessa† and Jose Merseguer‡
† Dipartimento di Informatica, Universita dell’Aquila, Italy{luca.berardinelli,vittorio.cortellessa}@univaq.it
§ Dipartimento di Informatica, Universita di Torino, Italy{bernardi}@di.unito.it
‡ Departamento de Informatica e Ingenierıa de Sistemas,Universidad de Zaragoza, Spain{jmerse}@unizar.es
Abstract. The modeling and validation of Non-Functional Properties (NFPs) isa crucial task for software systems to satisfy user expectations then for softwareprojects to succeed. Nevertheless this research field still suffers the heterogene-ity of hermetic approaches aiming to the modeling and validation of one singlenon-functional property without sharing information among them and loosingthe view of the system as a whole. In this paper we present preliminary resultson modeling and analysis of different NFPs starting from a single UML model,suitably extended with profiles like MARTE and DAM. To support the validity ofmodeling we show how the approach allows the derivation of Petri Net, QueuingNetwork and Fault Tree models for analyzing, respectively, availability, perfor-mance and reliability indices of a software system under development.
Keywords: UML, Availability, Performance, Reliability.
1 Introduction
Although it is acknowledged that the importance of non-functional properties (NFPs)is at least the same as the functional ones, there is nonetheless a large path to walk forNFPs modeling and analysis to gain the maturity of the functional ones. In this path,it has been identified that the integration of various non-functional system propertiesinto a unified representation would be an asset and likely a must. Such representationwould not only favor the NFP modeling but also support further reasoning about suchproperties. This paper tries to be one step ahead in this direction by showing that it isfeasible to model and analyze different NFPs within the same framework. In particularwe focus on dependability [6] and performance [14] properties.
The standard profile for Modeling and Analysis of Real Time and Embedded sys-tems (MARTE) [3] has enabled UML to the specification and analysis of NFPs in termsof performance attributes. Later, the non-standard profile for Dependability Analysis
? This work has been partly supported by the Italian Project PACO (Performability- Aware Com-puting: Logics, Models, and Languages) funded by MIUR.

and Modeling (DAM) [10] accomplished the same tasks for dependability attributes.Indeed, being DAM a MARTE specialization, these profiles can be together used toannotate NFPs in UML models to jointly describe their performance and dependabilityproperties, metrics and input parameters.
In particular, DAM follows the proposal in [6] and allows one to express differentdependability properties: reliability, availability, maintainability and safety. MARTEand DAM were jointly used in [10] for the modeling of fault tolerance mechanismssuch as replication, where it has also been shown how to analyze availability systemproperties.
In this paper, we introduce a case study in the eHealth domain that needs to be as-sessed for availability, reliability and performance. We work on this case study to pro-duce, with the support of MARTE and DAM together, a unified design that accounts forall these properties. Moreover, once the design is obtained, we describe how to extractanalyzable non-functional models from it. Concretely, Petri Nets [5] for availability,Fault Trees [20] for reliability and Queuing Networks [15] for performance.
In the remainder of this section we recall some important aspects of MARTE andDAM which are necessary to understand the rest of the work. Section 2 will presentthe UML design of the eHealth system. Sections 3, 4 and 5 will respectively describeeach domain (reliability, availability and performance), some of the MARTE and DAMmodeling peculiarities and the analysis of the model generated from the annotated UMLmodel of the case study. Finally in Section 6 we discuss the existing literature and weconclude the paper.
1.1 Background on MARTE and DAM
MARTE is a UML lightweight extension (i.e., through the use of UML stereotypes andtagged-values) to support the modeling and analysis of systems that need to verify tim-ing constraints. In particular, MARTE allows one to specify non-functional properties(NFPs) according to a well-defined Value Specification Language (VSL) syntax. DAMis a MARTE specialization. Hence a MARTE/DAM annotation stereotypes a designmodel element in the way UML proposes, i.e. by extending its semantics.
The DAM profile supports the specification of dependability properties and require-ments, such as reliability, availability, maintainability and safety. It can be used alsoto characterize the threats affecting the system components and services (i.e., faults,errors, failures and hazards) and their relationships (e.g., error propagation and cause-effect relationship between threats) and, for repairable systems, the recovery strategies.Both qualitative and quantitative information can be specified with the use of tagged-values, for example, regarding the threats characterization, the component/service fail-ure modes and the probability of error propagation between two interacting compo-nents, respectively 1.
The entire set of MARTE stereotypes can be found in [3], while the DAM stereo-types, as well as the set of UML meta-classes that the stereotypes can be applied to, canbe found in [9].
1 Concerning the latter, i.e. error propagation, we note that currently DAM allows the specifi-cation of a very basic model, however we are investigating how to represent more complexones.

<<stereotype>>DAM::DaComponent
fault: DaFault....
<<tupleType>>DAM_Library::ComplexDA_Types::
DaFailure
occurenceRate: DaFrequency.....
<<tupleType>>DAM_Library:ComplexDA_Type::
DaFault
occurrenceRate: DaFrequencyoccurrenceProb: NFP_Realpersistency: Persistencyduration: NFP_Duration.....
<<stereotype>>DAM::DaVariant
multiplicity: NFP_Integer
<<stereotype>>DAM::DaSpare
dormancyFactor: NFP_Real....
<<stereotype>>DAM::DaStep
kind: StepKindrecovery: DaRecoveryfailure: DaFailure..... <<stereotype>>
DAM::DaService
ssAvail:NFP_PercentageexecProb:NFP_Real....
<<stereotype>>GaWorkloadEvent
pattern: ArrivalPattern....
<<stereotype>>GaStep
hostDemand: NFP_Duration
prob: NFP_Real ....
<<stereotype>>DAM::DaConnector
fault: DaFault....
(a)
(b)
(c)
Fig. 1. (a) MARTE stereotypes (b) DAM stereotypes (c) DAM data types
Figure 1 depicts an excerpt of the MARTE and DAM stereotypes and tagged valuesused in this work. According to UML, each stereotype is made of a set of tags whichdefine its properties. For example, DaService stereotype has ssAvail and execProb astags. The former is used to specify the steady state availability, and the latter to definethe probability of service execution. The types of tags are either basic UML types, orMARTE NFP types (such as NFP Integer) or complex dependability types (such asDaFault or DaFailure). The latter ones (see Figure 1(c)) are made of attributes that maybe MARTE NFP types or simple types.
MARTE NFP types are data-types of special importance since they enable descrip-tion of relevant NFP aspects using properties such as: value, a value or parameter name(prefixed by the dollar symbol); expr, a VSL expression; source, the origin of the NFP- e.g., a requirement (req), an input parameter (assm), an estimated (est) or measured(msr) parameter; and statQ, the type of statistical measure (e.g., maximum, minimum,mean).
2 The eHealth Case Study
We present in this section a case study in the context of an eHealth system that will bea leading example of this paper.
The system was developed in [19] and now is equipped with a Message Redun-dancy Service (MRS) taken from [10]. The goal of MRS is to provide availability andreliability capabilities to the original eHealth system.
The eHealth system aims to support doctor’s everyday activities, and the Use CaseDiagram (UCD) in Figure 2(a) summarizes these activities.
For instance, the dynamics of Make Prescription use case is modeled by theSequence Diagram (SD) in Figure 2(d). It considers that, after visiting the patient, thedoctor can make a prescription to be sent to the hospital (pharmacy) where eventuallythe patient will take (buy) the medicines. The doctor uses the component Clientinstalled in his/her PDA to effectively fill and send the prescription.

The Client component encrypts the prescription since it has to arrive to the targetreceiver free of viruses and malicious attacks. At this point, the MRS comes into play:it provides a Message Replicator (MR) component that can receive encryptedfiles to be scanned and delivered in trust.
For each file, MR creates a Redundancy Manager (RM) that replicates themessages and assigns each one to a Payload component for the actual scanning. In-deed, each RM creates $N Payloads that will vote for the file integrity. The RM willneed at least ($N/2) + 1 results or votes from the Payloads to decide if the file has tobe sent. In positive case, the RM decrypts the file and sends the prescription through asecure LAN (see Fig. 2(b)), otherwise the file is discarded.
The SD in Figure 2(e) models the dynamics of the RequestPatientInfoPagesuse case. The service allows the doctor to retrieve mixed media information on his/herpatients that combines text with or without different kinds of images that refer to theirpersonal data, their medical histories and patient-related diseases. The patient’s relatedpages are finally available on the doctor’s PDA.
Finally, the Deployment Diagram (DD) in Figure 2(b) depicts for each systemcomponent its actual location (e.g., the Client component deployed on the Doctor’sPDA).
It is interesting to remark some aspects. The database is linked to a secured LAN(Figure 2(b)), so to protect its records. However the image server is linked to the WANwhich is not secured. The components that make up the MRS (i.e. MR, RM and Pay-loads) are also deployed in nodes linked to the secured LAN. Moreover node0, theone hosting MR and RM, is backed up with a spare node1 to increase the systemavailability. Indeed MR and RM move to node1 whenever node0 fails.
Another aspect of interest is how the hardware Fault ($ft rateNode) attachedto node0 is propagated as a software Failure (see the Failure annotation in the MRstatechart): we keep the variable name $ft rateNode in both annotations to matchthe propagation. The rationale behind it is that when node0 is faulty then the softwareallocated on it (i.e. MR and RM) will get failing, as represented in case of MR by theDown state in its statechart.
Finally, note that in Figure 2(b) some components are replicated, for example thenodes hosting Payloads. We model this characteristic with the resMult tag, that inthis case accounts for $M * $N nodes. The default value for resMult is 1, so nodeswithout this tag will not be replicated.
3 Reliability Modeling and Analysis
In this section we show how to build a reliability model starting from the eHealth UMLmodel illustrated in Section 2.
As a target reliability model we have considered the one presented in [12], that is amodel that expresses the reliability on demand of a component-based system as a func-tion of: (i) the reliability of software components and connectors, (ii) the operational

Fig. 2. UML models of eHealth case study.

profile. In the latter the probability of invocation of use cases (each corresponding to aSD) and the number of invocations of components and connectors are included 2.
The probability of failure on demand in the original model is expressed as follows:
θS = 1−K∑
k=1
pk(N∏
i=1
(1− θi)bpik ·∏
(i,j)
(1− ψij)interact(i,j,k)) (1)
where:
– K is the number of system scenarios;– pk is the probability of execution of scenario k;– θS is the failure probability on demand of the whole system;– θi is the failure probability on demand of a software component i;– bpik is the number of busy periods (i.e. invocations) of component i within scenario
k;– N is the number of software components;– ψij is the failure probability on demand of a software connector between compo-
nents i and j;– interact(i, j, k) is the number of interactions between components i and j within
scenario k (i.e. the number of times the connector between these two componentsis used);
In [12] it has been illustrated how such model can be straightforwardly obtainedfrom annotated UML diagrams. However, in order to make more explicit the trans-formation, and also to produce a model based on a well-known reliability notation,equation (1) has been reformulated here as a Fault Tree [20].
A Fault Tree is a tree whose nodes are events and logical operators (i.e. AND, OR,NOT), and where the root contains an undesired effect. Each event that could causethis effect is added to the tree as a series of logic expressions. When fault trees arelabeled with failure probabilities (i.e. the probabilities of these causes to occur), thefailure probability of the root effect or any other intermediate event can be evaluated bysolving the fault tree.
Figure 3 shows the Fault Tree that has been obtained for the eHealth example andthat we use to illustrate the transformation step. Round boxes represent basic events thatcannot be split, whereas square boxes represent composite events. The remaining nodesrepresent logical operators.
2 In the original model [12] the reliability on demand can be intended either as a probabilitydistribution function (over the number of invocations) or as its expected value. For sake ofsimplicity, in this paper we only work with expected values.

eHealth System
<<DaService>>RequestPatientInfo <<DaService>>MakePrescription <<DaService>>RequestDoctorInfoComponents and connectors<<DaService>>execProb=0.56
<<DaComponent>>Client <<DaComponent>>MsgReplicator<<DaConnector>>WAN… …bp = 2 bp = 4…interact = 2
<<DaComponent>>RedundancyMgr…bp = f(N)
<<DaService>>execProb=0.26 <<DaService>>execProb=0.18Components and connectors Components and connectors
Fig. 3. The eHealth example Fault Tree.
The effect in the root of Figure 3 is the failure of the whole eHealth system. Suchfailure can be caused by a failure in any software component or connector under thehypothesis that component/connector failures are non-maskable and unrepairable. Thishypothesis undergoes the original model and has been simply inherited here. More com-plex reliability models can be considered, for example analytical models that take intoaccount error propagation, such as the one in [11]. However, in order to deal with amore complex reliability model our approach might only need to extend the DAM pro-file with the missing parameters (if any), so to make UML models ready to embed thoseannotations to produce more complex reliability models (see footnote in Section 1.1).
The second layer of the tree (from the top) includes all possible eHealth use cases,as modeled in the Use Case Diagram of Figure 2(a). Each (square) node at this layerrepresents the correct execution of the corresponding SD (i.e. the execution withoutfailures). The root is connected to the three nodes through a NOR operator because thesystem fails if some use case has not been correctly completed.
In the third layer of the tree, for sake of modeling the correct execution of each usecase two events are joined (through an AND operator) that are: (i) the invocation of theuse case and (ii) the correct execution of all components and connectors within the usecase. A round box in this layer represents the former event labeled with its probability(i.e. the probability of use case execution, as reported in the Use Case Diagram of Figure2(a)), whereas a square box represents the latter event as follows.
As illustrated in equation (1), the probability of correct execution of a use caseis the probability that none of components and connectors fails within the SD thatrepresents its dynamics. Therefore the three bottommost layers of Figure 3 representthe combination of correct executions of software components and correct interactions

over software connectors. Such further layers have been illustrated only for the MakePrescription use case, that is the one on which we have focused our analysis.
Note, however, that only components and connectors subject to failures have beenreported in the Fault Tree, because the remaining ones do not contribute to the usecase reliability. In particular, as illustrated in Figure 2(d), we assume that Payload andHospRec cannot fail, and also the user is not subject to failures while entering inputs.Besides, we have assumed that interactions among co-deployed components (such asMessage Replicator and Redundancy Manager) cannot fail because they are based onreliable shared memory, whereas remote interactions passing through the WAN are sub-ject to failures (see Figure 2(b)).
Finally, at the bottommost layer each component/connector is replicated for thenumber of times it is used within the SD, and such number is annotated (for sake ofreadability) under the corresponding element. Following equation (1), such number iscalled bp for components and interact for connectors. Such values are evaluated byprocessing the SD and simply counting the number of activations along the lifelineof each component (for bp), and the number of messages exchanged among pairs ofcomponents (for interact) 3 [12].
Once labeled all bottommost leaves with their failure probabilities (i.e. θi for thecomponents and ψij for the connectors), it is straightforward that the tree evaluationbrings in the root the failure probability of the whole system given by equation (1) 4.
In what follows, for sake of illustration, we show the analysis of the reliability of theMake Prescription use case, that is the probability associated to the square boxComponents and connectors corresponding to this use case. For tree construction, theprobability associated to this node is the reliability of this use case, which correspondsto the following expression
N∏
i=1
(1− θi)bpik ·∏
(i,j)
(1− ψij)interact(i,j,k) (2)
opportunely instantiated on the components and connectors shown in Figure 3. Inparticular, the expression that we obtain here is:
(1−θClient)2·(1−θMsgReplicator)4·(1−θRedundancyMgr)f(N)·(1−ψClient−MsgReplicator)2
(3)where bp and interact values have been obtained by parsing the SD in Figure 2(d).
The failure probabilities of components and connectors in expression (3) have been allannotated in the UML diagrams of Figure 2, therefore the transformation is completedby this last step of porting these annotations as parameters of the model. In detail, weobtain the following expression 5:
3 Note that the number of invocations of the Redundancy Manager has been expressed as afunction of N that is the loop parameter in the Make Prescription SD of Figure 2(d).
4 In order to maintain a tree structure, a single component/connector may appear multiple timesas a tree leave because it may be involved in multiple SDs. In this case its reliability value mustbe replicated overall instances.
5 The amount of busy periods have been calculated on the basis of loop iterations in the scenario.

(1−ft probPDA)2·(1−ft probNode)4·(1−ft probNode)5N/2+2.8·(1−ft probWAN)2
(4)For sake of consistency with the other types of analysis performed in this paper, we
have solved expression (4) for the following set of values: N = 3, ft probPDA =0.001, ft probNode = 0.00001. We have assigned three values to ft probWAN foranalyzing the sensitivity of the use case reliability to the failure probability of the WAN.The results are summarized in the following table:
WAN failure probability (ft probWAN ) Make Prescription reliability1 0
0.1 0.810.01 0.978
Table 1. Use case reliability vs WAN failure probability.
The first row of Table 1 is an obvious result due to the assumption that each failureis unmaskable and unrepairable, therefore if the WAN certainly fails then the whole usecase certainly fails. The second and third row provide an idea of use case reliabilitygrowth while growing the reliability of the WAN.
This provides a proof of concept that annotations introduced in the UML diagramsof Figure 2 are rich enough to generate a Fault Tree model and make a reliability anal-ysis of the system.
4 Availability Modeling and Analysis
One of the non-functional requirements of the eHealth system is related to the availabil-ity. In particular, considering the ssAvail tagged-value associated to the MakePrescrip-tion use case in Figure 2(a), the MakePrescription service should be available at least99% of the time.
We use the Generalized Stochastic Petri Nets (GSPN) [5] to assess the availabilityrequirement. A GSPN is a Stochastic Petri Net, where the set of transitions includeimmediate and timed transitions. Immediate transitions are depicted as black thin bars,timed ones are shown as white thick bars. The former fire in zero time and modellogic conditions, the latter are characterized by a firing rate (parameter of the negativeexponential distribution) and are used to model timed activities. Priority levels are alsoassigned to transitions (by default timed transitions have priority equal to zero) thatare used to solve the conflicts among immediate transitions. Transition weights areused to solve, probabilistically, the conflicts among immediate transitions with the samepriority.
The GSPN model of the eHealth system has been obtained by customizing theUML-to-GSPN transformation approach in [18] to the dependability analysis domain

and by considering the fault assumption specification in the Deployment Diagram (Fig-ure 2(b)). Currently, the derivation process has been manual but, as future work, weplan to make it automatic. The work [18] provides a formal semantics of UML statemachines (SMs) in terms of GSPNs and proposes a method to get a GSPN model froma set of performance-annotated UML SMs. The proposed semantics is compositional:the GSPN model of the system is obtained by composing the GSPN sub-models ofthe single SMs, by using standard Petri net operators. In the following, we focus onthe mapping of the DAM annotated SM, Figure 2(c), and Deployment Diagram, Fig-ure 2(b), onto the GSPN input parameters.
Client
e_SP2MR
Wait4Msg
Message ReplicatorIdle
e_ack
Wait4ack
e_ackπ=2
ftPDA
PDA fault-failurepropagation and recovery
recPDA upPDA
dwnPDA
e_reClient e_failClient
think
ClientDown
e_failClient
e_failCliente_reClient
WANDown1
WANDown2
e_SP2MR
result
ftprop_ack
ftprop_SP2MR
trOK1
trOK2
trKO2
ftDuration1
ftDuration2
e_failMR
e_failMR
π=2
ft_node
Node fault-failurepropagation and recovery
rec_node
up_node
dwn_node
e_failMR
MRDown
trKO1
(e) WAN communicationtransient fault - SP2MR
(f) WAN communicationtransient fault - ack
Legend (parameter specification)Transition Rate/Weight
ftPDAft_nodeftDuration1,ftDuration2reNoderePDAthinkresulttrKO1,trKO2trOK1,trOK2
ft_ratePDAft_rateNode1/ft_durWANre_rate1re_rate21/(3s.)
1/(0.5834s)ft_probWAN1-ft_probWAN
Type
EXPEXPEXPEXPEXPEXPEXPIMMIMM
e_recMR
(a)(b)
(c) (d)
e_recMR
Fig. 4. GSPN model for availability computation.
The GSPN model derived from the UML specification is shown in Figure 4: it con-sists of six subnets that communicate via interface places (striped places). The subnets(a,b) model the up/down states of the PDA and node0, respectively, due to the crash faultoccurrences affecting the nodes and the corresponding recovery actions. The firing ratesof the timed transitions ftPDA, subnet (a) and ft node, subnet (b), correspond to theinput parameters specified in the fault.occurrenceRate tagged-values associated to theDaComponent nodes (deployment diagram of Figure 2(b)). The transitions recPDAand rec node model the recovery actions undertaken in case of node crash. In par-ticular, the firing rate of the latter is set to the input parameter of the recovery.ratetagged-value specified in the DaStep transition of the MR state machine (Figure 2(c)).
The fault-failure propagation from the hw component node0 to the sw componentMR (failure.Fcause tag of the DaStep failure transition, in the MR state machine) aswell as the effect of the reallocation of the latter onto the spare node1 (map,onto tagsof the DaStep reallocation transition, in the MR state machine), are modeled by the
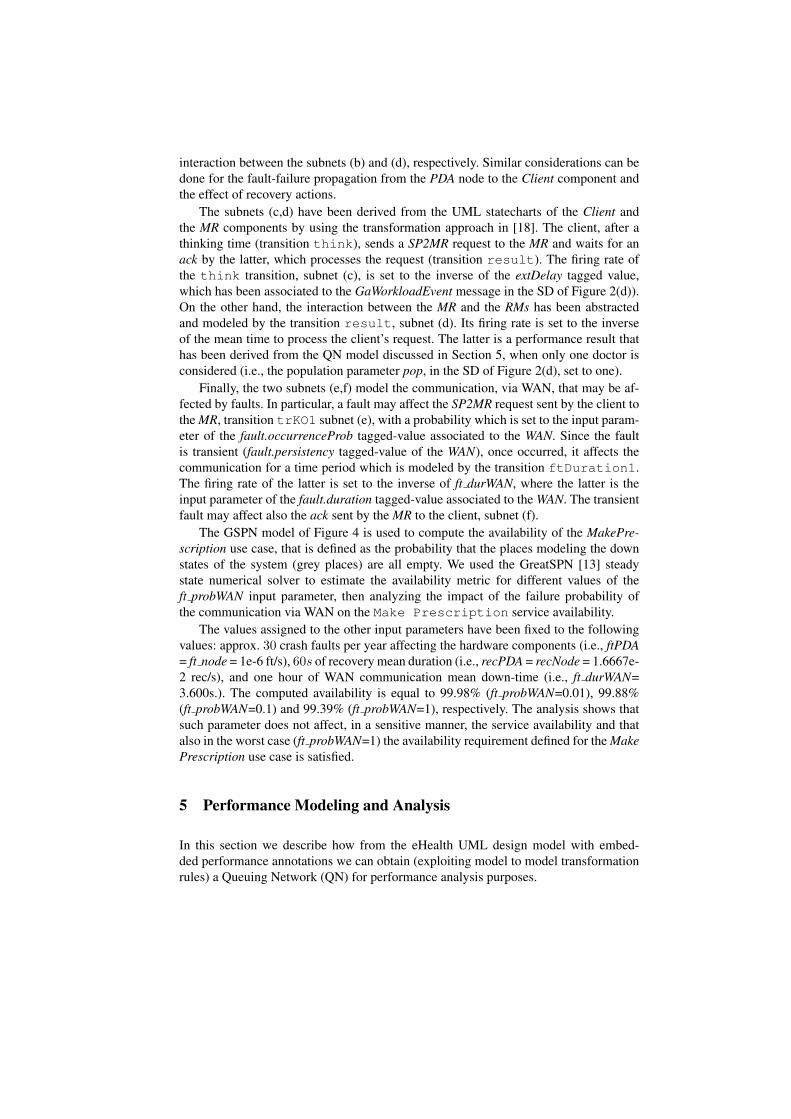
interaction between the subnets (b) and (d), respectively. Similar considerations can bedone for the fault-failure propagation from the PDA node to the Client component andthe effect of recovery actions.
The subnets (c,d) have been derived from the UML statecharts of the Client andthe MR components by using the transformation approach in [18]. The client, after athinking time (transition think), sends a SP2MR request to the MR and waits for anack by the latter, which processes the request (transition result). The firing rate ofthe think transition, subnet (c), is set to the inverse of the extDelay tagged value,which has been associated to the GaWorkloadEvent message in the SD of Figure 2(d)).On the other hand, the interaction between the MR and the RMs has been abstractedand modeled by the transition result, subnet (d). Its firing rate is set to the inverseof the mean time to process the client’s request. The latter is a performance result thathas been derived from the QN model discussed in Section 5, when only one doctor isconsidered (i.e., the population parameter pop, in the SD of Figure 2(d), set to one).
Finally, the two subnets (e,f) model the communication, via WAN, that may be af-fected by faults. In particular, a fault may affect the SP2MR request sent by the client tothe MR, transition trKO1 subnet (e), with a probability which is set to the input param-eter of the fault.occurrenceProb tagged-value associated to the WAN. Since the faultis transient (fault.persistency tagged-value of the WAN), once occurred, it affects thecommunication for a time period which is modeled by the transition ftDuration1.The firing rate of the latter is set to the inverse of ft durWAN, where the latter is theinput parameter of the fault.duration tagged-value associated to the WAN. The transientfault may affect also the ack sent by the MR to the client, subnet (f).
The GSPN model of Figure 4 is used to compute the availability of the MakePre-scription use case, that is defined as the probability that the places modeling the downstates of the system (grey places) are all empty. We used the GreatSPN [13] steadystate numerical solver to estimate the availability metric for different values of theft probWAN input parameter, then analyzing the impact of the failure probability ofthe communication via WAN on the Make Prescription service availability.
The values assigned to the other input parameters have been fixed to the followingvalues: approx. 30 crash faults per year affecting the hardware components (i.e., ftPDA= ft node = 1e-6 ft/s), 60s of recovery mean duration (i.e., recPDA = recNode = 1.6667e-2 rec/s), and one hour of WAN communication mean down-time (i.e., ft durWAN=3.600s.). The computed availability is equal to 99.98% (ft probWAN=0.01), 99.88%(ft probWAN=0.1) and 99.39% (ft probWAN=1), respectively. The analysis shows thatsuch parameter does not affect, in a sensitive manner, the service availability and thatalso in the worst case (ft probWAN=1) the availability requirement defined for the MakePrescription use case is satisfied.
5 Performance Modeling and Analysis
In this section we describe how from the eHealth UML design model with embed-ded performance annotations we can obtain (exploiting model to model transformationrules) a Queuing Network (QN) for performance analysis purposes.

The adopted approach (Software Architecture Performance analysis, SAP•one [17])for the performance modeling of a software system consists essentially in the generationof a QN model from an UML architectural one. SAP•one has been conceived to beapplied in the first phases of the software process to reveal architectural flaws as soonas possible, so the developer will be able to modify the system architecture.
The eHealth UML (sub-)model used for performance analysis consists of a staticand dynamic view given by the Component Diagram (CD, Figure 2(f)) and SequenceDiagram (SD, Figure 2(d)), respectively. These diagrams are enriched with additionalinformation about the system performance using the MARTE [3] profile (note that inthis case DAM annotations [10] are not necessary because MARTE was conceived forperformance purposes) as follows:
– The response time (the respT tag of the GaScenario stereotype) for SD ofinterest, see Figure 2(d);
– The scheduling policies for components (the schedPolicy tag of the GaExecHoststereotype) and service times for their operations (hostDemand tag of the PaStepstereotype), see Figure 2(f);
– The workload for the SD (the pattern tag of the GaWorkloadEvent stereo-type) and the probability to execute the optional fragments (prob tag of the PaStepstereotype), see Figure 2(d).
The peculiarity of this approach is that the service centers of the QN do not repre-sent hardware resources (such as disks or processors), but they represent the softwarecomponents of the system architecture. The (sub-)model made of CD and SD, then,represents a platform-independent model, and the performance indices that can be ob-tained do not underlie assumptions in the platform architecture. The only assumption isthat every software component will be placed on a logical device, and that all the de-vices will have the same processing rate but they can manage requests through queuesof different capacity and different scheduling policy. In practice, the SAP•one anal-ysis is comparative, in that the obtained performance values are useful to reveal badarchitectural choices.
The fundamental rule for transforming the UML design model into the QN analy-sis model defines one or more service centers (it depends on the resMult tag value)for each software component (CD, Figure 2(f)). The possible transitions among servicecenters (i.e. the QN topology) are obtained from the assembly connector between re-quired/provided interfaces of components. Finally the paths followed by entities acrossthe service centers (a distinct one for each SD) are derived from the order of mes-sages exchanged between lifelines in the SD (Figure 2(d,e)). The resulting QN modelis shown in Fig.5.
It is worth noting that the entity named (a) in the QN represents in the UML modelthe Doctor’s requests. The entities (b) and (c) represent the votes of the Payload and theprescription sent to the Hospital by the Redundancy Manager, respectively. Regardingthe number of Payloads, we have considered three in this model, which is enough for avoting algorithm to work.
The QN has been simulated using the Java Modeling Tools (JMT) [22], it was notpossible to carry out Mean Value Analysis (MVA) [15] due to the existence of forks

and joins. The simulation parameters were established with a confidence level of 0.9and an error equal to 0.1. Then we computed the response time ($RT variable in themodel) that the system needed to process a Doctor’s request for prescription. We setdifferent values for the population ($pop variable of stereotype GaWorkloadEventin Fig.2(d)), thus interpreting multiple requests from one or more Doctors. Table 5reports the results obtained.
Fig. 5. The QN Model
$pop $RT (sec.) $pop $RT (sec.)1 0.58333333 6 0.7480344892 0.61200189 7 0.7895218713 0.64261899 8 0.8327652104 0.67536272 9 0.8792668805 0.71042945 10 0.930278346
Table 2. Response times for Doctor’s prescriptions.
6 Discussion and conclusions
In this paper we have shown the adequacy of existing UML profiles to perform differentanalysis on the same case study. During this last decade, one of the major challengesof the researchers working on modeling and evaluation of computer-based systems hasbeen to produce, more or less automatically and systematically, formal models fromADL- and UML- based system descriptions to support the assessment of NFPs.

ADL-based approaches include, among all, AADL [2] and EAST-ADL [1]. AADLallows the derivation of different formal models (e.g. GSPN [21], Fault Trees, MarkovChains) from an extended AADL Dependability Model [21]. EAST-ADL instead isinstead a Domain Specific Language for the automotive systems domain that allowsone to define concepts and tools for system analysis. Then one of the goal of theATESST project [1] is the integration between MARTE and EAST-ADL concepts thathas already lead to the definition of an UML profile, similarly to what it was done forAADL[3].
In this work we are interested to UML-based approaches because, even after thestandardization of MARTE, they address either qualitative or quantitative evaluation.Moreover, most of them use a unique target formalism for the system assessment, hencethey only partially support the software engineers during the V&V activities.
Performance assessment approaches can be found in the survey [7], where it emergesthat only few efforts have been addressed to the exploitation of the information at theearly stages of the software lifecycle (i.e., requirements specification).
With regard to dependability assessment, the work in [10] classifies the differentapproaches according to a check-list of requirements that a dependability UML profileshould satisfy. Most of the surveyed works propose UML extensions to specify eitherreliability or safety properties, while less efforts have been devoted to availability [16]and maintainability [4].
However, almost all works propose transformation techniques from UML design todependability formal models such as: Stochastic Petri Nets, Fault Trees, probabilistictimed automata, Markov processes, or simple mathematical models.
All the previous approaches face the modeling and validation of one single non-functional property of the system in isolation. Our experiment has been instead aimed atshowing the integration of NFPs within a unique modeling language that is UML. Withthese preliminary results we have demonstrated that rich and opportunely integratedmodel annotations, i.e. the ones provided by DAM and MARTE together, are suffi-cient to separately derive different non-functional models. At the moment, the resultsprovided by our model solutions have not been related each other within the originalUML model, although relationships between the analysis models have been exploited.For example, the output index of the QN model (i.e. mean response time of the MakePrescription scenario) has been used as an input parameter of the GSPN model(i.e. mean time for MR component to process the request). However the UML modelsthat we propose here contain non-functional parameters (i.e. inputs to the analysis mod-els) and indices (i.e. outputs of the analysis models), and the latter work as placeholderto embed the analysis results within the original model. We devise such embeddingmechanism as a fundamental step to allow in future cross-indices observations finalizedto detect inconsistencies (or only relationships) between the results of different analy-sis. As a short-term result in this direction, we intend to introduce transformations thatlead to composite indices, such as performability ones [8]. Besides, we intend to applysuch approach to more complex (failure) scenarios to check its real applicability.
References1. ATESST Project Web Site, http://www.atesst.org/.

2. SAE-AS5506: SAE Architecture Analysis and Design Language AADL, international Soci-ety of Automotive Engineers, Warrendale, PA, USA (November 2004).
3. UML Profile for MARTE, OMG document ptc/08-06-09, Object Management Group, Inc.(2008), http://www.omgmarte.org/Documents/Specifications/08-06-09.pdf.
4. N. Addouche, C. Antoine, and J. Montmain. Methodology for UML modeling and formalverification of real-time systems. In International Conference on Computational Intelligencefor Modelling Control and Automation (CIMCA 2006).
5. M. Ajmone Marsan, G. Balbo, G. Conte, S. Donatelli, and G. Franceschinis. Modelling withGeneralized Stochastic Petri Nets. J. Wiley, 1995.
6. Algirdas Avizienis, Jean-Claude Laprie, Brian Randell, and Carl Landwehr. Basic conceptsand taxonomy of dependable and secure computing. IEEE Transactions on Dependable andSecure Computing, 01(1):11–33, 2004.
7. S. Balsamo, A. Di Marco, P. Inverardi, and M. Simeoni. Model-based performance predictionin software development: a survey. IEEE Transactions on Software Engineering, 30(5):295–310, May 2004.
8. S. Bernardi and J. Merseguer. QoS Assessment via Stochastic Analysis. IEEE InternetComputing, pages 32–42, May-June 2006.
9. S. Bernardi, J. Merseguer, and D. Petriu. An UML profile for Dependability Analysis Mod-eling. Technical report, University of Torino, Dipartimento di Informatica, Torino (Italy),2008.
10. S. Bernardi, J. Merseguer, and D.C. Petriu. A Dependability Profile within MARTE. Journalof Software and Systems Modeling, 2009. DOI: 10.1007/s10270-009-0128-1.
11. Vittorio Cortellessa and Vincenzo Grassi. A modeling approach to analyze the impact oferror propagation on reliability of component-based systems. In CBSE, pages 140–156,2007.
12. Vittorio Cortellessa, Harshinder Singh, and Bojan Cukic. Early reliability assessment ofUML based software models. In Workshop on Software and Performance, pages 302–309,2002.
13. GreatSPN. http://www.di.unito.it/∼greatspn. University of Torino.14. Raj Jain. The Art of Computer Systems Performance Analysis. Wiley, 1991.15. E.D. Lazowska, J. Zahorjan, G. Scott Graham, and K.C. Sevcik. Quantitative System Perfor-
mance - Computer System Analysis Using Queueing Network Models. Prentice Hall, 1984.16. I. Majzik, A. Pataricza, and A. Bondavalli. Stochastic Dependability Analysis of System
Architecture Based on UML Models. In Architecting Dependable Systems, LNCS 2677,pages 219–244. Springer-Verlag, 2003.
17. Antinisca Di Marco and Paola Inverardi. Compositional Generation of Software ArchitecturePerformance QN Models. In WICSA, pages 37–46, 2004.
18. J. Merseguer, S. Bernardi, J. Campos, and S. Donatelli. A compositional semantics for UMLState Machines aimed at performance evaluation. In Silva M., Giua A. and Colom J.M.,editor, WODES02: 6th International Workshop on Discrete Event Systems, pages 295–302,Zaragoza, Spain, October 2002. IEEE Computer Society.
19. PLASTIC IST STREP Project. Deliverable D2.2: Graphical design language and tools forresource-aware adaptable components and services, 2007. http://www-c.inria.fr/plastic/.
20. C. V. Ramamoorthy, G. S. Ho, and Y. W. Han. Fault tree analysis of computer systems.In AFIPS ’77: Proceedings of the June 13-16, 1977, national computer conference, pages13–17, New York, NY, USA, 1977. ACM.
21. Ana-Elena Rugina, Karama Kanoun, and Mohamed Kaaniche. A system dependability mod-eling framework using aadl and gspns. In WADS, pages 14–38, 2006.
22. An Open Source. Java modelling tools. http://jmt.sourceforge.net/.


![Extending SysML to explore Non-Functional Requirements: The …galaxy.hua.gr/~mara/publications/SAC12.pdf · properties de ned in MARTE UML pro le [4]. Since, non-functional requirements](https://img.pdfslide.net/doc/110x75/5e8aff2234562640ca0bba59/extending-sysml-to-explore-non-functional-requirements-the-marapublicationssac12pdf.jpg)