Embed Size (px)
Citation preview

ANNUAL REPORT
2018/2019 FINANCIAL YEAR

1
Contents VOLUME 1 ............................................................................................................................................... 9
chapter ONE: mayor forward and executive summary ........................................................................ 14
TABLE 1.1 ECONOMIC PROFILE .............................................................................................. 24
Chapter 2 – good governance and public participation........................................................................ 39
INTRODUCTION TO POLITICAL GOVERNANCE .................................................................................. 40
2.3.2. JOINT FUNCTION AND PROJECTS WITH SECTOR DEPARTMENTS ........................................... 52
2.5.3 APPROVED RISK POLICIES AND STRATEGIES ............................................................................ 60
2.13.1 COMMUNICATION ACTIVITIES ............................................................................................... 69
2.13.2 COMMUNICATION UNIT .................................................................................................. 69
chapter 3: Service delivery perfomance PERFORMANCE REPORT ....................................................... 70
PART ONE .............................................................................................................................................. 70
3.1.3 THE WAY FORWARD ..................................................................................................... 72
3.2 THE IDP AND THE BUDGET ................................................................................................ 72
3.5 MUNICIPAL FUNCTIONS .................................................................................................... 73
Table 3.9 Employees: Water Services (this service is provided for by uMgungundlovu District
Municipality) ................................................................................................................................. 81
3.8.2 EMPLOYEES: SANITATION SERVICES (THIS SERVICE IS PROVIDED FOR BY
UMGUNGUNDLOVU DISTRICT MUNICIPALITY) ............................................................................. 83
3.10 WASTE MANAGEMENT (REFUSE COLLECTIONS, WASTE DISPOSAL, STREET CLEANING
AND RECYCLING) ........................................................................................................................... 88
3.10.2 REFUSE REMOVAL SERVICE DELIVERY LEVELS .............................................................. 89
3.11 HOUSING ........................................................................................................................... 91
3.13.2 GRAVEL ROADS ............................................................................................................. 95
3.13.5 EMPLOYEES – ROADS .................................................................................................... 96
3.13.6 CAPITAL EXPENDITURE – ROADS .................................................................................. 96
3.14 STORM WATER .................................................................................................................. 97
3.14.1 STORM WATER INFRASTRUCTURE ................................................................................ 97
3.14.2 COST OF CONSTRUCTION/MAINTENANCE ................................................................... 98
3.14.3 EMPLOYEES: STORM WATER ........................................................................................ 98
3.15 PLANNING ......................................................................................................................... 99
3.15.1 CHALLENGES: PLANNING ............................................................................................ 100
3.15.2 SERVICE DELIVERY STATISTICS FOR PLANNING ........................................................... 100
3.15.3 EMPLOYEES: PLANNING .............................................................................................. 102
3.16 LOCAL ECONOMIC DEVELOPMENT ................................................................................. 102
3.16.1 SERVICE DELIVERY INDICATORS: LED .......................................................................... 103

2
- Establish 3 Industrial Sewing Hubs. ....................................................................................... 103
3.16.2 HIGHLIGHTS: LED......................................................................................................... 103
3.16.3 CHALLENGES: LED ....................................................................................................... 104
Table 3.38 Employees: LED ......................................................................................................... 105
COMPONENT D: COMMUNITY AND SOCIAL SERVICES ............................................................... 106
3.17.2 CHALLENGES: LIBRARIES ............................................................................................. 107
3.17.3 SERVICE STATISTICS - LIBRARIES ................................................................................. 108
Table 3.41 Service statistics –Libraries ........................................................................................ 108
3.17.4 SERVICE DELIVERY INDICATORS .................................................................................. 109
3.17.5 EMPLOYEES: LIBRARIES ............................................................................................... 109
Table 3.42 Employees: Libraries .................................................................................................. 109
3.18 CEMETERIES .................................................................................................................... 109
CHALLENGES ............................................................................................................................... 109
Current Cemetry in New Hanover Ward 2 is full and no land has been identified. Other
challenges includes waterlogging in Coolair cemetery and cemeteries with no fencing leading
to vandalism. All our cemeteries are still to be provided with toilets for public use during
burials. ......................................................................................................................................... 109
3.18.2 EMPLOYEES: CEMETERIES ........................................................................................... 110
Table 3.43 Employees: Cemeteries ............................................................................................ 110
3.19 SOCIAL PROGRAMMES .................................................................................................... 110
3.19.1 EMPLOYEES: SOCIAL PROGRAMMES .......................................................................... 112
Table 3.45 Employees: Social programmes ................................................................................. 112
3.20 POLLUTION CONTROL ..................................................................................................... 113
3.21 BIO-DIVERSITY, LANDSCAPE AND OPEN SPACES ............................................................ 113
3.22.1 SERVICE STATISTICS – TRAFFIC, SECURITY AND LICENSING ........................................ 115
Table 3.46 Service data for Traffic, security and licensing .......................................................... 115
3.22.2 EMPLOYEES: TRAFFIC, SECURITY AND LICENSING ...................................................... 116
Table 3.47 Employees: Traffic, security and licensing ................................................................. 116
3.24 COMMUNITY HALLS ........................................................................................................ 117
3.24.1 HIGHLIGHTS: COMMUNITY HALLS .............................................................................. 117
3.24.2 CHALLENGES: COMMUNITY HALLS ............................................................................. 117
3.24.3 EMPLOYEES: COMMUNITY HALLS ............................................................................... 117
Table 3.51 Employees: Community halls ..................................................................................... 117
3.28 SPORT GROUNDS ............................................................................................................ 118
3.28.1 CHALLENGES: SPORT GROUNDS ................................................................................. 118
3.28.2 EMPLOYEES: SPOR

3

4

5
T GROUNDS ................................................................................................................................. 118
COMPONENT H: UMSHWATHI MUNICIPALITY: CORPORATE POLICY, OFFICES AND OTHER
SERVICES ..................................................................................................................................... 119
3.29 EXECUTIVE AND COUNCIL ............................................................................................... 119
3.29.2 CHALLENGES: EXECUTIVE AND COUNCIL .................................................................... 120
3.29.3 SERVICE DELIVERY INDICATORS: EXECUTIVE AND COUNCIL ...................................... 121
3.29.4 EMPLOYEES: EXECUTIVE AND COUNCIL ...................................................................... 121
Table 3.61 Employees: Executive and Council ............................................................................. 121
3.30 FINANCIAL SERVICES ....................................................................................................... 121
3.30.1 HIGHLIGHTS: FINANCIAL SERVICES ............................................................................. 123
3.30.2 CHALLENGES: FINANCIAL SERVICES ............................................................................ 123
3.30.3 SERVICE DELIVERY INDICATORS: FINANCIAL SERVICES ............................................... 123
3.30.4 EMPLOYEES: FINANCIAL SERVICES .............................................................................. 124
Table 3.65 Employees: Financial Services ................................................................................... 124
3.31 HUMAN RESOURCES ....................................................................................................... 124
3.31.1 HIGHLIGHTS: HUMAN RESOURCES ............................................................................. 125
3.31.2 CHALLENGES: HUMAN RESOURCES ............................................................................ 125
3.31.3 SERVICE DELIVERY INDICATORS: HUMAN RESOURCES ............................................... 126
3.31.4 EMPLOYEES: HUMAN RESOURCE ................................................................................ 126
Table 3.68 Employees: Human Resources ................................................................................... 126
3.32 CORPORATE SERVICES..................................................................................................... 126
3.32.1 HIGHLIGHTS: CORPORATE SERVICES ........................................................................... 127
3.32.2 CHALLENGES: CORPORATE SERVICES ......................................................................... 127
3.32.3 SERVICE DELIVERY INDICATORS: CORPORATE SERVICES ............................................ 127
3.32.4 EMPLOYEES: CORPORATE SERVICES ........................................................................... 128
Table 3.71 Employees: Corporate Services ................................................................................ 128
3.32.5 CAPITAL EXPENDITURE – CORPORATE SERVICES ........................................................ 128
Table 3.72 Capital expenditure - corporate services ................................................................... 128
COMPONENT I: ORGANISATIONAL PERFORMANCE SCORECARD............................................... 130
3.33 DEVELOPMENT AND SERVICE DELIVERY PRIORITIES FOR 2018/19 ................................ 130
CHAPTER 4: ORGANISATIONAL DEVELOPMENT PERFORMANCE (PERFORMANCE REPORT PART
ONE) .................................................................................................................................................... 165
A. NATIONAL KEY PERFORMANCE INDICATORS - MUNICIPAL TRANSFORMATION AND
ORGANISATIONAL ........................................................................................................................... 165
B. HIGHLIGHTS – MUNICIPAL TRANSFORMATION AND ORGANISATIONAL DEVELOPMENT ..... 165
C. CHALLENGES – MUNICIPAL TRANSFORMATION AND ORGANISATIONAL DEVELOPMENT .... 166

6
4.1 COMPONENT A: INTRODUCTION TO THE MUNICIPAL WORKFORCE ....................................... 167
4.1.1 EMPLOYMENT EQUITY .................................................................................................... 169
EMPLOYMENT EQUITY VS. POPULATION ........................................................................................ 170
4.1.2 VACANCY RATE ................................................................................................................ 170
4.1.3 STAFF TURNOVER RATE .................................................................................................. 173
4.2 COMPONENT B: MANAGING THE MUNICIPAL WORKFORCE ................................................... 174
4.2.1 INJURIES .......................................................................................................................... 174
4.2.2 SICK LEAVE ...................................................................................................................... 176
4.2.3 SUSPENSIONS ......................................................................................................................... 177
4.2.4 HR POLICIES AND PLANS ................................................................................................. 177
4.3 COMPONENT C: CAPACITATING THE MUNICIPAL WORKFORCE .............................................. 179
4.3.1 SKILLS DEVELOPMENT AND TRAINING ........................................................................... 179
INTERNAL TRAINING PROGRAMS DURING THE 2018/19 FINANCIAL YEARS .................................. 179
4.3.2 THE FOLLOWING DIAGRAM ILLUSTRATES THE LEARNERSHIPS WHICH WERE FUNDED BY THE
LGSETA AND WERE ONGOING DURING THE 2018/19 FINANCIAL YEAR ......................................... 180
4.3.3 THE FOLLOWING TABLE ILLUSTRATES THE INTERNAL TRAINING INTERVENTIONS DURING
THE 2018/19 FINANCIAL YEAR IN VARIOUS OCCUPATIONAL CATEGORIES .................................... 181
4.3.3 SKILLS DEVELOPMENT - BUDGET ALLOCATION .............................................................. 181
4.4 COMPONENT D: MANAGING THE MUNICIPAL WORKFORCE EXPENDITURE ............................ 182
4.4.1 PERSONNEL EXPENDITURE .............................................................................................. 182
Chapter 5: Financial Performance ...................................................................................................... 183

7

8

9
VISION, MISSION AND VALUES
MISSION:
To promote social-economic development through sustainable effective and efficient
use of resources and dependable delivery of basic services in line with the
Constitutional mandate and to continually strive to remain a green municipality.
VISION:
To be a healthy, secure and self-sustainable community by 2030
This Annual Report is divided into two volumes and has six chapters as outlined:
VOLUME 1
Chapter 1: Mayor’s Foreword and Executive Summary;
Chapter 2: Governance;
Chapter 3: Service Delivery Performance;
Chapter4: Organizational Development Performance;
Chapter 5: Financial Performance;
Chapter 6: Auditor General’s Findings; and audit Opinion
APPENDIX
VOLUME 2

10
Annual Financial Statements
CHANGES IN COUNCIL
Resignation: Cllr M.M De Vries from the DA resigned in April 2018.
New appointment: Cllr V.M Mncwabe from the DA was appointed sworn in June
2018.
Naidoo replaced by Cllr Ndlovu and Cllr Shezi replaced by Mncube

11
Table 1: Alignment of the key challenges, interventions with KPA's
Key Performance Area Key Challenges Interventions
STATUS
Municipal
Transformation&
Institutional Development
Poor work ethic and
organisational
culture
Review organisational structure and placement of
staff; Restructure the organisation; Implement
code of conduct and disciplinary policy and
collective agreement; Roll out PMS Policy to all
staff; Review Recruitment Policy.
Addressed
Basic Service Delivery
Aging
Infrastructure and
backlogs
Sourcing funding from sector departments;
Develop a policy self-sustaining infrastructure;
Develop Private-Public Partnership for
infrastructure development and maintenance;
Develop a maintenance plan for infrastructure;
develop master plans for infrastructure and review
annually; develop clear prioritisation plan; develop
a capital project investment framework as part of
part of SDF.
Being reviewed

12
Key Performance Area Key Challenges Interventions
STATUS
Local Economic
Development
High
unemployment,
poverty & inequality
Develop a Grant-in-Aid Policy & Programmes;
Implement capacity building programs for women,
youth; SMME’s and Cooperatives; Improve
access to EPWP and CWP job opportunities to the
most needy; Promoting greater procurement from
local cooperatives and SMME’s; Providing
incentives to local businesses for the use of local
labour; Develop a programme to roll out agrarian
projects; Forming partnerships with business;
Reskilling of retrenched workers (citizens);
Providing support to local SMME’s, cooperatives;
Setting minimum targets for the use of labour
intensive methods in infrastructure projects &
develop a clear program for small contractor
development.
Municipal Financial
Viability & Management
Lack of funding/
revenue collection
Review the Revenue Enhancement Strategy;
Identify additional sources of income; Investigate
driver’s testing ground; Negotiate with DOT to
have weigh bridge; Review lease agreements for
all municipal properties, Implement/ review, Credit
control and debt collection policy, Appoint
dedicated Panel of Attorney’s to pursue debt
collection beyond the final demand process, Take
legal action against government departments
owing money to the Municipality, Capacitate
finance staff on revenue collection, Carry out Land
audit.
Good Governance &
Public Participation
Undue political
interface
Review and workshop delegations; develop
communication protocol. Addressed
Cross Cutting Issues Unknown land use
and ownership
Conduct land rights and land use audit; review
bylaws; Appoint or capacitate property valuer;
review and update the enforcement structure.
Develop local area plans.

13
POLITICAL LEADERSHIP
Mayor: His Worship Cllr. G.M Zondi
Deputy Mayor: Cllr. M.P.Dlamini
Speaker: Cllr. N. P Mdunge
TRADITIONAL LEADERSHIP AMAKHOSI
iNkosi B Ntanzi: Mhlangandlovu iNkosi
B.G Gwamanda: New Hanover
iNkosi M.Z Mthuli: Mathulini
iNkosi M.S Ndlovu: Masihambisane
iNkosi Gcumisa: Swayimane
iNkosi Ngubane: Faye
iNkosi Ndunankulu M. Zondi: Nadi iNkosi Madlala
SENIOR MANAGEMENT

14
Municipal Manager: Mr. N.M Mabaso
Chief Financial Officer: Mr. R. Mani
General Manager: Community Services: Mr. B.T Zondi
General Manager: Corporate Services: Mrs. T.T Mathenjwa
General Manager: Technical Services: Mrs. N. Mncube
CHAPTER ONE: MAYOR FORWARD AND EXECUTIVE SUMMARY
MAYOR’S FORWARD
Fellow citizens, It is humbling and an honour to present to you uMshwathi’ s annual
report for the year ending 2018/19. As encapsulated in our vision our long term long
to be a healthy secured municipality through agribusiness and sound environmental
management by 2030.
Secured means all races within our community live harmoniously, in peace and
prosperity without economic or political or religious exclusion.
To arrive in that desired uMshwathi state, it is paramount that we promote a healthy,
self-sustainable community through infrastructure and socio-economic development.
Self-sustainability resonates with the wisdom of the former American President J.F
Kennedy words in 1961 that “ask not what Country will do for you, but what you will
do for government.
KEY POLICY DEVELOPMENTS IN 2018/19
Our Spatial Development Framework (SDF) was finalized and approved by Council
in the past year. This will assist the municipality to control and drive development in
a structured and visionary way. The Land Use Management System (LUMS) was

15
also finalized and approved to minimize the intentions of the SDF and establish a
healthy secured municipality that we all desire to see.
New Electrification projects achieved for the last year was for 942 households.
These were installed at Efaye, Dalton, Windy Hills and to several African farm
dwellers. Since our challenge has been deteriorating infrastructure we have
mitigated the challenge by investing R5.5 million to maintain it. This was achieved by
doing renovations in six community halls, in areas like Thokozani and Mpolweni.
Seven crèches were also renovated in Nyaninga. Four sports fields including a
netball court were constructed in Swayimane.
One Agrihub (farmer support unit) was also completed during the past year. The
municipality also undertook community capacity building, which is currently in
progress. An ICT office was also completed successfully in Bamshela. Our PMU unit
has successfully implemented nine projects as per planned schedules.
CHALLENGES
A few projects were delayed mostly due to the inexperience of emerging contractors,
however it is encouraging to report that the delayed projects did not result in scope
creep and further costs to our municipality. Underperforming contractors were forced
to bear the escalated costs of prolonged projects.
PUBLIC PARTICIPATION
uMshwathi has been blessed by the Traditional Council “Amakhosi” that sit and
deliberate the future of our municipality in portfolio committees and other municipal
public undertakings. The said leaders always make a point to bring their
communities. This naturally motivates all stakeholders including ward committee
members and the greater public to participate in all municipal public undertakings
such as IDP/Budget Izimbizo that are always well attended. The Council has a very
good working relationship with the traditional leaders and this has been the key to
massive public attendance.

16
Council employs a number of mediums to also boost public attendances such as
radio announcements, public hauling, school announcements and newspaper
advertisement. The public also benefits in these Izimbizo as Council identifies and
gives feedback to the communities on progress made on their IDP needs which also
creates a sense of belonging and transparency leading to project ownership.
FUTURE ACTIONS
Going forward, I am interested to see and experience the uMshwathi that you desire
and that you will build. As local government we have and always will give you the
means to start a great and prosperous future by creating sports fields, community
halls, agribusiness hubs that you requested. Any business idea that you have,
training that you need there are people ready to help you.
We shall obviously continue to maintain and usher in more, more high mast lights
and more agribusiness hubs like chicken-processing factories etc. let’s all come
together and utilize this infrastructure to create employment for ourselves. Work hard
and create a market here and abroad. It can only start here with you. Most
importantly if YOU pay for what you use, pay for your electricity and water so Eskom
can have the means to stop load shedding, pay for your rates so we can take move
our municipality forward.
CONCLUSION
I, conclude by wishing you all a happy and prosperous 2020, filled with love, laughter
and happiness. Let’s all get out there and do our bit to make our UMshwathi GREAT.
Let’s heed the call “Thuma Mina” and bring change and prosperity to our families. It
can only start with you. God Bless You and God Bless South Africa.
Cllr. GM Zondi

17
His Worship Mayor
18
MM FOREWORD IN 2018/2019 ANNUAL REPORT
It is my privilege to present to you the Annual Report for the 2018/2019 Financial Year.
2019 was a hectic but good year for the Municipality. We engaged in the larger and most
future-oriented infrastructure projects, ranging from road construction, the completion of
spatial development framework (SDF), and Land Use Management System and community
facilities.
We welcomed the new Mayor and Councilors who joined us during the year. We also wish
to record our deep sadness in the loss of the former Mayor, Cllr. S.S. Zondi-Mbhele, who
served the municipality with diligence.
PUBLIC PARTICIPATION
Our community comes first. During the year, we continued to embark on the community
consultation and engagement process to ensure that all our plans are guided, citizen
aspiration for the future, and that the needs of the community are addressed as defined by
them. We are ready to create even more value for our community by finalizing the current
consultation process of changing the municipal logo and color scheme to the one that
resonates with our community aspirations for a brighter future.
FINANCES
Our pursuit of an audit opinion without any findings remains unchanged and despite the
setbacks as reported in respect of the 2018/2019 financial year, the target remains in sight.
The municipal financial health is solid, cash flow management and focus are all within the
acceptable norms.
We have continued to achieve good scores on back-to-basic over the last three financial
years and our future plan is to ensure the longevity of this achievement. The payment of
municipal accounts debt remains low. However, we are encouraged to see that government
departments have started to settle their long outstanding accounts.
PLANNING PROCESS
Planning remains our top strategy. The Municipal IDP document has managed to be
ranked amongst the top ten in the category, within the province over a number of financial
years. This tool is supported by constant and continuous reports and feedback to
communities through the newsletter and is firmly encored at the Wards through Operation
Sukuma Sakhe and Ward Community activities. To avoid duplications, these activities are
consolidated in all wards through functional war rooms.

19
RISK MANAGEMENT
Municipal risk exposure is diligently considered on all angles. We are committed to
proactive risk management in the pursuit of the municipality's strategic objectives with a
view to ensure sustainable service delivery and to safe guard the municipal assets and
interests. We acknowledge that proactive risk management is both a key element of good
corporate governance and an enabler for plans to be realized.
The municipality would like to bid farewell to all outgoing members of the Audit and Risk
Committee for their diligent performance and commitment whilst in office.
PERFORMANCE
We have significantly strengthened our performance throughout the municipality by
improving the number of performance targets achieved has improved from 86.1% to 93.3%.
MIG EXPENDITURE
In enhancing development, during the year we engaged in capital projects that resulted in
the municipal infrastructure grant allocation being spent in full. Our performance in this
regard opens up new opportunities to secure additional allocations from The Treasury. In
total, R29.6 million was spent on capital projects.
LOCAL ECONOMIC DEVELOPMENT
Municipal economic development plans are aligned to provincial and district development
plans. Our focus is on small and emerging businesses led by youth and community- based
organizations such as cooperatives, practical and intensive training that enables the youth
to start their businesses. This includes training on furniture making, sewing and providing
support to farmers. In the following financial year, a Farmer’s hub will be created in New
Hanover to enable local businesses to participate in the provincial government RASSET
program.
RELATIONS
Our relationship management is based on trust and open communication. We have
succeeded in maintaining a good working relationship with all our stakeholders, including
ratepayers associations, farmers associations, business interest groups, and employee’s
representative groups. Naturally our interest will at times differ and our relationship is
always a work-in-progress, however we have so far managed to achieve results that
received favor from all interested parties.
INSTITUTION ARRANGEMENT
OUR DESIRE TO CREATE A SOLID MUNICIPAL CULTURE IS ALIVE. OUR MUNICIPAL
VALUES WHICH INCLUDE ETHICAL BEHAVIOR AND FAIRNESS ARE BASED ON THIS

20
QUEST AND ARE IN LINE WITH THE BATHO PELE PRINCIPLES AND PRACTICES AS
IMPLEMENTED BY THE MUNICIPALITY MORE THAN TWO YEARS AGO.
ENVIRONMENT
Environmental protection is key to our healthy. We have a clear ambition to protect our
environment and retain our status of being amongst the greenest municipality in the
province. Our by-laws, building regulations and planning framework helps us to pursue
these goals. Municipal investment on digital solution is part of the plan to reduce waste.
CHALLENGES
Our employee employment cost ratio is higher than the acceptable norm and this is due to
work being done in-house as opposed to outsourcing. The cost of the digitalization
activities is continuing to increase and this is due to the fast paced information technology
environment. On the other hand, through this investment the municipality is able to
collaborate more effectively and to reduce costs such as printing and duplication of
activities. Also through the oversight structure such as the Municipal Public Accounts
Committee and Audit Committee slack in performance against plans and standards are
identified and steps to correct the situation are then taken. Information Communication and
technology (ICT) extension to communities and training of communities on ICT.
PLANS FOR THE FUTURE
Our plans for the future are contained in the Municipal IDP Document for 2019/2020 and all
our stakeholders are encouraged to read this document. A brief summary of our future
plans is highlighted at the beginning of each chapter of this document.
Thank you for your meaningful and positive contribution over the years. Let us look forward
to meeting new challenges together over the coming years.
NM Mabaso
Municipal Manager

21
MUNICIPAL FUCTIONS, POPULATION AND ENVIRONMENTAL OVERVIEW
1.1. UMSHWATHI LM OVERVIEW
The uMshwathi Local Municipality (LM), (KZN221), is strategically located within the
uMgungundlovu District Municipal area, to the north of Msunduzi Municipality
(Pietermaritzburg/ Capital City of KwaZulu Natal). UMshwathi is sharing a common
boundary with Msunduzi, uMngeni, Mpofana, uMvoti, Ndwedwe, eThekwini and
Mkhambathini Local Municipalities. Covering a land area of approximately 1867.9km², the
uMshwathi Municipality has 111 645 people living in approximately 29 083 households
according to Community Survey 2016.
The Municipality covers an area of approximately 1811 square kilometers in extent. The
provincial positioning of uMshwathi accommodates secondary movement systems, which
aim at providing efficient and effective access e.g. the R33 (Old Greytown Road) serves as
the major/main movement corridor between the N3 and the capital Msunduzi Municipality,
to some of the surrounding local Municipalities towards the north such as uMvoti, Msinga,
and Ndumeni. Hence, due to these as well as many other characteristics, there is a clear
reflection of the R33 being a primary development and access corridor offering a range of
opportunities for investment in relation to the province.
The advantage of uMshwathi Municipality’s close proximity to Pietermaritzburg (Msunduzi
Municipality), opportunity exists for positive spin-offs for Local Economic Development
(LED). The local economy can also be diversified through, the development of tourism
infrastructure and middle to high-income residential and commercial developments that
may be limited in Msunduzi

22
MAP 1: LOCALITY MAP
1.2. SPATIAL ANALYSIS
uMshwathi LM sits in the KwaZulu-Natal province as a local municipality of
uMgungundlovu District Municipality. The uMshwathi Municipality features
transportation networks such as the R33 (Old Greytown Road) and the R614
(Wartburg Road) to N2, which provide linkages from main centers such as
Durban and Pietermaritzburg, to the interior of the province such as Greytown
and Dundee. At a local level, both the R33 and the R614 have been identified
as primary corridors that have the potential to become key development routes
within the Municipality and Province by linking markets, places and people.
The land within the Municipality is dominated by agricultural landscapes
(timber and sugar-cane) and rural-residential settlements. The four main urban
centers within the Municipality are New Hanover, Wartburg, Dalton and Cool
Air. While each of these centers vary in terms of the services they offer, the
Primary Centre/ Node is New Hanover that serves as the Administrative Hub of

23
the Municipality. Wartburg serves as the main Commercial Centre while Dalton
is the main Service Industrial Hub within the Municipality. Outside of these
main urban areas, are various other nodes which boast thriving economic
activities, high concentrations of people, mixtures of land use and the
availability of goods and services essential for the communities living around
these nodes e.g. Bhamshela, Swayimane, Appelsbosch, Crammond, etc.
Throughout the Municipality, there is a broad spectrum of services, facilities,
amenities and other opportunities, which aim to improve the Municipality‘s
economic, social, political and environmental status.
1.3. ECONOMIC PROFILE
The land is mostly agricultural, although urban development is to be found in
the main towns. The communities living in the underdeveloped areas have
extremely limited access to basic physical, social requirements and very few
economic opportunities. The present authority structures are, as yet, unable to
provide fully for the improvement of basic living conditions urgently required by
the rural inhabitants. The main towns are Cool Air, Dalton, New Hanover,
Wartburg. The main economic sectors are agriculture, manufacturing and
tourism.

24
TABLE 1.1 ECONOMIC PROFILE
Employment Status 2011 Census
Employed 32%
Unemployed 11%
Not Economically
Active
50%
Discouraged Work
Seekers
7%
Sector of Employment 2011 Census
Formal Sector 63%
Informal Sector 23%
Private Households 10%
Do not know 5%
Annual Income 2011 Census
No Income 9%
Under R4800 4%
R4800 to R10 000 9%
R10 000 to R20 000 41%
R20 000 to R40 000 18%
R40 000 to R75000 7%
R75000 to R150 000 5%
R150 000 to R300 000 3%
R300 000+ 1%
Unspecified 3%

25
Education Profile 2016 Community Survey
None 10%
Other 1%
Some Primary Education 14%
Primary Education 5%
High School Education 35%
Grade 12 (Matric) 29%
Higher Education 4%
N/A 2%
1.4. DEMOGRAPHIC PROFILE
Covering a land area of approximately 1867.9 square kilometers, the
uMshwathi Municipality has 111645 People living in approximately 29083
households according to Community Survey 2016. This indicates 4.96%
increase in the population count of 106,374 as per the 2011 Stats SA data.
Table 1.2: Population Information
2016 Community Survey
Total Population 111 645
Source: Community Survey 2016
1.4.1. POPULATION BY AGE CATEGORY
Table 1.3: Population by Age Range
Age Percentage
Under 18 46%
18-6 50%

26
65 and over 4%
Source: Community Survey 2016
1.4.2. POPULATION GROUP
Table 1.4: Population Group
Group Percentage
Black African 94%
Coloured 0%
Indian/Asian 3%
White 2%
Source: Community Survey 2016
1.4.3. GENDER PROFILE
TABLE 1.5 GENDER PROFILE
Source: Community Survey 2016
1.4.4. HEAD OF HOUSEHOLD BY GENDER
Table 1.6: Head of Household by Gender
Source: Community Survey 2016
Male Female
48% 52%
Male Female
51% 49%

27
1.4.5. HOUSEHOLDS BY DWELLING TYPE
Table1.7: Household by dwelling type
Dwelling Type Percentage
House 52%
Traditional 37%
Shack 6%
Flat in Backyard 3%
Other 2%
Unspecified 3%
N/A 2%
Source: Community Survey 2016
1.4.6. WATER SUPPLY
Table 1.8: Sources of water
Water Source Percentage
Umgungundlovu DM 59%
Natural Source 23%
Own Service 12%
Vendor 3%
Other 2%
Source: Community Survey 2016

28
1.4.7. ELECTRICITY SUPPLY
Table .1.9: Sources of electricity
Electricity Supply Percentage
In-house prepaid meter 70%
No Access to Electricity 14%
In-house Conventional Meter 13%
Other 1%
Source: Community Survey 2016
1.4.8. ACCESS TO TOILET FACILITIES
Table 1.10: Access to toilet facilities
Toilet Facility Percentage
Pit Toilet 42%
Chemical Toilet 24%
Flush Toilet 15%
No Access to Any Toilets 1.6%
Source: Community Survey 2016
1.4.9. REFUSE DISPOSAL
Table 1.11: Refuse disposal
Refuse Disposal Percentage
Own Dump 80%
Service Provider 8%
Communal Dump 5%
Service Provider Not Regularly 3%
Other 4%
Source: Community Survey 2016

29
1.4.10. SOCIO-ECONOMIC STATUS
Table 1.12: Socio-Economic Status
Socio-Economic Status
Year Housing Backlog as
proportion of current demand
Unemployment Rate Proportion of households with no
Income
2011 6.1% 24.9% 9.9%
2016 6.4% 25.6% 9.0%
2018
Source: Statistics SA Census 2011, 2016 CS
1.4.11. NATURAL RESOURCES
TABLE 1.13. NATURAL RESOURCES
Source: Statistics SA Community survey 2016ALI
1.5. TOURISM
Albert Falls Dam is a tourism node that was designated in 1975 as a nature
reserve. The dam is located approximately 20km north of Pietermaritzburg and
is one of the area’s likeable tourist destinations. The area around the dam is
filled with secluded nature trails and picnic spots. The dam boasts an
Natural Resources
Major Natural Resource Relevance to Community
Land Opportunities for agriculture and alternative energy
sources
Water dams Tourism opportunities and farming
Labour force Opportunity for local economic development through
active workforce and educational opportunity through
establishment of institutions of further education

30
abundance of bird life as well as wild life and is counted amongst the best bass
fishing dams in the country. The site offers camping area, water skiing, fishing,
scenic views, and cultural attraction.
Apart from the dam, the route that extends from Albert Falls, Wartburg, New
Hanover, and Dalton is known as Albert Falls Amble. This route offers a
selection of arts and craft, and it runs along a number of private game reserves.
1.6. PLANNING AND DEVELOPMENT PRINCIPLES
Planning and development are key economic capacity building activities within
the Municipality. The government’s transformation process, on legislation that
deals with land-use management, has also led to a radical transformation of
municipal planning. The overall objectives of these reforms are to develop a
more appropriate, integrated, developmental, strategic and sustainable
development planning founded on the principles of our Constitution.
During the apartheid era (1948-94), land-use planning was used to enforce
racial segregation. The dawn of democracy has necessitated new thinking and
the development of new tools to strengthen the municipalities and other
stakeholder’s ability to successfully implement the new direction. This new
thinking is based on the understanding that Land is an asset. Land is scarce.
Land is fragile. “The broad objective is to facilitate allocation of land to the uses
that provide the greatest sustainable benefits and to promote the transition to a
sustainable and integrated management of land resources.”
This resulted in the government development of Spatial Development
Framework and land use system that seeks to redress past injustice and to put
proper land use management plans at the center stage of development.
However, shortage of skilled professionals in the field of planning and
development remains one of the major challenges.

31
1.7. INTERNET ACCESS
Table 1.14 Internet Access
Source: 2016 Community Services
Access to Internet presents unprecedented economic growth opportunity.
Smartphone plays an import link to Internet for the 48% of the population that
has Internet. Also 40% of the population seems not to have access to the
Internet.
Provision of basic services is essential for sustained community livelihood,
public health, development and safety. These services include water,
electricity, sewerage & sanitation, and solid waste management. In uMshwathi
municipality context, most of these services are provided through the District
Municipality and other State Owned Companies such as Eskom for the
distribution of electricity but uMshwathi is responsible for waste management.

32
TABLE 1.15 SWOT ANALYSIS
STRENGTHS WEAKNESSES
Recent acquisitions of plant and
equipment to improve
service delivery and infrastructure
development
Competent and highly-skilled
team of individuals within the
Technical Services Department
(municipality)
New infrastructure built in the last
year
Critical post filled
Housing Unit established
(facilitation)
Support from DoHS (funding)
Support from DRDLR (land
acquisition)
Support from ITB (rural areas in
relation to DRA)
Vast rural area of the municipality
imposes a burden on the cost-
effectiveness of delivering services to
these areas
Insufficient compliance officers to
ensure bylaws are implemented.

33
OPPORTUNITIES THREATS
Increased sources of funding for
infrastructure development
through LOTTO and other
donors(MIG) (INEP)
Completed development of the
Thusong Centre improves service
delivery and interaction with
community members
Farmers are supportive in making
land available for housing sites.
Project Steering Committees
(Public Participation).
Site Meetings (Public
Participation)
EPWP Programme, CWP
Programme
Housing Consumer Education
Programme (Education for
beneficiaries)
Vandalism to Municipal property by
local communities
Illegal dumping occurs from time to
time
EIA‘s take too long before approvals
Mushrooming of slums/informal
settlements.
Land invasion by illegal occupants
Illegal/Informal tenants (resistance in
paying rents)
Shortage of housing sites at wards 1,
2, 7 and 9.
Land ownership issue at ward 3.
Poor quality of emerging contractors
The social and economic value of education in the development of a society
and a country cannot be overstated. The Municipality is tasked with a
developmental mandate and investment in education is one of the key drivers
of individual and society success.
The Municipality’s no-schooling rate for those above 20 years is 15.7%.
Research indicates that there is a converse relationship between the society
level of education and poverty rate and participation in the economic activities.
We are, however, encouraged to see an increase in the level and number
of high quality schools being built in our area. To assist, the Municipality
Councilors participate in annual back- to-school and matriculates support
campaigns.

34
1.8. FINANCIAL HEALTH OVERVIEW
The municipality continues to maintain a good financial health despite
escalating salary bill and other operating costs. Total income for the year was
R189.3 million which is 98.15% of the budget. The high debt level is still a
challenge, at the end of the financial year municipal debt was just above
R124.9 million inclusive of R37.9 million provision for doubtful debts.
However, concrete steps are taken to recover the amount due and a common
understanding has been reached with a government department, which
accounts for more than 50% of the total debt. (Department of water and
sanitation)
Most of our income still comes from government grants and the balance is
derived from rates and tariffs for municipal services.
TABLE 1.16 FINANCIL OVERVIEW
Financial Overview: year 2018/2019
R’000
Details Original Budget Adjustment Budget Actual
Income:
Rates 36,200 42,250 45,5050
Services 2,070 2,250 2,402
Operational Grants 97,972 97,972 97,972
INEP Grant 10,000 10,000 10,000
Capital Grants 27,098 27,098 27,098
Other 12,800 13,325 16,340
Total 186,140 192,895 199,317
Less Operating Expenditure

35
Salaries 74,477 77,238 76,521
General expenditure 55,591 58,625 53,459
Repairs and Maintenance 12,730 12,520 12,120
Contribution to reserves/Provisions 500 500 2,285
INEP Expenditure 10,000 10,000 10,000
Contribution to Capital 0 0 0
Total Expenditure 153,298 158,883 154,385
Surplus/(Deficit) 32,842 34,012 44,932
TABLE 1.17 OPERATING RATIO
TABLE 1.18 TOTAL CAPITAL EXPENDITURE
Total Capital Expenditure
Details 2016-2017 2017-2018 2018-2019
R R R
Original budget 28,629 40,516 32,842
Adjustment budget 40,729 43,016 34,012
Actual 38,704 37,021 29,642
Operating Ratios
Details Restated
2017 2018 2019
Employee Cost 51% 53% 54%
Repairs and Maintenance 7% 10% 8%
Finance charges and Impairment 0.1% 0.3% 1.58%

36
COMMENT ON OPERATING RATIOS
Explanation of variances from expected norms:
Employee cost expected to be 30% to total operating costs 40% for
rural municipalities
Employee costs are high because there is a need for critical positions to
ensure effective service delivery. Furthermore the municipality is grant
dependent thus operational expenditure is at its minimum. However
steps are in place to reduce the ratio to an acceptable level.
Repairs and maintenance 8%
Repairs and maintenance is within the required 8%. The municipality
ensures that there is adequate budget allocated for the maintenance of
its assets (Roads and buildings).
Finance charges and Impairment 10%: Finance charges are low
because there is only one loan that is being serviced. Furthermore there
are only 3 installments remaining and the loan will be repaid in February
2020.
1.9. ORGANISATIONAL DEVELOPMENT OVERVIEW
uMshwathi organizational arrangements for personnel management and
development is currently dispersed over five departments which are community
services; corporate service; finance; municipal managers office and technical
services. Corporate services department is responsible for the formulation and
maintenance of policies for recruitment and manages council employees.
Staff development unit has been established under human resources for the
identification of training needs amongst the council personnel and
administration of bursaries. This unit assists in ensuring municipal compliance
with skills development framework and achievement of organizational
development policy priorities.

37
Local Labour Forum Committee handles all organizational development and
other labour related matters. Two municipal recognized unions represent
employees at this committee. These labour unions are IMATU and the
majority SAMWU
During the reporting year, the committee monitored the functioning of
placement committee, which was specially established to deal with job
description challenges and job grading of certain positions. The committee has
finalized most of the work assigned including placements. Results of job grading
are submitted from region two, which was assigned in terms of the collective
agreements with the unions to our district.
1.10. AUDITOR GENERAL REPORT
For over five years the municipality received an unqualified audit opinion.
However in the current report two issues were cited by Auditor General which
led to a qualified audit opinion. These two issues are non-compliance with
GRAP17 relating to assets management and statement of cash flow. More
details can be found in chapter 6
TABLE 1.19 STATUTORY ANNUAL REPORT PROCESS
N0. Activity Timeframe
10. period Consideration of next financial year’s Budget and IDP process plan.
Except for the legislative content, the process plan should confirm in-year reporting formats to ensure that reporting and monitoring feeds seamlessly into the Annual Report process at the end of the Budget/IDP implementation
August
11. Implementation and monitoring of approved Budget and IDP commences (In-
year financial reporting). July
1
2. Finalise the 4th quarter Report for previous financial year
1
3. Audit/Performance committee considers draft Annual Report of municipality August

38
1
4. Mayor tables the draft unaudited Annual Report
15. Municipality submits draft Annual Report including annual financial statements
and performance report to Auditor General
16. Annual Performance Report as submitted to Auditor General to be provided as
input to the IDP Analysis Phase.
17.
Submit the draft year 2017-2018 Annual Report to Internal Audit and Auditor-General
Auditor General audits drafts Annual Report including Annual Financial Statements and Performance data
September – October
Municipalities receive and start to address the Auditor General’s comments November
Mayor tables Annual Report and Audited Financial Statements to Council complete with the Auditor- General’s Report
January
Audited Annual Report is made public and representation is invited
Oversight Committee assesses Annual Report
Council adopts Oversight report January to March
Oversight report is made public
Oversight report is submitted to relevant provincial councils
Commencement of draft Budget/ IDP finalization for next financial year. Annual
Report and Oversight Reports being used as input
January
The deadlines indicated above are part of the Municipality’s sound governance
and proper planning indicators. These timelines assist in the alignment of staff
activities with overall Municipality goals and objectives, legal prescripts and
other municipal operating guidelines. They also help to coordinate the process
that leads to the timely compilation of the IDP, Budget, and Performance
Management System, financial statements as well as the annual report.

39
CHAPTER 2 – GOOD GOVERNANCE AND PUBLIC PARTICIPATION
COMPONENT A: POLITICAL AND ADMINISTRATIVE GOVERNANCE
Good governance comprises 8 major characteristics: it is participatory,
consensus oriented, accountable, transparent, responsive, effective and
efficient, equitable and inclusive and follows the rule of law. At uMshwathi
Municipality, these characteristics have been pursued viciously to ensure that
all forms of corruption are eradicated, the views of minorities vindicated, and
that the voices of the most vulnerable in society are incorporated in decision-
making.
HIGHLIGHTS – GOOD GOVERNANCE AND PUBLIC PARTICIPATION
The Municipality with regards to good governance and public participation has
achieved the following highlights:
Table 2.1: Achievements
Highlight Description
Implementation of Council resolutions 95% of all Council resolutions implemented
Inclusivity Ward committee functional and ward base
plan in operation
Inter-governmental co-operation Operation Sukuma Sakhe remain
functional in all fourteen wards
Oversight Fully functional Independent oversight
committees (Audit, Risk and MPAC)
CHALLENGES – GOOD GOVERNANCE AND PUBLIC PARTICIPATION
In terms of good governance and public participation the municipality
experiences the following general challenges:

40
Table 2.2: Challenges
Description Actions to address
Council committee meetings Compilation of a time schedule for meetings
By-laws Lag in review of by-laws
Inter-governmental co-operation
Lack of attendance by Auditor General and
COGTA representatives in Audit Committee
meetings
Oversight
MPAC members need more training and
capacity building to enable the committee to
discharge its work effectively
WAY FORWARD
The general outlook going forward
Table 2.3: Way forward – municipality future plans
Description Actions to address
Council committee meetings Compilation of a time schedule for meetings
Inter-governmental co-operation Improve functioning of intergovernmental
structures
Inter-governmental co-operation Independent Review of irregular and wasteful
expenditure
Oversight
Training programs to boost MPAC members
effectiveness
Appointment of audit committee
Table 3: Good governance and public participation challenges
2.1. POLITICAL GOVERNANCE STRUCTURE
INTRODUCTION TO POLITICAL GOVERNANCE
Section 151(3) of the Constitution states that the Council of a municipality has
the right to govern, on its own initiative, the local government affairs of the local

41
community. Council as political governance performs both legislative and
executive functions. Council focuses on decision-making to formulate policy
and to play an oversight and participatory role.
The legislative function of the Council is vested within the full Council with the
Speaker as its Chairperson. Council also established Section 79 and 80
committees within specific functional areas of the municipality.
The Audit/Performance Audit committee is an independent advisory body that
advises the municipal Council, political office-bearers, Accounting Officer and
Management Staff of the municipality on financial control, risk management,
accounting policies, performance management and effective governance.
The Municipal Public Account Committee (MPAC) fulfils the duty of and
Oversight Committee, and comprises non-executive Councillors, with the
specific purpose of providing Council with comments and recommendations on
the Annual Report. The Oversight Committee’s report is published separately
in accordance with MFMA guidelines. The MPAC Committee also investigates
fruitless, wasteful and unauthorized expenditure and make recommendations
to Council.
Apart from their functions as policy makers, councillors are also actively
involved in community work and the various social programmes in the
municipal area.
2.1.1 COUNCIL
The Political segment of the municipality comprises of a Municipal Council,
Executive Committee and Section 79/80 Committees. The Chairperson of the
Council is the Speaker and the Mayor chairs the Executive Committee. The
responsibility for the management of Council and Councillors adherence to the

42
Code of Conduct of Councillors rests with the Speaker. The Mayor on the other
hand manages the Executive Committee and the day-to-day affairs of Council.
This ensures harmonious relationships within Council and a clear line of
segregation of duties.
The Councillors are the custodians of the community needs and have a
number of legislative obligations that are assigned to them in terms of the
various pieces of legislation Acts that govern the existence and functioning of
the municipality. The following legislative obligations are imposed on municipal
councils:
Approval of the Integrated Development Plan (IDP) and the annual
budget of the Municipality, imposing of rates, taxes and other service
charges.
Oversight tabling of the annual budget, approval of service delivery and
budget implementation plans or the signing of annual performance
agreements and employees contracts of S54/56 managers.
Adoption and annual review of the policies of the municipality.
Approval of raising of loans Passing of by-laws.
uMshwathi Municipality had a total of twenty-seven (27) seats, allocated to 27
Councillors. Fourteen (14) of these seats were allocated to ward Councillors
who were elected through the wards they represented and thirteen (13) of
these seats were allocated to political parties in proportion to the number of
votes casted for the respective parties at the previous local government
elections in 2016.

43
Table 2.4 Political Parties Representation in Council
Below is a table that indicates council meetings attendance for the 2018/19
financial years:
Table 2.5 Council Meetings
Meeting dates Number of
resolutions passed
Aggregate Average
Percentage Councilor’s
attendance %
Average Percentage
apologies for non-
attendance
29/08/18 20 75 25
26/10/18 43 75 25
12/12/18 23 75 25
24/01/19 12 75 25
19/02/19 1 75 25
27/02/19 29 75 25
27/03/19 33 75 25
30/05/19 40 75 25
0
5
10
15
20
25
ANC IFP DA EFF
Council Representation
ANC IFP DA EFF
44
Meeting dates Number of
resolutions passed
Aggregate Average
Percentage Councilor’s
attendance %
Average Percentage
apologies for non-
attendance
26/06/19 32 75 25
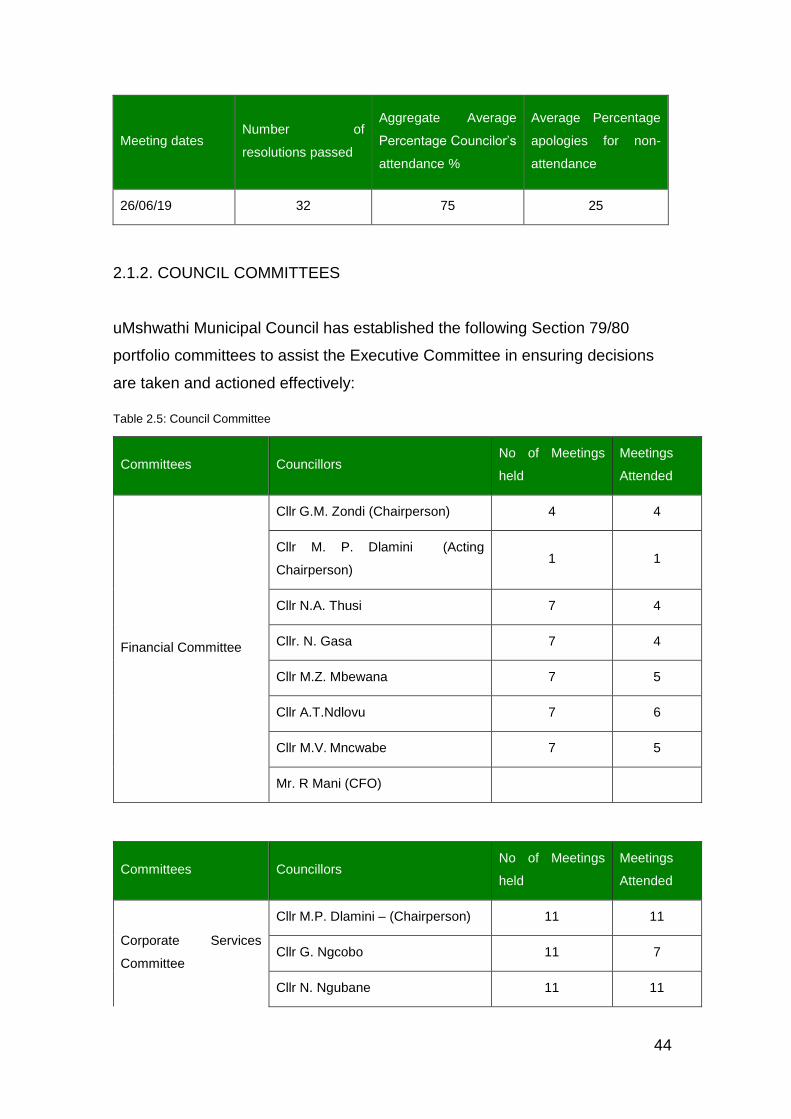
2.1.2. COUNCIL COMMITTEES
uMshwathi Municipal Council has established the following Section 79/80
portfolio committees to assist the Executive Committee in ensuring decisions
are taken and actioned effectively:
Table 2.5: Council Committee
Committees Councillors No of Meetings
held
Meetings
Attended
Financial Committee
Cllr G.M. Zondi (Chairperson) 4 4
Cllr M. P. Dlamini (Acting
Chairperson) 1 1
Cllr N.A. Thusi 7 4
Cllr. N. Gasa 7 4
Cllr M.Z. Mbewana 7 5
Cllr A.T.Ndlovu 7 6
Cllr M.V. Mncwabe 7 5
Mr. R Mani (CFO)
Committees Councillors No of Meetings
held
Meetings
Attended
Corporate Services
Committee
Cllr M.P. Dlamini – (Chairperson) 11 11
Cllr G. Ngcobo 11 7
Cllr N. Ngubane 11 11

45
Cllr S.J. Luthuli 11 9
Cllr. B.K Mkhize 11 6
Mrs. T.T. Mathenjwa (GM
Corporate Services)
Committees Councillors No of Meetings
held
Meetings
Attended
Infrastructure and
Planning Services
Committee
Cllr N.E. Cebekhulu (Chairperson) 7 7
Cllr M. Mngadi 7 5
Cllr S. Jila 7 7
Cllr N.R. Khanyile 7 7
Cllr. M. Dumakude 7 5
Mrs K Mncube
Community Services
Committee
Cllr S.M. Mbatha – Ntuli
(Chairperson) 9 9
Cllr C.S. Dube 9 3
Cllr L. P. Zondi 9 8
Cllr M.P. Majozi 9 5
Mrs N Mncube 9 0
Mr. B.T. Zondi (GM Community
Services) 9 9
Municipal Standing
Committee On Public
Accounts (MPAC)
Cllr. E.B. Mbongwe (Chairperson) 9 9
Cllr T. Dlame 9 6
Cllr N. Nzama 9 7
Cllr R. Govender 9 9
Cllr. P.M Dladla 9 9

46
2.1.3. POLITICAL DECISION-TAKING
Section 53 of the Municipal Systems Act (Act 32 of 2000) stipulates inter alia
that the respective roles and areas of responsibility of each political structure
and political office bearer of the municipality and of the municipal manager
must be defined. The section below is based on the Section 53 role
clarification that was approved at the Council.
MUNICIPAL COUNCIL
Governs by making and administrating laws, raising taxes and taking
decisions that affect people’s rights;
Is a tax authority that may raise property taxes and service levies;
Is the primary decision maker and takes all the decisions of the
Municipality except those that are delegated to political structures,
political once bearers, individual Councillors or officials;
Can delegate responsibilities and duties for the purposes of fast and
effective decision making;
Must strive towards the constitutional objects of local government;
Must consult the community with respect to local government matters;
and
Is the only decision maker on non-delegated matters such as the
approval of the IDP and budget.
HONOURABLE MAYOR
Is the executive and political leader of the municipality and is in this
capacity supported by the Executive committee;
Is the social and ceremonial head of the municipality;
must identify the needs of the Municipality and must evaluate progress
against key performance indicators;
Is the defender of the public’s right to be heard;
Mr. N.M Mabaso 9 5

47
Has many responsibilities with respect to the annual budget, the budget
process, budget control and various other financial matters; and
Performs the duties and exercise the responsibilities that were
delegated to him by the Council.
EXECUTIVE COMMITTEE
In terms of section 43 (2) of the Municipal Structures Act No. 117 of
1998, an executive committee must be composed in such a way that
parties and interests represented in the municipal council are
represented in the executive committee substantially the same
proportion as they are represented in the Council;
In terms of section 44 of the Local Government: Municipal Structures
Act No. 117 of 1998, the Executive Committee established, is the
principal committee of the Municipal Council which guides the Council in
performing its role of political oversight of the municipality’s functions,
programmes and the management of the administration;
The executive committee received reports from other committees of the
Council and forwarded these reports together with its recommendations
to the Council for Resolutions; and
The Executive Committee comprised of four ANC Councillors and one
IFP Councillor.
The table below shows the Executive Committee Councillors within their
specific political parties and wards.
TABLE 2.6 EXCUTIVE COMMITTEE COUNCILLORS
Ward Councillor Party Responsibility Male/Female
PR Councillor Cllr G.M. Zondi ANC Mayor Male
Ward 1 Cllr M.P. Dlamini ANC Deputy Mayor Male
Ward 4 Cllr N.E. Cebekhulu ANC Ward Councillor Male
Ward 7 Cllr Mbatha – Ntuli ANC Ward Councillor Female
PR Councillor Cllr M.P. Majozi IFP PR Councillor Male

48
The table below provides an analysis of the Council Resolutions taken and
implemented during the year:
Table 2.7 Council Resolutions
Number of Council Resolutions
taken during the year
Number of Council Resolutions
implemented during the year
Number of Council
Resolutions not implemented
during the year
0 0 0
Total of resolutions
implemented 0%
The following Councillor were elected by the Municipality to represent
uMshwathi at the uMgungundlovu District Municipality (UMDM).
Table 2.9 District representatives Councilors
Representative Local Municipality District Municipality
Cllr S.J. Luthuli uMshwathi uMgungundlovu
Cllr G. Ngcobo uMshwathi uMgungundlovu
Cllr B.K. Mkhize uMshwathi uMgungundlovu

49
REPORTING STRUCTURE (POLITICAL)
The Terms of Reference for Council
UMSHWATHI MUNICIPAL
COUNCIL
EXECUTIVE
COMMITTEE
Community Services
Portfolio Committee
Audit Committee
MPAC
Infrastructure & Planning
Services Portfolio
Committee
Financial Services
Portfolio
Committee
Corporate Services
Portfolio Committee

50
2.2 ADMINISTRATIVE GOVERNANCE STRUCTURE
The Municipal Manager is the head of uMshwathi Municipality administration,
as well as its Accounting Officer. He has extensive statutory and delegated
powers and responsibilities.
The Municipal Manager is, amongst others, responsible:
For the formation and development of an economical, effective, efficient
and accountable administration;
To ensure that the municipal “machine” operates efficiently, that the
organizational structure is able to perform the various tasks and
exercise the necessary controls;
The Municipal Manager works closely with the corporate services
manager to fulfill a leadership role in the administration; this is of utmost
importance to influence the actions of staff and to inspire and persuade
them to work together to realize the municipality’s goals; He is also ably
assisted by the Technical Services manager on the implementation of
the municipality’s integrated development plan, and the monitoring of
progress on MIG infrastructure projects; and
For the financial responsibilities the Chief Financial Officer aids him
through the control of budget and expenditure as determined by the
MFMA.
The Municipal Manager is the chief adviser of the municipality and must
advise the political structures and political office-bearers of the
municipality. The Municipal Manager must see to the execution of the
decisions of the political structures and political office-bearers of the
municipality.

51
His executive management team, whose structure is outlined in the table
below, assists him:
Table 2.10: Administrative governance structure
Name of Official Department
Performance agreement signed
(Yes/No)
Mr. N. M Mabaso Municipal Manager Yes
Mr. R Mani GM Finance Yes
Mr. B.T. Zondi GM Community Services Yes
Mrs. T.T. Mathenjwa GM Corporate Services Yes
Mrs. N. Mncube GM Technical Services Yes
COMPONENT B: INTER-GOVERNMENTAL RELATIONS
It is the intention of uMshwathi Municipal Administration and Council to ensure
that its communities derive maximum benefits from its participation in inter-
governmental forums and meetings.
2.3 INTER-GOVERNMENTAL RELATIONS (IGR)
In terms of the Constitution of South Africa, all spheres of government and all
organs of state within each sphere must co-operate with one another in mutual
trust and good faith fostering friendly relations. They must assist and support
one another, inform and consult one another on matters of common interest,
coordinate their actions, adhering to agreed procedures and avoid legal
proceedings against one another. This notion is largely captured through the
co-operative way that inter government agencies work together in the war
rooms at ward level. UMshwathi municipality plays a pivotal role of co-
ordination and referrals to assist its communities with day to day necessities

52
like grants and pension pay-out information, identity documents applications
and proof of address.
Table 2.11 Inter-governmental structures
Name of Structure Members
Focus Area
Outcomes of
Engagements/To
pics Discussed
Operation Sukuma
Sakhe
Dept. of Health;
Dept. of Home
Affairs; Dept. of
transport and other
sector departments
Most vulnerable groups
Support Broad
government
based initiatives
EPWP
SALGA; LED/IDP
officials, Dept. of
Works
Youth Unemployment
Provincial and
district based
initiatives
2.3.2. JOINT FUNCTION AND PROJECTS WITH SECTOR DEPARTMENTS
All the functions of government are divided between the different spheres
namely National, Provincial and Local. The municipality therefore share their
area and community with other spheres of government and their various sector
departments and has to work closely with national and provincial departments
to ensure the effective implementation of various projects and functions.
The table below provides detail of such projects and functions:
Table 2.12: Joint projects and functions with sector departments
Name of Project/
Function
Expected Outcome/s
of the Project
Sector Department/s
involved
Contribution of Sector
Department
War on Poverty
Reduce poverty in
identified poorest
wards in municipal
Local Department of
Rural Development
Established steering
committee with
municipality and other

53
Name of Project/
Function
Expected Outcome/s
of the Project
Sector Department/s
involved
Contribution of Sector
Department
area local departments
Police Forum Community Safety SAPS Different local department
meetings
Aids Council Addressing Aids
Social Services and
different local
departments
Meetings and
programmes
COMPONENT C: PUBLIC ACCOUNTABILITY
MSA S15 (b): requires a municipality to establish and organise its
Administration to facilitate a culture of accountability amongst its staff. S16 (i):
states that a municipality must develop a system of municipal governance that
compliments formal representative governance with a system of participatory
governance. S18 (i) (d): requires a municipality to supply its community with
information concerning municipal governance, management and development.
Such participation is required in terms of:
The preparation, implementation and review of the IDP;
Implementation and review of the performance management system;
Monitoring and review of the performance, including the outcomes and
impact of such performance; and preparation of the municipal budget.
2.4. PUBLIC MEETINGS
Accountability and community participation were enhanced by engagements
through the following media:
School announcements for students to tell parents to attend Council
meetings;

54
Community radio: advertising during popular shows in both English and
isiZulu languages;
Local Newspaper, and own municipal newsletter;
Pamphlets at houses;
Posters on strategic places in towns.
The table below shows the different public meetings for the 2018/19 financial
year.
Table 2.13 Public Meetings
The purpose of a ward committee is:
To solicit participation from the community to inform council decisions;
To make Councillors accountable to the people that elected them
To ensure effective communication between the council and the
community; and
To assist the ward councillor with consultation and report-backs to the
community.
2.4.1. WARD COMMITTEES
Ward committees should be elected by the community they serve. A ward
committee may not have more than 10 members and women should be well
represented. The ward councillor serves on the ward committee and act as the
Nature and
purpose of
meeting
Number
of
meetings
Number of
participating
municipal
councillors
Number of
participating
municipal
administrators
Est
Number of
community
members
attending
IDP Imbizo 15 1 10 200
Budget Imbizo 15 1 10 300

55
chairperson. Although ward committees have no formal powers, they advise
the ward councillor who makes specific submissions directly to the council.
These committees play a very important role in the development and annual
revision of the integrated development plan of the area.
The ward committees support the ward councillor who receives reports on
development, participates in development planning processes, and facilitates
wider community participation. To this end, the municipality constantly strives
to ensure that all ward committees function optimally with community
information provision, convening of meetings, ward planning, service delivery,
IDP formulation and performance feedback to communities.
The table below provides information of the ward committee meetings held
during the 2018/19 financial year:
Table 2.14 Ward committee meetings
Ward Town No. of
meetings
Dates of
meetings
No. of
Councillors
Attended
No. of
Municipal
Administrator
s Attended
No. of
Community
Members
Attended
1 4 1 0 10
2 2 1 0 10
3 2 1 0 10
4 2 9 June 2019 1 0 10
5 2 1 0 10
6
2.4.2 FUNCTIONALITY OF WARD COMMITTEES
The table below provides information on the composition and functionality of
ward committees as follows:
Ward committee meetings held during the year include scheduled
meetings between ward councillor and committee members, including

56
IDP/Ward Committee engagements as part of the IDP process for the
2018/19 planning year.
Number of reports does not include IDP/Ward committee engagements
for which specific reports.
Functionality of ward committees is determined by the active
engagements of ward committees with communities on public platforms
and direct interactive sessions to improve or create better communities
are reflected in the IDP minutes.
Table 2:15 Functioning of ward committees
Ward number Committee established:
Yes / No
Number of reports submitted to the speaker’s/
IDP office
1 Yes 104
2 Yes 104
3 Yes 104
4 Yes 104
5 Yes 104
6 Yes 104
7 Yes 104
8 Yes 104
9 Yes 104
10 Yes 104
11 Yes 104
12 Yes 104
13 Yes 104
14 Yes 104
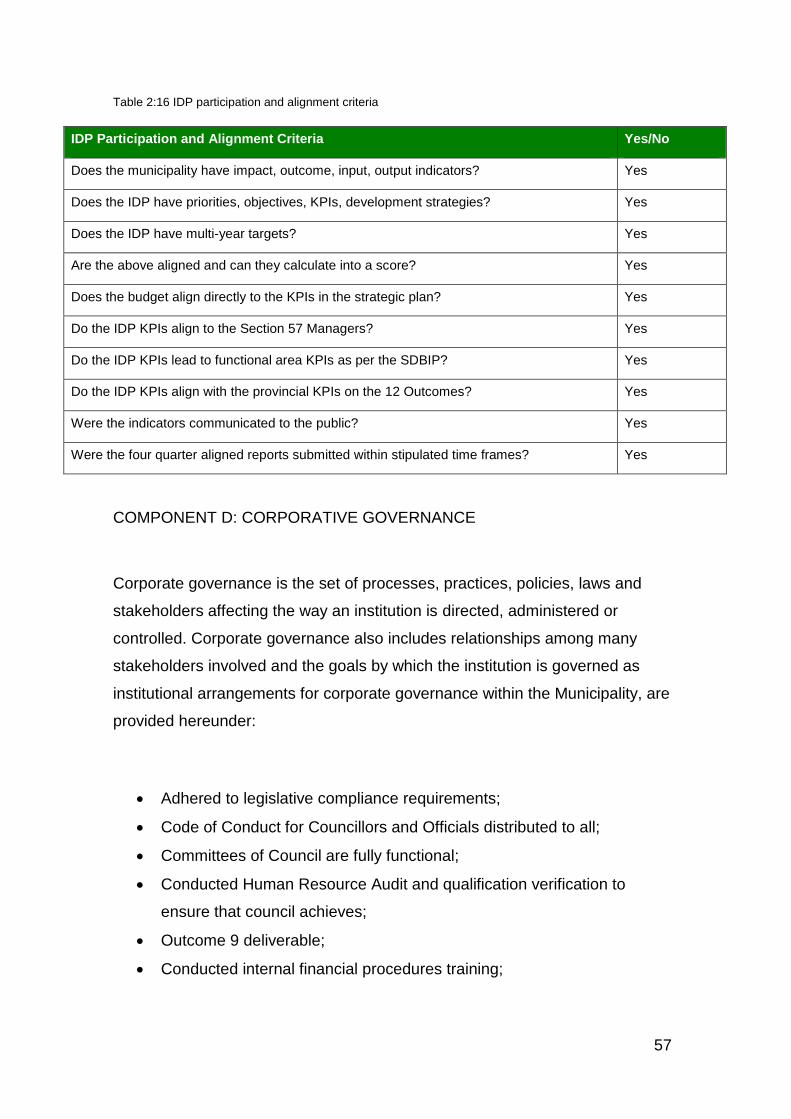
2.4.3 IDP PARTICIPATION AND ALIGNMENT CRITERIA
The MSA requires that local government structures prepare IDP’s. The IDP
serves as a tool for the facilitation and management of development within the
municipal area. The function for the preparation of the IDP is under the Office
of the Municipal Manager and the authority for the preparation of the IDP is
delegated to an official.
57
Table 2:16 IDP participation and alignment criteria
IDP Participation and Alignment Criteria Yes/No
Does the municipality have impact, outcome, input, output indicators? Yes
Does the IDP have priorities, objectives, KPIs, development strategies? Yes
Does the IDP have multi-year targets? Yes
Are the above aligned and can they calculate into a score? Yes
Does the budget align directly to the KPIs in the strategic plan? Yes
Do the IDP KPIs align to the Section 57 Managers? Yes
Do the IDP KPIs lead to functional area KPIs as per the SDBIP? Yes
Do the IDP KPIs align with the provincial KPIs on the 12 Outcomes? Yes
Were the indicators communicated to the public? Yes
Were the four quarter aligned reports submitted within stipulated time frames? Yes
COMPONENT D: CORPORATIVE GOVERNANCE
Corporate governance is the set of processes, practices, policies, laws and
stakeholders affecting the way an institution is directed, administered or
controlled. Corporate governance also includes relationships among many
stakeholders involved and the goals by which the institution is governed as
institutional arrangements for corporate governance within the Municipality, are
provided hereunder:
Adhered to legislative compliance requirements;
Code of Conduct for Councillors and Officials distributed to all;
Committees of Council are fully functional;
Conducted Human Resource Audit and qualification verification to
ensure that council achieves;
Outcome 9 deliverable;
Conducted internal financial procedures training;

58
Engage in capacity building programmes for officials to meet minimum
competency requirements;
Established Local Labour Forum to ensure harmonious working
relationships amongst organised labour;
IGR Framework is implemented, and the coordination is functional and
effective;
Institutionalised internal Financial Controls; and
Oversight Committees, which are Audit and MPAC, are all functional.
2.5 RISK MANAGEMENT
Risk management is a systematic and formalised process instituted by the
municipality to identify, assess, manage, monitor and report risks to ensure the
achievement of objectives.
In terms of Section 62(1)(c)(i) and Section 95(c)(i) of the Municipal
Finance Management Act (MFMA), No. 56 of 2003, it requires the
accounting officer to ensure that the municipality and municipal entities,
if any, have and maintain effective, efficient and transparent systems of
risk management.
The main reason for risk management is that the service delivery
environment and the public sector’s interface with stakeholders have
become far more demanding and volatile than before.
The objective of the Risk Management Policy is to assist management and
Council to make informed decisions which will:
Improve the municipality’s performance on decision making and
planning;
Provide a sound basis for integrated risk management and internal
control as components of good corporate governance;
Assist management in ensuring more effective reporting and
compliance with applicable laws, regulations and other corporate
governance requirements.

59
Enhance a culture of good governance, ethical conduct; discourage
inefficiencies and counter fraud and corruption. This includes:
Sustainable and reliable services delivery
Informed decisions supported by proper due intelligence;
Innovation
Reduced waste
Prevent fraud and corruption
Value for money through efficient use of resources
Sound and programme management leading to designed outputs
and outcomes
2.5.2 TOP FIVE RISKS
High level debtors that may have to be written off as bad debt or settled
at a costly discount
Occurrence of irregular and fruitless expenditure
Disasters that can be triggered by climate changes and expose local
response capacity
ITC infrastructure
SCM compliance and political interferences
2.5.2.1 ACTION TO ADDRESS THETOP FIVE RISKS
The table below provides the actions implemented/that will be implemented to
address the top five risks:
Table 2.17 Action Plan to address the top five risks
Risk Actions implemented or that will be
implemented
Outstanding debtors Credit Control Policy implementation and installation of prepaid meters
Liquidity Credit Control Policy implementation and cost containment
Scarce water resources
Occurrence of irregular and fruitless expenditure Update supplier database and training of officials and councillors

60
2.5.3 APPROVED RISK POLICIES AND STRATEGIES
Table 2.18 Approved risk policies and strategies
Name of strategy / policy Developed
Yes/No Date adopted/reviewed
Risk Management Policy
Yes Not yet reviewed
2.5.3 APPROVED RISK POLICIES AND STRATEGIES
Table 2.18 Approved risk policies and strategies
Name of strategy / policy Developed
Yes/No Date adopted/reviewed
Risk Management Policy
Yes Not yet reviewed
2.6 ANTI-CORRUPTION AND ANTI-FRAUD
Section 83(c) of the MSA refers to the implementation of effective bidding
structures to minimize the possibility of fraud and corruption and the Municipal
Finance Management Act (MFMA), section 112(1) (m)(i) identifies supply chain
measures to be enforced to combat fraud and corruption, favoritism and unfair
and irregular practices. Section 115(1) of the MFMA states that the accounting
officer must take steps to ensure mechanisms and separation of duties in a
supply chain management system to minimize the likelihood of corruption and
fraud.
2.6.1 DEVELOPED STRATEGIES
Table 2.19 Strategies
Name of strategy / Policy Developed
Yes/No Date adopted/reviewed
Combating the Abuse of Supply Chain
Management Regulations Yes July 2019

61
Name of strategy / Policy Developed
Yes/No Date adopted/reviewed
Audit Charter Yes 5 December 2019
2.7 AUDIT COMMITTEE/S
Section 166(2) of the MFMA states that an audit committee is an independent
advisory body, which must:
Advise the Municipal Council, the political office-bearers, the accounting
officer and the management staff of the municipality, on matters relating
to:
Internal financial control;
Risk management;
Performance management; and
Effective governance
2.7.1 FUNCTIONS OF THE AUDIT COMMITTEE
The audit committee has the following main functions as prescribed in
section 166 (2) (a-e) of the Municipal Finance Management Act, 2003
and the Local Government Municipal and Performance Management
Regulation:
To advise the council on all matters related to compliance and effective
governance;
Respond to the council on any issues raised by the auditor-general in
the audit report;
To review the quarterly reports submitted to it by the internal audit;
To evaluate audit reports pertaining to financial, administrative and
technical systems;
To review the performance management system and make
recommendations in this regard to council;

62
To identify major risks to which council is exposed and determine the
extent to which risks have been minimized;
Review the plans of the internal audit function and in so doing, ensure
that the plan addresses the high-risk areas and ensure that adequate
resources are available;
To review the annual financial statements to provide council with an
authoritative and credible view of the financial position of the
municipality, its efficiency and its overall level of compliance with the
MFMA, the annual Division of Revenue Act (DoRA) and other applicable
legislation.
2.7.2 MEMBERS OF THE AUDIT COMMITTEE
Table 2.20 Members of the Audit Committee
Name of representative
Capacity Meeting Attended
Professor B. Stobie Chairperson 4/5
Ms. P Sithole Member 5/5
Ms. K Narshai Member 4/5
Mr. Lunga Senior Manager Office of the MM 4/5
2.8 PERFORMANCE AUDIT COMMITTEE
The Regulations require that the performance audit committee is comprised of
a minimum of three members, the majority of whom are external (neither a
councilor nor an employee) of the municipality. Section 14(2) (b) of the
Regulations further stipulates that the performance audit committee must
include at least one person who has expertise in performance management. It
is also a requirement of the Regulations in Section 14(2)(d) that the Council of
a municipality designate neither a member of the performance audit committee
who is neither a councilor nor an employee of the municipality as the
chairperson of the committee.

63
In terms of Section 166(4) (a) of the MFMA, an audit committee must consist of
at least three persons with appropriate experience. The majority may not be in
the employ of the municipality.
Section 166(5) of the MFMA, requires that the members of an audit committee
must be appointed by the council of the municipality. One of the members, not
in the employ of the municipality, must be appointed as the chairperson of the
committee. No councilor may be a member of an audit committee.
Both the Regulations and the MFMA, indicate that three is the minimum
number of members needed to comprise a performance audit committee.
While the regulations preclude the appointment of a councilor as chairperson
of the performance audit committee, the MFMA excludes the involvement of a
councillor in the composition of an audit committee entirely.
Section 14(3) (a) of the Regulations requires that the performance audit
committee of a municipality must meet at least twice during each financial
year. However, any member of the committee may call for additional special
meetings of the performance audit committee, where sufficient justification
exists in terms of Section 14(3) (b) of the Regulations.
In terms of Section 14(4) (a) of the Regulations the performance audit
committee has the responsibility to:
i. Review the quarterly reports produced and submitted by the internal
audit process;
ii. Review the municipality’s performance management system and make
recommendations in this regard to the council of the municipality; and
iii. At least twice during each financial year submit a performance audit
report to the council of the municipality.
FUNCTIONS OF THE PERFORMANCE AUDIT COMMITTEE
2.8.2 MEMBERS OF THE PERFORMANCE AUDIT COMMITTEE
The Audit Committee fulfils the functions of the Performance Audit Committee.

64
2.9 INTERNAL AUDITING
2.9.1 RISK REGISTER AND THREE-YEAR STRATEGIC PLAN
Section 165 (2) (a), (b) and (c) of the MFMA requires that the internal audit unit
of a municipality must:
a) Prepare a risk based audit plan and an internal audit program for each
financial year; and
b) Advise the accounting officer and report to the audit committee on the
implementation of the internal audit plan and matters relating to:
Internal audit;
Internal controls;
Accounting procedures and practices;
Risk and risk management;
Performance management;
Loss control; and
Compliance with this act, the annual Division of Revenue Act and any
other applicable legislation; and
c) Perform such other duties as may be assigned to it by the Accounting
Officer.
A risk assessment was performed during 2019 and all relevant risks were
populated into a new risk register for. This risk assessment formed the basis of
the 3-year Strategic Audit Plan.
2.9.2 ANNUAL AUDIT PLAN
The risk based audit plan for 2018/19 was executed based on the above
approach and methodology.

65
2.10 SUPPLY CHAIN MANAGEMENT
Section 110-119 of the Supply Chain Management Regulations 2005 and
relevant MFMA circulars, stipulate the required processes and guidance to
help ensure that SCM arrangements provide appropriate goods and services,
offer best value for money and minimize opportunities for fraud and corruption.
uMshwathi municipality SCM Policy was approved by Council on 30 July 201.
Reports on the implementation of the SCM Policy are submitted monthly to the
Accounting Officer. These reports are also tabled in special council meetings.
The procurement processes consists of the following components:
Contract Management – is usually completed by the respective
department, depending on the type of service that is requested.
Advertising – Formal quotations (R30 001 to R 199 999), are
advertised on the notice boards and website of the municipality for
seven (7) days, and formal tenders are advertised for three (3) weeks
on the website and in the local newspapers as contemplated in the SCM
Regulations.
Specification – never uses the Specification Committee, due to the
shortage of sufficient personnel to fulfill this function.
Evaluation – The evaluation of formal quotations and tenders are done
on the respective principles of 80/20 and 90/10 (as prescribed in the
SCM Regulations), depending on the type of services that was
requested. The report of such evaluation, is forwarded to the
Adjudication Committee.
Adjudication – This committee usually accept the proposal of above
standing committee or refer the proposal and report back to the
Evaluation Committee, if additional information is needed regarding the
proposed contractor.

66
2.11 BY-LAWS AND POLICIES
Section 11 of the MSA gives municipal councils the executive and legislative
authority to pass and implement by-laws and policies.
Below is a list of all the policies developed and reviewed during the financial
year:
Table 2.21 Policies
Policies developed/revised Date adopted
Public participation
conducted prior to adoption
of policy(Yes/No)
Resolution Number
Tariff Policy 31 May 2019 No SR8/05-19
Cash and Investment Management
Policy 31 May 2019 No SR8/05-19
Credit Control Policy 31 May 2019 No SR8/05-19
Tax Policy 31 May 2019 No SR8/05-19
Below is a list of all the by-laws developed and reviewed during the financial year Table 2.22 By-laws
By-laws developed/revised
Date adopted Public participation
conducted prior to adoption of policy (Yes/No)
Date of publication
No by-laws developed or revised during 2018/19
N/A N/A N/A
2.12 WEBSITE
Municipalities are required to develop and maintain a functional website that
displays relevant information as per the requirements of S75 of the MFMA and
S21A and B of the Municipal Systems Act (“MSA”) as amended.
The website should serve as a mechanism to promote accountability and
transparency to communities and therefore information posted should be
accurate and timeously updated. The municipal website is a key

67
communication mechanism in terms of service offering, information sharing
and public participation. It is a communication tool that should allow easy and
convenient access to relevant information. The municipal website should serve
as an integral part of the municipality’s communication strategy.
The table below gives an indication about document that are published on our
website.
Table 2.23 Website checklist
Description of information and/or document Yes/No and/or Date
Published
Municipal contact details (Section 14 of the Promotion of Access to Information Act)
Full Council details Yes
Contact details of the Municipal Manager Yes
Contact details of the CFO Yes
Physical address of the Municipality Yes
Postal address of the Municipality Yes
Financial Information (Sections 53, 75, 79 and 81(1) of the Municipal Finance Management Act)
Draft Budget 2018/19 Yes
Adjusted Budget 2018/19 Yes
Asset Management Policy Yes
Customer Care, Credit control & Debt collection Policy Yes
Indigent Policy Yes
Funds and Reserves Policy Yes
Investment & Cash Management Policy Yes
Rates Policy Yes
Supply Chain Management Policy Yes
Tariff Policy Yes
Petty Cash Policy Yes
Travel and Subsistence Policy Yes

68
Description of information and/or document Yes/No and/or Date
Published
SDBIP 2018/19
Yes
Integrated Development Plan and Public Participation (Section 25(4)(b) of the Municipal Systems Act
and Section 21(1)(b) of the Municipal Finance Management Act)
Reviewed IDP for 2018/19 Yes
IDP Process Plan for 2018/19 Yes
Supply Chain Management (Sections 14(2), 33, 37 &75(1)(e)&(f) and
120(6)(b)of the Municipal Finance Management Act and Section 18(a) of
the National SCM Regulation)
SCM contracts above R30 000 Yes
Service delivery agreements Yes
Public invitations for formal price quotations Yes
Reports (Sections 52(d), 71, 72 &75(1)(c) and 129(3) of the Municipal
Finance Management Act)
Annual Report of 2018/19 Yes
Oversight reports Yes
Quarterly Reports
Yes
Local Economic Development (Section 26(c) of the Municipal Systems
Act)
Local Economic Development Strategy Yes
LED Policy Framework Yes
Economic Profile Yes
LED Projects Yes
Performance Management (Section 75(1)(d) of the Municipal Finance
Management Act)

69
2.13 COMMUNICATIONS
2.13.1 COMMUNICATION ACTIVITIES
Table 2.24 Communication activities
Communication activities Yes/No Date
Approved/Completed
Communication strategy No N/A
Communication Policy No N/A
Functional complaint management systems Yes Continuous monthly
Customer satisfaction surveys Yes June 2019
2.13.2 COMMUNICATION UNIT
Table 2:25 Communications
Communication Unit
Yes/No Number of people in
the Unit Job titles
Yes 1 1
2.14 PUBLIC SATISFACTION WITH MUNICIPAL SERVICES
During the year, the municipality commissioned an independent company to
conduct a community satisfaction survey and the findings appear on the table
below. The survey covered all fourteen wards using local youth and focused
mainly on the level of community satisfaction with the municipality service
delivery. A survey consisted of 5 320 households, 4 300 households
responded and that is equivalent to 81% response rate. Aggregated results
appear below.
Table 2:26 Satisfaction surveys
Satisfaction Surveys Undertaken during: Year -1 and Year 0

70
Subject matter of survey Survey
method
Survey date No. of
people
included in
survey
Survey results
indicating
satisfaction or better
(%)*
Overall satisfaction with: 00 Missing
(a) Municipality 00 Missing
(b) Municipal Service Delivery 00 Missing
(c) Mayor 00 Missing
Satisfaction with: 00 Missing
(a) Refuse Collection 00 Missing
(b) Road Maintenance 00 Missing
(c) Electricity Supply 00 Missing
(d) Water Supply 00 Missing
(e) Information supplied by municipality to
the public
0 Missing
(f) Opportunities for consultation on
municipal affairs
00 Missing
CHAPTER 3: SERVICE DELIVERY PERFOMANCE PERFORMANCE
REPORT
PART ONE
COMPONENT A: SERVICE DELIVERY PERFOMANCE

71
3.1 PERFORMANCE MANAGEMENT
Chapter 6 of the Municipal Systems Act, Act 32 of 2000 and the Municipal
Planning and Performance Management Regulations, 796 of August 2001,
prescribes uMshwathi municipality’s performance management system.
Section 7(1) of the above-mentioned regulation states that “A municipality’s
performance management system entails a framework that describes and
represents how the municipality’s cycle and processes of performance
planning, monitoring, measurement, review, reporting and improvement will be
conducted, organised and managed, including determining the responsibilities
of the different role players.” This framework, inter alia, reflects the linkage
between the IDP, budget, SDBIP and individual and service provider
performance. The financial year under review witnessed an improvement in the
rate of the service delivery. Provision of basic services is essential for
sustained community livelihood, public health, development and safety. These
services include water, electricity, sewerage, sanitation, and solid waste
management. In our context, most of these services are the responsibility of
the District Municipality and other State Owed Companies such as Eskom for
the distribution of electricity.
3.1.1 ORGANISATIONAL PERFORMANCE ACHIEVE
The organisational performance management system monitored and evaluated
using the SDBIP and the performance process can be summarised as follows:
Completion of grounds work for uMshwathi Ridge project
The top layer SDBIP was approved by the Mayor on 28 August 2018
The municipality utilizes a manual based performance management
system updated on a quarterly basis.
The first quarterly report submitted to Council on 12 December 2018
and the second quarterly report formed part of the section 72 report in
terms of the Municipal Finance Management Act, submitted to Council
on 24 January 2019.
Internal Audit audits the performance measurements of the municipality
on a continuous basis as prescribed by the relevant legislation, which

72
includes submission of reports on a quarterly basis to the Municipal
Manager and Performance Audit Committee.
Monitoring of the SDBIP was done through quarterly reporting to the
Department of Corporate Services and audited by the internal auditors
on a quarterly basis
The performance agreements for the 2018/19 financial year for the
managers of Community Services, Finance, Technical Services and
Corporate Services were signed as prescribed.
3.1.2 PERFORMANCE CHALLENGES
High cost of construction materials in rural areas
Huge infrastructure backlog
High repairs and maintenance cost and aging infrastructure
5 568 households which have no access to piped water
3.1.3 THE WAY FORWARD
3.2 THE IDP AND THE BUDGET
The graph above presents a summary of project priority list as it appears in
2018/2019 IDP document. The graph shows that there is a high demand for
the construction and upgrading of existing roads. Demand for the construction
of crèches and children centres follows in second place.
3.3 STRATEGIC SERVICE DELIVERY BUDGET IMPLEMENTATION
PLAN
The purpose of strategic performance reporting is to report specifically on the
implementation and achievement of IDP outcomes. The SDBIP is the
municipality’s strategic plan and shows the strategic alignment between the
different documents (IDP, budget and performance agreements).

73
3.4 SERVICE PROVIDERS STRATEGIC PERFORMANCE
Section 76(b) of the MSA states that KPIs should inform the indicators set for
every municipal entity and service provider with whom the municipality has
entered into a service delivery agreement. A service provider:
means a person or institution or any combination of persons and
institutions which provide to or for the benefit of the local community
External service provider means an external mechanism referred to in
section 76(b) which provides a municipal service for a municipality
Service delivery agreement means an agreement between a
municipality and an institution or person mentioned in section 76(b) in
terms of which a municipal service is provided by that institution or
person, either for its own account or on behalf of the municipality
During the year under review the municipality did appoint service providers
who provided municipal services to or for the benefit of the local community on
behalf of the municipality. The achievement of service providers in terms of
contract completion is at 89%. All contract appointments are regularly
monitored to ensure timeous completion and required service level targets.
3.5 MUNICIPAL FUNCTIONS
3.5.1 ANALYSIS OF FUNCTIONS
The powers and functions performed by local authorities in South Africa are
defined primarily in Section 156 and 229 of the Constitution (Act 108 of 1996).
The Local Government Municipal Structures Act (117 of 1998), read together
with the Local Government Municipal Structures Amendment Act (33 of 2000),
divides the powers and functions, as set out in the Constitution between district
and local municipalities (Section 84). The Act together with the Amendment
Act, Section 85(1), allows the MEC for COGTA to further adjust the division of
certain of these functions between district and local municipalities, whilst
Section 84(3) (a) allows only the Minister for Provincial and Local Government
to authorize a category B municipality to perform the following functions.

74
The municipal functional areas are as indicated below:
Table 3.2 Municipal Functional area’s
Municipal Function
Municipal Function
Yes / No
Constitution Schedule 4, Part B functions:
Air pollution No
Building regulations Yes
Child care facilities Yes
Electricity installations Yes
Firefighting services No
Local tourism Yes
Municipal airports No
Municipal planning Yes
Municipal health services Yes
Municipal public transport No
Municipal public works only in respect of the needs of municipalities in
the discharge of their responsibilities to administer functions
specifically assigned to them under this Constitution or any other law
No
Pontoons, ferries, jetties, piers and harbours, excluding the regulation
of international and national shipping and matters related thereto No
Storm water management systems in built-up areas Yes
Trading regulations Yes
Sanitation services domestic waste collection and disposal systems Yes
Constitution Schedule 5, Part B functions:
Beaches and amusement facilities No
Billboards and the display of advertisements in public places No
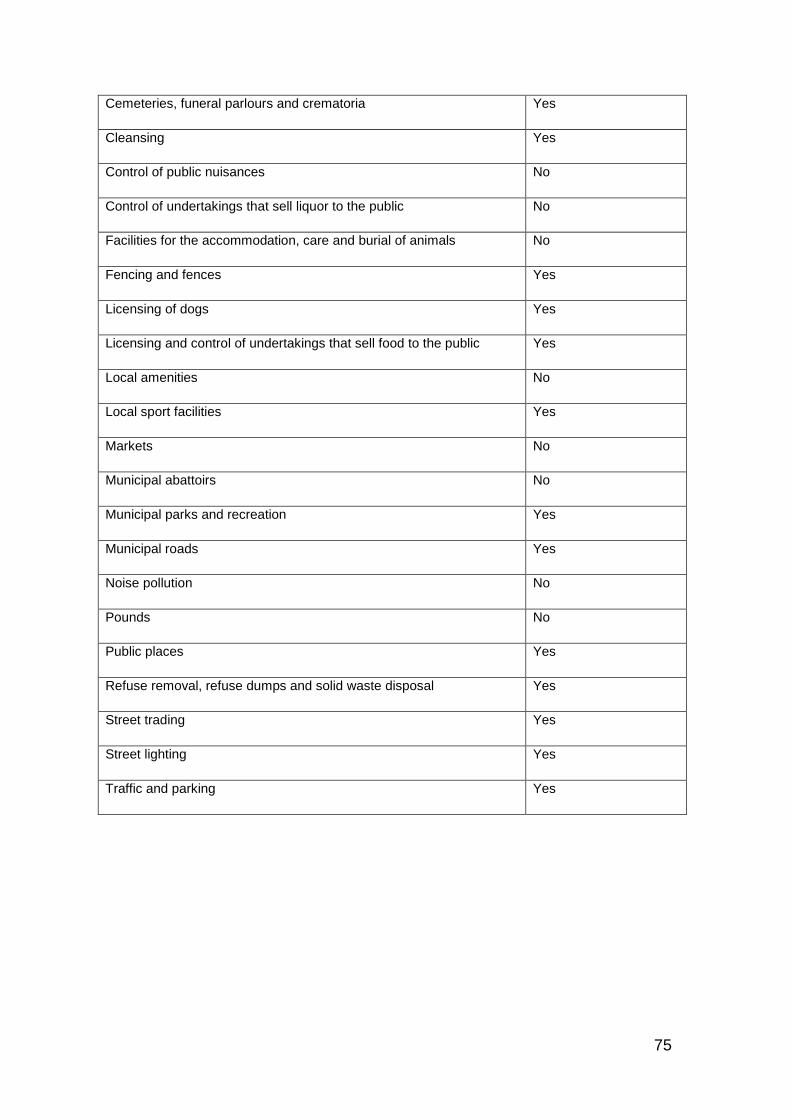
75
Cemeteries, funeral parlours and crematoria Yes
Cleansing Yes
Control of public nuisances No
Control of undertakings that sell liquor to the public No
Facilities for the accommodation, care and burial of animals No
Fencing and fences Yes
Licensing of dogs Yes
Licensing and control of undertakings that sell food to the public Yes
Local amenities No
Local sport facilities Yes
Markets No
Municipal abattoirs No
Municipal parks and recreation Yes
Municipal roads Yes
Noise pollution No
Pounds No
Public places Yes
Refuse removal, refuse dumps and solid waste disposal Yes
Street trading Yes
Street lighting Yes
Traffic and parking Yes

76
3.6 OVERVIEW OF PERFORMANCE PER WARD
3.6.1 LARGEST CAPITAL PROJECTS
Table 3.3 Capital projects of all Wards
Capital Projects
No. Project Name and detail Start Date End Date
Total Value
R
1
2
3
4
5
The above analysis includes only the 5 largest capital projects of the ward
Table 3.4 Basic service provision for all Wards
Basic Service Provision
Detail Water Sanitation Electricity Refuse Housing
Formal households 0 2 496 2 496 2 496
Informal
households 187 187 187 187
Total Households* 2 683 2 683 2 683 2 683
Houses completed in year 0
Shortfall in Housing units 1 179

77
COMPONENT B: BASIC SERVICES
Performance targets for basic services were set, taking into account the
financial position of the municipality and the availability of resources. The focus
was on delivering the basic services to the community to the best of its ability
with limited resources and finance.
The municipality delivers the following basic services to its residents:
Sanitation provision
Waste management
Housing
Free basic services and indigent support
Table 3.5 Household Services
Flush toilet
connected to
sewerage and septic
tanks %
Weekly refuse
removal %
Piped water inside
dwelling %
Electricity for
lighting %
2001 2011 2001 2011 2001 2011 2001 2011
41.9 53.7 60.2 72.5 41.6 59.8 72 76.9
3.7 WATER PROVISION
UMgungundlovu District Municipality (UMDM) is the water service authority
(WSA) and water service provider (WSP) to six of its seven local municipalities
that include uMshwathi municipality.
uMshwathi Municipality plays a consultative and an oversight role. Almost half
of the district population get water from uMngeni Water and the rest gets water
through the District water tankers and from natural sources. In numbers, 6 344
households of the 23 732 have access to water inside their dwellings and a
further 11 453 have access to water inside their yards. The information from
census 2011 also indicates that there are 4 759 standpipes which provide

78
communities with access to water. The concern for the Municipality, however,
is the 5 568 households which have no access to piped water. The Blue drop
risk rating is at 15.12%. The Blue drop score is at 84% which shows an
increase.
The water sources in the municipal area are as follows:
Table 3.6 Sources of Water (Census 2011)
Sources of Water
Regional/Local water scheme (operated by
municipality or other water services provider) 72%
Borehole 23%
Spring 1%
Rain water tank 0.7%
Dam/Pool/Stagnant water 1.9%
River/Stream 0%
Water vendor 0.2%
Water tanker 0.9%
Other 0.5%
3.7.1 KEY PERFORMANCE INDICATORS: WATER SERVICES
Water service is provided by uMgungundlovu District Municipality
3.7.2 WATER SERVICE DELIVERY LEVELS
Water is probably the most fundamental and indispensable of natural
resources. Fundamental to life, the environment, food production, hygiene and
power generation. Poverty reduction and improved water management are
inextricably linked. Section 4B of the Constitution lists water and sanitation
services limited to potable water supply systems and domestic waste water

79
and sewerage disposal systems as a local government function. Basic water is
defined as 25 litres of potable water per day supplied within 200 meters of a
household.
According to Census 2011, the number of households with access to piped
water inside the dwelling was estimated at 6 064 (Statistics SA, 2011), whilst
64 households had no access to piped (tap water) in 2011.
Table 3.7 Distribution of households by access to piped water and municipality (Community Survey 2016)
Access
2001
Number of
households
2011
Number of
households
2016 CS
Number of
households
%
Piped (tap) water inside
dwelling/house
3 205 11.02
Piped (tap) water inside yard 500 212 10 368 35.6
Piped water on community
stand
3 357 11.54
Rain-water tank in yard 778 2.67
Borehole in the yard -
Borehole outside the yard
650 2.1
Neighbours tap 1 464 4.9
Public/communal tap 658 2.26
Water-carrier/tanker 2 209 7.59
Flowing water/stream/river 5 404 18.58
Other source 989 3.4

80
3.7.3 HOUSEHOLDS - WATER SERVICE DELIVERY LEVELS BELOW THE
MINIMUM
The table below indicates the water service delivery levels for 2018/19
Table 3.8 Water service delivery levels for 2018/19
Description
2014/15 2018/19
Actual Original
Budget
Adjusted
Budget Actual
Number of households
Total households
Households below minimum
service level 0
Proportion of households
receiving 6kl free water
Below is a table that specifies the number of formal and informal households
with water service delivery levels below the minimum standards for the financial
years 2017/18 and 2018/19:
Table 3.9 Water service delivery levels below the minimum: Households
Description
2017/18 2018/19
Actual Actual
Formal settlements
Total households 0 0
Households below minimum
service level 0 0
Proportion of households below
minimum service level 0 0
Informal settlements
Total households 0
Households below minimum
service level 0

81
Description
2017/18 2018/19
Actual Actual
Proportion of households below
minimum service level 0
*In terms of the Back to Basics requirements the municipality is required to calculate the
number of erven to which a service is provided regardless of the number of households per
erf
3.7.4 EMPLOYEES: WATER SERVICES
Table 3.9 Employees: Water Services (this service is provided for by uMgungundlovu District Municipality)
Job levels
2018/19
2018/19
Posts Employees
Vacancies
(fulltime
equivalents)
Vacancies
(as a % of
total posts)
Number
0 – 3 0 0 0 0 0
4 – 6 0 0 0 0 0
7 – 9 0 0 0 0 0
10 – 12 0 0 0 0 0
13 - 15 0 0 0 0 0
16 – 18 0 0 0 0 0
19 – 20 0 0 0 0 0
Total 0 0 0 0 0
3.7.5 CAPITAL EXPENDITURE – WATER SERVICES (THIS SERVICE IS
PROVIDED FOR BY UMGUNGUNDLOVU MUNICIPALITY)
The table below indicates the amount that was spent on water services projects
for the 2018/19 financial year:

82
Table 3.10 Capital expenditure 2018/19: Water services
Capital projects
2018/19
Budget Adjustment
budget
Actual
expenditure
Variance from
adjustment
budget
Total project
value
(R)
N/A
Total project value represents the estimated cost of the project on approval by council
(including past and future expenditure as appropriate).
3.8 SANITATION SERVICES
Sanitation is currently the legislated function of uMgungundlovu District
Municipality. About one-third of the population have access to flush or
chemical toilets. The most concerning figure is 6.3% of the population reported
to have no access to any toilets. This figure is same as the rate in KwaZulu-
Natal province, which is sitting at 6.23%.
3.8.1 SANITATION SERVICE DELIVERY LEVELS
Below is a table that specifies the distribution of households by type of toilet
facility as per Statistics SA 2011 and Community Survey 2016:

83
Table 3.11 Distribution of households by type of toilet facility and municipality (Census 2011, Community
Survey 2016)
Facility
2001
Number of
households
2011
Number of
households
CS 2016
Flush or chemical toilets 3 505 4 879 6 812
Pit latrines 553 722
Flush toilets connected to a public sewerage
system
3 478
Flush toilets connected to a septic tank or
conservancy tank
1 306
Pit latrines with ventilated pipe 7 689
Pit latrines without ventilated pipe 4 520
Bucket toilets 837 185 227
None 724 382 654
Other 4 393
3.8.2 EMPLOYEES: SANITATION SERVICES (THIS SERVICE IS PROVIDED
FOR BY UMGUNGUNDLOVU DISTRICT MUNICIPALITY)
Table 3.12 Employees: Sanitation Services
Job levels
2014/15
2018/19
Posts Employees
Vacancies
(fulltime
equivalents)
Vacancies (as a
% of total posts)
Number
0 – 3 6 5 1 17
4 – 6 1 1 1 0 0
7 – 9 5 5 5 0 0
10 – 12 0 0 0 0 0
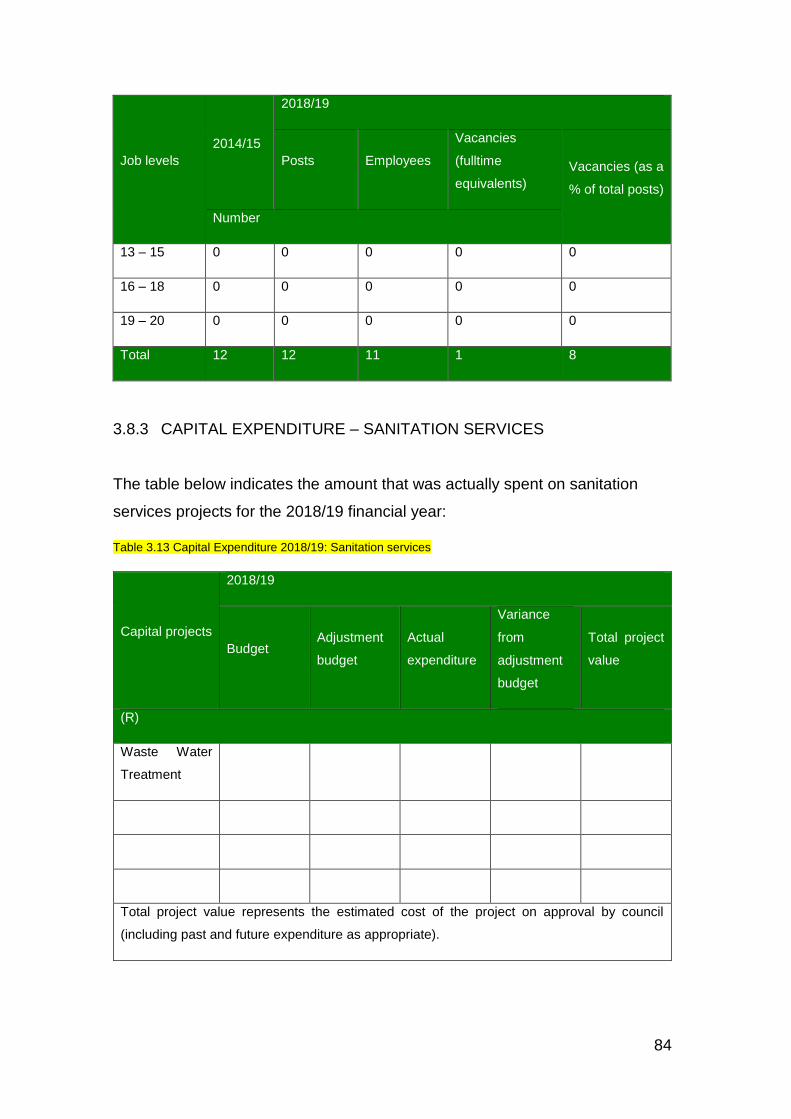
84
Job levels
2014/15
2018/19
Posts Employees
Vacancies
(fulltime
equivalents)
Vacancies (as a
% of total posts)
Number
13 – 15 0 0 0 0 0
16 – 18 0 0 0 0 0
19 – 20 0 0 0 0 0
Total 12 12 11 1 8
3.8.3 CAPITAL EXPENDITURE – SANITATION SERVICES
The table below indicates the amount that was actually spent on sanitation
services projects for the 2018/19 financial year:
Table 3.13 Capital Expenditure 2018/19: Sanitation services
Capital projects
2018/19
Budget Adjustment
budget
Actual
expenditure
Variance
from
adjustment
budget
Total project
value
(R)
Waste Water
Treatment
Total project value represents the estimated cost of the project on approval by council
(including past and future expenditure as appropriate).
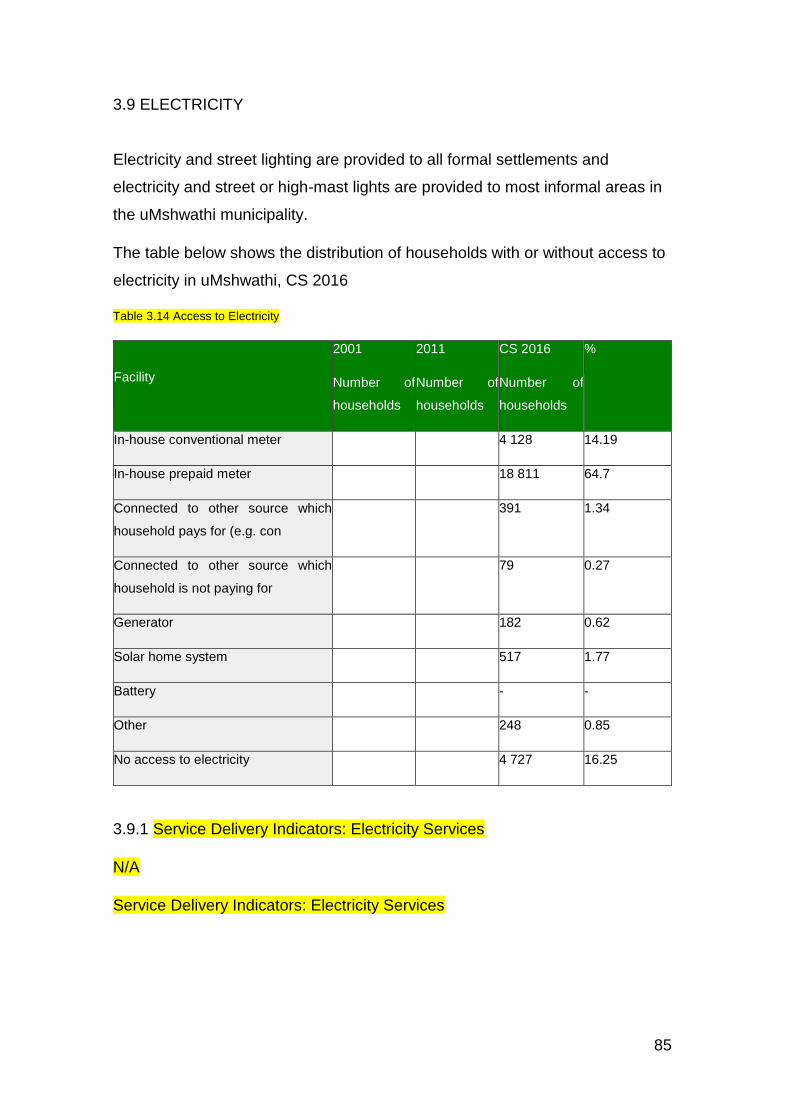
85
3.9 ELECTRICITY
Electricity and street lighting are provided to all formal settlements and
electricity and street or high-mast lights are provided to most informal areas in
the uMshwathi municipality.
The table below shows the distribution of households with or without access to
electricity in uMshwathi, CS 2016
Table 3.14 Access to Electricity
Facility
2001
Number of
households
2011
Number of
households
CS 2016
Number of
households
%
In-house conventional meter 4 128 14.19
In-house prepaid meter 18 811 64.7
Connected to other source which
household pays for (e.g. con
391 1.34
Connected to other source which
household is not paying for
79 0.27
Generator 182 0.62
Solar home system 517 1.77
Battery - -
Other 248 0.85
No access to electricity 4 727 16.25
3.9.1 Service Delivery Indicators: Electricity Services
N/A
Service Delivery Indicators: Electricity Services

86
3.9.2 ELECTRICITY SERVICE DELIVERY LEVELS
The table below indicates the different service delivery level standards for
electricity within the urban edge area of the municipality:
Table 3.15 Electricity service delivery levels
Electricity Service Delivery Levels
Description
2018/19 2018/19
Number of households
Energy (above minimum level)
Electricity (at least min. service level)
Electricity (prepaid (min service level) 0
Sub Total
Percentage
Energy (below minimum level)
Electricity (min service level)
Electricity (prepaid (min service level) 0
Other energy sources 0
Sub-total
Percentage
Total number of households
3.9.3 EMPLOYEES: ELECTRICITY SERVICES

87
Table 3.16 Employees: Electricity Services
Job levels
2017/18
2018/19
Posts Employees
Vacancies
(fulltime
equivalents)
Vacancies
(as a % of
total
posts) Number
0 – 3 0 0 0 0 0
4 – 6 0 0 0 0 0
7 – 9 0 0 0 0 0
10 – 12 0 0 0 0 0
13 – 15 0 0 0 0 0
16 – 18 0 0 0 0 0
19 – 20 0 0 0 0 0
Total 8 8 8 0 0
3.9.4 CAPITAL EXPENDITURE – ELECTRICITY SERVICES
The table below indicates the amount that was actually spent on electricity
service projects for the 2018/19 financial year:

88
Table 3.17 Capital expenditure 2018/19: Electricity services
Capital projects
2018/19
Budget Adjustment
budget
Actual
expenditure
Variance
from
adjustment
budget
Total
project
value
(R)
BobosheTrading 449,940.03
TCN Investments 456,591.39
Shanti's Electrical 967,788.26
TCN Investments 560,997.49
Sizundawo
Engineering 593,031.33
Total project value represents the estimated cost of the project on approval by council
(including past and future expenditure as appropriate).
3.10 WASTE MANAGEMENT (REFUSE COLLECTIONS, WASTE
DISPOSAL, STREET CLEANING AND RECYCLING)
The municipality delivers solid waste services to the residents of UMshwathi
Municipality. All residents receive the service once a week and a black bag
system is applied for the removal of all solid waste.
Challenges are as follows:
Illegal dumping issues
Landfill site availability
Waste refuse truck is no longer in a good condition.

89
3.10.1 SERVICE DELIVERY INDICATORS: WASTE MANAGEMENT
(REFUSE COLLECTIONS, WASTE DISPOSAL, STREET CLEANING AND
RECYCLING)
Service delivery indicators: Waste management (Refuse collections, waste
disposal, street cleaning and recycling)
3.10.2 REFUSE REMOVAL SERVICE DELIVERY LEVELS
The table below indicates the different refuse removal service delivery level
standards within the urban edge area of the municipality:
Table 3.18 Refuse removal service delivery levels
Description
2018/19 CS 2016 %
Outcome Actual
Household
Refuse removal: (Minimum level)
Removed at least once a week - 2 391
Minimum service level and above
sub-total -
Minimum service level and above
percentage
Refuse removal: (Below minimum level)
Removed less frequently than once a
week 8 299 926
Using communal refuse dump 11,616 1 628
Using communal container/central
collection point 11,616 107

90
Description
2018/19 CS 2016 %
Outcome Actual
Household
Using own refuse dump 10,945 22 561
Other rubbish disposal 827 632
No rubbish disposal 0 837
Below minimum service level sub-
total
Below minimum service level
percentage
Total number of households
*In terms of the Back to Basics requirements the municipality is
required to calculate the number of erven to which a service is
provided regardless of the number of households per erf
3.10.3 EMPLOYEES: WASTE MANAGEMENT (REFUSE COLLECTIONS,
WASTE DISPOSAL, STREET CLEANING AND RECYCLING)
Table 3.19 Employees: Waste management (Refuse collections, waste disposal, street cleaning
and recycling)
Job levels
2017/18
2018/19
Posts Employees
Vacancies
(fulltime
equivalents)
Vacancies
(as a % of
total
posts) Number
0 – 3 22 26 22 4 0
4 – 6 3 3 3 0 0
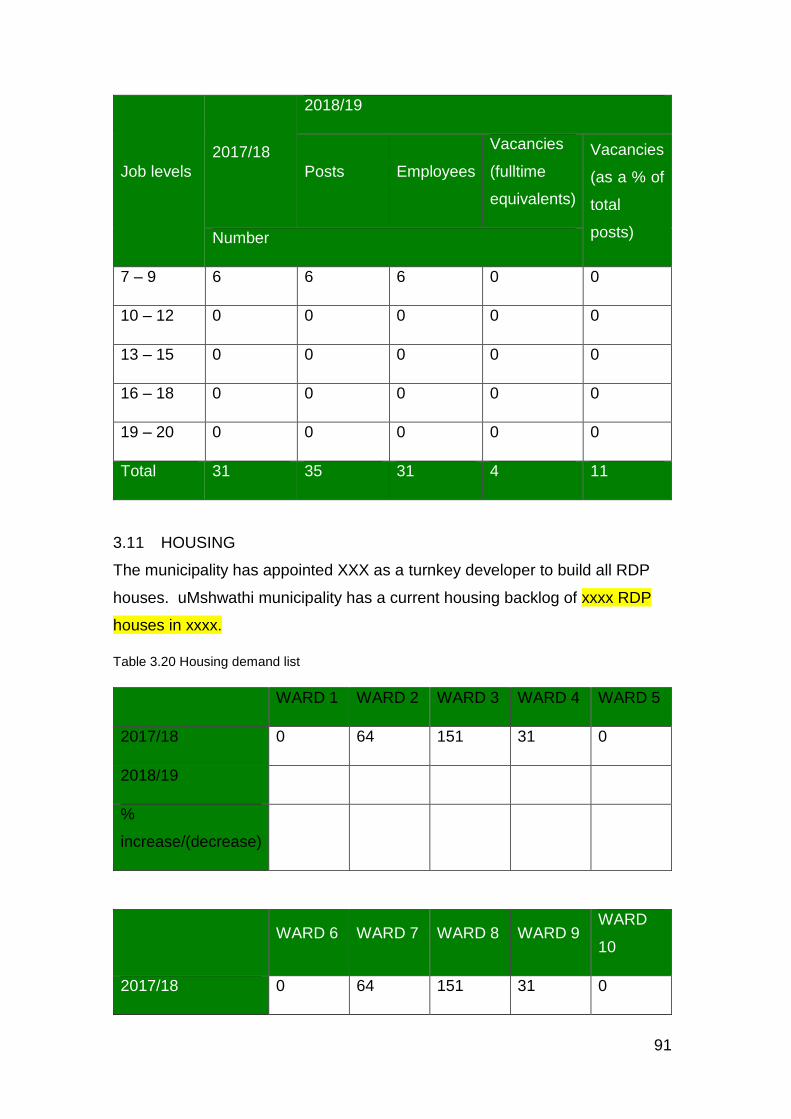
91
Job levels
2017/18
2018/19
Posts Employees
Vacancies
(fulltime
equivalents)
Vacancies
(as a % of
total
posts) Number
7 – 9 6 6 6 0 0
10 – 12 0 0 0 0 0
13 – 15 0 0 0 0 0
16 – 18 0 0 0 0 0
19 – 20 0 0 0 0 0
Total 31 35 31 4 11
3.11 HOUSING
The municipality has appointed XXX as a turnkey developer to build all RDP
houses. uMshwathi municipality has a current housing backlog of xxxx RDP
houses in xxxx.
Table 3.20 Housing demand list
WARD 1 WARD 2 WARD 3 WARD 4 WARD 5
2017/18 0 64 151 31 0
2018/19
%
increase/(decrease)
WARD 6 WARD 7 WARD 8 WARD 9 WARD
10
2017/18 0 64 151 31 0

92
WARD 6 WARD 7 WARD 8 WARD 9 WARD
10
2018/19
%
increase/(decrease)
WARD
11
WARD
12
WARD
13
WARD
14
WARD
2017/18 0 64 151 31 0
2018/19
%
increase/(decrease)
3.11.1 EMPLOYEES: HOUSING MISSING INFOR TECH
Table 3.21 Employees: Housing
Job levels
2017/18
2018/19
Posts Employees
Vacancies
(fulltime
equivalents)
Vacancies
(as a % of
total
posts) Number
0 – 3 0 0 0 0 0
4 – 6 0 0 0 0 0
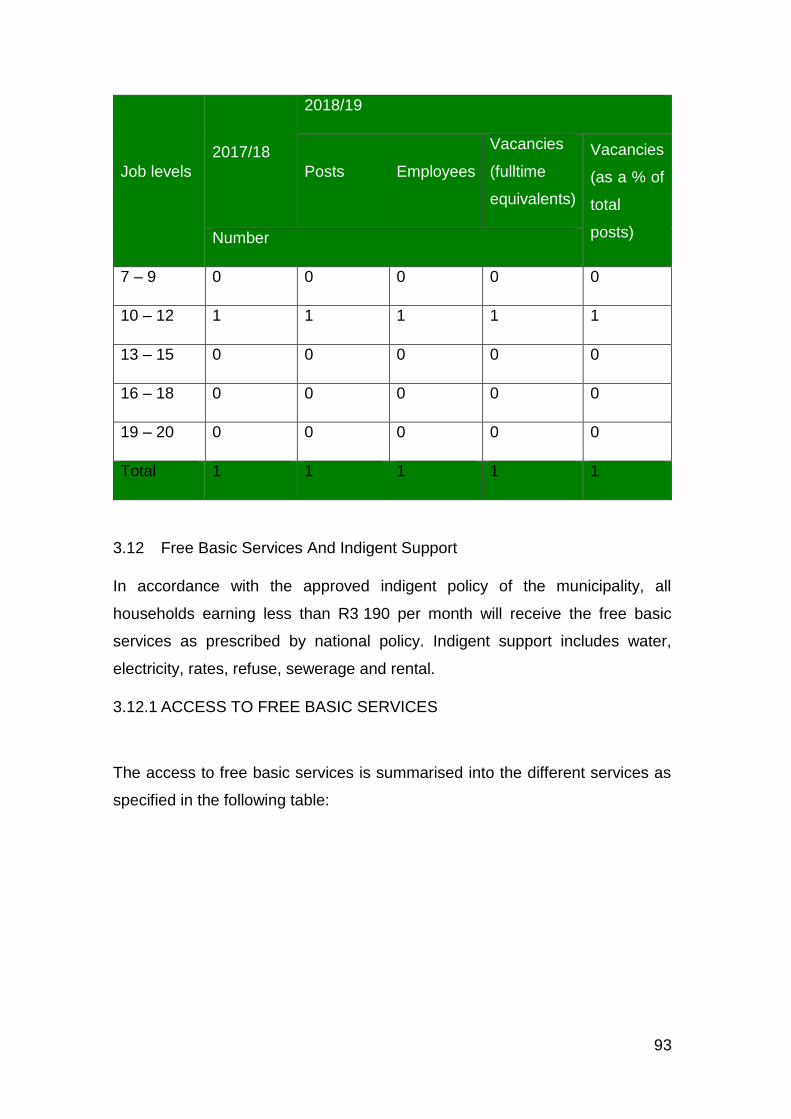
93
Job levels
2017/18
2018/19
Posts Employees
Vacancies
(fulltime
equivalents)
Vacancies
(as a % of
total
posts) Number
7 – 9 0 0 0 0 0
10 – 12 1 1 1 1 1
13 – 15 0 0 0 0 0
16 – 18 0 0 0 0 0
19 – 20 0 0 0 0 0
Total 1 1 1 1 1
3.12 Free Basic Services And Indigent Support
In accordance with the approved indigent policy of the municipality, all
households earning less than R3 190 per month will receive the free basic
services as prescribed by national policy. Indigent support includes water,
electricity, rates, refuse, sewerage and rental.
3.12.1 ACCESS TO FREE BASIC SERVICES
The access to free basic services is summarised into the different services as
specified in the following table:

94
Table 3.22 Access to free basic services
Free basic services to low income households
Year
Number of households
Tot
al
Households earning less than R 3 500 per month
Free basic
water
Free basic
sanitation
Free basic
electricity
Free basic
refuse
Acce
ss (%)
Acces
s (%)
Acces
s (%)
Acces
s (%)
2017/
18
2018/
19
21
52 1782 82.8
The cost of free basic services amounted to R 1,183,158 for the financial year.
COMPONENT B: ROAD TRANSPORT
This component includes: roads, transport and storm water drainage.
The vision for South African transport given with the White Paper on National
Transport Policy (1996) is to: “provide safe, reliable, effective, efficient and fully
integrated transport operations and infrastructure which will best meet the
needs of freight and passenger customers at improving levels of service and
cost in a fashion which supports government strategies for economic and
social development whilst being environmentally and economically
sustainable.”

95
3.13 ROADS
uMshwathi municipality focus on normal maintenance, re-gravel and reseal of
roads. The district municipality with Transport Department is responsible to
maintain, repair, protect and manage the proclaimed provincial roads in our
area. Challenges facing the municipality are the maintenance of potholes due
to insufficient funds.
3.13.1 ASPHALT ROADS
Table 3.23 Asphalt roads
Financial year Total km asphalt
roads
Km of new
asphalt roads
Km existing
asphalt roads
re-sheeted
Km asphalt
roads
maintained
2017/18 14 0 0 34
2018/19 34 0 0 34
3.13.2 GRAVEL ROADS
Table 3.24 Gravel roads
Financial year Total km gravel
roads
Km new gravel
roads
constructed
Km gravel
roads upgraded
to asphalt
Km gravel roads
graded/maintained
2017/18 88 0 0 Unknown
2018/19 88 0 0 88

96
3.13.3 COST OF CONSTRUCTION/MAINTENANCE
The budget for paved constructed roads was R0000 whilst R1 was spent. The
total cost of maintenance for gravel and paved/asphalt roads was R00000
3.13.4 SERVICE DELIVERY INDICATORS: ROADS
Service Delivery Indicators: Roads
3.13.5 EMPLOYEES – ROADS
Table 3.25 Employees: Roads
Job levels
2017/18
2018/19
Posts Employees
Vacancies
(fulltime
equivalents)
Vacancies
(as a % of
total posts)
Number
0 – 3 0 0 0 0 0
4 – 6 0 0 0 0 0
7 – 9 3 3 3 0 0
10 – 12 0 0 0 0 0
13 – 15 0 0 0 0 0
16 – 18 0 0 0 0 0
19 – 20 0 0 0 0 0
Total 17 18 17 1 56
3.13.6 CAPITAL EXPENDITURE – ROADS
The table below indicates the amount that was spent on road service projects
for the 2018/19 financial year:

97
Table 3.26 Capital expenditure 2018/19: Road services
Capital projects
2018/19
Budget Adjustment
budget
Actual
expenditure
Variance
from
adjustment
budget
Total
project
value
(R)
Upgrade and
construction of
various roads
18,200,000.00 13,270,000.00 15,136,713.00 1,866,713
Total project value represents the estimated cost of the project on approval by council
(including past and future expenditure as appropriate).
3.14 STORM WATER
uMshwathi municipality’s waste water (storm water) systems consist of
channels, pipelines and open trenches with piped road crossings.
3.14.1 STORM WATER INFRASTRUCTURE
The table below shows the total kilometres of storm water maintained and
upgraded as well as the kilometres of new storm water pipes installed:

98
Table 3.27 Stormwater infrastructure
Financial year
Total km storm
water
measures
Km new storm
water
measures
Km stormwater
measures
upgraded
Km stormwater
measures
maintained
2017/18 0 0 37
2018/19 0 37
3.14.2 COST OF CONSTRUCTION/MAINTENANCE
The table below indicates the amount of money spent on storm water
projects:
Table 3.28 Cost of construction/maintenance of storm water systems
Financial year
Storm water measures
Capital
R’000
Maintained
R’000
2017/18 500 90
2018/19 0 0
3.14.3 EMPLOYEES: STORM WATER
Table 3.29 Employees: Storm water
Job levels
2017/18
2018/19
Posts Employees
Vacancies
(fulltime
equivalents)
Vacancies
(as a % of
total
posts) Number
0 – 3 9 9 9 0 0
4 – 6 0 0 0 0 0

99
Job levels
2017/18
2018/19
Posts Employees
Vacancies
(fulltime
equivalents)
Vacancies
(as a % of
total
posts) Number
7 – 9 0 0 0 0 0
10 – 12 1 1 1 0 0
13 – 15 0 0 0 0 0
16 – 18 0 0 0 0 0
19 – 20 0 0 0 0 0
Total 10 10 10 0 0
COMPONENT C: PLANNING AND DEVELOPMENT
This component includes two service delivery priorities namely :
Planning; and
Development.
Planning consists of land use and building control.
Development consists of Local Economic Development (LED). LED is built
around a commitment to develop a climate in which economic development
and growth can prosper.
3.15 PLANNING
National imperatives such as the Municipal Systems Act of 2000 prescribes
that municipalities must develop a spatial plan that seeks to address the past
skewed planning models and in an integrated way explore how planning for all
people and communities will be addressed. The spatial plan thus informs how

100
space and resources will be used to create a more coherent and systematic
approach to planning and service delivery.
The SDF emanates from the directives of the Municipal Systems Act (Act 32 of
2000) (Chapter 5: Integrated Development Planning, Part 2: Contents of
Integrated Development Plans – Section 26(e)) and must be a core component
of the IDP of the municipality. The relevance of the legislative context of the
UMshwathi SDF is that it needs to be aligned with the following:
National SDF
Provincial SDF
The focus of planning is on the:
Approval and issuing of rezoning applications, sub-divisions and
consolidation
Application of the regulations in terms of building control and the approval
of building plans
3.15.1 CHALLENGES: PLANNING
The tables below give a brief description of all the challenges regards to the
planning department during the 2018/19 financial year:
Table 3.30 Planning challenges
Challenge Corrective action
Land audit not conducted Conduct land audit
3.15.2 SERVICE DELIVERY STATISTICS FOR PLANNING
The table below displays the applications for land use development :

101
Table 3.31 Applications for land use development
Detail
Formalisation of
townships Rezoning
Built
environment
2017/1
8
2018/1
9
2017/1
8
2018/1
9
2017/1
8
2018/1
9
Planning application
received 0 0 9 8 0 0
Determination made in
year of receipt 0 0 9 8 0 0
Determination made in
following year 0 0 0 0 0 0
Applications withdrawn 0 0 0 0 0 0
Applications outstanding at
year end 0 0 0 0 0 0
The table below indicates the building plans received and processed during
the financial year
Table 3.32 Town planning and building control service delivery statistics
Type of service 2017/18 2018/19
Building control
Building plan applications
processed
MISSING INFOR
PLANNING
Approximate value
New residential dwellings
Residential extensions
New Business buildings
Business extensions

102
3.15.3 EMPLOYEES: PLANNING
Table 3.33 Employees: Planning
Job levels
2017/18
2018/19
Posts Employees
Vacancies
(fulltime
equivalents)
Vacancies
(as a % of
total posts)
Number
0 – 3 0 0 0 0 0
4 – 6 0 0 0 0 0
7 – 9 0 0 0 0 0
10 – 12 1 1 1 0 0
13 – 15 1 1 1 0 0
16 – 18 0 0 0 0 0
19 – 20 0 0 0 0 0
Total 2 2 2 2 2
3.16 LOCAL ECONOMIC DEVELOPMENT
The LED strategy along with the LED process plan is reviewed and implemented
annually. The LED strategy is built around commitment to develop a climate in
which economic development and growth can prosper and growth is shared.
The municipality aimed to create a conducive business environment. The
municipality ensures implementation and support of programmes that focus on
economic development.

103
3.16.1 SERVICE DELIVERY INDICATORS: LED
2 Capacity-building projects (Furniture, Clothing Design & Garment
Making)
Support & promote 3 agrarian reform programs
Support 1 poverty alleviation project
Support 6 enterprises with inputs/equipment.
Coordinate emerging farmers summit by 30 Dec 2018
- Establish 3 Industrial Sewing Hubs.
3.16.2 HIGHLIGHTS: LED
The table below gives a brief description of all the highlights for LED during the
2018/19 financial year:
Table 3.34 LED Highlights
Achievement/Highlight Description
Hosted Emerging Farmer’s Summit Platform for information sharing &
relationship building
Sewing hubs established in Mbava, Thuthuka
Centre and Cool Air & New Hanover.
Facilities for the empowerment of SMMEs
and Cooperatives
Participating in the Traditional Foods
Competition
Event aimed at educating communities about
the health benefits of indigenous foods
Completion of Furniture Learnership,
Garment Design, Hydroponics and
Indigenous Chickens Skills Programs
Programs aimed at empowering local youth
and women. Seventy people participated in
the programs.
15 Informal Traders received inputs &
equipment
Department of Small Business initiative in
which each beneficiary received equipment
such as stoves & sewing machines worth
about R18 000.00

104
3.16.3 CHALLENGES: LED
The table below gives a brief description of all the challenges for LED during the
2018/19 financial year:
Table 3.34 LED challenges
Challenge Corrective action
Budget/funding Source additional funding from SETAs
Human Resources Source interns, form partnerships and
appoint service providers
Shortage of training venues & furniture Resuscitate and / or establish more training
venues
3.16.4 LED INITIATIVES
The table below shows the number of jobs created through grant projects for the
2018/19 financial year:
Table 3.35 Job creation through grant projects
Jobs created through grant projects
Project Detail Total wages paid
R
Furniture Learnership NQF2 1 Facilitator for 10 months
R100 000.00
Furniture Learnership NQF2 Each of the 20 students received
stipends of R1200 per month over
a period of 10 months
R240 000.00
Garment Design,
Hydroponics &Indigenous
chickens Skills Programs
Three facilitators R114 000.00

105
Table 3.36 Job creation through EPWP projects
Jobs created through EPWP projects
Project details Number of EPWP appointments
IG/Cleaning and repairing of Streets 70 plus
Capital Projects
3.16.5 TOURISM AWARENESS/EVENTS
Annual events in the uMshwathi region:
Table 3.37 Tourism awareness/events
Annual event Date
Traditional Foods Competition in Mpolweni Hall 18 October 2018
uMshwathi Emerging Farmer’s Summit at Cool Air Hal 25 March 2019
Bass Fishing Competition at Torwoodlea Lodge 09 March 2019
Canoeing Competition at Albert Falls Dam
Note: Tourism of the Municipality is driven by the District Municipality
3.16.6 EMPLOYEES: LED
Table 3.38 Employees: LED
Job levels
2017/18
2018/19
Posts Employees
Vacancies
(fulltime
equivalents)
Vacancies (as a
% of total
posts)
Number
0 – 3 0 0 0 0 0
4 – 6 0 0 0 0 0
7 – 9 0 0 0 0 0
10 – 12 1 2 1 1 0.5
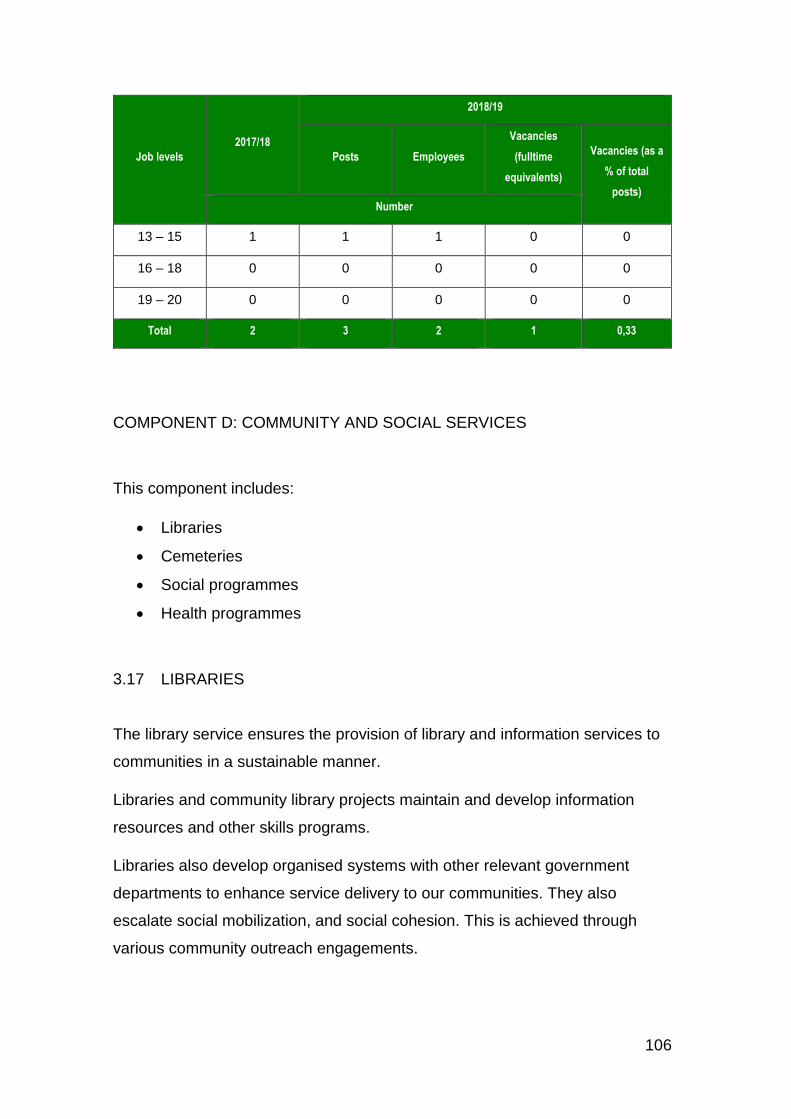
106
Job levels
2017/18
2018/19
Posts Employees
Vacancies
(fulltime
equivalents)
Vacancies (as a
% of total
posts)
Number
13 – 15 1 1 1 0 0
16 – 18 0 0 0 0 0
19 – 20 0 0 0 0 0
Total 2 3 2 1 0,33
COMPONENT D: COMMUNITY AND SOCIAL SERVICES
This component includes:
Libraries
Cemeteries
Social programmes
Health programmes
3.17 LIBRARIES
The library service ensures the provision of library and information services to
communities in a sustainable manner.
Libraries and community library projects maintain and develop information
resources and other skills programs.
Libraries also develop organised systems with other relevant government
departments to enhance service delivery to our communities. They also
escalate social mobilization, and social cohesion. This is achieved through
various community outreach engagements.

107
3.17.1 HIGHLIGHTS: LIBRARIES
The table below gives a brief description of all the highlights for libraries during
the 2018/19 financial year:
Table 3.39 Libraries highlights
Highlight Description
Spelling BEE Local and Regional BEE
Career outreach Implemented in April targeting Grade 12
Setting up mobile Libraries Trustfeed
Grant Increase
At 60 % increase of Grant allocation was
obtained previous year and retained with
inflation percentage
Loss of Books Effective Library security Control system
3.17.2 CHALLENGES: LIBRARIES
The table below gives a brief description of the libraries challenges during the 2018/19 financial
year:
Table 3.40 Libraries challenges
Challenge Corrective action
Loss of books / Load Shedding Effective library Scan
Internet Effective functioning of the internet system
and availability of WI-FI on Saturdays
Insufficient Computers , Printers and Toner Effective model for computers and printers

108
3.17.3 SERVICE STATISTICS - LIBRARIES
Table 3.41 Service statistics –Libraries
Type of service 2017/18 2018/19
Libraries
Number of libraries 3 Situated at Wartburg , Dalton
and New Hanover
Library members 17, 021 Total libraries
Books circulated 14295
Books lost 201
Exhibitions held 04 Career outreach , Exhibitions by tertiary
institution, Spelling Competition
Internet users 5769 For all libraries
New library service points or Wheelie
Wagons 3 Three school libraries
Children programmes 657 Story Telling / Story writing
Visits by school groups and crèches 336 Story Telling
Book group meetings for adults N/A N/A
Primary and secondary book education
sessions 4 Career Outreach / and story telling

109
3.17.4 SERVICE DELIVERY INDICATORS
3.17.5 EMPLOYEES: LIBRARIES
Table 3.42 Employees: Libraries
Job levels
2017/18
2018/19
Posts Employees
Vacancies
(fulltime
equivalents)
Vacancies
(as a % of
total posts)
Number
0 – 3 0 0 0 0 0
4 – 6 0 0 0 0 0
7 – 9 4 4 4 4 0
10 – 12 2 2 2 2 0
13 – 15 1 0 0 0 1
16 – 18 1 0 0 0 1
19 – 20 0 0 0 0 0
Total 10 0 2
3.18 CEMETERIES
There are 5 cemeteries in the uMshwathi area that resort under the jurisdiction
of the municipality and 2 additional cemeteries that belong to churches.
ACHIEVEMENTS
New cite at Mpolweni service provider appointed for geodetic analysis and
environmental impact assessments ward 10 for cemetery.
CHALLENGES
Current Cemetry in New Hanover Ward 2 is full and no land has been identified.
Other challenges includes waterlogging in Coolair cemetery and cemeteries

110
with no fencing leading to vandalism. All our cemeteries are still to be provided
with toilets for public use during burials.
3.18.1 Service delivery indicators: Cemeteries
Service delivery indicators: Cemeteries
3.18.2 EMPLOYEES: CEMETERIES
Table 3.43 Employees: Cemeteries
Job levels
2017/18
2018/19
Posts Employees
Vacancies
(fulltime
equivalents)
Vacancies (as a
% of total
posts)
Number
0 – 3 8 8 6 2 0
4 – 6 0 0 0 0 0
7 – 9 0 0 0 0 0
10 – 12 0 1 1 0 0
13 – 15 0 0 0 0 0
16 – 18 0 0 0 0 0
19 – 20 0 0 0 0 0
Total 1 1 1 0 0
3.19 SOCIAL PROGRAMMES
The aim of social programmes is to:
Address problems and poverty identified in the community
Commemorate special public days
Enhance good communication
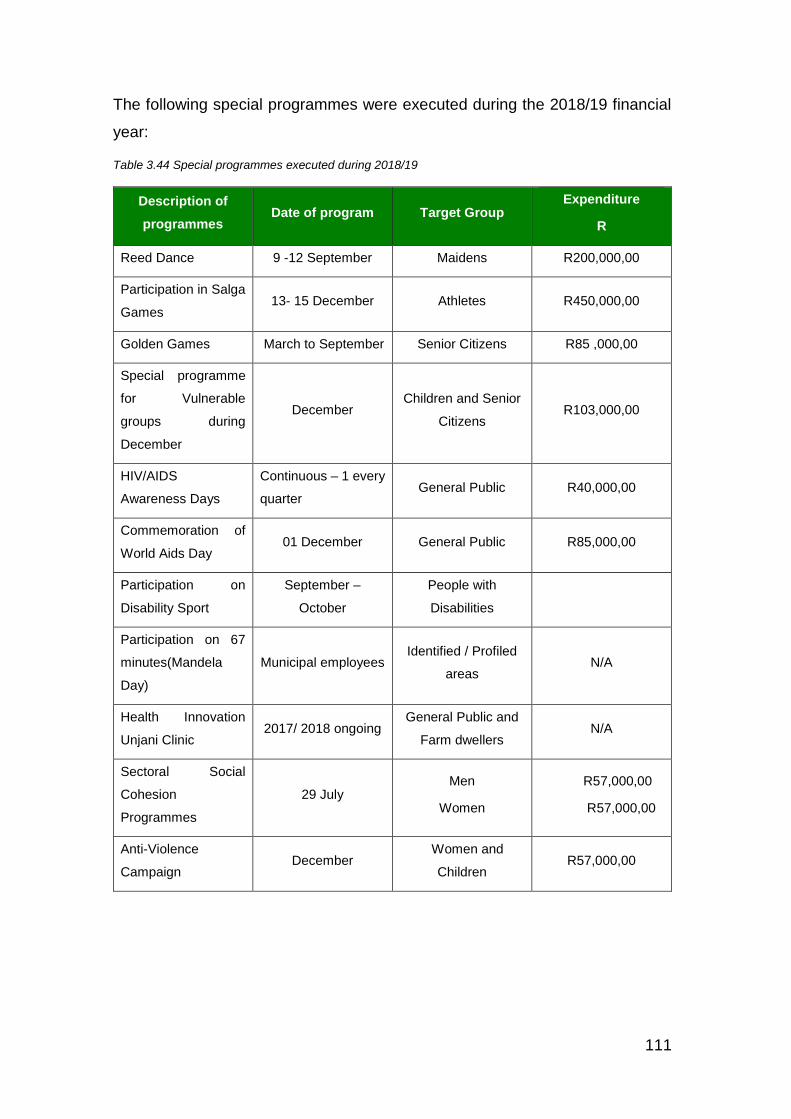
111
The following special programmes were executed during the 2018/19 financial
year:
Table 3.44 Special programmes executed during 2018/19
Description of
programmes Date of program Target Group
Expenditure
R
Reed Dance 9 -12 September Maidens R200,000,00
Participation in Salga
Games 13- 15 December Athletes R450,000,00
Golden Games March to September Senior Citizens R85 ,000,00
Special programme
for Vulnerable
groups during
December
December Children and Senior
Citizens R103,000,00
HIV/AIDS
Awareness Days
Continuous – 1 every
quarter General Public R40,000,00
Commemoration of
World Aids Day 01 December General Public R85,000,00
Participation on
Disability Sport
September –
October
People with
Disabilities
Participation on 67
minutes(Mandela
Day)
Municipal employees Identified / Profiled
areas N/A
Health Innovation
Unjani Clinic 2017/ 2018 ongoing
General Public and
Farm dwellers N/A
Sectoral Social
Cohesion
Programmes
29 July Men
Women
R57,000,00
R57,000,00
Anti-Violence
Campaign December
Women and
Children R57,000,00

112
3.19.1 EMPLOYEES: SOCIAL PROGRAMMES
Table 3.45 Employees: Social programmes
Job levels
2017/18
2018/19
Posts Employees
Vacancies
(fulltime
equivalents)
Vacancies
(as a % of
total posts)
Number
0 – 3 0 0 0 0 0
4 – 6 0 0 0 0 0
7 – 9 0 0 0 0 0
10 – 12 0 0 0 0 0
13 - 15 0 0 0 0 0
16 – 18 0 0 0 0 0
19 – 20 2 0 2 0 0
Total 2 1 2 0 0
The staff compliment for psycho social support reside within the department of
social development. The social services vulnerable groups are implemented in
collaboration with departments. The municipality employee component consists
of two warm bodies that are responsible for coordination and facilitation.
COMPONENT E: ENVIRONMENTAL PROTECTION
This component includes: pollution control, biodiversity and landscape
According to section156(2) of the Constitution, a municipality may make and
administer by-laws for the effective administration of matters that it has the
right to administer. Air pollution is listed as a matter in which local government

113
has authority and national and provincial government may not compromise or
impede a municipality’s right to exercise its powers or perform its functions.
3.20 POLLUTION CONTROL
Air pollution control is not a function of the municipality, but a function
performed by the district municipality.
3.21 BIO-DIVERSITY, LANDSCAPE AND OPEN SPACES
We use biodiversity in various ways. Some examples of direct use are: for
food, medicine, firewood (cooking and heating), industry (building materials or
veld products such as baskets), recreational harvesting (gardening of hunting)
and ecotourism (spring flowers for example). Indirectly, biodiversity provides
services that are important to human well-being, for example, nutrient cycling,
photosynthesis, climate regulation, and so on. Biodiversity conservation also
means that organisms should exist in their own right and not just to be used by
humans.
COMPONENT F: SECURITY AND SAFETY
This component includes:
Traffic, law enforcement and licensing
Disaster management
The function of security and safety is to provide a safe environment for the
residents of the UMshwathi and to ensure the safety of the personnel of the
municipality through effective and efficient operationalization of all relevant
plans in conjunction with public safety.

114
The UMSHWATHI MUNICIPALITY delivers security services where contract
workers are deployed at all municipal buildings.
UMSHWATHI MUNICIPALITY does not have a full time dedicated fire service.
It does, however, offer fire-fighting services through cooperation with district
municipality.
Disaster management is a district function.
The aim of law enforcement in a municipality is to create an environment that
will further the social and economic development of the community. Through
law enforcement services the municipality ensures that individuals and their
families are safe. Law Enforcement Officers are deployed in the municipal area
to ensure that by-laws are enforced in the municipal area. An officer of Traffic
is currently fulfilling the duties of law enforcement.
The aim and function of the Traffic Department is to educate and create a
culture of voluntary compliance with road traffic rules and regulations and to
enhance courteous and tolerant road user behaviour. UMSHWATHI
MUNICIPALITY has an operational traffic department comprising driver
licensing, traffic law enforcement, vehicle testing and motor vehicle
registrations.
3.22 TRAFFIC, SECURITY AND LICENSING
The aim and function of the Traffic Department is to educate and create a
culture of voluntary compliance with road traffic rules and regulations and to
enhance courteous and tolerant road user behaviour. UMSHWATHI
MUNICIPALITY has an operational traffic department comprising driver
licensing, traffic law enforcement, vehicle testing and motor vehicle
registrations.
The main priorities are:
The testing of applicants for learner’s licenses and the application and
renewal of professional driving licenses.
The registration and licensing of motor vehicles.

115
The promotion of road safety and law enforcement.
3.22.1 SERVICE STATISTICS – TRAFFIC, SECURITY AND LICENSING
Table 3.46 Service data for Traffic, security and licensing
Details
2017/18 2018/19
Actual no. Actual no.
Number of road traffic accidents during the
year
Number of infringements attended
Number of traffic officers in the field on an
average day
Number of traffic officers on duty on an
average day
Number of driver’s licenses issued
Number of learner’s licenses processed and
issued
Number of motor vehicle license transactions
Number of road signage erected
Number of fines issued for traffic offences
R-value of fines collected
Number of roadblocks held
Special escorts
Awareness initiatives on public safety

116
3.22.2 EMPLOYEES: TRAFFIC, SECURITY AND LICENSING
Table 3.47 Employees: Traffic, security and licensing
Job levels 2017/18
2018/19
Posts Employees
Vacancies
(fulltime
equivalents)
Vacancies
(as a % of
total
posts) Number
0 – 3 0 0 0 0 0
4 – 6 0 0 0 0 0
7 – 9 1 1 1 0 0
10 – 12 6 6 6 0 0
13 – 15 0 0 0 0 0
16 – 18 0 0 0 0 0
19 – 20 0 0 0 0 0
Total 7 7 7 0 0
COMPONENT G: SPORT AND RECREATION
This component includes:
Community halls
Swimming pools
Caravan park
Nature reserve
Sport grounds

117
3.24 COMMUNITY HALLS
Community halls 24 in all wards are maintained
3.24.1 HIGHLIGHTS: COMMUNITY HALLS
The table below gives a brief description of all the highlights for Community halls
during the 2018/19 financial year:
Table 3.49 Community halls highlights
Highlight Description
All communities who requested hall usage
were accommodated Weddings, funerals etc
3.24.2 CHALLENGES: COMMUNITY HALLS
The table below gives a brief description of the Community halls challenges
during the 2018/19 financial year:
Table 3.50 Community halls challenges
Challenge Corrective action
Cost of daily maintenance and upgrade of
halls Source additional funding
Vandalism Security personnel through EPWP
3.24.3 EMPLOYEES: COMMUNITY HALLS
Table 3.51 Employees: Community halls
Job levels
2017/18
2018/19
Posts Employees
Vacancies
(fulltime
equivalents)
Vacancies
(as a % of
total posts)
Number
0 – 3 8 9 8 1 11

118
Job levels
2017/18
2018/19
Posts Employees
Vacancies
(fulltime
equivalents)
Vacancies
(as a % of
total posts)
Number
4 – 6 0 0 0 0 0
7 – 9 0 0 0 0 0
10 – 12 0 0 0 0 0
13 – 15 0 0 0 0 0
16 – 18 0 0 0 0 0
19 – 20 0 0 0 0 0
Total 8 9 8 1 11
3.28 SPORT GROUNDS
12 out of 14 have Sport fields available UMshwathi Municipal Area. Due to the
scarcity of water resources most of the soccer/rugby pitches cannot be grassed.
3.28.1 CHALLENGES: SPORT GROUNDS
The table below gives a brief description of the Sport grounds challenges during
the 2018/19 financial year:
Table 3.57 Sport grounds challenges
Challenge Corrective action
Daily maintenance for sport grounds Source additional funding
Vandalism
3.28.2 EMPLOYEES: SPORT GROUNDS

119
Table 3.58 Employees: Sport grounds
Job levels
2017/18
2018/19
Posts Employees
Vacancies
(fulltime
equivalents)
Vacancies
(as a % of
total posts)
Number
0 – 3 3 3 3 0 0
4 – 6 0 0 0 0 0
7 – 9 0 0 0 0 0
10 – 12 0 0 0 0 0
13 – 15 0 0 0 0 0
16 – 18 0 0 0 0 0
19 – 20 0 0 0 0 0
Total 3 3 3 0 0
COMPONENT H: UMSHWATHI MUNICIPALITY: CORPORATE POLICY,
OFFICES AND OTHER SERVICES
This component includes:
Executive and Council
Human Resources
3.29 EXECUTIVE AND COUNCIL
Executive and Council includes the:
Mayor
Councillors
Office of the Municipal Manager

120
3.29.1 HIGHLIGHTS: EXECUTIVE AND COUNCIL
The table below gives a brief description of all the highlights for Executive and
Council during the 2018/19 financial year:
Table 3.59 Executive and Council highlights
Highlight Description
The establishment of the Disciplinary Board
and Protected Disclosure Procedure was
approved on 26 October 2018
Resolution number C939
The following Human Resources Policies
were reviewed and approved by Council on
27 February 2019:
Acting in a Higher/Same Level
Position Policy
External Bursary Policy
Internal Bursary Policy Leave Policy
Scarce Skills Retention Policy
Skills Development Policy
Human Resources Policy
Resolution number C1028
The Draft IDP 2019/2020 was approved and
adopted on 27 March 2019 Resolution number C1049
The reviewed Audit Charter was approved
and adopted on 30 May 2019 Resolution number C1089
The Draft Operating Budget for the
2019/2020 Financial Year and Two Outer
Years was approved on 30 May 2019
Resolution number C1091
3.29.2 CHALLENGES: EXECUTIVE AND COUNCIL
The table below gives a brief description of Executive and Council challenges
during the 2018/19 financial year:

121
Table 3.60 Executive and Council challenges
Challenge Corrective action
None N/A
3.29.3 SERVICE DELIVERY INDICATORS: EXECUTIVE AND COUNCIL
Service delivery indicators: Executive and Council
3.29.4 EMPLOYEES: EXECUTIVE AND COUNCIL
Table 3.61 Employees: Executive and Council
Job levels
2014/15
2018/19
Posts Employees
Vacancies
(fulltime
equivalents)
Vacancies
(as a % of
total posts)
Number
0 – 3 0 0 0 0 0
4 – 6 0 0 0 0 0
7 – 9 0 0 0 0 0
10 – 12 2 2 2 0 0
13 – 15 0 0 0 0 0
16 – 18 0 0 0 0 0
19 – 20 10 10 10 0 0
Total 12 12 12 0 0
3.30 FINANCIAL SERVICES
Financial services include:
Budget and treasury control
Expenditure management

122
Income management
Supply Chain Management
Sound financial management practices are essential to the long term
sustainability of the municipality. It underpins the process of democratic
accountability. The key objectives of the Municipal Finance Management Act
(2003) is to modernise municipal financial management in South Africa so as
to lay a sound financial base for the sustainable delivery of services. The
management of key financial and governance areas is achieved by focussing
on reducing the levels of outstanding debt owed to the municipality, to assist
with service delivery spending and maintaining a healthy cash flow and also
maintaining an unqualified audit for the municipality by resolving audit findings
and improving financial governance.
Table 3.62 Service Standards for Financial Services
Debt recovery
Details of
the types of
account
raised and
recovered
2017/18 2018/19
Billed in
year
Actual for
accounts
billed in
year
Proportio
n of
accounts
value
billed that
were
collected
%
Billed in
year
Actual for
accounts
billed in
year
Proportio
n of
accounts
value
billed that
were
collected
%
R % R %
Property
rates
36,009,40
7
32,336,44
7 89.8%
45,504,99
2
36,449,49
9 80.1%
Electricity Eskom Eskom
Water District District
Sanitation District District
Refuse 2,151,310 1,931,876 89.8% 2.402,453 1,924,365 80.1%

123
3.30.1 HIGHLIGHTS: FINANCIAL SERVICES
The table below gives a brief description of all the highlights for Financial
Services during the 2018/19 financial year:
Table 3.63 Financial Services highlights
Highlight Description
Achieved Unqualified Audit Opinion for 2018
An unqualified audit opinion was maintained
2019/20 budget approved
The budget was approved within the
legislative timeframes
Implemented Credit Control Policy Handed over 300 arrear accounts to
attorneys
3.30.2 CHALLENGES: FINANCIAL SERVICES
The table below gives a brief description of the Financial Services challenges
during the 2018/19 financial year:
Table 3.64 Financial Services challenges
Challenge Corrective action
Non-payment of municipal debt Hand over arrear accounts for collection
Delay by Bid Evaluation Committee in
finalising bids
Set strict timeframes for bid committee to
finalise bids. Include in CFO’s scorecard
3.30.3 SERVICE DELIVERY INDICATORS: FINANCIAL SERVICES
Service Delivery indicators: Financial Services

124
3.30.4 EMPLOYEES: FINANCIAL SERVICES
Table 3.65 Employees: Financial Services
Job levels
2017/18
2018/19
Posts Employees
Vacancies
(fulltime
equivalents)
Vacancies
(as a % of
total posts)
Number
0 – 3 0 0 0 0 0
4 – 6 7 8 7 1 13
7 – 9 6 7 6 1 14
10 – 12 9 9 9 0 0
13 – 15 2 2 1 1 50%
16 – 18 0 0 0 0 0
19 – 20 0 0 0 0 0
Total 24 26 24 2 8
3.31 HUMAN RESOURCES
The Human Resource unit resort under the Department of Corporate Services
and is responsible for the following functions:
Human Resource Administration
Recruitment and selection
Labour Relations
Employment Equity
Organisational Structure and Job Evaluation
Occupational Health and Safety
Training and development
Employee Assistance Programme
The aim is to provide management with effective and efficient strategic advice
and support with reference to new and amended legislation, interpretation of

125
policies, organizational change, sound labour relation practices and a healthy
and safe environment.
3.31.1 HIGHLIGHTS: HUMAN RESOURCES
The table below gives a brief description of all the highlights for Human
Resources during the 2018/19 financial year:
Table 3.66 Human Resources highlights
Highlight Description
See Chapter 4
3.31.2 CHALLENGES: HUMAN RESOURCES
The table below gives a brief description of the Human Resources challenges
during the 2018/19 financial year
Table 3.67 Human Resources challenges
Challenge Corrective action
See Chapter 4

126
3.31.3 SERVICE DELIVERY INDICATORS: HUMAN RESOURCES
3.31.4 EMPLOYEES: HUMAN RESOURCE
Table 3.68 Employees: Human Resources
Job levels 2017/18
2018/19
Posts Employees
Vacancies
(fulltime
equivalents)
Vacancies
(as a % of
total
posts) Number
0 – 3 0 0 0 0 0
4 – 6 0 0 0 0 0
7 – 9 0 0 0 0 0
10 – 12 2 2 2 0 0
13 – 15 0 0 0 0 0
16 – 18 0 0 0 0 0
19 – 20 0 0 0 0 0
Total 2 2 2 0 0
3.32 CORPORATE SERVICES
The Corporate Services unit resort under the Department of Corporate Services
and is responsible for the following functions:
Human Resources
Administration Services
IT Services
Record Management
Labour Relations
Town Planning
Cleaning Services

127
Switchboard and Customer Care
The aim is to ensure effective and efficient administrative systems to enhance
the municipality’s objectives.
3.32.1 HIGHLIGHTS: CORPORATE SERVICES
The table below gives a brief description of all the highlights for corporate
services during the 2018/19 financial year:
Table 3.69 Corporate Services highlights
Highlight Description
MISSING INFOR CS MISSING INFOR CS
3.32.2 CHALLENGES: CORPORATE SERVICES
The table below gives a brief description of the corporate services challenges
during the 2018/19 financial year:
Table 3.70 Corporate Services challenges
Challenge Corrective action
3.32.3 SERVICE DELIVERY INDICATORS: CORPORATE SERVICES
Service delivery indicators: Corporate Services

128
3.32.4 EMPLOYEES: CORPORATE SERVICES
Table 3.71 Employees: Corporate Services
Job levels
2017/18
2018/19
Posts Employees
Vacancies
(fulltime
equivalents)
Vacancies
(as a % of
total posts)
Number
0 – 3 5 5 5 0 0
4 – 6 2 2 2 0 0
7 – 9
10 – 12 4 4 4 0 0
13 – 15 1 1 1 0 0
16 – 18 0 0 0 0 0
19 – 20 0 0 0 0 0
Total 12 12 12 0 0
3.32.5 CAPITAL EXPENDITURE – CORPORATE SERVICES
The table below indicates the amount that was actually spent on corporate
services projects for the 2018/19 financial year:
Table 3.72 Capital expenditure - corporate services
Capital projects
2018/19
Budget Adjustment
budget
Actual
expenditure
Variance from
adjustment
budget
Total project
value
(R)

129
Capital projects
2018/19
Budget Adjustment
budget
Actual
expenditure
Variance from
adjustment
budget
Total project
value
(R)
Total project value represents the estimated cost of the project on approval by council
(including past and future expenditure as appropriate).

130
COMPONENT I: ORGANISATIONAL PERFORMANCE SCORECARD
3.33 DEVELOPMENT AND SERVICE DELIVERY PRIORITIES FOR 2018/19
The performance report for the year 2018/19 is summarised below.
Strategic Objectives: There are 44 strategies contained within all 6 National KPAs and
135 performance indicators in the Organisational Scorecard/ SDBIP.
Annual performance achievement, 121 indicators were fully achieved = 90%; 5 not
achieved = 4%; 8 partially achieved = 6%; 1 discontinued = 0.7%. The overall
achievement is 96.3%.
KPA No. of
Strategies
No. of
Indicators
Achieved Not Achieved Partially Achieved Discontinued during
mid-year
Basic Service
Delivery 16 42 39 2 1 0
Municipal
Institutional
Development
&
Transformation
8 35 35 0 0 0
Local
Economic
Development
6 12 10 1 1 0
Municipal
Financial
Viability &
Management
4 19 14 2 2 1
Good
Governance &
Public
Participation
4 18 15 0 3 0
Cross Cutting
Issues 6 9 8 0 1 0

131
Below are the annual performance figures for the reporting year 2018/19.
Annual performance achievement, 106 indicators were fully achieved = 78.5%; 5 not
achieved = 3.7%; 20 partially achieved = 14.8%; 3 discontinued = 2.2% the overall
achievement is 93.3%
TOTAL 44 135 121 5 8 1
%
Achievement
89.6% 3.7% 6% 0.7%

132
The main development and service delivery priorities for 2018/19 forms part of the
municipality’s top layer SDBIP for 2018/19 and are indicated in the tables below including,
management responses.
KPA No. of
Strategies
No. of
Indicators
Achieved Not
Achieved
Partially
Achieved
Discontinued during
mid-year
No activity
Basic Service
Delivery 16 43 32 2 5 3
1
Municipal
Institutional
Development
&
Transformation
6 30 27 0 3 0
0
Local
Economic
Development
5 14 13 0 1 0
0
Municipal
Financial
Viability &
Management
4 20 14 2 4 0
0
Good
Governance &
Public
Participation
4 18 14 1 3 0
0
Cross Cutting
Issues 7 10 6 0 4 0
0
TOTAL 42 135
106 5 20 3
1
%
Achievement
78.5% 3.7% 14.8% 2.2%
0.7%
Overall
achievement
Achieved+ partially
achieved 93.3%

133
KPA IDP GOAL IDP REF/
CODE
PROJECT/
PROGRAMME
/
MEASURABLE
OUTPUT
BASELINE 2018/19
TARGET
ACTUAL
PERFORMANCE
REASON FOR
VARIANCE
CORRECTIVE ACTION
BASIC
SERVICE
DELIVERY
IMPROVE
THE QUALITY
OF LIFE OF
OUR
CITIZENS
BSD
1.1.1
Construction
of
infrastructure
for electricity.
Constructe
d
electricity
infrastruct
ure for 65
household
s.
Appointment
of contractor &
site handover
for
construction of
electricity
infrastructure
for 450
Households
Annual Target
achieved,
Contractor has been
appointed and site
handover has been
done.
Number of
connections were
reduced from 450
to 297 due to the
changes at
Mhlangandlovu
project which was
changed to Apples
botch which has
less connections of
70 compare to the
250 that was
initially planned for
Mhlangandlovu
New projects which is
UCL and McKenzie
Farm have been added
to make it 450
connections. Design
have been completed,
project ready for
advertisement.
BSD
1.1.2
Install High
mass lighting
in ward 13
4 high
mast lights
installed.
Install 2 High
Mast in ward
13
BSD
1.2.1
Provide free
basic
electricity to
all qualifying
beneficiaries
84% of
beneficiari
es claimed
free basic
electricity.
Provide 95% of
beneficiaries
with free basic
electricity
1782 out of 2152:
82.80%
Not all registered
beneficiaries are
claiming their FBE
Engage with Eskom to
review the list as at
June
BSD
1.2.2
Provide 95% of
beneficiaries
with free basic
electricity
1782 out of 2152:
82.80%
Not all registered
beneficiaries are
claiming their FBE
Engage with Eskom to
review the list as at
June
BSD
1.2.3
Review and
update
Indigent
Register
Indigent
register
updated
Review and
update
Indigent
The register has
been reviewed
None None

134
by 30 June
2018
Register by 30
June 2019
BSD
1.3.1
Construction/
Upgrade of
Community
facilities. (
Community
halls &
Crèche's
New
indicator
Preparation of
tender
document for
construct 2
Community
Facilities
(Ogujini
Community
Skills Centre in
Ward 11)
&(Thokozani
Community
Skills Centre in
Ward 1)
Annual Target
Achieved for Ogujini
Community Skills
Centre, Tender
documents has been
compiled. Annual
Target achieved for
Thokozani
Community Skills
Centre, tender
document has been
compiled
None None
BSD
1.3.2
Roll over/
Contractor
Appointed
Complete
upgrade of 1
hall (Mount
Elias Hall)
Annual Target
Achieved, 1 upgrade
of Mount Ellias Hall
has been completed.
None None
BSD
1.3.3
Roll over/
Contractor
Appointed
Complete
construction of
1 Hall (Socolile
Community
Hall)
Annual Target
Achieved, 1 Hall has
been completed
(Social Community
Hall).
None None
BSD
1.3.4
Construction/
completion of
Crèche
Creche
constructe
d.
Construct 1
crèche Estezi
Estezi Creche
constructed and
complete
None None
BSD
1.4.1
Construction/
Upgrading/
Completion of
sport fields
1 sports
field
completed
.
Construction 1
sport field
(Ekhamanzi
Sports field)

135
BSD
1.4.2
Upgrade 1
sport field
(Efaye)
BSD
1.5.1
Construction
of gravel roads
2 kms of
road was
upgraded.
Upgrade 2
Kilometers of
gravel road at
Mchunu Road
in Ward 4, and
4km of Gravel
Road at Mbeka
Access Road in
Ward 8
Upgrade of 2kms
Mchunu road is
complete and
upgrade of Mbeka
road is incomplete.
Insufficient budget
available to
complete this
project.
The project will be
implemented on the
2019/2020 financial
year.
BSD
1.5.2
Construction
of Tar Roads
2kms of
gravel
road
constructe
d.
Appointment
of contractors
& Site
handover for
Tarring 1km on
D1013 Road
and Tarring of
1km
Shiyabazali
Access Road by
30 June 2019.
Contractors has
been appointed and
site handover has
been done.
None None
BSD
1.5.3
New
indicator
Appointment
of contractor
for Tarring of
Cool Air/Dalton
Accesses of
300m
Contractor has been
appointed.
None None
Tarring of 1km
on L714
Tarring of 1km L714
is complete.
None None

136
BSD
1.5.4
Storm water
drains and
channels
maintenance
29.6kms of
storm
water
infrastruct
ure
maintaine
d.
Maintain 40
kms of storm
water drains
and channels
40 Kms of storm
water drains has
been maintained.
None None
BSD
1.5.5
Pedestrian
walkways
maintenance
44.3kms of
storm
water
maintaine
d
Maintain 10 km
of Pedestrian
walkways (New
Hanover,
Dalton,
Wartburg, Cool
Air)
10 kms of
Pedestrians
walkways has been
maintained.
None None
BSD
1.5.6
Gravel Road
maintenance
11kms of
gravel
road
maintaine
d.
Maintain
15kms of
gravel Road
(regravelled/Bl
aded) 14
Municipal
Wards
Annual Target
Achieved, 16kms of
gravel road has been
maintained.
None None
BSD
1.6.1
Reporting on
the planning,
implementatio
n and
monitoring of
infrastructure
projects.
Submitted
6 report to
portfolio
com on
infrastruct
ure
projects
Submit 9
reports on
infrastructure
projects
7 progress reports
were submitted to
portfolio committee
on capital projects.
Two(2) Reports
were tabled at the
portfolio meeting
Ensure that all the
reports are part of the
agenda.
BSD
1.7.1
Maintenance
of municipal
buildings
New
indicator
Submit 9
reports on
municipal
buildings
maintenance.
9 reports were
submitted to
portfolio on
municipal buildings
maintenance.
The set of minutes
are attached to
support the report
of 04 April 2019.
The error on the
date of report is
noted
Proof reading to
minimise the errors
will be conducted
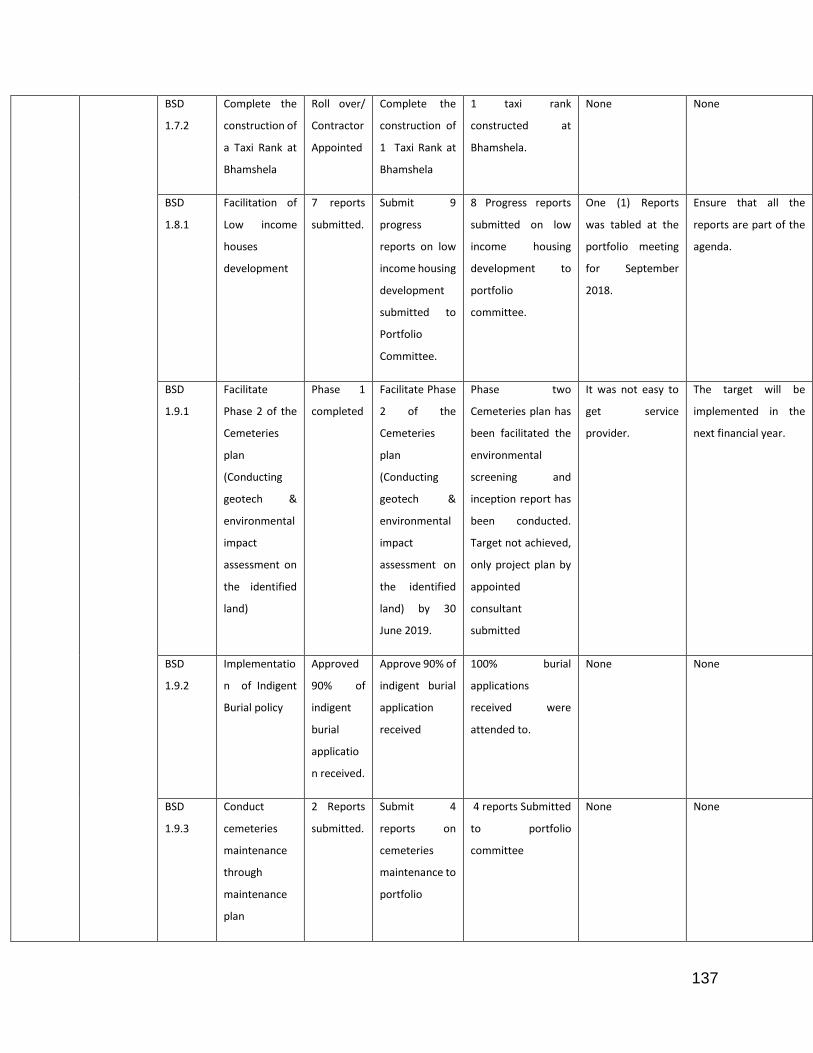
137
BSD
1.7.2
Complete the
construction of
a Taxi Rank at
Bhamshela
Roll over/
Contractor
Appointed
Complete the
construction of
1 Taxi Rank at
Bhamshela
1 taxi rank
constructed at
Bhamshela.
None None
BSD
1.8.1
Facilitation of
Low income
houses
development
7 reports
submitted.
Submit 9
progress
reports on low
income housing
development
submitted to
Portfolio
Committee.
8 Progress reports
submitted on low
income housing
development to
portfolio
committee.
One (1) Reports
was tabled at the
portfolio meeting
for September
2018.
Ensure that all the
reports are part of the
agenda.
BSD
1.9.1
Facilitate
Phase 2 of the
Cemeteries
plan
(Conducting
geotech &
environmental
impact
assessment on
the identified
land)
Phase 1
completed
Facilitate Phase
2 of the
Cemeteries
plan
(Conducting
geotech &
environmental
impact
assessment on
the identified
land) by 30
June 2019.
Phase two
Cemeteries plan has
been facilitated the
environmental
screening and
inception report has
been conducted.
Target not achieved,
only project plan by
appointed
consultant
submitted
It was not easy to
get service
provider.
The target will be
implemented in the
next financial year.
BSD
1.9.2
Implementatio
n of Indigent
Burial policy
Approved
90% of
indigent
burial
applicatio
n received.
Approve 90% of
indigent burial
application
received
100% burial
applications
received were
attended to.
None None
BSD
1.9.3
Conduct
cemeteries
maintenance
through
maintenance
plan
2 Reports
submitted.
Submit 4
reports on
cemeteries
maintenance to
portfolio
4 reports Submitted
to portfolio
committee
None None

138
BSD
1.9.4
Support
Pauper burials
Supported
100% of
pauper
burial
requests
received
Provide 100%
support to the
pauper burial
requests
received.
No application
received
None None
BSD
2.1.1
Promotion of
SMMEs and
Cooperatives'
development
for the youth
2
programm
es for
youth
coordinate
d
Implement 4
programmes
for youth
SMME"s and
cooperatives.
4 projects
implemented for
youth SMMES and
cooperatives
None None
BSD
2.1.2
Promote Sport
Development
4 sports
promotion
al projects
implement
ed
Coordinate 8
sports
developments
projects.
8 sports promotion
development
projects
coordinated. Only 7
targeted projects
implemented, and 2
additional projects
were implemented
The requisition is
not available
because the
programme was
funded by the
department of
Sports &
recreation.
BSD
2.1.3
Review of
Youth
Development
and sport
Strategy
New
indicator
Adoption of the
reviewed Youth
Strategy 30
June 2019.
Target not achieved Presentation was
done to full council
but the strategy
was not adopted
yet
The strategy will be
adopted in the next
council meeting
BSD
2.1.4
Promote
Cultural
development
& Heritage
4 Arts and
Culture
projects
implement
ed
Implement 5
programmes
for cultural
development
and heritage
5 programmes for
cultural
development and
heritage
implemented. 2
additional projects
but POE insufficient
None None

139
BSD
2.2.1
Addressing
Social Ills
against
Vulnerable
Groups
5
programm
es for
vulnerable
groups
coordinate
d.
Coordinate/im
plement 4
projects
addressing
social ills
against
vulnerable
groups.
4 programmes
implemented to
addressing social ills
against vulnerable
groups.3 as per POE
None
BSD
2.2.2
Empowerment
of people with
disabilities ,
women and
senior citizens
1 senior
citizens co-
op
supported
Coordinate 2
empowerment
projects for
senior citizens
and people
with disabilities
2 projects
implemented for
senior citizens and
people with
disabilities.
None None
BSD
2.2.3
Improve
healthy
lifestyle for
Elderly
4 senior
citizens
programm
es
coordinate
d
Coordinate/im
plement 3
projects for
senior citizens
3 programmes
implemented for
senior citizens
None None
BSD
2.2.4
Promote
recreational
activities for
children
2 children
projects
coordinate
d
Coordinate 3
projects for
Children
3 projects
coordinated for
children.
None None
BSD
2.2.5
Coordinate
review of
vulnerable
group strategy.
New
indicator
Adoption of the
reviewed
Vulnerable
Groups
Strategy by 30
June 2019.
Strategy has been
adopted and
reviewed on 26 June
2019
None None

140
BSD
2.3.1
Addressing
social &
structural
drivers to
HAST
06
HIV/AIDS
Awareness
Programm
e
coordinate
d
Coordinate 04
HIV/AIDS
awareness
4 HIV awareness
campaigns
coordinated.
however 2
awareness
campaigns there
were no
requisition
prepared since
they was a jointly
together with
clinics
BSD
2.3.2
Coordination
of Structural
meetings ( LAC
3 Nerve
center & 4
LAC
meetings
coordinate
d.
Coordinate 4
LAC meetings
4 LAC meetings
coordinated
None None
BSD
2.3.3
Empowerment
of people living
with HIV
1
programm
e
supported
Coordinate 2
programmes of
people living
with HIV
2 programmes
coordinated for
people living with
HIV
None None
BSD
2.4.1
NPO, CBO &
NGO"s
mentorship
1 NPO
mentored
Mentor 1 NPO,
CBO & NGO's
1 NPO mentored None None
BSD
2.4.2
Reinventing
the culture of
reading by
conducting
awareness
campaigns
4 reading
campaigns
conducted
.
Coordinate 4
Reading /
community
outreach
campaign
4 reading
/community
outreach campaigns
coordinated
There was no need
for requisition
because it was a
short presentation.
BSD
3.1.1
Conduct Joint
law
enforcement
4 joint law
enforceme
nt
initiatives
conducted
with SAPS
Conduct 4 joint
law
enforcement
initiatives with
SAPS and
Submit 4 report
on law
4 joint law
enforcement
initiatives with SAPS
and submitted
report on law
enforcement
initiatives
None None

141
enforcement
initiatives
BSD
4.1.1
Refuse
removal
4302
household
s were
Serviced
123 % of
3800
household
s providing
solid waste
removal
Provide 100%
refuse removal
service to 1142
households
100% of 1142
households serviced
None None
11 Skips
were
provided
Provide 11
skips ongoing,
in Dalton, Cool
Air, Wartburg ,
New Hanover,
Appelshbosch
Hospital
11 skips provided on
ongoing basis, in
Dalton, Cool Air,
Wartburg , New
Hanover,
Appelshbosch
Hospital
None None
MUNICIPA
L
INSTITUTI
ONAL
DEVELOP
MENT AND
TRANSFOR
MATION
IMPROVED
ADMINISTRA
TIVE, LEGAL
AND
ADVISORY
SUPPORT
MID&T
1.1.1
Review and
workshop
HR/SG/IT
Policies
4 Policies
were
reviewed
Adoption of 8
reviewed
policies (Skills
Dev policy,
Employment
Equity Policy ,
Bursary Policy,
HR Strategy,
Fleet
management
policy, Records
management
12 Policies were
reviewed &
approved:
Employment equity,
Skills Dev, Internal
&External Bursary,
HR Strategy, Leave,
Scarce Skills, Acting,
Records
management, Fleet
management ICT
None None

142
policy, ICT
Security policy
& ICT
Framework by
30 June 2019
Security Policy & ICT
Framework.
MID&T
1.1.2
Strengthen the
Human
Resources
Administrative
processes (
capacity
building)
3
workshops
conducted
Conduct 4
workshops:
Workshop 1
for staff on the
Code of
Conduct;
Workshop 2
Batho Pele for
staff ;
Workshop 3 for
staff on the
Fleet
management
policy,
Workshop 4 for
staff on the
Safe Work
procedure
manual Policy
30 June 2019.
Conducted 4
workshops for all
staff: Code of
Conduct, Batho Pele
& Safe Work
procedure manual
took place on the 18
& 20 Sept, 2018.
Workshop 4 Fleet
policy took place on
the 13 June 2019.
None None

143
MID&T
1.1.3
Develop new
policy in line
with legislation
for SG/HR & IT
4 new
policies
developed
Development
and adoption of
2 ICT policies
by 30 June
2019 (ICT
Service Level
Agreement
Management
policy and ICT
Controls
Policy)
Developed 4
policies: 3 ICT
policies: ICT
Framework Policy,
ICT Controls Policy &
ICT Service Level
Agreement
Management were
approved by Council
on the 27 March
2019. HR- Job
Evaluation Policy
None None
MID&T
1.1.4
Filling of
vacant posts
5 positions
filled:
Fill 1 positions
in line with the
reviewed Org
Structure, in
line with the
IDP goals
namely post
General
Manager
Technical
Services
Appointed & filled 2
positions: GM
Corporate Services
appointed in July
2018 & GM
Technical Services
appointed in
February 2019.
None None
MID&T
1.1.5
Implementatio
n of the WSP
Spent 59%
on WSP
implement
ation
Spend 90% of
2018/19 WSP.
Spend 88.25% of
2018/19 WSP
The reason for the
underspent is that
some payments
have not been
done, however we
have submitted all
payments: EG
payment for
Chainsaw handling
This is a problem on
the finance section.

144
Implement
ed 3
training
projects:
Implement 5
training
projects (Code
8 & Code 10,
Leadership
Development,
CPMD, Road &
Interpret maps
& engineering
drawings &
water
reticulation,
Chainsaw
handling &
maintenance.
Implemented 5
trainings. Road &
Interpret maps &
engineering
drawings & water
reticulation was
done in Nov 2018.
Leadership
Development was
done from Sept.
2018. Code 8 & Code
10 was done in Mar
2019. CPMD
commenced in Sept.
2018 & is ongoing,
Chainsaw handling
took place on the 28
June 2019.
None None
Trained 20
staff
members
Train 25 staff
members
Trained 27 staff: 7
on Leadership
Development, 8 on
Code 10, 5 staff on
Road & Interpret
maps & engineering
drawings & water
reticulation, 2
CPMD, 5 Chainsaw
handling.
None None

145
MID&T
1.1.6
Maintenance
of both
existing
internal &
external
bursaries
Maintaine
d 80% of
existing
internal
bursaries
Maintain 70%
of existing
internal & 50%
of external
bursaries
9 internal bursars, 4
completed their
studies, 2 did not
qualify for further
funding. 3 were to
be maintained and 2
payments were
made. 66% internal,
12 external bursars,
7 could not be
maintained as 3
completed and 1
secured NSFAS
funding, did not pay
for 3 as this was their
final year. 5 were to
be maintained and 3
of those were paid
for = 60% external.
We therefore
maintained 63 % of
both internal &
external bursars
None None
MID&T
1.1.7
Awarding of
new internal &
external
bursaries
Award 2 new
bursaries.
Awarded 2 new
external bursaries as
internal applicants
didn’t meet the
requirements.
None None
MID&T
1.1.8
Review of the
organizational
structure
The
existing
organizati
onal
structure
was re-
affirmed
by Council
Adoption of
reviewed
organizational
structure for
2019/20 by 30
June 2019
Reviewed
organizational
structure for
2019/20 was
approved on the 30
May 2019
None None

146
on the 30
May 2018
MID&T
1.1.9
Development,
approval and
submission
2019/20 WSP
The
2017/18
WSP was
submitted
and
approved
on the 25
April 2018
Approve the
2019/20 WSP
by 30 April
2019
2019/20 WSP
approved on the 30
April 2019 and
submitted to
LGSETA.
None None
MID&T
1.1.10
Coordinate
Employee
Assistance
Programmes
Wellness
day
programm
e held on
the 27
June 2017
Coordinate 4
Employee
Assistance
Programmes
Coordinated 4 EAP
programmes.
Nutrition Awareness
29 March 2019,
Cancer Awareness
18 & 20 September
2018, Financial
wellness 04
December 2018 &
Men's talk 21 June
2019.
None None
MID&T
1.1.11
Continuance
facilitation and
engagement
regarding Job
Evaluation &
submit reports
to Council
JD's
submitted
to Region
and
waiting for
results
Facilitate 4
meetings
regarding Job
evaluation and
submit reports
to Council
4 Meetings were
held on the 29 Aug,
05 Oct 2018, 15 Feb,
and 7 May 2019. 6
Reports were
submitted on the 26
Oct & 12 December
2018, 27 Feb, 28
March, 30 May & 26
June 2019.
None None

147
MID&T
1.1.12
Implementatio
n of the
Employment
Equity Plan of
the
Municipality
2 Women
appointed
in middle
managem
ent
Employ 1
women
(Women
employed in
management
and 1 with
disability) by
June 2019
Employed 2 woman
in management: GM
Corporate Services
appointed in July
2018 & GM
Technical Services
appointed in
February 2019.
An error occurred
where the
department of
Corporate Services
amended the
departmental
score card by
removing the
target of
employing 1
person with a
disability and
omitted to remove
the same on the
organizational
score card.
None
MID&T
1.2.1
Develop &
approve
calendar of
meetings for
the 2018 -
2019 and 2019
- 2020 financial
years
Council
approved
calendar
of Jan-June
2018
approved
on 31 Oct
2017:
Calendar
for July-
Dec 2018
approved
30 Jun
2018
Submit
calendar of
meetings for
Jan 2019 - June
2019 for
approval by 30
December
2018: Submit
calendar of
meetings for
July -Dec 2019
for approval by
30 June 2019.
Calendar of
meetings for Jan -
June 2019 approved
by council on the 12
December 2018.
Calendar of meeting
for July-Dec 2019
approved on 27
March 2019.
None None
MID&T
1.2.2
Fleet
management
4 reports
submitted
Submit 4
reports on fleet
management
to portfolio
Submitted 10
reports on fleet
management to
Corporate Services ,
on the 16 July, 07
Aug, 05 Sept, 03 Oct,
14 Nov 2018, 04 Feb,
07 March , 03 April,
None None

148
02 May & 11 June
2019.
MID&T
1.3.1
Provision of
legal support
100% of all
litigations
received
was
attended
to
Attend to 100%
of all litigations
received.
Municipal as
respondent 4
matters; Municipal
as plaintiff 1 matter.
Property rights
matters 17.
None None
MID&T
1.4.1
Review PMS
Framework in
line with
Chapter 6 of
MSA
PMS
Framewor
k was
adopted
on the 2th
June 2018.
Adoption of the
reviewed PMS
Framework by
30 June 2019
Reviewed PMS
Framework was
submitted to EXCO
on 18 June 2019 and
submitted to Council
on 26 June 2019
None None
MID&T
1.4.2
Ensure
performance
agreements
for S57 are
signed by
target date.
5 PA’s
were
submitted
to Cogta
on the
20th of
July 2017
Submit 5 signed
Performance
agreements
submitted to
the MEC by 31
July 2018
The 4 Performance
Agreements were
signed and
submitted to Cogta
on 26 of July 2018
We were in the
process of
employing the
General Manager:
Technical Services
None
MID&T
1.4.3
Submit Annual
Performance
report to AG
for auditing.
2016/17
Annual
performan
ce Report
submitted
to AG by
30 August
2017
Submit 2017/
18 Annual
Performance
Report by 31
August 2018 to
AG for auditing
The 2017/18 Annual
Performance Report
was submitted to AG
on the 31 of August
2018 via the CFO
None None
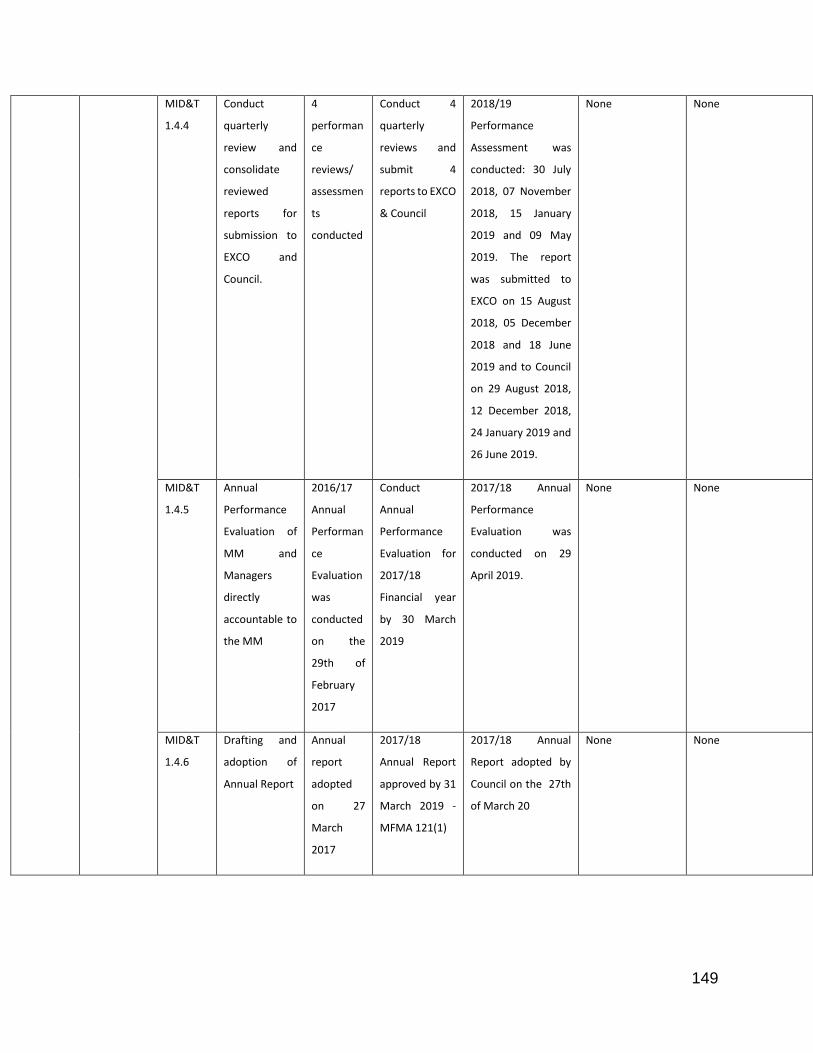
149
MID&T
1.4.4
Conduct
quarterly
review and
consolidate
reviewed
reports for
submission to
EXCO and
Council.
4
performan
ce
reviews/
assessmen
ts
conducted
Conduct 4
quarterly
reviews and
submit 4
reports to EXCO
& Council
2018/19
Performance
Assessment was
conducted: 30 July
2018, 07 November
2018, 15 January
2019 and 09 May
2019. The report
was submitted to
EXCO on 15 August
2018, 05 December
2018 and 18 June
2019 and to Council
on 29 August 2018,
12 December 2018,
24 January 2019 and
26 June 2019.
None None
MID&T
1.4.5
Annual
Performance
Evaluation of
MM and
Managers
directly
accountable to
the MM
2016/17
Annual
Performan
ce
Evaluation
was
conducted
on the
29th of
February
2017
Conduct
Annual
Performance
Evaluation for
2017/18
Financial year
by 30 March
2019
2017/18 Annual
Performance
Evaluation was
conducted on 29
April 2019.
None None
MID&T
1.4.6
Drafting and
adoption of
Annual Report
Annual
report
adopted
on 27
March
2017
2017/18
Annual Report
approved by 31
March 2019 -
MFMA 121(1)
2017/18 Annual
Report adopted by
Council on the 27th
of March 20
None None

150
MID&T
1.4.7
Monitor the
implementatio
n of Council
Resolutions
(Reports to the
MM)
2 report
submitted
to MM
Submit 2
reports to MM
regarding
implementatio
n of Council
resolutions.
Two reports
regarding the
implementation of
Council resolutions
submitted to MM
None None
MID&T
1.5.2
Share Point
Installation
Phase One
was
completed
in January
2017
Install Share
Point by 30
June 2019
Installation of Share
Point completed on
the 05 March 2019
None None
MID&T
1.5.3
CCTV
Installations
New
indicator
Install CCTV @
Thusong Centre
by 30 June
2019
CCTV was installed
on the 28 December
2018.
None None
MID&T
1.5.4
Office failover
for internet &
server
application
New
indicator
Upgrade of
Server by 30
March 2019
Upgrade of Server
completed on the 29
April 2019
The service
provider was
appointed late in
December, the US
companies were
closed for
shipment, and they
delivered the
server when they
opened late in
January 2019.
MID&T
1.5.5
Purchase of
Leave
Management
System
New
indicator
Purchase of
Leave
Management
System by 30
June 2019
Service providers
were requested to
presentation and
quotations of the
system and such
were above the
budget. Additional
funding was
requested during
mid-year budget
Purchase of Leave
Management
System tender was
advertised and
closed on the 14
June 2019, the
challenges we
faced was with the
Evaluation
Committee not
meeting timeously
The First BEC meeting
took place on the 10
July 2019, however an
appointment of a
Service Provider was
not done, and it will be
done in July 2019. The
MM is dealing with the
Chairperson's of the
committees.

151
review. Partially
Achieved:
in order to award
this tender on
time.
MID&T
1.6.1
Implementatio
n of OHS
aligned
training
programs
3 OHS
trainings
implement
ed.
Implement 2
health & safety
training
projects/
workshops for
all staff by the
end of June
2019
Implemented 3
health & safety
training projects/
workshops for all
staff: The Safe Work
Procedure took
place on the 18 & 20
September 2018,
the Hearing and loss
prevention took
place on the 30
October 2018 & First
Aid took place on
the 18 & 19
December 2018.
(This was not for all
staff though)
None None
MID&T
1.6.2
Purchasing of
Personal
Protection
Equipment
(PPE) and
Stock items
PPE
purchased
by 30 June
2018
Purchase of
Personal
Protection
Equipment
(PPE) by 30
June 2019
Purchase of Personal
Protection
Equipment (PPE) on
the 20 February
2019.
None None
MUNICIPA
L
FINANCIAL
VIABILITY
SOUND
FINANCIAL
MFV&M
1.1.1
Capacitate
staff on
New
indicator
Train 2 staff
members from
revenue
section on
3 staff members
have been sent for
training
None None

152
AND
MANAGE
MENT
MANAGEME
NT
revenue
collection
revenue
collection.
MFV&M
1.1.2
Have regular
Consumer
awareness
campaigns
Nil Conduct 2
consumer
campaigns on
services
charges and the
need to pay
municipal debt.
Only 6 as per POE 10
meetings have been
held with the
building inspector
None None
MFV&M
1.1.3
Take legal
action against
arrear debtors
315
accounts
have been
handed
over to the
attorneys
Hand over at
least 30 arrear
accounts per
annum
At least 301
accounts have been
handed over
None None
MFV&M
1.1.4
Review the
municipality's
Revenue
Enhancement
Strategy
annually
The
Revenue
Enhancem
ent policy
was
approved
on 27 June
2018
Adoption of the
reviewed
Revenue
Enhancement
Strategy by 31
March 2019
The revenue
enhancement
Strategy was
reviewed and
approved on 26 June
2019
None None
MFV&M
1.1.5
Increase and
maintain
Revenue
Collection Rate
Collection
rate is at
117.75%
Increase
Collection Rate
by 5% to 95%
including arrear
debt
Collection rate for
the year is 80.1%
The main reason is
the culture of non-
payment of
municipal
accounts.
Nonpayment of
the government
debt also has a
bearing on the
collection rate. The
handing over of
accounts was
stopped in
The issue of
Government debt
reported to Treasury
and Cogta. Still
pursuing to hand over
accounts

153
November pending
the development
of a panel of
attorneys
MFV&M
1.2.1/
General
indicator
Financial
viability of the
municipality
expressed as
follows: A=B-
C.D“A”
represents
debt coverage
“B” represents
total operating
revenue
received -“C”
represents
operating
grants “D
’represents
debt service
payments(i.e.
.interest
+redemption)
due within the
financial year
180.55:1 05:01 402.1 : 1 None None
0.58:1 01:01 0.60 : 1
54% 60% 54%
5.61:1 03:01 4.70 : 1
MFV&M
1.2.2
Submit 100%
of S71 Monthly
Reports to be
Treasury &
Quarterly
5 finance
report
submitted.
Submit 4
Finance
Reports to
Council
Only 5 as per POE 6
finance reports were
submitted to Council
None None

154
Reports to
Council
MFV&M
1.3.1
Development
and approval
of Budget
Process Plan
Process
plan was
approved
by 31
August
2017
Approve
Budget Process
Plan by 31 of
August 2018
Process Plan was
approved by 29
August 2019
None None
MFV&M
1.3.2
Review Budget
Related
Policies
Budget
related
policies
approved
on the
27th of
June 2018
Adoption of
the reviewed
Budget Policies
(Budget, credit
control, cash
management,
investment &
virement ) by
31 May 2019
Two polices were
reviewed and
approved on 26 June
2019.
Please comment Please comment
General
Indicator
Efficient and
economical
spending on
MIG Grant
funding
100%
capital
budget
spent.
Spend 100% of
capital budget
Annual Target
Achieved, 100%
spent on MIG
allocation.
None None
MFV&M
1.4.1
Review SCM
Policy
Reviewed
SCM policy
adopted
on the
27th June
2018
Adoption of the
reviewed SCM
Policy by 30
June 2019
SCM Policy was
reviewed and
adopted by Council
on 26 June 2019
None None

155
MFV&M
1.4.2
Hold Regular
Bid Committee
meetings
25 Bid
comm
meetings
held.
Hold 27 Bid
Committee
meetings
annually: Bid
Spec - 9 Bid
Evaluation - 10
Bid
Adjudication- 8
41 meetings held
BSC - 13 BEC
- 14 BAC -
14, Only 11 BSC
meeting,11 BEC
meeting and 12 BAC
meetings.= 34
None None
MFV&M
1.4.3
Timeframe to
finalize and
award bids
Mostly
awarded
within 2
months
Finalize and
award tenders
within 2
months of
closure of
tender
Only 6 out of 18
tenders were
finalized within 2
months
There were delays
during the
Evaluation stage
MFV&M
1.4.4
Timeframe to
finalize and
award of
Quotations
Mostly
awarded
within 7
days
Finalize and
award
quotations
within 7 days of
closing date
27 out 50 quotations
were awarded
within 7 days.
Delays in feedback
from user
departments.
Service providers
withdrawing at last
minute
Record is being kept of
correspondence to
user departments
MFV&M
1.4.5
Update
Contract
Register
Contract
register
updated
monthly.
Update
Contract
Register
monthly
The Contract
register has been
updated on a
monthly basis
None None
MFV&M
1.4.6
Submit SCM
reports to
Council
(Deviations)
Only 1
report
submitted
Submit 4 SCM
Reports
(deviations) to
Council
10 reports were
submitted to
Council. Only 4
Reports submitted
None None
MFV&M
1.4.7
Develop &
submit
2019/20
Annual
Procurement
Plan
Procureme
nt Plan
developed
by 30 June
2018
Develop &
submit
2019/20
Annual
Procurement
Plan to
Provincial
The procurement
plan was developed
and submitted to
treasury on 1st of
July
None None

156
Treasury by 30
June 2019
LOCAL
ECONOMI
C
DEVELOP
MENT
PILLAR 2:
BASIC
SERVICE
DELIVERY
LED
1.1.1
Contribute to
the marketing
of uMshwathi
Tourism
Products
Contribute
d to Amble
in Jan 2018
Contribute
towards
publication of
the Amble
magazine by 30
Dec 2018
Contributed towards
publication of the
Amble magazine on
20 December 2018
None None
LED
1.1.2
Conduct and
finalize
Research/
feasibility
study on
tourism
opportunities
New
Indicator
Conduct
Research/
feasibility study
on tourism
opportunities
by 30 June
2019
Conducted Research
on tourism
opportunities by 30
May 2019
None None
LED
1.1.3
Facilitate a
Tourism
Meetings
New
Indicator
Facilitate
/coordinate 3
Tourism
meeting
3 Tourism meetings
Facilitated
None None
LED
1.2.1
Facilitate
capacity
building for
prioritized
groups
3 capacity
building
projects
facilitated
Facilitate the
implementatio
n of 5 capacity
building
Projects.
6 capacity building
project Facilitated.
None None

157
LED
1.2.2
Support &
Promote
agrarian
reform in
uMshwathi
5 agrarian
reform
programs
supported.
Support &
promote 3
agrarian reform
programs
4 agrarian reform
programs
Supported.
Water tanks were
purchased for
Wards 9 and 12
instead of Ward 4.
There is no
requisition for
inputs collected
from DoAgric for
local farmers.
There is no
requisition as the
seedlings were
collected from
Agriculture
Department.
LED
1.3.1
Support
poverty
alleviation
projects
3 projects
supported.
Support 1
poverty
alleviation
project by 30
September
2018
1 poverty alleviation
project Supported
by 30 September
2018
None None
LED
1.3.2
Sponsor
attendance of
SMMEs /
cooperatives
at exhibitions
1 Crafter
sponsored
Sponsor
attendance of
SMMEs /
cooperatives
at 1 Exhibition
Sponsor attendance
of SMMEs /
cooperatives at 1
Exhibition
The requisition was
not done as the
municipal
transport was used
to transport the
SMME's hence the
trip sheet was used
None
General
indicator
Job
opportunity
creation
138 EPWP
and 96 job
opportunit
ies created
through
capital
projects
Create 150 job
opportunities
through capital
projects and
EPWP ( 70
through EPWP
and 80 through
Capital projects
= 150)
Annual Target
Achieved, 150 jobs
created.
None None

158
LED
1.4.1
Support
commercial/su
bsistence
enterprises
with funding
for inputs /
equipment/
certification
5
enterprise
s
supported.
Support 6
enterprises
with
inputs/equipm
ent.
6 enterprises
supported with
input /equipment
None None
LED
1.4.2
Coordinate
market days
New
Indicator
Coordinate 3
market days
Coordinate 3 market
days
There is no
requisition for
Market Days on 30
August 2018
because the
participants
provided own
transport
None
LED
1.4.3
Coordinate
Emerging
farmers
summit
New
Indicator
Coordinate
emerging
farmers
summit by 30
Dec 2018
Coordinated the
Emerging Farmers
Summit by on 25
March 2019
None None
LED
1.4.4
Establish
Industrial
Sewing Hubs
New
Indicator
4 Industrial
Sewing Hubs
have been
established
4 Industrial Sewing
Hubs have been
established
None None
LED
1.5.1
Coordinate
and hold
Business
Breakfast/Lunc
h
1
Business/
Lunch
coordinate
d
Coordinate and
hold 1 Business
Breakfast/Lunc
h by 30 March
2019
Coordinated 3
Business Meetings
by 30 March 2019
(however there
were no need for
refreshment
because of the
duration of the
meetings)
However there
were no need for
refreshment
because of the
duration of the
meetings
None

159
LED
1.5.2
Facilitate
Social
empowerment
project.
New
Indicator
Spend 80% of
the social
empowerment
project.
Spent 62% of the
social
empowerment
budget.
Some programs
were note
implemented by
Councilors
Outstanding programs
to be implemented in
the next financial year
2019/2020
GOOD
GOVERNA
NCE &
PUBLIC
PARTICIPA
TION
STRENGTHE
NED
DEMOCRACY
GG & PP
1.1.1
Attend IGR
and Public
Participation
meetings
3 District
technical
coordinati
ng forum
(MM's
Forum)
MM to attend 4
District
Technical Co-
coordinating
(MM's) Forum
meetings
Attended 3
meetings: 29 August
2018, 15 March
2019.District
Technical
Coordinating Forum
meeting did not sit
for the fourth
Quarter.
The Municipal
Manager of
uMgungundlovu
District
Municipality did
not coordinate the
meeting of the
fourth quarter.
Should be reminded
and be supported in
the coordination o the
Forum meetings.
3 Social
cluster
meetings
coordinate
d
MM to
coordinate and
Chair 4 Social
Cluster
meetings
Coordinated and
Chaired 4 Cluster
meetings: 31 August
2018,13 December
2018, 08 March
2019 and 20 June
2019.
None None
GG & PP
1.1.2
Review and
adoption of
Communicatio
ns strategy
Communic
ations
Strategy
was
reviewed
and
adopted
on 27 June
2018
Adoption of the
reviewed
Communicatio
ns strategy
adopted by 28
June 2019
Communications
strategy reviewed
and adopted on the
26/06/2019
None None
GG & PP
1.1.3
Analyze the
results of
Conduct
2017/18
Customer
Satisfaction
Survey
conducted
Develop action
plan to address
challenges
highlighted
during 2017/18
Customer
Action plan
developed
None None
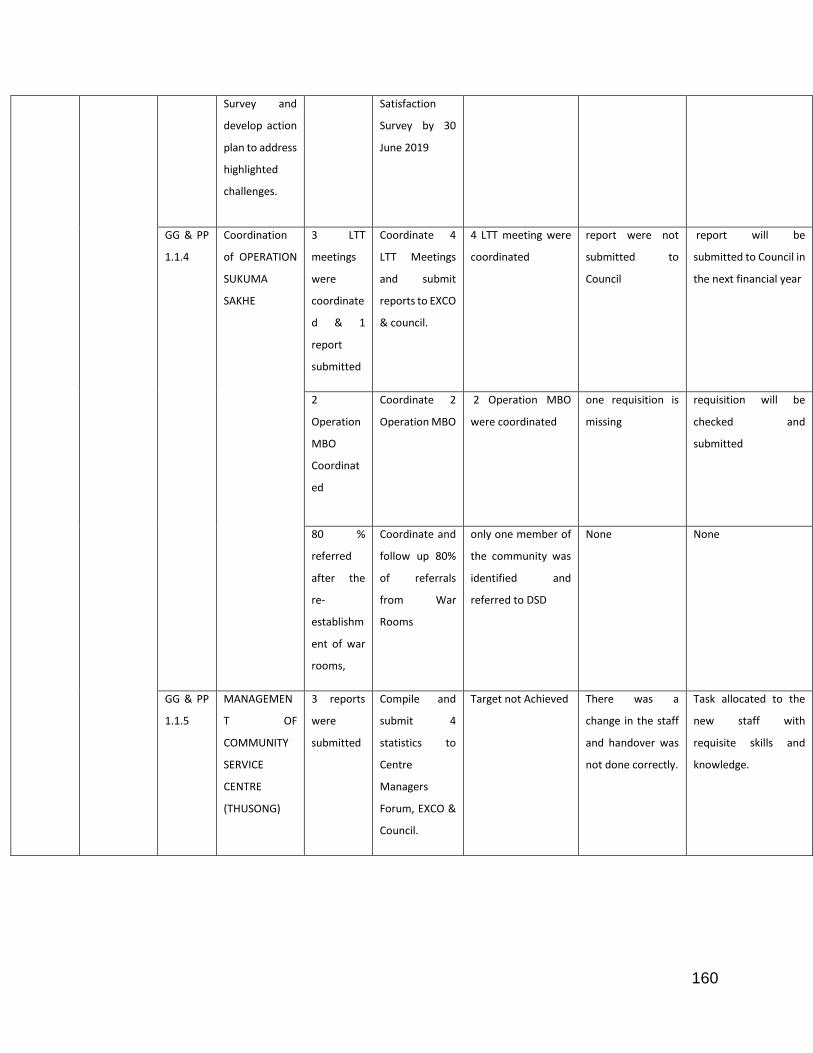
160
Survey and
develop action
plan to address
highlighted
challenges.
Satisfaction
Survey by 30
June 2019
GG & PP
1.1.4
Coordination
of OPERATION
SUKUMA
SAKHE
3 LTT
meetings
were
coordinate
d & 1
report
submitted
Coordinate 4
LTT Meetings
and submit
reports to EXCO
& council.
4 LTT meeting were
coordinated
report were not
submitted to
Council
report will be
submitted to Council in
the next financial year
2
Operation
MBO
Coordinat
ed
Coordinate 2
Operation MBO
2 Operation MBO
were coordinated
one requisition is
missing
requisition will be
checked and
submitted
80 %
referred
after the
re-
establishm
ent of war
rooms,
Coordinate and
follow up 80%
of referrals
from War
Rooms
only one member of
the community was
identified and
referred to DSD
None None
GG & PP
1.1.5
MANAGEMEN
T OF
COMMUNITY
SERVICE
CENTRE
(THUSONG)
3 reports
were
submitted
Compile and
submit 4
statistics to
Centre
Managers
Forum, EXCO &
Council.
Target not Achieved There was a
change in the staff
and handover was
not done correctly.
Task allocated to the
new staff with
requisite skills and
knowledge.

161
GG & PP
1.1.6
Coordinate
Budget/IDP
Mayoral
Imbizo
1 Budget/
IDP Imbizo
coordinate
d in April
2019
Coordinate
Mayoral
Budget/IDP
Imbizo by 30
April 2019
1 Mayoral
Budget/IDP Imbizo
coordinated on 17
May 2019
None None
GG & PP
1.2.1
Ensure the
effective
functioning of
internal audit
and risk
management
unit
Audit Plan
was
submitted
to AC on
the 21st of
November
Approval of
Audit Plan by
Audit
Committee by
30 September
2018
Audit plan approved
by 5 December 2018
& resolution
contained in the
minutes of the Audit
Committee minutes
None None
GG & PP
1.2.2
4 reports
submitted
to Audit
Committe
e.
Submit 4
internal audit
reports to Audit
Committee
Only 4 as per POE Six
reports submitted to
Audit Committee
None None
GG & PP
1.2.3
Risk
register
reviewed
by 30 June
2018
Review Risk
profile/
Register by 30
June 2019
Risk profile reviewed
by 30 June 2019
None None
GG & PP
1.2.4
3 Risk
Committe
e meetings
coordinate
d
Coordinate 4
Risk
Management &
Fraud
Prevention
committee
meetings.
Four risk
management and
fraud prevention
committee
coordinated
None None
GG & PP
1.3.1
Lend
administrative
support to
MPAC and
Audit
Committee
5 MPAC
meetings
coordinate
d
Coordinate 4
MPAC
meetings.
4 MPAC committee
meetings
coordinated
None
3 audit
committee
meetings
Coordinate 4
Audit
4 Six audit
committee
coordinated
None None

162
coordinate
d
Committee
meetings.
GG & PP
1.4.1
Functional
Ward
Committees
104 Ward
committee
meetings
coordinate
d
Coordinate 56
Ward
Committee
Meetings in all
14 wards
160 Ward
Committee
meetings
coordinated in all 14
wards
None None
Average
attendanc
e in all
wards is
74%
70%
attendance by
Ward
committee
members
81% attendance by
Ward Committee
members
None None
GG & PP
1.4.2
Coordinate
Combined
Ward
Committee
meetings
2
Combined
Ward
Committe
e meetings
were
coordinate
d
Coordinate 2
combined
Ward
Committee
meetings by 30
June 2019
Two combined ward
committee
coordinated.
None None
CROSS
CUTTING
ISSUES
SAFE AND
SECURE
COMMUNITI
ES
CCI 1.1.1 Conduct
disaster
awareness
campaigns
3
Awareness
Campaigns
Conducted
Conduct 4
disaster
awareness
campaigns
2 disaster awareness
campaigns
coordinated
Elections
campaigns, strikes
in ward 3.
to be done in July to
take place in ward 13
CCI 1.2.1 Training of
Volunteers
and Ward
based
structures on
disaster risk
assessment
27
volunteers
trained
Train 28
volunteers on
disaster risk
assessment by
30 Dec 2018
28 volunteers on
disaster risk
assessment has
been trained
None None
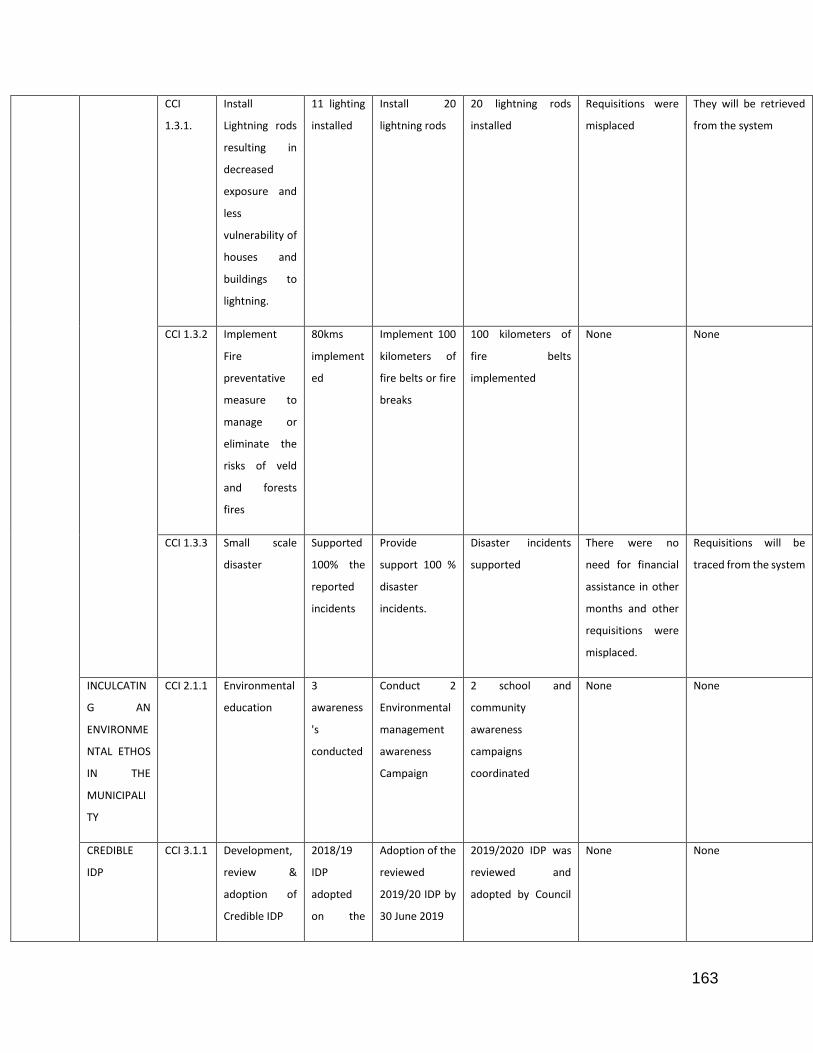
163
CCI
1.3.1.
Install
Lightning rods
resulting in
decreased
exposure and
less
vulnerability of
houses and
buildings to
lightning.
11 lighting
installed
Install 20
lightning rods
20 lightning rods
installed
Requisitions were
misplaced
They will be retrieved
from the system
CCI 1.3.2 Implement
Fire
preventative
measure to
manage or
eliminate the
risks of veld
and forests
fires
80kms
implement
ed
Implement 100
kilometers of
fire belts or fire
breaks
100 kilometers of
fire belts
implemented
None None
CCI 1.3.3 Small scale
disaster
Supported
100% the
reported
incidents
Provide
support 100 %
disaster
incidents.
Disaster incidents
supported
There were no
need for financial
assistance in other
months and other
requisitions were
misplaced.
Requisitions will be
traced from the system
INCULCATIN
G AN
ENVIRONME
NTAL ETHOS
IN THE
MUNICIPALI
TY
CCI 2.1.1 Environmental
education
3
awareness
's
conducted
Conduct 2
Environmental
management
awareness
Campaign
2 school and
community
awareness
campaigns
coordinated
None None
CREDIBLE
IDP
CCI 3.1.1 Development,
review &
adoption of
Credible IDP
2018/19
IDP
adopted
on the
Adoption of the
reviewed
2019/20 IDP by
30 June 2019
2019/2020 IDP was
reviewed and
adopted by Council
None None

164
27th of
June 2018
on the 26th June
2019
CCI 3.2.1 Development,
review and
adoption of
SDF
Draft SDF
adopted
on the
27th of
June 2018
Adoption of
SDF by 30 June
2019
The final SDF was
approved and
adopted by council
on the 30th May
2019
None None
CCI 3.3.1 Develop Land
use scheme for
uMshwathi
municipality
New
indicator
Adoption of
Land Use
Management
Scheme by 30
June 2019
The final land use
management
scheme was
approved and
adopted by council
on the 26th June
2019
None None
CCI 3.3.2 Develop ward
based plans for
14 ward
New
indicator
Adoption of
Draft Ward
based plans by
30 June 2019
Draft Ward Based
Plans not adopted.
The service
provider is
underperforming
and has not
submitted the
draft ward base
plans for adoption

165
CHAPTER 4: ORGANISATIONAL DEVELOPMENT PERFORMANCE
(PERFORMANCE REPORT PART ONE)
A. NATIONAL KEY PERFORMANCE INDICATORS - MUNICIPAL
TRANSFORMATION AND ORGANISATIONAL
The table shows the municipality's performance in terms of the national key
performance indicators (KPI). These KPI’s form part of local government focus area in
terms Municipal Planning and Performance Management Regulations and section 43 of
the MSA.
KPA & Indicators Municipal achievement
Municipal
achievement
2017/18 2018/19
The number of people from employment equity target
groups employed in the three highest levels of
management in compliance with a municipality’s
approved employment equity plan
8 9
The percentage of a municipality’s training budget
actually spent on implementing its workplace skills plan 100% 88%
B. HIGHLIGHTS – MUNICIPAL TRANSFORMATION AND ORGANISATIONAL
DEVELOPMENT
Highlight Description
100% of s54A/56 positions filled
This indicates stability in the administration of the
Municipality
Highly qualified S54A / 56 managers who are
heading all departments and leading the
institution
This speaks to compliance with recruitment processes
and the municipality having the right leaders at the right
time giving meaningful contribution in the fulfilment of the
constitutional mandate doing things that are most
economically
Organisational structure during the 2018/19
financial was reviewed to reflect the new
challenges being faced by the municipality.
This reflects alignment with the organisational strategy of
the municipality.

166
Highlight Description
Critical policies have been reviewed and
evaluated in terms of the IDP and
organisational strategy.
This emphasises order and healthy labour relations
Emphasis on staff development and training
including the provision of bursaries, learner-
ships, in-service training and internships.
Compliance with the Skills Development Act as well as
the Labour Relations Act
Emphasise to the Health and Safety of
employees
Employer of choice who puts the needs and safety of
employees first
C. CHALLENGES – MUNICIPAL TRANSFORMATION AND ORGANISATIONAL
DEVELOPMENT
Challenge Actions to address
Insufficient Office space Planning and budget of office space
Job Evaluation not completed
Follow ups with the Provincial Audit Committee to
complete the auditing of the SALGA Region 2 results
Lack of proper administrative and computerised
systems
Budget and purchase the system as a matter of urgency
PMS not cascaded to all staff
Cascading of PMS to all relevant staff
Lack of commitment by staff on training Formulate strategies to enhance employee commitment
and ensure consequence management
Lack of succession planning and career management
policy
HR to create strategies and drive the same on
succession planning
Increase sick leave by staff
Partnership with the Department of Health to implement
a monthly clinic on the premises of the municipality
None compliance with the National Treasury norms on
the issue of total cost to personnel ration i.e., the
municipality has exceeded the 40% norm
Training provided to the Income Section on best
practices on revenue collection

167
4.1 COMPONENT A: INTRODUCTION TO THE MUNICIPAL WORKFORCE
Human Resources is considered the backbone of uMshwathi Municipality. The
responsibilities of a human resource professional fall into three main areas: staffing,
compensation and benefits for workers, and the design of work. Essentially, HRM's aim
is to maximize the municipality productivity by improving the effectiveness of its
employees. This approach is unlikely to change in any fundamental way given the ever-
increasing pace of change in the business world.
Some of our activities includes training and development; recruitment and selection,
satisfying employee’s needs, employee wellness, health and safety and employee
relations are the backbone and strength of the organization. Human Resources play a
business partner role of supporting the management team on how to strategically
manage people and business resources.
The support rendered by Human Resources, enables the Municipality to meet
organizational goals as displayed on the strategic document of the Municipality that is
the Integrated Development Plan, herein after referred to as the IDP. The Human
Resources Section renders a professional support service that is well aligned to the
Municipality’s IDP. In so doing, the Human Resources Section is supporting all five (5)
departments of the Municipality in meeting their strategic objectives and further assists
all departments to make a meaningful contribution in the fulfilment of the following
constitutional mandate as displayed in Chapter 7 of the Constitution of the Republic of
South Africa, 1996 by providing support to achieve the following:-
Provide democratic and accountable government for local communities
Provide services to the communities in a sustainable manner
Promote Social and Economic Development
Promote a safe and healthy environment
Encourage the involvement of the Community and community based
organizations in local matters

168
We are committed to organizing people so they can carry out work activities efficiently.
That requires people to be seen as human assets, not the organization's costs or
liabilities. Looking at people as assets is a part of the management of contemporary
human resources and human capital.
The Human Resources Section formulates policies and standard operating procedures
that are aligned to the IDP and are compliant with legislation and the collective
agreements of the South African Local Government Bargaining Council, herein after
referred to as the SALGBC. The Human Resources Section is responsible for
implementation of relevant Human Resources Legislation, policies and prescripts. As a
member of the South African Local Government Association, we provide oversight in
implementing the SALGA Human Resources Strategy and other policies designed to
empower local municipalities.
Our main objectives include:
Design and Implementation of the organizational structure aligned to the
Municipality’s IDP;
Development and Implementation of an Integrated Human Resources Strategy
aligned to the strategy of the Municipality;
Training and development of employees and Councillors
To contribute towards the employability and self- employability of youth and our
communities;
To ensure a competent workforce to achieve our objectives;
To improve quality and management control processes;
To align the organizational culture to the business objectives to improve the
organizational efficacy and measure.
Development and implementation of the HIV / AIDS strategy and employee
wellness programme (EAP);
Motivation of employees and implementation of change management
programmes;
Development and implementation of retention and talent management strategies;
Maintenance of a healthy labour relations environment that is conducive;

169
Custodian of the Human Resources Policies;
Employment Equity;
Occupational Health and Safety;
Implementation of the Task Job Evaluation System;
Provision of management support and leadership on pertinent organizational
issues.
4.1.1 EMPLOYMENT EQUITY
Our employment practices are in line with Employment Equity Act No 55 of 1998 (as
amended). This act encourages equal opportunities and fair treatment in employment
by removing unfair discrimination and shall take affirmative action to address the
imbalances faced by the identified groups in the past.
uMshwathi Municipality is committed in fulfilling the purposes of the Employment Equity
Act No 55 of 1998 as amended by ensuring that its vision is in line with the vision of the
Republic of South Africa. The Municipality recognizes that this shall be achieved
through recruiting, training, developing and accelerating the promotional opportunities of
the designated groups.
The Municipality with its relevant stakeholders (management, employees, unions etc.)
undertakes to make employment decisions that are based on the principle of
employment equity in line with the agreed numerical targets and Affirmative Action
measures. In 2018/19 financial year, the Corporate Services Department included on its
departmental score card as a performance target the recruitment and appointment of
people from the designated groups as follows:
One woman in Middle Management
The Municipality appointed two (2) women in management in the positions of General
Manager Corporate Services and General Manager Technical Services.
The five-year Employment Equity Plan (July 2015 – June 2019) of the Municipality was
adopted during the 2015/16 financial year and the following table summarizes the
Employment Equity targets of the Plan.
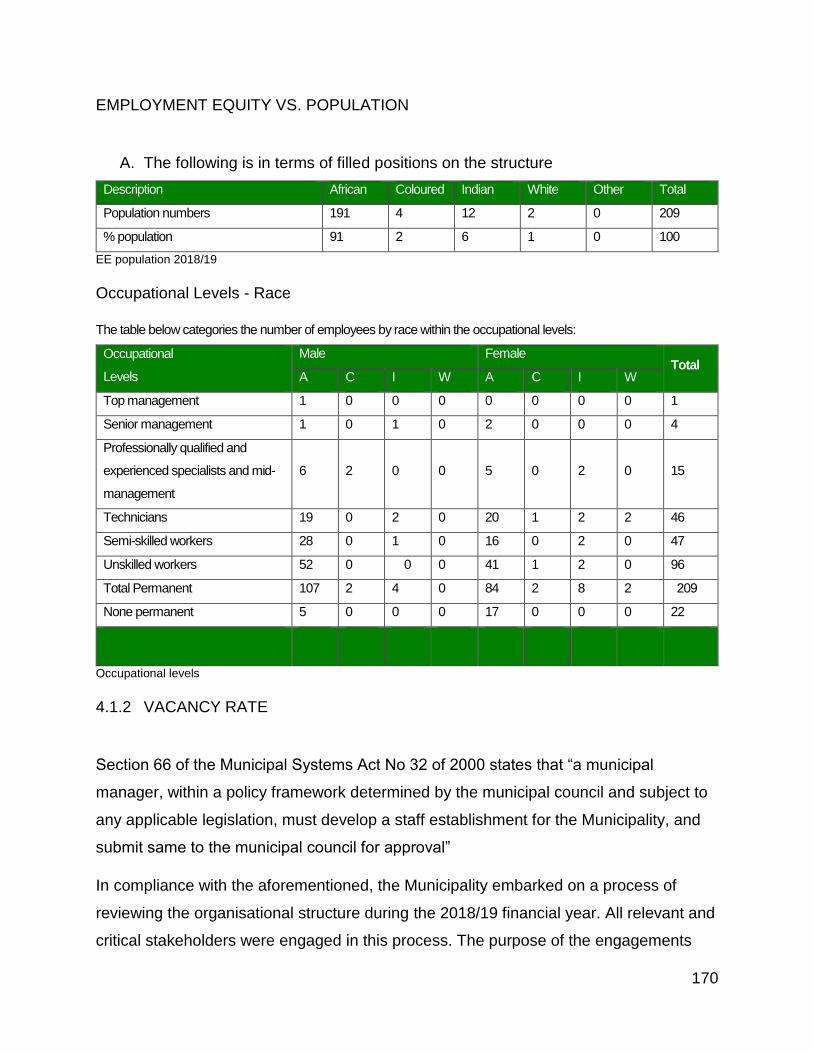
170
EMPLOYMENT EQUITY VS. POPULATION
A. The following is in terms of filled positions on the structure
Description African Coloured Indian White Other Total
Population numbers 191 4 12 2 0 209
% population 91 2 6 1 0 100
EE population 2018/19
Occupational Levels - Race
The table below categories the number of employees by race within the occupational levels:
Occupational
Levels
Male Female Total
A C I W A C I W
Top management 1 0 0 0 0 0 0 0 1
Senior management 1 0 1 0 2 0 0 0 4
Professionally qualified and
experienced specialists and mid-
management
6 2 0 0 5 0 2 0 15
Technicians 19 0 2 0 20 1 2 2 46
Semi-skilled workers 28 0 1 0 16 0 2 0 47
Unskilled workers 52 0 0 0 41 1 2 0 96
Total Permanent 107 2 4 0 84 2 8 2 209
None permanent 5 0 0 0 17 0 0 0 22
Occupational levels
4.1.2 VACANCY RATE
Section 66 of the Municipal Systems Act No 32 of 2000 states that “a municipal
manager, within a policy framework determined by the municipal council and subject to
any applicable legislation, must develop a staff establishment for the Municipality, and
submit same to the municipal council for approval”
In compliance with the aforementioned, the Municipality embarked on a process of
reviewing the organisational structure during the 2018/19 financial year. All relevant and
critical stakeholders were engaged in this process. The purpose of the engagements

171
was to review the structure in order to ensure that it is aligned with the strategic
objectives of the Municipality as displayed on the IDP. The following critical
stakeholders were engaged:
Heads of Departments
Extended Management Committee
Organized Labour
Local Labour Forum
Corporate Services Portfolio Committee
Executive Committee
Full Council
Following extensive consultative meetings with the aforementioned stakeholders, the
organizational structure was adopted on 30 May 2019.
The following diagram illustrates the overview of the staff establishment of uMshwathi
Municipality as reviewed, adopted during the 2018/19 financial year, and adopted on 30
May 2019:
General Managers appointed in terms of section 56 of the Municipal Systems Act 32 of
2000 head the departments. The General Managers are reporting directly to the
Municipal Manager who has been appointed in terms of Section 54A of the Act.
In the month of July 2019, the Municipality commenced with a placement process of all
existing employees into the approved organizational structure. This process involves

172
extensive consultation with Heads of Department, line managers for each department
and Union representatives
The Corporate Services Portfolio Committee, Executive Committee as well as Full
Council play a critical role of oversight in the matter.
The following diagrams illustrates the vacancy rate on the staff establishment that is
currently in use.
DEPARTMENT NUMBER OF POSITIONS
Office of the Municipal Manager 21
Corporate Services Department 37
Finance Services Department 22
Community Services Department 153
Technical Services Department 52
Total Number of posts 290
Vacancies 75
Vacancy Rate 25%
Table
Pie Chart
75%
25%
VACANCY RATIO
TOTAL NUMBER OF STAFF TOTAL NUMBER OF VACANCIES

173
4.1.3 STAFF TURNOVER RATE
A high staff turnover may be costly to a municipality and might negatively affect
productivity, service delivery and institutional memory/organisational knowledge. Below
is a table that shows the staff turnover rate within the municipality. The staff turnover
rate shows an increase from XX% in 2017/18 to XX % in 2018/19.
The table below indicates the staff turnover rate over the last three years:
Financial year
Total no appointments
at the end of each
financial year
New appointments No terminations during
the year Turn-over rate
2017/18 7 7 4 0
2018/19 6 6 18 0
Staff turnover rate as at 30 June 2019
The table below shows a breakdown of the different categories of the terminations:
Month Appoint-
ments
Promo-
tions Total
Retire-
ments
Dismiss
als
Resigna
-tions
Disable
d Death Total
July 2018 0 0 0
August 2018 0 1 1
September 2018 0 0 1 1
October 2018 1 1 1 1
November 2018 0 0 1 1
December 2018 0 0 1 1
January 2019
February 2019 1 1 1 1
March 2019 0 0
April 2019 0 0 1 1 2
May 2019 0 0 1 1
June 2019 1 1 1 1
Total
3 0 3 3 0 2 0 5 10
Termination Categories
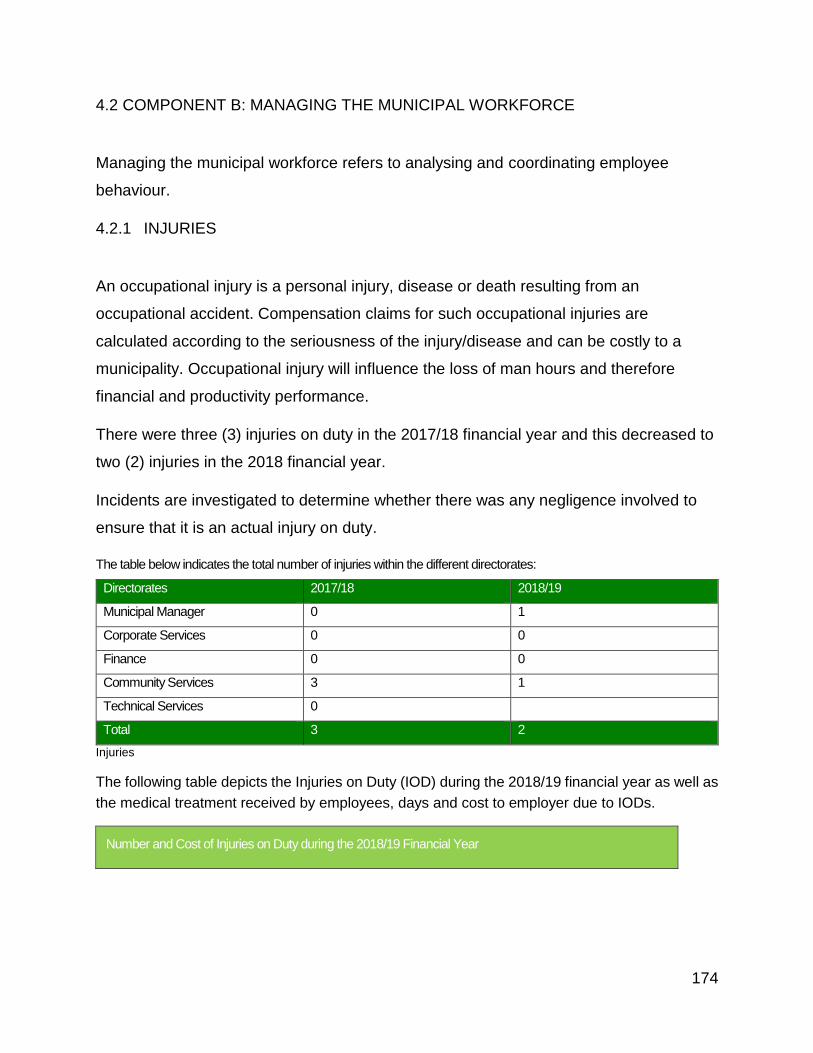
174
4.2 COMPONENT B: MANAGING THE MUNICIPAL WORKFORCE
Managing the municipal workforce refers to analysing and coordinating employee
behaviour.
4.2.1 INJURIES
An occupational injury is a personal injury, disease or death resulting from an
occupational accident. Compensation claims for such occupational injuries are
calculated according to the seriousness of the injury/disease and can be costly to a
municipality. Occupational injury will influence the loss of man hours and therefore
financial and productivity performance.
There were three (3) injuries on duty in the 2017/18 financial year and this decreased to
two (2) injuries in the 2018 financial year.
Incidents are investigated to determine whether there was any negligence involved to
ensure that it is an actual injury on duty.
The table below indicates the total number of injuries within the different directorates:
Directorates 2017/18 2018/19
Municipal Manager 0 1
Corporate Services 0 0
Finance 0 0
Community Services 3 1
Technical Services 0
Total 3 2
Injuries
The following table depicts the Injuries on Duty (IOD) during the 2018/19 financial year as well as
the medical treatment received by employees, days and cost to employer due to IODs.
Number and Cost of Injuries on Duty during the 2018/19 Financial Year

175
Type of injury
Injury
leave
taken
Employees using injuries on duty/
Medical Treatment
Total cost
IOD Medical Treatment
Required basic medical
attention only 5 0 2
2562.65
Temporary total
disablement 0 0 0
0
Permanent disablement 0 0 0
0
Fatal 0 0 0 0
TOTAL 5 0 2 2562.65

176
4.2.2 SICK LEAVE
The number of day’s sick leave taken by employees has service delivery and cost
implications. The monitoring of sick leave identifies certain patterns or trends. Once
these patterns are identified, corrective action can be taken.
The total number of sick leave taken during the 2018/19 financial year (1631.5) shows
an increase when compared with the 2017/18 financial year (1584).
The table below indicates the total number sick leave days taken within the different
directorates:
Department 2017/18 2018/19
Municipal Manager 158 190
Corporate Services 286 298.5
Finance 119 118
Community Services 961 861
Technical Services 60 164
Total 1584 1631.5
Sick leave
Month LTI MT DIFR
Jul 0 0 0
Aug 0 0 0
Sept 0 0 0
Oct 0 0 0
Nov 0 0 0
Dec 0 0 0
Jan 1 0 0
Feb 1 0 0
Mar 0 0 0
Apr 0 0
May 0 0 0
Jun 0 0
July 0 0 0
Total 2 0 0
0
0.2
0.4
0.6
0.8
1
1.2
Jul
Au
gSe
pt
Oct
No
vD
ec
Jan
Feb
Mar
Ap
rM
ay Jun
July
Tota
l
DIFR
MT
LTI

177
4.2.3 SUSPENSIONS
Employees who fail to adhere to the code of conduct of the municipality will lead to their
employment, suspended.
No employees have been suspended as all matters were resolved before suspension.
4.2.4 HR POLICIES AND PLANS
uMshwathi Municipality is governed by numerous South African Labour Legislations and
Collective Agreements of the South African Local Government Bargaining Council. The
Municipality reviews and develops its policies in order to ensure alignment with current
legislation as well as the environmental needs and operations.
The table below shows the current adopted HR policies:
No Adopted Policy Adoption Date
STRATEGIC POLICIES
1 Human Resources Strategy 27 February 2019
2 Employment Equity Policy 30 May 2019
ON BOARDING POLICIES
3 Recruitment and Induction Policy 29 June 2016
4 Probationary Period Policy 7 December 2015
DEVELOPMENT POLICIES
4 Skills Development Policy 27 February 2019
5 Internal Bursary Policy 27 February 2019
6 External Bursary Policy 27 February 2019
7 Learnership Policy 29 June 2016
8 Experiential Learning Policy 29 June 2016
9 Acting in a higher / same level position Policy 27 February 2019

178
HR,POLICIES REVIEWED
The Municipality reviewed and developed the following Human Resources policies
during the 2018/19 financial year:
10 Secondment Policy 7 December 2016
11 Individual Performance Management System ( IPMS) 7 December 2016
RETENTION POLICIES
12 Scarce and Critical Skills Policy
27 February 2019
MAINTENANCE POLICIES
13 Employee Wellness Policy 29 June 2016
14 Occupational Health and Safety Policy 29 June 2016
15 Occupational Health and Safety Practices and Procedures 29 June 2016
16 Occupational Health and Safety Plan 7 December 2015
17 Labour Relations Policy 7 December 2015
18 Leave Policy 27 February 2019
19 Job Evaluation Policy 27 February 2019
20 HIV / AIDS Policy 29 June 2016
21 Sexual Harassment Policy 29 June 2016
22 Travel and Subsistence Policy 29 June 2016
23 Subsidised Motor Vehicle Policy 29 June 2016
24 Substance Abuse Policy 29 June 2016
EXIT POLICIES
26 Termination of Service Policy 29 June 2016

179
REVIEWS
1 Skills Development Policy 27 February 2019
2 Internal Bursary Policy 27 February 2019
3 Employment Equity Policy 30 May 2019
4.3 COMPONENT C: CAPACITATING THE MUNICIPAL WORKFORCE
Section 68(1) of the MSA states that a municipality must develop its human resource
capacity to a level that enables it to perform its functions and exercise its powers in an
economical, effective, efficient and accountable way. For this purpose the human
resource capacity of a municipality must comply with the Skills Development Act (SDA),
1998 (Act No. 81 of 1998), and the Skills Development Levies Act, 20 1999 (Act No. 28
of 1999).
4.3.1 SKILLS DEVELOPMENT AND TRAINING
INTERNAL TRAINING PROGRAMS DURING THE 2018/19 FINANCIAL YEARS
uMshwathi Municipality is committed in fulfilling the purpose of the Skills Development
Act 97 of 1998 by using the Municipality as an active learning environment for both its
employees and the unemployed members of its Community. The Municipality
recognizes the importance of investing in its human capital through prudently planned
skills development initiatives and activities.
Skills Audits are conducted on an annual basis with a view to identifying the skills needs
within the Municipality in order to develop the workplace and to address the skills and
competency needs of its employees and Councillors, some information is incorporated
in the HR strategy.
The Municipality submitted the Workplace Skills Plan (WSP) and Annual Training
Report timeously to the Local Government SETA before 30 April 2019 as required by
law. The Municipality has therefore finalised the process of formulating the Workplace
Skills Plan for the 2019/20 financial year and the Annual Training Report for the 2018/19
financial year.

180
The budget that was allocated to training for the 2018/19 financial year was
R850 000.00. As at the end of the 2018/19 financial year 88% of the allocated amount
was utilized on training programs during the financial year.
4.3.2 THE FOLLOWING DIAGRAM ILLUSTRATES THE LEARNERSHIPS WHICH
WERE FUNDED BY THE LGSETA AND WERE ONGOING DURING THE 2018/19
FINANCIAL YEAR
SECTION 18.1 LEARNERSHIPS
NO EMPLOYEE LEARNERSHIP NUMBER OF EMPLOYEES
3 National Certificate in Municipal Integrated
Development Plan
28
SECTION 18.2 LEARNERSHIPS
4 National Certificate in Municipal Integrated
Development Plan
42
8 National Certificate: Landscaping
210
Skills development is able to support the Municipality to enhance achievement of the
Municipality’s Employment Equity agenda. Although skills development is aimed at
benefiting all employees, however the people of the designated groups (blacks, women,
and the disabled) should take preference in advancing their development. In line with
the Municipality’s Employment Equity targets as this will be addressing the imbalances
of the past through affirmative action. Skills development is linked to other human
resource processes and provides valuable information for recruitment and promotion
processes.
The Municipality is successfully creating a learning organisation and a learning
Community by placing significant value on the education, training and development of
its workforce, and by encouraging employees to grab appropriate learning opportunities
aimed at advancing their skills and competency levels.

181
4.3.3 THE FOLLOWING TABLE ILLUSTRATES THE INTERNAL TRAINING
INTERVENTIONS DURING THE 2018/19 FINANCIAL YEAR IN VARIOUS
OCCUPATIONAL CATEGORIES
NO
TRAINING INTERVENTIONS
TOTAL
EMPLOYEES
TRAINED
1 CPMD 2
2 Code 10 learner and drivers training 8
3 Certificate: Municipal IDP 3
4 Safe Work Procedure Manual 209
5 Hearing and Loss Prevention 209
6 Job Description Writing 30
7 Leadership development 28
8 Road & Interpret maps & engineering drawings & water reticulation 6
9 Chainsaw maintenance and handling 5
Skills matrix
4.3.3 SKILLS DEVELOPMENT - BUDGET ALLOCATION
The budget that was allocated to training for the 2018/19 financial year was R
850,000.00. As at the end of the 2018/19 financial year 88% of the allocated amount
was utilized on training programs during the financial year.
Total personnel budget Total allocated Total spent % Spent
850 000 748 000 88%
Budget allocated and spent for skills development

182
LGSETA requires all municipalities to submit quarterly training reports with evidence of
attendance in order to ensure that actual training is taking place in terms of the skills
development plan submitted for the 2018/19 financial year.
4.4 COMPONENT D: MANAGING THE MUNICIPAL WORKFORCE EXPENDITURE
Section 66 of the MSA states that the accounting officer of a municipality must report to
the council on all expenditure incurred by the municipality on staff salaries, wages,
allowances and benefits. This is in line with the requirements of the Public Service
Regulations (2002), as well as National Treasury Budget and Reporting Regulations
SA22 and SA23.
4.4.1 PERSONNEL EXPENDITURE
The table below indicates the percentage of the municipal budget that was spent on
salaries and allowance for the past three financial years and that the municipality is well
beneath the national norm of between 35 to 40%:
Financial year
Total expenditure salary
and allowances
Total operating
expenditure Percentage
R’000 %
2017/18 31 537 251 81 290 409 38.80%
2018/19 32 013 158 87 507 971 36.58%
Personnel expenditure
Below is an analysis of the personnel expenditure for the year under review:
Description
2017/18 2018/19
Actual Actual
R
Councillors (Political office bearers plus other)
Salary 1 697 546 1 763 007
Data Card Allowance 32 400 32 400
Cell phone allowance 187 812 187 248
Travel allowance 571 849 287 787
Subtotal – Councillors 2 489 607 2 570 442
% increase/(decrease) 12% 3.25%
All municipal employees (excl. councillors)

183
Description
2017/18 2018/19
Actual Actual
R
Salary 21 777 194 24 541 254
Company contributions 4 536 452 5 175 401
Motor vehicle allowances 1 306 955 1 267 636
Housing benefits and allowances 207 144 182 791
Performance bonus 0
Overtime 1 219 899 846 791
Subtotal - All municipal employees (excl. councillors) 29 047 644 32 013 158
% increase/ (decrease) 15% 10.21%
Total municipality 31 537 251 34 583 600
% increase/(decrease) 15% 9.66%
Personnel expenditure
CHAPTER 5: FINANCIAL PERFORMANCE
COMPONENT A: STATEMENT OF FINANCIAL PERFORMANCE
The statement of financial performance provides an overview of the financial
performance of the municipality and focuses on the financial health of the municipality.
5.1 FINANCIAL SUMMARY
The table below indicates the summary of the financial performance for the 2018/19
financial year:

184
Table 5.1 Financial Performance 2018/19
Description
2017/18 2018/19 2018/19 Variance
Actual
Audited
outcome)
Origina
l
budget
Adjusted
budget Actual
Original
budget
Adjustment
s budget
R’000 %
Financial performance
Property rates 36,009 36,200 42,250 45,505 25.70% 7.70%
Service charges 2,151 2,070 2,250 2,403 16.09% 6.80%
Investment revenue 1,511 1,500 1,600 2,335 55.67% 45.93%
Transfers recognised -
operational 92,274 97,972 97,972 97,972 100.00% 100.00%
Other own revenue 13,496 21,300 21,725 14,005 (34.25%) (35.54%)
Total revenue (excluding
capital transfers and
contributions)
145,441 159,04
2 165,797
162,22
0 2.20% (2.16%)
Employee costs 64,229 64,577 67,438 66,780 3.41% (0.98%)
Remuneration of
councillors 9,436 9,900 9,800 9,741 (1.69%) (0.60%)
Depreciation & asset
impairment 12,622 13,500 14,000 13,439 (0.45%) (4.01%)
Finance charges 419 360 200 167 (53.61%) (16.50%)
Materials and bulk
purchases 0 0 0 0 0 0
Transfers and grants 0 0 0 0 0 0
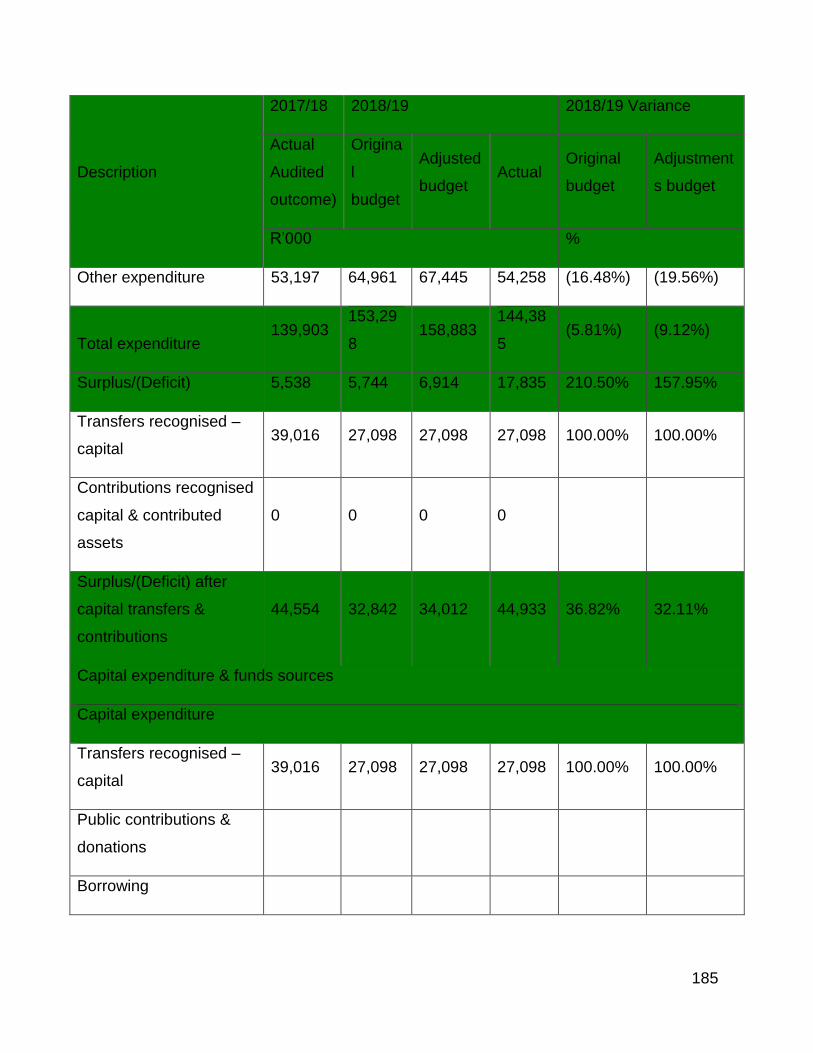
185
Description
2017/18 2018/19 2018/19 Variance
Actual
Audited
outcome)
Origina
l
budget
Adjusted
budget Actual
Original
budget
Adjustment
s budget
R’000 %
Other expenditure 53,197 64,961 67,445 54,258 (16.48%) (19.56%)
Total expenditure 139,903
153,29
8 158,883
144,38
5 (5.81%) (9.12%)
Surplus/(Deficit) 5,538 5,744 6,914 17,835 210.50% 157.95%
Transfers recognised –
capital 39,016 27,098 27,098 27,098 100.00% 100.00%
Contributions recognised
capital & contributed
assets
0 0 0 0
Surplus/(Deficit) after
capital transfers &
contributions
44,554 32,842 34,012 44,933 36.82% 32.11%
Capital expenditure & funds sources
Capital expenditure
Transfers recognised –
capital 39,016 27,098 27,098 27,098 100.00% 100.00%
Public contributions &
donations
Borrowing

186
Description
2017/18 2018/19 2018/19 Variance
Actual
Audited
outcome)
Origina
l
budget
Adjusted
budget Actual
Original
budget
Adjustment
s budget
R’000 %
Internally generated
funds 5.744 6.914 2,544 (55.71%) (63.21%)
Total sources of capital
funds 39,016 32.842 34,012 29,642 (9.75%) (16.55%)
Financial position
Total current assets 97,746 49,250 62,516
133,38
9 170.84% 113.37%
Total non-current assets 227,055
252,71
1 253,881
243,25
8 (3.74%) (4.18%)
Total current liabilities (9.989) (3,000) (3,000)
(17,351
) 478.37% 478.37%
Total non-current
liabilities (3,372) (2,288) (2,288) (2,925) 27.84% 27.84$
Community
wealth/Equity 311,440
296,67
3 311,109
356,37
1 20.12% 14.55%
Cash flows
Net cash from (used)
operating 46,041 42,515 49,237 54,455 28.08% 10.60%
Net cash from (used)
investing (41,499)
(32,842
) (34,012)
(53,174
) 61.91% 56.34%

187
Description
2017/18 2018/19 2018/19 Variance
Actual
Audited
outcome)
Origina
l
budget
Adjusted
budget Actual
Original
budget
Adjustment
s budget
R’000 %
Net cash from (used)
financing (4,268) (1,600) (900) (739) (53.81%) (17.89)
Cash/cash equivalents at
the beginning of the year 928 11,191 11,191 1,202 (89.26%) (89.26%)
Cash/cash equivalents at
the year end 1,202 19,264 25,516 1,744 (90.95%) (93.17%)
Variances are calculated by dividing the difference between actual and original/adjustments
budget by the actual
The table below shows a summary of performance against budgets:
Table 5.2 Performance against budgets
Financial
year
Revenue Operating expenditure
Budget Actual Diff.
%
Budget Actual Diff.
%
R’000 R’000
2017/18 182,627 184,459 1,832 1.00% 139,611 143,563 3,952 2.83%
2018/19 182,895 189,317 6,422 3.51% 148,883 144,385 (4,498) (3.02%)
The following graph indicates the various types of revenue items in the municipal
budget for 2018/19:

188
Revenue
The following graph indicates the various types of expenditure items in the municipal
budget for 2018/19:
Operating expenditure

189
5.1.1 REVENUE COLLECTION BY VOTE
The table below indicates the revenue collection performance by vote:
Table 5.3 Revenue by vote
Vote description
2017/1
8 2018/19 2018/19 Variance
Actual Original
budget
Adjuste
d
budget
Actual Original
budget
Adjust-
ments
budget
R’000 %
Vote 1 – Office of the
Municipal Manager 92,992 98,547 98,697 99,629 1.10% 0.94%
Vote 2 – Corporate
Services
Vote 3 – Community
Services 4,939 4,517.5 4,972.5 5,435 20.31% 9.30%
Vote 5 – Civil Engineering
Services 39,204 27,313 27,313 27,342 0.11% 0.11%
Vote 6 – Financial
Services 47,323
45,762.
5
51,912.
5 56,910 24.36% 9.63%
Total revenue by vote
184,45
8
176,14
0
182,89
5
189,31
6 7.48% 3.51%
Variances are calculated by dividing the difference between actual and
original/adjustments budget by the actual

190
5.1.2 REVENUE COLLECTION BY SOURCE
The table below indicates the revenue collection performance by source for the 2018/19
financial year:
Table 5.4 Revenue by source
Vote description
2017/1
8 2018/19 2018/19 Variance
Actual Original
budget
Adjuste
d
budget
Actual Original
budget
Adjust-
ments
budget
R’000 %
Property rates 36,009 36,200 42,250 45,505 25.70% 7.70
Property rates - penalties
& collection charges 0
0 0 0 0 0
Service charges -
electricity revenue 0
0 0 0 0 0
Service charges - water
revenue 0
0 0 0 0 0
Service charges -
sanitation revenue 0
0 0 0 0 0
Service charges - refuse
revenue 2,151 2,070 2,250 2,402 16.04% 6.76
Service charges - other 0 0 0 0 0 0
Rentals of facilities and
equipment 683 550 700 731 32.91% 4.43%

191
Vote description
2017/1
8 2018/19 2018/19 Variance
Actual Original
budget
Adjuste
d
budget
Actual Original
budget
Adjust-
ments
budget
R’000 %
Interest earned - external
investments 1,511 1,500 1,600 2,335 55.67% 45.94%
Interest earned -
outstanding debtors 9,733 8,000 8,000 9,045 13.06% 13.06%
Dividends received 0 0 0 0 0 0
Fines 28 72 42 45 (37.5%
) 7.14%
Licences and permits 0 0 0 0 0 0
Agency services 2,754 2,300 2,625 2,912 26.61% 10.93%
Transfers recognised –
operational 92,274 97,972 97,972 97,972 0 0
Other revenue 297 378 358 440 16.40% 22.91%
Gains on disposal of PPE 0 0 0
833 100.00
%
100.00
%
Total revenue (excluding
capital transfers and
contributions)
145,44
0
149,04
2
155,79
7
162,22
0 8.84% 4.12%
Variances are calculated by dividing the difference between actual and
original/adjustments budget by the actual

192
5.1.3 OPERATIONAL SERVICES PERFORMANCE
The table below indicates the operational services performance for the 2018/19 financial
year:
Table 5.5 Operational service performance
Description
2017/1
8 2018/19 2018/19 Variance
Actual
(Audite
d
Outco
me)
Original
Budget
Adjust
ed
Budget
Actual Original
Budget
Adjust-
ments
Budge
t
R’000 %
Operating Cost
Water
Waste Water (Sanitation)
Electricity
Waste Management 1,319 1,880 1,880 1,891 0.59% 0.59%
Housing
Component A: sub-total 1.319 1,880 1,880 1,891 0.59% 0.59%
Roads and Stormwater 18,447 29,693 29,533 13,866 (53.30
%)
(53.05
%)
Transport
Component B: sub-total 18,447 29,693 29,533 13,866 (53.30
%)
(53.05
%)

193
Description
2017/1
8 2018/19 2018/19 Variance
Actual
(Audite
d
Outco
me)
Original
Budget
Adjust
ed
Budget
Actual Original
Budget
Adjust-
ments
Budge
t
R’000 %
Planning
Local Economic
Development 897 1,200 1,200 1,519 26.58%
26.58
%
Component C: sub-total 897 1,200 1,200 1,519 26.58% 26.58
%
Libraries 2,079 1,994 2,223 2,303 15.50% 3.60%
Social services &
community development 22,801 12,529 13,070 24,360 94.42%
86.37
%
Component D: sub-total 24,880 14,523 15,293 26,663 83.59% 74.34
%
Environmental Protection 266 1,360 1,260 976 (28.24
%)
(22.54
%)
Component E: sub-total 266 1.360 1,260 976 (28.24
%)
(22.54
%)
Traffic & licensing 5,395 5,188 5,950 6,524 25.75% 9.65%
Fire Serices and Disaster
Management 365 500 450 263
(47.40
%)
(41.56
%)

194
Description
2017/1
8 2018/19 2018/19 Variance
Actual
(Audite
d
Outco
me)
Original
Budget
Adjust
ed
Budget
Actual Original
Budget
Adjust-
ments
Budge
t
R’000 %
Component F: sub-total 5,760 5,688 6,400 6,787 19.32% 4.74%
Holiday Resorts and
Campsites
Swimming Pools,
Stadiums and Sport
Ground
Community halls,
facilities, Thusong centres 3,982 4,700 4,650 5,216 10.98%
12.17
%
Component G: sub-total 3,982 4,700 4,650 5.216 10.98% 12.17
%
Financial Services 26,016 27,437 27,866 27,919 1.76% 0.19%
Office of the MM 17,305 17,529 19,413 18,059 3.02% (6.97
%)
Administration (Council) 16,930 14,642 14,892 14,133 (3.48%) (5.10
%
Human Resources
(Corporate) 27,761 24,646 26,496 27,357 11.00% 3.25%

195
Description
2017/1
8 2018/19 2018/19 Variance
Actual
(Audite
d
Outco
me)
Original
Budget
Adjust
ed
Budget
Actual Original
Budget
Adjust-
ments
Budge
t
R’000 %
Component UMSHWATHI
MUNICIPALITY: sub-total 88,012 84,254 88,667 87,468 3.82% (1.35)
Total Expenditure 143,56
3 143,298
148,88
3
144,38
6 0.75%
(3.02
%)
Variances are calculated by dividing the difference between actual and
original/adjustments budget by the actual
5.2 FINANCIAL PERFORMANCE PER MUNICIPAL FUNCTION
The tables below show the financial performance according to municipal functions:
5.2.1 OFFICE OF THE MUNICIPAL MANAGER
Table 5.6 Financial Performance: Office of the Municipal Manager
Description
2017/18 2018/19
Actual Original
budget
Adjustm
ent
budget
Actual
Varianc
e to
budget
R’000 %
Total operational revenue 0 0 0 0 0

196
Description
2017/18 2018/19
Actual Original
budget
Adjustm
ent
budget
Actual
Varianc
e to
budget
R’000 %
Expenditure:
Employees 10,204 9,789 9,789 10,118 3.36%
Repairs and maintenance
Other 7,101 7,740 9,624 7,941 (17.49%
)
Total operational expenditure 17,305 17,529 19,413 18,059 (6.95%
%)
Net operational (service)
expenditure (17,305)
(17,529
) (19,413) (18,059)
(6.95%
%)
5.2.2 FINANCE
Table 5.7 Financial Performance: Finance
Description
2017/18 2018/19
Actual Original
budget
Adjustment
budget Actual
Variance to
budget
R’000 %
Total operational revenue 47,322 45,762 51,912 56,910 9.63%
Expenditure:
Employees 8.239 8,132 8,251 8,008 (2,95%)

197
Description
2017/18 2018/19
Actual Original
budget
Adjustment
budget Actual
Variance to
budget
R’000 %
Repairs and maintenance
Other 17,777 19,305 19,615 19,911 1.51%
Total operational
expenditure 26,016 27,437 27,866 27,919 0.19%
Net operational (service)
expenditure 21,306 18,325 24,046 28,991 20.57%
5.2.3 ADMINISTRATION (COUNCIL)
Table 5.8 Finance Performance: Administration
Description
2017/18 2018/19
Actual Original
budget
Adjustment
budget Actual
Variance
to
budget
R’000 %
Total operational revenue 92,309 97,997 97,997 98,833 0.85%
Expenditure:
Employees 9,436 9,720 9,620 9,741 1.26%
Repairs and maintenance
Other 3,834 4,922 5,272 4,392 (16.69%)

198
Description
2017/18 2018/19
Actual Original
budget
Adjustment
budget Actual
Variance
to
budget
R’000 %
Total operational expenditure 13,270 14,642 14,892 14,133 (5.10%)
Net operational (service)
expenditure 79,039 83,355 83,805 84,700 1.07%
5.2.4 HUMAN RESOURCES (CORPORATE)
Table 5.9 Financial Performance: Human Resources
Description
2017/18 2018/19
Actual Original
budget
Adjustment
budget Actual
Variance
to
budget
R’000 %
Total operational revenue 0 0 0 0 0
Expenditure:
Employees 10,237 9,991 10,941 11,147 1.88%
Repairs and maintenance
Other 17,524 14,655 15,555 16,211 4.22%
Total operational expenditure 27,761 24,646 26,496 27,358 3.25%
Net operational (service)
expenditure (27,761) (24,646) (26,496) (27,358)

199
5.2.5 HOLIDAY RESORTS AND CAMPSITES (N/A)
Table 5.10 Financial Performance: Holiday Resorts and Campsites
Description
2017/18 2018/19
Actual Original
budget
Adjustment
budget Actual
Variance
to
budget
R’000 %
Total operational revenue
Employees
Repairs and maintenance
Other
Total operational expenditure
Net operational (service)
expenditure

200
5.2.6 SWIMMING POOLS AND SPORT GROUNDS (N/A)
Table 5.11 Financial Performance: Swimming Pools and Sports Grounds
Description
2017/18 2018/19
Actual Original
budget
Adjustment
budget Actual
Variance
to
budget
R’000 %
Total operational revenue
Expenditure:
Employees
Repairs and maintenance
Other
Total operational expenditure
Net operational (service)
expenditure

201
5.2.7 COMMUNITY FACILITIES AND THUSONG CENTRES
Table 5.12 Financial Performance: Community Facilities and Thusong Centre
Description
2017/18 2018/19
Actual Original
budget
Adjustment
budget Actual
Variance
to
budget
R’000 %
Total operational revenue 683 620 750 853 13.73%
Expenditure:
Employees
Repairs and maintenance 3,982 4,700 4,650 5,216 12.17%
Other
Total operational expenditure 3,982 4,700 4,650 5,216 12.17%
Net operational (service)
expenditure (3.299) (4,080) (3,900) (4,363) 11.87%

202
5.2.8 TRAFFIC SERVICES AND LAW ENFORCEMENT
Table 5.13 Financial Performance: Traffic Service and Law Enforcement
Description
2017/18 2018/19
Actual Original
budget
Adjustment
budget Actual
Variance
to
budget
R’000 %
Total operational revenue 2,781 2,370 2,665 2,955 10.88%
Expenditure:
Employees 5,380 4,988 5,750 6,524 13.46%
Repairs and maintenance
Other 15 200 200 0 100%
Total operational expenditure 5,395 5,188 5,950 6,524 9.65%
Net operational -service
expenditure (2,614) (2,818) (3,285) (3,569) 8.65%

203
5.2.11 FIRE SERVICES AND DISASTER MANAGEMENT (COMMUNITY & SOCIAL)
Table 5.14 Fire Services and Disaster Management
Description
2017/18 2018/19
Actual Original
budget
Adjustment
budget Actual
Variance
to
budget
R’000 %
Total operational revenue 5 6 6 5 (16.67%)
Expenditure:
Employees 20,366 8,043 8,844 21,170 139.37%
Repairs and maintenance
Other 3,698 6,186 5,876 4,971 (15.40%)
Total operational expenditure 24,064 14,229 14,720 26,141 (77.59%)
Net operational (service)
expenditure (24,059) (14,223) (14,714) (26,136) (77.63%)

204
5.2.12 LIBRARIES
Table 5.15 Financial Performance: Libraries
Description
2017/18 2018/19
Actual Original
budget
Adjustment
budget Actual
Variance
to
budget
R’000 %
Total operational revenue 2 2 2 1 (50.00%)
Expenditure:
Employees 2.075 1,861 2,090 2,229 6.65%
Repairs and maintenance
Other 4 133 133 74 (44.36%)
Total operational expenditure 2,079 1,728 1,957 2,303 17.68%
Net operational (service)
expenditure (2,077) (1,726) (1,955 (2.302) 17.75%

205
5.2.13 LED (Included in 5.2.11)
Table 5.16 Financial Performance: LED
Description
2017/18 2018/19
Actual Original
budget
Adjustment
budget Actual
Variance
to
budget
R’000 %
Total operational revenue
Expenditure:
Employees
Repairs and maintenance
Other
Total operational expenditure
Net operational (service)
expenditure

206
5.2.14 ROAD TRANSPORT
Table 5.17 Financial Performance: Road Transport
Description
2017/18 2018/19
Actual Original
budget
Adjustment
budget Actual
Variance
to
budget
R’000 %
Total operational revenue 188 215 215 259 20.47%
Expenditure:
Employees 7,729 21,953 21,953 7,586 (65.44%)
Repairs and maintenance
Other 10,718 7,740 7,040 6,280 (10.80%)
Total operational expenditure 18,447 29,693 28,993 13,866 (52.03%)
Net operational -service
expenditure (18,259) 29.478 (28,778) (13,607) (52.72%)

207
5.2.15 ENVIRONMENTAL PROTECTION
Table 5.18 Financial Performance: Environmental Protection
Description
2017/18 2018/19
Actual Original
budget
Adjustment
budget Actual
Variance
to
budget
R’000 %
Total operational revenue 0 0 0 0 0
Expenditure:
Employees
Repairs and maintenance 146 1,210 1,110 871 (21.53%)
Other 120 150 150 105 (30.00%)
Total operational expenditure 266 1,360 1,260 976 (22.54%)
Net operational (service)
expenditure (266) (1,360) (1,260) (976) (22.54%)
208
5.2.16 ELECTRICITY (N/A)
Table 5.19 Financial Performance: Waste Management
Description
2017/18 2018/19
Actual Original
budget
Adjustment
budget Actual
Variance
to
budget
R’000 %
Total operational revenue
Expenditure:
Employees
Repairs and Maintenance
Other
Total operational expenditure
Net operational (service)
expenditure

209
5.2.17 WATER (N/A)
Table 5.20 Financial Performance: Water
Description
2017/18 2018/19
Actual Original
budget
Adjustment
budget Actual
Variance
to
budget
R’000 %
Total operational revenue
Expenditure:
Employees
Repairs and Maintenance
Other
Total operational expenditure
Net operational (service)
expenditure

210
5.2.18 WASTE WATER MANAGEMENT (N/A)
Table 5.21 Financial Performance: Waste Water Management
Description
2017/18 2018/19
Actual Original
budget
Adjustment
budget Actual
Variance
to
budget
R’000 %
Total operational revenue
Expenditure:
Employees
Repairs and maintenance
Other
Total operational expenditure
Net operational (service)
expenditure
5.2.19 WASTE MANAGEMENT
Table 5.21 Financial Performance: Waste Management
Description
Actual Original
budget
Adjustment
budget Actual
Variance
to budget
R’000 %
Total operational revenue 2,151 2,070 2,250 2.402 6.76%
Expenditure:
Employees

211
Description
Actual Original
budget
Adjustment
budget Actual
Variance
to budget
R’000 %
Repairs and maintenance
Other 1,319 1,880 1,880 1,891 (0.59%)
Total operational
expenditure 1,319 1,880 1,880 1,891 (0.59%)
Net operational (service)
expenditure 832 190 370 511 38.12%

212
5.3 GRANTS
5.3.1 GRANT PERFORMANCE
The table below indicates the grant performance for the 2018/19 financial year:
Table 5.22 Grant Performance for 2018/19
Description
2017/1
8 2018/19
2018/19
Variance
Actual Budge
t
Adjust
-
ments
budge
t
Actual
Origin
al
budge
t
Adjust
-
ments
budge
t
R’000 %
Operating and capital transfers and grants
National Government:
Equitable share 87,377 91,82
0
91,82
0
91,82
0 0 0
Municipal Systems
Improvement 0 0 0 0 0 0
Expanded Public Works
Programme 2,065 1,471 1,471 1,471 0 0
Finance Management Grant 1,900 1,970 1,970 1,970 0 0
Provincial Government:
Library Grant 932 2,711 2,711 2,711 0 0
Other grant providers:

213
Description
2017/1
8 2018/19
2018/19
Variance
Actual Budge
t
Adjust
-
ments
budge
t
Actual
Origin
al
budge
t
Adjust
-
ments
budge
t
R’000 %
Total Operating Transfers And
Grants 92,274
97,97
2
97,97
2
97,97
2 0 0
5.3.2 CONDITIONAL GRANTS
The performance in the spending of conditional grants is summarised as follows:
Table 5.23 Conditional grant (excl. MIG)
Details
Budget
Adjust-
ments
budget
Actual
Variance
Budg
et
Adjustmen
ts budget
R’000 %
Financial Management Grant (FMG) 1,970 1,970 1,970 0 0.00
Municipal Systems Improvement
Grant 0 0 0
0 0.00
Municipal Infrastructure Grant (MIG) 27,098 27,098 27,098 0 0.00
Integrated National Electrification
Programme 10,000 10,000 10,000
0 0.00
Expanded Public Works
Program(EPWP) 1,471 1,471 1,471
0 0.00

214
Details
Budget
Adjust-
ments
budget
Actual
Variance
Budg
et
Adjustmen
ts budget
R’000 %
Library Grant 2,711 2,711 2,711 0 0.00
Equitable share 91,820 91,820 91,820 0 0.00
Total 135,07
0
135,07
0
135,07
0 0 0.00
Variances are calculated by dividing the difference between actual and
original/adjustments budget by the actual.
5.3.3 LEVEL OF RELIANCE ON GRANTS & SUBSIDIES
Table 5.24 Reliance on grants and subsidies
Financial year
Total grants
and subsidies
received
Total
operating
revenue
Percentage
R’000 %
2017/18 92,274 145,443 63.44%
2018/19 97,972 162,219 60.40%
The following graph indicates the municipality’s reliance on grants for the last two
financial years:
Reliance on grants

215
5.4 FINANCIAL RATIOS BASED ON KEY PERFORMANCE INDICATORS
5.4.1 LIQUIDITY RATIO
Table 5.25 Liquidity financial ratio
Description Basis of calculation
2017/18 2018/19
Audited Outcome Audited outcome
Current ratio
Current
assets/current
liabilities
9.78 7.69
5.4.2 BORROWING MANAGEMENT
Table 5.26 Borrowing Management
Description Basis of calculation
2017/18 2018/19
Pre-audit outcome Audited outcome
Capital charges to
operating
expenditure
Interest & principal
paid /operating
expenditure
0.03 0.63
5.4.3 EMPLOYEE COSTS
Table 5.27 Employee Costs
Description Basis of calculation
2017/18 2018/19
Pre-audit outcome Audited outcome
Employee costs Employee
costs/Total
53.86 53.00

216
Description Basis of calculation
2017/18 2018/19
Pre-audit outcome Audited outcome
Operational
expenditure
5.4.4 REPAIRS & MAINTENANCE
Table 5.28 Repairs and maintenance
Description Basis of calculation
2017/18 2018/19
Pre-audit outcome Audited outcome
Repairs &
maintenance
R&M/Operational
Expenditure 9.88 8.39
COMPONENT B: SPENDING AGAINST CAPITAL BUDGET
Capital expenditure relates mainly to construction projects that will have value lasting
over many years. Capital expenditure is funded from grants, borrowings and operating
expenditures and surpluses. Component B deals with capital spending indicating where
the funding comes from and whether municipalities are able to spend the available
funding as planned. In this component it is important to indicate the different sources of
funding as well as how these funds are spend.

217
5.5 CAPITAL EXPENDITURE
5.5.1 CAPITAL EXPENDITURE BY NEW ASSETS PROGRAMME
Table 5.29 Capital Expenditure: New Assets Programme
Description
2017/18 2018/19
Audited
outcome
Original
Budget
Adjustment
Budget
Actual
Expenditure
R'000
Capital expenditure by Asset Class
Infrastructure – Total 15,644 18,800 13,270 15,158
Infrastructure: Road
transport – Total 14,368 18,200 13,270 15,138
Roads, Pavements &
Bridges 14,368 18,200 13,270 15,138
Storm water 0 0 0 0
Infrastructure: Electricity –
Total
1,276 600 0 20
Generation 0 0 0 0
Transmission &
Reticulation
0 0 0 0
Street Lighting 1,276 600 0 20
Infrastructure: Water - Total 0 0 0 0
Dams & Reservoirs 0 0 0 0
Water purification 0 0 0 0

218
Description
2017/18 2018/19
Audited
outcome
Original
Budget
Adjustment
Budget
Actual
Expenditure
R'000
Capital expenditure by Asset Class
Reticulation 0 0 0 0
Infrastructure: Sanitation -
Total
0 0 0 0
Reticulation 0 0 0 0
Sewerage purification 0 0 0 0
Infrastructure: Other - Total 0 0 0 0
Waste Management 0 0 0 0
Transportation 0 0 0 0
Gas 0 0 0 0
Other 0 0 0 0
Community – Total 19,400 9,500 16,200 12,283
Parks & gardens 0 0 0 0
Sports fields& stadia 10,149 2,000 6,500 5,199
Swimming pools 0 0 0 0
Community halls 2,121 1,500 3,880 2,892
Libraries 0 0 0 0
Recreational facilities 0 0 0 0

219
Description
2017/18 2018/19
Audited
outcome
Original
Budget
Adjustment
Budget
Actual
Expenditure
R'000
Capital expenditure by Asset Class
Fire, safety & emergency 0 0 0 0
Security and policing 0 0 0 0
Buses 1,326 1,000 3,240 1,400
Clinics 0 0 0 0
Museums & Art Galleries 0 0 0 0
Cemeteries 0 0 0 0
Social rental housing 0 0 0 0
Other 5,804 5,000 2,580 2,792
Capital expenditure by
Asset Class 0 0 0 0
Heritage assets - Total 0 0 0 0
Buildings 0 0 0 0
Other 0 0 0 0
Investment properties -
Total 0 0 0 0
Housing development 0 0 0 0
Other 0 0 0 0
Other assets 1,446 4,542 4,542 2,201

220
Description
2017/18 2018/19
Audited
outcome
Original
Budget
Adjustment
Budget
Actual
Expenditure
R'000
Capital expenditure by Asset Class
General vehicles 723 1,792 1,792
Specialised vehicles 0 0 0 0
Plant & equipment 180 750 750 170
Computers -
hardware/equipment 321 1,000 1,000 950
Furniture and other office
equipment 222 1,000 1,000 358
Abattoirs 0 0 0 0
Markets 0 0 0 0
Civic Land and Buildings 0 0 0 723
Other Buildings 0 0 0 0
Other Land 0 0 0 0
Surplus Assets -
(Investment or Inventory) 0 0 0 0
Other 0 0 0
Agricultural assets 0 0 0 0
List sub-class 0 0 0 0
Biological assets 0 0 0 0

221
Description
2017/18 2018/19
Audited
outcome
Original
Budget
Adjustment
Budget
Actual
Expenditure
R'000
Capital expenditure by Asset Class
List sub-class 0 0 0 0
Intangibles 533 0 0 0
Computers - software &
programming 533 0 0 0
Other (list sub-class) 0 0 0 0
Total Capital Expenditure
on new assets 37,023 32,842 34,012 29,642
Specialised vehicles 0 0 0 0
Refuse 0 0 0 0
Fire 0 0 0 0
Conservancy 0 0 0 0
Ambulances 0 0 0 0
5.6 SOURCES OF FINANCE
The table below indicates the capital expenditure by funding source for the 2018/19
financial year:

222
Table 5.30 Capital expenditure: Funding Source
Details
2017/1
8 2018/19 2018/19 Variance
Actual
Origina
l
budget
(OB)
Adjustmen
t budget Actual
Adjustmen
t to OB
variance
Actual to
OB
variance
R”000 %
Source of finance
External loans 0 0 0 0 0 0
Public contributions
and donations 0 0 0 0 0 0
Grants and
subsidies 37,023 27,098 27,098
27,09
8 0 0
Own funding 0 5.744 6,914 2,544 (55.71%)0 (63.21%
)
Total 22 376 26 473 26 823 15
890 0 0

223
5.7 CAPITAL SPENDING ON 5 LARGEST PROJECTS
Projects with the highest capital expenditure in 2018/19
Table 5.31 Capital Expenditure: 5 Largest Projects
Name of project
2018/19 Variance current year:
2018/19
Original
budget
Adjustme
nt budget
Actual
expenditu
re
Original
variance
Adjustme
nt
variance
R’000
L714 Access Road 6,000 6,000 7,242 20.70% 20.70%
Urban Sportsfield 0 4,640 3,734 100.00% (19.53%)
D1013 3,500 1,700 2,423 (30.77%) 42,53%
Sicolile Hall 1,500 2,730 2,091 39.40% (23.41%)
Estezi Creche 1,500 1,100 1,930 28.66% 75.46%

224
5.8 MUNICIPAL INFRASTRUCTURE GRANT (MIG)
Table 5.32 Municipal Infrastructure Grant (MIG)
Municipal Infrastructure Grant (MIG)* Expenditure 2018/19 on Service backlogs
Details
Budget Adjustment
Budget Actual
Variance
Budget Adjustment
Budget
R'000 %
Infrastructure – Water 0 0 0 0 0
Reticulation 0 0 0 0 0
Water purification 0 0 0 0 0
Infrastructure – Sanitation 0 0 0 0 0
Reticulation 0 0 0 0 0
Sewerage purification 0 0 0 0 0
Infrastructure – Roads 18,800 13,270 15,138 (19.48%) 14.08%
Infrastructure - Electricity 0 0 0 0 0
Reticulation 0 0 0 0 0
Other Specify: 9,500 16,200 12,283 29.30% (24.18%)
Sports Fields 2,000 6,500 5,199 159.95% (20.02%)
Halls 1,500 3,880 2,892 92.80% (25.46%)
Taxi rank 1,000 3,240 1,400 40.00% (56.79%)
Creches 5,000 2,580 2,792 (44.16%) 8.22%
Total 37,800 29,470 27,421 0 0

225
Municipal Infrastructure Grant (MIG)* Expenditure 2018/19 on Service backlogs
Details
Budget Adjustment
Budget Actual
Variance
Budget Adjustment
Budget
R'000 %
* MIG is a government grant program designed to fund a reduction in service
backlogs, mainly: Water; Sanitation; Roads; Electricity. Expenditure on new, upgraded
and renewed infrastructure. Variances are calculated by dividing the difference
between actual and original/adjustments budget by the actual.
COMPONENT C: CASH FLOW MANAGEMNET AND INVESTMENTS
5.9 CASH FLOW
Table 5.33 Cash Flow
Description
2017/18 2018/19
Audited
outcome
Original
budget
Adjusted
budget Actual
R’000
Cash flow from operating activities
Receipts
Ratepayers and other 40,106 0 0 45,166
Government 0 operating 92,274 0 0 97,972
Government 0 capital 39,016 0 0 27,098
Interest 1,511 0 0 2,335

226
Description
2017/18 2018/19
Audited
outcome
Original
budget
Adjusted
budget Actual
R’000
Dividends 0 0 0 0
Payments
Suppliers and employees (126,446) 0 0 (117,949)
Finance charges (419) 0 0 (167)
Transfers and Grants 0 0
Net cash from/-used operating activities 46,042 0 0 54,454
Cash flow from investing activities
Receipts
Proceeds on disposal of PPE 0 0 0 0
Decrease -Increase in non-current debtors 0 0 0 0
Decrease -increase in other non-current receivables 0 0 0 0
Decrease -increase in non-current investments (4,479) 0 0 (23,532)
Payments
Capital assets (37,021) 0 0 (29,642)
Net cash from/-used investing activities (41,4499) 0 0 (53,174)
Cash flows from financing activities
Receipts
Short term loans 0 0 0 0

227
Description
2017/18 2018/19
Audited
outcome
Original
budget
Adjusted
budget Actual
R’000
Borrowing long term/refinancing 0 0 0 0
Increase -decrease in consumer deposits 0 0 0 0
Payments
Repayment of borrowing (4,267) 0 0 (739)
Net cash from/-used financing activities (4,267) 0 0 (739)
Net increase/-decrease in cash held 275 0 0 541
Cash/cash equivalents at the year begin 928 0 0 1,203
Net increase on cash/cash equivalents at the year-end 1,203 0 0 1,744
Source: MBRR SA7

228
5.10 GROSS OUTSTANDING DEBTORS PER SERVICE
Table 5.34 Gross outstanding debtors per service
Financial year
Rates
Trading
services
Economic
services
Housing
rentals Other Total (Electricity
and
water)
(Sanitation
and
refuse)
R’000
2017/18 62,507 0 3,749 0 41,809 108,065
2018/19 98.388 0 7,388 0 19,112 124,888
Difference 35,881 0 3.639 0 (22,697) 16,823
5.11 TOTAL DEBTORS AGE ANALYSIS
Table 5.35 Service debtors age analysis
Financial year
Less than
30 days
Between
30-60 days
Between
60-90 days
More than
90 days Total
R’000
2017/18 4,388 2,876 2,039 98,762 108,065
2018/19 4,843 3,009 2,096 114,940 124,888
Note: Figures exclude provision for bad debt

229
5.12 BORROWING AND INVESTMENTS
5.12.1 ACTUAL BORROWINGS
Table 5.36 Actual Borrowings
Instrument
2017/18 2018/19
R’000
Long-term loans (annuity/reducing balance) 1,631 892
Long-term loans (non-annuity) 0 0
Local registered stock 0 0
Instalment credit 0 0
Financial leases 0 0
PPP liabilities 0 0
Finance granted by Cap equipment supplier 0 0
Marketable bonds 0 0
Non-marketable bonds 0 0
Bankers acceptances 0 0
Financial derivatives 0 0
Other securities 0 0
Municipality total 584 78
The following graph shows the municipal actual borrowings for the past two years:

230
5.12.2 MUNICIPAL INVESTMENTS
Table 5.37 Municipal Investments
Investment* type
2017/18 2018/19
R’000
Securities - National government 0 0
Listed corporate bonds 0 0
Deposits – Bank 9,988 33,521
Deposits - Public investment commissioners 0 0
Deposits - Corporation for public deposits 0 0
Bankers acceptance certificates 0 0
Negotiable certificates of deposit – Banks 0 0
Guaranteed endowment policies (sinking) 0 0
Repurchase agreements – Banks 0 0
Municipal bonds 0 0
Other 0 0
Municipality total 1 872 54

231
The table below indicates the declaration of loans and grants made by the municipality
for the 2018/19 financial year:
Table 5.38 Declaration of loans and grants
All organisations or persons in
receipt of loans/grants provided by
the municipality
Nature of
project
Conditions
attached
to funding
Value
2018/19
Total
amount
committed
over
previous
and future
years
R’000 R’000
N/A
Total: 165 0
COMPONENT D: OTHER FINANCIAL MATTERS
5.13 SUPPLY CHAIN MANAGEMENT
The municipality does have policies and practices that comply with the guidelines set by
the Supply Chain Management regulations of 2005.

232