Embed Size (px)
Citation preview
GUIDELINES ON INTEGRATED ECONOMIC STATISTICS
White cover publication, pre-edited text subject to official editing
United Nations
GUIDELINES ON INTEGRATED ECONOMIC STATISTICS
Table of Contents Page
Preface 6
List of abbreviations and acronyms 9
List of case studies 13
Chapter I. INTRODUCTION 15
A. Purpose of the Guidelines 15
B. Content and structure of the Guidelines 15
C. Online access to additional information 19
Chapter II. POLICY NEEDS, BENEFITS AND CHALLENGES OF INTEGRATED ECONOMIC STATISTICS 20
A. Needs for integrated economic statistics 20
B. Policy needs 21
C. Benefits of integrated economic statistics 25
D. Challenges of integrated economic statistics 26
Chapter III. GENERAL FRAMEWORK FOR INTEGRATED ECONOMIC STATISTICS 30
A. Introduction 30 B. Scope of integration 30
C. Building blocks of integration 32
1. System of National Accounts as conceptual organizing framework 33
2. Institutional arrangements 35
a. Centralized statistical systems 37
b. Decentralized statistical systems 37
c. Centralization versus decentralization of statistical systems 38
3. Statistical production process 39
a. Standards and methods 39
b. Business registers and frames 41
2
c. Surveys and administrative data sources 42
d. Dissemination and communication 43
Chapter IV. INSTITUTIONAL ARRANGEMENTS FOR MANAGING INTEGRATED ECONOMIC STATISTICS 48
A. Introduction 48
B. Legislative, operational, strategic planning and process management framework 49
1. Legislative framework 49
2. Codes of practice 50
3. Strategic planning 52
4. Process management 55
C. Coordination and governance arrangements 57
1. Advisory committees 59
2. Relationship management 61
3. Memorandums of Understanding 62
4. Service level agreements 63
5. Cross-agency teams 63
D. Human and financial resources 64
1. Human resources 64
2. Financial resources 65
E. International arrangements for the integration of economic statistics 70
Chapter V. THE STATISTICAL PRODUCTION PROCESS OF INTEGRATED ECONOMIC STATISTICS 76
A. Introduction 76
B. Standards and methods 81
1. Common concepts, definitions and classifications 81
3
a. Harmonization of standards with macroeconomic statistics frameworks and classifications 85
b. Definition and classification of statistical units 86
c. Definition and classification of transactions 90
2. Data processing, data editing, metadata and data warehousing 91
3. Data quality frameworks 93
C. Business registers and frames 94
D. Surveys and administrative data sources 100
1. Statistical collection and common language 100
2. Questionnaire design 102
a. Principles of questionnaire design 102
b. Questionnaire database 104
c. Metadata system 106
d. Questionnaire grouping 106
3. Use of administrative data sources 108
a. Dealings with administrative authorities 110
b. Advantages and limitations of administrative records 111
c. Mapping of concepts and definitions of administrative sources with statistical uses 112
d. Other types of administrative data 113
E. Dissemination and communication 113
1. Dissemination 113
2. Communication 118
3. Practices of international dissemination and communication 119
Chapter VI. IMPLEMENTATION OF INTEGRATED ECONOMIC STATISTICS 121
A. Introduction 121
B. Reconciliation of source data 122
C. Industry accounts 125
1. Agriculture 127
4
2. Industry and services 128
D. Input-Output accounts 129
E. Sector accounts 138
F. International accounts 141
G. Labour accounts 146
H. System of price and volume measures 148
I. Regional accounts 153
J. Satellite accounts 154
1. Tourism satellite accounts 154
2. Health satellite accounts 155
K. Environmental accounts 159
Annex 1. List of domains for integrated economic statistics 162
Annex 2. References 165
5
Preface
The development of the Guidelines on Integrated Economic Statistics has been initiated by the Statistical
Commission as it recognized the significance of an integrated approach for increasing the consistency and
coherence of economic statistics to enhance the quality and analytical value of the information the statistics
contain for short term, annual and benchmark economic statistics and macroeconomic statistics. At its thirty-
seventh session in 2006, the Commission recommended the operational use of an integrated approach to
economic statistics in national economic statistics programmes, based on the Report of the Secretary-General
on Integrated Economic Statistics (E/CN.3/2006/5). Subsequently, at its forty-second session in 2011, the
Statistical Commission endorsed the draft Guidelines (E/CN.3/2011/37).
The present Guidelines have been developed as a collaborative effort of two Friends of the Chair groups
created by the Statistical Commission. For the purpose of preparing a concept paper on the modalities of the
integrated approach to economic statistics, the thirty-seventh session of the Statistical Commission
established the first Friends of the Chair Group on Integrated Economic Statistics (E/CN.3/2006/32), under
the leadership of Adelheid Bürgi-Schmelz, Director General of the Swiss Federal Statistical Office. The
Group discussed its findings at a Workshop on Integrated Economic Statistics, co-organized by the Swiss
Federal Statistical Office and the Statistical Office of the Department of Economic and Social Affairs of the
United Nations (UNSD), on 6-8 June 2007 in Berne. The Friends of the Chair presented its final report
containing the concept paper on integrated economic statistics at the thirty-ninth session of the Statistical
Commission in 2008 (E/CN.3/2008/6). The members of the first Friends of the Chair Group and participants
of the workshop in Berne included Denis Farrell (Australia), Marie Brodeur and Michel Girard (Canada),
Zhang Weimin (China), Swaraj K. Nath (India), Irena Tvarijonaviciute (Lithuania), Jaime Andres de la Llata
Flores and Yuriko Yabuta (Mexico), Marleen Verbruggen and Kees Zeelenberg (Netherlands), Ron
McKenzie (New Zealand), Asad Elahi (Pakistan), Rashad Cassim (South Africa), Adelheid Bürgi-Schmelz,
Ruth Meier, Michel Di Pietro and Philippe Stauffer (Switzerland), J. Steven Landefeld (United States of
America), Werner Bier and Richard Walton (European Central Bank), Peter Bekx (Eurostat), Robert
Edwards (International Monetary Fund), Enrico Giovannini (Organisation for Economic Cooperation and
Development) and Magdolna Csizmadia and Ivo Havinga (UNSD).
This publication builds on and extends the concept paper prepared by the first Friends of the Chair Group
and includes case studies based on papers presented at the Berne workshop.
6
At the request of the thirty-ninth session of the Statistical Commission (E/CN.3/2008/34), a second Friends
of the Chair Group was formed in 2009 under the leadership of J. Steven Landefeld, Director of the Bureau
of Economic Analysis, Department of Commerce, United States of America, with the purpose of preparing
more extensive and operational guidelines including case studies and practical knowledge material to guide
countries in the process of implementing an integrated approach in their national statistical systems. The
initial draft chapters submitted by members of the Group were discussed at a meeting, co-organized by the
Bureau of Economic Analysis of the United States of America and UNSD, on 7-9 December 2009 in
Washington, D.C. The members of the second Friends of the Chair Group, participants of the Washington,
D.C. meeting and additional staff of the participating organizations providing written contributions included
Michel Girard (Canada), Ramón Bravo Zepeda (Mexico), Peter van de Ven, Ronald Janssen, Arnout van
Delden and Alex Lammertsma (Netherlands), Ron McKenzie (New Zealand), Rashad Cassim (South Africa),
J. Steven Landefeld, Shaunda Villones, Ruth Bramblet, Dennis Fixler, Bruce Grimm, Kristy Howell, Brent
Moulton and Erich Strassner (United States of America), Richard Walton (European Central Bank), Peter
Bekx (Eurostat), Adelheid Bürgi-Schmelz, Manik Shrestha, Mick Silver, Andrew Kitili and Ethan Weisman
(International Monetary Fund), Carsten Boldsen (Economic Commission for Europe) and Paul Cheung,
Magdolna Csizmadia and Ivo Havinga (UNSD).
Members of the second Friends of the Chair on Integrated Economic Statistics contributed draft chapters and
case studies for this publication and have been engaged in the review of subsequent versions of the
Guidelines. A full working draft was circulated for global consultation in December 2010-January 2011 and
comments were provided by 54 countries and organizations. The forty-second session of the Statistical
Commission in 2011 endorsed the draft Guidelines and made suggestions for its finalization
(E/CN.3/2011/37). In response to the call by the Commission for additional case studies, the contributions of
Brazil, Finland and the United Kingdom, including text by Sanjiv Mahajan (United Kingdom Office for
National Statistics) are gratefully acknowledged. The incorporation of comments, additional contributions,
substantive editing, revision and preparation of the final version was jointly undertaken by J. Steven
Landefeld and Shaunda Villones (Bureau of Economic Analysis, Department of Commerce, United States of
America), Richard Walton (European Central Bank) and Magdolna Csizmadia, Ivo Havinga and Gulab Singh
(UNSD).
These Guidelines are published as a methodological tool and a compendium of case studies on the integrated
approach to economic statistics to assist countries in producing macroeconomic statistics that are consistent
and coherent with short-term, annual and benchmark economic statistics. The Guidelines present the
integration framework of economic statistics based on best current practices for the entire spectrum of
7

statistical agencies, from countries with centralized and decentralized statistical systems, as well as from
countries at different stages of economic and statistical development.
8
List of abbreviations and acronyms
AEG Advisory Expert Group
AES Annual Enterprise Survey
AMNE Activities of multinational enterprises
ANZSIC Australian and New Zealand Standard Industrial Classification
ARC Advance Release Calendar
BANFF Generalized edit and imputation system
BEA Bureau of Economic Analysis, United States of America
BIS Bank for International Settlements
BLS Bureau of Labor Statistics, United States of America
BPM6 Balance of Payments Manual, Sixth Edition
CANCEIS Canadian Census Edit and Imputation System
CBS Central Bureau of Statistics of the Netherlands
CES Current Employment Statistics
CES Conference of European Statisticians
CIF Cost, insurance and freight
CMFB Committee on Monetary, Financial and Balance of Payments Statistics
CNAE National classification of economic activities of Brazil
CPA Classification of Products by Activity
CPI Consumer price index
DQAF Data Quality Assessment Framework
ECB European Central Bank
ESA European System of Accounts
EU European Union
Eurostat Statistical Office of the European Communities
FAO Food and Agriculture Organization of the United Nations
9
FDI Foreign direct investment
FIRST Fully Integrated Rational Survey Technique
FOB Free on board
GAAP Generally-Accepted Accounting Principles
GDDS General Data Dissemination System
GDP Gross domestic product
GFSM Government Finance Statistics Manual
GSG Government Statistician Group of the United Kingdom
GSS Government Statistical Service of the United Kingdom
GST Goods and services tax
GVA Gross value added
HICP Harmonized Index of Consumer Prices
HST Harmonized sales tax
I Industry
IBGE Instituto Brasileiro de Geografia e Estatística
ICP International Comparison Programme
ICT Information and Communication Technology
IFRS International Financial Reporting Standards
ILO International Labour Organization
IMF International Monetary Fund
INEGI Instituto Nacional de Estadística y Geografía (Mexico)
I-O Input-output
IPP International price project
IRS Internal Revenue Service
ISIC International Standard Industrial Classification of All Economic Activities
ISWGNA Intersecretariat Working Group on National Accounts
ISCO International Statistical Classification of Occupations
10
ISO International Organization for Standardization
IT Information Technology
JEDH Joint External Debt Hub
KLEMS Capital (K), labour (L), energy (E), materials (M) and service (S) inputs
MFI Monetary financial institutions
MNE Multinational enterprise
MOU Memorandum of Understanding
NACE Classification of Economic Activities in the European Community
NAICS North American Industrial Classification System
NAMEA National accounting matrix including the environmental accounts
NAMWA National accounting matrix including water accounts
NAPCS North American Product Classification System
NCB National Central Bank
NIPA National income and product accounts
NPISH Non-profit institutions serving households
NSO National Statistical Organization
NSDP National Data Summary Pages
NQAF National quality assessment frameworks
OECD Organisation for Economic Cooperation and Development
ONS Office for National Statistics of the United Kingdom
P Product
PEEI Principal European Economic Indicators
PPI Producer price index
PY Previous year
PYP Previous year prices
QCEW Quarterly Census of Employment and Wages
R&D Research and development
11
RIMS Regional Input-Output Modeling System
SDDS Special Data Dissemination Standard
SDMX Statistical Data and Metadata eXchange
SEEA System of Environmental-Economic Accounts
SHA System of Health Accounts
SNA System of National Accounts
SUT Supply and use table
TFFS Task Force on Financial Statistics
TSA Tourism Satellite Account
TTSA Travel and Tourism Satellite Accounts
UNECE United Nations Economic Commission for Europe
UNSC United Nations Statistical Commission
UNSD United Nations Statistics Division
UNWTO World Tourism Organization
VAT Value Added Tax
WCA World Programme for the Census of Agriculture
WHO World Health Organization
XBRL Extensible Business Reporting Language
XML Extensible Markup Language
12
List of case studies
Page
Case study 2.1 Mapping economic statistics to user needs in South Africa 24
Case study 2.2 A core set of consistent and timely economic statistics: integrated economic accounts for the
euro area 28
Case study 2.3 The impetus for integrated national accounts in the United States: The Great Depression 29
Case study 3.1 Integrating agriculture into the national statistical system 45
Case study 3.2 Integration of monetary and financial statistics in the euro area financial accounts 47
Case study 4.1 United Kingdom Code of Practice 66
Case study 4.2 Statistics Netherlands - Chain management 67
Case study 4.3 Statistics New Zealand – Using business process modelling to enhance integration 68
Case study 4.4 Roles of the Office for National Statistics and the United Kingdom Statistics Authority 69
Case study 4.5 The Intersecretariat Working Group on National Accounts 71
Case study 4.6 The Task Force on Finance Statistics 72
Case study 4.7 The International Comparison Programme 73
Case study 4.8 The Harmonized Index of Consumer Prices 74
Case study 4.9 The institutional environment in the creation of euro area accounts 75
Case study 5.1 Statistics Netherlands - Centralized integration system for national accounts 78
Case study 5.2 Statistics for the harmonized revenue allocation formula in Canada 79
Case Study 5.3 New Zealand economy-wide economic survey 80
Case study 5.4 Good practices in the development of international statistical standards 84
Case study 5.5 Statistics New Zealand - Tax-based business register 99
Case study 5.6 An integrated economic surveys system: The Mexican approach 103
Case study 5.7 Use of administrative sources to produce structural business statistics: the Brazilian case 109
Case study 5.8 Origins and purpose of the SDMX 117
Case study 6.1 United States measures of compensation 125
13
Case study 6.2 Adjustments to industry source data to improve consistency: the United States enterprise-
establishment adjustment process 127
Case study 6.3 An overview of the compilation schematic integrating Supply and Use Tables and Symmetric
Input-Output Tables – United Kingdom 131
Case study 6.4 Using the input-output accounts to benchmark United States GDP statistics 133
Case study 6.5 The development of quarterly national accounts in the Netherlands 134
Case study 6.6 The input-output framework as a data-harmonisation and integration tool: The United States
integration of the annual industry accounts 135
Case study 6.7 Integration of industry statistics: KLEMS statistics for the United States 137
Case study 6.8 The sector accounts in the Netherlands 140
Case study 6.9 The United States-Canadian current-account reconciliation and data exchange 143
Case study 6.10 The development of labour accounts in the Netherlands 148
Case study 6.11 Towards integrated price and volume system: a practical experience of Statistics Finland 151
Case study 6.12 Price indexes in the United States national accounts 152
Case study 6.13 Netherlands tourism satellite accounts 156
Case study 6.14 United States travel and tourism satellite accounts 157
Case study 6.15 Health Satellite Account – Brazil - 2005-2007 158
Case study 6.16 Environmental accounting in the Netherlands 161
14
Chapter I. INTRODUCTION
A. Purpose of the Guidelines
1.1 The purpose of the Guidelines on Integrated Economic Statistics is to aid countries in preparing a set
of integrated economic statistics in response to the need for a consistent framework for measuring a
country’s economic activity in an increasingly interconnected global economy. Integrated economic
statistics provide a consistent and reliable assessment of a country’s economic activity for policy and
analytical uses.
1.2. The Guidelines are based on internationally adopted standards, including the System of National
Accounts 2008, the Balance of Payments Manual, Sixth Edition, and more specialized technical manuals,
such as those on the measurement of prices, sectoral and business statistics, and foreign direct investment.
The Guidelines use the methodological standards, the recommendations, and the emphasis on policy-relevant
data in these manuals as the basis for the organizing principles and detailed practices for preparing integrated
economic statistics that are presented.
1.3. These principles include the design of strategic plans for the integration of micro and macro data that
are based on consistent economic data within countries, over time, and across countries worldwide.
1.4. The recommended practices for countries vary. For countries with centralized statistical systems,
“bottom-up” practices, such as the development of plans to collect data, may ensure consistent micro data
that are used as inputs into national accounts and other macro data. For countries with more decentralized
statistical systems, “top-down” practices may be needed; these practices include procedures to adjust input
data to the concepts and definitions used in the national accounts and the use of common standards and
consistent estimation methods, including reconciliation techniques.
B. Content and structure of the Guidelines
1.5. Chapter II describes the needs of policymakers and other users for integrated economic statistics,
the benefits of the availability of these statistics, and the challenges of preparing these statistics.
1.6. Policymakers and other users need integrated economic statistics that are consistent with other
economic statistics and indicators provided by the national statistical system. These needs should be the basis
for a country’s plans for developing better integrated economic accounts that are designed to be consistent
with macroeconomic concepts and theories for accounting for growth and productivity.
1.7. The Guidelines summarize the benefits of integrated economic statistics as follows:
15
• Consistency between short-term indicators and macroeconomic data on the state of the economy for
monetary and fiscal authorities, businesses, and other users at critical turning points in the economy.
• Consistency across sectors in depicting trends in, and the distribution of, economic activity across
products, industries, and regions for tax and spending projections, business planning, the allocation
of funds, and economic coordination and assistance.
• Consistency across countries for key measures such as real GDP, inflation, balance sheets, and
international trade for purposes of assessing cross-country effects and policy coordination.
• Transparency and consistency in concepts and definitions so that decision-makers are using common
metrics for trade, financial, and other policies.
• Greater accuracy in the economic data through the reconciliation of discrepancies across data from
different sources as part of the integration process.
• Reduction in the reporting burden for business respondents, increased efficiency in the production of
data, and greater accuracy through the use of common definitions, common or reconciled business
registers, common or integrated questionnaires, common and integrated electronic data collection,
editing and processing, estimation, and dissemination systems, use of administrative records, and
other strategies for integration.
• More relevant statistics that more quickly address user needs through the development of integrated
links to advisory committees, new management and legal structures, and more accessible data
dissemination systems.
1.8. The challenges of integrating economic statistics include the need for resources to be invested in
adopting statistical standards, in re-engineering statistical production processes, and in changing institutional
arrangements for the long-term benefits.
1.9 Three case studies are presented: mapping economic statistics to user needs in South Africa,
integrated economic accounts for the euro area, and the impetus for integrated national accounts in the
United States of America.
16
1.10. Chapter III describes the general framework of integrated economic statistics that is determined by
the scope of the integration of selected statistical domains and by the three building blocks of the statistical
infrastructure for economic statistics.
1.11 The scope and the statistical domains for integration need to be outlined and selected in order to
respond to users’ demands for integrated economic statistics and to treat the selected domains as interrelated
statistics in a consistent statistical system.
1.12 Three interlinked building blocks support the integrated approach to economic statistics. First, the
System of National Accounts provides the common conceptual framework. Second, institutional
arrangements (including legislative, organizational, budgetary, managerial, and customer arrangements)
further support the environment for integration in both centralized and decentralized statistical systems.
Third, an integrated statistical production process provides a production chain from the collection of basic
data to the dissemination of the resulting statistics. This chapter focuses on the first building block and
provides an overview of the other two building blocks; details on the institutional arrangements are presented
in chapter IV, and details on the integrated statistical production process are presented in chapter V.
1.13 Two case studies are presented: integrating agricultural statistics into the national statistical system
and integrating monetary and financial statistics into the euro area financial accounts.
1.14 Chapter IV describes the institutional arrangements that are essential for developing and managing
a system of integrated economic statistics. It details the legislative, operational, strategic planning, and
process management framework, the coordination and governance arrangements, and the human and
financial resources. It also highlights the need for flexibility in developing integration plans in countries with
different types of statistical systems.
1.15 The coordination and governance arrangements for achieving the integration of statistics include
formation of advisory committees, practicing relationship management, signing of memorandums of
understanding between the users of the statistics and the producers of the statistics, and having service- level
agreements between suppliers and users, and cross-agency teams.
1.16 Human and financial resources are two essential elements of a successfully integrated statistical
system. Guidelines for the best use of these elements are presented.
1.17 International arrangements for the integration of economic statistics include a key list of activities
that must be well coordinated, supported, and if possible, fully formalized to develop integrated economic
statistics
17
1.18 Nine case studies are presented. Four illustrate the national experiences of the United Kingdom, the
Netherlands, and New Zealand, and five provide information about institutional arrangements that support
the integration of economic statistics.
1.19 Chapter V describes the four major components of the integrated statistical production process in
the following sections: standards and methods, business registers and frames, surveys and administrative
sources, and dissemination and communication.
1.20 Standards and methods are the common concepts, definitions, and classifications that are the basis
for improving the quality of data so that the resulting economic statistics can be successfully integrated into a
consistent statistical system.
1.21 Business registers and frames presents information on the importance of a common universe, or
frame, of statistical units to be regularly collected in surveys so that the data are consistent.
1.22 Surveys and administrative sources presents information on the requirements for conducting surveys
to collect data, including the design of the questionnaires, and the use of administrative records data.
1.23 Dissemination and communication presents information on providing accessibility to the statistics in
various formats and media to a broad range of users.
1.24 Eight case studies provide information about the practices of national statistical organizations in
Brazil, Mexico, Canada, the Netherlands, and New Zealand, and each focuses on a different component of
the statistical production process to achieve integration.
1.25 Chapter VI introduces the implementation framework for integrated economic statistics. It presents
practical case studies related to a range of topics for the implementation of integrated economic statistics. It
demonstrates the use of specific accounts such as industry accounts, input-output accounts, sector accounts
and labour accounts.
1.26 Satellite accounts—which may be linked to the core accounts but incorporate alternative definitions
and conventions—are also included. The discussion focuses on practical compilation problems that might
arise during implementation and on potential solutions for both centralised and decentralised systems.
1.27 Sixteen case studies supplement the information that is presented in this chapter, including studies
about the uses of the various accounts in Brazil, Finland, the Netherlands, the United Kingdom, and the
United States of America.
18
C. Online access to additional information
1.28 Documents and reference material with information about integrated economic statistics—such as
country practices, case studies, and other sources about statistical innovations—are available from the
Knowledge Base on Economic Statistics at http://unstats.un.org/unsd/EconStatKB/Knowledgebase.aspx
which is maintained by the United Nations Statistics Division.
1.29 The documents on this Web site are organized by the components of the integrated statistical
production process framework and by statistical domain. The Web site also provides links to statistical
standards that are relevant to the integration of economic statistics. Further case studies, in addition to those
presented in the Guidelines, are posted on the Web site providing access to a broader range of country
practices and diverse information material. It will be continuously updated with contributions from national
and international institutions about their experience and practices on topics related to the integration of
economic statistics.
19
Chapter II. POLICY NEEDS, BENEFITS AND CHALLENGES OF INTEGRATED ECONOMIC STATISTICS
A. Needs for integrated economic statistics
2.1 Integrated economic statistics are a set of economic statistics that depict a consistent and coherent
picture of economic activities for policy, business, and other analytical uses. Integration of economic
statistics is about the use of common concepts, definitions, estimation methods and data sources for statistical
reconciliation. In today’s global context, the users of the statistical services ask for more and better statistics
and the statistical services need to be proactive in satisfying the increasing user needs for integrated
economic data.
2.2 In addition, a number of recent emerging initiatives on the measurement of sustainability, social
progress and well-being have raised the need for integrated and coherent official statistics to shed light on
these complex issues and hence pose challenges to statistical offices to produce integrated economic,
environmental and socio-demographic statistics. The development of such integrated and multidimensional
statistics requires developing the capacity to integrate the production of relevant statistics.
2.3 The motivation for integrated economic statistics comes from the benefits such datasets provide for
coordinated national and global policy initiatives in an increasingly interconnected world. This motivation is
relevant for all countries, independent of the level of development of statistical systems and the national
economy. The integration is achievable for small and comprehensive national economic datasets and can be
progressively introduced in the national statistical system.
2.4 The practices to achieve integration of economic statistics may vary depending on the degree of
centralization or decentralization of the national statistical system. National statistical systems that are less
advanced and complex should take, at an early stage, the principles of integration of economic statistics into
the design of their statistical production process. More advanced statistical systems should incorporate the
principles of integration in the re-engineering of their statistical production process and institutional
arrangements.
2.5 It should be recognized that one single and detailed implementation approach towards integrated
economic statistics is neither possible nor desirable, because national statistical systems are different. There
are, however, general guiding principles and good practices that are presented in these Guidelines.
Integration requires a broad and comprehensive system-wide approach encompassing: (a) the adoption of the
conceptual framework of the System of National Accounts as the umbrella framework for organizing
economic statistics, (b) the alignment of the interdependencies of the components of the statistical production
process and (c) the establishment of enabling institutional arrangements for statistical integration.
20
2.6 Historically, many national statistical organizations have organized their production process
according to a “stovepipe” model. In that model, a unit within a statistical agency is responsible for
producing statistics related to a specific segment of the economy such as manufacturing, retail trade or
investment. The unit is responsible for conducting all the steps required to produce the statistics for that
specific segment of the economy, from collection to dissemination. Under that model, each unit has its own
set of data suppliers. The information collected from each unit is integrated in the national accounts
framework according to a consistent set of concepts, definitions and classifications of the System of National
Accounts. This integration work closely studies and harmonizes the surveys and estimation methods that take
place in the other units in order to achieve the highest level of consistency and coherence of the statistics
compiled by each of the units.
2.7 From an operational point of view, the “stovepipe” model has its merits, but it falls short of
addressing the real needs of the data users. Also, under this model, data collection through separate industry
samples runs the risk of omission and duplication of statistical units. Clients find it useful to have access to
data for a specific segment of the economy, but this is not all the information they need. The reality is that
the world is complex and economic activities are interrelated. Users need statistics that will allow them to
make links quickly between various segments of the economy. They need to evaluate the linkages between
the various sectors of the economy to assess the impact of exogenous shocks and to formulate appropriate
policy responses in order to achieve specified goals such as stability or growth. Users need to be able to
establish linkages between real economy activities and the related financing activities. They need
comprehensive and consistent statistics about emerging issues related to global phenomena such as the
sustainability of trends in debt, housing, and financial markets, innovation, globalization, and environment
conditions. Users need a comprehensive and consistent macroeconomic statistical framework for analyzing
economic relationships and changes in production, consumption and accumulation. They need consistent
datasets for output, income and productivity in the real sector and the functioning of the financial sector.
B. Policy needs
2.8 Comprehensive integration begins with the adoption of the System of National Accounts as the
organizing conceptual framework. Moreover, integration must recognize the interlinkages of macroeconomic
accounts - national accounts statistics, external sector statistics, balance of payments accounts, government
finance statistics and monetary and financial statistics. These macro-economic accounts, along with
associated macro-price and employment data, are the cornerstones of economic policy, business strategy, and
of business and household expectations.
21
2.9 Users prefer to assess “signals” on economic, financial and monetary phenomena, which are first
given by short-term statistics at monthly and quarterly frequency and subsequently in trend and details
provided with the release of quarterly and annual national accounts. These short term statistics relate to
production, retail sales, employment, prices and the like, are important in their own right and are used for
many policy decisions. Moreover, these component data should be appropriately integrated through data
aggregation as statistical inputs for macro statistics.
2.10 Global financial crises are important reminders of the need for integration, in particular between the
real and financial sectors of the economy. The financial crises have prompted many statistical agencies to
react quickly to collect new or updated short term information about their economy on a regular basis. The
financial crises have highlighted the importance of information on banks’ balance sheet behavior in funding
and financing, acquisition of assets and liabilities together with movement in prices in relation to the real
sector developments.
2.11 Mutually reinforcing interpretation of data through the use of the System of National Accounts as an
organizing conceptual framework allows policymakers to focus on the appropriate policy, rather than trying
to determine the "true" state of the economy including the sources of growth or weaknesses in the economy
in order to best target their interventions.
2.12 Transparent institutional arrangements based on consultations with users and coordination of
producers should be compliant with the criteria of accuracy, data quality, and comparability across countries.
These consultations with users should be formalized through advisory committees and service agreements
and coordination of producers through legal mandates. Coordination among data producers should address
users’ main preference for consistent information during a business cycle from the release of component data
on segments of the economy to macroeconomic aggregates. Any shortcomings in providing the consistent
and coherent information users require may lead to misinterpretations and policy mistakes that could be
costly for the economy in terms of output, employment and price stability, as well as financial and monetary
objectives.
2.13 The framework within which statistics are aggregated, adjusted, revised and released allow users to
assess production, income and financial flows and productivity measures as major inputs to their economic
and monetary analysis. Policy makers require such a framework, because it allows a disaggregation of
macroeconomic aggregates by institutional sectors and a detailed analysis of the interactions among
institutional sectors and between them and the rest of the world.
2.14 The System of National Accounts as organizing framework of integrated economic statistics offers a
comprehensive policy perspective of the economy for detailing the financial and non-financial transactions
22
by sectors of the economy. These statistics can enhance policy analysis and enrich economic analysis and
provide a framework to analyse macro-prudential issues such as risks and exposures. The benefits lie,
moreover, in a comprehensive set of data and indicators which are available – at a higher frequency – in one
single framework.
2.15 Integrated economic statistics are of key importance for ensuring that the correct monetary, fiscal
and other policy decisions are taken. In monetary policy, for example, this framework covers a bank-based
system of financial intermediation and provides information on the financial structure of the economy, as
well as providing monetary variables (the financial investment of the money-holding sectors and the liquidity
of the non-financial sectors and their sources of funds) and a summary view of financial markets including
credit conditions and prices.
2.16 Even though the specific policy needs of each user differ, they require a link to a more coordinated
set of microeconomic and macroeconomic statistics. This is certainly the case for economic policy or
decision-taking at all levels of government, but also within the public and private corporations. For example,
large corporations such as multinationals have an interest in macroeconomic models tailored to their own
requirements. Moreover, financial institutions have to provide forecasts for individual clients, all of which
require detailed macroeconomic statistics that are consistent with other more detailed sector and industrial
statistics. Harmonization of concepts for macro and micro data can reduce duplicate requests for similar
information, reduce confusion and misreporting, reduce respondent burden, reduce survey costs, and improve
the accuracy and consistency of information presented to users.
2.17 User needs for integrated and consistent economic data should remain the foundation for developing
integrated economic accounts and associated component data. The central role of these users also underlines
the importance of engaging users in setting priorities for statistical integration. Case study 2.1 provides an
example of systematic engagement with user groups in South Africa for mapping economic statistics to user
needs.
23

Case study 2.1 Mapping Economic Statistics to User Needs in South Africa In the area of economic statistics in South Africa, systematic engagement with users represents a major challenge. In
deciding how to prioritize competing demands from different users, a large weight is given to produce essential data
such as the production, turnover, Producer Price Index, Consumer Price Index and employment that feed into the
national accounts. The domain of economic statistics faces continuous challenges for improving the quality of GDP, its
timeliness, and the proper allocation by components of GDP. This poses difficulties as the demand for micro data
increases for analysis at detailed industry level. As we develop our economic statistics programme beyond national
accounts, a very important area for further development is our focus on other aspects of the statistical production cycle,
like questionnaire design.
In defining broader priorities of economic statistics there are three sets of issues that are taken on board in balancing
user needs with available resources:
• the status of existing collections by continuously assessing the detail collected and its frequency;
• the need for new data collections and publications; and
• the implications of discontinuing publications no longer considered useful.
A complex mechanism is in place to respond to user needs based on formalized engagement with organizations within
the broader government and state architecture (Parliament Committee, Ministries, Statistics Council, Advisory
committees). Moreover, user groups, as shown below, are a key vehicle through which to improve our statistical
priorities.
User groups Form of engagement Economics Subcommittee Ongoing engagement -average of 3 meetings a year User groups in progress CPI, Agriculture and Government Accounts User groups planned GDP, Labour Market Statistics Annual forum with economists Joint venture with universities Biannual workshops with Reserve Bank Scheduled
Source: Mapping Economic Statistics to User Needs: Aligning Statistical Production with South Africa’s Economic Policy Priorities, Statistics South Africa, paper presented at Friends of the Chair on Integrated Economic Statistics workshop, 6-8 June 2007, Berne.
24
C. Benefits of integrated economic statistics
2.18 The benefits of integration not only accrue to users of the data, but also to data producers and data
providers. In countries able to redesign data collection systems from the “bottom up,” the use of common
concepts, definitions, business registers and frames, estimation methods and data sources improve
consistency and reduce respondent burden and may reduce statistical agency costs, at least in the longer term.
This allows agencies to better direct their scarce resources to answering users’ demands for updating and
extending their statistical programmes. Such integration in data collection also facilitates the introduction of
consistent, automated edits and other best practices that reduce the likelihood of errors and improve
accuracy, while at the same time increase consistency. Even in countries more reliant on “top-down”
procedures, the ability to share micro data and reconcile major differences in business lists, and the use of
common concepts, definitions, classifications, data sources and estimation methods such as seasonal
adjustments, balancing techniques and extrapolation can produce large gains in consistency, accuracy and
efficiency.
2.19 Harmonization of sample frames, collections, and estimating methods help produce consistency
between macro data and the input data collected at the micro level. The micro statistics are of importance in
their own right, and used for many policy and business decisions, as well as inputs for macro statistics. Their
consistency is important for integrated micro and macro business decisions and related economic policy.
2.20 Effective integration exploits the role of macroeconomic accounts for reconciliation, using them as a
double-entry accounting system for identifying discrepancies; providing a statistical framework for their
resolution in a manner that both increases accuracy and consistency. Basic statistics that can be reconciled in
this framework are a vast array of economic statistics such as employment, prices, production, consumption
and accumulation, which feed into national accounts.
2.21 Integration of economic statistics throughout the stages of the statistical production process from
collection through dissemination can produce many benefits. The included case studies 2.2 and 2.3 for the
euro area and the United States, respectively, provide illustrative examples. The main benefits of integrated
economic statistics for data producers, users and providers alike can be summarized as follows:
• Consistency between such data as monthly and other short-term indicators and quarterly and annual
macroeconomic data on the state of the economy for monetary and fiscal authorities, businesses, and
other users at critical turning points in the economy.
• Consistency across sectors in depicting trends in, and the distribution of, economic activity across
products, industries, and regions for national and regional tax and spending projections, business
planning, the allocation of funds, and economic coordination and assistance.
25
• Consistency across countries for key measures such as real GDP, inflation, balance sheets, and
international trade for purposes of assessing cross country effects and policy coordination in today’s
interdependent global economy.
• Transparency and consistency in concepts and definitions so that decision-makers are using common
metrics for trade, financial, and other policies.
• Greater accuracy in the economic data through the reconciliation of discrepancies across data from
different sources as part of the integration process.
• Reduction in the reporting burden for business respondents and increased efficiency in the production
of data through the use of common definitions, common or reconciled business registers, common or
integrated questionnaires, common and integrated electronic data collection, processing, and
dissemination systems, use of administrative records, and other strategies for integration.
• More relevant statistics that more quickly address user needs through the development of integrated
links to advisory committees, new management and legal structures, and new data dissemination
systems.
D. Challenges of integrated economic statistics
2.22 Moving towards the integration of economic statistics is likely to impact many, if not all, economic
data collections due to changes of statistical design and production process. The traditional approach to the
collection of economic statistics has been to cover different topics and economic activities in a rolling
programme of surveys and censuses spread over several years. The resulting inconsistencies in survey and
questionnaire designs can make the integration of economic statistics difficult. A major cause of incoherence
among economic statistics is that collection of basic data through surveys and administrative sources for
different industries or activities are designed independently of each other. The objective of measuring
accurately a particular industry or sector remains, but an equally important objective is to design ways to
produce statistics that are consistent with those for other industries and sectors. When designing a data
collection for a particular industry, it should be considered how it will integrate with other statistical outputs.
For example, data collections for a particular segment of the economy cannot be designed in isolation, but
must use concepts, definitions and estimation methods that are used in other economic surveys and
administrative collections. The application of consistent classifications to appropriately defined statistical
units is essential for the coherence of economic statistics and avoiding omissions and duplications of units.
The challenge lies in ensuring that statistical units and their classifications are applied consistently across all
statistical measures.
26
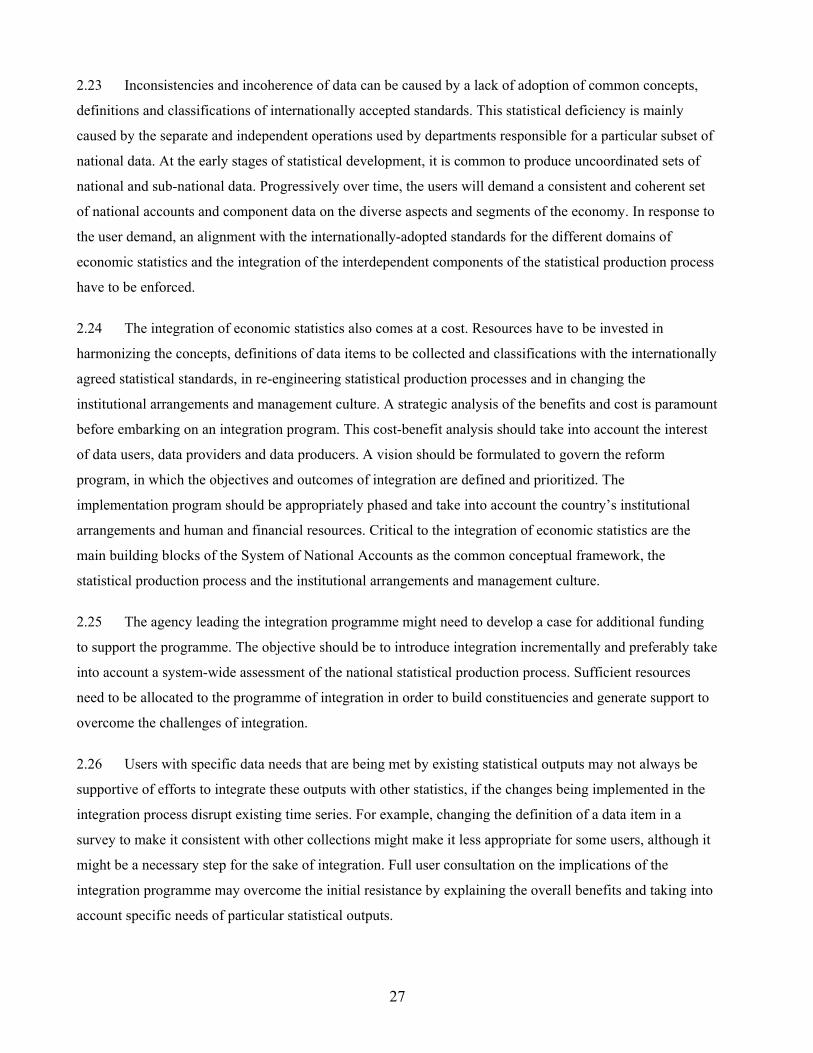
2.23 Inconsistencies and incoherence of data can be caused by a lack of adoption of common concepts,
definitions and classifications of internationally accepted standards. This statistical deficiency is mainly
caused by the separate and independent operations used by departments responsible for a particular subset of
national data. At the early stages of statistical development, it is common to produce uncoordinated sets of
national and sub-national data. Progressively over time, the users will demand a consistent and coherent set
of national accounts and component data on the diverse aspects and segments of the economy. In response to
the user demand, an alignment with the internationally-adopted standards for the different domains of
economic statistics and the integration of the interdependent components of the statistical production process
have to be enforced.
2.24 The integration of economic statistics also comes at a cost. Resources have to be invested in
harmonizing the concepts, definitions of data items to be collected and classifications with the internationally
agreed statistical standards, in re-engineering statistical production processes and in changing the
institutional arrangements and management culture. A strategic analysis of the benefits and cost is paramount
before embarking on an integration program. This cost-benefit analysis should take into account the interest
of data users, data providers and data producers. A vision should be formulated to govern the reform
program, in which the objectives and outcomes of integration are defined and prioritized. The
implementation program should be appropriately phased and take into account the country’s institutional
arrangements and human and financial resources. Critical to the integration of economic statistics are the
main building blocks of the System of National Accounts as the common conceptual framework, the
statistical production process and the institutional arrangements and management culture.
2.25 The agency leading the integration programme might need to develop a case for additional funding
to support the programme. The objective should be to introduce integration incrementally and preferably take
into account a system-wide assessment of the national statistical production process. Sufficient resources
need to be allocated to the programme of integration in order to build constituencies and generate support to
overcome the challenges of integration.
2.26 Users with specific data needs that are being met by existing statistical outputs may not always be
supportive of efforts to integrate these outputs with other statistics, if the changes being implemented in the
integration process disrupt existing time series. For example, changing the definition of a data item in a
survey to make it consistent with other collections might make it less appropriate for some users, although it
might be a necessary step for the sake of integration. Full user consultation on the implications of the
integration programme may overcome the initial resistance by explaining the overall benefits and taking into
account specific needs of particular statistical outputs.
27
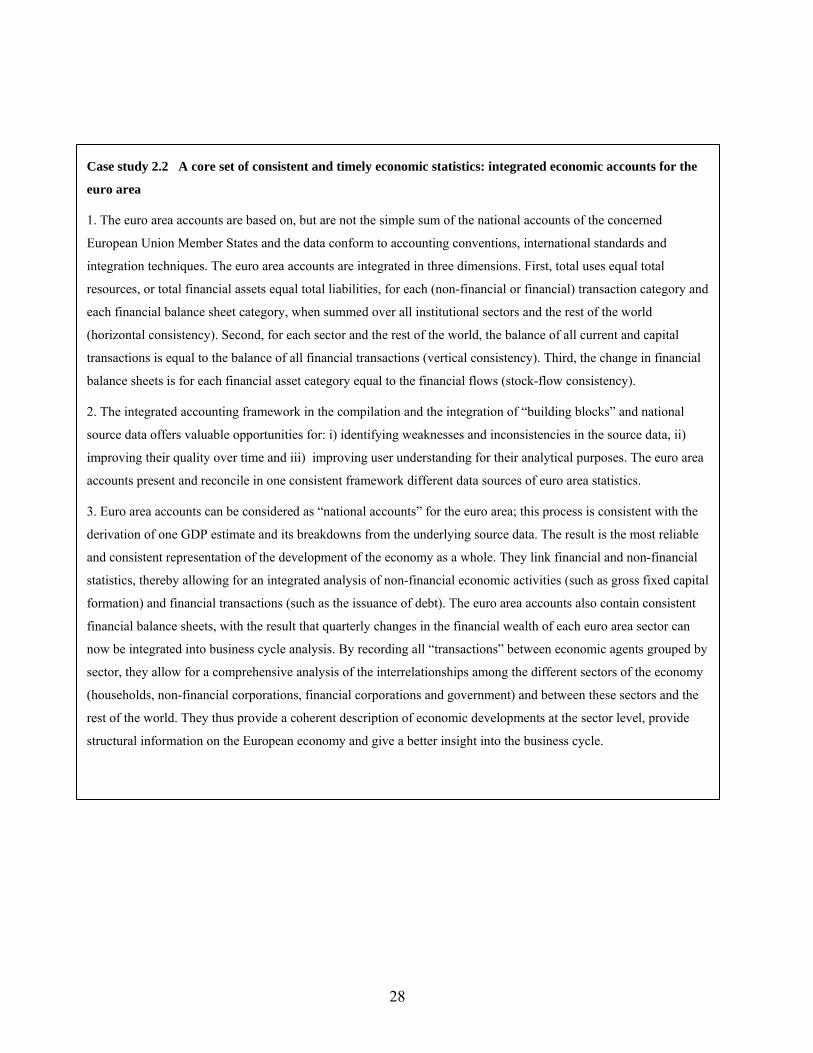
Case study 2.2 A core set of consistent and timely economic statistics: integrated economic accounts for the
euro area
1. The euro area accounts are based on, but are not the simple sum of the national accounts of the concerned
European Union Member States and the data conform to accounting conventions, international standards and
integration techniques. The euro area accounts are integrated in three dimensions. First, total uses equal total
resources, or total financial assets equal total liabilities, for each (non-financial or financial) transaction category and
each financial balance sheet category, when summed over all institutional sectors and the rest of the world
(horizontal consistency). Second, for each sector and the rest of the world, the balance of all current and capital
transactions is equal to the balance of all financial transactions (vertical consistency). Third, the change in financial
balance sheets is for each financial asset category equal to the financial flows (stock-flow consistency).
2. The integrated accounting framework in the compilation and the integration of “building blocks” and national
source data offers valuable opportunities for: i) identifying weaknesses and inconsistencies in the source data, ii)
improving their quality over time and iii) improving user understanding for their analytical purposes. The euro area
accounts present and reconcile in one consistent framework different data sources of euro area statistics.
3. Euro area accounts can be considered as “national accounts” for the euro area; this process is consistent with the
derivation of one GDP estimate and its breakdowns from the underlying source data. The result is the most reliable
and consistent representation of the development of the economy as a whole. They link financial and non-financial
statistics, thereby allowing for an integrated analysis of non-financial economic activities (such as gross fixed capital
formation) and financial transactions (such as the issuance of debt). The euro area accounts also contain consistent
financial balance sheets, with the result that quarterly changes in the financial wealth of each euro area sector can
now be integrated into business cycle analysis. By recording all “transactions” between economic agents grouped by
sector, they allow for a comprehensive analysis of the interrelationships among the different sectors of the economy
(households, non-financial corporations, financial corporations and government) and between these sectors and the
rest of the world. They thus provide a coherent description of economic developments at the sector level, provide
structural information on the European economy and give a better insight into the business cycle.
28
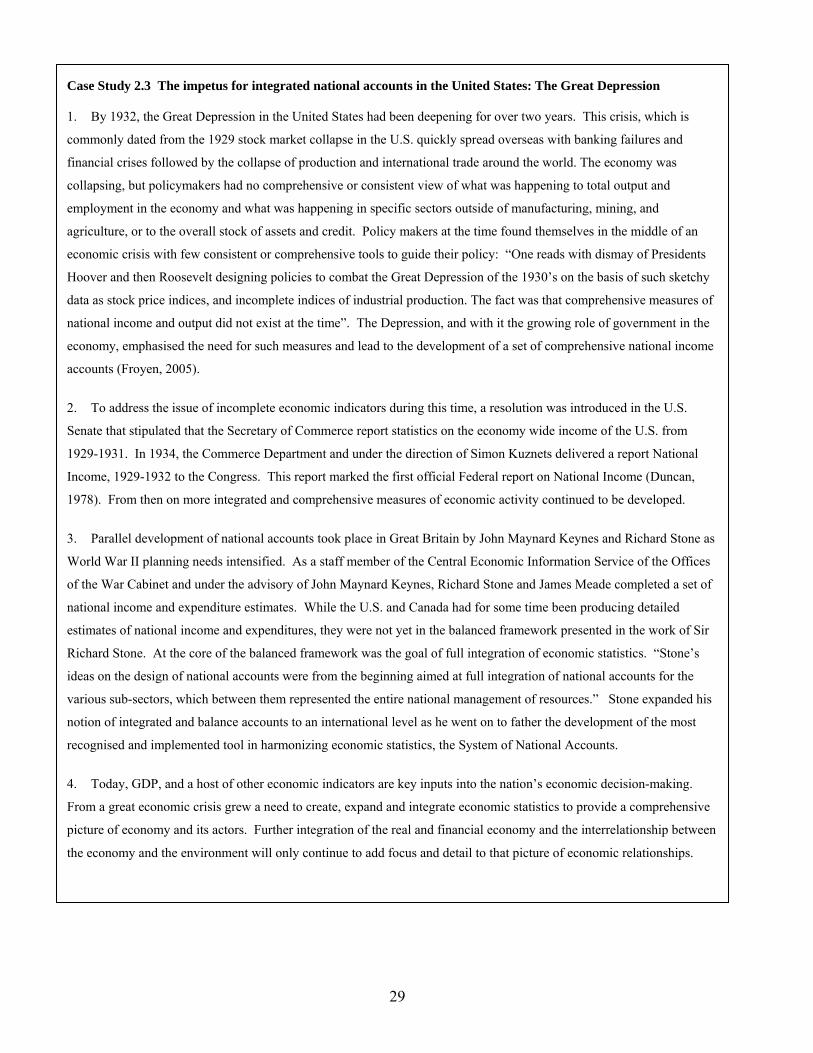
2. To address the issue of incomplete economic indicators during this time, a resolution was introduced in the U.S.
Senate that stipulated that the Secretary of Commerce report statistics on the economy wide income of the U.S. from
1929-1931. In 1934, the Commerce Department and under the direction of Simon Kuznets delivered a report National
Income, 1929-1932 to the Congress. This report marked the first official Federal report on National Income (Duncan,
1978). From then on more integrated and comprehensive measures of economic activity continued to be developed.
3. Parallel development of national accounts took place in Great Britain by John Maynard Keynes and Richard Stone as
World War II planning needs intensified. As a staff member of the Central Economic Information Service of the Offices
of the War Cabinet and under the advisory of John Maynard Keynes, Richard Stone and James Meade completed a set of
national income and expenditure estimates. While the U.S. and Canada had for some time been producing detailed
estimates of national income and expenditures, they were not yet in the balanced framework presented in the work of Sir
Richard Stone. At the core of the balanced framework was the goal of full integration of economic statistics. “Stone’s
ideas on the design of national accounts were from the beginning aimed at full integration of national accounts for the
various sub-sectors, which between them represented the entire national management of resources.” Stone expanded his
notion of integrated and balance accounts to an international level as he went on to father the development of the most
recognised and implemented tool in harmonizing economic statistics, the System of National Accounts.
4. Today, GDP, and a host of other economic indicators are key inputs into the nation’s economic decision-making.
From a great economic crisis grew a need to create, expand and integrate economic statistics to provide a comprehensive
picture of economy and its actors. Further integration of the real and financial economy and the interrelationship between
the economy and the environment will only continue to add focus and detail to that picture of economic relationships.
Case Study 2.3 The impetus for integrated national accounts in the United States: The Great Depression
1. By 1932, the Great Depression in the United States had been deepening for over two years. This crisis, which is
commonly dated from the 1929 stock market collapse in the U.S. quickly spread overseas with banking failures and
financial crises followed by the collapse of production and international trade around the world. The economy was
collapsing, but policymakers had no comprehensive or consistent view of what was happening to total output and
employment in the economy and what was happening in specific sectors outside of manufacturing, mining, and
agriculture, or to the overall stock of assets and credit. Policy makers at the time found themselves in the middle of an
economic crisis with few consistent or comprehensive tools to guide their policy: “One reads with dismay of Presidents
Hoover and then Roosevelt designing policies to combat the Great Depression of the 1930’s on the basis of such sketchy
data as stock price indices, and incomplete indices of industrial production. The fact was that comprehensive measures of
national income and output did not exist at the time”. The Depression, and with it the growing role of government in the
economy, emphasised the need for such measures and lead to the development of a set of comprehensive national income
accounts (Froyen, 2005).
29
Chapter III. GENERAL FRAMEWORK FOR INTEGRATED ECONOMIC STATISTICS
A. Introduction
3.1 The general framework for integrated economic statistics as set out in these Guidelines is based on
the fundamentals of the statistical infrastructure of a national statistical system and applies the best practices
of modern business architecture. This general framework is applicable to statistical systems at different
stages of statistical development and with centralized or decentralized models of operation.
3.2 The general framework for integrated economic statistics is determined by its scope of integration
for selected statistical domains and by the three building blocks of the statistical infrastructure for economic
statistics: (a) the System of National Accounts as conceptual organizing framework for economic statistics,
(b) the institutional arrangements and management culture as enabling environment for integration and (c)
the statistical production process as an integrated production chain from the collection of basic data to
dissemination of statistics. The scope and these three building blocks along with their components are
introduced in the subsequent sections of this chapter.
B. Scope of integration
3.3 For the purpose of the present Guidelines, the scope and the statistical domains targeted for
integration need to be outlined and selected in order to address user demand for an integrated statistics and to
treat the selected domains of economic statistics as interrelated statistics in a consistent and coherent
statistical information system.
3.4 Integration of economic statistics is about statistical reconciliation of the various primary and
secondary statistics such as those related to production, income, consumption, employment and prices with
the macroeconomic accounts such as national accounts. While countries will take the ultimate decision which
ones among the various domains of statistics they wish to consider as primary targets for integration, it is
desirable that this selection should be done on a broad basis of economic and related statistics. The targeted
domains might include the economic source data used in the national accounts, for example income,
consumption, business, sectoral, prices, and employment statistics and, extending to domain areas such as
statistics of the environment (for further details, see Annex 1).
3.5 These Guidelines present the scope of the statistical domains of integrated economic statistics based
on the Classification of International Statistical Activities1. This classification includes a listing of statistical
1 Conference of European Statisticians document ECE/CES/BUR/2009/OCT/19. Available from http://www.unece.org/fileadmin/DAM/stats/documents/ece/ces/bur/2009/mtg1/19.e.pdf
30
domains that provides a structured presentation of a broad type of statistical activities and subject areas. It
classifies statistical activities to collect, process and disseminate data, develop standards and cover strategic
and management issues in official statistics.
3.6 The Classification of International Statistical Activities organizes the broad types of statistical
activities in five statistical domains. Domains 1-3 constitute subject-matter areas dealing with the outputs of
the statistical process and their conceptual basis, comprising demographic and social statistics (domain 1),
economic statistics (domain 2) and environment and multi-domain statistics (domain 3). Domains 4 and 5
cover substantive issues that are more process and organization-oriented and also deal with the strategic,
institutional, governance and managerial aspects of official statistics.
3.7 Regarding the scope of integration, selected from the full list of the subject areas of statistical
activities of the Classification of International Statistical Activities, these Guidelines primarily cover the
following statistical domains:
Domain 1. Demographic and social statistics
1.2 Labour
1.5 Income and consumption
Domain 2. Economic statistics
2.1 Macroeconomic statistics
2.2 Economic accounts
2.3 Business statistics
2.4 Sectoral statistics
2.4.1 Agriculture, forestry, fisheries
2.4.2 Energy
2.4.3 Mining, manufacturing, construction
2.4.4 Transport
2.4.5 Tourism
2.4.6 Banking, insurance, financial statistics
2.5 Government finance, fiscal and public sector statistics
2.6 International trade and balance of payments
31
2.7 Prices
2.8 Labour costs
2.9 Science, technology and innovation
Domain 3. Environment and multi-domain statistics
3.1 Environment
Domain 4. Methodology of data collection, processing, dissemination and analysis
Domain 5. Strategic and managerial issues of official statistics
3.8 Domain 4 covers activities that focus on the various processes that lead to statistical outputs. It
covers cross-functional methodology and activities that are used for producing official statistics by domains
1-3. The activities under this domain include the components of the integrated statistical production process
such as common concepts and metadata, classifications, business registers and frames, surveys, use of
administrative sources, dissemination and communication.
3.9 Domain 5 covers areas that address institutional and management concerns, dealing with the
organizational side of national and international statistical agencies. It includes governance and coordination
of the statistical system, including relationship with users, organization of the statistical office, promotion of
official statistics, setting up national statistical programmes, dealing with capacity-building, human resources
management and training, and the management of ICT for statistical offices.
3.10 The list of selected statistical domains considered as primary targets for integrated economic
statistics is presented in Annex 1 based on the document Classification of International Statistical Activities.
Case study 3.1 “Integrating agriculture into the national statistical system” underlines the selection of
agriculture among the domains of economic statistics to be considered among the primary targets for
integration. Case study 3.2 “Integration of of monetary financial statistics in the euro area financial accounts”
provides a regional example of the integrated production process.
C. Building blocks of integration
3.11 The integrated approach to economic statistics is supported by three main building blocks consisting
of the System of National Accounts as the conceptual framework, supporting institutional arrangements and
an integrated statistical production process. These building blocks are interlinked and mutually reinforcing
structures for setting up integrated statistical systems.
3.12 The implementation of integrated economic statistics relies on the application of statistical
integration frameworks and techniques for the compilation of consistent and coherent basic, sectoral and
32
macroeconomic statistics. Central to the integration of economic statistics is the System of National
Accounts which is a conceptual framework ensuring consistency of concepts, definitions and classifications
across the various datasets.
3.13 Institutional arrangements encompass the components of: (a) legislative, operational, strategic
planning and process management framework, (b) coordination and governance among data producers, users
and providers, and (c) human and financial resources. Each component contributes to a system-wide
integration for the statistical system.
3.14 The integration of economic statistics covers all aspects of an integrated statistical production
process based on the fundamentals of business architecture and an up-to-date information technology
environment for national statistical systems. The statistical production process includes the use of
recommended methods for data collection, processing and dissemination through the components of: (a)
standards and methods to adopt common concepts, definitions, classifications and meta data and common
methods of data processing and editing and common data quality; (b) business registers and frames; (c) data
sources including surveys and use of administrative data; d) integration of statistics and accounts and (e)
dissemination and communication including data exchange.
1. System of National Accounts as conceptual organizing framework
3.15 The starting point for integrated economic statistics is the use of the internationally accepted
standard for macroeconomic accounts, the System of National Accounts (preferably its latest edition being
the 2008 SNA) as the conceptual organizing framework. The important role of the System of National
Accounts is ensuring that economic statistics are conceptually consistent with economic theory. First, it
serves as a conceptual framework for assuring the consistency of the concepts, definitions and classifications
used in different, but related, fields of statistics. Second, it serves as an accounting framework for ensuring
the numerical consistency of data drawn from different sources, such as business and household surveys,
merchandise trade, tax and other administrative data. The SNA’s double-entry framework is a powerful tool
for integration, identifying gaps and inconsistencies, harmonising concepts, and setting priorities for
integration.
3.16 As the result of years of work in harmonizing macroeconomic statistical standards, the use of the
2008 SNA as the conceptual framework provides consistency and coherence with other internationally
accepted standards and international recommendations like the Balance of Payments Manual, Sixth Edition
(BPM6) and other specialised manuals ranging from international classifications, the measurement of
industry statistics (e.g. industry, distributive trade, and construction statistics) and prices to the measurement
of foreign direct investment. This mutual consistency and coherence between the internationally accepted
33
standards and international recommendations are the outcome of the harmonization efforts by the
international statistical community. Building upon international standards manuals renders policy-relevant
and integrated micro-and macro- data that are consistent and coherent within countries, over time, and across
countries.
3.17 Using the 2008 SNA as the organizing statistical framework allows for statistical reconciliation
through the confrontation of source data in the accounting identities. This statistical reconciliation covers
basic statistics from: primary and secondary sources, short term and structural statistics, national and
international statistics. Using national accounts concepts and methods produces a coherent and consistent
description of the economic activity at different levels of aggregation. In national accounts, the task of
statistical reconciliation is fundamental to ensuring that the macroeconomic data set is comprehensive,
consistent and coherent. Moreover, reconciling primary and secondary data sources will allow the short term
and structural component data of the national accounts to provide complementary economic information
based on accurate, consistent and timely statistics. National accounts statistics compilation is possible
because of the availability of a wide variety of data on economic activities collected from economic surveys,
administrative sources and private sector data.
3.18 The national accounts framework is based on the fundamentals of economic theory and used to
support macroeconomic and sectoral policies including those related to employment, inflation, international
trade, money and finance. Among the various theoretical models employed by the users, the national
accounts support the understanding and forecasting of the determinants of growth and productivity of the
economy by providing a consistent and coherent data set for output, prices, inputs of material and services,
energy use and labour and capital as factors of production. Similarly, national accounts and the properties of
their component data support the monitoring and forecasting of turning points of the level and the change and
the growth of the aggregate economic activity in the business cycle. Users request information on economic,
financial and monetary phenomena presented in a coherent way during the business cycle first by the release
of a coherent set of short-term statistics and subsequently by the release of quarterly and annual national
accounts.
3.19 The national accounts framework not only allows for producing consistent and coherent short term
and annual statistics for macroeconomic aggregates including quarterly and annual national accounts for the
real sector. As an integration framework of economic statistics, it also provides a presentation of
macroeconomic aggregates relating the financial, government, non-financial, and household sectors of the
economy, and their relationship with the external sector. National accounts offer a comprehensive framework
for policy analysis by providing consistent information that enables policy makers to examine the impact of
changes on all aspects of the economy in a multiple entry set of accounts. Integrated statistics enable
34
observation of key variables and their responses to changes in policy and to changes in the structure of the
economy. For example, national accounts can help assess a given policy change on growth by examining its
impact on the determinants of growth (labour, capital, energy, and materials, and in an extended natural
resources), its impacts on specific goods and services producing industries, its impact on consumption and
accumulation, its effects across regions of the country and effects on size classes of enterprises and
ownership.
3.20 Integrated economic statistics based on national accounts framework are also useful in financial
stability analysis. This allows the identification of risks and vulnerabilities in the various sectors of the
economy (for example, the impact of the non-financial, household and financial sector balance sheets on
borrowing and lending and sectors’ capacity to produce and spend) and in the linkages (in financial
exposures) between economic sectors of the economy. These macroeconomic and sectoral data allow for
key macroeconomic indicators to be derived on corporate borrowing, profitability, household wealth and
savings, leverage ratios and estimates of debt service burden.
3.21 The integrated presentation is of key importance for ensuring that the policy decisions are taken by
bringing the whole economy into view. This presentation observes the key macroeconomic aggregates from
the real and financial economy by the integration of component data on portfolio behavior in funding and
financing of the real economy.
3.22 In the integrated statistical production process macro accountants establish partnerships with other
key producers of economic, demographic and social, and environmental statistics and accounts and introduce
common concepts and definitions, and develop arrangements for data exchanges between the statistical
offices and other government agencies for producing statistics. Data reconciliation and integration support
the harmonization of economic and related statistics, facilitates the aggregation and comparison among
disparate data sets, and promotes the compilation of coherent macroeconomic statistics such as national
accounts, balance of payments statistics and environmental-economic accounts.
2. Institutional arrangements
3.23 The institutional setting has an important role to play in the building blocks of the integrated
statistical production process. The functions and responsibilities of the lead statistical agency in the country
can be carried out more efficiently if it is supported in this role by institutional arrangements such as
advisory committees, relationship meetings, memorandums of understanding, service level agreements
technical cooperation, and a legal framework that protects the confidentiality and integrity of the data while
allowing for the sharing of data between partner statistical agencies.
35
3.24. Institutional arrangements are essential for the management of integrated economic statistics. In
every statistical system, some statistics are produced outside the national statistical organization, by
government departments and other administrative agencies. Those statistics have to be integrated with the
statistics produced by the national statistical organization. Moreover, as the use of administrative data
increases, arrangements are necessary to ensure that data from sources such as administrative data are
collected in a way that is consistent with the need of the statisticians.
3.25 Arrangements are also necessary to assure those providing administrative data that their data will be
kept confidential and used only for statistical purposes. Respondents to statistical surveys must be assured
that their data will only be used for statistical purposes and will not be shared for tax, investigatory,
regulatory, and other administrative purposes.
3.26 With such protections, multi-sectoral statistical coordination and strategic planning help to establish
in the national statistical system formalised institutional arrangements to delegate responsibility from
collection to data exchange, to compilation and dissemination for an efficient statistical programme.
3.27 Integration should be consciously introduced in the management culture of the statistical system, and
consistently implemented from the start of the statistical production process. An organizational culture needs
to adapt integration in all phases of the statistical production process. This requires a vision and strategic
planning on the part of the management for setting up a flexible and adaptable integrated statistical system.
3.28 It is useful to have a multi-year strategic plan for the implementation of the integrated statistical
production process to ensure the success and stability of the long-term programme. The funding aspect is
also critical for the managers of the integration project. To build constituencies and managing advocacy
activities to generate support has to be on their agenda.
3.29 High-level management support is crucial for adopting integration as an objective for the statistical
system as a whole. It demonstrates the level of commitment and will increase the willingness of management
teams at all levels for cooperation and implementation of the changes in accordance with the initiatives
related to the integrated economic statistics programme.
3.30 Senior managers need to mobilize agency-wide support for the new and high-priority task of
integration and ensuring contributions of the stakeholders. As part of building a strong system of
management culture of values, norms and shared beliefs, senior management should manage labour relations,
human resources, issues of recruitment of professionals, provision of training to all classes of staff,
development of training material and a range of related issues.
36
3.31 The development of information technology resources requires long-term management support and
commitment for change. It includes developing an ICT infrastructure and ICT strategies for the statistical
system that becomes part of the integrated statistical production process.
3.32 The institutional, organizational and legal conditions of the various countries can be different. These
various conditions may be reflected in different legislative frameworks and codes of practice. Due to their
different institutional arrangements countries with centralised and decentralised statistical systems may face
different challenges and, therefore, may develop different approaches and modalities for statistical
integration. The legislative framework, coordination and governance and other components of the
institutional arrangements are described in full detail in Chapter IV of these Guidelines.
a. Centralized statistical systems
3.33 A national statistical system is referred to as centralised if the management and operations of the
statistical programmes are predominantly the responsibility of a single autonomous government agency. The
advantage of a centralised national statistical service, from the point of view of statistical outputs, is that it
usually is better equipped than a decentralised system to plan and to implement the integration of economic
statistics. Centralisation makes it easier to adopt and implement uniform standards, definitions,
classifications, and set up and maintain the production process framework. Countries with centralised
systems have a greater ability to apply consistent designs to all statistical inputs because they have greater
control over statistical designs. In view of the growing awareness that policies and programmes of various
government departments are interdependent, both macroeconomic analysis and many kinds of socio-
demographic analysis require a system of statistics in which concepts and classifications are not only
precisely defined and standardized, but harmonized, with relationships established between many of the
definitions. As a further advantage, statistical outputs obtained through integration have substantive
importance for economic analysis.
3.34 A centralized statistical system, however, offers no automatic guarantee for successful integration. A
centralized service may have a disadvantage when the appropriate organizational set-up, strong and able
leadership and other institutional arrangements are missing for the implementation of integrated economic
statistics and can become “stove-piped.” As a result, countries with centralised statistical systems may not
have perfectly coherent data and they will need to use the same analytical and reconciliation tools during the
compilation phase to maximise the coherence of their statistics.
b. Decentralized statistical systems
3.35 A national statistical system is referred to as decentralized if the statistical programmes are managed
and operated under the authority of several government departments. Under this arrangement, a particular
37
agency is usually charged with the responsibility of coordinating the statistical activities of the various
departments. One of the advantages that countries with decentralised systems can benefit from integrated
economic statistics is that the various organisations responsible at the domains involved where the data are
collected have specialised expertise that can facilitate and increase the efficiency of integration. Countries
with a decentralised system may focus more in achieving coherence in the compilation stage because they
have greater control over those processes.
3.36 The outputs of a decentralized statistical system with a strong coordinating agency can be more
efficient than that of a centralized system’s institution. In a strongly led decentralized system, there would be
awareness of the need for maintaining contacts designed to influence, coordinate and harmonise the outputs
of the various autonomous departments and to exercise leadership to counteract the departments to go their
own way. The institution with decentralised system may have stronger, better arranged institutional contacts
in place with its data suppliers than an institution in a centralised statistical system which may rely on its
established network of institutional arrangements.
3.37 Countries with a decentralised system may need to put more effort into the compilation stage to
achieve coherence. Coordination among the decentralised institutions is needed to overcome inconsistencies
in terminology, definitions and classifications. They also need to detect and to eliminate a lack of coherence
between concepts. Countries with decentralised statistical systems also need to work with their data suppliers
to improve consistency between input series, even if it means they have less ability to control the design
process; they must manage what they can control and try to influence what they cannot control.
c. Centralization versus decentralization of statistical systems
3.38 Centralization and decentralization are the subjects of discussion in the statistical community. Some
of the characteristics of the two systems are relevant in the context of statistical integration. Integration can
be successfully achieved in countries with centralised or with decentralised systems. Certain conditions may
help the implementation of integration in some countries with different institutional arrangements. For
example, strong powers of coordination support the integration of statistics. If the office in charge of
coordination is backed by the legal power to apply the tools of integration, its capacity to coordinate is
correspondingly greater than that of an office lacking such powers.
3.39 Whether the statistical systems are centralised or decentralised, policy analysts and decision makers,
particularly in the more specialised activities, must feel they can involve statisticians directly in their quest
for more relevant and reliable quantitative information. Physical proximity to policy analysts in decentralized
systems can be important to statisticians in determining policy needs. Moreover, examples exist of
centralised systems that are quite responsive to policy and other user’s requirements.
38
3. Statistical production process
a. Standards and methods
Common concepts, definitions and classifications
3.40 It is crucial for integration to apply uniform concepts, definitions and classifications based on
internationally accepted standards and classifications, for which the System of National Accounts functions
as umbrella framework. The use of harmonised terminology, concepts, definitions, and classifications is
necessary in a national statistical system so that the various data collections are comparable and can be
related to each other. In all phases of the integrated statistical production process, common concepts are
recommended. To ensure the use of consistent terminology and definitions, statistical agencies should
establish a terminology management strategy to reduce in the different areas in the organisation the use of
inconsistent terminology applied in questionnaires and in dissemination. For this purpose, the appropriate
tools, including thesaurus, glossary of concepts should be developed and adopted across the organisation.
The glossaries, as a minimum, should contain a concept label, definition, detailed source information and
related terms.
3.41 Inconsistent terminology is a major source of such inaccuracies when databases and publications
may contain different definitions for the same concept which cause misunderstandings and
misinterpretations. Recognising the negative impact of having ambiguous and unclear terminology, the
national statistical organisations and international agencies have developed common concepts, definitions
and classifications based on statistical standards and have compiled glossaries, to promote the collection and
dissemination of consistent and comparable statistics.
3.42 Integrated statistics obtained through the use of harmonised classification devices are more powerful
than statistics collected without harmonisation. Harmonisation has been achieved, for example, through the
implementation of standards such as the International Standard Industrial Classification of All Economic
Activities (ISIC) (United Nations (2008a). It should be noted that integration is a broader concept than
harmonisation as it goes beyond harmonising concepts, definitions, classifications or standards. The
harmonisation of standards is only one dimension of integration.
Data processing and editing
3.43 Data editing is an integral part of the statistical production process and needs to be addressed in all
phases of the statistical production process, including at the collection phase. Methodological, organisational
and legal issues related to data editing, linkage and integration have to be resolved. Documentation of the
editing process and transparency are indispensable to ensure that the resulting data will be widely accepted
and understood by users. Data editing is a resource intensive process, but it has a far-reaching impact on data
39
quality as it affects data accuracy, interpretability, relevance and coherence. The statistical service can learn
in the editing process about the data, that the survey processes can be improved in a systematic way.
3.44 The temporal dimension of integration aims at reconciling and harmonizing short-term and structural
economic statistics produced at different points in time, but referring to the same phase in the business cycle.
The coherence of sub-annual and annual statistics has key importance for planners and policymakers and
other users of data. Integrated economic statistics comply with the criteria of accuracy and consistency of
data quality and provide coherent short-term statistics with the release of annual data.
3.45 The integration of economic statistics supports producing economic data with required periodicity
and timeliness. An integrated economic statistics framework facilitates conceptual and numerical consistency
of sub-annual and annual data, consistency in summing quarterly data to annual data and a transparent
revision policy. The user needs for timeliness of data can be evaluated by the statistical agency when
balancing the trade-off between timeliness with accuracy and consistency.
3.46 Data processing covers the elements of data processing systems, data management and warehousing.
Generic tasks are those to be considered for automated processing such as those related to editing, validation,
imputation and estimation. These tasks should be appropriately documented in the metadata and should be
made available for internal and external users of the data to facilitate their interpretation. Moreover, this
qualitative information generated through the data processing phase will assist in identifying flaws and areas
of improvement at each stage of the statistical production process including at the level of integration of the
component data in national accounts.
Metadata
3.47 Metadata in statistics are data that describe statistical data. Statistical metadata describe processes
that collect, process and produce statistical data and indicate the data sources and tools that are instrumental
in statistical production like statistical standards and classifications, business registers and frames, statistical
methods, procedures and software. Due to the range of internal and external users, the metadata should
include elements of management of quality related to the institutional environment, system, statistical
production process and statistical outputs. The use of standard terminology for metadata across the various
statistical domains will facilitate the international comparison of data.
Data quality framework
3.48 Statistical agencies monitor and improve data quality through the application of quality frameworks,
which includes the management of statistical production process by observing the methodological soundness,
the cost effectiveness and the response burden. Other elements of quality management pertain to the
40
institutional system in coordinating the data producers, provides and users and using statistical standard as
the SNA as umbrella conceptual framework and to the institutional environment by evaluating aspects of
professional conduct, impartiality, objectivity and transparency. When it comes to managing statistical
output, the quality framework looks at the management of relevance, accuracy and reliability, accessibility,
coherence and comparability and metadata. National quality frameworks are to allow for the assessment
across the institutional and statistical spectra of the national statistical system.
b. Business registers and frames
3.49 A comprehensive and up-to-date business register has a central role in achieving integration of
economic statistics in terms of providing a central sampling frame for all business surveys. The
establishment of such a register is essential for the full co-ordination of source data that use the same basic
information about business units. Countries with a high proportion of small and micro enterprises
complement the business register with non-overlapping area frames based on agricultural, economic and
population censuses. The central frame, consisting of a business register and, where applicable, in
combination with area frames, represents the backbone of the collection processes of source data that
interface with businesses through direct profiling, surveys, feedbacks and use of administrative records. The
central frame contains data about the firms, name, address, and a code identifying activity, variables about
size and information about the life cycle of the firm. For operational reasons, a unique identifier should be
assigned to each entity in the central register. Ideally, this identifier should be selected taking into
consideration the business number used by the administrative authorities to ensure that administrative data
are correctly applied to the various entities on the register in its creation and maintenance.
3.50 The creation of a unified, comprehensive statistical register is the medium-term objective. Common
universe for sampling and consistent classification of businesses promote consistency on collected data
across surveys. As a result of a single business register, accuracy, consistency, and timeliness in producing
statistics can be improved and respondent burden reduced.
3.51 For decentralized systems with multiple business registers, the objective may be the reconciliation of
key differences in classification and the identification of gaps and overlaps across the various registers.
Through such reconciliation, decentralized systems may be able to achieve many of the benefits of a single
business register. In addition, since some business registers are based on comprehensive, but relatively dated
census data, while other based on more timely, but less comprehensive business register and tax data,
reconciliation can improve the accuracy of both registers.
41
c. Surveys and administrative data sources
Surveys
3.52 In designing integrated data collections, it has become an important objective to achieve consistency
with statistics of the different industries and sectors. Standardisation of surveys and questions across the
questionnaires of different industries contributes to consistency and facilitates the integrated statistical
production process. Integration should be comprehensive and encompass survey design, sample frame, and
questionnaire design. Survey design may need to compensate for a lack of willingness among data providers
of business statistics programmes. Respondents are increasingly reluctant to complete many separate survey
requests sent to them each year through traditional survey questionnaires. A coordinated modular approach
through annual continuous data collection instruments with infra-annual collection rounds instead of separate
specific purpose surveys can reduce response burden and cost.
3.53 Consultation with business respondents before survey and questionnaire design and updates is
essential. The choice of the survey data collection method (mail, telephone, electronic, interview, etc.) would
depend on the country’s resources, preferences and characteristics. The use of a modular approach with an
annual continuous survey instrument may be preferable to facilitate flexibility for updates and
harmonization.
Administrative data sources
3.54 Increased reliance on administrative data requires tools for adapting administrative data for statistical
purposes. For integrating administrative source data for statistical purposes; concepts need to be matched
with statistical standards. Some of the issues that need to be addressed in integrating the data from
administrative sources for compilation of economic statistics include: (i) units used in those sources do not
correspond directly to the definition of the required statistical units, (ii) data in administrative sources have
generally been collected for a specific administrative purpose (for example, turnover for value added tax
(VAT) purposes may not include turnover related to the sales of VAT exempt goods and services), (iii)
classification systems used within administrative sources may be different and (iv) timeliness (different time
schedule than that of the NSO advance release calendar). The advantage of using administrative records and
various government data is to promote a more efficient use of data collections, and reduce the burden of the
respondents in addition to reducing the cost of data collection.
3.55 Administrative data sources can be used for the production of statistical data, for verifying already
compiled data, as well as for filling gaps of missing data in statistical surveys. The use of administrative data
for statistical purposes does not necessarily imply that these should replace traditional statistical techniques,
but rather that it should be used to supplement and reinforce them.
42
3.56 Agreements need to be reached about effective and efficient data collections, including the use of
administrative records and various government data files to avoid duplication of data collections and an
undue burdening of respondents. Legislation on data sharing arrangements and access can be set up between
the statistical office, other government departments or public bodies. If administrative data sources are used,
the confidentiality and integrity of the data sources must be ensured with the utmost care and adequate
methodology needs to be guaranteed.
d. Dissemination and communication
3.57 Dissemination enhances accessibility of statistical information and constitutes an indispensable
building block of the integrated statistical production process. Dissemination, communication and outreach
activities constitute complex areas of the statistical production process that involve building, managing and
promoting customer relationships with a broad circle of data users and the media. Integration may facilitate
providing user-friendly presentations of data, explanations of concepts, ensure consistent format across
publications, electronic sources and websites. Dissemination and communication of statistics aims at
explaining data to users, to improve statistical literacy and make metadata widely available. The
development of data warehouses efficiently supports the integration of economic statistics.
3.58 To assure the timeliness and integrity of economic statistics, best practices, such as those contained
in the IMF’s General Data Dissemination System and Special Data Dissimination Standard (1996 and 1997)
specify the public dissemination schedule of release of data in the form of a release calendar. This release
calendar provides prior notice of the release dates on which the statistical agency will release its key
economic indicators to the public.
3.59 In the dissemination of statistics, good practices require giving credit to the original source of
statistics and following widely accepted quotation/citation policies when the data used had been originally
collected by others. Citations facilitate assessment of the reliability and verify the authenticity of the original
data sources for the users. The source of data always need to be documented and made transparent for the
users.
3.60 The dissemination and communication efforts of the statistical organisation benefit from collecting
and analysing feedback from the customers. Prior to establishing the revisions policy of data series for
statistical domains, it is important to consult the main users of official statistics to identify their needs and
priorities.
3.61 The main components of the statistical production process related to standards and methods, business
registers and frames, surveys and administrative sources and dissemination and communication are described
43

in more detail in chapter V.
44
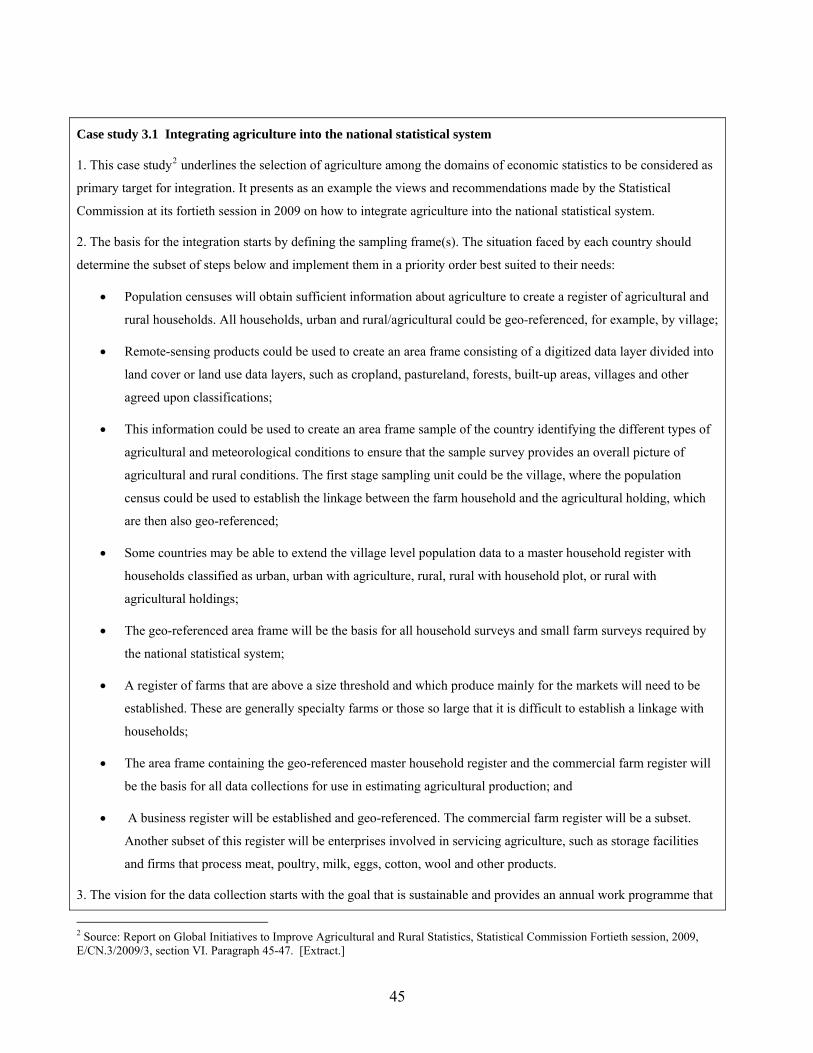
Case study 3.1 Integrating agriculture into the national statistical system
1. This case study2 underlines the selection of agriculture among the domains of economic statistics to be considered as
primary target for integration. It presents as an example the views and recommendations made by the Statistical
Commission at its fortieth session in 2009 on how to integrate agriculture into the national statistical system.
2. The basis for the integration starts by defining the sampling frame(s). The situation faced by each country should
determine the subset of steps below and implement them in a priority order best suited to their needs:
• Population censuses will obtain sufficient information about agriculture to create a register of agricultural and
rural households. All households, urban and rural/agricultural could be geo-referenced, for example, by village;
• Remote-sensing products could be used to create an area frame consisting of a digitized data layer divided into
land cover or land use data layers, such as cropland, pastureland, forests, built-up areas, villages and other
agreed upon classifications;
• This information could be used to create an area frame sample of the country identifying the different types of
agricultural and meteorological conditions to ensure that the sample survey provides an overall picture of
agricultural and rural conditions. The first stage sampling unit could be the village, where the population
census could be used to establish the linkage between the farm household and the agricultural holding, which
are then also geo-referenced;
• Some countries may be able to extend the village level population data to a master household register with
households classified as urban, urban with agriculture, rural, rural with household plot, or rural with
agricultural holdings;
• The geo-referenced area frame will be the basis for all household surveys and small farm surveys required by
the national statistical system;
• A register of farms that are above a size threshold and which produce mainly for the markets will need to be
established. These are generally specialty farms or those so large that it is difficult to establish a linkage with
households;
• The area frame containing the geo-referenced master household register and the commercial farm register will
be the basis for all data collections for use in estimating agricultural production; and
• A business register will be established and geo-referenced. The commercial farm register will be a subset.
Another subset of this register will be enterprises involved in servicing agriculture, such as storage facilities
and firms that process meat, poultry, milk, eggs, cotton, wool and other products.
3. The vision for the data collection starts with the goal that is sustainable and provides an annual work programme that
2 Source: Report on Global Initiatives to Improve Agricultural and Rural Statistics, Statistical Commission Fortieth session, 2009, E/CN.3/2009/3, section VI. Paragraph 45-47. [Extract.]
45
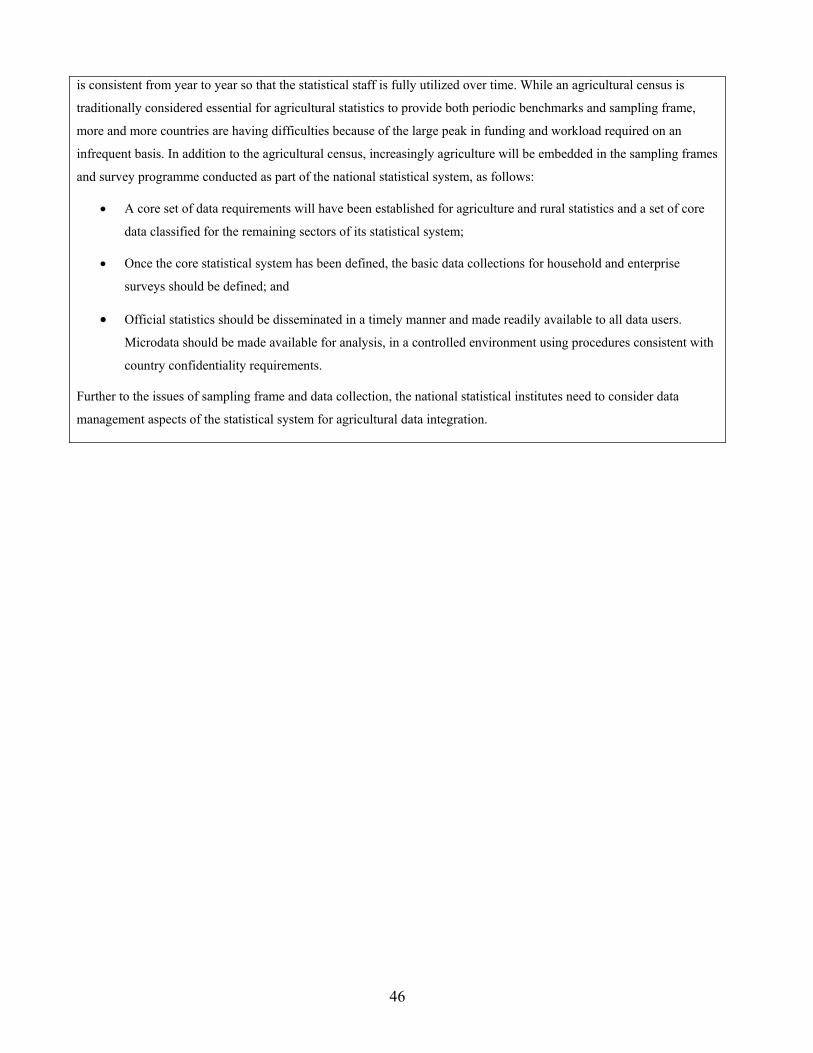
is consistent from year to year so that the statistical staff is fully utilized over time. While an agricultural census is
traditionally considered essential for agricultural statistics to provide both periodic benchmarks and sampling frame,
more and more countries are having difficulties because of the large peak in funding and workload required on an
infrequent basis. In addition to the agricultural census, increasingly agriculture will be embedded in the sampling frames
and survey programme conducted as part of the national statistical system, as follows:
• A core set of data requirements will have been established for agriculture and rural statistics and a set of core
data classified for the remaining sectors of its statistical system;
• Once the core statistical system has been defined, the basic data collections for household and enterprise
surveys should be defined; and
• Official statistics should be disseminated in a timely manner and made readily available to all data users.
Microdata should be made available for analysis, in a controlled environment using procedures consistent with
country confidentiality requirements.
Further to the issues of sampling frame and data collection, the national statistical institutes need to consider data
management aspects of the statistical system for agricultural data integration.
46
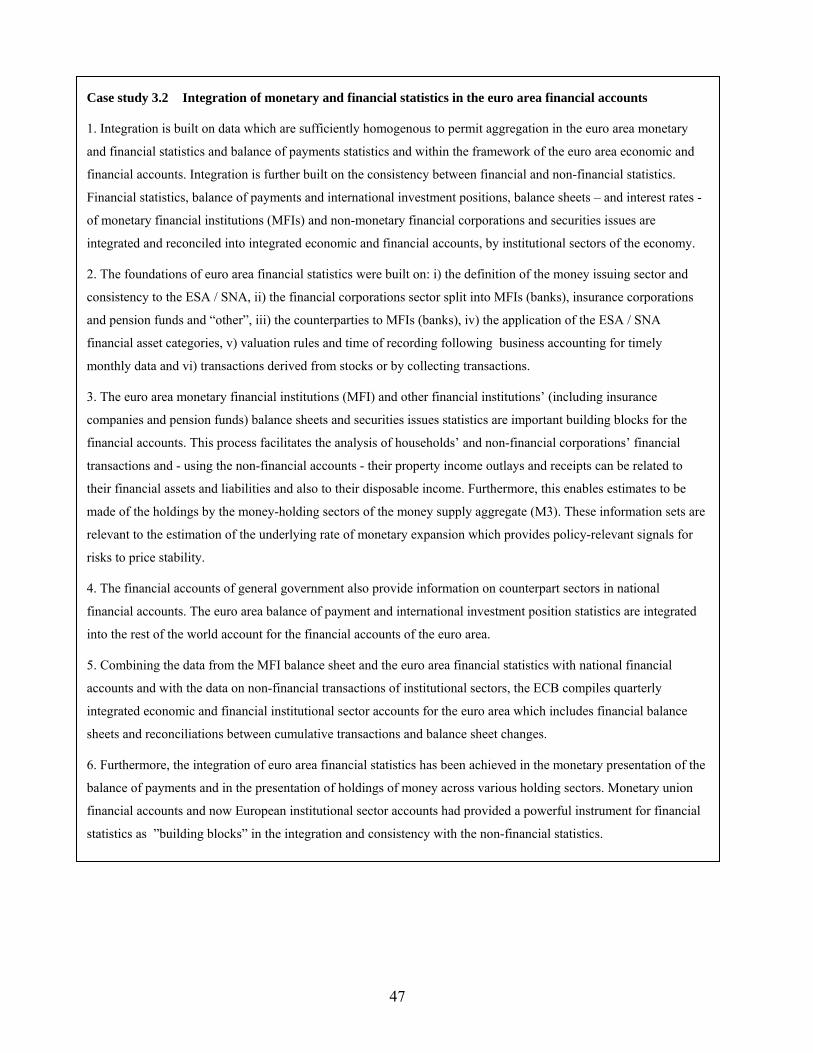
6. Furthermore, the integration of euro area financial statistics has been achieved in the monetary presentation of the
balance of payments and in the presentation of holdings of money across various holding sectors. Monetary union
financial accounts and now European institutional sector accounts had provided a powerful instrument for financial
statistics as ”building blocks” in the integration and consistency with the non-financial statistics.
Case study 3.2 Integration of monetary and financial statistics in the euro area financial accounts
1. Integration is built on data which are sufficiently homogenous to permit aggregation in the euro area monetary
and financial statistics and balance of payments statistics and within the framework of the euro area economic and
financial accounts. Integration is further built on the consistency between financial and non-financial statistics.
Financial statistics, balance of payments and international investment positions, balance sheets – and interest rates -
of monetary financial institutions (MFIs) and non-monetary financial corporations and securities issues are
integrated and reconciled into integrated economic and financial accounts, by institutional sectors of the economy.
2. The foundations of euro area financial statistics were built on: i) the definition of the money issuing sector and
consistency to the ESA / SNA, ii) the financial corporations sector split into MFIs (banks), insurance corporations
and pension funds and “other”, iii) the counterparties to MFIs (banks), iv) the application of the ESA / SNA
financial asset categories, v) valuation rules and time of recording following business accounting for timely
monthly data and vi) transactions derived from stocks or by collecting transactions.
3. The euro area monetary financial institutions (MFI) and other financial institutions’ (including insurance
companies and pension funds) balance sheets and securities issues statistics are important building blocks for the
financial accounts. This process facilitates the analysis of households’ and non-financial corporations’ financial
transactions and - using the non-financial accounts - their property income outlays and receipts can be related to
their financial assets and liabilities and also to their disposable income. Furthermore, this enables estimates to be
made of the holdings by the money-holding sectors of the money supply aggregate (M3). These information sets are
relevant to the estimation of the underlying rate of monetary expansion which provides policy-relevant signals for
risks to price stability.
4. The financial accounts of general government also provide information on counterpart sectors in national
financial accounts. The euro area balance of payment and international investment position statistics are integrated
into the rest of the world account for the financial accounts of the euro area.
5. Combining the data from the MFI balance sheet and the euro area financial statistics with national financial
accounts and with the data on non-financial transactions of institutional sectors, the ECB compiles quarterly
integrated economic and financial institutional sector accounts for the euro area which includes financial balance
sheets and reconciliations between cumulative transactions and balance sheet changes.
47

Chapter IV. INSTITUTIONAL ARRANGEMENTS FOR MANAGING INTEGRATED ECONOMIC STATISTICS
A. Introduction
4.1 Appropriate institutional arrangements are essential for developing and managing an integrated
system of economic statistics. The integration of economic statistics depends upon the legal, organizational
and planning framework, the coordination and governance arrangements, and human and financial resources
all of which differ widely across countries. There is no “right” institutional setting for integrating economic
statistics, in the sense that the goal can be achieved in both centralized and decentralized statistical systems.
A range of institutional approaches and arrangements need to be put in place to support the integration of
economic statistics. The approach taken for integration of economic statistics will depend on the way the
official statistics system is organized and take into account the existing legal framework.
4.2 To change over from the statistics production being organized in stove-pipes, or independent
production lines to an integrated system of statistical organization, changes are required to be implemented in
the national statistical systems that are not only technical, but also organizational.
4.3 The “bottom up approach” to integration is easier to apply in a centralized system. A national
statistical office with legally-mandated responsibility for the quality of official economic statistics will be in
a strong position to influence the design and implementation of the integration of statistics to a great degree.
Responsibility for leading statistical development and for coordination of government agencies will provide
many opportunities to strengthen the integration of the official statistics system.
4.4 The main reasons why institutional arrangements are important in the context of integrated economic
statistics are the following:
• In every statistical system, some important statistics are produced outside the national statistical
agencies by other government departments and quasi-government organizations. These data are used
by the agency or agencies responsible for the production of official statistics. For example, the
national accounts will use data from numerous sources. Improving the coherence of input statistics
can contribute significantly to the quality of the national accounts;
• Many government agencies collect statistical information to help carry out their administrative
functions. This administrative data can be an important input into the production of national
economic statistics. For example, international trade data will often be collected by the agency
responsible for collecting customs duties. As the use of administrative data increases, the national
statistical agency will become more dependent on data from sources outside its direct control.
Arrangements to ensure that administrative data are collected in a way that is consistent with the
48
needs of statisticians and its timely availability will be important. Even in a centralised statistical
system, the national statistics office will have to work with other government agencies to ensure that
administrative data can be integrated with data from other collections;
• The national statistics office may have responsibility for coordination and dissemination of economic
statistics, but much of the funding for statistical production may be contestable by other government
departments. The national statistical agency will have to work with other agencies that produce
statistics to ensure the coherence of all economic statistics by encouraging consistent frameworks,
standards, definitions and classifications. In countries with decentralized statistical systems,
responsibility and funding for the production of economic statistics may be spread between various
government agencies. The agency responsible for producing national accounts and a user of the
economic statistics produced by other collection agencies may be a strong advocate for integration;
• In some countries, especially those with federal structure, the collection and production of statistics
occurs at regional, district and municipal levels. Economic statistics are compiled at the national
level by aggregating up statistics produced by district and regional offices. Staff responsible for
statistical operations at various levels of government have to be trained how the data is used at the
various levels of aggregations.
B. Legislative, operational, strategic planning and process management framework
1. Legislative framework
4.5 Statistical leadership may be more effective if the mandate for integration is established by law or
other binding instrument, and its role acknowledged in day-to-day business by other producers and users of
statistics. A statistics act that applies to all the statistics collected and produced by government departments
and agencies is a valuable tool for the integration of economic statistics. The stronger the powers of
coordination at the center of the system, the greater the chance of integrating effectively statistics. If the
office in charge of coordination is backed by the legal power to apply the tools of coordination, its capacity
to coordinate is correspondingly greater than that of an office lacking these assets.
4.6 A statistics act may provide a national statistical office with authority to:
• provide leadership to the national statistical system;
• advise other government agencies on statistical projects initiated by them;
• develop approved statistical standards for government agencies;
• define, lay down, and promote standard concepts, procedures, definitions, and classifications for
collection, compilation and dissemination of official statistics;
49
• provide authority for the compulsory collection of data;
• ensure confidentiality and integrity of information provided by respondents, while providing for the
sharing of data between official statistical agencies; and
• approve the design of all statistical surveys operated by government agencies.
4.7 The legislative framework can strengthen the external capability of the statistical agencies and their
relationship with the suppliers of data. The statistical service should acknowledge and pay attention to the
legal aspects of the institutional arrangements of integration and specify how it will be achieved. Among the
tasks the need may arise to develop legal provisions, or if they exist, amend them concerning the collection
of administrative data that are planned to be used for the integration of economic statistics.
2. Codes of practice
4.8 Codes of practice as operational framework can play an important role in supporting the drive
towards the integration of economic statistics. The advantage of a code of practice or common standards is
having a clear set of rulings and high-level endorsement and mechanisms, to assess and ensure
implementation. If a new general code of practice is adopted for the statistical office as a whole,
development and implementation of such a code should be the responsibility of the chief statistician or
independent statistical council, but should be based on the authority that of the Prime Minister or President,
Cabinet, or legislature.
4.9 The achievement of common standards across agencies and functional units requires a clear
statement or code of practice as what is to be covered by the integrative process and the means by which this
is to be achieved. Such a code may be part of a system of codes for other dimensions of a statistical office’s
work, including quality, confidentiality, response burden, meeting user needs, or the integrative code may
stand alone. If a code of practice exists for these other operating dimensions, then the inclusion of a further
one regarding the integration of economic statistics can be readily incorporated into this system. If such
principles and protocols do not exist, the statistical office may wish to consider whether it adopts integrative
principles and an associated protocol in a piece-meal way, or whether its needs would be better served by a
major policy initiative of adopting several principles and protocols that include integration.
4.10 The limitation of a code of practice is that it may not have a mechanism for evaluating the costs and
benefits of integration. For example, the adoption of common geographical codes and industry
classifications might not be the highest priority for the NSO. As a set of principles and means of
implementation, the code sets the agenda for integration. For the national experience of the United Kingdom,
please see Case study 4.1.
50
4.11 Over the last few years, many NSOs have developed principles and protocols for official statistics,
often as part of a Code of practice. These are designed to provide assurance that official statistics are
adequate for the uses that they were designed to meet and to facilitate improvements in the overall coherence
of official statistics. The document may encompass fundamental principles to include: relevance, integrity,
quality, accessibility, protecting confidentiality, meeting needs of users, reducing load on providers,
enhancement through integration, accumulation and innovation, efficiency in costs, fairness in dissemination,
but should also include the mechanisms for attaining such aims.
4.12 Principles and protocols are useful tools for fostering the integration of economic statistics by
promoting national coordination. Official statistics are broad in scope and are produced by many different
government agencies in a country. In many countries, there is a central or national statistical office that
produces the greater share of official statistics, whereas in other countries there is more than one statistical
agency handling different areas of statistics. In all cases, many official statistics are produced by government
departments. Coordination of statistical activities should be undertaken to avoid duplication of work, to
minimize the reporting burden of respondents, to facilitate the integration of data from different sources
through the use of statistical standards and to participate in international initiatives.
4.13 The rationale for the coherence principle is that frameworks and classifications used in statistics
must be relevant for their use in economic research and decision-making. Data can be interpreted when it is
grouped or classified within a structured and understandable picture of the real world. A key aspect of the
coherence principle is that the value of statistical data is maximised by using common standards for statistics
across the vast pool of data available from administrative and survey databases and allows separate datasets
to be related, and more comprehensive statistics to be produced.
4.14 The adoption of a coherence principle covering integration for all statistical agencies in a
decentralised system, and all functional departments in a centralised one, is an important step for a statistical
office, more so if the principle goes hand in hand with a set of guidelines and policies, or protocols, for their
implementation. A protocol sets out the procedures that should be followed in order to achieve statistical
integration.
4.15 Protocols for integration of statistics should cover common frameworks, standards and
classifications and specify that common statistical frames, definitions and classifications are used in all
statistical surveys and data sources to provide consistency over time and between datasets. These protocols
should align wherever possible with national and international frameworks and classifications. Principles and
protocols should be developed for a range of dimensions.
51
3. Strategic planning
4.16 A strategic approach to planning that involves multi-level planning activities is an important tool for
advancing the integration of economic statistics to better support policy and other decsions. The long-term
objectives should be decided first. Once these are clear, plans that move towards these goals can be put in
place. Activities for the integration of economic statistics need to be approached on three different time
horizons. First, at the strategic level where the objectives that the statistical agency wants to achieve are
specified. The importance of statistical integration should be established as a key policy for all planning
decisions. Secondly, at the tactical level at which the design of an output for the next production cycle is
decided. The objective is to ensure that each statistical design contributes to the coherence of related
statistics. Thirdly, at the operational level at which daily production activities emerge and decisions should
take into account their impact on the quality and overall consistency of statistics to support integration.
4.17 Strategic planning is the process by which an organization defines its strategy, or direction, and
makes decisions that allocate resources to pursue this strategy. To determine its strategic direction towards
integration, the NSO needs to know exactly where it stands, then determine where it wants to go (scope,
focus, etc), and how it will get there. The strategic plan of an NSO will identify and prioritise user needs and
describes processes and mechanisms by which these needs will be progressively met given limited resources.
To ensure that integration of economic statistics has a high priority, it should be an integral part of this
strategic plan.
4.18 Most national statistics offices will already have a strategic plan in place. If a framework exists for
strategic planning, then the objective will be to evaluate how integrative practices can be incorporated into it.
A statistical office embarking on the incorporation of the integration of economic statistics into their overall
strategic framework needs to first consider the suitability of their existing strategic plan.
4.19 The strategic planning system should be evaluated to determine if it is meeting existing needs and to
identify any modifications that would better facilitate the integration of economic statistics. United Nations
(2003) provides guidance on reviewing the suitability of a statistical office’s existing strategic framework.
Strategic frameworks take time to evolve to meet the planning needs of individual statistical offices and,
indeed, such needs themselves change. Strategic planning systems benefit from stability, so any evaluation
exercise should not just incorporate statistical integration as one of the objectives, but also include
mechanisms for achieving this objective. To pre-empt the need for further changes down the road, the
opportunity should be taken to review the other objectives and decide if they are still appropriate and whether
mechanisms for achieving them are effective.
52
4.20 The strategic plan for integration of statistics does not have to be fleshed out in great detail, but it
must spell out the objectives of integration and how they can be achieved. The contents of the plan should
address the following issues:
• coherence of economic statistics across the entire national statistical system;
• establishment and maintenance of the statistical infrastructure to support integration of economic
statistics;
• specification of steps necessary to achieve integration;
• allocation of responsibilities to relevant agencies; and
• provision of legal authority, financial and other resources; and the the allocation of those resources
across agencies.
4.21 The strategic plan provides a road map to guide the organization into the future. It summarizes the
organization’s role and purpose, operating environment and challenges, and long-term direction. The
strategic plan is a key input into the decision-making processes and will guide longer-term workforce
planning, and annual business planning and budgeting.
4.22 A step-wise approach may commence with senior management requesting middle and line managers
to identify potential projects for integration with a brief listing of costs and benefits. A relatively small
number of projects that can be undertaken within a fixed time-frame should serve the statistical office well as
a platform of examples that will build support for funding of new projects promoting integration. As agencies
or functional departments put up plans for projects promoting integration, given limited resources and
competing projects, there is a need for a mechanism for appraising these projects not only against
themselves, but against projects whose core aim is not the integration of economic statistics. For a statistical
office to be effective it needs to be able to ascertain user requirements and ensure that they are met in as
effective a manner possible given available resources.
4.23 The strategic planning system should be changed so that the integration dimension becomes part of
the project appraisal. The implications for integration should always be part of the assessment criteria and,
other things being equal, methods that meet the needs of an integrated system are preferred to those that do
not. This more holistic view of project appraisal seeks to identify changes in the statistical system not just in
terms of meeting specific needs, but also in terms of their implications and merits for the system as a whole.
A broad range of projects can support integration of statistics. Projects intended to meet specific user or
producer need may contribute to the integration of processes, methods, or outputs, even if they are not
explicitly formulated just in terms of integrating economic statistics. Projects that are proposed specifically
53
to enable compliance with international standards will contribute to integration, if the standards themselves
have been devised with the needs of integration in mind. For example, compliance with the SNA serves the
needs of integration as it leads to an integrated, consistent set of macroeconomic statistics.
4.24 Statistical information produced in an integrated process should meet quality standards, consistency,
coherence and other technical requirements. They must also be produced in a resource-efficient manner and
have internal and external evaluation mechanisms to ensure adaptability and uniformity of the products of the
statistical process.
4.25 Annual operational plans should be nested within longer term, such as five-year frameworks. These
plans should include objectives, steps to be taken, requirements, and fall back options. The longer term plans
should be open, flexible and participative. The responsibility for their operation should be devolved, subject
to review and formal evaluation. There is a need for increasing awareness of introducing strategic planning
as an important dimension of institutional arrangement of integration of economic statistics.
4.26 During the implementation of a strategic plan, there is often the need to make adjustments to cater
for circumstances not visualized during the planning stage. These changes should be made when necessary,
if circumstances have changed significantly and deviation from the original plan is essential. A monitoring
and control mechanism has to be invoked to ensure that actions are taken in accordance with the plan.
Change management is a particularly important subject for ensuring success when strategic plans are put to
implementation. In the following, six components of change management during the implementation of the
strategic plan is provided based on Cummings & Worley (2005, p. 491 – 492).
• Formulate a clear strategic vision: in order to make a cultural change effective a clear vision of the
organization’s new strategy, shared values and behaviours is needed. This vision provides the
intention and direction for the culture change;
• Display top-management commitment: culture change must be managed from the top of the
organization. Senior management must demonstrate support for change;
• Model culture change at the highest level: in order to show that the management team is in favour of
the change, the change has to be notable at first at this level. Senior management should model the
kinds of values and behaviours that they want to see in the rest of the organization;
• Modify the organization to support organizational change;
• Select and help to adapt newcomers to fit with the new culture; and
• Develop ethical and legal sensitivity: Changes in culture can lead to tensions between organizational
and individual interests, which can result in ethical and legal problems for practitioners.
54
4. Process management
4.27 The production of a statistical output can be viewed as a series of business processes, beginning with
the objective of the data collection, moving on to data source and sample selection and other steps in
collecting and processing the data and ending with dissemination of outputs. One way to manage the
integration of economics statistics is by treating the statistical production process as a sequence of statistical
processes using the tools of process management. In the context of economic statistics, the sequence of
processes might cover all activities from survey design to dissemination. For example, a production
sequence might begin with the identification of administrative data source or design of a quarterly business
survey and continue right through to the outputs of the survey being included in quarterly GDP estimates,
which are subsequently reconciled with the annual national accounts.
4.28 A variety of the methodologies and tools are available for statistical agencies attempting to improve
the way they manage statistical production processes. The common feature of all these methodologies is an
emphasis on managing processes effectively to achieve a desired objective. In contrast with the traditional
hierarchical management approaches, process management focuses on optimizing each process in the
production sequence to ensure that the quality of the final product meets the requirements of users.
4.29 The following aspects of process management are important in the context of the integration of
economic statistics:
• Designing the processes in the production sequence to achieve the required standard of quality is
more effective than mass inspection and repair of final statistical product. Investment in the design
of processes usually brings the greatest return in quality.
• Breaking the production of a complex product into a number of clearly defined processes, allows a
quality standard to be designed for each process. If this is done correctly, the quality of the final
statistical product can be controlled by ensuring that every process complies with the relevant
standard.
• Designing statistical processes to ensure that they work together to contribute to the quality of the
final product. A single process should not be optimized in isolation, without considering the impact
on the various uses of the final output. For example, a business survey will be designed to meet the
users of business statistics, but the design should also take into account the way that business
statistics feed into the compilation of the national accounts.
• Clearly designating the process owner. For the process to be controllable, the accountability for each
statistical process must be clearly understood.
55

• Precisely defining user requirements, with care being taken not to create unrealistic expectations.
4.30 The implementation of process management involves a number of steps to produce the final
statistical output and must be clearly documented. At the most basic level, a process is an activity in which
resources and controls are applied to inputs to produce a specified output. This is illustrated by the diagram
4.1.
Diagram 4.1: Components of a statistical production process
Inputs
Process
Output
Controls
Resources
4.31 Statistical production process is often sequential with the output of one process becoming the input
into the next after being modified or refined. In practice, the sequence of statistical processes will be more
complicated than just a linear transfer from one process to the next, as the output of one process may feed
into several statistical processes and main input of a statistical process may be used as auxiliary information
somewhere during subsequent stages in the production cycle. These interdependencies form a network of
statistical production. The terminology used in the description of each process should be standardized across
all statistical outputs. All the users of the output from each process should be identified and their quality
requirements clearly specified. Every instance where a statistical output is used in the compilation of another
statistic would be identified. All processes should be designed systematically to ensure that the output of the
process is of sufficient quality to support the requirements of other processes further down the production
sequence.
4.32 When the sequence of statistical processes requires data to be handed from one unit to another, an
appropriate handover mechanism should be developed. If data flows from one agency to another, a Service
Level Agreement might be used to define the standard that must be achieved before hand over is completed.
For example, an agreement might specify that administrative data is in a form that is appropriate for
compilation into a statistical output. A standard methodology might be adopted for a particular type of
process, with all outputs being required to use the standard unless there are good reasons for deviating from
56
it. For example, a standard sample selection method might be adopted for industry surveys to increase the
coherence between various industry statistics. Standard IT tools might be developed and used in all
production sequences that pass data through a particular process. For example, a generic edit and imputation
tool might be used for all administrative and survey datasets. This standardisation of systems is easier to
achieve if a standard set of methodologies has been agreed for that particular process, e.g. limiting non-
response to three different methods. The management of statistical processes should be reviewed regularly
and updated, in particular when external circumstances change or shifts in the availability of data affect user
requirements. Process descriptions and the various delivery agreements should be revised frequently to keep
them up-to-date and relevant.
4.33 Statistics Netherlands has developed a process management technique called Chain Management and
applied it to the production of all official statistics. The concept of a “steady state” is used to describe the
end of a data processing phase in which value is added to the data, for example by editing the data, querying
outliers, comparing with data from other sources, or balancing. The business architecture distinguishes ten
different steady states, each with specific quality requirements indicating the data are suitable for re-use in
other statistical processes. Each steady state consists of a dataset (including metadata) in a state of
processing of well-described quality. Defining steady states and specifying the processing stage between
each two steady states is a transparent way for providing an overview of the complete statistical chain. This
Statistics Netherlands' approach is described further in Case study 4.2.
4.34 Process management can be used as a tool for gradual improvement to the sequence of production
processes. Some statistical agencies will start on a small scale and introduce process management for core
statistical processes. Quick gains can often made by identifying the weakest of the processes and
strengthening them. At a later stage, additional processes can be integrated in a network of statistical process
management. For further details, see Case study 4.3 of Statistics New Zealand.
C. Coordination and governance arrangements
4.35 Statistical coordination and governance arrangements are essential for the development of an
integrated national statistical system. The coordination role of the statistical service and the relationship with
data providers will be particularly important in a decentralized statistical system. Institutional arrangements
should foster structured communication and coordination between all statistics producers and suppliers of
data at the national level.
4.36 The integration of economic statistics in a decentralised statistical system will be more effective if
one agency has responsibility for leading the national statistical system. The lead agency in the statistical
system will need to evaluate the processes for coordinating activities. If there is a strong tradition of
informal mechanisms or a separate formal structure for coordinating activity that works sufficiently well,
57
then the integrative responsibility can be built into these mechanisms. However, if existing mechanisms are
deemed to be inadequate, new mechanisms for statistical coordination may need to be developed. This lead
agency or coordinating body would work with other departments and organisations to map out a long-term
strategic plan and program of work that will achieve the desired objectives. Responsibility for specific tasks
and activities could then be negotiated with the different agencies that have a role the statistical system.
Once responsibilities have been delegated, the timetable for key deliverables can be negotiated and agreed by
all participants in the program.
4.37 The coordinating agency should monitor progress on the integration program, and where
participating agencies are unable to meet the agreed timetables due to other pressures of work, adjustments to
the program might be required. In a highly decentralised statistical system, responsibilities for various
economic statistics may be spread among several government agencies, with no single agency having
responsibility for leadership of the statistics system. In this situation, a lead might need to be taken by the
agency responsible for the compilation of the national accounts, as it will have the greatest interest in
achieving integration. In other situations, the agency responsible for budgetary allocations may have a role
in leading coordination activities.
4.38 In some countries, the central bank is responsible for the production of some economic statistics, the
national accounts, balance of payments or price indices. In such cases, the central bank will have an
important role in supporting the integration of statistical collections and informal arrangements have to be
established to ensure the necessary consistency in economic statistics for effective cooperation between the
central bank, as a producer of statistics, and other statistical authorities. The specific arrangements should
aim to optimize the quality, cost-effectiveness and availability of official statistics.
4.39 Governance arrangements for official statistics are necessary conditions to develop trust and
confidence in the statistical system and can effectively support the integration of the statistical production
process. Through governance arrangements statistical offices obtain appropriate guidance on a range of
matters from advisory boards and councils. Governance related issues in place support the statistics
framework to deal with the independence and impartiality of economic statistics. Governance arrangements
include important elements to protect the autonomy of the statistical offices. As the coverage of governance
arrangements is the whole national statistical system, it can provide cohesion across the statistical system
nationwide, facilitating participation in the integration process. An example of governance arrangements in
the United Kingdom is provided in Case study 4.4.
4.40 Statistical offices implementing an integrated production process of economic statistics need to move
away from an organizational structure where each statistical output is managed from beginning to end within
a separate division, with its own sampling frame, classifications, survey design and collection system. This
58
structure can be a serious obstacle to integrated and coherent information and makes consistent sampling
frames, population boundaries, classifications difficult to achieve. Resolving this difficulty requires
redesigning the entire statistical programme into an integrated system using common classifications and
methodologies, harmonized surveys and questionnaires and instituting an organizational structure that serves
this purpose.
4.41 One practical approach is a reorganization of the statistical agency towards a more functional
structure. A separate division with responsibility for developing and maintaining classifications and
standards can lead a programme to apply consistent definitions and classifications to all statistical outputs.
Creating a division with responsibility for developing a business register to be used for the production of all
economic statistics is an effective way to ensure that units are selected and classified consistently across all
statistical outputs. Establishing an independent statistical methods division can help to ensure that all
surveys are designed in a coherent way.
4.42 Countries can rely on a variety of mechanisms for coordination described below. What is important
in this context is to develop a workable system of coordination that incorporates all mechanisms and
dimensions that support the national plan for integration.
1. Advisory committees
4.43 A strong system of advisory committees is important for the integration of economic statistics.
These groups will support sound decision-making by ensuring that the interests of all stakeholders are taken
into account in the development of official statistics system. Users of statistics represented on advisory
committees are more likely to be strong advocates for integration of economics statistics. Advisory
committees should represent a broad range of economic and statistical interests, including users, producers,
and suppliers of official statistics. Members should be selected for their knowledge of economic and
statistical issues, their interest in the development of economic statistics as a coherent system and their
standing in the statistical/economic community. Advisory committees can contribute to the integration of
economic statistics by:
• advocating the integration of economics statistics;
• advising on relevance and quality of economic statistics to ensure that they meet the needs of users;
• countering sectional interest groups advocating statistical outputs that are inconsistent with other
economic statistics;
• supporting the implementation of international statistical frameworks;
59
• encouraging other producers of economic statistics to implement standard frameworks and
classifications;
• improving the coherence and integration of economic statistics;
• identifying shortcomings in concepts, definitions, sources and methods used in official economic
statistics; and
• promoting coordination of survey activities to achieve efficient and effective data collection.
4.44 Advisory committees on statistical standards can play an important role in the development,
promotion and implementation of statistical standards. Users and producers of statistics can ensure that their
needs have been addressed by participating in the process for developing national statistical standards. For
example, if consultation makes the redeveloped classifications more relevant to the producers of statistics,
they are more likely to be adopted widely. The role of an advisory committee on statistical standards can
include:
• promoting the use of common standards for official statistics;
• advising on the development of standards, protocols and policies for development and production;
• ensuring that all producers of statistics participate in the development and review of classifications
and standards;
• Encouraging, vetting, endorsing the development, implementation, promulgation of statistical
frameworks and standards;
• ensuring that standards and classifications used are sound, well-documented and accessible;
• ensuring that code files and dictionaries are made available to assist producers of statistics in the use
of standard classifications;
• advising on training about the use of standard frameworks and classifications;
• guiding the monitoring of official statistics and reporting on the implementation of standards,
policies and protocols; and
• identifying shortcomings in the application of the concepts, definitions, and methods of adopted
international standards.
4.45 Committees on statistical standards support the coherence of economic statistics by promoting the
use of national and international statistical frameworks. They can encourage the development, promotion
and implementation of standard concepts, definitions, classifications and terminology.
60
2. Relationship management
4.46 The institutional arrangements that support the integration of economic statistics work at two levels.
At the lower level are the working groups and practical relationships where statistical work is done and
practical problems are resolved. This must be supported by higher-level contacts to build a widespread
commitment to integrating the statistics system and dealing with strategic problems. Both types of contact
are essential for the integration of economic statistics.
4.47 Regular relationship meetings with government departments and organizations that use and produce
statistics should have a number of objectives, including:
• coordination between the producers and users of statistics;
• monitoring of progress on bilateral projects;
• coordination of the planning of joint work between organizations;
• discussion of new ideas and resolution of problems; and
• resolution of data issues relevant to participating organizations.
4.48 The integration of economic statistics relies on information about user needs. One formal
mechanism for identifying such needs is a system of user committees. The membership of user committees
should be drawn from major users, including the central bank and other government departments, private
sector, education, media, emerging interest groups, and those with specialized knowledge. There should also
be facilities on the statistical office’s website for feedback from users and surveys of users of the websites as
to deficiencies in information available. There should be regular relationship meetings with major users, such
as central banks, other producers of statistics and data providers, such as the tax and customs authorities,
whose administrative data are used by the statistical office.
4.49 National statistical agencies are making increasing use of administrative data. Relationships with
data supplier organizations are very important, because disruptions in supply can seriously impact the quality
of economic statistics. An important benefit of memorandums of understanding and service level agreements
is that they can consolidate and make cooperation with data supplier organizations more predictable.
4.50 Relationship managers can support the integration of economic statistics by fostering interaction
between government departments and agencies that use and produce statistics. Having a person in each
agency with an awareness of the importance of official statistics will contribute to the increasing coherence
of statistics.
61
4.51 The role of the relationship manager includes:
• regular meeting with relevant staff in other agencies;
• identifying issues that need to be resolved; and
• ensuring that the appropriate staff are involved in finding a solution.
3. Memorandums of Understanding
4.52 Increasing use of administrative data supplied by other government departments increases the
importance of the relationships between supplier organizations and producers of statistics, to ensure timely
and consistent supply of data. In decentralised statistical systems, the statistical aggregates that feed into the
national accounts may be supplied by several government agencies. The greatest risk in the short term is that
data might not be delivered on time to meet the timetable for production of regular statistical outputs. In the
longer term, the greater risks are around the quality of the data being supplied. The ideal is that definitions
and classifications be consistent with those used in other economic statistics. Agreeing to a Memorandum of
Understanding (MOU) with each supplying organization is an excellent tool for managing these risks.
4.53 A Memorandum of Understanding is a legal document that outlines the terms and details of an
agreement between agencies, including each party's requirements and responsibilities. An important benefit
of these Memoranda of Understanding is early warning of changes to administrative procedures or statistical
processes that could affect the quality of data used for the production of statistics. These agreements make
cooperation with supplier organizations more predictable by consolidating all information about all decisions
and processes in one document. In particular, they can deal with the following issues:
• Conditions for the supply of administrative data;
• Timetable for the supply of data;
• Confidentiality, integrity, and security of data;
• Consultation about new uses of administrative data;
• Resolution of disputes;
• Consultation before making changes that will affect the variables supplied;
• Understanding statistical needs before making changes; and
• Consultation before changing administrative forms.
62
4. Service level agreements
4.54 The compilation of statistics often requires exchanges of data been different units or departments
within a government agency. A service level agreement covering the conditions for exchange of data
between the administrative unit and the business statistics units or the national accounts unit can be
extremely important for ensuring a smooth data exchange.
4.55 A service level agreement is a contractual agreement between a supplier and a customer specifying
the timing and quality of the service that will be provided. They are usually negotiated by operational staff
with an understanding of the production process and the way the data will be used. If the supplier and the
customer business units belong to different agencies, a service level agreement may need to be backed by a
more general Memorandum of Understanding developed by the corporate staff in the cooperating agencies.
Service level agreements describe the responsibilities of the supplier and customer, by defining precisely the
nature of the product to be delivered, the relevant quality standards, and the frequency, format and timing of
delivery. A process for dealing with data problems should be specified. The agreement may include various
fallback options that will apply if the supplier is unable to comply with quality or timeliness due to factors
beyond its control.
4.56 Each service level agreement should be reviewed periodically to ensure that quality standards and
timetables are appropriate. Most will include a formal change management procedure to ensure that both
parties agree with any proposed changes before they are implemented. Special consideration should be given
to suppliers of administrative data, such as the tax authorities and central banks. More formal agreements or
enabling legislation may be needed to formalise data delivery to the statistical office.
5. Cross-agency teams
4.57 In a decentralised statistical system, communication between the staff of the different agencies
responsible for producing statistics is important for integration of statistics. If they do not understand how
their statistics are used by other agencies, they will tend to pursue the needs of their own agency at the
expense of the requirements of other agencies. Any activities that can get staff out of their stovepipes will
facilitate the overall coherence of the statistical system. Cross-agency teams are a useful tool for building
understanding of the way that the entire statistical system coheres together. By participating in a cross
agency project team, agency staff will develop a better understanding of how staff in other agencies produce
or use their statistics. Forming a cross-agency team to develop a new classification may be a good way to
begin this type of cooperation.
4.58 The success of a cross agency team will depend on a number of factors. Leadership “buy in” is
essential. The senior management of each of the participating agencies must be strongly committed to the
63

project. The scope and objectives of the project must be clearly defined and agreed at the beginning of the
process. The resources needed to complete the project must be clearly specified. The participating agencies
will need to reach agreement on the source of funding and which agencies will be providing the necessary
resources. An experienced project leader should be appointed. The project leader will need a clearly defined
role and authority, because they often have to deal with a number of competing constituencies. Regular
meetings of the project team will be essential for good communication and resolution of issues. A steering
group with representation from all the participating agencies should exercise oversight over the projects.
This group should act quickly to remove any bottlenecks that may hold it up. A clearly defined set of
deliverables should be agreed at the beginning of the project.
4.59 Data needs will need to be prioritised and the importance of the project should be communicated to
other staff in the participating agencies that may need to contribute data or expertise from time to time.
Groups of relevant experts who understand data linkages and quality may need to be called together on an ad
hoc basis to sort out differences in source data and classifications. Statistical agencies should ensure that
contributions to cross-cutting projects are recognised in awards, performance assessments and salary
reviews. A key benefit of successful joint projects is that they demonstrate the possibility of integration
projects.
D. Human and financial resources
1. Human resources
4.60 Integration of economic statistics will change the roles and responsibilities of many of the people
involved in the production of economic statistics. Adaptation to the integrated statistical process can be
systematically fostered and supported by a variety of activities related to human resources.
4.61 The development of an understanding of the importance of statistical integration should be built into
all relevant training activities. Staff responsible for compiling national accounts will need a sound
understanding of issues regarding classifications, population coverage, and business registers that affect their
ability to integrate statistics from different sources. Staff responsible for the operation of statistical surveys
will need an understanding of how their data are used in the compilation of national accounts. Training
courses should provide an understanding of how data issues affect the use of statistical outputs in the SNA.
For example, staff responsible for producing retail trade statistics should know how their statistics feed into
estimates of household consumption expenditure. They should be able to give advice about changes to their
time series that would affect the use of retail trade information for this purpose
4.62 One way to foster the understanding of the way that results of statistical surveys are used in the
compilation of national accounts is to encourage staff rotations between relevant divisions and departments.
64
In a centralised system, rotations of staff between survey divisions and the national accounts division will
foster an understanding of the way that decisions about these design and production of statistics can
influence their use for SNA purposes. If staff in these divisions understands each other’s roles, they will be
better placed to take actions that will enhance the integration of their statistics. In a decentralised statistical
system staff rotations between different agencies will provide support for the integration of statistics. For
example, staff from the agency responsible for the production of the national accounts might be seconded to
an agency responsible for conducting economic surveys to work on the development and implementation of a
new industrial classification or redeveloping a business survey.
4.63 Another way to foster integration of statistics is to specify a contribution to integration of statistics
into the performance criteria or standards for relevant staff. Rewarding staff for their contribution to
activities that improve the integration of statistics will help foster these activities. Staff with responsibility for
coordinating activities between various agencies or divisions should have clearly defined roles and
responsibilities. Senior management can recognise the importance of integration by acknowledging
achievements in the direction through existing reward and recognition schemes. Such actions reinforce the
message that integration activities are important for the organization.
2. Financial resources
4.64 The funding arrangement for an integration programme will vary depending on the institutional
arrangements in each country. The agency responsible for leading the programme for integration of statistics
should work with other agencies to assist them to obtain sufficient funding. This could range from the
national statistics office making funding available to be another government agency by fiscal transfer, or
supporting the other agency to go through the existing budgeting channels to obtain the funding needed. In
some situations, funding may be available from international agencies.
4.65 The aim is to develop an agreed work programme, with funding established for each aspect of the
programme. Long-term funding streams are important. Ensuring that funding is available would strengthen
the commitment of participants in the programme for integration of economic statistics.
65
3. The UK Statistics Authority, which was established on commencement of the Statistics and Registration Service
Act 2007, was given a statutory duty to prepare, adopt, publish, and assess compliance with a Code of Practice for
Statistics that sets out the professional standards which official statistics are expected to meet. The UK Statistics
Authority’s Code of Practice for Official Statistics (2009) built on, and superseded, the National Statistics (2002)
Code.
Case study 4.1 United Kingdom Code of Practice
1. The United Kingdom (UK) experience provides an example of the detail of a code for the principles and practice
of implementation, but also of the high-level institutional support. The UK National Statistics’ Code of Practice is
set out in two parts. National Statistics (2002) sets out key principles and standards. This is supported by a series of
protocols that provide practical frameworks for the implementation of the principles and standards of the Code
across all significant areas of activity relevant to National Statistics. The Code is consistent with the United Nations’
Fundamental Principles of Official Statistics (United Nations 1994) and the European Statistics Code of Practice
(Eurostat 2011) (with which all producers of European Statistics are expected to comply). The Code then moved to
one supported by an independent authority responsible for such principles and practices.
2. The principle on integration was derived from the compliance guidelines for Principle 7 of the National Statistics
(2008) code: “Enhancement through integration, accumulation and Innovation.” Integration was one of several
principles within a framework each of which had attached to it a protocol for implementation.
66
Stat base: Dataset with parameter values of aggregates of populations of statistical unit types;
Output base: Dataset with parameter values at the level of the output tables. Some values of aggregates may be
suppressed because of “disclosure control”.
2. The datasets within each Base are stored in a central data warehouse in order to make the data available for re-use
in other processes. Within the chain of economic statistics we have further refined the four basic types of steady
states as part of a large redesign programme on economic statistics (see Braaksma, 2007).
3. For each steady state the dataset and its quality are defined by means of quality indicators; the further towards the
end of the process, the more demanding these quality requirements are. The necessary quality requirements are
determined by the various users of a specific dataset. These steady states as well as the related metadata like quality
reports and the data source design are stored in the central data warehouse. The data source design declares the
variables that should be produced as well as some ex ante agreements on quality of the data with respect to for
instance turnover coverage, accuracy, level of detail and punctuality. Not all data sets are broadly re-used within
other processes. Some data sets are just transferred from a single supplier to a single user within one production line
(stove pipe) and stored locally. Even in those cases, ex ante quality requirements between supplier and user are laid
down in, so called, Service Level Agreements.
Case study 4.2 Statistics Netherlands - Chain Management
1. The starting point of chain management at Statistics Netherlands is the development of business architecture.
Central to this business architecture is the use of so called ”steady states”. A steady state is a dataset in a well-
defined state of processing (see Renssen and Van Delden, 2009). Steady states can be used to structure the outcomes
of the statistical process: they may be the starting point, the end point or half-products of the production process.
Statistics Netherlands distinguishes four basic types of steady states:
Input base: Data set at record level, which contains the unit types and variables as they are present in the
source data;
Micro base: Dataset at record level that use standardised statistical unit types and variables;
67
5. A new platform has been developed internally that will be used to store and edit all business surveys and administrative
unit record data. This means that consistent parameter driven automated edits can be applied to all records regardless of
their source. All statistical outputs are published using the same dissemination tools. In addition to reducing costs and
minimising risk, standardising processes across the organisation supports the integration of economics statistics.
Standardisation also simplifies the data integration and analysis that is necessary for meeting the increasingly complex
policy and research needs of government and the wider research community. Using standard processes, methods and
systems facilitates the rotation of staff by allowing them adapt more quickly to a new subject matter areas. Statistics New
Zealand has adopted a process-oriented approach to the production of statistics. A focus on standardisation of business
processes should gradually become part of our organisational culture.
Case study 4.3 Statistics New Zealand – Using Business Process Modelling to Enhance Integration
1. Statistics New Zealand began a serious move towards process-oriented approach to the production of statistics with the
gradual introduction of business process modeling methods. The key outcome is the adoption of a disciplined business
process approach to describe how the organisation functions and how changes to the organisation and new projects are
planned and managed. Critical business processes are abstracted from existing processing systems and their underlying
data structures and database systems. The seven top-level processes identify of activities where value can be added. A
long-term objective is to devote less resources to Design and Develop, Build and Collect phases by adopting standard tools
and methodologies. This will allow more resources to be applied to the Need, Analyse and Disseminate phases where value
can be added for users of the national statistical system.
2. The Business Process Model influences the way that Statistics NZ is organised. For example an Integrated Data
Collection division has been established with responsibility for all data collections for both economic and social surveys.
This ensures that consistent collection processes are applied to all surveys. The business processes that pose the greatest risk
to the organisation can be identified and decisions about investments to mitigate them are made from the corporate level.
3. Standard methodologies have been adopted for many of the core processes that are common to the production of most
statistics. The samples for all business surveys are selected off a comprehensive business register using an approved set of
sampling methods. This ensures that all business data is classified consistently. All administrative data records for
businesses are matched to the business register to obtain their classifications. This ensures that data from survey and
administrative sources are classified consistently. Editing and Imputation Standards and Guidelines have been adopted.
This standard ensures that editing and imputation processes are undertaken consistently for all economic statistics.
4. The appropriate statistical methods are applied consistently across each subject area, whether the data is collected
through a collection instrument or from an administrative data source. A Business Process Model facilitates the
identification of opportunities to standardise common processes for the benefit of the organisation. Standard, generic tools
have been acquired or developed for some of the critical processes. The aim is for all non-response imputation to be done
using CANCEIS or BANFF, tools produced by Statistics Canada. This ensures that a standard set of imputation methods is
used across all surveys and that decisions about which method to use are made consistently.
68
Case study 4.4 Roles of the Office for National Statistics and the United Kingdom Statistics Authority Office for National Statistics The Office for National Statistics (ONS) is the executive office of the UK Statistics Authority, and is therefore a separate but closely related body to the Authority. The Director General (DG) for ONS, supported by the Director General's Office, is responsible for the day to day management of the office, including all statistical production, corporate services and general management. The DG is line managed by the National Statistician and is a member of the Authority's Board. UK Statistics Authority The Authority was established on 1 April 2008 by the Statistics and Registration Service Act 2007 as a non-Ministerial department directly accountable to Parliament. On that date, ONS became the Statistics Authority's executive office. The UK Statistics Authority Board is the top level decision-making body of the organisation. It oversees ONS and undertakes the independent scrutiny of all official statistics produced by different bodies across the United Kingdom. The Authority Board is directly supported by staff in the Authority's Central Office. This consists of the Monitoring and Assessment team and the Authority Secretariat. The Monitoring and Assessment team monitor the production and publication of official statistics across the UK, by a process of independent assessment of official statistics against the Code of Practice for Official Statistics. The Head of Assessment is a member of the Authority Board and is directly accountable to its non-executive members. The Authority Secretariat supports the Board in its oversight and regulatory functions. The National Statistician is the Authority's Chief Executive and Accounting Officer (whose budget includes that of ONS). She is a member of the Board and accountable to it for the operation of ONS. She is the principal adviser on official statistics to the Authority and the Government. She is also:
• Permanent Secretary (head Civil Servant) for all staff in the Authority and ONS; and • Head of the Government Statistical Service (GSS).
The National Statistician therefore provides the link between ONS and the Authority Board, and with top layers of wider Government, including Ministers and Parliament. Her team in the National Statistician's Office also:
• supports the development of GSS policy and planning; • provides advice to producers of official statistics; • manages relations with international statistical organisations; and • provides recruitment and communications services for the Government Statistician Group (GSG).
The GSS is made up of all civil servants involved in producing official statistics across UK government departments, including ONS, and the devolved administrations of Scotland and Wales. The GSG - Government Statistician Group - is a professional community of statisticians within the GSS, who operate within a personnel framework administered by the National Statistician's Office.
69
E. International arrangements for the integration of economic statistics
4.66 International institutional frameworks emphasize comparability and consistency of datasets across
countries. Strong institutional coordination at the international level is essential to developing integrated
economic statistics. Integration of economic statistics encompasses a key set of activities that must be well
coordinated, supported and, if possible, fully formalized to achieve the desired goal. They include the
development of: (i) international statistical standards (methodologies) i.e., the concepts, definitions,
classifications and inter-related tables or accounts integrating a broad set of statistics; (ii) compilation
guidelines and implementation programs; (iii) integrated economic databases; (iv) universal quality
assurance frameworks to assess the quality of output produced and (v) technical assistance and capacity
building..
4.67 Some countries participate in a regional organization with a responsibility for coordinating the
production of the statistics of member countries. Implementing the standards and practices agreed by the
regional organization will play an important role in the integration of economic statistics within each country
and between countries.
4.68 Strong international coordination and the international statistical framework provide support for the
integration of economic statistics at the national level. The statistical work in international organizations
resembles the work in national statistical organizations. It consists of the same work phases, but an important
characteristic is that data collection most frequently has the national organizations as respondents. The data
collected are aggregate data on a national or regional level, as distinct from micro data on individual persons,
households or corporations. International organizations have a leading role in the development and
harmonization of statistical standards.
4.69 The development of international statistical standards or recommendations is the necessary first step
and requires wide international consultation to ensure universality in terms of relevance, applicability and
feasibility of implementation. Given the goal to realize international comparability for a broad set of
statistical domains, there is an expectation that national authorities will implement the standards in their
process of developing comparable and accessible data sets. Similarly, there is an expectation that
international stakeholders will endeavor to promulgate the standards through various supporting systems.
Examples of international arrangements for the integration of economic statistics are provided in the
following case studies, 4.5 to 4.9.
70
4. The governance structure of the ISWGNA includes a rotating annual chairmanship with a permanent secretariat
assigned to United Nations Statistics Division (UNSD). The mandate of ISWGNA, however, does not extend to
other equally important aspects of integrated economic statistics, in particular development of integrated economic
databases and supporting quality assurance frameworks.
1. The System of National Accounts (SNA) is the recognized international standard and is, therefore, the basis for
national and international reporting on national accounts for both developing and developed countries. It also
provides the overarching framework for the macro and sectoral standards in other domains of economic statistics
facilitating the integration of these statistical systems to achieve consistency with national accounts.
2. The planning, organisation and coordination of the SNA review and revision process is overseen by the
Intersecretariat Working Group on National Accounts (ISWGNA), which was created in 1983 through a mandate of
the United Nations Statistical Commission. The ISWGNA constitutes five member organizations (Eurostat, IMF,
OECD, United Nations and World Bank).
3. The five agencies coordinated the development of the conceptual framework of the 1993 SNA and its update, the
2008 SNA, through a programme of international cooperation and governance. Following the adoption of the 1993
SNA and the 2008 SNA, the ISWGNA was tasked with the monitoring and assisting countries to implement the
system through an international agreed implementation strategy. To facilitate its work, it was agreed to develop a
joint programme of work including training, drafting of supporting manual and compilation guidelines, undertaking
research, and extending technical cooperation.
Case study 4.5 The Intersecretariat Working Group on National Accounts
71
4. The TFFS is chaired by the Statistics Department of the IMF and meets annually to consider its work program. It
reports every four years to the UNSC, and annually to the IMF’s Committee on Balance of Payments Statistics. The
TFFS work on the JEDH is fully formalized through a Service Level Agreement signed by the four data contributing
agencies and coordinated by its Secretariat at the IMF.
Case study 4.6 The Task Force on Finance Statistics
1. The Task Force on Finance Statistics (TFFS) was created in 1992 under the auspices of the United Nations
Statistics Commission (UNSC) to take stock of the activities of the international organizations involved in collection
and dissemination of finance statistics and to make recommendations aimed at avoiding duplication. Its mandate
was broadened in 1998 and currently involves development of methodological standards for statistics on debt;
promotion of data availability on financial stocks including international reserves; encouragement of internationally
accepted statistical practices to enhance data quality; and fostering of inter-agency collaboration in statistical
capacity building. Its key outputs include the production of External Debt Statistics: Guide for Compilers and Users,
the External Debt Data Quality Assessment Framework and the Joint External Debt Hub (JEDH) initiative.
2. Specifically JEDH disseminates a broad range of creditor/market data series on the external debt and selected
foreign assets of developed, developing and transition countries and territories. The creditor/market data are
complemented in the JEDH by series from the World Bank’s Quarterly External Debt Database which disseminates
detailed external debt data that are published individually by countries that subscribe to the IMF’s Special Data
Dissemination Standard or participates in the General Data Dissemination System (GDDS).
3. The JEDH also features creditor/market- and national-based data comparisons of countries’ external debt, and
provides users with access to metadata. Data are updated by contributing agencies on a quarterly basis and each
agency is responsible for the quality of data series they provide. As a pilot project of the Statistical Data and
Metadata exchange (SDMX), JEDH applies technological innovation to the context and content of information
being exchanged with the aim of generating efficiencies through the convergence of data flows into a common
framework.
72
1. The International Comparison Programme (ICP) is a worldwide statistical operation involving some 160
countries. It produces internationally comparable price and volume measures for gross domestic product and its
expenditures components.
2. The ICP is organized by regions (six of them) all but one overseen by the ICP Global Office in the World Bank.
The remaining region is covered by the Eurostat-OECD Purchasing Power Parity program. Eurostat and the OECD
work closely with the Global Office to ensure that their 46 or 47 countries can be combined in a single comparison
with the 110 or so countries of other regions.
3. The responsibility for the ICP within regions is shared between national and regional agencies. National statistical
offices carry out data collection. Regional agencies provide guidance and coordinate data collection and data
validation. They also put together and finalize the regional comparison. Responsibility for ensuring that the regional
comparison can be integrated in a world comparison rests with the Global Office.
4. Results of regional comparisons are disseminated by regional agencies. Results of the world comparisons are
disseminated by the Global Office.
Case study 4.7 The International Comparison Programme
73
2. The development of harmonised standards was in close collaboration with price experts from the EU national
statistical offices. The process has been described as involving a high level of collaboration with much time spent
discussing technical and practical issues to obtain results by consensus, reinforced where necessary, by legal acts.
The approach taken was, after much discussion, to adopt legislation setting out the broad principles and scope for
the HICP. The first milestone in the development of HICPs, in October 1995, was the adoption of a Council
regulation, which set the legal framework for the harmonized methodology. This has been built on over the years
using a series of legally binding implementation regulations, each addressing one or more specific areas of
methodology. Given the importance accorded to the accuracy, reliability and comparability of the HICPs in the EU,
Eurostat operates a system of compliance monitoring to ensure that the legal framework is adhered to.
Case study 4.8 The Harmonized Index of Consumer Prices
1.At the time of the Maastricht Treaty on European Union, in 1992, each European Union (EU) Member State
compiled its own consumer price index (CPI) often using different methods largely with the objective of measuring
changes in the cost of living. Simple international comparisons of these national CPIs did not necessarily give
accurate inter-national comparisons of consumer price inflation. The Harmonized Index of Consumer Prices (HICP)
was developed by the EU as a response to the need for comparable CPIs to measure the convergence of inflation of
EU Member States as a criterion for entry to monetary union, and as the basis for assessing price stability. The ECB
has defined price stability as a year-on-year increase in the HICP for the euro area of below 2%. In the pursuit of
price stability, the ECB aims at maintaining inflation rates below, but close to, 2% over the medium term.
74
6. The ECB, Eurostat and EU NSOs and NCBs are working under an agreed medium-term development plan. This
includes, in particular the publication of a comprehensive set of accounts at T+90days, fit for monetary policy
purposes, who-to-whom detail for securities, the breakdown of other flows into revaluations and other volume
changes, s well as additional seasonally adjusted data.
4. The integrated quarterly euro area accounts were developed on the basis of the methodological framework
established in the European System of Accounts 2005 and of the conversion of national data into meaningful
European accounts. The compilation is a unique product as regards compilation, strategy and compilation. Eurostat
is mainly responsible for the non-financial part of the accounts and the ECB is responsible for the financial side,
including reconciliation with the non-financial accounts. Both institutions ensure full coordination by regular video-
conferences.
5. The compilation of the euro area accounts relies mostly on statistics already collected and compiled for other
purposes. They provide an ideal platform for reconciling across the two dimensions of the ECB’s monetary policy
analysis, entailing both financial and non-financial analysis.
2. In this unique achievement, the Committee on Monetary, Financial and Balance of Payments Statistics (CMFB)
played an instrumental role. For further detail see CMFB (2011) “Promoting Excellence in European Statistics”,
CMFB, 20 years, pages 105-108.
3. The CMFB discussed in June 2001 a users’s vision for an integrated system of quarterly European accounts.
Subsequently, a Eurostat-ECB task force was set up in 2002 to prepare the methodological and legal grounds fro the
collection of quarterly non-financial accounts by institutional sector.
Case study 4.9 The institutional environment in the creation of euro area accounts
1. The preparation of the integrated quarterly euro area accounts and non-financial European accounts is due to the
close collaboration at European level between the European System of Central Banks and the European Statistical
System. They are jointly compiled and published by the ECB and Eurostat in close cooperation with the NSOs and
NCBs of the European Unon since June 2007.
75
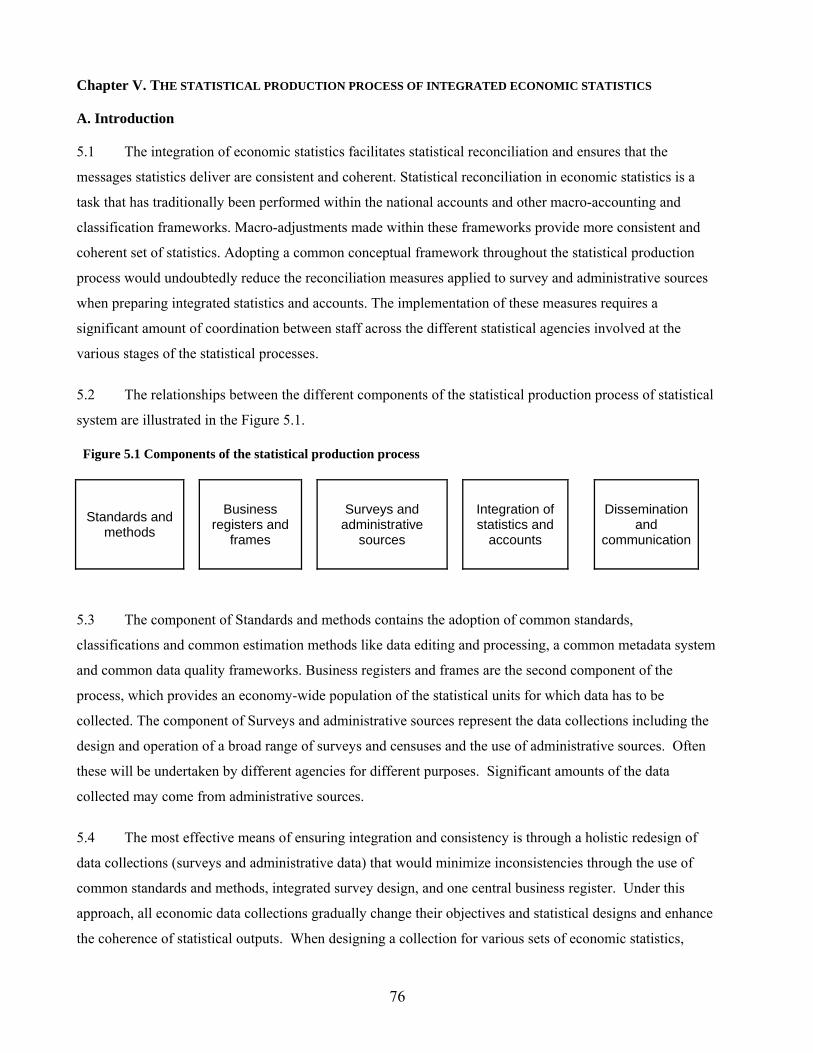
Chapter V. THE STATISTICAL PRODUCTION PROCESS OF INTEGRATED ECONOMIC STATISTICS
A. Introduction
5.1 The integration of economic statistics facilitates statistical reconciliation and ensures that the
messages statistics deliver are consistent and coherent. Statistical reconciliation in economic statistics is a
task that has traditionally been performed within the national accounts and other macro-accounting and
classification frameworks. Macro-adjustments made within these frameworks provide more consistent and
coherent set of statistics. Adopting a common conceptual framework throughout the statistical production
process would undoubtedly reduce the reconciliation measures applied to survey and administrative sources
when preparing integrated statistics and accounts. The implementation of these measures requires a
significant amount of coordination between staff across the different statistical agencies involved at the
various stages of the statistical processes.
5.2 The relationships between the different components of the statistical production process of statistical
system are illustrated in the Figure 5.1.
Figure 5.1 Components of the statistical production process
Standards and methods
Business registers and
frames
Surveys and administrative
sources
Integration of statistics and
accounts
Dissemination and
communication
5.3 The component of Standards and methods contains the adoption of common standards,
classifications and common estimation methods like data editing and processing, a common metadata system
and common data quality frameworks. Business registers and frames are the second component of the
process, which provides an economy-wide population of the statistical units for which data has to be
collected. The component of Surveys and administrative sources represent the data collections including the
design and operation of a broad range of surveys and censuses and the use of administrative sources. Often
these will be undertaken by different agencies for different purposes. Significant amounts of the data
collected may come from administrative sources.
5.4 The most effective means of ensuring integration and consistency is through a holistic redesign of
data collections (surveys and administrative data) that would minimize inconsistencies through the use of
common standards and methods, integrated survey design, and one central business register. Under this
approach, all economic data collections gradually change their objectives and statistical designs and enhance
the coherence of statistical outputs. When designing a collection for various sets of economic statistics,
76
methodologists will need to think beyond their current work to how they will integrate with other statistical
outputs. Likewise, questionnaires have to apply concepts and definitions that are consistent with those used
in other surveys and administrative collections.
5.5 Integration of statistics and accounts pertain to the stage in the production process where statistical
integration frameworks are applied for reconciliation purposes. Such frameworks include the institutional
sector accounts and input-output accounts of System of National Accounts which allow for the confrontation
and reconciliation of component data through accounting identities.
5.6 The data collected within the economic statistics system are used to produce a wide range of
statistics that measure the structure and performance of different parts of the economy, including industries,
institutional sectors, transactions and prices. All these will be disseminated separately and will often have a
unique set of users, for which a tailored communication has to be developed. Integrated statistics and
accounts, such as business and sectoral statistics, prices, national accounts and balance of payments, are the
final products of the economic statistics system. They bring statistics together and use data from a broad
range of sources to compile an integrated set of statistics and accounts that monitor the performance and
position of the entire economy. In the following, Case studies 5.1, 5.2 and 5.3 by the Netherlands, Canada
and New Zealand are presented with national practices on various components of the statistical production
process.
77
5. This programme makes a number of moves in the direction of the “Integration by Design” approach. For example,
the statistical units according to the GBR are not always appropriate for linking the information from the different
administrative sources. A new statistical unit (apart from the above mentioned unit for the largest enterprises) was
introduced for the linking procedures although statistical units are less homogeneous than production processes and
their organisation.
6. A main conclusion is that reorganizations in the statistical processes (and corresponding reorganizations in the
organizational structures) are less complicated in a central environment.
Case Study 5.1 Statistics Netherlands - Centralized integration system for national accounts
1. The organization of the Economic Division of Statistics Netherlands was originally by branches of industry.
Departments were in place for agricultural statistics, for manufacturing industries, etc. The National Accounts
Department was responsible for the integration of the economic statistics. IT automation and an improvement in the
timeliness of statistics lead to the reorganisation of the bureau, in 1991. A new reorganization came in place in
which the CBS was structured according to 8 divisions. Although some processes were (more) centralized, like the
automation and the R & D-activities, the basic principle of the organization remained the branches of industry.
2. In 2000, the next reorganization was from a product-organization to a process-organization. The production of
statistics for separate branches of industry (the “stove-pipes”) was no longer the basic principle of the organization.
In the Economic Division, departments were established for the successive phases of the statistical production
process. Starting with the department for the General Business Register, a department for the logistics of the
questionnaires was set up, followed by a department for judgement and analysis of the data and ending with the
department for National Accounts. The process of economic statistics could be characterised as a chain process,
starting with the General Business Register and ending with the National Accounts.
3. In this new organization, the National Accounts Department is organized to conform to a process orientation.
Before 2000, sub-departments were responsible for products, like the supply and use table and the quarterly
accounts. After 2000, the sub-departments play a role only in a part of the production process, but they play that role
for all products of the National Accounts department. Sub-departments are in place for estimates of goods’
producers, services industries, government activities and financial institutions and on households. One sub-
department is responsible for the integration of the data in all integration frameworks.
4. In the new, chain-orientated organization, the whole process of compiling economic statistics is redesigned. This
project began in 2008 and is still running in 2010. One of the leading principles of the redesign is to make optimal
use of administrative information. Thus, the information of the tax authorities e.g. on VAT is used. For necessary
information that is not administratively available, additional surveys are possible, but these should be reduced, to the
minimum. Furthermore, a special sub-project is set up to cover the information from the largest enterprises in the
Netherlands. For these 300 largest enterprises, the aim is to get a consistent picture by the micro-integration of the
data.
78
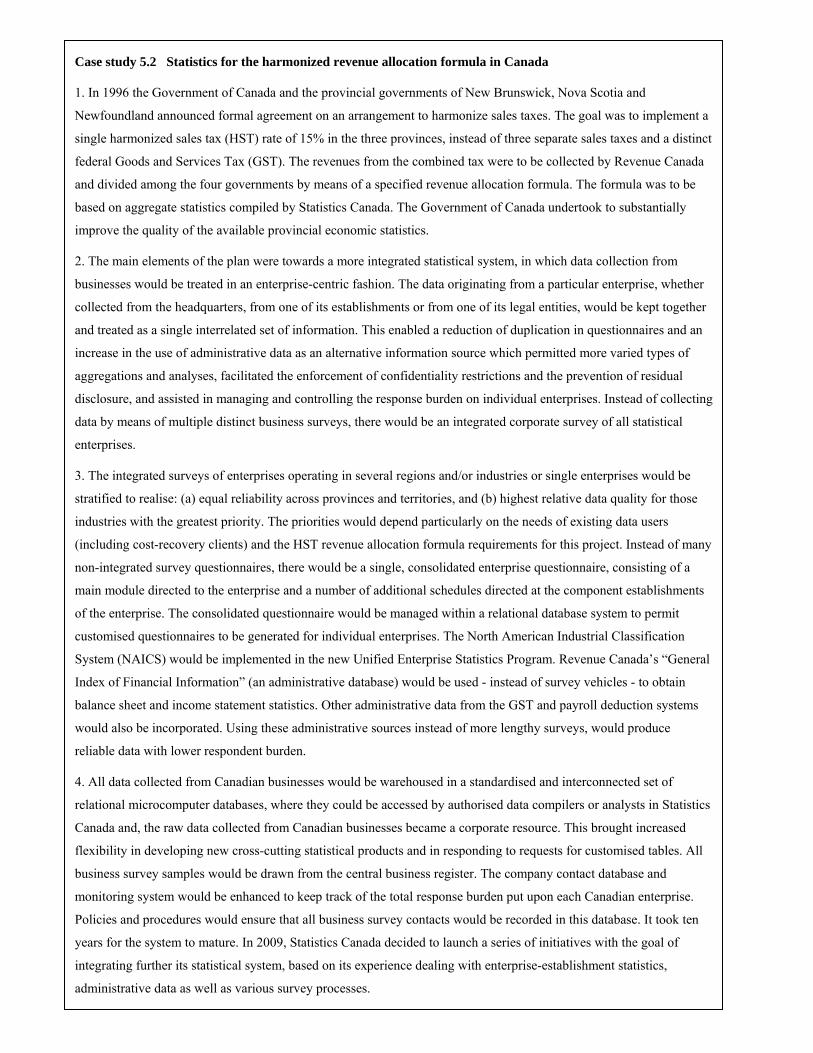
79
3. The integrated surveys of enterprises operating in several regions and/or industries or single enterprises would be
stratified to realise: (a) equal reliability across provinces and territories, and (b) highest relative data quality for those
industries with the greatest priority. The priorities would depend particularly on the needs of existing data users
(including cost-recovery clients) and the HST revenue allocation formula requirements for this project. Instead of many
non-integrated survey questionnaires, there would be a single, consolidated enterprise questionnaire, consisting of a
main module directed to the enterprise and a number of additional schedules directed at the component establishments
of the enterprise. The consolidated questionnaire would be managed within a relational database system to permit
customised questionnaires to be generated for individual enterprises. The North American Industrial Classification
System (NAICS) would be implemented in the new Unified Enterprise Statistics Program. Revenue Canada’s “General
Index of Financial Information” (an administrative database) would be used - instead of survey vehicles - to obtain
balance sheet and income statement statistics. Other administrative data from the GST and payroll deduction systems
would also be incorporated. Using these administrative sources instead of more lengthy surveys, would produce
reliable data with lower respondent burden.
4. All data collected from Canadian businesses would be warehoused in a standardised and interconnected set of
relational microcomputer databases, where they could be accessed by authorised data compilers or analysts in Statistics
Canada and, the raw data collected from Canadian businesses became a corporate resource. This brought increased
flexibility in developing new cross-cutting statistical products and in responding to requests for customised tables. All
business survey samples would be drawn from the central business register. The company contact database and
monitoring system would be enhanced to keep track of the total response burden put upon each Canadian enterprise.
Policies and procedures would ensure that all business survey contacts would be recorded in this database. It took ten
years for the system to mature. In 2009, Statistics Canada decided to launch a series of initiatives with the goal of
integrating further its statistical system, based on its experience dealing with enterprise-establishment statistics,
administrative data as well as various survey processes.
Case study 5.2 Statistics for the harmonized revenue allocation formula in Canada
1. In 1996 the Government of Canada and the provincial governments of New Brunswick, Nova Scotia and
Newfoundland announced formal agreement on an arrangement to harmonize sales taxes. The goal was to implement a
single harmonized sales tax (HST) rate of 15% in the three provinces, instead of three separate sales taxes and a distinct
federal Goods and Services Tax (GST). The revenues from the combined tax were to be collected by Revenue Canada
and divided among the four governments by means of a specified revenue allocation formula. The formula was to be
based on aggregate statistics compiled by Statistics Canada. The Government of Canada undertook to substantially
improve the quality of the available provincial economic statistics.
2. The main elements of the plan were towards a more integrated statistical system, in which data collection from
businesses would be treated in an enterprise-centric fashion. The data originating from a particular enterprise, whether
collected from the headquarters, from one of its establishments or from one of its legal entities, would be kept together
and treated as a single interrelated set of information. This enabled a reduction of duplication in questionnaires and an
increase in the use of administrative data as an alternative information source which permitted more varied types of
aggregations and analyses, facilitated the enforcement of confidentiality restrictions and the prevention of residual
disclosure, and assisted in managing and controlling the response burden on individual enterprises. Instead of collecting
data by means of multiple distinct business surveys, there would be an integrated corporate survey of all statistical
enterprises.
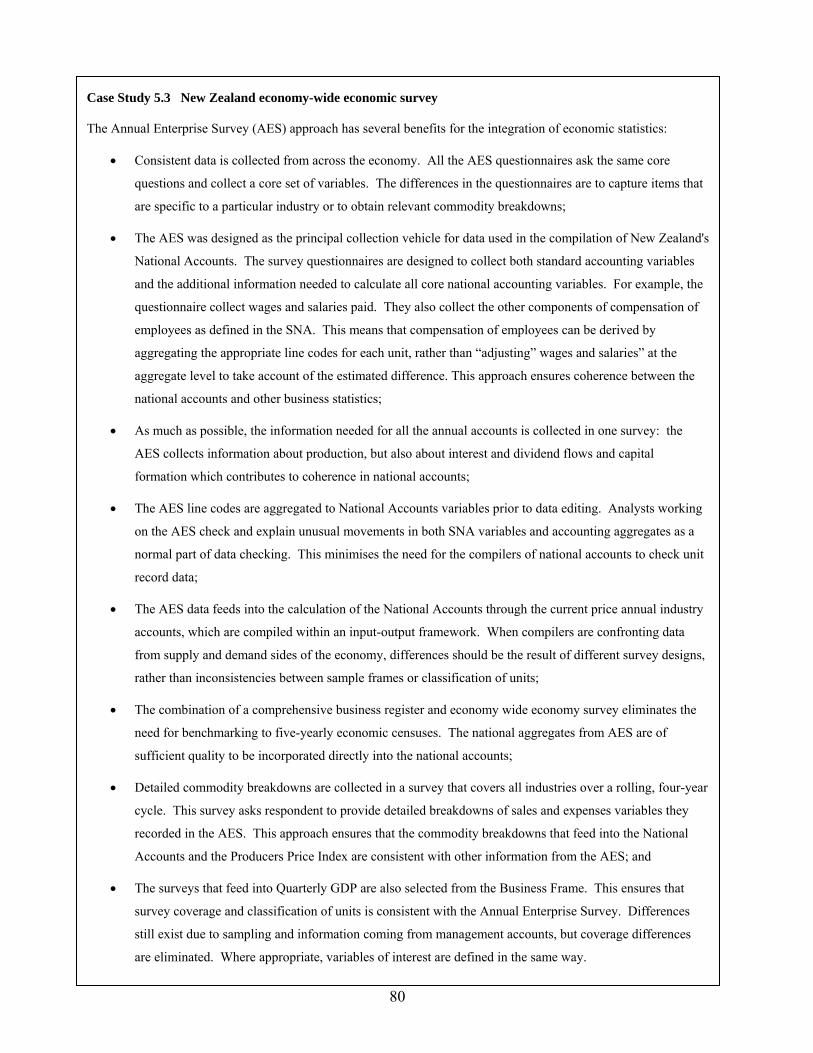
80
• The AES was designed as the principal collection vehicle for data used in the compilation of New Zealand's
National Accounts. The survey questionnaires are designed to collect both standard accounting variables
and the additional information needed to calculate all core national accounting variables. For example, the
questionnaire collect wages and salaries paid. They also collect the other components of compensation of
employees as defined in the SNA. This means that compensation of employees can be derived by
aggregating the appropriate line codes for each unit, rather than “adjusting” wages and salaries” at the
aggregate level to take account of the estimated difference. This approach ensures coherence between the
national accounts and other business statistics;
• As much as possible, the information needed for all the annual accounts is collected in one survey: the
AES collects information about production, but also about interest and dividend flows and capital
formation which contributes to coherence in national accounts;
• The AES line codes are aggregated to National Accounts variables prior to data editing. Analysts working
on the AES check and explain unusual movements in both SNA variables and accounting aggregates as a
normal part of data checking. This minimises the need for the compilers of national accounts to check unit
record data;
• The AES data feeds into the calculation of the National Accounts through the current price annual industry
accounts, which are compiled within an input-output framework. When compilers are confronting data
from supply and demand sides of the economy, differences should be the result of different survey designs,
rather than inconsistencies between sample frames or classification of units;
• The combination of a comprehensive business register and economy wide economy survey eliminates the
need for benchmarking to five-yearly economic censuses. The national aggregates from AES are of
sufficient quality to be incorporated directly into the national accounts;
• Detailed commodity breakdowns are collected in a survey that covers all industries over a rolling, four-year
cycle. This survey asks respondent to provide detailed breakdowns of sales and expenses variables they
recorded in the AES. This approach ensures that the commodity breakdowns that feed into the National
Accounts and the Producers Price Index are consistent with other information from the AES; and
• The surveys that feed into Quarterly GDP are also selected from the Business Frame. This ensures that
survey coverage and classification of units is consistent with the Annual Enterprise Survey. Differences
still exist due to sampling and information coming from management accounts, but coverage differences
are eliminated. Where appropriate, variables of interest are defined in the same way.
Case Study 5.3 New Zealand economy-wide economic survey
The Annual Enterprise Survey (AES) approach has several benefits for the integration of economic statistics:
• Consistent data is collected from across the economy. All the AES questionnaires ask the same core
questions and collect a core set of variables. The differences in the questionnaires are to capture items that
are specific to a particular industry or to obtain relevant commodity breakdowns;

B. Standards and methods 1. Common concepts, definitions and classifications 5. 7 The integration of statistics and the improvement of the quality of the data require the application of
common concepts, definitions and classifications. The successful implementation of methodological
standards usefully contributes to achieving the integration of statistics. Unless internationally recommended
standardized concepts and classifications are applied to the various subject-matter areas of statistics within a
coherent logical system, statistical data cannot be structured to meet the needs of users for aggregated data or
for compatible data from various fields. Standards provide common concepts, definitions, and classifications
at the national, regional and international levels. Descriptions of agreed definitions are needed for clear and
accurate interpretation of the various concepts.
5.8 Compliance with international standards is an important tool to harmonize and strengthen the
national statistical systems. There are many challenges in adopting international statistical standards at the
national level. Among the challenges are competing user needs, conflicting statistical priorities, scarce
financial and human resources, coordination among data providers, legal restrictions on access to data across
statistical agencies, and degree of respondent burden. The degree with which these challenges can be
addressed will determine the extent of national compliance with the international standard.
5.9 In order to meet the many challenges of developing, implementing and promoting international
statistical standards, the global statistical community has agreed on the principles to facilitate the
development of standards and has made significant investment in the development, dissemination,
maintenance, harmonization, updating, revision and implementation of standards. The international statistical
agencies continue to play a leading role in developing international standards and are committed to provide
technical support in the form of training, operational guides, collection and dissemination of best practices
and various other forms of knowledge base tools to assist countries in adopting international standards.
5.10 The usefulness of international standard frameworks as tools for integration depends on the degree to
which national agencies preparing primary data adapt their concepts, definitions and classifications to fit into
them. Steps need to be taken to involve and motivate all data producers of relevant economic statistics and
keep them engaged in the process.
5.11 The main objectives of developing standards are to diminish the major causes of differences in
statistics arising from the use of different concepts (e.g. units, transactions etc.), valuation and time of
recording rules, accounting structure, key aggregates and balances. Their harmonization and their greater
consistency could diminish differences and result in more coherent data outputs.
81
5.12 Standards should be developed with broad involvement of stakeholders and technical expert groups.
Because standards are to enjoy general acceptance, they should be formulated in consultation with specialists
in the respective fields. Technical committees are the most appropriate instruments for this kind of work. The
development has to take place in a consultation process, maintaining transparency, with attention to
consistency with related conceptual frameworks and standards. It is important to reach a consensus on all
main outstanding issues before finalization.
5.13 The high significance attributed to the establishment of standards for the integration of statistics is
underlined in the United Nations (1994) document Fundamental Principles of Official Statistics that states
under Principle 9:
“The use by statistical agencies in each country of international concepts, classifications and methods
promotes the consistency and efficiency of statistical systems at all official levels.”
5.14 The adoption of the Fundamental Principles of Official Statistics was followed by the endorsement
of the Declaration of Good Practices in Technical Cooperation in Statistics in 1999, which included relevant
principles underlining the role of standards in the integration process.
5.15 The Declaration in Principle 4 states: “Concepts, definitions, classifications, sources, methods and
procedures employed in the production of international statistics are chosen to meet professional scientific
standards and are made transparent for the users”. Good practices related to this principle include:
• Documenting the concepts, definitions, classifications used, and making this information publicly
accessible;
• Documenting how data are collected, how editing mechanisms are applied to country data; and
• Making officially agreed standards publicly available.
5.16 The Declaration in Principle 8 states that “Standards for national and international statistics are to
be developed on the basis of sound professional criteria, while also meeting the test of practical utility and
feasibility.” Good practices related to this principle include:
• Systematically involving national statistical offices and other national organizations for official
statistics in the development of international statistical programmes including the development and
promulgation of methods, standards and good practices;
• Ensuring that decisions on such standards are free from conflicts of interest;
• Advising countries on implementation issues concerning international standards; and
• Monitoring the implementation of agreed standards.
82
5.17 Through international cooperation, a large number of standards have been developed in the past
decades. These international standards can be viewed as methodological recommendations that are often
accompanied by practical compilation guidelines. Many of these international standards served as the basis
for the development of related national standards.
5.18 The adoption of the standard should take place by the respective authoritative body followed by
publication and dissemination. The formal adoption of the standard conveys support for the forthcoming
implementation process. The publication and broad dissemination provides accessibility for data providers
and users to the standards and facilitates its understanding as well as the necessary revisions and updates to
the standards. The implementation phase includes providing technical advice to users, preparation of
compilation guides, organizing training courses, exchange of best practices, monitoring the implementation
and undertaking updates based on international research.
5.19 The development of standards is a complex process encompassing various stages of work. Case
study 5.4 “Good practices in international standards development” illustrates the project management
approach used in the System of National Accounts 2008 update process.
83
Case study 5.4 Good practices in the development of international statistical standards
1. When the Statistical Commission at its thirty-seventh session evaluated the multi-year updating project of the
System of National Accounts 2008, in its report3 it attributed the commendable progress:
“to the adoption of the project management approach4 and the extensive use of a transparent interactive website, and
recommended that approach and technology in similar statistical projects and programmes.”
2. The update’s Work Programme emphasized the basic approach as a transparent review process that has a broad
support in the international statistical community. For this to happen, national statistical organizations were engaged
and consulted in all phases and at all levels. The work programme called for active involvement of the senior
management in national, regional and international organizations. The outreach was not limited to national statistical
offices but engaged other producers of statistics like central banks that produce national accounts and other
macroeconomic statistics.
3. The SNA update Work Programme included the following main components:
• The criteria for the issues to be updated in the standards were defined. The list of issues adopted by the
Statistical Commission ensured that the selection of issues was kept feasible, manageable and corresponded
to the needs of the community of statisticians that initiated the update;
• The Governance structure was operational and built on continuous collaboration at many levels: The
Intersecretariat Working Group on National Accounts (ISWGNA) consisting of Eurostat, the IMF, the
OECD, United Nations and the World Bank was responsible for managing and coordinating the updating
process assisted by an SNA subject-matter technical editor. Ensuring smooth progress of the overall process
was the task of a project manager. The United Nations Statistics Division, as the secretariat of the ISWGNA,
provided secretarial support including setting up and maintaining the project website. The senior
management of the five ISWGNA agencies provided collective oversight and liaised with senior-level
representatives of countries and international organisations;
• To resolve technical issues and reach consensus, a 20-member Advisory Expert Group (AEG) supported the
ISWGNA in its deliberations on conceptual issues in six meetings and in many electronic forum discussions
and papers, producing a substantial body of research. Topical (standing and ad hoc) expert groups carried
out additional research; and.
• To ensure country involvement all documents for discussion and recommendations were publicly accessible
through the update web site for commenting with a 60-day response period and their responses were posted.
Countries were consulted on every substantive step and decision in the update process, and their replies
provide a rich source of information why they support or object to certain proposals. These replies can be
3 See, E/CN.3/2006/32. 4 See, Work Programme for the updating of the 1993 SNA, by ISWGNA, 21 November 2003, http://unstats.un.org/unsd/nationalaccount/Workprogram1993SNAupdate%2021Nov2003final.pdf
84
useful input also in the implementation phase of the standard after its adoption, as well as a source about the
needs of certain countries for indication of technical assistance in one or another area.
4. The project’s successful and timely completion can be attributed to the efficient collaboration of its many
contributors representing a broad-based group of stakeholders joining their efforts in a closely coordinated
undertaking in the framework of the adoption of a project management approach.
a. Harmonization of standards with macroeconomic statistics frameworks and classifications
5.20 Harmonization of standards is the most important instrument for increasing consistency at the
international level. A significant degree of harmonisation has already been achieved among macroeconomic
statistics frameworks such as the System of National Accounts (SNA), Balance of Payments Manual (BPM),
Government Finance Statistics Manual (GFSM) that has further improved with the development and
adoption of the System of National Accounts 2008 (2008 SNA). Consistency with international
classifications like the International Standard Industrial Classification of All Economic Activities (ISIC) has
been achieved in that the definitions of kinds of activities and statistical units are the same.
5.21 The major harmonization of the systems occurred in the following areas:
• Residence. All systems distinguish the domestic economy from the rest of the world on the same
basis - residence of institutional units - assigning to the rest of the world those institutional units
whose main centre of predominant economic interest is outside the geographic territory of the
country;
• Domestic economy and institutional sectors. All systems define the domestic economy comprising
resident institutional units, adopting a common breakdown of the economy into institutional sectors
and sub-sectors;
• Stocks and flows. All systems use the same distinction between stocks - economic magnitudes
measured at a point in time - and flows - economic magnitudes measured with regard to a period of
time. Also, all systems use the same definitions for transactions and other economic flows;
• Accounting rules. All systems use the accrual basis for recording transactions. All systems use
market prices as the valuation principle;
• Boundary issues. For all systems, the production and asset boundaries are the same; and
• Integrated accounts. In all systems, an integrated set of accounts explains all changes between an
opening and a closing balance sheet by transactions, holding gains/losses, and other changes in the
volume of assets. This fosters analysts’ ability to reconcile stocks and flows within balance sheets.
85
In addition, the systems reflect harmonization in similar accounting frameworks, although
substantial differences exist in classification to meet specific needs.
5.22 In recent years there has been important focus on the harmonization of concepts and definitions
across sectoral and business statistics of the various domains of economic statistics with the concepts and
definitions used in macroeconomic frameworks. Various updating activities in economic statistics have taken
place at the same time as several major macroeconomic standards were revised and updated. This allowed
the institutions responsible for the development and updating of their standards to conduct the necessary
consultations to ensure the increasing of methodological consistency, achieve harmonization of concepts and
definitions with related structural statistics and the underlying macroeconomic frameworks.
5.23 Since the standard development kept the harmonization across standards of the various domains of
economic statistics and classifications a major target, a significant degree of harmonization of the recently
updated business and sectoral statistics standards with the standards of macroeconomic frameworks has been
achieved. These intermediate output frameworks of business statistics are based on common methodological
principles and common definitions of data items that allow for a coordinated compilation of harmonized
statistics with reliability and flexibility to the level of detail required to meet the needs of national, regional
and international agencies and business users.
5.24 There has been considerable progress in updating, revising and developing methodology in statistical
areas in a number of economic statistics domains such as industry (United Nations, 2009a), distributive trade
(United Nations, 2009b), international trade (United Nations, 1998),foreign direct investment (OECD, 2008),
external debt (IMF, 2003), tourism (United Nations et al, 2008c) etc. at the same time that their
harmonization with the standards of macroeconomic frameworks has been kept in focus. The coordinated
approach of the revision of the related business and structural statistics standards in the economic statistics
domains with macroeconomic frameworks and classifications has resulted in harmonized conceptual systems
of these standards, frameworks and classifications. In the countries that implement the standards with the
harmonized concepts it would open up the possibility for considering the introduction of highly integrated
data collection and estimation programmes.
b. Definition and classification of statistical units
5.25 The legal and operational structures of economic entities as well as their record keeping practices are
developed to support their sales, profits, and other goals and may not be well suited for statistical purposes.
Statistical surveys are designed to successfully use these data by providing coherence between national
accounting and business accounting standards. For the implementation of integrated economic statistics it is
important to have guidelines about such topics as the statistical units to be used for the purpose of data
collection and reporting. If two or more statistical collections cover the same economic activity over time,
86
meaningful comparison between data cannot be made unless the object of comparison applies to the same
units. The statistical unit serves as a tool for measuring in an unduplicated an exhaustive manner several
aspects of the economy.
5.26 Statistical units may be defined according to many different criteria: legal, accounting or
organizational; geographical; and production. The relative degrees of importance of these criteria depend on
the purpose from a statistical perspective of compilation and dissemination. A legal or institutional criterion
helps define units in the economy that are identifiable and recognizable. In some cases, legally separate units
need to be grouped together if they are not sufficiently autonomous in their behaviour and objectives. In
order to define an institutional unit, accounting or organisational criteria also have to be applied. Accounting
criteria require that an institutional unit keep a complete set of accounts of its transactions. Organizational
criteria state that enterprises are organizational units that have a certain degree of autonomy.
5.27 A statistical unit is an entity about which information is sought and for which statistics are ultimately
compiled. It is the unit that provides the basis for statistical aggregates and to which tabulated data refer. They can
be observable such as a legal entity or created by splitting the observed entity, using statistical estimation
methods, for the provision of a detailed and homogeneous set of statistics. For operational purposes, a
distinction must be made between collection and reporting. The collection unit is the contact unit from which
data are obtained for the questionnaire survey forms. A reporting unit is the unit for which data are reported.
Reporting units are those entities for which information is collected by means of questionnaires or
interviews. Reporting units are the units for which statistics are compiled. In the case of a complex operating
structure, the unit at the highest level of the operating structure may make a separate return for units at a
lower level of the operating structure.
5.28 For data collection purposes, the most convenient way to obtain statistics would be to collect from
entities capable of reporting complete sets of required records. This would allow statisticians to take
advantage of information available from the accounting records of the producing entities and similar or
complementary information these producing entities provide to administrative authorities. In such a context,
this would result in statistics that, to a certain degree, serve best the interests of users since it makes it
possible to relate administrative records to statistical surveys. For the respondents, the link with
administrative data sources represents a first condition towards the use of administrative information in the
compilation of statistics and the potential reduction in response burden.
5.29 For economic statistics, the statistical units can be distinguished between institutional units,
enterprise groups, enterprises and establishments as set out in the next sections.
87
Institutional units
5.30 Institutional units are the core units of the System of National Accounts. All subsequent definitions
embody the definition of this basic unit. An institutional unit may be defined as an economic entity that is capable,
in its own right, of owning assets, incurring liabilities and engaging in economic activities and in transactions
with other entities.
5.31 An institutional unit has the following main attributes: (a) it is entitled to own goods or assets in its own
right and is therefore able to exchange the ownership of goods or assets in transactions with other institutional
units; (b) it is able to take economic decisions and engage in economic activities for which it is itself held to be
directly responsible and accountable at law; (c) it is able to incur liabilities on its own behalf, to take on other
obligations or future commitments and to enter into contracts and (d) either the institutional unit has a complete
set of accounts, including a balance sheet of assets and liabilities, or it would be possible and meaningful, from
both an economic and a legal viewpoint, to compile for it a complete set of accounts, if required.
Enterprise group
5.32 Enterprises under the control of the same owner form a group to achieve economic advantages such
as control of a wider market and increase in productivity through more effective business management.
Integration of economies leads to the formation of vertical groups. An enterprise takes control over another
enterprise that is producing raw material or semi-manufactured goods (backward integration) or selling its
final product (forward integration). An enterprise group is a set of enterprises controlled by a group head.
5.33 For certain analyses, it may be useful to observe links between certain enterprises and group together
those that have strong ties with each other and recognize the links of the group head and the controlled
enterprise via the network of subsidiaries. The enterprise group unit is particularly useful for financial
analyses, however, given its unstable and varied nature, the enterprise still remains the central unit for
observation and analysis.
Enterprise
5.34 An institutional unit in its capacity as a producer of goods and services is known as an enterprise. An
enterprise is an economic transactor with autonomy in respect of financial and investment decision-making, as
well as authority and responsibility for allocating resources for the production of goods and services. It may be
engaged in one or more economic activities at one or more locations.
5.35 The enterprise is the basic statistical unit at which all information relating to its production activities and
transactions, including financial and balance-sheet accounts, are maintained and from which international
transactions, an international investment position (when applicable), a consolidated financial position and the net
88
worth can be derived. It is also used for institutional sector classification in the System of National Accounts
2008. The enterprise or corporate level is the unit best suited for the analysis of profits, Research and
Development, international trade, foreign direct investment, pricing, and other decisions made at the headquarters
of an enterprise.
Establishment
5.36 An establishment is defined as an enterprise or part of an enterprise that is situated in a single location
and in which only a single productive activity is carried out or in which the principal productive activity accounts
for most of the value added. In the case of most small and medium-sized businesses, the enterprise and the
establishment will be identical. Some enterprises are large and complex with different kinds of economic activities
undertaken at different locations. Such enterprises should be broken down into one or more establishments
provided that smaller and more homogeneous production units can be identified for which production data may be
meaningfully compiled.
5.37 The establishment is particularly useful as a statistical unit for compilation and dissemination of
information related to its production activities which would include: (a) production of goods and services,
revenues from sales of goods and services, all associated costs including employee remuneration, taxes on
production and imports, subsidies, depreciation and a meaningful operating surplus; (b) employment information
such as numbers of employees, types of employees and hours worked; (c) stock of non-financial capital used and
(d) changes in inventories and gross fixed capital formation undertaken5.
Type of legal organization and ownership of statistical units 5.38 The kind of legal organization is an important characteristic of statistical units which may be
included in the business register. The kind of legal organization is the legal form of the economic entity
(either the enterprise or the establishment). Further breakdowns may be of interest to users, namely:
incorporated enterprises and unincorporated units by sole proprietors and partnerships not recognized as
independent legal entities.
5.39 In addition to taking into account the kind of legal organization, it is considered useful to distinguish
between the types of ownership, namely, between private ownership and the various forms of public
ownership of units and foreign controlled units. The grouping based on legal organization facilitates the
choice of the appropriate types of surveys for data collection from the units in each group. Such surveys
5 For more details on statistical units reference may be made to the source Statistical Units, United Nations Statistics Division (2007), available at: http://unstats.un.org/unsd/isdts/docs/StatisticalUnits.pdf and further information is included in the publication United Nations (2009).
89
would be economical and offer the advantage of ease of implementation for collecting data to compile
institutional sector accounts.
c. Definition and classification of transactions
Coherence between national accounting and business accounting
5.40 The integration of statistics will be enhanced, if the definition and classification of transactions is
standardized. Different standards and classifications can have different definitions for similar variables. For
example, SNA variables are often defined differently to the variables stored in business accounting systems.
Responses to questionnaires will be more accurate, if the data items in survey questions are specified in
terms of accounting definitions that are understood by respondents. If the additional information needed for
the derivation can also be collected, the SNA variables can be derived at the unit record level. This approach
ensures coherence between the national accounts and other business statistics. If the additional data needed
to derive SNA variables cannot be collected, an adjustment will have to be made at the aggregate level to
take account of any differences in definitions.
5.41 The general principle in national and business accounting is that transactions should be recorded as
claims and obligations occur, that is on an accrual basis, not on a cash basis. If discrepancies occur in
recording, these inconsistencies may be eliminated by ex-post adjustments.
Business accounting standards
5.42 National accounting information for companies must be drawn from data compiled and recorded
according to relevant local accounting standards. Business survey respondents are usually asked to apply
either the relevant International Financial Reporting Standards (IFRS) or national Generally-Accepted
Accounting Principles (GAAP). This may cause several problems for the coherence and consistency of
accounting information being collected:
• Where accounting standards do not prescribe a particular treatment or allow some latitude, there may
still be problems of consistency (between units or over time) for some transactions, if businesses
report similar transactions in different ways;
• In most cases, the principles underlying the relevant accounting standard will be consistent with the
principles of the SNA. In particular, both standards are based on the principle that economic
substance should take precedence over legal form. Two areas where the IFRS adopts a different
approach to the SNA are in the area of the recognition of holding gains and losses as income, and in
the recording of provisions and contingent liabilities. Where the accounting standards conflict with
SNA principles, survey data have to be adjusted;
90
• Many countries have adopted the IFRS. The change from GAAP to IFRS will result in a change in
the definition, valuation and time of recording for some transactions. If adjustments cannot be made,
these changes may lead to breaks in time series for the accounting period when the changes occur.
These breaks should be identified and explanations provided, without breaching confidentiality rules;
and
• For multinational enterprises, IFRS and other accounting standards usually require transactions
between enterprises in different countries to be consolidated for the whole group. The non-
consolidated data needed for the compilation of the national accounts will have to be obtained from
other sources.
XBRL reporting
5.43 XBRL (Extensible Business Reporting Language) is an XML-based computer language
developed for the electronic transmission of business and financial reports. Some regulatory agencies have
established processes for businesses to fulfil their mandatory reporting requirements using XBRL standards.
XBRL tools have also been developed for reporting of financial information to taxation and statistical
agencies. These tools reduce the cost of compliance for business by building reporting requirements into
standard accounting software packages in a way that automates the process of reporting to government
agencies.
5.44 The core methodology is an XBRL taxonomy that defines all the data items that the relevant
agencies require from business. An essential step in developing a taxonomy is harmonising the data items
collected by different government agencies. If two agencies require the same definition of a data item, it is
given the same name. If the different agencies establish that they need different definitions, then they are
specified with different names. This harmonisation process simplifies reporting by businesses by
standardising definitions, but it also assists with integration of statistics, because different collection agencies
have consistent and coherent data definitions.
2. Data processing, data editing, metadata and data warehousing
5.45 Data processing represents a very expensive step in data collection. For statistical agencies, the goal
may be the development of a generic suite of processing tools that improve data quality and make integration
possible, while reducing costs. Processing systems should be integrated with all components of the statistical
production process in which several centralized tools can be considered for development, including standard
sample selection tools, standard edit, imputation and estimation tools and a metadata system for all statistical
inputs.
91
5.46 The processing activities should consist of generic tasks to be performed as soon as the survey and
administrative data become available. The tasks include basic correction process when the data enter the
system, an edit and imputation process, an allocation process, an estimation process and micro and macro
data analysis. During processing, adjustments and corrections are made to the data and arrangements must be
in place to ensure that these adjustments do not affect the coherence of data. Many adjustments and
corrections will be made to the basic economic data before they get integrated in macro accounts. A
significant amount of qualitative information assembled during the various processing stages should be
considered metadata information to be made available to the macro accountants. This information is not only
crucial in the final stages of the integration process, but also helps understanding the quality of data and
decisions taken at various stages of processing and could reveal important details and flaws about survey
design, survey and administrative data and data estimation methods used.
5.47 Using a data warehousing system of data and metadata contributes to the integration of economic
statistics. With well-designed data warehouses, the dissemination of data and metadata becomes integrated
with the collection and processing components of the statistical production process. To support the
integration of economic statistics, an output data warehouse should establish a simple and efficient process
for accessing data to provide:
• comprehensive metadata to facilitate understanding and analysis;
• consistent and coherent long-term time series;
• reliable information about the availability of data;
• information about the availability of updated versions of published series; and
• contact details for the people who can provide more information about a statistical output.
5.48 Statistical agencies have traditionally developed a separate database for each statistical output.
While this simplifies development processes, this practice can be a hindrance to integration of statistics,
especially if there is no effort to standardize variable definitions, labels and formats. As better IT tools have
become available, many statistical agencies are moving towards the development and population of output
data warehouses. The data warehouse approach to the storage of statistical data has many advantages,
including:
• Efficient search capability;
• Consistency in terminology and definition of variables;
• Standardized statistical methodologies;
92
• Easier access with common tools and processes;
• Increased coherence through standard classifications and definitions;
• Relevant metadata available in a standard consistent format; and
• Easier data integration.
3. Data quality frameworks
5.49 Many organizations may have an operating standard for quality control. The family of standards for
quality management systems, ISO 9000 is maintained by ISO, the International Organization for
Standardization6 (ISO) and is administered by accreditation and certification bodies. The requirements in
ISO 9001:2008 (which are one of the standards in the ISO 9000 family) include:
• adopting a set of procedures for all key business processes;
• monitoring processes to ensure they are effective;
• keeping adequate records;
• checking output for defects, with appropriate and corrective action where necessary;
• regularly reviewing individual processes and the quality system itself for effectiveness; and
• facilitating continual improvement. 7
5.50 There are commonalities between a quality management system and the process for introducing an
integration framework. Where feasible, the statistical agencies should enhance existing, effectively
functioning data quality frameworks to incorporate an integration dimension in economic statistics for the
institutional arrangements, data input and output aspects of the statistical production process.
5.51 The quality of official statistics is a central concern for all statistical agencies. A number of countries
and international organizations have developed detailed concepts and procedures of quality control. Of
particular note is the IMF’s Data Quality Assessment Framework (DQAF).8 The DQAF was designed to
assess the quality of specific types of national datasets, presently covering the national accounts, consumer
price index, producer price index, government financial statistics, monetary statistics, balance of payments,
6 Details available at: http://www.iso.org/iso/home.htm.7 The non-market orientation of national statistical offices and the essentially public nature of the informational product offered makes ISO 20252:2006 Market, Opinion, Social Research, Vocabulary and Service Requirements, published in 2006, better suited to NSOs than the ISO 9000 series. Details of ISO 20252:2006 are available at: http://www.bsigroup.com/en/Assessment-and-certification-services/management-systems/Standards-and-Schemes/ISO-20252/. 8 Available at: http://dsbb.imf.org/Applications/web/dqrs/dqrsdqaf.
93
and external debt. The DQAF provides a structure for comparing existing practices against best practices
using five dimensions of data quality—methodological soundness, accuracy and reliability, serviceability,
and accessibility—as well as institutional prerequisites for data quality that may be cross-cutting and have an
integration dimension.
5.52 While there are various quality frameworks in use, the expert group on national quality assurance
frameworks (NQAF) has developed a generic template and established a mapping to existing national quality
assurance frameworks,9 which can lead to be utilized by countries to introduce integration of economic
statistics as a quality dimension.
C. Business registers and frames
5.53 Business registers have a central role in integrated economic statistics. They provide a common
universe for sampling and uniform classification of firms, which promote consistency in collected data across
surveys. Moreover, they allow the integration of data from administrative sources and surveys. As a result,
the timeliness in producing statistics can be improved and respondent burden reduced.
5.54 A business register combines different sources, such as tax records and administrative records. The
business register coverage should be as complete as possible. One way to ensure consistency of units and
classifications is to use a comprehensive business register as the vehicle for structuring units and assigning
their classifications. If all survey populations are drawn from the business register and all administrative data
are matched to it, all data records can take the classifications that they have already had assigned to them on
the business register. This ensures that information from different data sources is classified consistently and
the problem of a statistical units being classified differently in different surveys is avoided.
5.55 The business register consists of a suite of files, programes and processes that interface with
businesses through direct profiling, survey responses and feedbacks as well as indirectly, through
administrative sources such as tax records. This frame is to support survey sampling and stratification
required to measure fully all sectors of the economy. Consequently, the register needs to contain data about
the units, the name and address, a code identifying activity, variables about their size and information about
their life cycle. That information is not only to determine an optimum sample for a given survey, but also to
study the business demographic of the country.
5.56 In order to prepare business and sectoral statistics, the statistical unit should be the establishment
since it is the most detailed unit for which the range of data required are normally available. For analytical
and sampling reasons, information about size of establishments should be available. Information about where 9 See http://unstats.un.org/unsd/statcom/sc2012.htm document E/CN.3/2012/13
94
the establishment is located is also required for analytical purposes as well as for producing detailed
unduplicated regional sets of accounts. Statistical units should be assigned a unique number in order to
facilitate the matching process with administrative sources. Identification code must not change throughout
the life of the unit, although some of the unit’s other characteristics may change.
5.57 Enterprises and establishments are performing various activities. They should be classified to the
industry that contributes most to the value added of the unit, or to the activity the value added of which
exceeds that of any other activity undertaken by the unit, called its principal activity. The principal activity of
producer units may change from one statistical period to the next, either because of seasonal factors or the
management decision to vary the pattern of output. This necessitates the change of classification of the unit.
Frequent change needs to be avoided as it may distort the statistics rendering the interpretation difficult.
Countries are encouraged to develop a “stability rule” or “resistance rule”. Without such rules, there would
be changes in the economic demography of the business population which would be no more than statistical
artefacts.
5.58 For the purpose of accurate measurement of production, distribution and financing in the economy, it
is desirable to have the links between individual establishments and their parent enterprise clearly defined.
More importantly, these links are fundamental for the efficient sampling design because one survey might
gather information on value added, employment and other production-related statistics usually available at
establishment level, while another may collect data from consolidated financial statements compiled mainly
at the enterprise level. One of the attributes attached to a statistical unit should be the period of economic
activity of a given unit and include the date of commencement and cessation of its activity. This is an
important piece of information when establishing the sample for a given survey.
5.59 Data from administrative databases are an important source of statistical information. The units
recorded in administrative systems are usually defined to meet administrative and legal objectives which can
be different from those needed for economic statistics, so compromise between conceptual purity and
practicality may be necessary. For example, it is necessary to draw on tax records for the required data or if
survey data need to be supplemented with tax data, statistical agencies will have to decide whether (a) they
can map the legal and statistical structure of the enterprise, or (b) they use the legal structure selectively as a
proxy for the statistical structure (ISIC Rev 4, 2008).
5.60 As statistical offices become more dependent on administrative data for updating their business
registers and as a core data source, the statistical unit is closely linked with the legal/administrative unit.
Administrative units are close proxies to the economic concepts that statisticians are trying to measure and
the alignment of statistical units to administrative units has not affected the quality of the statistics.
95
5.61 Where administrative units differ significantly from the enterprises or establishments that are the
basis of other statistical collections, a record of the mapping between the two sets of units will assist with the
integration of data. A business register is an effective tool for recording these mappings.
5.62 The transactions of multi-national corporations do not align well with the economic behaviour that
is measured by national economic statistics of each of the countries in which they operate. Some
multinational global enterprises keep integrated accounting records at the global or the regional levels only.
To separate and extract complete accounts for all the activities taking place within each domestic economy,
data should be obtained from the main or regional head office of the global enterprise.
5.63 Statistical information will be collected for geographic regions. Public organisations that collect
statistics may sometimes adopt adminstrative regions that reflect the nature of their activities. Government
departments may often be responsible for administering different sets of geographic regions. For example, a
department of agriculture may adopt different regions than a department responsible for unemployment
benefits. This presents challenges when integrating statistics from a variety of sources.
5.64 The adoption of standard data definitions and terminology will assist with the integration of data.
Organisations that collect data with a regional dimension should map their administrative regions to a
standard geographic classification. If records are classified at the lowest level of disaggregation, data from
different sources can be aggregated into coherent areas and regions. Each regional area should be defined in
a way that is consistent with all other areas.
5.65 The regular updating of business registers to “clean” it for “births” and “deaths” of businesses
ensures reliability of the data collected, especially around turning points in the economy. There is a need for
a sample frame whether the country uses business registers or economic census for the survey sample design.
The practice used to derive sample frames raises various issues such as area samples and updates of list
frames. In countries where “snap shots” of business registers serve as sample frame, one might need to adjust
survey results considering business register lags (post-stratification and probabilistic models).
5.66 A comprehensive business register has many benefits for the integration of economic statistics:
• A consistent reference point for all adopted classifications (such as for industries, geographical
location, sources of data, identifier of statistical unit), which facilitates the integration of statistical
outputs by ensuring that classifications are applied consistently across all surveys and statistical outputs;
• A reduction in duplications and inconsistent coverage of administrative datasets, when matching
administrative datasets to the business register;
96
• Samples for all economic surveys from the business register ensure coherence between different
surveys and reduces the need for coverage adjustments;
• Administrative data and survey data can be combined in a statistical output with the business register
ensuring coherence between data sources. For example, the business register can be partitioned with tax
data being used for one partition and survey data used for the rest. A unit that is included on two
different data sources can be excluded from the less appropriate source to ensure that the coverage is
coherent;
• Information from different sides of the accounts is derived from data sources with consistent coverage
and classifications;
• Time series of the business demographic information on the register allows the growth and
development of businesses to be analyzed. It can be used to ensure that longitudinal micro data analysis
is consistent with other economic statistics;
• Operating cost and response burden of data providers can be monitored when all survey activities are
channelled through the same register.
5.67 The creation of a unified comprehensive statistical business register is a long-term objective and a
challenging task. Decentralized systems may want to begin by developing a system for reconciling the more
significant inconsistencies in the data produced by multiple business registers. This may require
memorandums of understanding, changes in laws relating to confidentiality and exchange of data, and
developing a better integrated statistical production process. Reconcilation of significant differences can
improve the accuracy and consistency of the data through more consistent classification of key enterprises
and the elimination of overlaps and gaps in coverage. Further, because some registers – such as those
derived from censuses – are more comprehensive, while others – such as those derived from commercial and
administrative records – are more up to date, reconciliation of differences may produce better business
registers than any one of these types of registers by drawing upon the different strengths of the various
registers.
5.68 Less advanced statistical systems may need to undertake intermediate steps to create a more
comprehensive coverage of enterprises through a combination of a limited statistical register (e.g. on the
basis of certain types of ownership and legal status) complemented by an area frame. As an option for a
survey programme that can be used to efficiently capture comprehensive statistical information from
enterprises of all sizes operating in an economy, see the Fully Integrated Rational Survey Technique
(FIRST), (United Nations, 1994b). Progressively, the coverage of the statistical register could be extended
based on the institutional strengthening of the statistical system to maintain a certain scope. In addition, there
may be a capacity limit with which developing countries with large informal sectors could attempt to include
97

the small and micro enterprises in their statistical registers given the sheer number of these businesses.
Building a business register involves adopting a strategy for the inclusion of each unit to achieve more
comprehensive coverage. For a national example of business register development see Case study 5.5.
98
Case Study 5.5 Statistics New Zealand - Tax-based business register
1. The tax-based business register (called the Business Frame) records a core set of information for all economically
significant private and public sector businesses and organizations engaged in the production of goods and services in
New Zealand. All units are coded to a range of classifications, including institutional sector and industry (5-digit
ANZSIC). Information from the tax system is supplemented wherever possible with data from other administrative
sources, such as business directories, land registries, government actuary, etc. Name changes and group structures are
kept up to date with information from the companies’ office. Several size indicators, including annual turnover and
number of employees, are updated monthly from administrative sources for use in selecting survey populations,
stratifying samples, and defining imputation groups. The development of a comprehensive business register has several
benefits for the integration of economic statistics:
• All business survey populations are drawn from the same register, so their target populations are complete and
consistent. Sample selection, stratification, imputation and estimation use the same information, so standard
methods can be applied; and
• All sample units for surveys are selected from the business register and all administrative data is matched to it,
so all business records take the classifications that have already been assigned to them on the register. This
contributes to the coherence of economic statistics by ensuring that unit models and classifications are applied
consistently to all business data that feeds into the macro accounts, regardless of the source.
2. Statistics New Zealand has established a Classifications and Standards division to take the responsibility for
developing standard classifications, sometimes in joint projects with the Australian Bureau of Statistics. A Standards
Governance Board was established to ensure that standard classifications are used in as many data collections as
possible.
3. While building statistical infrastructure and developing integrated data collections, Statistics New Zealand has
continued to apply best practice principles to the compilation of National Accounts and Balance of Payments statistics.
Current price annual accounts are compiled within a supply and use framework in which estimates from supply and
demand sides of the economy are confronted and reconciled at the product level. This approach improves the coherence
of key national accounts measures, such as gross national income, gross national expenditure, national disposable
income, and their components. The combination of a comprehensive business register and economy wide economy
survey has eliminated the need for benchmarking to five-yearly economic censuses, as the aggregates from the Annual
Enterprise Survey are of sufficient quality to be incorporated directly into the national accounts. The next challenge is
to expand the range of accounts being produced.
99
D. Surveys and administrative data sources
1. Statistical collection and common language
5.69 The implementation of an effective collection system requires giving particular attention to two
essential elements. The first element is related to the frame of statistical units to be measured. The frame is
the backbone of the statistical system. It represents what must be regularly measured by the statistical
system. Its coverage must be as complete as possible and reflect the organizational structure of all statistical
units of the economy. Where it is not possible to implement a central frame, efforts must be made to put in
place an environment that has the characteristics of a central frame.
5.70 Before the collection stage can begin, there is a need to prioritise; making a choice between what is
required for users that are only focusing on a segment of the economy and the needs of those focusing on the
overall economy. Because of the importance to produce a complete set of integrated sets of statistics for the
whole economy, the priority should be to collect, at a minimum, aggregate statistics for the economy. These
statistics would be collected at a high frequency. Many of these statistics would be available from
administrative data sources in order to minimize costs and response burden. Because of the need to use
administrative data sources in the production of economic statistics, administrative data concepts, definitions
and classifications should be incorporated into the statistical system and aligned to those already in place,
adding to the common language.
5.71 The frequency would depend on factors such as size or the use of the statistics to administer
government programs. Lower level data could be collected less frequently. The pace of structural changes in
economic activity or the need to understand emerging issues are, among other factors that would influence
the frequency of collection.
5.72 The second element has to do with concepts, definitions and classifications. It includes mappings
between concepts, definitions and classifications used by the statistical system and those commonly used
outside of the statistical system. It deals as much with data to be collected than data to be derived. The
second element is essentially to ensure the presence of a common language among the various areas that
compose the statistical system. The ultimate goal is to ensure consistency in the content of questionnaires of
all programs.
5.73 The content of questionnaires should be integrated across all surveys, but the focus will differ from
programme to programme. The focus of some questionnaires could be to collect data from enterprises while
others would be focusing on establishments. The questions should be metadata-driven to ensure a specific
topic is treated the same way throughout the programs. Depending of the frequency at which some
information is collected, the questionnaires would contain modules that can be added or removed rapidly.
100
The questions would be aligned with accounting records of enterprises and enterprise and the survey results
would easily transformed into economic variables required by the statistical system.
5.74 The approach for sending questionnaires to respondents should take into account their preferences.
Respondents do not like to receive a large number of of questionnaires in a staggered way. They prefer a
unique questionnaire, often an electronic but printable questionnaire, which covers all the information they
must provide. Since many firms have difficulty providing information for the lowest of their production
entities, survey should be able to get that information directly from the enterprises.
5.75 In order to ensure enough flexibility within the statistical system and a capacity to react quickly in
covering new areas, it is crucial to design processes that can be reused. This pertains to all survey-taking
processes such as sampling, questionnaires design as well as editing, imputation and reconciliation processes.
5.76 Once a comprehensive business register is in place, an economy-wide annual economic data
collection interspersed with infra-annual collections can be developed with the following benefits:
• Comprehensive coverage of the entire economy and capability of ensuring data for the macro
accounts and component data that deliver a consistent and coherent assessment for the various
segments of the economy at different points in time;
• Consistent data collected from across the economy with a core set of variables collected from all
units in the annual and infra-annual collections;
• Survey questionnaires designed to collect both the general data items and the additional information
needed to calculate core national accounts variables;
• Survey and administrative variables aggregated to national accounts variables prior to data editing,
which allows analysts to check and explain unusual movements in both general variables and
specific national accounting aggregates as a normal part of data checking, and consequently keeping
to a minimum the need for the national accountants to check unit record data;
• The combination of a comprehensive business register and an annual economy-wide economic
survey reducing the need of conducting frequent economic censuses required to recalibrate the level
of macroeconomic statistics, notably in the national accounts; and
• Consistency between the annual and infra-annual collections.
101
2. 2. Questionnaire design
a. Principles of questionnaire design
5.77 Integrated questionnaires and questionnaire design play a central role in the data collection process
as they have a major impact on respondent behavior, interviewer performance, collection cost and respondent
relations and therefore on data quality. These impacts are critical for on-going and longitudinal surveys.
5.78 The development of a questionnaire assumes that in the period leading to its development, a
thorough process was followed to evaluate and prioritise the need what data to collect. It also assumes that
the data to be collected will have an economic significance of their own and, in the context of other data
within the statistical system, will also add to the coherence and the completeness of the macroeconomic
statistical system.
5.79 Before collection can occur, a sample must first be identified and a series of questions must be
established. To the extent the sample is representative and the questions are adapted to the capacity of
respondents to answer the questions, assuming a sound methodology, the quality of the survey results should
be adequate, particularly regarding response accuracy. It does not necessarily mean the data will be coherent
with other data of the statistical system.
5.80 A questionnaire is a set of questions designed to collect information from a respondent. With the
increase of administrative data, questionnaires should be developed with the possibility that part of the
survey results will be provided by respondents while another part will originate from administrative sources.
This way, a new questionnaire may not be required if the data to be collected become available from
administrative sources.
5.81 The collection of statistical information needs to be organized by moving from a stovepipe approach
towards and integrated approach. In a stovepipe model where each programme collects information on its
own and for its own purposes, an entity surveyed may be asked the same questions with different definitions.
There could be the case of a manufacturing survey asking questions about the number of workers and a
labour survey asking similar questions but using different definitions. This approach does not only increase
survey burden, but is likely to produce labour statistics that are difficult to align. In contrast, integrated
questionnaire design and integrated surveys help to resolve these data collection issues. In Case study 5.6 the
national practice of integrated surveys system of Mexico is presented.
102
Case study 5.6 An integrated economic surveys system: The Mexican approach The general objective of INEGI Mexico’s National Economic Surveys is to provide useful, high quality and timely
primary statistics through continuous surveys. These surveys are integrated with economic censuses and administrative
registers in order to satisfy national and international data needs for statistical information and satisfy national accounts
requirements. They offer the user data on specific segments of the Mexican economy and are data inputs in the
compilation of national accounts.
Economic surveys were initially undertaken using different conceptual frames and questionnaires with limited
integration between economic censuses, the monthly and annual surveys. Being separate collection exercises, the
response burden could become significant for those sampled enterprises engaged in different industries (manufacturing,
commerce, services), when repeatedly included in the selected samples for the different industries. The field operations
were not cost effective, because of duplications in information collected and the long travel distances between
establishments operating in the same industry. Moreover, the separate survey operations rendered irregular work load
for the interviewers.
In contrast, with the introduction of the INEGI Mexico’s National Economic Surveys, common concepts, definitions
and classification were adopted across the surveys based on international standards and recommendations. Also the
response burden and cost of operations were reduced with the adoption of a common survey system. Common
estimation methods for editing, validation and processing were introduced. Moreover, being a continuous field
operation, the work flow could be better managed across the year.
Overall the benefits of the introduction of an integrated data collection scheme for economic statistics can be
summarized as the optimization of resources and time; the increased knowledge of field staff in managing and operating
the field operations; the reduction of data providers’ load; the increased cost effectiveness; and staff in the central office
becoming specialized in questionnaire and sample design and in the application of data estimation and analysis
techniques.
Source: The integrated approach to economic statistics: The Mexican approach. Presentation by INEGI Mexico at the
Workshop of the Friends of the Chair on Integrated Economic Statistics, Berne, 6-8 June 2007
103
5.82 There is a need to use common concepts, terminology and classifications in designing
questionnaires. Without uniformity, comparability is not possible. Major causes of differences in statistics
come from the use of different basic concepts such as on units and transactions. Their harmonization is
valuable as it will reduce these differences and result in a more coherent and consistent set of data outputs.
5.83 The questionnaire can greatly contribute to the overall efficiency of the statistical system. A well-
designed questionnaire will impact the statistical system in many ways. It helps minimise response burden
and make collection more efficient by ensuring a minimum number of response and non-response errors. A
well-designed questionnaire should facilitate the coding and capture of data and minimize the amount of
edits and imputation. Finally, the questionnaire should minimize costs and time associated with data
collection and processing. Preference should be given to electronic data reporting, due to the potential cost
saving. An instruction guide should always be provided to respondents. For complex enterprises, special
arrangements should be put in place. Dedicated staff should be assigned to conduct data collection for
complex enterprise groups on a wide range of topics. This staff would also be responsible for regularly
reviewing the profile of the enterprise groups.
5.84 Statistical agencies should allocate resources to test questionnaires before they are put in the field.
The testing should provide insights into how respondents react to a questionnaire. The testing can be done
via a focus group, one-on-one interviews, with the focus on testing and evaluating the wording of the
questions, sequencing format and assessing alternate wording of questions. Wording and concepts should be
aligned to those already in use within the organisation. This should be reflected in both the questions and the
reporting guide which should be short and clear.
5.85 Cognitive methods can also be used to examine respondents thought process as they answer the
survey questions and ascertain whether or not respondents understand the meaning of the questions. In
countries where there are many official languages, testing should be conducted in all official languages
before implementation. Ideally, a pilot test would be conducted to observe all survey operations working
together, including the administration of the questionnaire.
b. Questionnaire database
5.86 The integrated questionnaire should be viewed as a database containing all questions about
production and financial variables or other characteristics which might be asked from the various entities in
scope, the enterprises and/or establishments. A strategic goal should be to eliminate duplicate data requests
through a strategy centered on enterprises and a series of questionnaires with a common look and feel. The
104
questions need to be grouped in “modules” covering the major categories of information normally requested
on business surveys; revenues, expenses, balance sheet items, capital expenditures, employment, commodity
inputs and outputs, class of customers, destination of shipments (turnovers)/sales, etc. The questions should
contain a flag indicating if the questions are aimed at the enterprise or the establishment. Ideally, the
questions would indicate whether they are best answered by the comptroller, the payroll manager, the
production manager or some other officer. The production manager most likely knows about the material
inputs in his unit but may not have all the information about services inputs which are often under the
responsibility of another unit within that enterprise. Since the business register contains information about
enterprises, or enterprises and establishments or simple units, the database should be constructed so that
variables can be associated with these types of entities.
5.87 The questionnaire database can be grouped in four categories. The first category consist of a series of
identifiers such as the name of the survey, industry codes, questionnaires identifiers and the dates the
publication will eventually be released.
5.88 The second category deals with survey content or rules:
• all questions for all surveys are to be stored using reference numbers;
• each reference number would outline one single concept;
• each single concept can only be represented by one reference number;
• reference numbers are to be shared by surveys to collect and process data;
• sharing information and coherence analysis for large enterprises receiving multiple questionnaires;
• a generic description for every reference number defining the concept to be measured; and
• survey specific descriptions if the wording differs from the generic description.
5.89 The third category deals with the values collected. Questionnaire cells should be assigned a domain
value when they are created. The cell type could be numerical or character. The expected length of the
numbers could be pre-specified. The cell may indicate an expected range of value.
5.90 The fourth category would provide edit collection specifications such as:
• the edit number and its description;
• edit failure formulas;
105
• edit messages;
• severity of the edits;
• type of edits i.e. based on historical or collected data; and
• edit action flag indicating suspicious data have been confirmed with respondents.
c. Metadata system
5.91 The implementation of a metadata system is an important prerequisite in developing an integrated
questionnaire in the statistical system. The metadata will eventually provide the necessary coherence
between the various estimates and data collection tools leading to the production of the statistical
information. For ultimate users, metadata are not only about concepts related to units, variables and
classifications, metadata are also about quality. The metadata structure covers the following items: statistical
description, unit of reference, reference period, institutional mandate, confidentiality, release policy,
frequency of dissemination, dissemination format, accessibility of documentation, quality management,
relevance, data accuracy and reliability, timeliness, comparability, coherence, cost and response burden, data
revision and statistical processing.
5.92 Metadata have a central role in the data production infrastructure that will greatly enhance the
efficiency of the statistical system. From the very beginning of the statistical process the metadata support
collection as well as post-collection processing and support activities in the various collection stages.
d. Questionnaire grouping
5.93 There are many ways to categorise the questions in the database. For example, they could be grouped
according to four categories of questions. The first questionnaire would target enterprises and would include
a set of standard questions on consolidated income, expenses (including purchased services), balance sheet
items, investment and employment for the whole enterprise. The second questionnaire would in fact be a
portrait of the enterprise showing the structure of the enterprise as generated by the business register. It
would show the legal and the operating structure of the enterprise to be confirmed or updated by the
respondent. The third questionnaire would still be enterprise-driven but would only collect information on
few basic variables for each establishment needed to calculate value added. The value of these variables
would be reconciled with the statistics obtained from a fourth questionnaire which would be establishment-
based. On that questionnaire, in addition to some basic questions on revenue and expenses at a fairly
aggregate level, the questionnaire would contain modules to collect more detailed data such as on destination
of production or employment.
106
5.94 In countries where survey data can be substituted by administrative data sources, a strategy focusing
on mainly two questionnaires could be envisaged. The first questionnaire would be dedicated to collecting
data at the enterprise or establishment level from the very complex businesses for which financial data
cannot be obtained from administrative data or some key information is not available such as information by
region. It would be a collection vehicle containing all questions on financial as well as characteristics-
information. The second questionnaire would be a simplified version of the first, dedicated to the collection
of industry-specific commodity or characteristics data at the establishment level. This questionnaire would
target the majority of businesses that have simple structures with their financial information coming from
administrative tax data and made up of a number of modules, each dedicated to collecting a specific type of
characteristic (e.g. input or output commodities, destination of production, qualitative type of information).
5.95 Both questionnaire types would be customised in the following ways. For complex businesses,
specialists in subject matter divisions would be able to customize the questionnaire in order to capture data
for the entire enterprise. The module dedicated to the capture of characteristic information could be
customized by industry or activity. For collecting characteristics information for a simple business, the
respondent would only receive the characteristics modules applicable to its industry/activity.
5.96 All the variables need to be aligned to statistical information from administrative sources, to the
extent they exist in the administrative database. Administrative data sources may not offer the required detail
concerning expenses related to professional business services but could provide a value at that level. Despite
the potential difficulties of aligning business accounting data and variables required for the statistical
programs, the strategy requires building mappings, often referred to as “chart of accounts”, between these
data. The chart of accounts is a tool linking business accounting statistics with various statistical accounting
frameworks supported by the statistical agencies. It greatly facilitates linkages between business accounts -
balance sheets and income statements - economic variables and national accounts statistics. Building a chart
of accounts will require the assistance of staff very knowledgeable of accounting practices.
5.97 Special attention should be given to surveys conducted outside the scope of the statistical agencies.
In many countries, even where the statistical system is centralised, many surveys are conducted in
departments specialised in specific industry field. For example, the department of natural resources could
conduct surveys on the mining sector. This could also occur when the subject matter falls under the
jurisdiction of another government agency. Formal agreement should be developed between these
organizations and the NSO to ensure compatibility of the questions. In order to determine questionnaire
content, consultations with the various subject matter areas are required. To ensure that response burden is
kept to a minimum, national accounts compilers must be active participants in determining the content and
prioritising the information.
107
3. Use of administrative data sources
5.98 The use of administrative data has become a cornerstone of many business statistics programmes in
many countries. The reliance on administrative sources has increased considerably to the point where they
now play a major role in the production of sub-annual and annual statistics while representing a reliable
source of information to update frame registers. First, they represent a relatively inexpensive source of
information compared to surveys and censuses, an important factor for statistical agencies dealing with
tightening budgets. Administrative records allow reducing burden of statistical inquiries. Administrative
records can be adapted and used in overall survey process for validation purposes by comparing them against
data collected by other methods, e.g. surveys. They can be used to replace survey data and in the absence of
information, such as non-response, administrative data can be useful in the imputation process. Finally, with
the increasing demand to produce statistics for small area where sample surveys may be difficult to
implement, administrative records represent a useful alternative. Case study 5.7 presents the national
practices of Brazil in the use of administrative sources to produce business statistics.
108

Case study 5.7 Use of administrative sources to produce structural business statistics: the Brazilian case
The first quarter of the 1990s was a period of intense structural changes in the Brazilian economy due to the increasing
opening of the economy, the intensification of the industrial restructuring process, the large dissemination of
information and communication technologies and the multiple extension of outsourcing practices. In such environment
increased the demand for updated and diversified economic data. It became clear the inadequacy of the Brazilian
traditional economic statistics system organization to respond to this demand. The lack of updated structural data was
evident. In the mid-nineties, the 1985 Economic Census was the sole reference for structural data. The annual survey
system turned out to be unable to answer the demand for updated structural business data in the inter-census period.
And, at last, for reasons of budget restrictions, the 1990 Economic Census was postponed for several years.
Under these circumstances, it was clear the need to revise the model and the procedures until then adopted in the
production of economic statistics, looking for other alternatives suitable to respond to the challenge faced by IBGE on
how to produce, at a compatible cost with the environment of short resources, a set of integrated economic data that
could meet the demand for more updated, diversified and of good quality economic data.
The solution was the rationalization of the system with wide use of sampling surveys and the articulation with
administrative files and data.
In the mid-1990s, the size of the Brazilian business sector (formal sector) was already quite large, summing around 3
million enterprises, and representing around 50% of the GDP. The greatest part was made up of small businesses with
relatively small participation in production. This feature of the Brazilian business organization was well revealed by
1985 Economic Census: 3, 7 % of total enterprises responded for 86, 4 % of the revenue and 59, 4 % of the employment
in the surveyed Business Sector. In 1995, business units with less than 20 employees represented 96.4% of the universe
of 3 million active enterprises registered at the Internal Revenue Services, but only 39.6% of the formal business
employment.
As the main aim of economic statistics is the measurement of the economic activity, by annual, quarterly and monthly
surveys, it became clear that the design of economic surveys should take into account the uneven weighting in the
business universe. Census operations surveying all enterprises are inevitably expensive and long lasting, but not
necessarily the most efficient way to provide updated data on the structure of the economy. The crucial question was
then how to develop and maintain an updated statistical business register covering the universe of enterprises to serve as
central frame for sample design. Articulation with administrative files covering the universe of enterprises of the
country was essential. Since the nineteen seventies, Federal Government had started the process of computerizing their
administrative files and records. A consequence was the improving of the effectiveness in the coverage of the business
universe. Since the nineteen eighties, IBGE has had access to individual business information from administrative files
of Labor Ministry. The Program of Modernization of the Economic Surveys was then designed and implemented by
IBGE, involving the transition to an integrated system of business surveys whose sample design is based in a central
business register comprehensive of all business units in the country, systematically updated by the merging of data from
IBGE surveys and from administrative files of Labor Ministry.
109
a. Dealings with administrative authorities
5.99 In many countries, the reliance on administrative data has reached such level that the statistical
system would significantly be affected if administrative records were to disappear. With the increasing role
of administrative data in the overall statistical system, clear arrangements between statistical offices and
administrative authorities must be in place and reviewed regularly to ensure continuity of the use of these
important data sources in the statistical system. Some form of agreements should exist between the
administrative authorities and the NSO setting out the rights and responsibilities of both parties. The
agreements should contain clauses about confidentiality, coding, data transfers and their frequency and the
content of the administrative database. Strict measures should be taken within the statistical agencies to
ensure the administrative data records remain confidential, are treated as survey micro data and used only for
statistical purposes. Access to micro records should only be given to staff involved in survey-taking
activities. Staff in the various programmes of the statistical agencies will demand access to the data because
of the great potential of the data for various compilation purposes or analytical purposes. Consequently, staff
responsible for the administrative data should be mandated to compile aggregate information, vetted for
confidentiality, so the data can be used in a broader context elsewhere in the statistical agencies. There will
always be cases where in order to perform a study, research or record linkages, it will be necessary to give
access to the micro administrative data to non-survey staff. A protocol should exist to evaluate this type of
requests.
5.100 Statistical agencies should always be in a position to demonstrate to administrative authorities that
strict measures are in place to protect the confidentiality of the data. Protocols describing specific processes
to transmit the data to the statistical agencies, the storage of the data, their use and reasons for their use and
steps to ensure the confidentiality or any residual disclosure related to the micro data as well as aggregates
compiled from administrative sources need to be in place. There are likely to be legal restrictions on
accessing, using and sharing data from administrative sources. In such cases, new legislation could enable
bilateral data sharing arrangements to be set up between the statistical office and other government
departments or public bodies.
5.101 Ideally, access to the administrative sources should be guaranteed by legislation. Legislation is not a
sufficient condition for the productive use of administrative records. A co-operative approach to the
development and utilisation of administrative records for statistical purposes is likely to be far more effective
in obtaining access to administrative records than an approach involving legal arguments. Managers in
organisations gathering administrative information must be sensitive to the importance of the data and
contribution to the overall statistical system. The development of a good working relationship with these
110
managers will facilitate exchange of information about data quality, making easier to identify and solve
problems as they arise.
5.102 The expertise of the statistical agencies in managing data processes may be beneficial to
organizations responsible for collecting and maintaining administrative databases. Efforts should be made to
share that experience in order to help administrative departments streamline their operations and improve the
quality of their data and coding. As for survey data, the statistical agencies should deal cautiously with the
confidentiality of administrative records.
5.103 The purpose of statistical information collection is quite different from the purpose of administrative
databases. It is to learn about levels, trends and relationships. In the statistical system the micro records that
compose the aggregates are held confidential and are never used to determine any action that would affect an
individual or an entity. Since statistical and administrative records should be treated the same, statistical
agencies should make it clear to organisations providing administrative data that the statistical agencies will
refrain from providing feedback that would translate into administrative actions vis-à-vis an individual or
entity.
b. Advantages and limitations of administrative records
5.104 Administrative data exist in response to legislation and regulation. As for the use of administrative
data for statistical purposes, one should take into consideration that administrative data cover specific
segments of the economic activity and are defined specifically to administer government programmes.
Consequently, administrative data may not always fit the exact needs of statistical agencies.
5.105 One of the main advantages of administrative data is that these allow statistical agencies to acquire
statistical information at a relatively low cost and to reduce response burden significantly. They also have the
advantage of covering a complete segment of the economy, often the whole economy. Due to the
administrative character of the data, non-response is normally negligible and data are subject to substantial
scrutiny, which should make them accurate. They are not subject to sampling errors.
5.106 Administrative records have limitations. Individuals and/or entities may not be required to report at
common intervals. Some data may be reported monthly while others quarterly, even annually. Annual data
may be presented on a calendar year basis, or on a fiscal year basis. Their availability may not align well
with data release deadlines of the statistical agencies. There may be delays before the data can be used and
procedures may be required to allocate the records in the proper period. The intended coverage of
administrative data may not satisfy well the needs of the NSO. The quality and some of the characteristics of
the data may be difficult to establish as the data are reported and processed in the organizations assembling
the administrative data.
111
5.107 It is necessary to examine the quality characteristics of individual sets of administrative records. The
coverage and content of administrative records can be subject to discontinuities resulting from changes in
regulations or administrative practices. Also, variables from administrative sources may not all receive the
same attention. For example, revenues may be examined closely but less effort may be devoted ensuring the
industry codes are correct. Discrepancies may arise between administrative concepts and statistical concepts.
As the administrative processes are not under statistical office control, concepts regarding variables and units
in respect of data coverage, content, quality and consistency may not comply with the needs of the statistical
system, limiting the use of administrative data for statistical estimation and analysis purposes. The difficulty
of matching administrative and statistical records will also limit the use of administrative records. Statistical
agencies should investigate all these issues thoroughly before they start using administrative records on a
large scale. It is possible that administrative sources arrive at the statistical agencies in an aggregated form.
For example, statistics about education on primary schools may be available at an aggregate level only. In
such a case, statistical agencies should obtain information about how the data were assembled.
c. Mapping of concepts and definitions of administrative sources with statistical uses
5.108 In order to make administrative records useful to statisticians, it is necessary to build mappings
showing how the concepts, definitions and classifications of administrative data can approximate the
economic variables required by the statistical system. For example, chart of accounts or mappings should be
established between the business accounting type data reported to administrative authorities and economic
variables of the statistical agencies. Methodologies should be developed on how the administrative data can
be used as extrapolators for economic data collected from official surveys and censuses using economic
accounting concepts and definitions.
5.109 Aligning concepts and definitions of administrative sources to those of the statistical agencies is a
necessary criterion for their use in the statistical system. There will be instances in which classifications and
definitions might need to be changed in order that the administrative data can be integrated with data from
surveys or other administrative sources. The definition of units covered in administrative sources often does
not align well with the definition used in the statistical system. The legal entity is often the concept used by
administrative authorities while the concept of enterprise and establishment is used by statistical agencies.
Moreover, entities can be identified differently in the various administrative databases. Consequently, one of
the prerequisites in using administrative data is to establish rigorous mappings between the various structures
of entities maintained by administrative departments and the statistical agencies. This mapping is necessary
to ensure that there is no duplication in coverage and that it will be possible to match up information from
various sources. In countries where a unique identifier is used by all administrative authorities to identify a
112
firm, the use of a unique identifier will greatly facilitate the integration of the administrative records into the
statistical system.
d. Other types of administrative data
5.110 Administrative databases represent excellent sources of information. However, other similar sources
of information should also be considered for use in the statistical system. For example, in the cases of public
enterprises and public quasi-corporations, reports to government such as income statements may be a basic
source of information about the production and financial status of these entities. Statistical offices may be
also able to obtain access to such type of data from the private sector. For example, information related to
credit cards may be a useful and rich source of information to estimate consumer spending, or data on room
vacancy could be a good indicator of accommodation services. Private sector data suppliers operate on a
commercial basis so the transfer of data from them to the statistical offices may take the form of a contract
with a payment of a fee. The data collected by private sector data suppliers can serve as an important
supplement to the official statistics, either as extrapolators or for use in validating estimates from preliminary
survey data. Such secondary source data, however, should be carefully examined for their scope and
coverage and considered for use only when found to be of acceptable quality.
E. Dissemination and communication
1. Dissemination
5.111 Critical to integrated economic statistics is the component of the statistical production process on
dissemination and communication. It is a critical component, because users ultimately benefit at this final
stage from the information services provided by statistical agencies.
5.112 Dissemination and communication are different but intertwined aspects of the ultimate output of the
statistical production process. Dissemination provides accessibility to statistical data and metadata through
hard copy publications, web-based databases and other means and ensures the transparent and impartial
release of consistent and coherent data to all users at the same time according to pre-announced release
calendars. Moreover, in considering data dissemination, the underlying technology should be kept in view.
5.113 Traditionally, dissemination is seen as a technical production element of the statistical production
process to provide accessibility to data and release numbers mainly to the more specialized and educated
users. According to this dissemination approach, it is assumed that the users have the ability to apply
analytical techniques to extract and interpret the information the statistics contain. Therefore, dissemination
can primarily focus on a one-way communication of numbers to the users without providing much narrative
or visualisation.
113
5.114 The integration of economic statistics requires changing the way dissemination and communication
are handled in the statistical production process. With the widespread use of the Internet and greater
accessibility of low cost communication and visualisation tools, many statistical agencies are introducing an
active two-way statistical communication with a much broader spectrum of users for the dissemination of
data. This statistical dissemination and communication goes beyond providing accessibility to numbers and
introduces a continuous dialogue about how the practical utility and relevance of the information the
statistics contain can best be presented. The statistical communication will be based on the dissemination of
data and metadata and supported with statistical narratives and visualization, since good practices
demonstrate that an increased number and diversity of end-users can be reached by including information
about the content and interpretation of the statistics disseminated.
5.115 The purpose of producing integrated economic statistics is that users benefit from comprehensive,
consistent, accurate, and reliable information disseminated on a timely basis, at a reduced burden and cost to
those involved in the process, especially data source providers and compilers but also statistical
communication experts. Integration of the production of economic statistics adds value to users by the
dissemination of information in an understandable and comprehensive format that meets their analytical
needs and enables conclusions to be drawn about the content, structural linkages and quality of the
disseminated data. An integrated dissemination in the presentation of an integrated set of macroeconomic and
detailed component structural and short-term statistics will benefit the users, in creating a better
understanding of the disseminated statistics and reinforcing messages for evidence-based policy and decision
making.
5.116 Dissemination is about accessibility of statistical information in user-friendly and consistent
presentations of data across publications, electronic sources and websites. It is also to explain data to users,
by making metadata available and to announce the schedule of releases of data in the form of an advance
release calendar. Such information may be provided for the forthcoming period on a weekly, monthly,
quarterly or annual basis. This advance release calendar provides prior notice of the release dates on which
the statistical agency undertakes to release specific statistical information to the public.
5.117 The accessibility requirement in dissemination relates to the need for data and metadata to be
presented in a clear and understandable manner on an easily-available, timely and impartial basis. It should
be ensured that up-to-date and relevant metadata and a prompt and knowledgeable support service are
available. An efficient dissemination practice is composed of the following three elements: data accessibility,
metadata accessibility, and assistance to users.
114
5.118 Data accessibility for integrated economic statistics should have data formats that are consistent to
enable navigation across sources of dissemination. Integrated economic statistics should be presented in a
way that facilitates proper interpretation and meaningful comparisons. The layout should be clear and well
structured, following internationally standardised methodologies. Descriptive text should also be clear, and
should accompany tables and charts containing data and perhaps be augmented by analytically-useful
applications of the data. Moreover, the statistics should be released in a pre-announced schedule. The
statistics also should be made available to all users at the same time, but statistics that are not routinely
disseminated can be made available on request. The data should be available in electronic format.
5.119 Metadata accessibility provides for documentation on, concepts, scope, classifications, basis of
recording, data sources, and statistical techniques which are available and noting differences from
internationally accepted statistical methodologies, standards, guidelines, and good practices. For integrated
economic statistics, these metadata should include references and links to the data, as well as cross-
references and links across datasets. Ideally the metadata should be available in electronic format. Metadata
should be available in a number of user-friendly formats (for example, as “Frequently-Asked Questions”) at
different levels of technical detail to meet different user needs.
5.120 Prompt and knowledgeable support services should be provided to assist users in a timely manner.
Contact points for each data set should be adequately publicised. Catalogues of publications, documents, and
websites, as well as other services that are available to users, including information on changes to data,
metadata, and dissemination practices should be widely available. Users should be fully informed of any data
that are made available on request. Users would benefit from explanations and examples in integrated
economic statistics, to note the coherence in concepts. Such clarifications can provide data reconciliations,
bridge tables, or distinguish differences in coverage, time of recording, and in other factors that may lead to
statistical discrepancies.
5.121 Good dissemination practices also require the identification of user needs for the release of data with
the appropriate periodicity (daily, weekly, monthly, quarterly, or annually, etc.) and with the adequate
timeliness. By definition, such data should be internally consistent within a dataset and across major data
sets. This means that the data should be reconcilable (through horizontal and vertical consistency checks)
within a reasonable period of time. The data should also be comparable among alternative macroeconomic
datasets. Data revisions should follow regular, well-announced, and transparent schedules. Preliminary data
should be distinguished clearly for users from any subsequent revisions or final data. Good practices for
serviceability of the data suggests that revision studies that compare changes in released data over time
should be released to the public in a transparent and equitable manner.
115
5.122 To further enhance the accessibility and presentation of data and metadata to users, the next logical
step to enhance these data and metadata is the adoption of the internationally endorsed Statistical Data and
Metadata eXchange (SDMX). Specifically, users need to easily and cheaply share, exchange, understand,
and be able to reuse the data and metadata for their own purposes. Some of these aspects concern
presentation of the information, the length of historical data, and electronic access.
5.123 The SDMX standards are designed for exchange or sharing of statistical information between two or
more partners. The SDMX standards have been developed by the sponsoring organisations in order to
accommodate. The standards are intended for reporting or sharing statistical data and metadata in the most
efficient way, within national statistical offices, central banks, ministries and other agencies. SDMX
standards can also be used within a national system for transmitting or sharing statistical data and metadata.
This is particularly interesting for countries with a federal structure or a fairly decentralized statistical
system. In such cases, a close link can be established between the national system for data sharing and
international ones, allowing for additional efficiency gains.
5.124 The use of SDMX for data exchange can easily evolve towards open SDMX-based dissemination;
such dissemination may respond well to user demands for well-structured data and metadata in reusable
formats, and should be considered as an option for national authorities as well as international organizations.
Good practices in adopting data exchange techniques such the SDMX could significantly improve the
usefulness of the disseminated information in its data sharing.
5.125 SDMX can also be used for data and metadata management within statistical organizations, since its
information model is applicable for much of the information stored and processed within statistical
organizations, and such organizations can make use of the SDMX information technology (IT) tools to
reduce the costs of developing their data management systems. For further details see case study 5.8.
116
Case study 5.8 Origins and Purpose of the SDMX
The Statistical Data and Metadata eXchange (SDMX) initiative was launched in 2001 by seven organizations working
on statistics at the international level: the Bank for International Settlements (BIS), the European Central Bank (ECB),
Eurostat, the International Monetary Fund (IMF), the Organisation for Economic Cooperation and Development
(OECD), the United Nations Statistical Division (UNSD) and the World Bank. These seven organizations act as the
sponsors of SDMX.
The stated aim of SDMX was to develop and use more efficient processes for exchange and sharing of statistical data
and metadata among international organizations and their member countries. To achieve this goal, SDMX provides
standard formats for data and metadata, together with content guidelines and IT architecture for exchange of data and
metadata. Organizations are free to make use of whichever elements of SDMX are most appropriate in a given case.
With the Internet and the world-wide web, the electronic exchange and sharing of data has become easier and more
common, but the exchange has often taken place in an ad hoc manner using all kinds of formats and non-standard
concepts. This creates the need for common standards and guidelines to enable more efficient processes for exchange
and sharing of statistical data and metadata. As statistical data exchange takes place continuously, the gains to be
realized from adopting common approaches are considerable both for data providers and data users.
SDMX aims to ensure that metadata always come along with the data, making the information immediately
understandable and useful. For this reason, the SDMX standards and guidelines deal with both data and metadata.
Common standards and guidelines followed by all players not only help to give easy access to statistical data, wherever
these data may be and without demanding prior agreement between two partners, but they also facilitate access to
metadata that make the data more comparable, more meaningful and generally more usable.
Source: SDMX Users Guide, p. 11. - See http://sdmx.org/
117

2. Communication
5.126 Statistical communication has evolved considerably over recent years. Traditionally, statistical
organisations focused on dissemination as a one-way communication of information through few media
channels (e.g. newspapers, radio and television). With a growing demand for statistical information from a
significantly broader group of users and the application of new technology, statistical services make
increased efforts to communicate coherent, mutually consistent and logically connected data with a higher
degree of interpretability. The extensive use of the Internet and the appearance of tools of the social media
have significantly changed the methods of communication and dissemination, as well as increased the
numbers and diversity of end-users.
5.127 Statistical systems of individual countries have a range of approaches when it comes to managing
communication functions. The placement of these functions within the organisational structure will impact
on their effectiveness and should ensure that communication of statistical data and the associated
technological infrastructure receives high level of attention from management. Increased competition from
other data producers means that there is an increasing need to improve communication from the statistical
organisations to mainstream users, such as media and policy makers, as well as hard-to-reach groups.
5.128 Most of the statistical organisations continue using the traditional way to disseminate their statistics
through publications, adding websites and other means to their methods of communication to convey the
information the statistics contain to the users in a more effective manner. The principal aim of statistical
communication is to reveal more of the information contained in statistical data to make statistical
information easier to interpret. Statistical communication is about catching the reader’s attention with a
headline or image, providing explanations behind the numbers in an easily understood, interesting and
entertaining fashion; and encouraging journalists and other users to consider how statistics might add impact
to their analysis.
5.129 Statistical communication conveys a message that tells readers what happened, when and where it
happened, and contributes to understanding why and how it happened. Statistical organisations use
communication to demonstrate the relevance of their data to government and the public. In such a way, they
can anticipate greater public support for statistical programmes, improve respondent relations and gain
greater visibility of their products.
5.130 The complexity of statistical communication depends on the aspiration level of the statistical agency
to interpret the information or knowledge the statistics contain. At the most basic form, the statistics are
presented in a traditional tabular format without any narrative. In this case, it is left to the user to apply
techniques to transform the data and establish relationships between the data to distil the information from
118
the statistics for a certain object of study based on theoretical considerations and using statistical techniques
with different levels of sophistication. At an intermediate level, for example, the SNA framework is used to
make certain macroeconomic and sectoral relationships on primary or disposable income versus
consumption, investment, trade or debt explicit in macroeconomic indicators. Such indicators might be
represented as deviations from the long term trend for analytical purposes, or alternatively, individual
macroeconomic and sectoral indicators can be analytically grouped with individual component short term
statistics based on the established properties of the component data in the past. Therefore, component data on
production, turnover, new orders, income, employment, prices, trade, money and financial indicators are
grouped with macroeconomic and sectoral indicators to demonstrate the analytical value of the indicators for
a certain subject like the international trade and housing sector and financial markets. Specifically, the
general user might be interested in this kind of analytical presentations to better understand and be educated
about the information and signals in the statistics. At the most advanced level, individual and composite
indicator sets are used to perform some type of sophisticated economic analysis. Advanced statistical and
econometric techniques are used to transform and select the individual component data to trace long term and
cyclical trends, detect turning points and explain growth.
5.131 Visualisation tools,10 in addition to statistical narratives and metadata can enhance the presentation
of data. Good practices for the dissemination of integrated economic statistics involve ample use of attractive
and informative graphs and charts accompanied by explanatory text, with well documented sources,
including corresponding links to the underlying and other related data and metadata. Demonstrating to users
how the information can be used may assist them to create and build new applications of the data and
metadata.
3. Practices of international dissemination and communication
5.132 The dissemination of integrated economic statistics benefits from an analytic framework. The IMF’s
Data Quality Assessment Framework (DQAF)11 provides such an analytical structure and contains specifics
on the dimensions of accessibility and serviceability which are directly related to dissemination.
5.133 The Special Data Dissemination Standard (SDDS) and the General Data Dissemination System
(GDDS) support good statistical dissemination practices by countries. SDDS prescribes that subscribers
disseminate 21 data categories on National Summary Data Pages (NSDPs, posted on national websites)
10 Good practices in the use of visualizations can be found on the website of the Statistics Netherlands (http://www.cbs.nl/en-GB/menu/publicaties/webpublicaties/interactief/default.htm?Languageswitch=on) 11 Information on the DQAF and the data dissemination initiatives is posted on the Fund’s Dissemination Standards Bulletin Board (DSBB) website (http://dsbb.imf.org/Default.aspx).
119
which have a standardised format to disseminate the latest two observations for each category. The SDDS
allows flexibility options and “as relevant” features, so that not all data categories are disseminated by every
subscriber. The NSDPs also may contain additional data and hyperlinks to longer time series and more
complete datasets. The SDDS also requires subscribers to disseminate a standardised Advance Release
Calendar (ARC) covering all the data categories. The implementation of NSDPs and ARCs enhances both
data and metadata accessibility, through uniform formatting, the pre-announcement of data releases in ARCs,
and simultaneous data releases on NSDPs.
5.134 At the international level, the IMF and other international agencies (the BIS, ECB, Eurostat, OECD,
and World Bank) have collaborated to create a Principal Global Indicators website
(http://www.principalglobalindicators.org/default.aspx) as a central international hub for dissemination
purposes based on good statistical dissemination practices. This website presents cross-country comparisons
of data for the G-20, with convenient data mapping facilities and links to other databases.
5.135 In a joint UNSD and Eurostat initiative, in response to the effects of the 2007 economic and financial
crisis, an updated internationally agreed data template and meta structure with 12 data categories was
moderated. It encouraged countries to make further progress in establishing national central data hubs for a
minimum core set of quarterly national accounts, high frequency economic and financial indicators, high
frequency indicators and related metadata system for early warning and macroeconomic surveillance
purposes. Apart from the inspiration from the SDDS programme, this initiative benefited in addition from the
work done by Eurostat during the last decade in the creation of Principal European Economic Indicators
(PEEI) data set12. The PEEI are an integrated presentation of quarterly and flash estimates of national
accounts with supporting high frequency statistics, in a single location for effective monitoring of the
business cycle and for macroeconomic surveillance. The internationally agreed data template further extends
the PEEI with national accounts-based indicators for the measurement of sectoral exposures and
vulnerabilities, for those countries that compile institutional sector accounts.
12 Information on the PEEI can be obtained from the statistical guide. Please see: http://epp.eurostat.ec.europa.eu/cache/ITY_OFFPUB/KS-81-08-398/EN/KS-81-08-398-EN.PDF and Eurostat’s website at, http://epp.eurostat.ec.europa.eu/portal/page/portal/euroindicators/peeis/
120
Chapter VI. IMPLEMENTATION OF INTEGRATED ECONOMIC STATISTICS
A. Introduction
6.1 For the implementation of an integrated statistical system, a broad range of actions need to be taken
to improve the coherence of the entire system, ranging from the adoption of international standards and
classifications to strengthening the institutional arrangements for statistical integration. Each country will
have to decide where it should focus its efforts depending on its priorities, resources and circumstances.
6.2 A long-term programme of integration should address all stages and all aspects of the economic
statistics. In the short-term, particular agencies will need to focus their efforts on those aspects of the system
over which they have the most control and where their efforts will have the greatest effect. Defining this
focus will require balancing benefits against costs and will vary depending on whether the statistical system
is centralised and decentralised. Statistical leadership will be important.
6.3 The programme of implementation will need to be carefully managed to avoid losing momentum,
because it will take a long time to complete full integration of economic statistics. In a centralised system,
the lead agency will be a national statistical office with a clearly specified responsibility for the integration of
economic statistics within a national statistical system. Coordinating mechanisms will vary depending on the
size of the statistics office. In a small office, this may be a coordinating committee of business unit
managers. In a larger organization, more complex arrangements will be needed, including staff appointed to
coordination and integration roles and a range of formal decision-making bodies through all levels of the
organization. A co-ordination or integration branch might be needed to develop the programme and ensure
that integration needs are taken into account whenever existing statistics are being redesigned or new
statistics are being developed. Methodology divisions may need to make the need for greater integration a
core requirement for all statistical designs. In a more decentralized statistical system, support for
standardized survey methodologies will have to be built across all participants in the economic statistics
system.
6.4 Various activities that can contribute to the integration of the economic statistics system need to be
carefully selected for the long-term implementation programme. The order in which these activities are
undertaken will vary depending on the nature of the statistical system. Implementing standards and
classifications will usually be a good place to start. Likewise, it is probably better to focus on key economic
measures at the beginning of the programme, and then broaden once initial success has been acheived.
Transforming an economic collection system, for example, transitioning a traditional programme of rolling
industry surveys and censuses spread over several years into a set of integrated collections using survey and
121
administrative data require statistical agencies to make careful decisions about the speed at which this work
can proceed.
6.5 Changes to economic data collections will generally have to be achieved within existing budgets,
timetables and programs. Getting all users and producers of statistics to agree to implement harmonised
concepts, definitions and design standards is a complex task. Business units and agencies responsible for
particular statistical outputs will have to be persuaded to adopt integration as an objective for any statistical
developments being undertaken. All these changes will have to be fitted into existing development
timetables without disrupting the publication timetable or the continuity of time series for existing outputs.
Every statistical output will have users with particular needs that need to be taken into account.
6.6 Most statistical agencies have limited resources, so attempts to make changes to the entire economic
statistics system in one project is unlikely to be practical. A more realistic approach would be a well-planned
set of gradual changes that are implemented effectively over a longer timetable.
6.7 National accounts provide the coordinating framework for integrating economic statistics to ensure
conceptual consistency as well as numerical consistency. Integrated accounts present a unified picture of all
of the aspects of the economy that are measured in the separate accounts. They have shared conventions,
definitions, and values. They allow measures in one account to be directly compared to the same or other
measures in other accounts.
6.8 The development of new integrated accounts or the continued improvement or integration of existing
accounts should be undertaken through the adoption of concepts, definitions, and methods recommended by
international standards. These standards supported by handbook and guidelines serve to harmonize economic
accounts across countries, facilitating international comparisons.
6.9 In this Chapter, it will be demonstrated how the System of National Accounts, 2008 (2008 SNA) as
international statistical standard is applied as the overall integration framework for economic statistics.
Being an accounting system for economic statistics, its integration function is based the institutional sector
accounts, the Input-Output accounts (I-O accounts) and other extensions such as the industry accounts, labor
accounts and satellite accounts. This Chapter will also point to other reference standards on economic
statistics along with the illustrative case studies of these frameworks for the integration of statistics of
specific segments and aspects of the economy. The selected country examples illustrate the range and variety
in national practices of the various aspects of implementation of integration of economic statistics.
B. Reconciliation of source data
6.10 Comprehensive and consistent source data are essential to developing accurate and reliable national
accounts. The source data for each set of integrated of accounts should correspond exactly to the concepts
122
and structure of the accounts. Moreover, these data need to be accurate in scope and coverage of units and in
time of recording and valuation.
6.11 Source data from economic surveys and censuses are generated in part to support economic
accounts. However, source data is likely to be generated for other purposes, such as tax collections, customs
and border control and financial regulations. These types of source data are generally referred to as
secondary or mixed use sources. Secondary sources include data from public authorities, often referred to as
administrative data, as well as data from private sources. Administrative data are often tabulated by
government entities as a byproduct of administering their programs – such as processing corporate tax
returns, regulating public utilities, and issuing building permits. These latter types of source data must be
adjusted and harmonized for use in the estimation of economic accounts, and may need further adjustment to
support a fully integrated system of accounts in which all of the components are fully compatible with all of
the accounts that make up the system.
6.12 Adjustments must be used to correct for a variety of source data. These include inconsistencies
among aggregates and sub-aggregates from national samples, incomplete or biased source data, differences
in the availability or gaps in the timing of source data, and differences in the classification of establishments
by agencies gathering data. There are likely to be differences in methodologies and source data used in
producing estimates for the various accounts, and systems where the responsibility for the various accounts is
divided.
6.13 The frequency with which source data are available is an important consideration in the development
of measures of economic activity. One factor affecting availability is the speed with which the source data
are collected, compiled, and released. Another factor is whether the source data are part of a statistical
programme that provides more complete or otherwise better coverage; for example, when more detailed
information is collected for a benchmark or annual survey than for quarterly or monthly surveys.
6.14 In the latter case, source data for the earliest estimates are typically incomplete, preliminary, or
missing, and trend-based projections are used to fill in the missing pieces. Subsequent revisions incorporate
later-available source data that are usually more comprehensive and from increasingly reliable sources. The
best source data may be obtained from economic censuses that are likely to be undertaken only every several
years. This ultimate data set will be annual in frequency; the earliest data may be of monthly or quarterly
frequency.
6.15 As an example, Table 1 illustrates the changing nature of the source data that supports the current
quarterly estimates of U.S. gross domestic product (GDP). For the “advance” estimate of GDP, components
that are based on survey data for all three months of the quarter account for 45 percent of the estimate;
components that are based on a mix of survey data and extrapolations (normally survey data for the first two
123
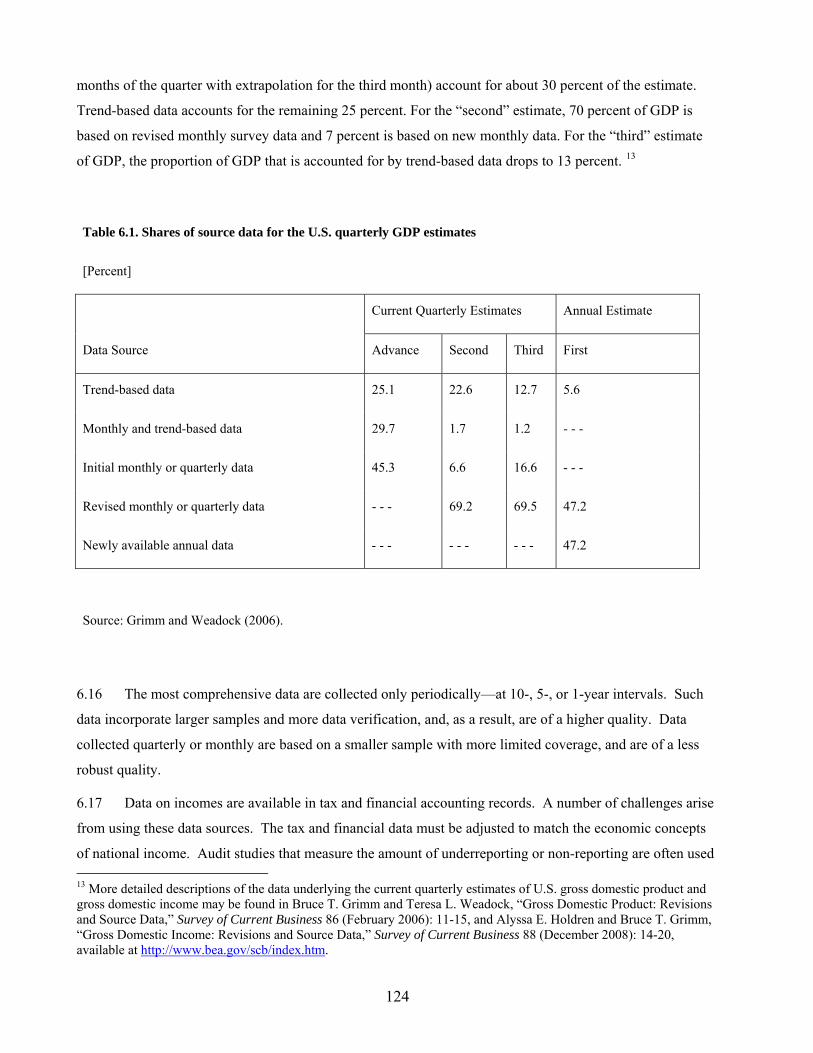
months of the quarter with extrapolation for the third month) account for about 30 percent of the estimate.
Trend-based data accounts for the remaining 25 percent. For the “second” estimate, 70 percent of GDP is
based on revised monthly survey data and 7 percent is based on new monthly data. For the “third” estimate
of GDP, the proportion of GDP that is accounted for by trend-based data drops to 13 percent. 13
Table 6.1. Shares of source data for the U.S. quarterly GDP estimates
[Percent]
Current Quarterly Estimates Annual Estimate
Data Source Advance Second Third First
Trend-based data 25.1 22.6 12.7 5.6
Monthly and trend-based data 29.7 1.7 1.2 - - -
Initial monthly or quarterly data 45.3 6.6 16.6 - - -
Revised monthly or quarterly data - - - 69.2 69.5 47.2
Newly available annual data - - - - - - - - - 47.2
Source: Grimm and Weadock (2006).
6.16 The most comprehensive data are collected only periodically—at 10-, 5-, or 1-year intervals. Such
data incorporate larger samples and more data verification, and, as a result, are of a higher quality. Data
collected quarterly or monthly are based on a smaller sample with more limited coverage, and are of a less
robust quality.
6.17 Data on incomes are available in tax and financial accounting records. A number of challenges arise
from using these data sources. The tax and financial data must be adjusted to match the economic concepts
of national income. Audit studies that measure the amount of underreporting or non-reporting are often used 13 More detailed descriptions of the data underlying the current quarterly estimates of U.S. gross domestic product and gross domestic income may be found in Bruce T. Grimm and Teresa L. Weadock, “Gross Domestic Product: Revisions and Source Data,” Survey of Current Business 86 (February 2006): 11-15, and Alyssa E. Holdren and Bruce T. Grimm, “Gross Domestic Income: Revisions and Source Data,” Survey of Current Business 88 (December 2008): 14-20, available at http://www.bea.gov/scb/index.htm.
124
to derive adjustments for the misreporting of incomes. Case study 6.1 provides further detail on a country
practice.
Case study 6.1 United States measures of compensation
1. United States measures of compensation are comprised of wages and salaries and supplements to wages and salaries.
Wage and salary estimates for the most recent quarter are based on U.S. Bureau of Labor Statistics’ (BLS) monthly
Current Employment Statistics (CES) program, which surveys about 140,000 businesses and government agencies,
representing approximately 410,000 individual worksites, and covers the employment, hours, and earnings for all
employees. The CES data do not cover certain types of irregular pay such as bonuses and stock options. Because
coverage of both the number and types of employees has varied in the past, the initial wage and salary estimates have
been subject to large revisions when more complete data become available, despite efforts to adjust for systematic bias.
2. The Quarterly Census of Employment and Wages (QCEW), which is compiled by BLS from state information as
reported by employers covering 98 percent of U.S. jobs, is the ultimate primary source of wages and salaries by industry
for the national accounts, the industry accounts, and the regional accounts (for regions, states, and counties), and
provides consistent and integrated statistics to analyze the U.S. economy. These data comprise a nearly complete
census of wages and salaries, including overtime, bonuses, stock options, and other irregular forms of compensation for
virtually all workers, and are incorporated into all but the most recent quarter’s estimates.
3. Benchmark and annual estimates of supplements to wages and salaries are comprehensive measures of all such
income. These supplements include employer contributions for U.S. government social insurance (mostly Social
Security, Medicare, and unemployment insurance) and contributions for pensions and private insurance (mostly health
insurance) and are developed using a variety of information. Estimates of government social insurance are primarily
based on data from the U.S. Social Security Administration. Estimates of contributions for private health insurance and
for state and local government health insurance are based on data from the Medical Expenditure Panel Survey (Centers
for Medicare and Medicaid Services). Estimates of contributions for federal health insurance are based on data from the
U.S. Office of Personnel Management. Estimates of contributions for private pensions and for supplemental
unemployment benefits are based on Form 5500 tabulations from the U.S. Department of Labor. (The Form 5500 is a
tax return filed by administrators of private pension and supplemental insurance plans.) Estimates of contributions for
federal pension plans are based on data from the Monthly Treasury Statement, and estimates of contributions for state
and local government pensions are based on U.S. Census Bureau annual surveys of state and local government
retirement funds. Estimates for workers’ compensation are based on data from the National Academy of Social
Insurance and A.M. Best (a private trade source).
C. Industry accounts
6.18 Consistent source data on the outputs, inputs, and value added in the production accounts by industry
(in short, industry accounts) are essential for identifying the sources of productivity and the industry breakout
of GDP growth. Industry and product classification systems establish the framework for defining production
125
and the goods and services produced. Examples of such frameworks include the International Standard
Industrial Classification of All Economic Activities (ISIC) and the Central Product Classification (CPC)
used for international comparisons, the North American Industry Classification System (NAICS) and North
American Product Classification System (NAPCS) used by Canada, Mexico, and the United States of
America, the NACE - Classification of Economic Activities in the European Community and Classification
of Products by Activity (CPA) used by the member countries of the European Community and the Australian
and New Zealand Standard Industrial Classification (ANZSIC) used by Australia and New Zealand.
6.19 Within a statistical system, adjustments may be required to treat industry and product classifications
consistently. For example, different source-data providers can have their own interpretation of industry and
product definitions, which would result in inconsistencies across datasets used to construct industry accounts.
It is important that suppliers and users of industry and product data eliminate inconsistencies to provide an
accurate and reliable description of production.
6.20 The unit of measurement should tell a consistent story about industries and production. For example,
source data collected from tax records may be on an enterprise, or company basis rather than an
establishment, or plant, basis that is more often used in surveys and that is more suitable for economic
accounts. As a result, consistency among output, inputs, and value added may require a translation from an
enterprise to an establishment basis, or vice versa. Moreover, differences in methodologies and sampling
procedures across source-data providers may require the development of a method that reconciles these
datasets based on the relative reliability of the data. This is particularly important when source-data
providers use different methods to measure the same, or similar, concepts.
6.21 Measures of industry activity are more consistent in definition and scope the more frequently the
activity is measured. In contrast, benchmark or annual industry surveys are likely to be more comprehensive,
based on a larger sample and better data verification, but there is also a greater chance that the industry has
changed markedly since the last benchmark. In other words, there are trade-offs between the frequency of a
series and the quality of a series. Case study 6.2 provides further details on the industry accounts.
126
Case study 6.2 Adjustments to industry source data to improve consistency: the United States enterprise-
establishment adjustment process
1. The unit of measurement for the United States industry accounts is the establishment. Many source-data providers in
the U.S. statistical system do not collect all data on an establishment basis. The U.S. Census Bureau prepares
quinquennial economic censuses, annual, and quarterly surveys primarily on an establishment basis. These Census
statistics are used to construct measures of outputs, inputs, and expenditures in the U.S. input-output (I-O) accounts.
The U.S. Department of the Treasury’s Internal Revenue Service (IRS) collects consolidated tax return data on an
enterprise basis. These data are used to construct Gross Domestic Income measures in the national income and product
accounts (NIPAs) and to directly construct measure of value-added by industry in the annual I-O accounts.
2. More specifically in the annual industry accounts, several subcomponents of gross operating surplus—such as
corporate profits before tax, corporate net interest, and corporate capital consumption allowance—are based on
corporate tax return data from the IRS. Because these enterprise- or company-based data may account for activities by
several establishments classified in different industries, the U.S. Bureau of Economic Analysis (BEA) must convert
them to an establishment, or plant, basis. The conversion is based on employment data for establishments from the
quinquennial economic census that is cross-classified by enterprise; this matrix breaks out the consolidated tax return
data separately for each corporate component of gross operating surplus. Corporate business income on an
establishment basis is then combined with establishment-based data on outputs, inputs, and expenditures within the I-O
framework. Inconsistencies that remain between these datasets are reconciled and harmonized through balancing the I-
O “use” table.
1. Agriculture
6.22 Concerns about food security and food prices, and the increasing demand for alternative uses of
agricultural products heighten the need for timely, reliable and high quality data to monitor progress in the
agricultural sector. A key element of the strategic plan for the development of agricultural and rural data
systems is the integration of agriculture into the national statistical system. The Global Strategy to Improve
Agricultural and Rural Statistics, endorsed by the Statistical Commission in 2010, involves identifying a
suite of methodologies for data collection, enabling the integration of agricultural and rural statistics with the
overlapping data requirements of other statistical domains (such as education, labour, health, environment),
including macroeconomic statistics and national accounts, and addressing the need to improve statistical
capacity.
6.23 The integration of agriculture into the national statistical system includes the development of a
master sample frame for agriculture, its use in an integrated survey system and the implementation of a data
management system. Integration means, on the other hand the use of common classifications and definitions.
127
For the integration of agriculture statistics countries can rely on international statistical standards and
classifications, primarily based on FAO methodological publications that provide national statistical offices
with internationally recognized definitions, concepts and classifications, to promote consistency and
comparability of information at the world level. Comprehensive publications on statistical methods and
standards in agricultural statistics cover economic accounts for food and agriculture, agricultural census
methods and standards, and sample survey methods for agricultural surveys.
6.24 The establishing of new classifications for agricultural activities and products, led by FAO, have
been carried out in parallel on three fronts: contributing FAO proposals for the Central Product
Classification (CPC), the International Standard Industrial Classification of All Economic Activities (ISIC),
and the International Standard Classification of Occupations (ISCO) the new versions of which now better
reflect the reality and needs of agriculture statistics; updating the FAO list of agricultural inputs and
products; and applying international classifications to the World Programme for the Census of Agriculture.
In the design of the World Programme for the Census of Agriculture 2010, the concepts and principles of the
SNA and ISIC have been used to define the agricultural census units, agricultural activities and the scope of
the agricultural census, moreover, a new crop list has been constructed on the basis of the principles and
structures of the CPC and ISIC.
6.25 The revised handbook A System of Economic Accounts for Food and Agriculture (FAO, 1996)
provides a broader framework to bring together various kinds of databases relating to food and agriculture in
an integrated system. The concepts and accounting structure of the system are based on the System of
National Accounts.
6.26 The Handbook on rural households’ livelihood and well-being jointly prepared by Eurostat, FAO,
OECD, UNECE and the World Bank responds to the need for better data and indicators on rural economies,
the farm household and the environment, providing a set of indicators with focus on the farm household as
primary reporting unit. (See: http://www.fao.org/fileadmin/templates/ess/pages/rural/index.htm)
6.27 The methodological publication A system of integrated agricultural censuses and surveys (FAO,
2005) provides guidance on the integrated system approach to agricultural censuses and surveys. It intends to
assist countries in the conduct of their national census of agriculture in the framework of the World
Programme for the Census of Agriculture 2010 (WCA 2010).
2. Industry and services
6.28 Data on industrial activities are required for several purposes by a variety of users including the
government, the business community, researchers and others. One of the most important purposes,
undoubtedly, is to provide a basis for assessing trends in the economy. For this purpose annual and infra-
128
annual estimates on the contribution of industrial activities to the national economy are in great demand by:
(a) policymakers, who use industrial statistics for formulation of industrial development strategies and plans
at the national and regional levels, as industrial development is important for every economy and provides
the necessary impetus for the growth of service activities; (b) business community, which uses industrial
statistics for evaluating business options, assessing opportunities for new investments and estimating market
shares for their products; (c) researchers, who study the technology employed in the production process in
terms of input-output relationships and productivity analysis by detailed economic activity, by size classes of
operating units, by geographical characteristics for regional, national and international analysis, and by
ownership structure; (d) compilers of national accounts, who make extensive use of industrial statistics
including for: (i) measuring the annual and quarterly output and value added generated by industrial activities
and (ii) compilation of supply and use tables by product and by industry and input-output tables; (e) general
public, who benefit from the availability of timely industrial statistics by using them to evaluate the
conditions of the economy, employment and income perspectives in order to make more informed decisions.
6.29 With a view to establishing a uniform pattern for the measurement of economic activities on a
comparable basis, international recommendations have been formulated by the United Nations for the
collection of statistics on a number of economic activities. These include international recommendations for
industrial statistics (United Nations, 2009a), construction (United Nations, 1997), distributive trade (United
Nations, 2009b) and index of industrial production (United Nations, 2009c). These recommendations,
amongst other things, provide definitions of data items recommended for collection and publication, together
with definitions of additional data items derived from the basic system. Compilers are encouraged to use the
list of data items as a reference in order to develop a list of data items in accordance with their own statistical
circumstances, respondent load and available resources and, after having determined the data items to be
placed on that list should use the definitions presented consistently. Statistical standards for guidelines and
recommendations on the compilation of output indicators for the services sector are available in the OECD
Compilation Manual for an Index of Services Production (OECD, 2007).
D. Input-Output accounts
6.30 The Input-Output (I-O) framework brings together components of gross value added (GVA),
industry inputs and outputs, product supply and demand, and the composition of final demand components
for the economy. This framework (in short I-O accounts) breaks the economy down to display transactions of
all goods and services between industries and final consumers for a single period (for example, a quarter or a
year). Information can be presented in two key products: Supply and Use Tables, and Symmetric Input-
Output Tables.
129
6.31 Supply and Use Tables show the whole economy by industry and products. The tables show links
between components of GVA, industry inputs and outputs, product supply and demand. Moreover, the
Supply and Use Tables contains the product balances, which links the detail of production by domestic
industries and imports with the intermediate use by industries and the final use by exports of goods and
services, government expenditure, household and NPISHs expenditure and capital formation.
6.32 Producing Supply and Use Tables allows an examination of consistency and coherency of National
Accounts components within a single detailed framework and, by incorporating the components of the three
approaches to measuring Gross Domestic Product (i.e. by production, income and expenditure) enables a
single estimate of GDP to be determined, both in current prices and constant prices.
6.33 When balanced in an integrated manner, the Supply and Use Tables also provide coherency and
consistency in linking the components of three accounts, these being:
Goods and Services Account
Production Account (by industry and by institutional sector)
Generation of Income Account (by industry and by institutional sector)
6.34 Symmetric Input-Output Tables are derived from the data in the Supply and Use Tables and other
additional sources to form the theoretical basis for subsequent analyses. These tables contain symmetric
(product by product or industry by industry) tables, Leontief Inverse and other diagnostic analyses such as
output and employment multipliers. These tables show separately the consumption of domestically produced
and imported goods and services, providing a theoretical framework for further structural analysis of the
economy, the composition and the effect of changes in final demand on the economy. The case study 6.3
provides further details on the development and use of the I-O Account.
130
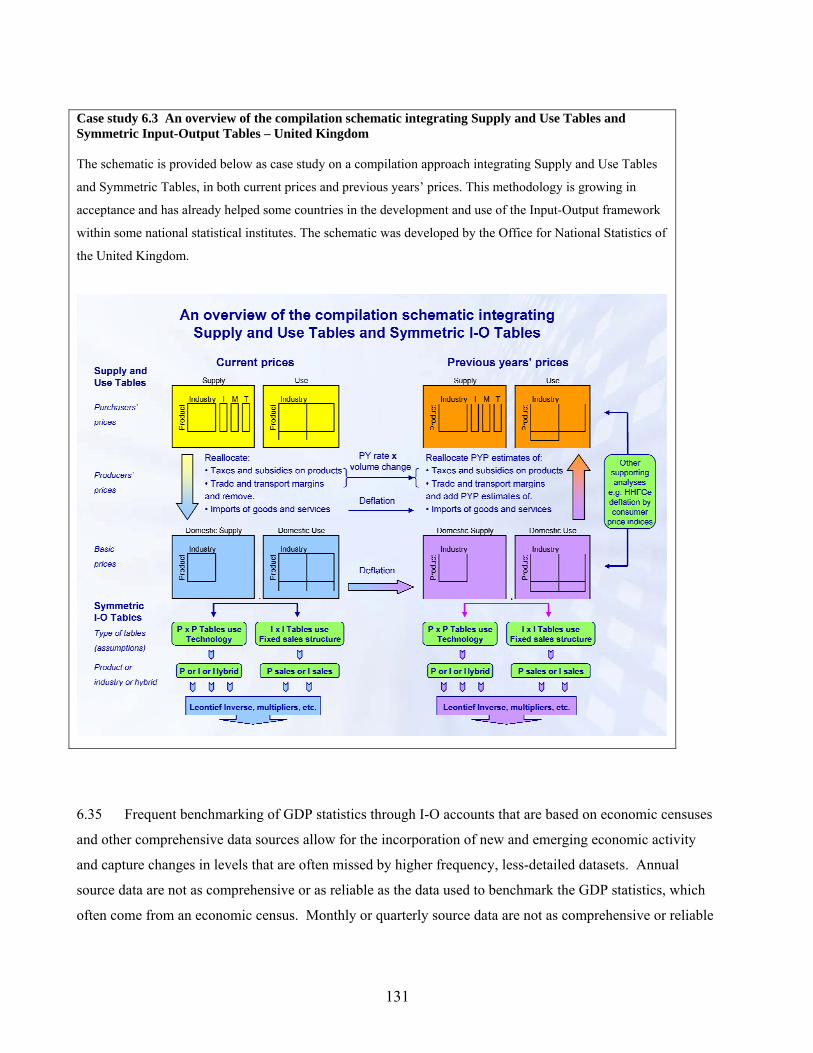
Case study 6.3 An overview of the compilation schematic integrating Supply and Use Tables and Symmetric Input-Output Tables – United Kingdom The schematic is provided below as case study on a compilation approach integrating Supply and Use Tables
and Symmetric Tables, in both current prices and previous years’ prices. This methodology is growing in
acceptance and has already helped some countries in the development and use of the Input-Output framework
within some national statistical institutes. The schematic was developed by the Office for National Statistics of
the United Kingdom.
6.35 Frequent benchmarking of GDP statistics through I-O accounts that are based on economic censuses
and other comprehensive data sources allow for the incorporation of new and emerging economic activity
and capture changes in levels that are often missed by higher frequency, less-detailed datasets. Annual
source data are not as comprehensive or as reliable as the data used to benchmark the GDP statistics, which
often come from an economic census. Monthly or quarterly source data are not as comprehensive or reliable
131
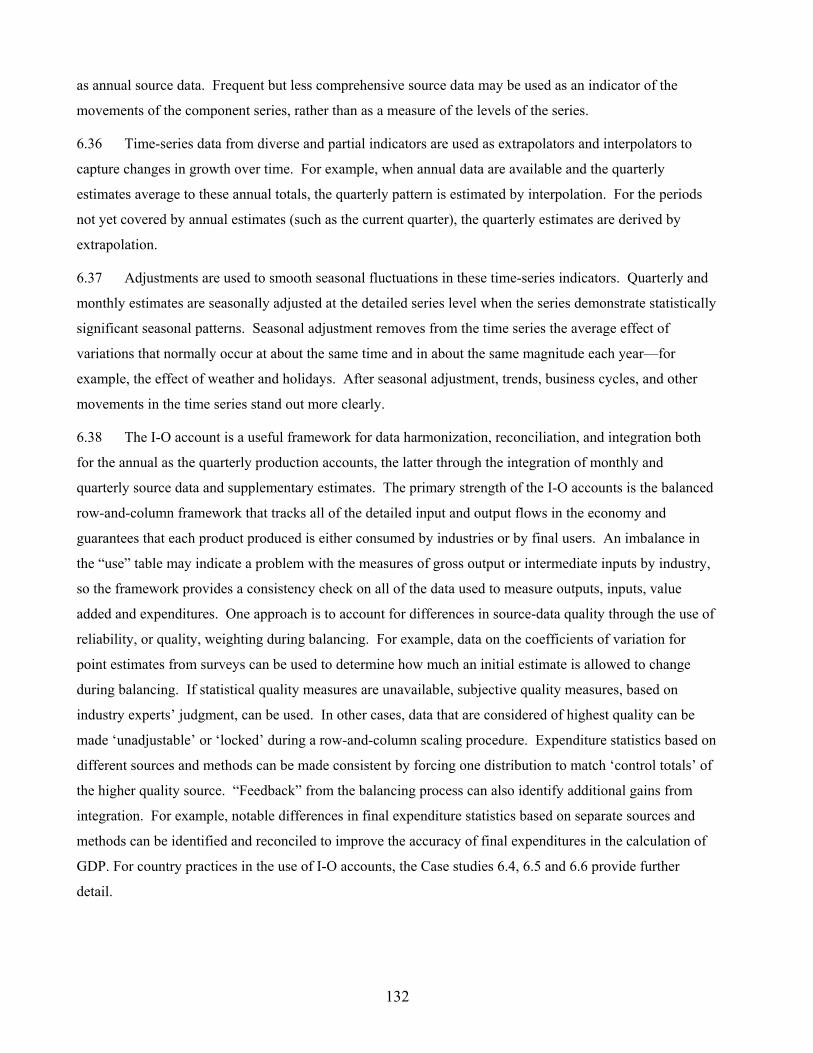
as annual source data. Frequent but less comprehensive source data may be used as an indicator of the
movements of the component series, rather than as a measure of the levels of the series.
6.36 Time-series data from diverse and partial indicators are used as extrapolators and interpolators to
capture changes in growth over time. For example, when annual data are available and the quarterly
estimates average to these annual totals, the quarterly pattern is estimated by interpolation. For the periods
not yet covered by annual estimates (such as the current quarter), the quarterly estimates are derived by
extrapolation.
6.37 Adjustments are used to smooth seasonal fluctuations in these time-series indicators. Quarterly and
monthly estimates are seasonally adjusted at the detailed series level when the series demonstrate statistically
significant seasonal patterns. Seasonal adjustment removes from the time series the average effect of
variations that normally occur at about the same time and in about the same magnitude each year—for
example, the effect of weather and holidays. After seasonal adjustment, trends, business cycles, and other
movements in the time series stand out more clearly.
6.38 The I-O account is a useful framework for data harmonization, reconciliation, and integration both
for the annual as the quarterly production accounts, the latter through the integration of monthly and
quarterly source data and supplementary estimates. The primary strength of the I-O accounts is the balanced
row-and-column framework that tracks all of the detailed input and output flows in the economy and
guarantees that each product produced is either consumed by industries or by final users. An imbalance in
the “use” table may indicate a problem with the measures of gross output or intermediate inputs by industry,
so the framework provides a consistency check on all of the data used to measure outputs, inputs, value
added and expenditures. One approach is to account for differences in source-data quality through the use of
reliability, or quality, weighting during balancing. For example, data on the coefficients of variation for
point estimates from surveys can be used to determine how much an initial estimate is allowed to change
during balancing. If statistical quality measures are unavailable, subjective quality measures, based on
industry experts’ judgment, can be used. In other cases, data that are considered of highest quality can be
made ‘unadjustable’ or ‘locked’ during a row-and-column scaling procedure. Expenditure statistics based on
different sources and methods can be made consistent by forcing one distribution to match ‘control totals’ of
the higher quality source. “Feedback” from the balancing process can also identify additional gains from
integration. For example, notable differences in final expenditure statistics based on separate sources and
methods can be identified and reconciled to improve the accuracy of final expenditures in the calculation of
GDP. For country practices in the use of I-O accounts, the Case studies 6.4, 6.5 and 6.6 provide further
detail.
132
Case study 6.4 Using the input-output accounts to benchmark United States GDP statistics
1. The U.S. Bureau of Economic Analysis (BEA) uses the benchmark input-output (I-O) accounts as the foundation for
several other accounts (Figure). The benchmark I-O accounts are in fact the most important statistical source for the
comprehensive revision of the national income and product accounts (NIPAs). They are used to establish the
benchmark year level for consumer spending, private fixed investment, and to provide information on the composition
of final demand. This in turn provides the basis for the estimates for gross domestic product (GDP) for the non-
benchmark years.
2. Also, the benchmark I-O accounts provide the framework and the basis for the quantity index for the GDP by
industry statistics. The benchmark I-O accounts also provide the foundation for the annual I-O accounts.
3. BEA’s regional program uses data from the benchmark I-O accounts to generate the Regional Input-Output Modeling
System (RIMS II), which can be used to analyze the impact of various projects or changes in economic programs on
state or local economies. For example, state and local government planners can use the model to assess the economic
impact of a military base closing, the closing of a major industrial plant, or a new development project.
Figure: The relationship between the benchmark input-output accounts and other BEA accounts
Benchmark Input-Output (I-O) Accounts These estimates, released every five years, are based on the most comprehensive and complete source data available, primarily from the Economic Census and surveys conducted by the U.S. Census Bureau.
National Income and Product Accounts
● Sets the level of PCE and PFI in the benchmark year by establishing the split of gross output between final purchases and intermediate inputs ● Determines what portion of gross output represents final purchases and distributes final purchases across major GDP components
Annual Industry Accounts ● Uses benchmark I-O data to help determine how major final demand categories, such as consumer spending and investment, are distributed across commodities ● Uses benchmark I-O data to help determine how intermediate inputs are distributed across commodities
Regional Input-Output Modeling System (RIMS II)
● Uses producer portion of benchmark I-O to create region-specific production patterns as input to RIMS II ● Uses value added and PCE, adjusted for regional earnings and consumption, to estimate the household row and column for RIMS II
133
Case study 6.5 The development of quarterly national accounts in the Netherlands
1. The development of the quarterly national accounts in the Netherlands started in 1982. Traditionally, the supply
and use table (SUT) is used as an integration framework for the economic statistics. So, also for the derivation of the
macro-economic totals on a quarterly basis, quarterly SUTs were used.
2. The first step, in 1982, was the breakdown of the table for the reporting year 1977 into four quarterly tables. The
method adopted in the Netherlands was to extrapolate these tables to the corresponding quarter of next year. A
wealth of data were available for this extrapolation process, including volume or value changes for reporting months
or quarters, and comparisons to the same month or quarter of the year before. The advantage of this representation is
of course that no explicit procedure for seasonal adjustment is necessary.
3. The next step in the development of the quarterly national accounts was a simulation to estimate tables for the
quarters of 1978. In this simulation, for each quarter the difference between the supply of and the demand for each
product was calculated. The reconciliation of these differences took place in the balancing process to reach
consistent SUTs for each quarter of 1978. The sum of the four quarterly tables was used to make a confrontation
with the final annual 1978 table. The differences between the annual and the sum of the quarters in volume and
values were broken down by the quarterly tables of 1978. The quarterly 1978 tables were subsequently used as the
basis for the extrapolation to the quarters of 1979 and so on.
4. The process of extrapolation uses several assumptions. One is the assumption of constant I-O ratios. Of course, no
short term information is available for the intermediate structure of the SUT. So, volume indicators on output of the
branches of industry are used in the extrapolation process to arrive at a table in constant prices. Price information for
each commodity separately is used for the inflation of the rows of the table to get the SUT in current prices. In the
balancing process the balancing is done both in constant and current prices simultaneously.
134
Case study 6.6 The input-output framework as a data-harmonisation and integration tool: The United States
integration of the annual industry accounts
1. The U.S. integration of the annual industry accounts is a case study in using the input-output (I-O) framework as a
data-harmonisation and integration tool. Prior to 2004, the United States prepared two sets of national industry
statistics: the I-O accounts, which consisted of the benchmark I-O accounts and the annual I-O accounts, and the GDP
by industry accounts. Both the I-O accounts and the GDP by industry accounts presented measures of gross output,
intermediate inputs, and value added by industry. These measures were often inconsistent because of the use of
different methodologies, classification frameworks, and source data.
2. The U.S. Bureau of Economic Analysis (BEA) developed its integration methodology to take advantage of the
richness of the source data that are available in the United States. BEA’s methodology ranks the available source data
by quality and estimates a balanced set of annual I-O and GDP by industry accounts that incorporate a weighted-
average of these source data on the basis of their reliability, or relative quality. Combining the strengths of the two
methods provides a more consistent and more accurate set of statistics. The primary strength of the annual I-O model is
the balanced row-and-column framework in which the detailed statistics are prepared. The framework provides a
simultaneous look at industries and products in the economy. This framework provides a “consistency check” between
production and consumption.
3. The GDP by industry methodology directly estimates value added by industry from high-quality source data. Several
factors, can affect the quality of the GDP by industry statistics for particular industries. For example, corporate tax data
must be translated from an enterprise to an establishment basis. In addition, distribution of proprietors’ income by
industry can introduce errors because of incomplete source data.
4. Thus, the GDP by industry value-added statistics can be of higher or lower quality than those constructed from the I-
O accounts, depending on source data. For an industry with high-quality data on gross output and intermediate inputs,
the measure of value added from the I-O accounts is superior. Alternatively, the GDP-by-industry measure of value
added for an industry that incorporates only small enterprise-establishment adjustments and a small amount of
proprietors’ income is superior. The final combined value added for an industry is an average of the measures from the
two sets of accounts, with weights determined by criteria that reflected the relative quality from the two sets of
accounts.
5. A further benefit of integrating the annual I-O accounts and the GDP by industry accounts is a “feedback loop” to the
NIPAs. The integration resulted in more than an exchange of information between the annual I-O and GDP by industry
accounts. It also provided a feedback loop to the NIPAs by providing annual estimates of the commodity composition
of GDP in non-benchmark years. Fully integrated accounts would, of course, include the benchmark I-O accounts. The
figure below illustrates the relationships among the various U.S. national economic accounts. The benchmark I-O
accounts provide the best-level estimates and commodity splits of GDP to the National Income and Products accounts
(NIPAs) (arrow 1), the best-level estimates of gross output to the GDP by industry accounts (2) and the starting point
for updating the annual I-O accounts (3). The NIPAs provide estimates of gross domestic income by industry to the
135
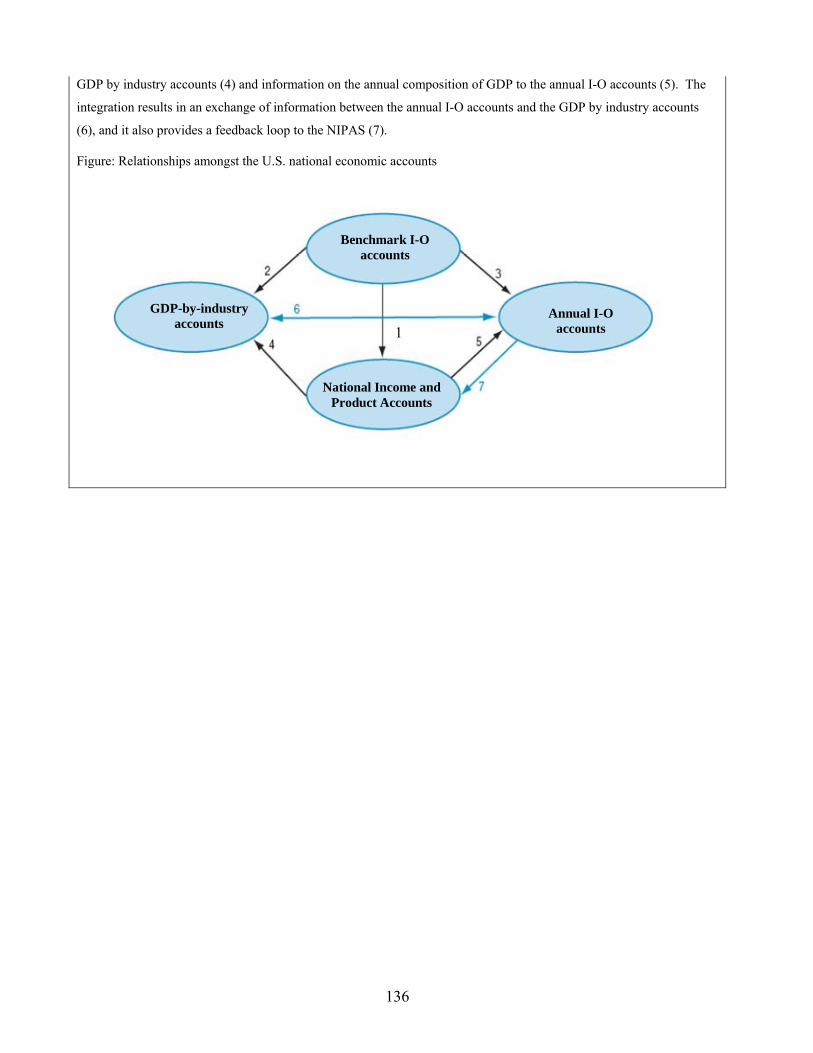
GDP by industry accounts (4) and information on the annual composition of GDP to the annual I-O accounts (5). The
integration results in an exchange of information between the annual I-O accounts and the GDP by industry accounts
(6), and it also provides a feedback loop to the NIPAS (7).
Figure: Relationships amongst the U.S. national economic accounts
GDP-by-industry accounts
Benchmark I-O accounts
Annual I-O accounts
National Income and Product Accounts
1
136
6.39 Integration of statistics on output, inputs, and value added with other national account statistics can
identify the sources of growth and productivity by industry. For example, integrating KLEMS statistics with
statistics from production accounts as well as productivity statistics provides a full accounting of growth
from the primary and intermediate factors of production within the domestic economy. Further details of this
application of the I-O Accounts and industry accounts are provided in the Case study 6.7.
Case study 6.7 Integration of industry statistics: KLEMS statistics for the United States
1. The KLEMS statistics for the United States, which BEA updates annually, provide greater detail on the types of
inputs that are consumed by industries in the production of goods and services. They aggregate the rich product detail
underlying the industry statistics of intermediate inputs into three cost categories—energy, materials, and purchased
services.
2. These aggregates are prepared by applying a KLEMS production framework14 to BEA’s statistics of industry
production. The availability of these statistics was made possible by the integration of the U.S. annual input-output (I-
O) accounts and GDP by industry accounts. The result is a set of KLEMS statistics that are derived from and consistent
with the published U.S. annual I-O and GDP by industry accounts since 1998. BEA developed this set of statistics in
response to demand from data users. The goal was to facilitate research into a wide array of economic issues. With the
release of the KLEMS statistics, BEA provides more analytically useful aggregations of intermediate inputs in current
dollars and in chain-type quantity and price indexes. For example, in recent years, studies on U.S. industries have
explored the relationship among gross output, value added, and intermediate inputs using BEA’s industry accounts.
Such studies have examined the substitution between primary, or value-added, factors of production (labor and capital)
and secondary, or intermediate, factors of production (energy, materials, and purchased services), the sources of
economic growth for industries, and the impact of input prices on aggregate price change.
3. The KLEMS statistics also facilitate other types of analyses. BEA and other U.S. statistical agencies, as well as
academic researchers, have conducted analytical studies using the KLEMS statistics and the integrated annual I-O and
GDP by industry accounts to measure the effects of domestic outsourcing and imported intermediate inputs on the U.S.
economy. The KLEMS statistics on energy, materials and purchased services have also been incorporated into the
Bureau of Labor Statistics’ measures of multi-factor productivity for the United States.
14 See Dale W. Jorgenson, Frank M. Gallop, and Barbara M. Fraumeni, Productivity and U.S. Economic Growth, (Massachusetts: Harvard University Press, 1987).
137
E. Sector accounts
6.40 In a number of countries the sector accounts are linked to the I-O table or to the supply and use table
(SUT). The sector accounts – just like the SUT – start with the production process. In the sector accounts
there is no need for detailed information on goods and services. The sector accounts are characterized by
transactions between different groups of actors (sectors), such as output, taxes and premiums, subsidies,
compensation of employees, property income, income transfers, consumption, investment in fixed assets and
capital transfers. In addition, the sector accounts record the transactions in financial assets and liabilities, and
provide and overview of the balance sheets. The description of the production process (the production
account) is followed by the process of distribution of income (the income account, primary distribution of
income) and the process of redistribution of income (the income account, secondary distribution of income).
The process of expenditure (income account, use of income account) is described. It is followed by the
capital account (capital transfers and capital accumulation), the financial and other changes in assets accounts
(changes in assets and liabilities and net worth) and the balance sheets (opening and closing stocks of assets,
liabilities and net worth and changes thereof).
6.41 The sector accounts describe the total economy. The break-down into institutional sectors is based on
the economic objectives and behaviors of the various actors in the economy. The process of statistical
integration of the source data is a process for each separate sector and collectively for the total economy in
the integrated economic accounts. The main sectors distinguished are the following:
S11 Non-financial corporations;
S12 Financial corporations;
S13 General government;
S14 Households;
S15 Non-profit institutions serving households; and
S2 The rest of the world.
6.42 Sector accounts present a coherent view of economic activity in terms of production, income
generation, income (re)distribution, consumption and accumulation and the economic roles played by
households (S14 and S2) and enterprises (S11, S12, S13, S15 and S2) in economic activity. Each economic
process is described in a separate account. The accounts register economic transactions, distinguishing
between uses and resources, with a special item to balance the two sides of each account. By passing on the
balancing item from one account to the next, a connection is created between subsequent accounts. These
accounts do not only exist for the total economy, but they are also compiled for separate domestic sectors. In
this way, the sector accounts describe: (1) for each economic process, the role of each sector, for instance,
138

general government in the income redistribution and financial corporations in financial intermediation and
liquidity and risk management and (2) for each sector, all economic transactions and their relation with other
domestic sectors and the rest of the world.
6.43 Transactions of the rest of the world are the mirror image of the accounts for the national economy.
They are presented from the point of view of the rest of the world and contain only a current account, a
capital account and a financial account. The current account includes imports, exports and income
transactions.
6.44 The surveys that are employed to collect data for the financial accounts should, to the extent
possible, use accounting concepts that enterprises already use for financial reporting. This will reduce
respondent burden and increase compliance. Survey instructions should provide linkages to the accounting
standards that should be used. In cases where companies follow different accounting principles than those
used by the compilers—as in the case of the United States, which currently follows U.S. Generally Accepted
Accounting Principles, but has some foreign-owned companies that report using the International Financial
Reporting System—companies should identify the accounting principles that they use. Compilers may need
to make adjustments to reported data where the accounting principles used by reporters differ markedly from
the principles used in statistical production.
6.45 Surveys that collect financial data should treat bank holding companies, offshore entities, and other
complex company structures in a uniform manner in order to maintain consistency across the accounts.
Compilers may want to treat certain special purpose entities as any other enterprise, or they may want to
“look through” them to the ultimate origin or destination of the investment. This may require additional
information on these entities.
6.46 An important indicator for the quality of sector accounts is the difference between the balancing item
“net lending/net borrowing” resulting from the capital accounts and the same balancing item resulting from
the financial accounts. In theory, the outcomes of the two balancing items should coincide for each (sub)
sector in the system of sector accounts. In practice, it turns out to be very difficult to attain this ideal situation
and statistical discrepancies arise. It follows that statistical discrepancies can only be calculated when a full
set of both non-financial and financial accounts is available. In many countries, financial accounts form a
new part of the system of national accounts, and the statistical discrepancies can be calculated, to judge and
to improve the quality of the sector accounts. Case study 6.8 provides a country example in reconciling
component data in the sector accounts.
139
• a transaction that is recorded as a use in one sector is recorded as a resource in another sector and vice
versa. Consequently, for each transaction the total of uses equals the total of resources. This is called the
transaction-identity. A special case is the identity of total supply (output and imports) and total use
(intermediate consumption, final consumption expenditure, capital formation and exports); and
• all available means of a sector are used by that sector. This is called the budget identity. This identity
implies that, theoretically, for each sector total resources and change in liabilities equals total uses and
change in assets.
In the sector accounts the transaction-identity is fully satisfied. It is not yet possible to meet the budget-identity.
Maintaining this identity would require adjustments of the estimates, which cannot be justified by the available data
sources. For this reason, statistical discrepancies will be allocated to the financial accounts.
• Capital account: capital transfers
• Capital account: capital accumulation
• Financial account
• Statistical discrepancies
The sector accounts can give a complete and fully consistent description of the total economy. Consistency implies
that:
Case study 6.8 The sector accounts in the Netherlands
The successive accounts of the Netherlands sector accounts are the following:
• Production account
• Income account: generation of income
• Income account: primary income distribution
• Income account: secondary income distribution
• Income account: use of income
140
F. International accounts
6.47 Updates to the SNA and the BPM6 were closely coordinated to increase consistency between the two
sets of international guidelines. Efforts to implement the standards should be done in an equally concerted
manner. Given this consistency, adherence to the guidelines in BPM6 will facilitate further integration of the
international accounts with the national accounts and related industry and regional statistics. Following the
recommended concepts, methods, and definitions will also improve the comparability of the international
accounts with the accounts of other nations.
6.48 The update of the BPM6 was also coordinated with the fourth edition of the OECD Benchmark
Definition of Foreign Direct Investment, which provides additional guidelines for measuring foreign direct
investment (FDI). In addition, there are linkages between BPM6 and other manuals that address, in more
detail, specific components of the international accounts, including the Manual on Statistics of International
Trade in Services, United Nations International Merchandise Trade Statistics: Concepts and Definitions, and
the OECD Handbook on Economic Globalisation Indicators.
6.49 To create an integrated set of accounts, source data should be adjusted where concepts and
definitions used in the international accounts differ from those used in the national accounts. The accounts
may use different definitions of the economic territory; for example, the national accounts may be compiled
on the basis of a narrowly defined “nation,” while the international accounts may include as part of the nation
outlying territories that are under its jurisdiction.
6.50 Data on exports and imports of goods are most often collected from customs documents and
therefore provide a virtual census of all transactions.15 As a result, benchmark, annual, and quarterly
estimates can be derived with no need for extrapolations from other sources. However, adjustments for
coverage, valuation, and timing must often be made to customs data to align trade statistics with the balance
of payments guidelines.
6.51 Customs data will likely need to be adjusted to include in the balance of payments goods that have
changed ownership but have not been recorded in the customs data because they have not physically crossed
borders. These include goods such as offshore fish catches, goods procured in ports by carriers, and goods
purchased by the military for use abroad. Other goods need to be added because they are not processed
through customs. These include goods transported through parcel post and electricity, gas, and water.
6.52 Source data on cross-border trade in goods should be collected on a consistent valuation basis. The
valuation recommended in BPM6 is the FOB (free on board) value, based on the transaction price including
inland freight, insurance, and other charges incurred in placing the merchandise on board the carrier at the
port of exportation. This valuation may differ materially from the change of ownership principle employed 15 Merchandise trade statistics generally include estimates for transactions valued below a specified exemption level.
141
by the BPM6 and the SNA, because the valuation is at the border, not necessarily where the change of
ownership actually occurs. Moreover, it is generally the best estimate given data sources and is the valuation
recommended by the SNA.
6.53 In practice, source data collection generally follows the International Merchandise Trade Statistics16
definitions, which value goods exports according to FOB but value imports according to CIF (cost,
insurance, and freight); that is, the value at the point of entry into the importing economy. For international
accounts purposes, the CIF value must be converted to FOB by deducting the value of the freight and
insurance charges incurred from the frontier of the exporting country to the border of the importing country.
6.54 Bilateral comparisons with major trading partners can be a useful tool for monitoring data quality
and identifying gaps in current account statistics. In some cases, data substitution might even be considered.
For example, it is more difficult for a country to identify its exports than it is to identify imports. The major
trading partners may benefit from data-sharing by using their partner’s import data as their export data. For
further details, please see Case study 6.9.
16 United Nations, International Merchandise Trade Statistics: Concepts and Definitions, 1998.
142
Case study 6.9 The United States-Canadian current-account reconciliation and data exchange
1. The United States-Canadian current-account reconciliation, conducted regularly since 1970, provides an excellent
example of the benefits of bilateral comparisons. The reconciliation, which explains the differences between the
estimates of the bilateral current account published by the U.S. Bureau of Economic Analysis and those published by
Statistics Canada, is undertaken because of the extensive economic links between Canada and the United States of
America. The reconciled estimates are intended to assist analysts who use both countries’ statistics and to show how
the current-account estimates would appear if both countries used common definitions, methodologies, and data
sources. In principle, the bilateral current account of one country should mirror the bilateral current account of the other
country. Differences occur in the published estimates of the U.S. and Canadian current accounts because of variations
in the definitions, methodologies, and statistical sources that are used by each country.
2. The longstanding U.S.-Canadian current-account reconciliation is among the leading examples of the benefits of
international data exchanges. As a part of the reconciliation process, Canada and the United States have evaluated the
accuracy of each other’s estimates, and as a result, each country now includes in its published estimates some data that
are provided by the other country. The exchange of data between Canada and the United States for transactions such as
trade in goods, travel, passenger fares, Canadian and U.S. government transactions, and some large transportation
transactions covers a substantial portion of the value of the Canadian and U.S. current account and has eliminated some
of the differences in the U.S. and Canadian-published estimates. In addition, the reconciliation process has highlighted
areas where errors and omissions may exist in each country’s estimates, which has helped in targeting data
improvement efforts. Other benefits of the data exchange include the elimination of some duplication of effort, a
reduction in some government processing costs, and reductions in respondent burden.
3. The U.S. and Canadian-published estimates are reconciled and there is extensive exchange of data between Canada
and the United States, differences in the published estimates remain. Complete substitution of the reconciled estimates
for published estimates and complete exchange of data are not feasible for several reasons. For trade in goods, imports
in the U.S. accounts would be affected because the United States attributes Canadian re-exports to the country of origin
rather than to Canada, the last country of shipment. For some accounts, the protection of confidentiality of the source
data bars the exchange of data. Finally, a few differences are attributable to different requirements for integrating the
international and national (domestic) accounts in each country.
143
6.55 In order to produce an integrated set of economic statistics, the financial and capital accounts from
the international accounts need to be produced in a manner that is consistent with how the domestic financial
sector statistics are produced. This requires parallel presentations of the domestic and international financial
accounts by institutional sector and by financial instrument. The 2008 SNA and BPM6 provide sector and
instrument classifications that have been harmonised for this purpose. Surveys need to be examined to
ensure that information is collected in a way that enables compilers to produce statistics at this level of detail.
6.56 In the international accounts, financial transactions are classified into five functional categories—
direct investment, portfolio investment, financial derivatives (other than reserves) and employee stock
options, other investment, and reserve assets—that group transactions in financial instruments according to
the economic motivation of the investment. Direct investment, portfolio investment, and other investment
transactions are often collected by separate surveys, and in some countries, these surveys are conducted by
different agencies. Agencies must be careful to avoid overlap and duplication. To do so, it may be necessary
to compare individual company reports. In countries with highly-decentralised systems, this may require
some form of data-sharing agreement.
6.57 It is important to properly classify a transaction by type of investment (direct investment, portfolio
investment, or other investment) during the data collection process. To do so, the data collection program
must employ clear definitions of the different types of investment. Respondent education is vital to ensure
that the information collected is accurately classified, particularly when companies may be required to report
different types of transactions to different agencies. Where one agency may collect data on both direct
investment and portfolio investment, for example, because of reasons of convenience (such as legal
restrictions, greater access to and familiarity with potential respondents, or historical accident), it may be
necessary to adjust data to reclassify certain transactions from one type of investment to another, and to
eliminate gaps and overlaps in coverage.
6.58 Financial asset positions and the related income flows are often collected independently. When this
is the case, a rate of return can be calculated and compared to comparable rates of return (such as a market
interest rate) to test the consistency of the income and position estimates.
6.59 Positions may be collected using a variety of different valuations, including book value, historical
cost, market value, or fair value. The BPM6 and the 2008 SNA recommend the use of market values for
traded securities, and the use of nominal values for loans, deposits, and other accounts receivable or payable.
However, data may not be collected using those valuation methods, and might then need to be adjusted.
6.60 Data collected from enterprises are often based on tax or accounting standards and may not reflect
market values. For example, direct investment positions are often collected at the historical cost or book
value. This value can be converted to a current-period price basis by valuing capital equipment, land, and
144
inventories at their current- period price or replacement cost. Direct investment positions can also be
adjusted to a market value basis by valuing the equity portion of the position using indexes of stock market
prices. One shortcoming of these methods is that it may be difficult to make these adjustments beyond the
aggregate level.
6.61 Cross-country comparisons can be undertaken through initiatives organised by international
institutions. Examples include the IMF’s Coordinated Portfolio Investment Survey and its Coordinated
Direct Investment Survey and the Bank for International Settlement’s international banking statistics.
6.62 Asymmetries in bilateral statistics can arise from the attribution of transactions to the “ultimate” or
the “immediate” country of ownership or destination. In theory, transactions in goods should be attributed to
the residence of the seller/purchaser of a good, in accordance with the change of ownership principle. In
practice, trade in goods is usually attributed to the country of origin for imports, and the country of final
destination for exports. This can lead to asymmetries in the attribution by partner economies, particularly
when goods are routed through an intermediate country.
6.63 Analogous problems may result where financial flows are collected on an immediate counterparty
basis while financial positions are collected on the basis of the issuer or holder. In order to facilitate
comparisons with partner countries, statistics can be compiled on both bases. This is recommended for direct
investment transactions and positions. The OECD Benchmark Definition of Foreign Direct Investment
describes a method for allocating inward investment to the ultimate investing country, but allocating outward
investment to the ultimate host country is a topic that remains on the research agenda.
6.64 Statistics on the Activities of Multinational Enterprises (AMNE) provide information on the
operations of a multinational enterprise (MNE), including variables such as employment, sales, value added,
employee compensation, R&D expenditures, and total imports and exports. Unlike FDI statistics, which
focus on cross-border relationships between parent companies and their affiliates, AMNE statistics cover the
full operations of the entire MNE. AMNE statistics are based on the idea of control, or majority ownership,
whereas FDI statistics are based on relationships that exhibit influence, or ownership of 10 percent or more.
6.65 Both FDI statistics and AMNE statistics are important for assessing the economic impact of MNEs
and for understanding globalization. The OECD Handbook on Economic Globalisation Indicators (OECD
Handbook) and the Manual on Statistics of International Trade in Services provide recommendations for the
compilation of key indicators based on FDI data and data on AMNE to address questions related to
globalization.
6.66 Although FDI and AMNE statistics are related, it can be difficult to establish linkages between the
two data sets because of differences in methodology. For example, statistics on AMNE should be presented
on a directional basis (i.e. inward and outward investment) and should be classified according to the country
145
of the entities covered. Statistics on foreign-owned affiliates in the compiling economy (inward investment)
should be attributed to the country of the ultimate investor. In order to reconcile these statistics with FDI
statistics that are classified according to the country of the immediate counterparty, compilers will need to
collect AMNE data based on the country of the immediate investor as well.
6.67 The enterprise populations for FDI and AMNE statistics are not equal; AMNE statistics cover a sub-
set of the enterprises involved in FDI. In some countries, where FDI and AMNE data are compiled by the
same agency, the data collection for the two data sets is largely consistent. However, in many cases the data
are compiled by different agencies and collected on different surveys. This can make it difficult to integrate
the two sets of statistics. Two OECD groups, the Investment Committee’s Working Group on International
Investment Statistics and the Committee on Industry, Innovation and Entrepreneurship’s Working Party on
Globalisation of Industry, have been working jointly on efforts to further integrate FDI and AMNE statistics.
6.68 The economic globalisation indicators presented in the OECD Handbook were developed from the
concepts in the SNA. One of the “basic” AMNE variables is value added, a multinational firm’s contribution
to gross domestic product (GDP). Value added of a multinational enterprise should be estimated in a way
that is comparable to the method for calculating GDP. This allows the statistics to be used together to
analyze a firm’s impact on a host economy.
6.69 AMNE statistics are also presented by activity or industry. Industry classification can be difficult
because enterprises are often engaged in several activities. Ideally, the enterprise should be classified
according to the primary economic activity, for example, the one that contributes most to value added or to
employment. To facilitate cross-country analysis, industry statistics should be compiled using standard
industry classification codes. This may be challenging, because while some countries use the ISIC, other
countries use their own national classification systems, for example, the NAICS adopted by Canada, Mexico,
and the United States of America. Reconciliations between national classification systems and ISIC are
important to enable international comparability.
G. Labour accounts
6.70 Labour statistics have their own character depending on their use in the economic or social context.
Labour is far from homogeneous as a production factor with the differences in education level, skills,
experience, sex, age, status, wages and salaries, labor cost and hours worked, which are some of the main
statistical descriptors of labour force and employment.
6.71 The development of a system of population and labour statistics integrated with the national accounts
is an essential part of the central framework of the national accounts and is at the heart of economic
accounting and productivity analysis. The relationships between wages, jobs and hours worked used in this
kind of analysis are depicted in Figure 6.1.
146
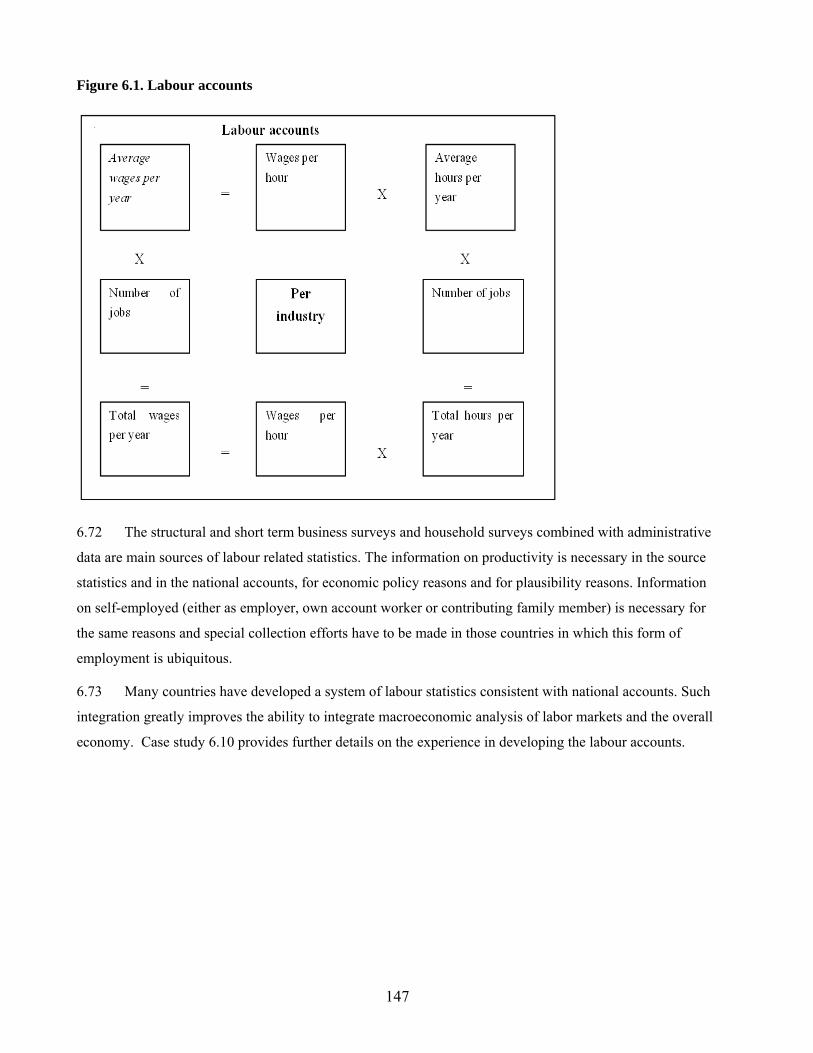
Figure 6.1. Labour accounts
6.72 The structural and short term business surveys and household surveys combined with administrative
data are main sources of labour related statistics. The information on productivity is necessary in the source
statistics and in the national accounts, for economic policy reasons and for plausibility reasons. Information
on self-employed (either as employer, own account worker or contributing family member) is necessary for
the same reasons and special collection efforts have to be made in those countries in which this form of
employment is ubiquitous.
6.73 Many countries have developed a system of labour statistics consistent with national accounts. Such
integration greatly improves the ability to integrate macroeconomic analysis of labor markets and the overall
economy. Case study 6.10 provides further details on the experience in developing the labour accounts.
147
1. The development of the labour accounts in the Netherlands started in the mid-1980s. The initial development was
considerably hampered by many discrepancies between the source data. Each source had its own limitations. For
instance, from administrative data is generated mainly for administrative and not for statistical purposes. For
instance, employment related information obtained from enterprise registration was restricted to what was available
in the enterprise registration. Moreover, surveys of individuals are not always reliable in responding to queries on
contractual working hours.
2. For the development of the labour accounts, considerable efforts were made to harmonise concepts, definitions
and classifications across the various survey and administrative sources and to reach the appropriate scope and
coverage of the statistical population. For the data estimation methods, variables and reference periods had to be
harmonised, for which intermediary concepts in the relevant sources were introduced that could be bridged with the
official labour statistics to be published.
2. After the conceptual harmonisation was obtained among the source data, the integration for the labour statistics
was introduced in four steps. In the first and the second step – harmonisation and exhaustiveness – the data are
treated in such a way that all data are abridged to the same definitions and populations. In the third step –
minimizing measurement errors – the causes of data errors are traced and removed. In the fourth and last step of the
integration process, the remaining discrepancies are reconciled through a statistical balancing process of the data.
3. After these four steps are carried out, a consistent and coherent picture for the labour statistics emerges. This
consistency and coherence is obtained only among the statistical information available from the many different
source statistics for the labour accounts. This internal consistency and coherence is no guarantee for external
consistency and coherence. In particular, there may be differences between the labour accounts and the national
accounts and such is the case in the Netherlands.
4. At the time when the labour accounts were developed in the Netherlands, the next benchmark revision year of the
national accounts was 1987, which was completed in 1992. However, the new labour accounts could only play a
partial role in this revision. The full consistency and coherence between the two statistical systems was reached in
the benchmark revision of the year 1995, first published in 1999.
Case study 6.10 The development of labour accounts in the Netherlands
H. System of price and volume measures
6.74 The SNA provides detailed recommendations on the use of price and volume measures. The
compilation of price indexes is addressed in several other manuals, which have been prepared on the same
structure. The Consumer Price Index Manual: Theory and Practice (2004) and the Export and Import Price
148
Index Manual: Theory and Practice (2009) were produced by a collaborative group made up of the
International Labour Organization (ILO), the OECD, the Statistical Office of the European Communities, the
United Nations, the World Bank, and the IMF. The Producer Price Index Manual: Theory and Practice
(2004) was produced by the IMF and Eurostat produced the Handbook on Price and Volume Measures in
National Accounts (1991). Given the importance of measures of inflation, real GDP, and productivity to
monetary and other policies, it is critical that policymakers receive consistent and unbiased measures for
prices and volumes.
6.75 The SNA recommends using superlative price indexes to measure price movements of aggregate
measures of economic activity (flows of goods and services, gross value added, and gross domestic product).
Superlative price indexes are symmetrical, provide reasonable approximations to the underlying economic
theoretical ideal (cost of living and output price indexes), and treat prices and quantities equally across
periods. As a result, superlative price indexes provide more consistent measures of aggregate prices over
periods experiencing appreciable price changes and address the aggregation bias present in fixed weighted
price and output indexes.
6.76 A common type of superlative price index is the Fisher chain price index. With a chained price
index, the weights are changed each successive period. To calculate a price index for period 2, two
individual price indexes are calculated. One uses weights from period 1 (a Laspeyres price index), and one
uses weights from period 2 (a Paasche price index). Changes in prices from period 1 to period 2 for each
component are weighted together using the two sets of weights. The resulting two changes in prices are then
multiplied together, and the square root of this product yields the change in the Fisher chain price index from
period 1 to period 2. To calculate the change in the index from period 2 to period 3, the process is repeated,
but using weights from periods 2 and 3 for the calculations. The process is repeated with each successive
period.
6.77 With price developments being a recurrent phenomenon in the market economies of many countries,
most measures of economic activity are adjusted for price movements. Measures of economic activity are
“deflated” at a detailed level of economic activity and aggregated using some form of index. Consumer price
indexes are primarily used to deflate personal consumption expenditures, certain components of the change
in private inventories, and state and local government purchases. Producer price indexes are primarily used
to deflate private investment in equipment and software and in structures, certain components of the change
in private inventories, government purchases, and, on occasion, exports and imports (when an item does not
have a satisfactory international price index). International price indexes are primarily used to deflate
imports and exports. They are also used to deflate the imported items included in private investment and in
the change in private inventories.
149
6.78 The source data for the calculation of price indexes may vary both from category of products and
over time. The source data will come either from official surveys of prices or from other mixed use sources,
including private sources. The principle underlying the selection of price-related source data is to use the
best-available data at the finest level of detail that can be managed. As a result, either the available detail for
price source data, or the available detail for the nominal values of products may determine the level of detail
that is deflated. If the detailed quantity adjustments are chained together, the totals will not sum to the
chained totals. This methodology preserves growth rates when base periods for real calculations are
changed, but at the cost of additivity.
6.79 In some cases, compilers may have more than one set of price estimates available. However, these
price estimates may exhibit somewhat different patterns. It may be necessary to select either the best price
series or a suitable methodology for incorporating information from all of them in some fashion.
6.80 The overall coherence and consistency between the price, volume and value estimates can be
significantly improved when a system’s approach to price and volume indexes is applied. This system of
price and volume indexes uses the structure of the I-O accounts in preparing I-O accounts for consecutive
periods with annual and quarterly frequency expressed in value and volume terms
6.81 Case studies 6.11 and 6.12 provide national practices in compiling and improving the coherence and
consistency among price indexes. The application of a system of price and volume indexes has also been
demonstrated in the previous case studies 6.1 and 6.4.
150
Case study 6.11 Towards integrated price and volume system: a practical experience of Statistics Finland
1. In years 2008-2010, Statistics Finland launched a development programme to improve the coherence and quality of
price and volume indices. The program consisted of several smaller projects and it was a joint undertaking by experts
from national accounts, price statistics and short-term business statistics. Coherence was sought with a methodology in
which volume data are derived - to a greater extent than before - from data concerning prices and production values.
Special emphasis was put on consistency of prices, volumes and values in the compilation of national accounts.
2. In order to increase quality, several improvements were made to the coverage and to the level of details of price
indices as well as quality changes. The development programme also addressed the need to standardise the information
systems of indices. A specific emphasis was put on the coherence of input data from the large multinational enterprises.
3. The main results of the projects carried out under the umbrella of the integration programme are the following:
- The quality of the volume index of industrial output was improved significantly by collecting more value data for
industrial products and by increasing remarkably the sample of the respective production price indices. This
enabled to move largely away from the volume extrapolation-method towards the deflation method in many
industries where the sole information of output quantities was considered less reliable than information on the
value of output.
- A new information system was introduced in national accounts, where methodological changes concerning price
and volume calculation were also made. Consequently, the new deflation method based on products in the
quarterly national accounts is in conformity with the annual national accounts and thus it produces price estimates
that are closer to those of annual accounts. A specific task group that has responsibility for the system of price and
volume indexes in national accounts was created.
- A new producer price index for private health care as well as new price indices for owner occupied housing were
developed, the latter as part of EU wide project.
- A new, generic metadata driven and process steered IT system was developed for index calculation - the index
engine, which will be used in the production of several price and cost indices in the near future.
4. The coherence between the price and volume measures will continue to be improved with the gradual change over to
new information system for index calculation and the introduction of chain price indices for the consumer price index.
5. It is important also to continue the work with large enterprises. An expert team at Statistics Finland is specialised in
collection and processing of data on large enterprises. Moreover, an ongoing project on an integrated information
system for business statistics will also contribute to the overall coherence of economic statistics and their classification.
151
Case study 6.12 Price indexes in the United States national accounts
1. The price source data underlying the bulk of United States gross domestic product (GDP) comes from three sets of
prices compiled by the U.S. Bureau of Labor Statistics (BLS). Fine-level components of the consumer price index
(CPI) are used to deflate most of the detailed components of personal consumption expenditures. Some components
have been deflated using other price data, including components of the producer price index (PPI). Because of this, and
because the CPI is a fixed-weight index and the personal consumption expenditures deflator is a chain price index, the
two are not identical. BLS and the U.S. Bureau of Economic Analysis (BEA) have published reconciliations.
2. Components of the PPI are used to deflate much of investment. Similarly, estimates of most import and export prices
are provided by price estimates from the international price project (IPP). The three sets of price indexes (CPI, PPI and
IPP) also underlie the deflation of most government purchases of goods and services, for both the federal government,
and for state and local governments. Estimates of prices for the compensation of government employees at all levels are
calculated by BEA using compensation rates for government employees and making the assumption that there are never
any changes in the productivity of the employees.
3. Some other components of GDP, however, are deflated using other price estimates. For example, observations of
prices charged are used to deflate imports of electricity from Canada. As another example, the Census Bureau’s
hedonics-based price index for single-family houses is used to deflate investment in these structures.
4. The price indexes for nonresidential structures provide examples of the changing data sources and estimation
methodologies that underlie estimates that have not been deflated using CPI, PPI, or IPP data. Until 1997, the price
index for these structures is calculated using an un-weighted average of movements in the Census price index for single-
family structures and a private construction cost index generated by a large, multi-city construction company. From
1997 to 2010, BEA calculates the prices using hedonics-based price indexes based on private, published costs of
construction for a variety of types of nonresidential structures. Going forward, BEA plans to use PPIs for nonresidential
structures that BLS recently began publishing. BEA’s hedonic price indexes were developed to serve as stopgaps until
BLS’ work on PPIs became available because of the gestation time for PPIs—based on much more comprehensive data
rather than hedonic regressions).
152
I. Regional accounts
6.82 Regional accounts must be consistent with those used in national and industry accounts programs,
and the regional areas that form the basis of such statistics should be consistently defined across programs
and over time. Such consistency not only mitigates possible confusion relating to what the regional statistics
measure, but also allows regional statistics to be used in unison with national and industry data. Access to
measures of a region’s contribution to a nation’s growth may deepen our understanding of business cycle
behavior and provide information on potential sources of recovery. The importance of consistent definitions
of regional areas across programs and over time is illustrated by many countries’ use of regional data for the
allocation of federal funds across provinces, states, and other levels of government, and the use of more
detailed geographic data for the allocation of provincial and state data to counties and muncipalities.
6.83 It would be useful for national surveys to include information on geographic location so that regional
estimates can be derived from the same source data as national estimates. There are difficulties associated
with the use of administrative records at the sub-national level because programs and reporting requirements
may differ across geographic regions. For example, the primary source of data on wages and salaries in the
United States is the Quarterly Census on Employment and Wages, which is constructed from the
administrative records, related to state-administered unemployment insurance programs. As the reporting
requirements and definitions of wages and salaries differ across states, much effort is expended in the United
States to adjust the administrative records data to derive regional wage and salary measures that can be
meaningfully compared to those of the nation and to other regions.
6.84 The surveys that are employed to collect regional economic data should be designed for a fine level
of detail, because different-sized regional units are appropriate for different types of economic analyses.
Related economic activity may be localized within a relatively small or relatively large area depending on
many factors, such as labour mobility and the ease with which goods can be transported. Even though
statistics related to economic activity may bear little relation to sub-national political boundaries, statistics
for sub-national political sub-divisions may also be useful, because national programs may distribute funds to
sub-national governments based on economic measures for each political jurisdiction. For example,
significant sums of monies in federal assistance may be distributed across regions based on regional-level
measures of economic activity.
6.85 Whenever possible, data on income flows should be collected and maintained in a manner that
accounts for the differences between the location of work and the location of residents of households.
Tracking this information is important because measures of current production, such as GDP, are based on
where production occurs and measures of income, such as personal income, are based on the location of
residence. Thus, a regional area may be growing in terms of the final goods and services that it produces, but
153
the income of the local residents may not, if many of the employees in the geographic area reside in different
location. Such a distinction may have important policy implications.
J. Satellite accounts
6.86 Satellite accounts—may be linked to the accounts of the System of National Accounts, but
incorporate definitional and conventional changes that improve the accounts’ abilities to examine specific
areas of the economy. Examples are provided by tourism satellite accounts and health satellite accounts.
Satellite accounts are internally integrated, but are not in complete accord with the integrated economic
accounts of the System of National Accounts. For example, an account for research and development might
define those activities as investment, even though they are treated as intermediate consumption in the System
of National Accounts.
a. Tourism satellite accounts
6.87 Tourism statistics in most countries include a large set of data items ranging from the number of
visitors, the socioeconomic characteristics of visitors, duration of stay to hotel capacity and its occupancy
rate. These statistics are representative at the country level, but are not necessarily consistent with
macroeconomic statistics. Tourism as an economic activity is of course included in national accounts, but
given its nature, it is not made explicit in the national accounts, because tourism related activities and
products are not explicitly recognized in the international product and industry classification. Given the
contributions of the tourism industry to many national economies, the concept of Tourism Satellite Account
(TSA) has been developed to identify the phenomena of tourism in each of the industries in the national
accounts in order to measure the contribution of the tourism industry in national economies.
6.88 The conceptual development of tourism satellite accounts is the result of continuous efforts and
international collaboration since the 1970s. In 1983, the first proposal from the World Tourism Organisation
(UNWTO) stressed the need for a “uniform and comprehensive means of measurement and comparison with
other sectors of the economy” following the recommendations of the SNA of that time. The OECD
contributed to the discussion in 1991 with the development of its Manual on Tourism Economic Accounts.
After the adoption of the recommendations on the definitions and classifications (Ottawa conference, 1993),
the UNWTO, OECD, Eurostat and United Nations developed the conceptual framework and 2001
publication of a TSA. This resulted in the updated manual, Tourism Satellite Account: Recommended
Methodological Framework 2008.
6.89 Country practices in the development of tourism accounts are presented in Case studies 6.13 and 6.14.
154

b. Health satellite accounts
6.90 The updating of the System of Health Accounts (SHA) as a joint effort by the OECD, Eurostat and
WHO is under way. In the further development of health satellite accounts the following categories of
information need to be considered: a functional classification of health care, an analysis of health care
provider units, expenditure on health care and information about the funding of health care. For a national
example of health satellite accounts in Brazil see related Case study 6.15.
155
Case study 6.13 Netherlands tourism satellite accounts
1. The national accounts are an important data source for the Netherlands tourism satellite accounts (TSA), which
determines what can be called the “borders” of the TSA. The TSA distinguishes inbound, outbound and domestic
tourism on daytrips and overnight stays with a recreational motive and business travel, consumer durables and social
transfers in kind. Different kinds of surveys are available to supply detailed data on each of these types of tourism
expenditure. A survey on daytrips is undertaken once every 5 to 6 years and is aimed at collecting information on
the kind of activity, destination and expenditure of daytrips of Dutch persons. The ‘continual holiday survey’ takes
place every quarter of a year and is aimed at gathering data on activities and expenditure of Dutch people on
vacation or on business trips in the Netherlands or abroad. A mobility survey is aimed at collecting information on
all aspects of mobility of the Dutch population, ranging from the mode of transportation and time of departure to
destination and motive of travel. A sample of accommodations and lodgings are asked for information on the
number of visitors and overnight stays of Dutch and foreign visitors. The survey ‘accommodations and lodgings’
takes place on an annual basis. Finally, the survey ‘inbound tourism’ is undertaken once in every 5 years. This
survey includes information on motive and characteristics of the visit, country of origin of the visitor, mode of
transportation and expenditures per category.
2. To facilitate the integration process in specific areas, separate modules have been developed. In these modules
different kinds of data are grouped together and analysed, after which the information is returned to the main
framework. The ratios and other different computations need to have a plausible value before the integration process
is completed.
156
Case study 6.14 United States travel and tourism satellite accounts
1. The United States travel and tourism satellite accounts (TTSAs) present a detailed picture of travel and tourism
activity and its role in the U.S. economy since 1998. They are based on the detailed benchmark Input-Output (I-O)
accounts and are consistent with the integrated annual industry accounts. The methods that are used to prepare the
TTSAs are also consistent with the methods used to estimate gross domestic product, national income, and other
national economic measures. These accounts are developed with the support of the Office of Travel and Tourism
Industries, International Trade Administration and U.S. Department of Commerce in order to more accurately measure
the contribution of travel and tourism to the economy.
2. There is no explicit “travel and tourism” industry in the U.S. industry accounts. Rather, travel and tourism is
distributed across many industries, including food and accommodation, transportation, recreation, entertainment, and
retail. They present estimates of current and real expenditures by tourists, or visitors, on 24 types of goods and services
for 1998 forward. The accounts also present estimates of the income generated by travel and tourism and estimates of
output (in current and volume terms) and employment generated by travel and tourism-related industries. The accounts
are updated annually and have been expanded to provide quarterly estimates of the sales of goods and services to
travelers and employment attributable to those tourism sales. The TTSAs can be used to determine the size of tourism
and the components of travel and tourism. Specifically, these accounts can be used to determine the shares of the goods
and services that were sold to visitors and the shares that were sold to local residents, to assess the effects of travel and
tourism on the U.S. economy, to examine the relationship among the travel and tourism industries, to determine the
expenditures of tourists, and to compare travel and tourism industries to other manufacturing and services industries.
157
Case study 6.15 Health Satellite Account – Brazil - 2005-2007
1. Health care industry is of significant importance in many countries in terms of size and employment. The
publication Health Satellite Account – Brazil - 2005-2007 has been compiled with a focus on policy and
analytical needs. This approach, however, is fundamental to obtain knowledge of the productive structure
and of the dynamics of this sector – including financial aspects, interaction with the rest of the economy
and the destination given to the goods and services produced – and for the formulation and implementation
of policies aimed at a more effective use of public resources and at a better distribution of health benefits
among the population.
2. In order to provide an overall view of health resources and uses in Brazil, IBGE released, in 2008, the
study Health Economics: A Macroeconomic Perspective 2000-2005. This preliminary publication compiled
and systematized data on production, consumption, international trade of goods and services related to
health, as well as employment and income obtained from economic activities, which generate such
products and the infrastructure of this sector, having the System of National accounts as its main source.
The study measured, for the first time, the contribution of the health care industry to the Brazilian
economy. The current Health Satellite Account – Brazil- 2005-2007 is a consequence of the improvement
of this first initiative.
3. This publication describes methodological procedures which have guided the compilation of the Health
Satellite Account, the boundaries of which, also based on the National Classification of Economic
Activities – CNAE 1.0, increase data coverage and, in some cases, improves the disaggregation of some
activities approached in that preliminary phase. The analysis of results, which follows, is widely illustrated
by tables and graphs and it encompasses, for each economic activity treated, information on the gross data
of production of health goods and services, inputs consumed in productive processes; gross value added,
final consumption of health goods and services, investments, salaries, job positions, among other aspects
for the period 2005-2007. The publication also includes a glossary with the concepts considered relevant to
the understanding of results, besides appendices with the detailed structure of the Tables of Resources and
Uses and their results for the period 2005-2007 and with the Integrated Economic Accounts for the period
2005-2006. The information presented in this publication is also available on the IBGE web site
http://www.ibge.gov.br/lojavirtual/fichatecnica.php?codigoproduto=90118 and makes it possible to know
the profile of healthcare in Brazil in the last few years, thus contributing to the valuing of this important
economic segment.
158
K. Environmental accounts
6.91 The System of Environmental-Economic Accounts (SEEA) is a multi-purpose, conceptual
framework that describes the interactions between the economy and the environment and the changes in the
state of the environment over time. At the heart of the SEEA is an accounting approach that describes, as
completely as possible, the stocks and flows that are relevant to the analysis of environmental and economic
issues. The accounting approach of the SEEA follows the system’s approach as described in the System of
National Accounts (SNA). Using common concepts, definitions and classifications, the SEEA extends the
monetary focused recording in the SNA to incorporate many environment statistics that are usually available
in physical or quantitative terms. The power of the SEEA comes from its conceptual framework to present
the interaction between the environment and the economy in coherent physical and monetary terms.
6.92 As an integrated accounting system, the SEEA stands apart from individual sets of environment
statistics. While sets of environment statistics are usually internally consistent, there is, for good reason,
often no strict consistency between one set of statistics and another. Environment statistics are often
collected with a particular regulatory or administrative purpose in mind and the way in which they are
structured is specific to this need. The SEEA also relies upon sets of environment statistics for the basic
statistics required in its implementation. It describes the conceptual accounting frameworks of flows and
stocks for water, minerals, energy, timber, fish, soil, land and ecosystems, pollution and waste in relation to
the economic activity of production, consumption and accumulation and the . Each of these natural resources
and other materials has specific and detailed measurement approaches that are integrated in the SEEA. The
SEEA is not designed to provide or replace the richness and depth that each of these individual sets of
environment statistics bring to their own areas, rather the linkages and connections developed in the SEEA
provide an additional and broader perspective and hence add value to the detailed information already
available. An accounting approach distinguishes the SEEA from general sets of statistics on environmental
and economic issues, because it demands coherence and consistency with a core set of concepts and
definitions. Thus, using a wide range of source data, the SEEA provides a consistent and coherent set of
environment statistics using a system’s approach to compare and contrast source data and presents
aggregates and their components data across a broad spectrum of environmental and economic issues.
6.93 The SEEA consists of a coherent, consistent and integrated set of tables and accounts which each
focus on different aspects of the interaction between the economy and the environment or on the changing
state of the environment. The tables and accounts are based on internationally agreed concepts, definitions,
classifications and accounting rules. There are five main types of accounts and tables in the SEEA
framework: (i) physical flow accounts presented in supply and use tables, (ii) asset accounts in physical and
monetary terms, (iii) the sequence of economic accounts, (iv) functional accounts for environmental
transactions, and (v) tables containing demographic and employment information. Each of these different
159

accounts is connected to the other within the SEEA framework, but each one focuses on a different part of
the interaction between the economy and the environment.
6.94 National practices on the application of environmental accounting are presented in Case study 6.16
by the Netherlands.
160
Case study 6.16 Environmental accounting in the Netherlands
1. In 1991 an illustrative national accounting matrix including the environmental accounts (NAMEA) was
presented for the first time. However, insufficient data were available for an immediate operationalization of
this conceptual framework. So it was decided to compile a more modest pilot-NAMEA, making use of a so-
called national environment policy plan, in which a number of environmental themes were distinguished. A
single indicator had been designed for each of these themes.
2. In 1993, this first NAMEA became available and the present NAMEAs basically maintained this format.
These NAMEAs focus on the following themes: the greenhouse effect, ozone layer depletion, acidification,
solid waste, wastewater and the exploration of crude oil and natural gas.
3. During the 1990s and the early 2000s, a number of pilot projects were performed to extend the system of
environmental accounts. Following a pilot project in 1997, the Nertherlands’ system of environmental accounts
was extended in 2002 with the national accounting matrix including water accounts (NAMWA). Other pilot
projects focused on energy, land use, subsoil accounts and environmental taxes. Between 2004 and 2007
subsystems based on these pilots were developed and implemented, while the air emission accounts and the
water emission accounts were further extended. In 2009, a program for advancing new statistics on sustainable
development was initiated. In cooperation with other institutes, new statistics will be developed to answer all
kinds of relevant social, economic and environmental questions. Within this scope new projects in the area of
environmental accounting were started.
161
Annex 1. List of domains for integrated economic statistics
The descriptions provided here are extracts from the original reference document. For the full description of
classification categories see the reference source document:
Classification of International Statistical Activities. Conference of European Statisticians,
ECE/CES/BUR/2009/OCT/19 http://www.unece.org/stats/documents/ece/ces/bur/2009/mtg1/19.e.pdf
1. Demographic and social statistics
1.2 Labour
Covers statistics on labour force, labour market, employment and unemployment.
1.5 Income and consumption
Covers statistics on household income and expenditures, consumption patterns.
2. Economic statistics
2.1. Macroeconomic statistics
All activities that are dealing with economy-wide statistics at macro level that go beyond or are different
from national accounts, whether annual, quarterly or monthly.
2.2. Economic accounts
Covers work on national accounts in current and constant prices, Excludes agricultural accounts (in 2.4.1),
tourism satellite accounts (in 2.4.5), government accounts, financial accounts (in 2.5).
2.3. Business statistics
Economy-wide statistics on the activities of enterprises. Covers work on economic statistics across
different sectors, business services, enterprises by size class. Excludes statistics of specific individual
sectors (in 2.4).
2.4. Sectoral statistics
Statistical activities dealing with one of the specific branches of industry or services.
2.4.1 Agriculture, forestry, fisheries
All agriculture, forestry, fishery related statistics, agricultural farm structures, crop and animal
production, commodities.
2.4.2 Energy
162

Energy supply, energy use, energy balances, energy markets, energy efficiency. Excludes energy
prices (in 2.7).
2.4.3 Mining, manufacturing, construction
Statistics on specific industrial activities related to mining, manufacturing and construction.
2.4.4 Transport
Covers statistics on all modes of transport, equipment, transport infrastructure, passengers and freight
transport, road traffic accidents.
2.4.5 Tourism
Covers statistics regarding visitor activity, e.g. expenditures, arrivals/departures, overnight stays etc.
associated to inbound, outbound and domestic forms of tourism, on tourism infrastructure,
employment and tourism satellite accounts.
2.4.6 Banking, insurance, financial statistics
Money, banking and financial market statistics, interest rates, exchange rates, stock market indicators,
pension fund statistics.
2.5. Government finance, fiscal and public sector statistics
All statistics related to the government sector, including debt, deficit, revenue, expenditure, accounts of
the government sector, tax and benefit systems.
2.6. International trade and balance of payments
Statistics on all cross-border transactions recorded in the balance of payments, including foreign direct
investment, foreign aid.
2.7. Prices
Any statistics dealing with prices, including consumer price indices, producer price indices, price indexes
of specific products and services, purchasing power parities.
2.8. Labour costs
Statistics on labour costs, earnings, wages, both for structural and short-term statistics.
2.9. Science, technology and innovation
Covers activities on science, technology and innovation, research and development (R&D), patents,
knowledge based services.
163
3. Environment and multi-domain statistics
3.1 Environment
Includes climate, climate change, biodiversity, natural resources, soil, water, air, waste, pollution,
environmental accounts.
4. Methodology of data collection, processing, dissemination and analysis
Includes Metadata (4.1) Classifications (4.2) Data sources (4.3) Business and agricultural censuses and
registers (4.3.2) Household surveys (4.3.3) Business and agricultural surveys (4.3.4), Other administrative
surveys (4.3.5) Data editing and data linkage (4.4) Dissemination, data warehousing (4.5)
5. Strategic and managerial issues of official statistics
Includes Institutional frameworks and principles, role and organization of official statistics (5.1) Statistical
programmes, coordination within statistical systems (5.2) Quality frameworks and measurement of
performance of statistical systems and offices (5.3) Management and development of human resources (5.4)
Management and development of technological resources (5.5) Technical cooperation and capacity building
(5.7).
164
Annex 2. References
André Monty (2003): Relationship between Statistical, Accounting and Administrative Units. Statistics Canada
Australian and New Zealand Standard Industrial Classification (2006) Available from http://www.abs.gov.au/ANZSIC
Bank of England (2006): Cost-Benefit Analysis of Monetary and Financial Statistics: A Practical Guide, London: Bank of England. Available from www.bankofengland.co.uk/statistics/about/cba.pdf
Bergdahl, M. (2008): Process orientation at Statistics Sweden. Implementation and initial experiences. International Association for Official Statistics (IAOS) conference ´reshaping official statistics´. 14-16 October 2008, Shanghai.
Braaksma, B. (2007): Redesign of the chain of economic statistics in the Netherlands. Paper of the Seminar on Registers in Statistics - methodology and quality, 21 - 23 May, 2007, Helsinki.
Central Bureau of Statistics of the Netherlands (1996): Arbeidsrekeningen, Kern van het statistisch systeem over arbeid.
Classification of Products by Activity (CPA) (2008), Available from http://epp.eurostat.ec.europa.eu/statistics_explained/index.php/Glossary:CPA
Committee on Monetary, Financial and Balance of Payments Statistics (2011). Promoting Excellence in European Statistics”, CMFB, 20 years. Lisbon, November 2011. Available from http://www.cmfb.org/pdf/2011-11-25%20CMFB_Promoting%20Excellence%20in%20European%20Statistics.pdf
Commission of the European Communities (2009): Communication from the commission to the European parliament and the council. On the production of EU statistics: a vision for the next decade. Com 404 final, Brussels, 10.8.2009.
Cummings, Thomas G. & Worley, Christopher G. (2005): Organization Development and Change, 8th Ed., Mason: OH: Thomson South-Western.
Duncan, Joseph W. (1978): Revolution in United States Government Statistics, 1926-1976. Washington DC: U.S. Department of Commerce Office of Federal Statistical Policy and Standards.
European Central Bank (2008) The ECB Statistics Quality Framework and quality assurance procedures. Available from http://www.ecb.europa.eu/stats/html/sqf.en.html
European Commission, International Monetary Fund, Organisation for Economic Cooperation and Development, United Nations, World Bank (2009), System of National Accounts 2008 (2008 SNA)
Eurostat (2001): Handbook on Price and Volume Measures in National Accounts. Luxembourg: Office for Official Publications of the European Communities, ISBN 92-894-2000-6. Available from http://www.euklems.net/pub/eurostat_handbook_on_volumes_&_prices.pdf
Eurostat (2011): European Statistics Code of Practice for the national and Community Statistical Authorities. Adopted by the European Statistical Systems Committee, 28 September 2011. Available from
http://epp.eurostat.ec.europa.eu/portal/page/portal/quality/documents/CoP_October_2011.pdf FAO (1996): A System of Economic Accounts for Food and Agriculture: World Programme for the Census of
Agriculture 2010. Food and Agriculture Organization of the United Nations, Rome, Italy. FAO (2005): A System of Integrated Agricultural Censuses and Surveys. Food and Agriculture Organization of
the United Nations, Rome, Italy.
165
FAO, United Nations, World Bank (2010) Global Strategy to Improve Agricultural and Rural Statistics, Available from http://www.fao.org/fileadmin/templates/ess/documents/meetings_and_workshops/ICAS5/Ag_Statistics_Strategy_Final.pdf
Froyen, Richard T. (2005): Macroeconomics: Theories and Policies. New Jersey: Prentice Hall.
Grimm, Bruce T. and Teresa L. Weadock (2006): “Gross Domestic Product: Revisions and Source Data,” Survey of Current Business 86 February 11-15.
Holdren, Alyssa E. and Bruce T. Grimm (2008): “Gross Domestic Income: Revisions and Source Data,” Survey of Current Business 88 December 14-20, Available from http://www.bea.gov/scb/index.htm.
International Labour Organization, International Monetary Fund, Organisation for Economic and Co-operation and Development, Eurostat, United Nations Economic Commission for Europe and World Bank (2004): Consumer Price Index Manual: Theory and Practice, Geneva, International Labour Organisation. Available from: http://www.ilo.org/public/english/bureau/stat/guides/cpi/index.htm
International Monetary Fund (2003), External Debt Statistics: Guide for Compilers and Users, Available from
http://www.imf.org/external/pubs/ft/eds/Eng/Guide/index.htm International Monetary Fund, International Labour Organization, Organisation for Economic Co-operation and
Development, United Nations, Economic Commission for Europe and the World Bank (2004): Producer Price Index Manual: Theory and Practice, Washington, International Monetary Fund. Available from http://www.imf.org/external/np/sta/tegppi/index.htm
International Monetary Fund (2007), The System of Macroeconomic Accounts Statistics: An Overview International Monetary Fund (2008): Balance of Payments and International Investment Position Manual, Sixth
Edition (BPM6), IMF, Washington DC. Available from http://www.imf.org/external/pubs/ft/bop/2007/bopman6.htm
International Monetary Fund, International Labour Organization, Organisation for Economic Co-operation and Development, United Nations Economic Commission for Europe and World Bank (2009): Export and Import Price Index Manual. Theory and Practice. Washington, International Monetary Fund. Available from http://www.imf.org/external/np/sta/tegeipi/index.htm
Janssen, R.J.A. and S.B. Algera (1988): “The Methodology of the Dutch system of quarterly accounts,” CBS Occasional papers, NA-25.
Janssen, R.J.A (1999): “Economic indicators: research on the business cycle and quarterly national accounts,” chapter 15 in: Maarseveen, J.G.S.J. van and M.B.G. Gircour (eds.), A century of statistics, (Amsterdam: Stichting beheer IISG,).
Jorgenson, Dale W. Frank M. Gallop, and Barbara M. Fraumeni (1987): Productivity and U.S. Economic Growth, (Massachusetts: Harvard University Press).
Kuznets, Simon (1934): “National Income 1929-1932.” Senate Document No. 124, 73rd Congress, 2nd Session. Washington D.C.: U.S. Government Printing Office.
Lundberg, Erik (1992): (Royal Academy of Sciences)’s Nobel Award Ceremony speech honoring Sir Richard Stone. His full speech is included in Nobel Lectures, Economics 1981-1990.
Mäler, ed. (1992): An Analysis of the Sources of War Finance and Estimate of the National Income and Expenditure in 1938 and 1940.
Mäler, K.G. (Ed.) (1992): Nobel Lectures, Economics 1981-1990. Singapore: World Scientific Publishing Company.
166
Marcuss, Rosemary D. and Richard E. Kane (2007): “U.S. National Income and Product Statistics: Born of the Great Depression and World War II.” Survey of Current Business, 87(2): 32-45.
Morisi, Teresa (2003): "Recent Changes in the National Current Employment Statistics Survey," Monthly Labor Review, June.
National Statistics (2002): National Statistics Code of Practice: Statement of Principles, London: The Stationary Office (TSO). Available from http://www.statistics.gov.uk/about_ns/cop/default.asp
National Statistics (2004): National Statistics Code of Practice Protocol on Data Access and Confidentiality, London: The Stationary Office (TSO)). Available from http://www.statistics.gov.uk/about_ns/cop/default.asp
National Statistics (2008): National Statistics Code of Practice: Protocol on Statistical Integration and Classification, Revised version (original 2004), February 2008, London: national Statistics. London: The Stationary Office (TSO)). Available from http://www.statistics.gov.uk/about_ns/cop/default.asp
North American Industry Classification System (NAICS) (2007), Available from http://www.ntis.gov/products/naics.aspx
North American Product Classification Systems (NAPCS) (1999) Available from http://www.census.gov/eos/www/napcs/index.html
Organisation for Economic Co-operation and Development (2001): Measuring Productivity: Measurement of Aggregate and Industry-level Productivity Growth; OECD, Paris. Available from http://www.oecd.org/dataoecd/59/29/2352458.pdf
Organisation for Economic Co-operation and Development (2005): Measuring Globalisation: OECD Handbook
on Economic Globalization Indicators, OECD, Paris. Available from http://browse.oecdbookshop.org/oecd/pdfs/browseit/9205061E.PDF
Organisation for Economic Co-operation and Development (2008): OECD Benchmark Definition of Foreign
Direct Investment, fourth edition; OECD, Paris; Available from http://www.oecd.org/dataoecd/26/50/40193734.pdf
Rayner, E (2007): Creating a New Business Model for NZ's National Statistical Office of the 21st Century, paper presented to The Business Process Management Conference, Sydney, 13–16 March, 2007.
Renssen, R.H. and Delden, A. van (2009): Standardisation of design and production of statistics: a service oriented approach at Statistics Netherlands. SN Discussion Paper 09034.
Schenau, Sjoerd; Roel Delahaye, Cor Graveland and Maarten van Rossum (2009): The Dutch environmental accounts: present status and future developments, paper National Accounts Department, Statistics Netherlands.
Sauers, Renee, Edward Dozier, and Denis Caron (2008): “Reconciliation of the U.S.-Canadian Current Account, 2006-2007,” Survey of Current Business 88, November: pp 48-62.
Statistics Canada (2009): Draft report on Quality Assurance Frameworks for the 41st session of the UN Statistical Commission 2010, Version 1, September. Available along with comments from http://unstats.un.org/unsd/dnss/nqaf.aspx
Statistics New Zealand (2006): Statistics New Zealand’s generic Business Process Model (gBPM) v2, Statistics New Zealand, Wellington.
Statistical Office of the European Communities (Eurostat) (2005): European Statistics Code of Practice: For National and Community Statistical Authorities. Available from epp.eurostat.ec.europa.eu/portal/page/portal/.../code_practice.pdf
167
Statistical Classification of Economic Activities in the European Community (NACE) Rev.2 (2006), Available from http://epp.eurostat.ec.europa.eu/statistics_explained/index.php/Glossary:Statistical_classification_of_economic_activities_in_the_European_Community_(NACE)
Steeg, A. M. van de (2009): Accounting for Tourism, The Tourism Satellite Account (TSA) in Perspective, Statistics Netherlands and University of Groningen.
Survey of Current Business, 72(3): 27-28., Sir Richard Stone and the Development of National Economic Accounts.
Survey of Current Business, (volume 33), 19-32, Annual Supplement to the Survey of Current Business.
United Kingdom Statistics Authority (2009): Code of Practice for Official Statistics, January 2009, Edition 1.0, London: The UK Statistics Authority. Available from http://www.ons.gov.uk/about-statistics/ns-standard/cop/index.html.
United Nations (1954), Handbook of Statistical Organization, Department of International Economic and Social Affairs, Statistical Office, Studies in Methods, Series F, No. 6, New York: United Nations.
United Nations (1994a) Fundamental Principles of Official Statistics. Available from http://unstats.un.org/unsd/methods/statorg/FP-English.htm
United Nations (1994b). Strategies for Measuring Industrial Structure and Growth. Studies in Methods, No. 65. Sales No. E.94.XVII.11. Available from http://unstats.un.org/unsd/publication/SeriesF/SeriesF_65E.pdf.
United Nations (1998): International Merchandise Trade Statistics: Concepts and Definitions. Studies in Methods, Series M, No.52, Rev.2, United Nations Publication Sales No. E.98.XVII.16 Available from http://unstats.un.org/unsd/publication/SeriesM/SeriesM_52rev2E.pdf
United Nations (2003). Handbook of Statistical Organization, Third Edition. United Nations et al (2007): Rural Households’ Livelihood and Well-Being: Statistics on Rural Development and
Agriculture Household Income. United Nations Economic Commission for Europe, Food and Agriculture Organization of the United Nations, Organization for Economic Co-operation and Development, Statistical Office of the European Communities and World Bank, New York, United Nations Publication Sales No. E.07.II.E.14. Available from http://www.fao.org/fileadmin/templates/ess/pages/rural/index.htm
United Nations (2008a): International Standard Industrial Classification of All Economic Activities Revision 4,
New York, Statistical Papers Series M No. 4 Rev.4 United Nations Publication Sales No. E.08.XVII Available from http://unstats.un.org/unsd/cr/registry/isic-4.asp
United Nations (2008b): Central Product Classification Version 2. Department of Economic and Social Affairs,
Statistics Division, Statistical Papers, Series M, No 77, Ver. 2. United Nations Publications, Sales No.E.08.XVII.7. Available from http://unstats.un.org/unsd//cr/registry/cpc-2.asp
United Nations et al (2008c) Eurostat, Organization for Economic Co-operation and Development, World
Tourism Organization, United Nations (2008): 2008 Tourism Satellite Account: Recommended Methodological Framework. Luxembourg, Madrid, New York, Paris. United Nations publication sales No. E.01.XVII.9. Available from http://unstats.un.org/unsd/tradeserv/TSA%20RMF%202008%20edited%20whitecover.pdf
168
United Nations (2009a): International Recommendations on Industrial Statistics. Statistical Papers, Series M, No. 90, United Nations publication sales no. E.08.XVII.8 Available from http://unstats.un.org/unsd/EconStatKB/Attachment387.aspx
United Nations (2009b): International Recommendations for Distributive Trade Statistics. Statistical Papers,
Series M, No. 89, United Nations publication sales no. E.08.XVII.26 Available from http://unstats.un.org/unsd/EconStatKB/Attachment364.aspx
United Nations (2009c): Report on Global Initiatives to Improve Agricultural and Rural Statistics, Statistical
Commission Fortieth session, 2009, E/CN.3/2009/3 United Nations et al (2010): Manual on Statistics of International Trade in Services. International Monetary
Fund, Organization for Economic Co-operation and Development, Statistical Office of the European Union, United Nations Conference on Trade and Development, World Trade Organization and World Tourism Organization. United Nations publication Sales No.E.10.XVII.14
UNECE (2009a): General Statistical Business Processing Model, Paper prepared by Steven Vale and presented at the Joint UNECE/Eurostat/OECD Work Session on Statistical Metadata (METIS).
UNECE (2009b) Making data meaningful, Part 1: A guide to writing stories about numbers, Available from http://www.unece.org/stats/documents/writing/MDM_Part1_English.pdf
United States Generally Accepted Accounting Principles (U.S. GAAP) (2009), Available from http://cpaclass.com/gaap/gaap-us-01a.htm
Wouters, Hans (2008). Treatment of statistical discrepancies, internal paper of Statistics Netherlands
169