Embed Size (px)
Citation preview
0 EDGARS
UNAUDITED CONSOLIDATED RESULTSQ1:FY18
18 AUGUST 2017

1
AGENDA
1. Q1:FY18 OVERVIEW
2. MACRO ECONOMIC ENVIRONMENT
3. FINANCIAL REVIEW
4. STRATEGY AND TURNAROUND INITIATIVES
5. WAY FORWARD

2
Q1:FY18 OVERVIEW
• Edcon Group trading profit up 165.4% to R89 million from a loss of R136 million
• Pro-forma adjusted EBITDA increased by 12.7% to R354 million
• Like-for-like retail sales decreased by 1.4% while Edgars like-for-like sales rose 1.6% over the quarter
• Improved results delivered despite retail credit sales decreasing by 7.4% and cash sales down 8.0%
• Gross profit margin up 60 bps from 38.3% to 38.9%
• Overall sales performance impacted by the removal of certain international brands, sale of Legit and closure of stores and trading environment
• Compared to this time last year, Edcon traded with 219 less stores and a 4% reduction in square meterage
• Once off costs removed from the system following the exit of 27 international brands, non-productive space and the clearance of aged stock
EDGARS

3
Q1:FY18 OVERVIEW
• Stock disciplines resulting in inputs and clearance shifts into anormal retail cycle
• Strategy implementation well underway in Jet and Edgars, with improved sales performance
• Merchandise strategy of range rationalisation, focused supplier management, fresher stock and more competitive pricing
• Business model ‘test and learn’ process completed in CNA and Active
• The R1.5 billion investment in IT is underway to halve the IT costs by year three, and transform the Edcon IT infrastructure
• Staff retention improved with the stabilisation of the balance sheet and strategic transformation process
• Transition of company leadership progressing seamlessly
• Results validates turnaround strategy
EDGARSJET

4
EDCON HAS UNDERGONE A RESTRUCTURE TO STREAMLINE OPERATIONS ON CORE BUSINESS
SPECIALTY
CellularInternational Brands
We have made the strategic decision to re-align corporate divisions in order to streamline operations and optimise scale efficiencies found in the larger Edcon Brands.
PREVIOUS STRUCTURE: NEW STRUCTURE
SPECIALTY
International Brands Cellular*
Boardmans & Red Square have moved into the Edgars division
Edgars Active has moved into the Jet division
*Cellular is allocated to chains for reporting purposes
5
2. MACRO ECONOMIC ENVIRONMENTRICHARD VAUGHAN - CFO

6
22232425262728
(1)
-
1
2
3
06-2
016
07-2
016
08-2
016
09-2
016
10-2
016
11-2
016
12-2
016
01-2
017
02-2
017
03-2
017
04-2
017
05-2
017
06-2
017
Real GDP (y-o-y %) Unemployment rate (%)
GDP GROWTH AND UNEMPLOYMENT RATE
456789
06-2
016
07-2
016
08-2
016
09-2
016
10-2
016
11-2
016
12-2
016
01-2
017
02-2
017
03-2
017
04-2
017
05-2
017
06-2
017 4
5.5
7
8.5
10
11.5
06-2
015
08-2
015
10-2
015
12-2
015
02-2
016
04-2
016
06-2
016
08-2
016
10-2
016
12-2
016
02-2
017
04-2
017
06-2
017
EXCHANGE RATES
PRIVATE SECTOR CREDIT EXTENSION (Y-O-Y %) REPO AND PRIME RATE
EXCHANGE RATES
06-2
016
07-2
016
08-2
016
09-2
016
10-2
016
11-2
016
12-2
016
01-2
017
02-2
017
03-2
017
04-2
017
05-2
017
06-2
017
USDZAR EURZAR
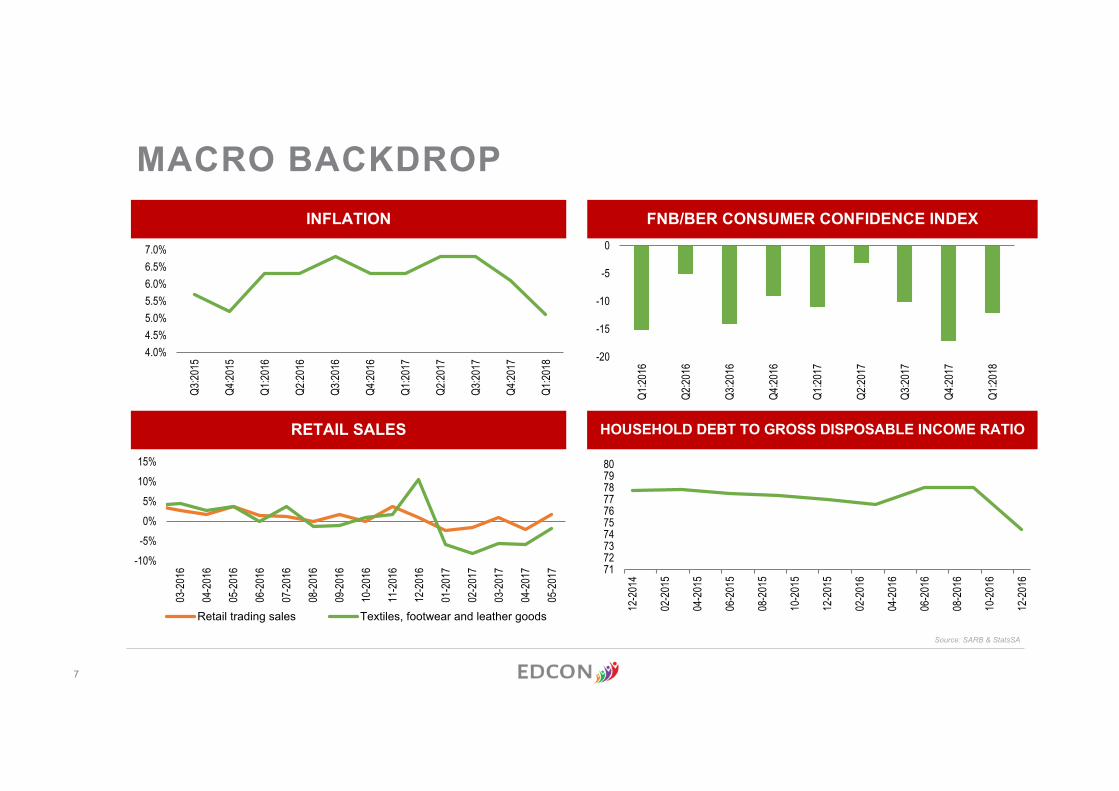
MACRO BACKDROP
Source: SARB & StatsSA
7
4.0%4.5%5.0%5.5%6.0%6.5%7.0%
Q3:20
15
Q4:20
15
Q1:20
16
Q2:20
16
Q3:20
16
Q4:20
16
Q1:20
17
Q2:20
17
Q3:20
17
Q4:20
17
Q1:20
18
INFLATION
-20
-15
-10
-5
0
Q1:20
16
Q2:20
16
Q3:20
16
Q4:20
16
Q1:20
17
Q2:20
17
Q3:20
17
Q4:20
17
Q1:20
18
-10%-5%0%5%
10%15%
03-2
016
04-2
016
05-2
016
06-2
016
07-2
016
08-2
016
09-2
016
10-2
016
11-2
016
12-2
016
01-2
017
02-2
017
03-2
017
04-2
017
05-2
017
Retail trading sales Textiles, footwear and leather goods
71727374757677787980
12-2
014
02-2
015
04-2
015
06-2
015
08-2
015
10-2
015
12-2
015
02-2
016
04-2
016
06-2
016
08-2
016
10-2
016
12-2
016
FNB/BER CONSUMER CONFIDENCE INDEX
RETAIL SALES HOUSEHOLD DEBT TO GROSS DISPOSABLE INCOME RATIO
Source: SARB & StatsSA
MACRO BACKDROP

8
3. FINANCIAL REVIEWBERNIE BROOKES – CEORICHARD VAUGHAN - CFO
9
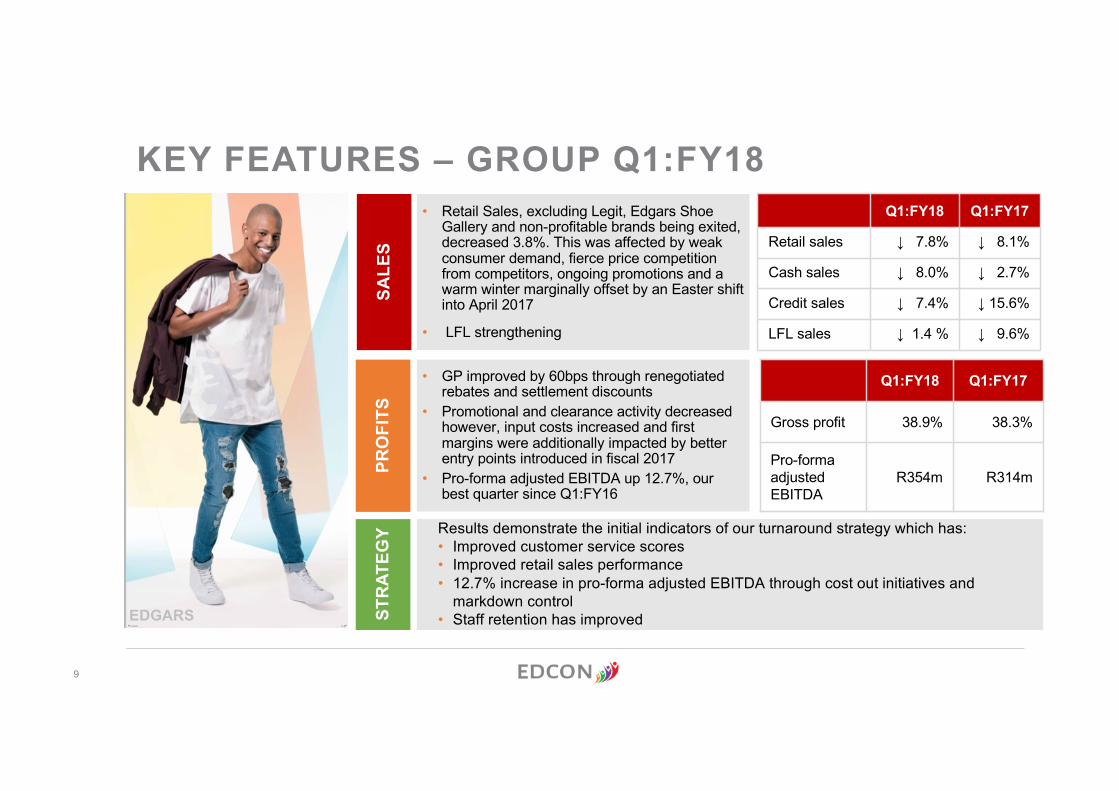
• Retail Sales, excluding Legit, Edgars Shoe Gallery and non-profitable brands being exited, decreased 3.8%. This was affected by weak consumer demand, fierce price competition from competitors, ongoing promotions and a warm winter marginally offset by an Easter shift into April 2017
• LFL strengthening
• GP improved by 60bps through renegotiated rebates and settlement discounts
• Promotional and clearance activity decreased however, input costs increased and first margins were additionally impacted by better entry points introduced in fiscal 2017
• Pro-forma adjusted EBITDA up 12.7%, our best quarter since Q1:FY16
Results demonstrate the initial indicators of our turnaround strategy which has:• Improved customer service scores• Improved retail sales performance • 12.7% increase in pro-forma adjusted EBITDA through cost out initiatives and
markdown control• Staff retention has improved
SALE
SPR
OFI
TSST
RAT
EGY
KEY FEATURES – GROUP Q1:FY18Q1:FY18 Q1:FY17
Retail sales ↓ 7.8% ↓ 8.1%
Cash sales ↓ 8.0% ↓ 2.7%
Credit sales ↓ 7.4% ↓ 15.6%
LFL sales ↓ 1.4 % ↓ 9.6%
Q1:FY18 Q1:FY17
Gross profit 38.9% 38.3%
Pro-forma adjusted EBITDA
R354m R314m
EDGARS

10
• Retail sales decreased 2.9%
- Improved customer experience, focused category management, driving credit and financial services products and change management is starting to show benefits to our customers with a positive 1.6% - LFL sales growth in Q1:FY18- Ladieswear, childrenswear, footwear and
cosmetics had positive retail sales growth- Cash sales decreased 0.5% and credit
sales decreased 5.5%- Easter shift to April 2017
• Gross margin of 42.4% up from 41.8%- Increased supplier discounts- Reduced markdown activity
• 3 new Edgars stores and 3 new Edgars Cosmetics Emporium stores opened
• 5 Edgars stores, 9 Edgars Cosmetics Emporium stores closed
Q1:FY18 Q1:FY17
Retail sales growth (%) (2.9) (8.5)
LFL sales growth (%) 1.6 (12.3)
GP margin (%) 42.4 41.8
Total number of stores 308 306
Capex spend (R’m) 66 61
Av space (‘000sqm) 765 765
EDGARS DIVISION – Q1:FY18219 stores* · LSM 6-10
*Includes 202 Edgars Stores, 1 Edgars sales store ,16 Edgars Cosmetics Emporium
40 stores · LSM 7-10
49 stores · LSM 5-10

11
• Retail sales decreased 2.3%- LFL sales growth decreased by 1.6% as
strategic initiatives started to show benefits through improved in-store experience, re-freshed business model, lay-bye offers, customer service and merchandise assortment improvements- Cash sales decreased 2.6% and credit sales
decreased by only 1.8%- Easter moved to April in 2017 from March
last year- Gross margin of 34.7% from 34.2%- Improved supplier rebates and discounts- Reduced markdown activity
• 20 new Jet stores and 2 Jet Mart stores opened
• 4 Jet stores, 3 Jet Mart stores and 1 Edgars Active Store closed
Q1:FY18 Q1:FY17
Retail sales growth (%) (2.3) (8.9)
LFL sales growth (%) (1.6) (8.4)
GP margin (%) 34.7 34.2
Total number of stores 711 700
Capex spend (R’m) 34 24
Av space (‘000sqm) 652 657
408 stores · LSM 4-7
122 stores · LSM 4-7
JET DIVISION – Q1:FY18
181 stores · LSM 4-7

12
• Includes CNA, mono-branded stores and Legit in Q1:FY18. Q1:FY17 additionally includes the entire Legit business and Edgars Shoe Gallery
• Excluding Legit, Edgars Shoe Gallery and unprofitable international brands, retail sales decreased 12.7% ( 37% reduction in meterage)- Cash sales decreased 40.8% (18.3% excl. Legit
and Edgars Shoe Gallery)- Credit sales decreased 39.4% (12.6% excl.
Legit and Edgars Shoe Gallery)• Margin improvement through:- Renegotiated supplier rebates and discounts- Excluding Legit, Edgars Shoe Gallery and
international brands being exited, gross margin % increased 340 bps to 39.5% from 36.1%
• 2 mono-branded opened
• 5 stores closed- 1 CNA and 4 mono-branded stores
• 10 Legit stores in Botswana disposed during the quarter
Q1:FY18 Q1:FY17
Retail sales growth (%) (40.5) (6.9)
LFL sales growth (%) (10.6) (7.0)
GP margin (%) 38.7 37.9
Total number of stores 266 496
Capex spend (R’m) 14 17
Av space (‘000sqm) 97 156
MONO-BRANDED STORES
195* stores · LSM 7-10
71 stores · LSM 5-10
*Includes 11 Samsung stores
10* stores · LSM 5-8*Stores in Botswana sold effective April 2017
SPECIALTY DIVISION – Q1:FY18

13
STATEMENT OF COMPREHENSIVE INCOME
(R millions) Q1:FY18 Q1:FY17 % change
Retail sales 5 508 5 973 (7.8)
Gross profit 2 142 2 286 (6.3)
Gross profit margin 38.9 38.3 0.6pts
Other income 327 454 (28.0)
Store costs (1 559) (1 703) (8.5)
Other operating costs(1) (1 003) (1 169) (14.2)
Share of profits of associates and insurance business 182 (4)
Trading profit 89 (136) 165.4
PROFORMA ADJUSTED EBITDA 354 314 12.7(1) Includes non-recurring costs of R10 million in Q1: FY18 (Q1: FY17 – R120 million). See cost analysis –Q1: FY18
14
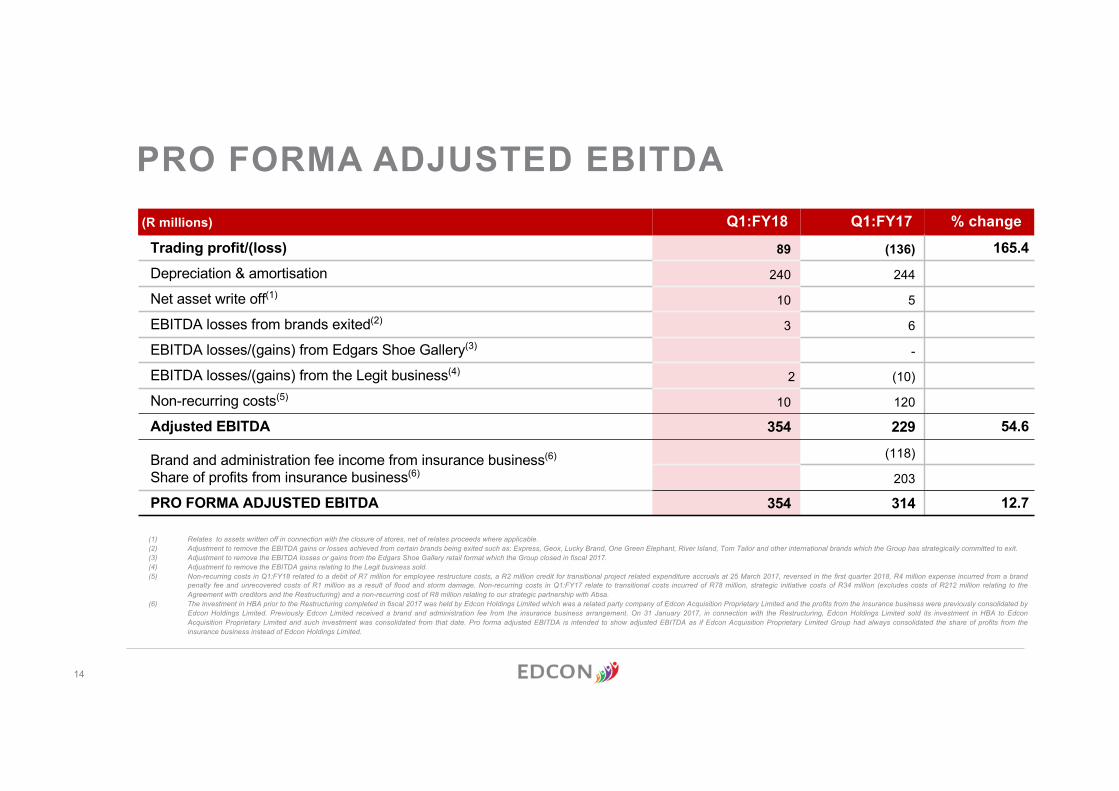
(R millions) Q1:FY18 Q1:FY17 % change Trading profit/(loss) 89 (136) 165.4Depreciation & amortisation 240 244
Net asset write off(1) 10 5
EBITDA losses from brands exited(2) 3 6
EBITDA losses/(gains) from Edgars Shoe Gallery(3) -
EBITDA losses/(gains) from the Legit business(4) 2 (10)
Non-recurring costs(5) 10 120
Adjusted EBITDA 354 229 54.6
Brand and administration fee income from insurance business(6)
Share of profits from insurance business(6)
(118)
203
PRO FORMA ADJUSTED EBITDA 354 314 12.7
(1) Relates to assets written off in connection with the closure of stores, net of relates proceeds where applicable.(2) Adjustment to remove the EBITDA gains or losses achieved from certain brands being exited such as: Express, Geox, Lucky Brand, One Green Elephant, River Island, Tom Tailor and other international brands which the Group has strategically committed to exit.(3) Adjustment to remove the EBITDA losses or gains from the Edgars Shoe Gallery retail format which the Group closed in fiscal 2017.(4) Adjustment to remove the EBITDA gains relating to the Legit business sold.(5) Non-recurring costs in Q1:FY18 related to a debit of R7 million for employee restructure costs, a R2 million credit for transitional project related expenditure accruals at 25 March 2017, reversed in the first quarter 2018, R4 million expense incurred from a brand
penalty fee and unrecovered costs of R1 million as a result of flood and storm damage. Non-recurring costs in Q1:FY17 relate to transitional costs incurred of R78 million, strategic initiative costs of R34 million (excludes costs of R212 million relating to theAgreement with creditors and the Restructuring) and a non-recurring cost of R8 million relating to our strategic partnership with Absa.
(6) The investment in HBA prior to the Restructuring completed in fiscal 2017 was held by Edcon Holdings Limited which was a related party company of Edcon Acquisition Proprietary Limited and the profits from the insurance business were previously consolidated byEdcon Holdings Limited. Previously Edcon Limited received a brand and administration fee from the insurance business arrangement. On 31 January 2017, in connection with the Restructuring, Edcon Holdings Limited sold its investment in HBA to EdconAcquisition Proprietary Limited and such investment was consolidated from that date. Pro forma adjusted EBITDA is intended to show adjusted EBITDA as if Edcon Acquisition Proprietary Limited Group had always consolidated the share of profits from theinsurance business instead of Edcon Holdings Limited.
PRO FORMA ADJUSTED EBITDA

15
OTHER OPERATING COSTS STORE COSTS
COST ANALYSIS Q1:FY18
• Other operating costs excl. non-recurring costs decreased by 5.3% attributable to renegotiated contracts offset by additional manpower costs for IT as the Group embarks on its IT strategy
• Store costs well managed decreasing by 8.5% - Closure of unprofitable stores during the
quarter - Rental and manpower constitute 61.7% of
total costs for Q1:FY18 (59.9% in Q1:FY17)
(R millions) Q1:FY18 Q1: FY17 % change
Other operating costs(excl. non-recurring costs)
993 1 049 (5.3)
Non-recurring costs10 120
TOTAL 1 003 1 169 (14.2)

16
CASH FLOW – Q1:FY18
198
117280
63101
OPERATING ACTIVITIES
OPENING CASH BALANCE
WORKING CAPITAL
MOVEMENT
CAPEX NET FINANCING COSTS
FINANCING ACTIVITIES
7
TAX
1 651
CLOSING CASH
BALANCE
455
(315)Trade and other
revceivables1Inventories
(23)
Trade and other payables
(1) Includes R39 million proceeds relating to the sale of the written down trade receivables book sold in fiscal 2017.
1 787
R’m Working capital

17
(R millions)(1) Cash PIK Q1:FY18 Q1:FY17Super Senior Secured debt
EUR Refinanced Facility A1 due 31 December 2017(2) E+4.00% 8.00% 632EUR Super Senior Facility due 31 December 2017 – Facility A2(2,3) E+4.00% 8.00% 1 972 2 075ZAR Super Senior RCF Term Loan due 31 December 2019(4) J+5.00% 3.00% 2 131 3 297
ZAR Converted revolving credit Facility until 31 December 2019(4,5)J+5.00% 3.00% 1 250
ZAR Super Senior Hedging Debt due 31 December 2017(6)JIBAR 8.00% 675
EUR Super Senior Term Loan due 31 December 2017(6) EURIBOR 8.00% 633EUR Super Senior PIK notes due 30 June 2019(6) 8.00% 1 842
Senior Secured debtZAR term loan due 31 December 2017(6) J+7.00% 3.00% 3 020EUR fixed rate note due 1 March 2018(6) 9.50% 10 244USD fixed rate note due 1 March 2018(6) 9.50% 3 780Lease liabilities 302 319
EUR Senior secured PIK Toggle notes due 30 June 2019(6) 9.75%(no toggle)
12.75%(toggle) 481
Other Loans (7) 206 304Gross third party debt 6 493 26 670Derivatives 50Cash held in escrow on Legit sale (634)Cash and cash equivalents (1 651) (1 111)
Net third party debt 4 208 25 609(1) FX rates at end Q1:FY17 were R15.19:$ and R16.81:€; and at the end of Q1:FY18 were R12.97:$ and R14.48:€.(2) The maturities may be extended in exchange for a cash margin uplift from 4.0% to 9.0% if certain leverage conditions are satisfied.(3) The maturity may be extended to 30 September 2018 or 31 December 2018 if certain leverage conditions are satisfied.(4) The maturity may be extended to 31 December 2020 if certain refinancing conditions are satisfied.(5) The total available facility is R1,825 million of which R575 million was undrawn at 24 June 2017. (6) This debt was restructured or amended as part of the Restructuring.(7) The portion of this debt relating to Zimbabwe was R137 million in Q1:FY18 and R229 million in Q1:FY17.(8) At the end of the period R204 million of a Super Senior LC facility were utilised for guarantees and LC’s.
EDGARS | WINTER 16
NET THIRD PARTY DEBT
JET

18
4. STRATEGY & TURNAROUND INITIATIVESBERNIE BROOKES - CEO

19
ROADMAP WITH STRATEGIC INITIATIVES2016 2017
INITIATIVESTATUS UPDATE
OCT NOV DEC JAN FEB MAR APR MAY JUN JUL AUG SEP
GROWTH
ENABLERS
COST
LEAN HQ & OPERATING MODEL
GNFR
COGS REDUCTION
PROPERTY
EDGARS CHAIN: TURNAROUND/CUSTOMER CENTRICITY
JET CHAIN: LEAN DISCOUNT RE-POSITIONING
SPECIALTY CHAINS: STRATEGY REVIEW AND REFRESH
CREDIT SALES
LOYALTY PROGRAM
CUSTOMER CENTRICITY
IT STRATEGY AND RENEWAL PLAN
SUPPLY CHAIN & LOGISTICS ROADMAP
SUPPLIER ENGAGEMENT
INVENTORY
Savings realized and locked in
Savings being realized
Savings being realized
Savings being realized
Initiatives underway – customer experience,category management, change management
Initiatives underway – In-store experience, every day low price & cost savings
Legit sale completePortfolio strategy review underway
Own book sales picking up ( over R400m)
Strategy developed and initial value target identified
NPS roll-out underway
Strategy and roadmap complete. RFP’s launched
Strategy and roadmap complete. Roll-out underway
Review underway
Review underway
1
2
3
4
5
6
7
8
9
10
11
12
13
14
20
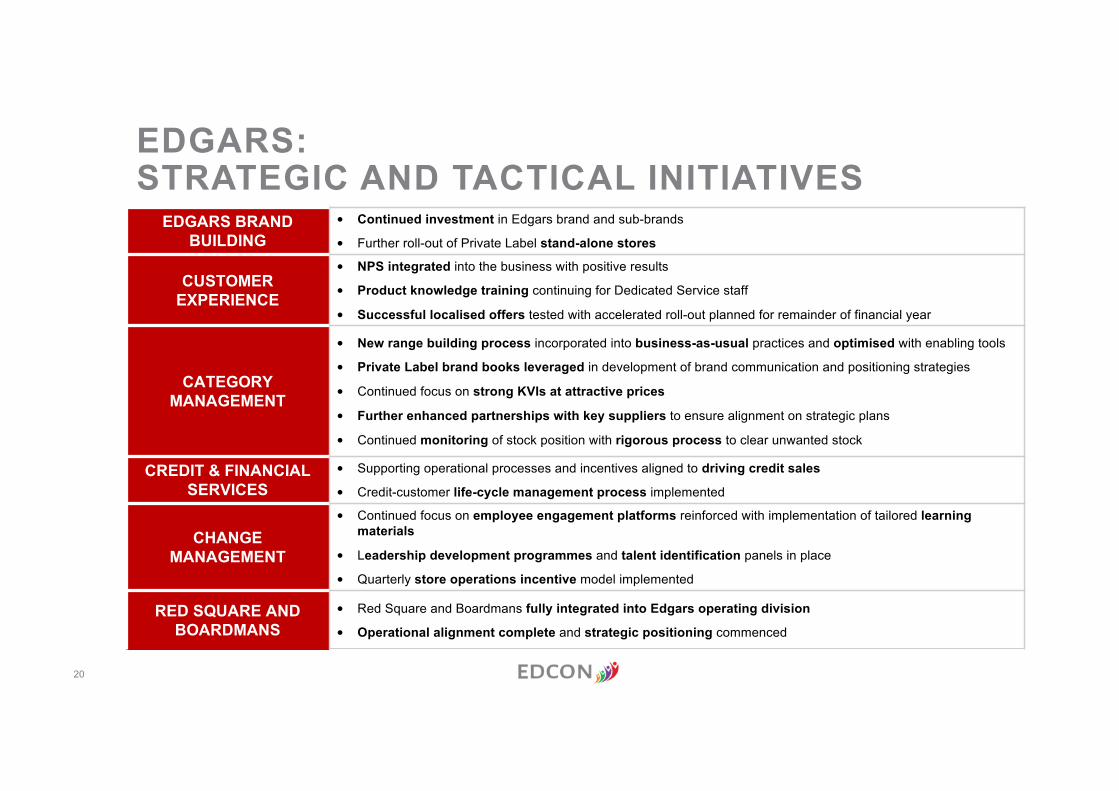
EDGARS: STRATEGIC AND TACTICAL INITIATIVES
EDGARS BRAND BUILDING
• Continued investment in Edgars brand and sub-brands
• Further roll-out of Private Label stand-alone stores
CUSTOMER EXPERIENCE
• NPS integrated into the business with positive results
• Product knowledge training continuing for Dedicated Service staff
• Successful localised offers tested with accelerated roll-out planned for remainder of financial year
CATEGORYMANAGEMENT
• New range building process incorporated into business-as-usual practices and optimised with enabling tools
• Private Label brand books leveraged in development of brand communication and positioning strategies
• Continued focus on strong KVIs at attractive prices
• Further enhanced partnerships with key suppliers to ensure alignment on strategic plans
• Continued monitoring of stock position with rigorous process to clear unwanted stock
CREDIT & FINANCIALSERVICES
• Supporting operational processes and incentives aligned to driving credit sales
• Credit-customer life-cycle management process implemented
CHANGEMANAGEMENT
• Continued focus on employee engagement platforms reinforced with implementation of tailored learning materials
• Leadership development programmes and talent identification panels in place
• Quarterly store operations incentive model implemented
RED SQUARE AND BOARDMANS
• Red Square and Boardmans fully integrated into Edgars operating division
• Operational alignment complete and strategic positioning commenced

21
JET: STRATEGIC AND TACTICAL INITIATIVES
SALES GROWTH
• Optimise store footprint: improve store productivity & profitability by identifying opportunities for consolidations, carve outs & reductions
• Turnaround JetMart: through localisation, changed customer perception and exiting categories that don’t fit with the brand
• New Growth: continued roll out of small store formats
• Category Management: recapture lost market share in key categories while remaining price competitive
• Redefine Active: stabilise and grow active to capture the youth market while improving profitability
• In-store experience: improved store shopping experience for customers through layout & visual changes
• Customer Centricity: embedded a truly effective customer centric marketing strategy that is right for the brand and rolled out NPS to all stores
GP IMPROVEMENT• Markdowns: improved GP through better markdown management
• Pricing: Continued focus on everyday low price items and key entry price points
CREDIT & FINANCIAL SERVICES
• Credit: Revised agreement with ABSA resulting in more control over new business credit sales• FS: Continue to drive additional income on insurance products through the operations channel
COST SAVINGS• Advertising: Revised strategy in place and has been realising media, cost and ROI efficiencies
• Lean operating model: Continued focus on cost savings
PEOPLE• Improving employee engagement: Continued focus on people initiatives to improve the employee experience that
empowers employees to deliver on business results• Improving strategic capability: Continued focus on leadership capability, through the launch of the Jet Retail and
Leadership Academy to improve leadership and functional competencies to deliver on business results

22
SPECIALTY: STRATEGIC AND TACTICAL INITIATIVES
• Consolidation of supplier base completed• Pilot revised product range and layout – CNA aims to re-establish itself as the dominant
stationery retailer through an expanded stationery range that includes a greater selection of fun and trendy products. This will be associated with a revised store layout to emphasise these changes
• Pilot of localised ranges under way to refine product offering by location• Ongoing evaluation of store network, including a potential revision in location strategy
CELLULAR
• Optimize range – Establish a top selling core range of products with localised supporting ranges of higher and lower selling price products tailored by geographic node
• Improved allocation - reduced store grids, to increase customer journey consistency and simplify processes
• Improve in-store visibility through in store advertising, and where possible relocating the Cellular pad closer to financial services
• Increase connections and improve customer life cycle management• Drive online sales
INTERNATIONAL BRANDS
• Continue exit of River Island and other underperforming in-store brands (River Island will continue to be available via their website)
• Continually engage on-going brands to collaboratively improve go to market propositions that deliver brand equity, aspirational product and customer experience while strengthening and enhancing the fashion credibility of the Edgars brand
• Right-size store footprint

23
SHIFTS & SAVINGS
• Increased collaboration, commitment and trust across the entire demand chain to achieve full potential.
• Focused on a lean sourcing operation through innovation, transparency and sustainabilityresulting in increased productivity per headcount
• On track to reduce reliance on indirect vendors (3rd party imports) from 44% to 17% by Winter 2018 • Shifts & vendor management across our direct vendor base to achieve estimated savings of 4% to
6%• Consolidation, across programs to maximise scale and drive volume• Increased vendor support for capability and capacity management• Reallocating sourcing geographies and vendors to align with market trends
LOCAL/REGIONAL FOCUS
• Total Direct Local / Regional spend to increase by 4% to 6% versus FY17• South African production estimated at 68 -72% of total Local / Regional spend • Increase Regional sourcing to support our Africa growth strategy• Achieve shorter lead-times by pursuing fabric bundling
CELROSE & EDDELS
• New denim plant fully operational, creating 150 new jobs • Established a dedicated knits line for ladieswear resulting in an additional 60 machinists• Product expansion to heels and boots together with 4 dedicated pump lines has resulted to 330 new
jobs
COGS: SAVINGS AND INITIATIVES

24
EFFICIENT LOGISTICS
• “Speedlining” initiative fully implemented and DC to store lead-times have reduced by 2.5 days• 80% of DC deliveries processed and dispatched to the depot on the same day• DC delivery windows for non replenishment product (Fashion) have been adjusted to ensure no stock
is held in the DC’s over weekends resulting in positive working capital benefit
• Continued collaboration with the chains to smooth weekly flow of inputs are yielding positive results with Merchant groups
• Design & implementation of the lead-time cube has increased visibility of lead-times across the Supply Chain network
MINIMAL STOCK ROOM PROCESSING
• Ramping up delivery of floor ready merchandise to stores i.e. Hanger Value Added Service (VAS), which helps free up store staff to focus on customer service
• The delivery of floor ready merchandise not only reduces processing times (store receipt to floor) but also stock losses/damages as merchandise is sent directly to the sales floor
IMPROVED ALLOCATION
• Hold back initiative has been rolled out with holdback styles performing well above the 15% markdown reduction target
• Shifting focus to multiple orders thereby reducing interest on inventory and improve working capital
SUPPLY CHAIN: STRATEGIC AND TACTICAL INITIATIVES

25
IT TRANSFORMATION UPATE
• Networks, Service Desk and Desktop renegotiations finalised
• Data Centre to be finalised by year endINFRASTRUCTURE
• RFP activity completed with contract awarded • Software license negotiations expected to be
finalised by end AugustINTEGRATION
• RFP activity nearing completion• Short-listed vendors selected and final
negotiations underwayPOS
MERCHANDISE AND PLANNING
FINANCE
BUSINESS INTELLIGENCE
• RFP activity nearing completion• Short-listed vendors selected and final
negotiations underway
• RFP activity nearing completion• Short-listed vendors selected and final
negotiations underway
• RFP activity nearing completion• Short-listed vendors selected and final
negotiations underway
IT ROADMAP DEVELOPED
3 year timeline for primary project delivery, starting with systems implementation mid-2017 after
completion of vendor contracting period

26
CREDIT, FINANCIAL SERVICES & COMMERCIAL SALES
CREDIT PORTFOLIO
• Revised Absa acquisition strategy positively driving credit sales: The revised strategy, which was implemented in November 2016, has resulted in stronger credit sales growth across all Chainsand is expected to gain further momentum over FY18 festive trade period
• Reintroduction of Regulatory compliant automated credit limit increases: The reintroduction of ACLI’s has resulted in positive growth in credit sales with the real benefit expected over the festive trade period
• Positive progress with revised compliance, new account application and credit limit increase processes: First phase of process expected to be implemented by October 2017 focused on improved customer experience
• Introduce targeted credit marketing campaigns, resulting in increased shopping frequency• Continuous focus collections efficiency, resulting in improved portfolio performance• Continue to consider various funding option for Edcon funded portfolio to support continuous
growth
FINANCIAL SERVICES PRODUCTS
• Continued strong performance of Hollard insurance partnership • Introduction of revised Legal product expected to further support growth
COMMERCIAL SALES GROWTH
• Commercial sales unit continues to positively contribute to Group sales• Gift card sales continue to show strong growth though new corporate partnerships• More focused 3rd party credit offering positively contributing to credit sales• Piloting corporate sales offering with strong future growth prospects• Piloting term loan financing model in selected CNA and JetMart stores to support big ticket item
sales
27
5. WAY FORWARDBERNIE BROOKES - CEO

28
WAY FORWARDThe roll-out of the strategic and tactical initiatives for all areas of the business will continue, which include:
• Enhancing the rationalisation of the overall range• Accelerating the store optimisation and service delivery model across
additional stores• Being even more competitive on price• Initiating faster stock turns• Improving the private label offering• Deliver floor ready merchandise to stores • Improved stock allocations• Completing the implementation of the Net Promotor Score (NPS) system,
while further embedding customer service into the various chains• Continue to develop Jet small store concept• Advancing the plans for the turn-around of CNA, Cellular and other
businesses.• Promote and support local manufacturing• Launch the new Thank U Loyalty Programme• Focus on preparation for Christmas
EDGARS

29 EDGARS
UNAUDITED CONSOLIDATED RESULTSQ1:FY18
18 AUGUST 2017
For more information: www.edcon.co.za | [email protected]
EDGARS