Embed Size (px)
Citation preview
Unaudited interim condensed financial statements For the six month period ended 30th June 2018
Registered office and principal place of business: Bank Dhofar Building Bank Al Markazi street Post Box 1507,Ruwi Postal Code 112 Sultanate of Oman
CONTENTS OF THE INTERIM CONDENSED FINANCIAL STATEMENTS
Page
The Board of Director’s report 1 & 2 Interim condensed statement of financial position 4 Interim condensed statement of comprehensive income 5 Interim condensed statement of changes in equity 6 to 8 Interim condensed statement of cash flows 9 Notes to the interim condensed financial statements 10 – 43
BANK DHOFAR S.A.O.G.
THE BOARD OF DIRECTORS’ REPORT FOR THE QUARTER ENDED
30th June 2018
Dear Shareholders,
On behalf of the Board of Directors of Bank Dhofar S.A.O.G., I am pleased to present to you the Bank’s Financial Statements for the quarter ended 30th June 2018.
The Bank’s Financial Performance during first half of 2018
The bank posted a net profit of OMR 24.949 million for the first half of 2018 compared to OMR 22.694 million same period last year, registering a year-on-year growth of 9.94%. Net Loans, Advances and Financing to customers’ is at OMR 3.126 billion as at 30th June 2018, compared to OMR 3.113 billion at the end of 30th June 2017, 0.42% increase. Customer Deposits, including Islamic deposits registered a growth of 4.73% to reach OMR 3.119 billion as at 30th June 2018 as compared to OMR 2.978 billion as at 30th June 2017. Net interest income and income from Islamic Financing activities for the six-months period ended 30th June 2018 stood at OMR 48.32 million compared to OMR 46.00 million for the first half of 2017, an increase of 5.04% year-on-year. Moreover, Non-interest income such as fees and commissions, foreign exchange profit, investment income etc. grew by 5.25% reaching OMR 17.04 during the 6-month period ended 30th of June 2018 million as against OMR 16.19 million for the same period last year. Total operating income reached OMR 65.36 million during first half 2018 as against OMR 62.19 million for the corresponding period of 2017, an increase of 5.10%. Operating cost to Operating Income ratio for the six-months period ended 30th June 2018 is at 50.72% as compared to 46.99% during the same period in 2017. Net provisions for loan impairment improved by 62.04% to OMR 2.38 million for the six-month period ended 30th June 2018 as against OMR 6.27 million during the same period of last year mainly due to recent changes in provision (Expected Credit Loss) calculation in compliance with International Financial Reporting Standards 9 (IFRS-9). Non-performing loans to gross loans ratio increased from 2.92% as at 30th June 2017 to 3.44% as at 30th June 2018, while Non-performing loans, net of interest suspense, to gross loans ratio stood at 1.86% as at 30th June 2018 as against 1.59% during the corresponding period of year 2017. The earnings per share (EPS) for the 6-months period ended 30th June 2018 are 0.009 similar to corresponding period of year 2017 of OMR 0.009.
Maisarah Financial Performance Highlights:-
Maisarah gross financing portfolio has grown from RO 351.15 million as at 30th June 2017 to OMR 369.29 million as at 30th June 2018, a growth of 5.17%. Gross Sukuk investment portfolio increased by 31.11% from OMR 32.139 million as at 30th June 2017 to OMR 42.139 million as at 30th June 2018. Total customer deposits is at OMR 312.44 million on 30th of June 2018, compared to OMR 314.99 30th June 2017. The net financing income after cost of funds increased by 29.33% year-on-year reaching OMR 4.819 million during half year ended 30th June 2018 compared to OMR 3.726 million same period 2017. Non-financing Income such as fees and commissions, foreign exchange profit, investment income and other income have increased by 77.47% to OMR 1.977 million first half 2018 compared to OMR 1.114 million first half of 2017. Cost to income ratio have improved to 49.60% for the period ended 30th June 2018 compared to 63.49% during same period of year 2017. Maisarah posted 6-months year to date profit before tax of OMR 3.456 million, an increase of 317.90% compared first half of 2017, OMR 827,000 thousand.
Awards & Accolades
Following key awards were won by the Bank during six months period ended 30th June 2018 and those awards are testimony to the continued efforts put in by the Bank in developing the Bank’s business:
No. 1 in Large Sized Banks Category at Best Banks Report by Oman Economic Review (OER)
Best Islamic bank in Oman - Maisarah Islamic Banking Services at the Middle East Banking Awards 2017 (EMEA Finance)
Best Corporate Banking Institution – Oman in The Business Awards 2017 by MEA Markets
Best Islamic Retail Bank Oman 2017 – Maisarah Islamic Banking by Global Banking & Finance Review
The Business Excellence Award from the BIZZ AWARDS (World Confederation of Business) 2018
Best mobile app from Pan Arab Web Awards 2018
Best Private Bank Oman 2017 – BankDhofar by Global Banking & Finance Review
Corporate Social Responsibility (CSR):
The Board of Directors contributed OMR 1 million in a demonstration of Bank’s support to the citizens in Dhofar and Wusta governorates to support the repair and restoration efforts for the damages caused by Cyclone Mekunu that hit Dhofar region in May 2018. Within the same context, BankDhofar also offered loan instalment deferments for customers in Dhofar Governorate as support to the affected families. BankDhofar has always been at the forefront in providing support to the community and continue delivering on its commitment to innovating strategic sustainable CSR initiatives ensuring lasting positive benefits to the local community.
Acknowledgment
On behalf of the Board, I would like to thank our valuable customers for their patronage and confidence reposed in the Bank. I thank the shareholders for the continuous support and the Bank’s diligent staff and management for the good performance during the period.
The Board of Directors also thanks the Central Bank of Oman and the Capital Market Authority for their valuable guidance to the local banking sector and the listed companies
Finally, the Board of Directors and all staff of the Bank would like to express our most sincere gratitude to His Majesty Sultan Qaboos Bin Said for his wise leadership and generous support to the private sector.
Eng. Abdul Hafidh Salim Rajab Al-Aujaili Chairman
BANK DHOFAR SAOG
___________________________________________________________________________ 4
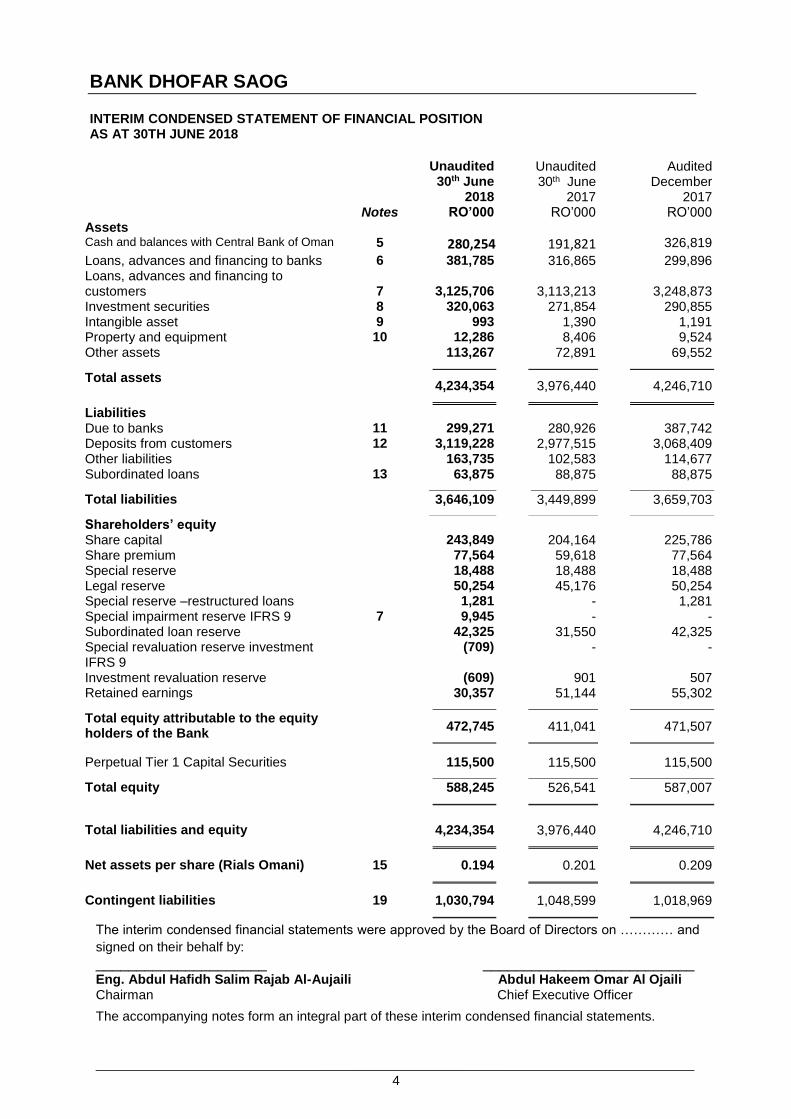
INTERIM CONDENSED STATEMENT OF FINANCIAL POSITION AS AT 30TH JUNE 2018
Unaudited
30th June 2018
Unaudited 30th June
2017
Audited December
2017 Notes RO’000 RO’000 RO’000
Assets Cash and balances with Central Bank of Oman 5 280,254 191,821 326,819
Loans, advances and financing to banks 6 381,785 316,865 299,896 Loans, advances and financing to customers
7
3,125,706
3,113,213
3,248,873
Investment securities 8 320,063 271,854 290,855 Intangible asset 9 993 1,390 1,191 Property and equipment 10 12,286 8,406 9,524 Other assets 113,267 72,891 69,552
Total assets 4,234,354 3,976,440 4,246,710
Liabilities Due to banks 11 299,271 280,926 387,742 Deposits from customers 12 3,119,228 2,977,515 3,068,409 Other liabilities 163,735 102,583 114,677 Subordinated loans 13 63,875 88,875 88,875
Total liabilities 3,646,109 3,449,899 3,659,703
Shareholders’ equity Share capital 243,849 204,164 225,786 Share premium 77,564 59,618 77,564 Special reserve 18,488 18,488 18,488 Legal reserve 50,254 45,176 50,254 Special reserve –restructured loans 1,281 - 1,281 Special impairment reserve IFRS 9 7 9,945 - - Subordinated loan reserve 42,325 31,550 42,325 Special revaluation reserve investment IFRS 9
(709) - -
Investment revaluation reserve (609) 901 507 Retained earnings 30,357 51,144 55,302
Total equity attributable to the equity holders of the Bank
472,745 411,041 471,507
Perpetual Tier 1 Capital Securities 115,500 115,500 115,500
Total equity 588,245 526,541 587,007
Total liabilities and equity 4,234,354 3,976,440 4,246,710
Net assets per share (Rials Omani) 15 0.194 0.201 0.209
Contingent liabilities 19 1,030,794 1,048,599 1,018,969
The interim condensed financial statements were approved by the Board of Directors on ………… and
signed on their behalf by:
_____________________ __________________________ Eng. Abdul Hafidh Salim Rajab Al-Aujaili Abdul Hakeem Omar Al Ojaili Chairman Chief Executive Officer
The accompanying notes form an integral part of these interim condensed financial statements.
BANK DHOFAR SAOG
___________________________________________________________________________ 5
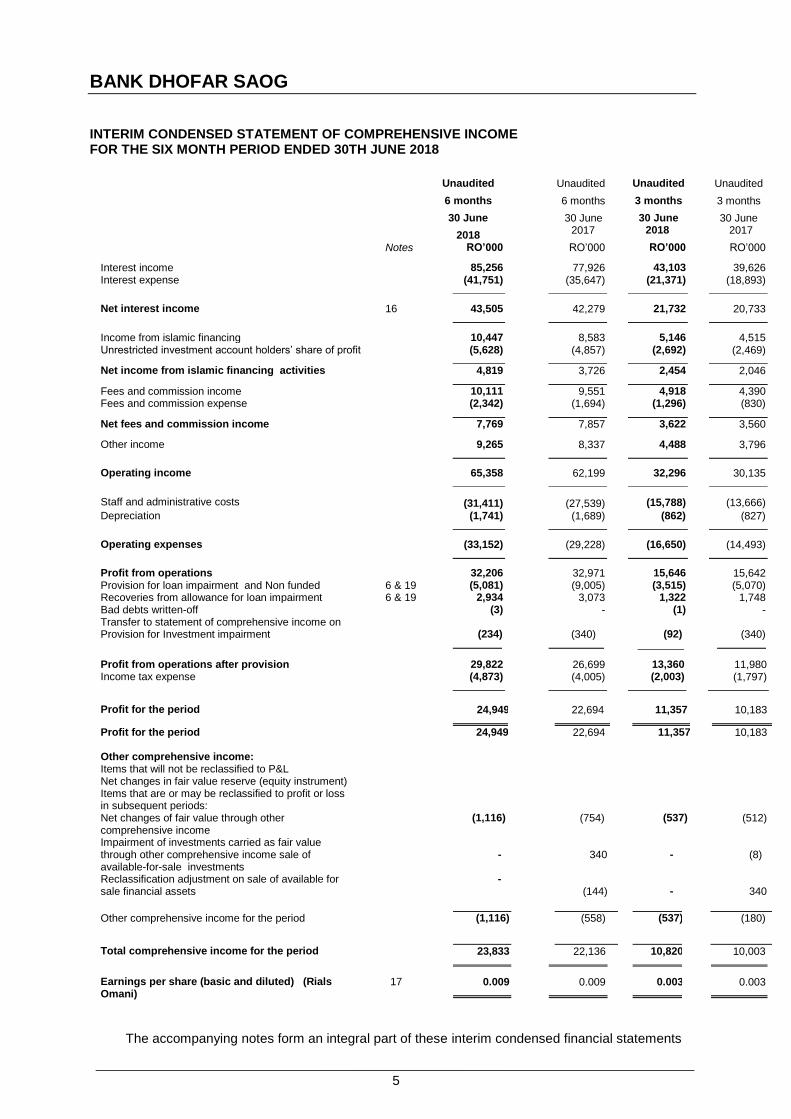
INTERIM CONDENSED STATEMENT OF COMPREHENSIVE INCOME FOR THE SIX MONTH PERIOD ENDED 30TH JUNE 2018 Unaudited
6 months
30 June
2018
Unaudited
6 months
30 June 2017
Unaudited
3 months
30 June 2018
Unaudited
3 months
30 June 2017
Notes RO’000 RO’000 RO’000 RO’000
Interest income 85,256 77,926 43,103 39,626 Interest expense (41,751) (35,647) (21,371) (18,893)
Net interest income 16 43,505 42,279 21,732 20,733
Income from islamic financing 10,447 8,583 5,146 4,515 Unrestricted investment account holders’ share of profit (5,628) (4,857) (2,692) (2,469)
Net income from islamic financing activities 4,819 3,726 2,454 2,046
Fees and commission income 10,111 9,551 4,918 4,390 Fees and commission expense (2,342) (1,694) (1,296) (830)
Net fees and commission income 7,769 7,857 3,622 3,560 Other income 9,265 8,337 4,488 3,796
Operating income 65,358 62,199 32,296 30,135
Staff and administrative costs (31,411) (27,539) (15,788) (13,666)
Depreciation (1,741) (1,689) (862) (827)
Operating expenses (33,152) (29,228) (16,650) (14,493)
Profit from operations 32,206 32,971 15,646 15,642 Provision for loan impairment and Non funded 6 & 19 (5,081) (9,005) (3,515) (5,070) Recoveries from allowance for loan impairment 6 & 19 2,934 3,073 1,322 1,748 Bad debts written-off (3) - (1) - Transfer to statement of comprehensive income on Provision for Investment impairment
(234)
(340)
(92)
(340)
Profit from operations after provision 29,822 26,699 13,360 11,980 Income tax expense (4,873) (4,005) (2,003) (1,797)
Profit for the period 24,949 22,694 11,357 10,183
Profit for the period 24,949
22,694 11,357 10,183
Other comprehensive income: Items that will not be reclassified to P&L Net changes in fair value reserve (equity instrument) Items that are or may be reclassified to profit or loss in subsequent periods:
Net changes of fair value through other comprehensive income
(1,116) (754) (537) (512)
Impairment of investments carried as fair value through other comprehensive income sale of available-for-sale investments
-
340
-
(8)
Reclassification adjustment on sale of available for sale financial assets
- (144)
-
340
Other comprehensive income for the period (1,116) (558) (537) (180)
Total comprehensive income for the period 23,833 22,136 10,820 10,003
Earnings per share (basic and diluted) (Rials Omani)
17 0.009 0.009 0.003 0.003
The accompanying notes form an integral part of these interim condensed financial statements

BANK DHOFAR SAOG
______________________________________________________________________________________________________________________ 6
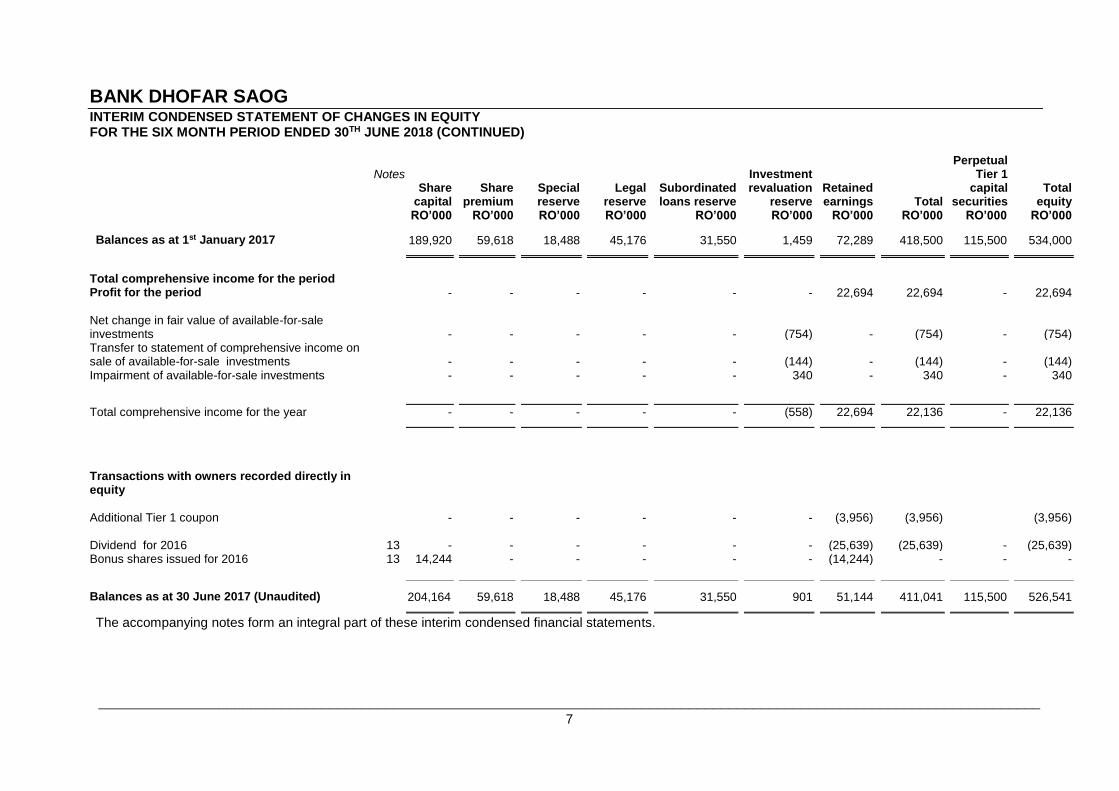
INTERIM CONDENSED STATEMENT OF CHANGES IN EQUITY FOR THE SIX MONTH PERIOD ENDED 30TH JUNE 2018
Notes
Share
capital
Share
premium
Legal
reserve
Special reserve
Special reserve
restructure
Special
impairment reserve IFRS9
Special
revaluation reserve IFRS9
Subordinat
ed loans reserve
Investment revaluation
reserve
Retained earnings
Total
Perpetual Tier 1
capital securities
Total
equity
RO’000 RO’000 RO’000 RO’000 RO’000 RO’000 RO’000 RO’000 RO’000 RO’000 RO’000 RO’000 RO’000 Balances as at 1 January 2018 225,786 77,564 50,254 18,488 1,281 - - 42,325 507 55,302 471,507 115,500 587,007 [[ [ [ [ [ [ [ [ [ [ [ [ [[ [ [
Changes on initial application of IFRS 9
-
-
-
-
-
8,455
(709)
-
-
709
8,455
-
8,455
Restated balance on 1 January 2018
225,786
77,564
50,254
18,488
1,281
8,455
(709)
42,325
507
56,011
479,962
115,500
595,462
Profit for the period - - - - - - - - - 24,949 24,949 - 24,949 Other comprehensive income for the period
Net changes of fair value through other comprehensive income
- - - - - - - - (1,116) - (1,116) (1,116)
Total comprehensive income for the period
-
-
-
-
-
-
-
- (1,116)
24,949
23,833
-
23,833
Transfer to Special impairment reserve IFRS9
-
-
-
-
-
1,490
-
-
-
(1,490)
-
-
-
Additional Tier 1 coupon
- - - - - - - - - (3,956) (3,956) - (3,956)
Transactions with owners recorded directly in equity
-
Dividend for 2017 14 - - - - - - - - - (27,094) (27,094) - (27,094)
Bonus shares issued for 2017 14 18,063 - - - - - - - - (18,063) - - -
[ [ [
Balances as at 30 June 2018 243,849 77,564 50,254 18,488 1,281 9,945 (709) 42,325 (609) 30,357 472,745 115,500 588,245
The accompanying notes form an integral part of these interim condensed financial statements.
BANK DHOFAR SAOG
______________________________________________________________________________________________________________________ 7
INTERIM CONDENSED STATEMENT OF CHANGES IN EQUITY FOR THE SIX MONTH PERIOD ENDED 30TH JUNE 2018 (CONTINUED)
Notes
Share capital
Share premium
Special reserve
Legal reserve
Subordinated loans reserve
Investment revaluation
reserve
Retained earnings
Total
Perpetual Tier 1
capital securities
Total equity
RO’000 RO’000 RO’000 RO’000 RO’000 RO’000 RO’000 RO’000 RO’000 RO’000
Balances as at 1st January 2017 189,920 59,618 18,488 45,176 31,550 1,459 72,289 418,500 115,500 534,000
Total comprehensive income for the period Profit for the period
-
-
-
-
-
-
22,694
22,694
-
22,694 Net change in fair value of available-for-sale investments
-
-
-
-
-
(754)
-
(754)
-
(754)
Transfer to statement of comprehensive income on sale of available-for-sale investments
-
-
-
-
-
(144)
-
(144)
-
(144)
Impairment of available-for-sale investments - - - - - 340 - 340 - 340
Total comprehensive income for the year - - - - - (558) 22,694 22,136 - 22,136
Transactions with owners recorded directly in equity
Additional Tier 1 coupon
- - - - - - (3,956) (3,956) (3,956)
Dividend for 2016 13 - - - - - - (25,639) (25,639) - (25,639) Bonus shares issued for 2016 13 14,244 - - - - - (14,244) - - -
Balances as at 30 June 2017 (Unaudited) 204,164 59,618 18,488 45,176 31,550 901 51,144 411,041 115,500 526,541
The accompanying notes form an integral part of these interim condensed financial statements.
BANK DHOFAR SAOG
______________________________________________________________________________________________________________________ 8
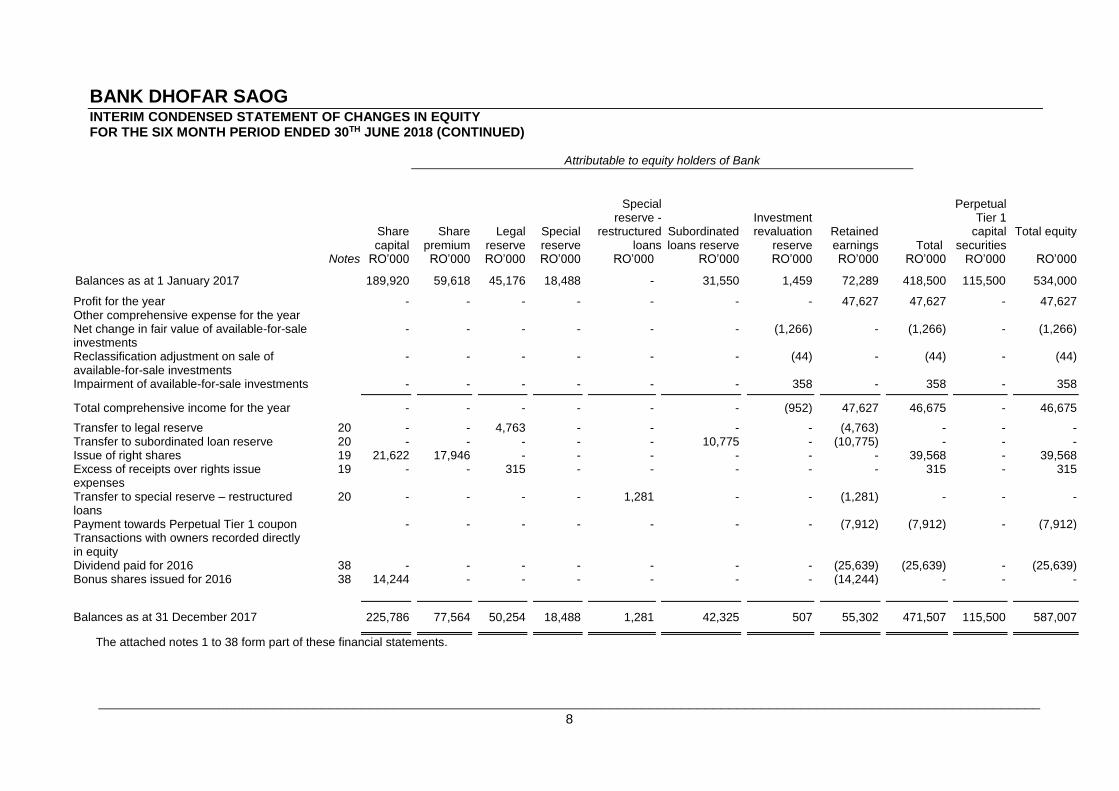
INTERIM CONDENSED STATEMENT OF CHANGES IN EQUITY FOR THE SIX MONTH PERIOD ENDED 30TH JUNE 2018 (CONTINUED)
Attributable to equity holders of Bank
Share capital
Share premium
Legal reserve
Special reserve
Special reserve -
restructured loans
Subordinated loans reserve
Investment revaluation
reserve
Retained earnings
Total
Perpetual Tier 1
capital securities
Total equity
Notes RO’000 RO’000 RO’000 RO’000 RO’000 RO’000 RO’000 RO’000 RO’000 RO’000 RO’000
Balances as at 1 January 2017 189,920 59,618 45,176 18,488 - 31,550 1,459 72,289 418,500 115,500 534,000
Profit for the year - - - - - - - 47,627 47,627 - 47,627 Other comprehensive expense for the year Net change in fair value of available-for-sale investments
- - - - - - (1,266) - (1,266) - (1,266)
Reclassification adjustment on sale of available-for-sale investments
- - - - - - (44) - (44) - (44)
Impairment of available-for-sale investments - - - - - - 358 - 358 - 358
Total comprehensive income for the year - - - - - - (952) 47,627 46,675 - 46,675
Transfer to legal reserve 20 - - 4,763 - - - - (4,763) - - - Transfer to subordinated loan reserve 20 - - - - - 10,775 - (10,775) - - - Issue of right shares 19 21,622 17,946 - - - - - - 39,568 - 39,568 Excess of receipts over rights issue expenses
19 - - 315 - - - - - 315 - 315
Transfer to special reserve – restructured loans
20 - - - - 1,281 - - (1,281) - - -
Payment towards Perpetual Tier 1 coupon - - - - - - - (7,912) (7,912) - (7,912) Transactions with owners recorded directly in equity
Dividend paid for 2016 38 - - - - - - - (25,639) (25,639) - (25,639) Bonus shares issued for 2016 38 14,244 - - - - - - (14,244) - - -
Balances as at 31 December 2017 225,786 77,564 50,254 18,488 1,281 42,325 507 55,302 471,507 115,500 587,007
The attached notes 1 to 38 form part of these financial statements.
BANK DHOFAR SAOG
_____________________________________________________________________________ 9
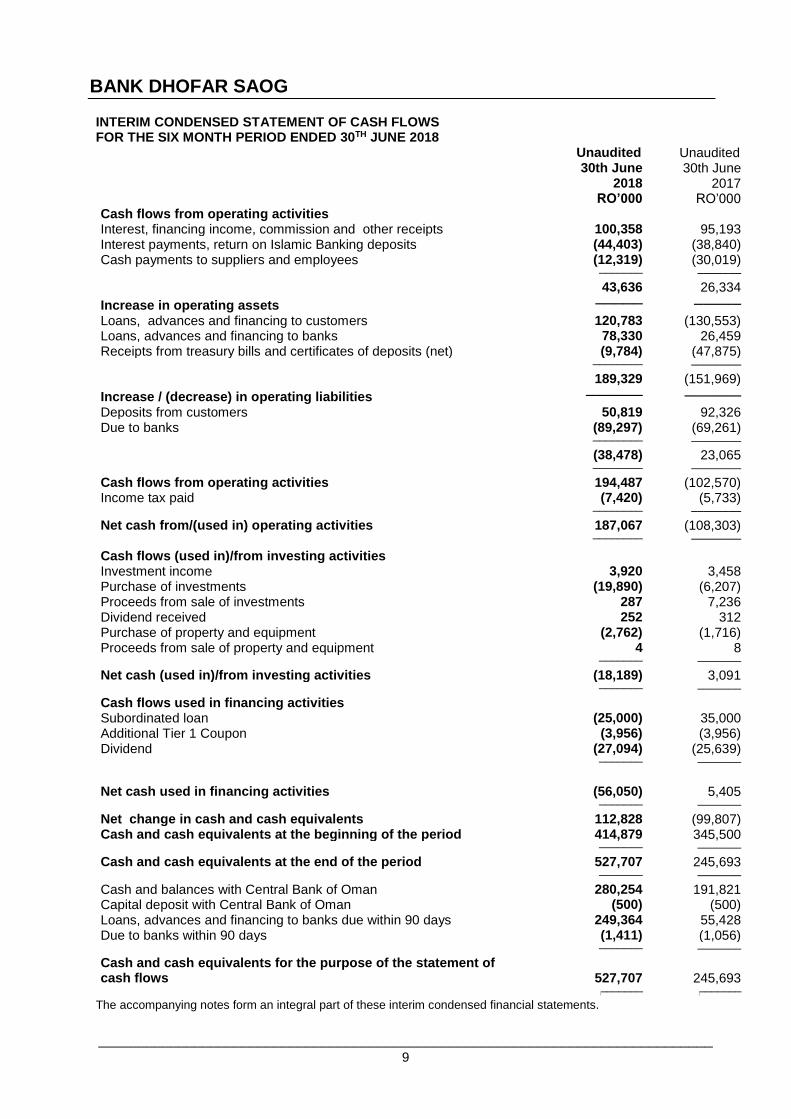
INTERIM CONDENSED STATEMENT OF CASH FLOWS FOR THE SIX MONTH PERIOD ENDED 30TH JUNE 2018
Unaudited 30th June
2018
Unaudited 30th June
2017 RO’000 RO’000 Cash flows from operating activities Interest, financing income, commission and other receipts 100,358 95,193 Interest payments, return on Islamic Banking deposits (44,403) (38,840) Cash payments to suppliers and employees (12,319) (30,019) ─────── ───────
43,636 26,334
Increase in operating assets ───── ─────
Loans, advances and financing to customers 120,783 (130,553) Loans, advances and financing to banks 78,330 26,459 Receipts from treasury bills and certificates of deposits (net) (9,784) (47,875) ──────── ────────
189,329 (151,969)
Increase / (decrease) in operating liabilities ────── ──────
Deposits from customers 50,819 92,326 Due to banks (89,297) (69,261) ──────── ────────
(38,478) 23,065 ──────── ────────
Cash flows from operating activities 194,487 (102,570) Income tax paid (7,420) (5,733) ──────── ────────
Net cash from/(used in) operating activities 187,067 (108,303) ──────── ────────
Cash flows (used in)/from investing activities Investment income 3,920 3,458 Purchase of investments (19,890) (6,207) Proceeds from sale of investments 287 7,236 Dividend received 252 312 Purchase of property and equipment (2,762) (1,716) Proceeds from sale of property and equipment 4 8 ─────── ───────
Net cash (used in)/from investing activities (18,189) 3,091 ─────── ───────
Cash flows used in financing activities Subordinated loan (25,000) 35,000 Additional Tier 1 Coupon (3,956) (3,956) Dividend (27,094) (25,639) ─────── ───────
Net cash used in financing activities
(56,050)
5,405 ─────── ───────
Net change in cash and cash equivalents 112,828 (99,807) Cash and cash equivalents at the beginning of the period 414,879 345,500 ─────── ───────
Cash and cash equivalents at the end of the period 527,707 245,693 ─────── ───────
Cash and balances with Central Bank of Oman 280,254 191,821 Capital deposit with Central Bank of Oman (500) (500) Loans, advances and financing to banks due within 90 days 249,364 55,428 Due to banks within 90 days (1,411) (1,056) ─────── ───────
Cash and cash equivalents for the purpose of the statement of cash flows
527,707
245,693
[─────── [─────── The accompanying notes form an integral part of these interim condensed financial statements.
BANK DHOFAR SAOG
_____________________________________________________________________________ 10
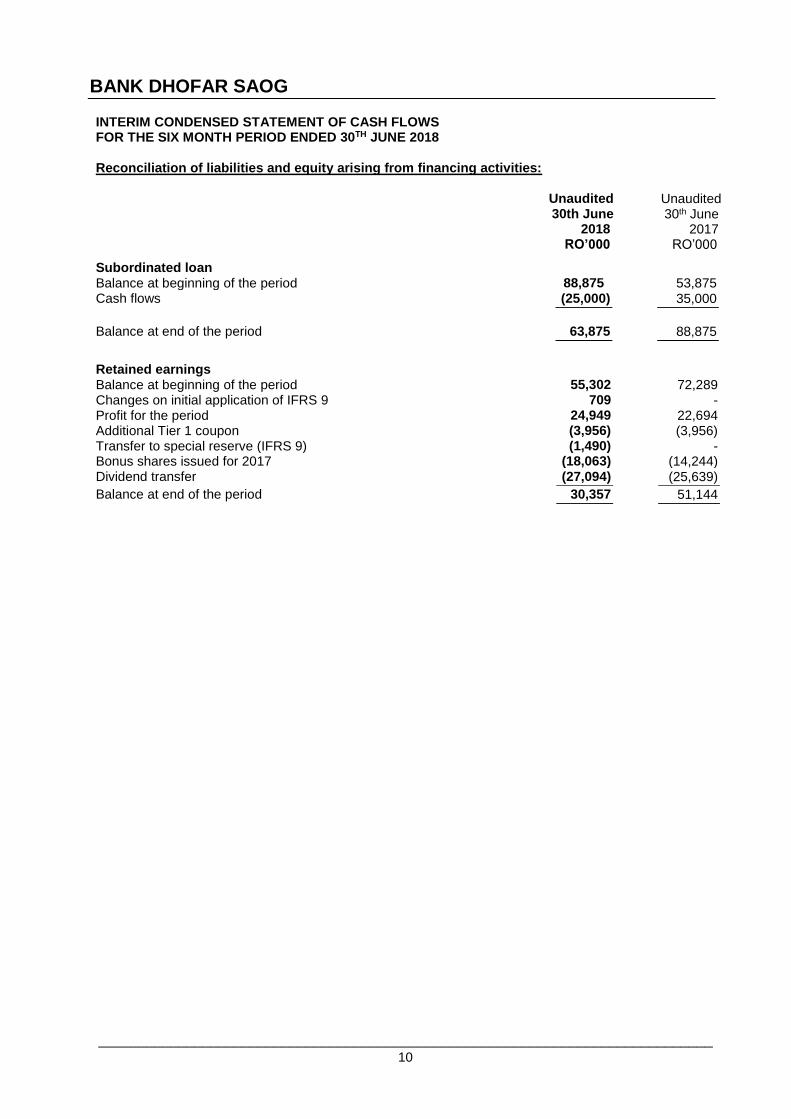
INTERIM CONDENSED STATEMENT OF CASH FLOWS FOR THE SIX MONTH PERIOD ENDED 30TH JUNE 2018 Reconciliation of liabilities and equity arising from financing activities:
Unaudited 30th June
2018
Unaudited 30th June
2017 RO’000 RO’000
Subordinated loan Balance at beginning of the period 88,875 53,875 Cash flows (25,000) 35,000 Balance at end of the period 63,875 88,875
Retained earnings Balance at beginning of the period 55,302 72,289 Changes on initial application of IFRS 9 709 - Profit for the period 24,949 22,694 Additional Tier 1 coupon (3,956) (3,956) Transfer to special reserve (IFRS 9) (1,490) - Bonus shares issued for 2017 (18,063) (14,244) Dividend transfer (27,094) (25,639)
Balance at end of the period 30,357 51,144
BANK DHOFAR SAOG
_____________________________________________________________________________ 11
NOTES TO THE INTERIM CONDENSED FINANCIAL STATEMENTS FOR THE SIX MONTH PERIOD ENDED 30 JUNE 2018
1. LEGAL STATUS AND PRINCIPAL ACTIVITIES
Bank Dhofar SAOG (the “Bank”) is incorporated in the Sultanate of Oman as a public joint stock
company and is principally engaged in corporate, retail and investment banking activities through a
network of 70 branches (30 June 2017: 68 branches) which comprises of 10 Islamic branches (30th June
2017: 10 Islamic branches) and 60 conventional branches (30 June 2017: 58 conventional branches). The
Bank’s Islamic Banking Window, Maisarah Islamic Banking Services has an allocated capital of RO 55
million from the core paid up capital of the shareholders. The Bank has a primary listing on the Muscat
Securities Market (“MSM”) and the Bank’s Perpetual Tier 1 Capital Securities are listed on Irish Stock
Exchange. The principal place of business is the Head Office, Capital Business District (“CBD”),
Muscat, Sultanate of Oman.
The Bank employed 1,570 employees as of 30 June 2018 (30 June 2017: 1,486 employees).
2 BASIS OF PREPARATION
2.1 Statement of compliance and basis of accounting
The unaudited interim condensed financial statements for the six month period ended 30 June 2018 of the
Bank are prepared in accordance with International Accounting Standard (IAS) 34, ‘Interim Financial
Reporting’, applicable regulations of the Central Bank of Oman (CBO) and the disclosure requirements
set out in the Rules and Disclosure and Proformas issued by the Capital Market Authority (CMA).
These unaudited interim condensed financial statements have been prepared in accordance with IAS 34
Interim Financial Reporting, and should be read in conjunction with the Bank’s last annual financial
statements as at and for the year ended 31 December 2017 (‘the last annual financial statements’).
They do not include all the information required for a complete set of IFRS financial statements.
However, selected explanatory notes are included to explain events and transactions that are significant
to an understanding of the changes in the Bank’s financial position and performance since the last annual
financial statements.
This is the first year Bank’s financial statements where IFRS 15 and IFRS 9 have been applied. Changes
to significant accounting policies are described in Note 3.
2.2 Functional and presentation currency
Items included in the Bank’s financial statements are measured using Rial Omani which is the currency
of the primary economic environment in which the Bank operates, rounded off to the nearest thousand.
2.3 Use of estimates and judgments
In preparing these interim condensed financial statements, management has made judgments, estimates
and assumptions that affect the application of accounting policies and the reported amounts of assets and
liabilities, income and expense. Actual results may differ from these estimates.
The significant judgments made by management in applying the Bank’s accounting policies and the key
sources of estimation uncertainty were the same as those that applied to the financial statements as at and
for the year ended 31 December 2017, except for new significant judgments and key sources of
estimation uncertainty related to the application of IFRS 15 and IFRS 9, which are described in Note 3.
BANK DHOFAR SAOG
_____________________________________________________________________________ 12
NOTES TO THE INTERIM CONDENSED FINANCIAL STATEMENTS FOR THE SIX MONTH PERIOD ENDED 30TH JUNE 2018
3 Changes in significant accounting policies
Except as described below, the accounting policies applied in these unaudited interim condensed
financial statements are same as those applied in the Bank’s financial statements as at and for the year
ended 31 December 2017.
The changes in accounting policies are also expected to be reflected in the Bank’s financial statements as
at and for the year ending 31 December 2018.
The Bank has initially adopted IFRS 15 Revenue from Contracts with Customers and IFRS 9 Financial
Instruments from 1 January 2018. A number of other new standards are effective from 1 January 2018
but they do not have a material effect on the Bank’s financial statements.
A. IFRS 9 Financial instruments
The Bank has adopted IFRS 9 as issued by the IASB in July 2014 with a date of initial application of 1
January 2018. The key changes to the Bank’s accounting policies resulting from its adoption of IFRS 9
are recognized below.
Classification of financial assets and financial liabilities
IFRS 9 contains three principal classification categories for financial assets: measured at amortized
cost, fair value through other comprehensive income (FVOCI) and fair value through profit or loss
(FVTPL).
On initial recognition, a financial asset is classified as measured at amortised cost, FVOCI or
FVTPL.
A financial asset is measured at amortised cost if it meets both of the following conditions and is not
designated as at FVTPL:
• the asset is held within a business model whose objective is to hold assets to collect contractual
cash flows; and
• the contractual terms of the financial asset give rise on specified dates to cash flows that are solely
payments of principal and interest on the principal amount outstanding.
A debt instrument is measured at FVOCI only if it meets both of the following conditions and is not
designated as at FVTPL:
• the asset is held within a business model whose objective is achieved by both collecting contractual
cash flows and selling financial assets; and
• the contractual terms of the financial asset give rise on specified dates to cash flows that are solely
payments of principal and interest on the principal amount outstanding.
BANK DHOFAR SAOG
_____________________________________________________________________________ 13
NOTES TO THE INTERIM CONDENSED FINANCIAL STATEMENTS FOR THE SIX MONTH PERIOD ENDED 30TH JUNE 2018
3 Changes in significant accounting policies (continued)
A.IFRS 9 Financial instruments (continued)
Classification of financial assets and financial liabilities (continued)
On initial recognition of an equity investment that is not held for trading, the Bank may irrevocably
elect to present subsequent changes in fair value in OCI. This election is made on an investment-by-
investment basis.
All other financial assets are classified as measured at FVTPL.
In addition, on initial recognition the Bank may irrevocably designate a financial asset that otherwise
meets the requirements to be measured at amortised cost or at FVOCI as at FVTPL if doing so
eliminates or significantly reduces an accounting mismatch that would otherwise arise.
IFRS 9 removes the requirement contained in IAS 39 relating to bifurcation of an embedded
derivative from an asset host contract. However, entities are still required to separate derivatives
embedded in financial liabilities where they are not closely related to the host contract.
IFRS 9 largely retains the existing requirements in IAS 39 for the classification of financial
liabilities. However, although under IAS 39 all fair value changes of liabilities designated under the
fair value option were recognized in profit or loss, under IFRS 9 fair value changes are generally
presented as follows:
• The amount of change in the fair value that is attributable to changes in the credit risk of the
liability is presented in OCI; and
• The remaining amount of change in the fair value is presented in profit or loss.
Business model assessment
The Bank makes an assessment of the objective of a business model in which an asset is held at a
portfolio level because this best reflects the way the business is managed and information is
provided to management. The information considered includes:
• The stated policies and objectives for the portfolio and the operation of those policies in practice. In
particular, whether management’s strategy focuses on earning contractual interest revenue,
maintaining a particular interest rate profile, matching the duration of the financial assets to the
duration of the liabilities that are funding those assets or realising cash flows through the sale of the
assets;
• How the performance of the portfolio is evaluated and reported to the Bank’s management;
• The risks that affect the performance of the business model (and the financial assets held within
that business model) and how those risks are managed;
• How managers of the business are compensated – e.g. whether compensation is based on the fair
value of the assets managed or the contractual cash flows collected; and
• The frequency, volume and timing of sales in prior periods, the reasons for such sales and its
expectations about future sales activity. However, information about sales activity is not considered
in isolation, but as part of an overall assessment of how the Bank’s stated objective for managing the
financial assets is achieved and how cash flows are realised.
BANK DHOFAR SAOG
_____________________________________________________________________________ 14
NOTES TO THE INTERIM CONDENSED FINANCIAL STATEMENTS FOR THE SIX MONTH PERIOD ENDED 30TH JUNE 2018
3 Changes in significant accounting policies (continued)
A.IFRS 9 Financial instruments (continued)
Classification of financial assets and financial liabilities (continued)
Financial assets that are held for trading or managed and whose performance is evaluated on a fair
value basis are measured at FVTPL because they are neither held to collect contractual cash flows
nor held both to collect contractual cash flows and to sell financial assets.
Assessment whether contractual cash flows are solely payments of principal and interest
For the purposes of this assessment, ‘principal’ is defined as the fair value of the financial asset on
initial recognition. ‘Interest’ is defined as consideration for the time value of money and for the
credit risk associated with the principal amount outstanding during a particular period of time and
for other basic lending risks and costs (e.g. liquidity risk and administrative costs), as well as profit
margin.
In assessing whether the contractual cash flows are solely payments of principal and interest, the
Bank considers the contractual terms of the instrument. This includes assessing whether the financial
asset contains a contractual term that could change the timing or amount of contractual cash flows
such that it would not meet this condition.
Modifications of financial assets
If the cash flows of the modified asset carried at amortised cost are not substantially different, then
the modification does not result in derecognition of the financial asset. In this case, the Bank
recalculates the gross carrying amount of the financial asset and recognises the amount arising from
adjusting the gross carrying amount as a modification gain or loss in profit or loss.
Impairment
The Bank recognises loss allowances for (Expected credit losses) ECL on the following financial
instruments that are not measured at FVTPL:
• Financial assets that are debt instruments;
• lease receivables;
• Financial guarantee contracts issued; and
• Loan commitments issued.
No impairment loss is recognised on equity investments.
The Bank measures loss allowances at an amount equal to lifetime ECL, except for the following,
for which they are measured as 12-month ECL:
• Debt investment securities that are determined to have low credit risk at the reporting date; and
• Other financial instruments (other than lease receivables) on which credit risk has not increased
significantly since their initial recognition
BANK DHOFAR SAOG
_____________________________________________________________________________ 15
NOTES TO THE INTERIM CONDENSED FINANCIAL STATEMENTS FOR THE SIX MONTH PERIOD ENDED 30TH JUNE 2018
3 Changes in significant accounting policies (continued)
A .IFRS 9 Financial instruments (continued)
Impairment (continued)
Loss allowances for lease receivables are always measured at an amount equal to lifetime ECL.
The Bank considers a debt security to have low credit risk when their credit risk rating is
Equivalent to the globally understood definition of ‘investment grade’.
12-month ECL are the portion of ECL that result from default events on a financial instrument that
are possible within the 12 months after the reporting date.
Measurement of ECL
Credit loss allowances are measured using a three-stage approach based on the extent of credit
deterioration since origination:
• Stage 1 – Where there has not been a significant increase in credit risk (SIR) since initial
recognition of a financial instrument, an amount equal to 12 months expected credit loss is recorded.
The expected credit loss is computed using a probability of default occurring over the next 12
months. For those instruments with a remaining maturity of less than 12 months, a probability of
default corresponding to remaining term to maturity is used.
• Stage 2 – When a financial instrument experiences a SIR subsequent to origination but is not
considered to be in default, it is included in Stage 2. This requires the computation of expected credit
loss based on the probability of default over the remaining estimated life of the financial instrument.
• Stage 3 – Financial instruments that are considered to be in default are included in this stage.
Similar to Stage 2, the allowance for credit losses captures the lifetime expected credit losses.
The key inputs into the measurement of ECL are the term structure of the following variables:
• Probability of default (PD);
• Loss given default (LGD);
• Exposure at default (EAD)
These parameters are generally derived from internally developed statistical models and other
historical data. They are adjusted to reflect forward-looking information.
Details of these statistical parameters/inputs are as follows:
• PD – The probability of default is an estimate of the likelihood of default over a given time
horizon.
• EAD – The exposure at default is an estimate of the exposure at a future default date, taking into
account expected changes in the exposure after the reporting date
• LGD – The loss given default is an estimate of the loss arising in the case where a default occurs at
a given time. It is based on the difference between the contractual cash flows due and those that the
lender would expect to receive, including from the realization of any collateral. It is usually
expressed as a percentage of the EAD.
BANK DHOFAR SAOG
_____________________________________________________________________________ 16
NOTES TO THE INTERIM CONDENSED FINANCIAL STATEMENTS FOR THE SIX MONTH PERIOD ENDED 30TH JUNE 2018
3 Changes in significant accounting policies (continued)
A . IFRS 9 Financial instruments (continued)
Impairment (continued)
Forward-looking information
The measurement of expected credit losses for each stage and the assessment of significant increases
in credit risk considers information about past events and current conditions as well as reasonable
and supportable forecasts of future events and economic conditions. The estimation and application
of forward-looking information requires significant judgement.
Macroeconomic factors
In its models, the Bank relies on a broad range of forward looking information as economic inputs,
such as: real gross domestic product (GDP) growth and oil revenue (as % of GDP). The inputs and
models used for calculating expected credit losses may not always capture all characteristics of the
market at the date of the financial statements. To reflect this, qualitative adjustments or overlays are
made as temporary adjustments using expert credit judgement.
Assessment of significant increase in credit risk
When determining whether the risk of default on a financial instrument has increased significantly
since initial recognition, the Bank considers reasonable and supportable information that is relevant
and available without undue cost or effort. This includes both quantitative and qualitative
information and analysis, based on the Bank’s historical experience and expert credit assessment and
including forward-looking information.
The following quantitative guidelines are used to determine the staging of accounts: 1. An account will migrate to stage 2 if any of the changes in rating below are met
For risk grades 1 – 4: >= 3 notch downgrade
Risk grade 5: 2 notch downgrade
Risk grade 6 and 7: 1 notch downgrade
2. An account will also migrate to stage 2 if it is more than 30 days past due
3. An account will also be considered stage 2 if has been placed under special mention
In addition to the above, qualitative criteria as per the CBO guidelines (BM 1149, Para 12
(d)), for assessing the significant increase in credit risk are applicable to corporate clients
with limits of OMR 500,000 or higher only.
BANK DHOFAR SAOG
_____________________________________________________________________________ 17
NOTES TO THE INTERIM CONDENSED FINANCIAL STATEMENTS FOR THE SIX MONTH PERIOD ENDED 30TH JUNE 2018
3 Changes in significant accounting policies (continued)
A. IFRS 9 Financial instruments (continued)
Impairment (continued)
Presentation of allowance for ECL in the statement of financial position
Loss allowances for ECL are presented in the statement of financial position as follows:
• Financial assets measured at amortised cost: as a deduction from the gross carrying amount of the
assets;
• Loan commitments and financial guarantee contracts: For financial guarantee contracts and loan
commitments, the loss allowance is recognised as a provision. The Bank has issued no loan
commitment that are measured at FVTPL. Liabilities arising from financial guarantee and loan
commitments are included within provisions under other liabilities in statement of financial position;
• Where a financial instrument includes both a drawn and an undrawn component, and the Bank
cannot identify the ECL on the loan commitment component separately from those on the drawn
component: the Bank presents a combined loss allowance for both components. The combined
amount is presented as a deduction from the gross carrying amount of the drawn component. Any
excess of the loss allowance over the gross amount of the drawn component is presented as a
provision; and
• Debt instruments measured at FVOCI The debt instruments classified under FVOCI are initially
recognised at fair value plus directly attributable transaction costs and subsequently measured at fair
value. Gains and losses arising from changes in fair value are included in other comprehensive
income within a separate component of equity. ECL or reversals, interest revenue and foreign
exchange gains and losses are recognised in profit and loss. Upon disposal, the cumulative gain or
loss previously recognised in other comprehensive income.
Definition of default
The Bank considers a financial asset to be in default when:
• The borrower is unlikely to pay its credit obligations to the Bank in full without recourse by the
Bank to actions such as realising security (if any is held); or
• The borrower is past due more than 90 days on any material credit obligation to the Bank.
Overdrafts are considered as being past due once the customer has breached an advised limit or been
advised of a limit smaller than the current amount outstanding.
In assessing whether a borrower is in default, the Bank considers indicators that are:
• Qualitative – e.g. breaches of covenant;
• Quantitative – e.g. overdue status and non-payment on another obligation of the same issuer to the
Bank; and
• based on data developed internally and obtained from external sources.
Inputs into the assessment of whether a financial instrument is in default and their significance may
vary over time to reflect changes in circumstances.
The Bank follows the definition of default as stipulated in CBO guidelines (BM 977 and
subsequent).
BANK DHOFAR SAOG
_____________________________________________________________________________ 18
NOTES TO THE INTERIM CONDENSED FINANCIAL STATEMENTS FOR THE SIX MONTH PERIOD ENDED 30TH JUNE 2018
3. Changes in significant accounting policies (continued)
A. IFRS 9 Financial instruments (continued)
Hedge accounting
IFRS9 introduces a new hedge accounting model that expands the scope of hedged items and risks
eligible for hedge accounting and alignes hedge accounting more closely with risk management
objectives and strategy with more qualitative approach to assess hedge effectiveness. IFRS9 also
introduces new requirements on rebalancing hedge relationships and prohibiting voluntary
discontinuation of hedge accounting.
The Bank has entered into interest rate swaps to hedge the variability in cash flows arising from
changes in interest rates relating to investments. The types of hedge accounting relationships that the
Bank currently designates meet the requirements of IFRS 9 and are aligned with Bank’s risk
management strategy and objective.
Based on Bank’s assessment, there is no impact from the adoption of new standard on hedge
accounting.
Transition
Changes in accounting policies resulting from the adoption of IFRS 9 have been applied
retrospectively, except as described below.
• Comparative periods have not been restated. Differences in the carrying amounts of financial assets
and financial liabilities resulting from the adoption of IFRS 9 are recognised in retained earnings and
reserves as at 1 January 2018. Accordingly, the information presented for 2017 does not reflect the
requirements of IFRS 9 and therefore is not comparable to the information presented for 2018 under
IFRS 9.
• The following assessments have been made on the basis of the facts and circumstances that existed
at the date of initial application.
- The determination of the business model within which a financial asset is held. - The designation and revocation of previous designations of certain financial assets and
financial liabilities as measured at FVTPL.
- The designation of certain investments in equity instruments not held for trading as at
FVOCI.
- For financial liabilities designated as at FVTPL, the determination of whether presenting the effects
of changes in the financial liability’s credit risk in OCI would create or enlarge an accounting
mismatch in profit or loss.
• If a debt security had low credit risk at the date of initial application of IFRS 9, then the Bank has
assumed that credit risk on the asset had not increased significantly since its initial recognition.
For more information and details on the changes and implications resulting from the adoption of
IFRS 9, see below:
BANK DHOFAR SAOG
_____________________________________________________________________________ 19
NOTES TO THE INTERIM CONDENSED FINANCIAL STATEMENTS FOR THE SIX MONTH PERIOD ENDED 30TH JUNE 2018
3. Changes in significant accounting policies (continued)
A. IFRS 9 Financial instruments (continued)
Transition (continued)
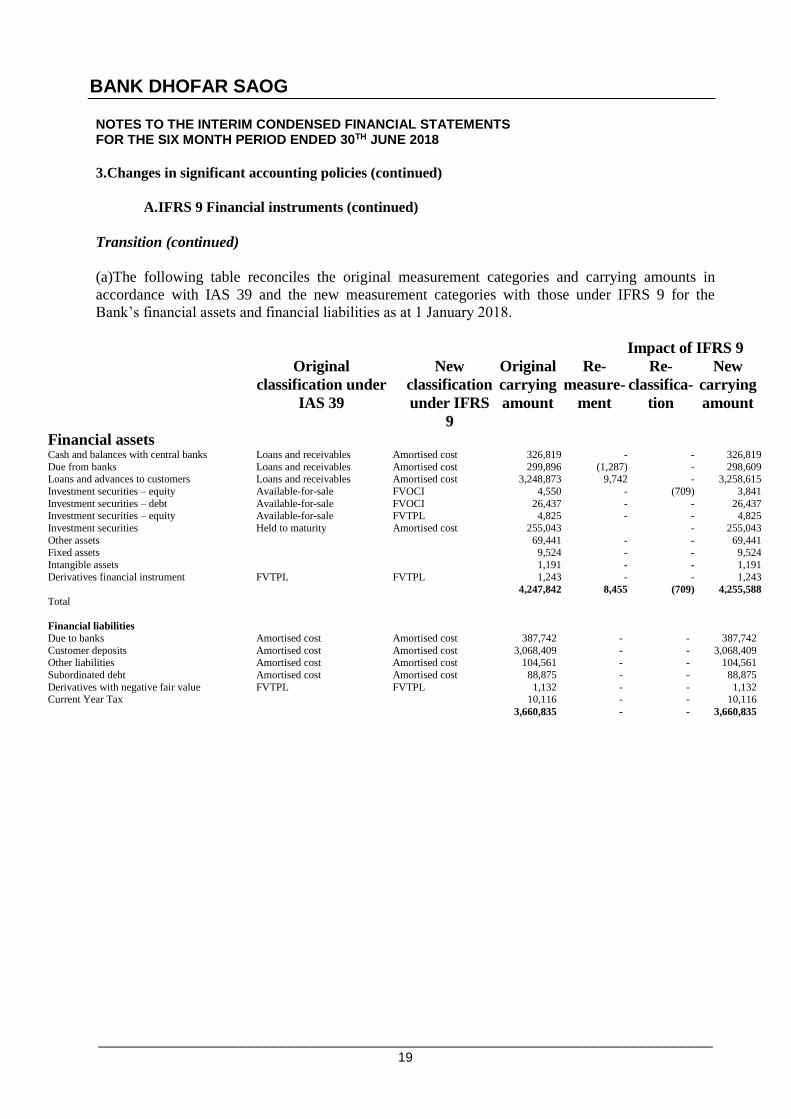
(a)The following table reconciles the original measurement categories and carrying amounts in
accordance with IAS 39 and the new measurement categories with those under IFRS 9 for the
Bank’s financial assets and financial liabilities as at 1 January 2018.
Impact of IFRS 9
Original
classification under
IAS 39
New
classification
under IFRS
9
Original
carrying
amount
Re-
measure-
ment
Re-
classifica-
tion
New
carrying
amount
Financial assets Cash and balances with central banks Loans and receivables Amortised cost 326,819 - - 326,819
Due from banks Loans and receivables Amortised cost 299,896 (1,287) - 298,609
Loans and advances to customers Loans and receivables Amortised cost 3,248,873 9,742 - 3,258,615
Investment securities – equity Available-for-sale FVOCI 4,550 - (709) 3,841
Investment securities – debt Available-for-sale FVOCI 26,437 - - 26,437 Investment securities – equity Available-for-sale FVTPL 4,825 - - 4,825
Investment securities Held to maturity Amortised cost 255,043 - - 255,043
Other assets 69,441 - - 69,441
Fixed assets 9,524 - - 9,524
Intangible assets 1,191 - - 1,191
Derivatives financial instrument FVTPL FVTPL 1,243 - - 1,243
Total
4,247,842 8,455 (709) 4,255,588
Financial liabilities
Due to banks Amortised cost Amortised cost 387,742 - - 387,742
Customer deposits Amortised cost Amortised cost 3,068,409 - - 3,068,409
Other liabilities Amortised cost Amortised cost 104,561 - - 104,561
Subordinated debt Amortised cost Amortised cost 88,875 - - 88,875
Derivatives with negative fair value FVTPL FVTPL 1,132 - - 1,132
Current Year Tax 10,116 - - 10,116
3,660,835 - - 3,660,835
BANK DHOFAR SAOG
_____________________________________________________________________________ 20
NOTES TO THE INTERIM CONDENSED FINANCIAL STATEMENTS FOR THE SIX MONTH PERIOD ENDED 30TH JUNE 2018
3 Changes in significant accounting policies (continued)
A. IFRS 9 Financial instruments (continued)
Transition (continued)
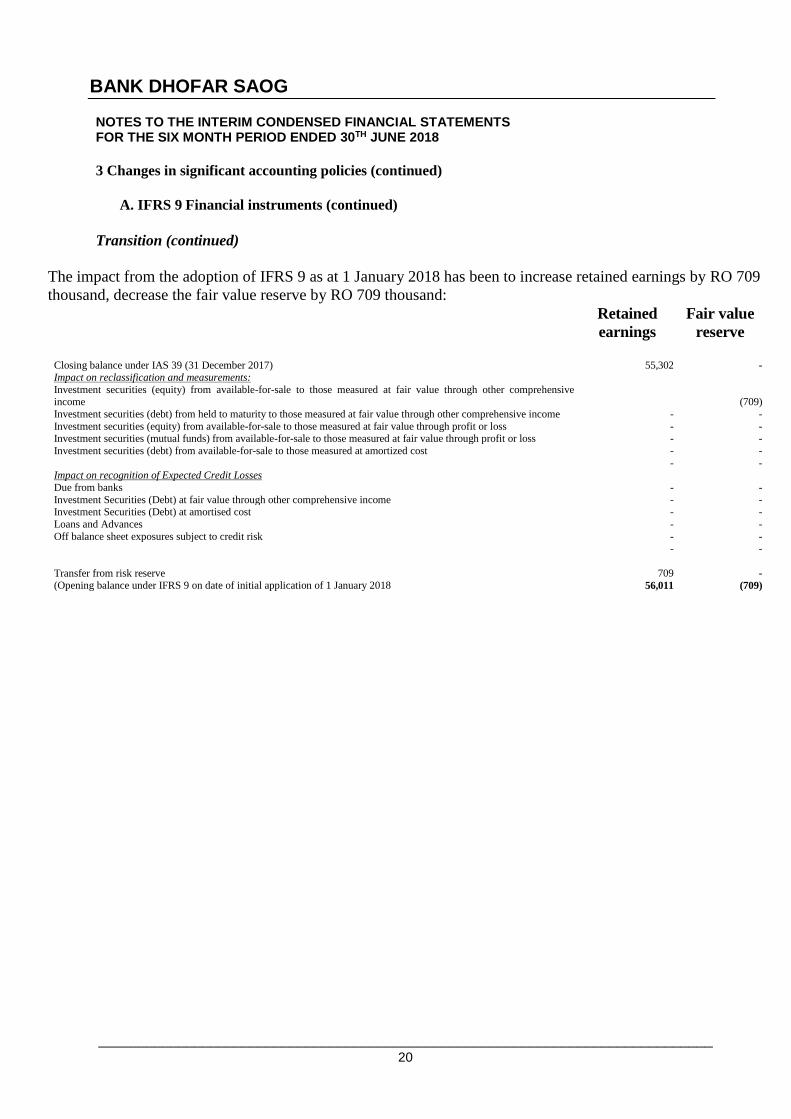
The impact from the adoption of IFRS 9 as at 1 January 2018 has been to increase retained earnings by RO 709
thousand, decrease the fair value reserve by RO 709 thousand:
Retained
earnings
Fair value
reserve
Closing balance under IAS 39 (31 December 2017) 55,302 - Impact on reclassification and measurements:
Investment securities (equity) from available-for-sale to those measured at fair value through other comprehensive income
XX
(709)
Investment securities (debt) from held to maturity to those measured at fair value through other comprehensive income - -
Investment securities (equity) from available-for-sale to those measured at fair value through profit or loss - - Investment securities (mutual funds) from available-for-sale to those measured at fair value through profit or loss - -
Investment securities (debt) from available-for-sale to those measured at amortized cost - -
- - Impact on recognition of Expected Credit Losses
Due from banks - -
Investment Securities (Debt) at fair value through other comprehensive income - - Investment Securities (Debt) at amortised cost - -
Loans and Advances - -
Off balance sheet exposures subject to credit risk - -
- -
Transfer from risk reserve 709 - (Opening balance under IFRS 9 on date of initial application of 1 January 2018 56,011 (709)
BANK DHOFAR SAOG
_____________________________________________________________________________ 21
NOTES TO THE INTERIM CONDENSED FINANCIAL STATEMENTS FOR THE SIX MONTH PERIOD ENDED 30TH JUNE 2018
3 Changes in significant accounting policies (continued)
A. IFRS 9 Financial instruments (continued)
Transition (continued)
Stage 1
Stage 2
Stage 3
Total Exposure subject to ECL 4,223,134
1,679,603
111,865
6,014,602
Opening Balance (Day 1 impact) – as at 1 January 2018
- Due from Banks
804
100
-
904
- Loans and Advances to Customers
15,914
21,498
36,407
73,819
- Investment Securities at FVOCI (Debt)
-
-
-
-
- Loan Commitments and Financial Guarantees 4,023
3,946
-
7,969
20,741
25,544
36,407
82,692
Net transfer between stages
- Due from Banks -
-
-
-
- Loans and Advances to Customers (157)
153
4
- - Investment Securities at FVOCI (Debt) -
-
-
-
- Loan Commitments and Financial Guarantees (12)
12
-
- (169)
165
4
-
Charge for the Period (net)
- Due from Banks
(44)
-
-
(44)
- Loans and Advances to Customers
636
3,384
(2,027)
1,993
- Investment Securities at FVOCI (Debt)
235
-
-
235
- Loan Commitments and Financial Guarantees 94
90
-
184
921
3,474
(2,027)
2,368
Closing Balance – as at 30th June 2018
- Due from Banks
760
100
-
860
- Loans and Advances to Customers
16,394
22,235
34,384
73,013
- Investment Securities at FVOCI (Debt)
234
-
-
234
- Loan Commitments and Financial Guarantees 4,105
6,848
-
10,953
21,493
29,183
34,384
85,060
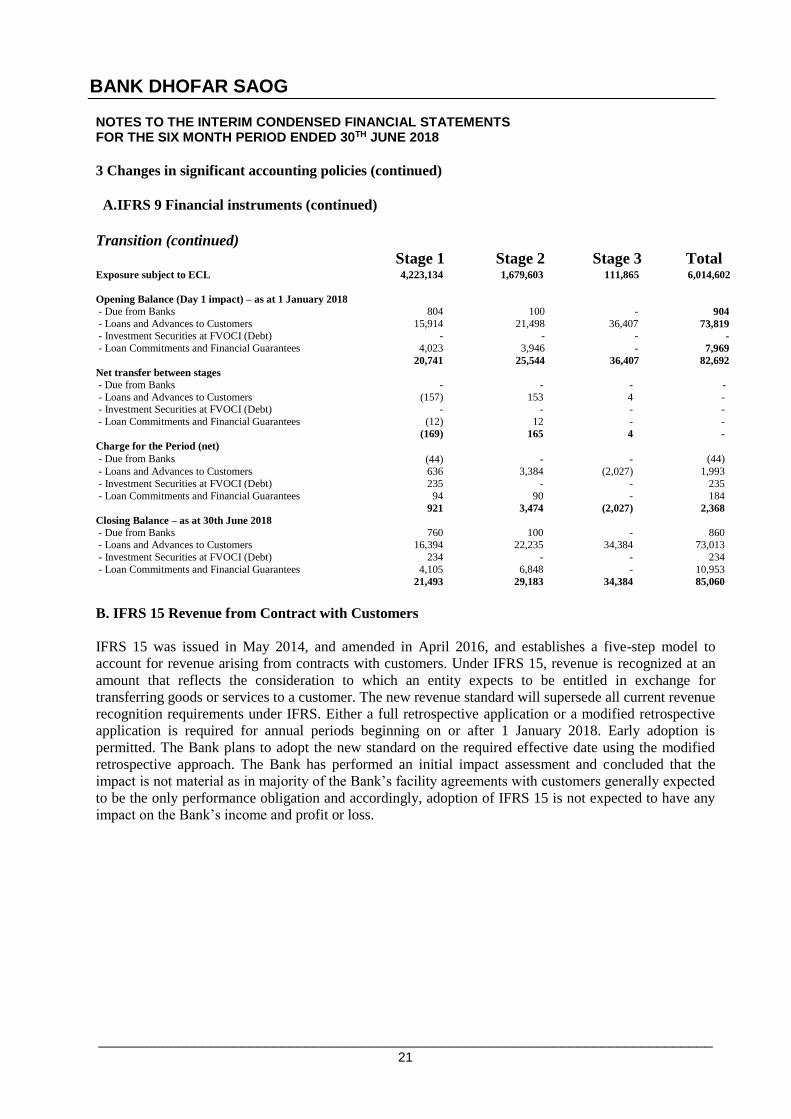
B. IFRS 15 Revenue from Contract with Customers
IFRS 15 was issued in May 2014, and amended in April 2016, and establishes a five-step model to
account for revenue arising from contracts with customers. Under IFRS 15, revenue is recognized at an
amount that reflects the consideration to which an entity expects to be entitled in exchange for
transferring goods or services to a customer. The new revenue standard will supersede all current revenue
recognition requirements under IFRS. Either a full retrospective application or a modified retrospective
application is required for annual periods beginning on or after 1 January 2018. Early adoption is
permitted. The Bank plans to adopt the new standard on the required effective date using the modified
retrospective approach. The Bank has performed an initial impact assessment and concluded that the
impact is not material as in majority of the Bank’s facility agreements with customers generally expected
to be the only performance obligation and accordingly, adoption of IFRS 15 is not expected to have any
impact on the Bank’s income and profit or loss.
BANK DHOFAR SAOG
_____________________________________________________________________________ 22
NOTES TO THE INTERIM CONDENSED FINANCIAL STATEMENTS FOR THE SIX MONTH PERIOD ENDED 30TH JUNE 2018
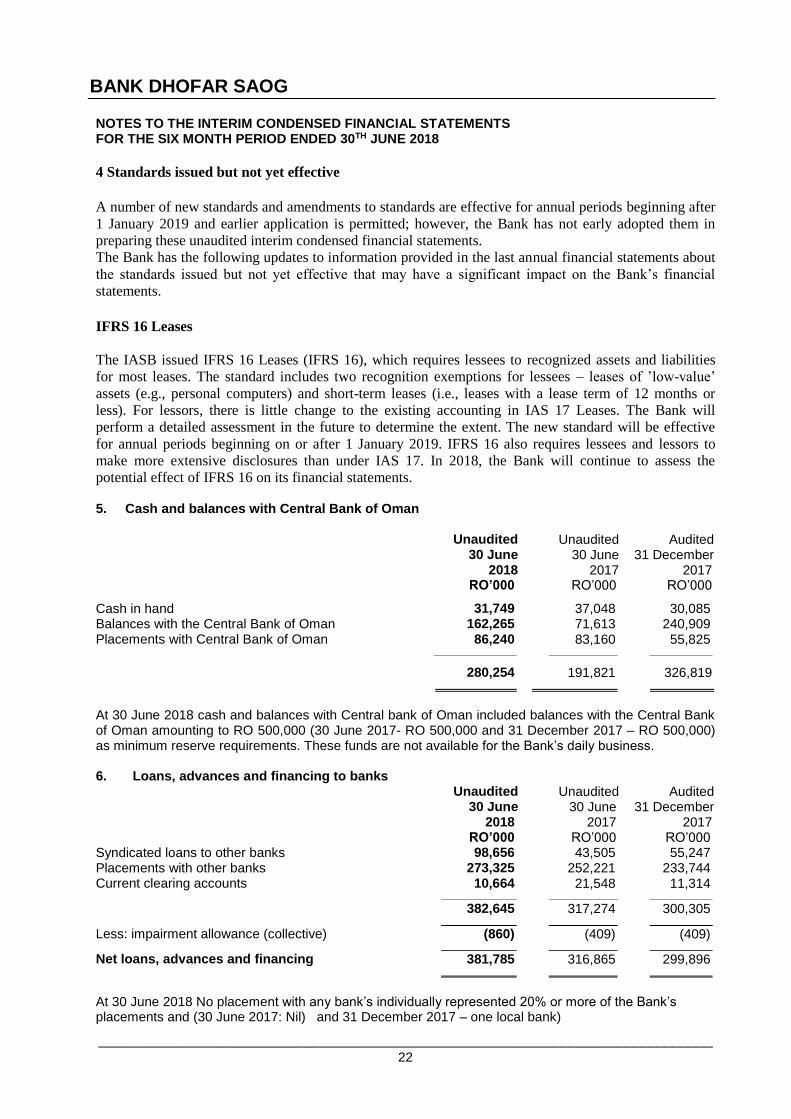
4 Standards issued but not yet effective
A number of new standards and amendments to standards are effective for annual periods beginning after
1 January 2019 and earlier application is permitted; however, the Bank has not early adopted them in
preparing these unaudited interim condensed financial statements.
The Bank has the following updates to information provided in the last annual financial statements about
the standards issued but not yet effective that may have a significant impact on the Bank’s financial
statements.
IFRS 16 Leases
The IASB issued IFRS 16 Leases (IFRS 16), which requires lessees to recognized assets and liabilities
for most leases. The standard includes two recognition exemptions for lessees – leases of ’low-value’
assets (e.g., personal computers) and short-term leases (i.e., leases with a lease term of 12 months or
less). For lessors, there is little change to the existing accounting in IAS 17 Leases. The Bank will
perform a detailed assessment in the future to determine the extent. The new standard will be effective
for annual periods beginning on or after 1 January 2019. IFRS 16 also requires lessees and lessors to
make more extensive disclosures than under IAS 17. In 2018, the Bank will continue to assess the
potential effect of IFRS 16 on its financial statements. 5. Cash and balances with Central Bank of Oman
Unaudited 30 June
2018
Unaudited 30 June
2017
Audited 31 December
2017 RO’000 RO’000 RO’000
Cash in hand 31,749 37,048 30,085 Balances with the Central Bank of Oman 162,265 71,613 240,909 Placements with Central Bank of Oman 86,240 83,160 55,825
280,254 191,821 326,819
At 30 June 2018 cash and balances with Central bank of Oman included balances with the Central Bank of Oman amounting to RO 500,000 (30 June 2017- RO 500,000 and 31 December 2017 – RO 500,000) as minimum reserve requirements. These funds are not available for the Bank’s daily business. 6. Loans, advances and financing to banks
Unaudited 30 June
2018
Unaudited 30 June
2017
Audited 31 December
2017 RO’000 RO’000 RO’000
Syndicated loans to other banks 98,656 43,505 55,247 Placements with other banks 273,325 252,221 233,744 Current clearing accounts 10,664 21,548 11,314
382,645 317,274 300,305
Less: impairment allowance (collective) (860) (409) (409)
Net loans, advances and financing 381,785 316,865 299,896
At 30 June 2018 No placement with any bank’s individually represented 20% or more of the Bank’s placements and (30 June 2017: Nil) and 31 December 2017 – one local bank)
BANK DHOFAR SAOG
_____________________________________________________________________________ 23
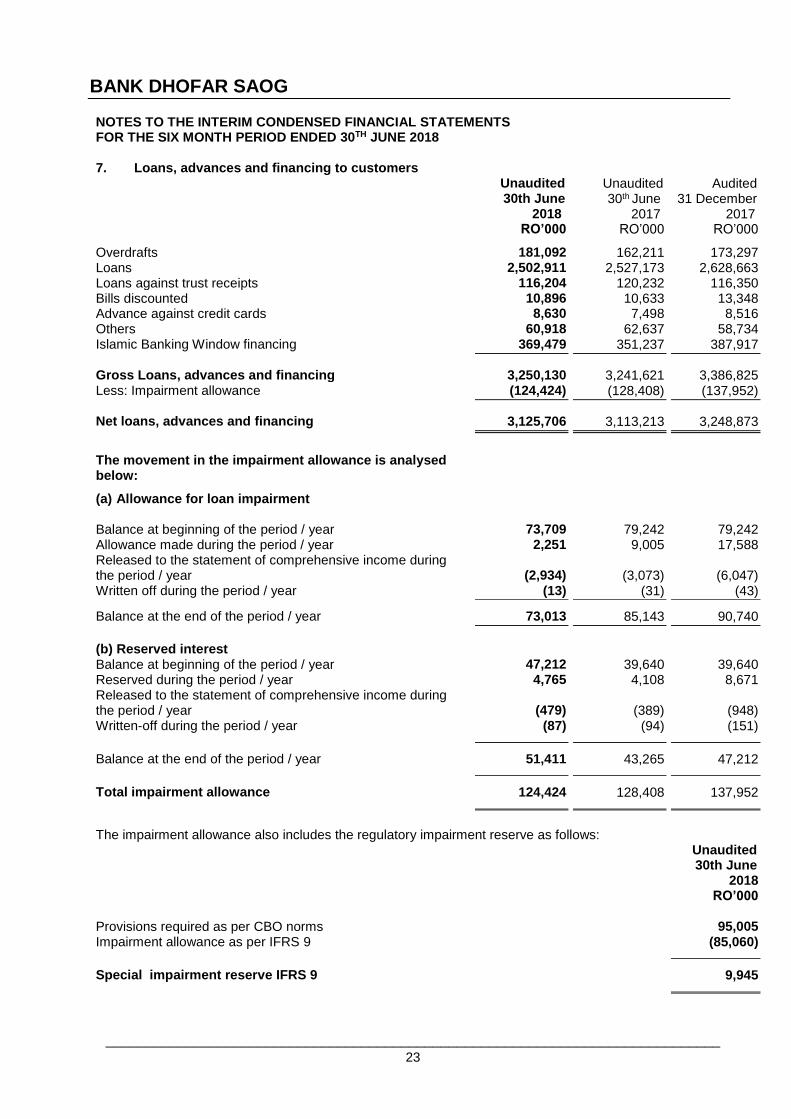
NOTES TO THE INTERIM CONDENSED FINANCIAL STATEMENTS FOR THE SIX MONTH PERIOD ENDED 30TH JUNE 2018 7. Loans, advances and financing to customers
Unaudited 30th June
2018
Unaudited 30th June
2017
Audited 31 December
2017 RO’000 RO’000 RO’000
Overdrafts 181,092 162,211 173,297 Loans 2,502,911 2,527,173 2,628,663 Loans against trust receipts 116,204 120,232 116,350 Bills discounted 10,896 10,633 13,348 Advance against credit cards 8,630 7,498 8,516 Others 60,918 62,637 58,734 Islamic Banking Window financing 369,479 351,237 387,917
Gross Loans, advances and financing 3,250,130 3,241,621 3,386,825 Less: Impairment allowance (124,424) (128,408) (137,952)
Net loans, advances and financing 3,125,706 3,113,213 3,248,873
The movement in the impairment allowance is analysed below:
(a) Allowance for loan impairment
Balance at beginning of the period / year 73,709 79,242 79,242 Allowance made during the period / year 2,251 9,005 17,588 Released to the statement of comprehensive income during the period / year (2,934) (3,073) (6,047) Written off during the period / year (13) (31) (43) Balance at the end of the period / year 73,013 85,143 90,740
(b) Reserved interest
Balance at beginning of the period / year 47,212 39,640 39,640 Reserved during the period / year 4,765 4,108 8,671 Released to the statement of comprehensive income during the period / year (479) (389)
(948)
Written-off during the period / year (87) (94) (151)
Balance at the end of the period / year 51,411 43,265 47,212
Total impairment allowance 124,424 128,408 137,952
The impairment allowance also includes the regulatory impairment reserve as follows:
Unaudited 30th June
2018 RO’000 Provisions required as per CBO norms 95,005 Impairment allowance as per IFRS 9 (85,060)
Special impairment reserve IFRS 9 9,945
BANK DHOFAR SAOG
_____________________________________________________________________________ 24
NOTES TO THE INTERIM CONDENSED FINANCIAL STATEMENTS FOR THE SIX MONTH PERIOD ENDED 30TH JUNE 2018 7. Loans, advances and financing to customers (continued)
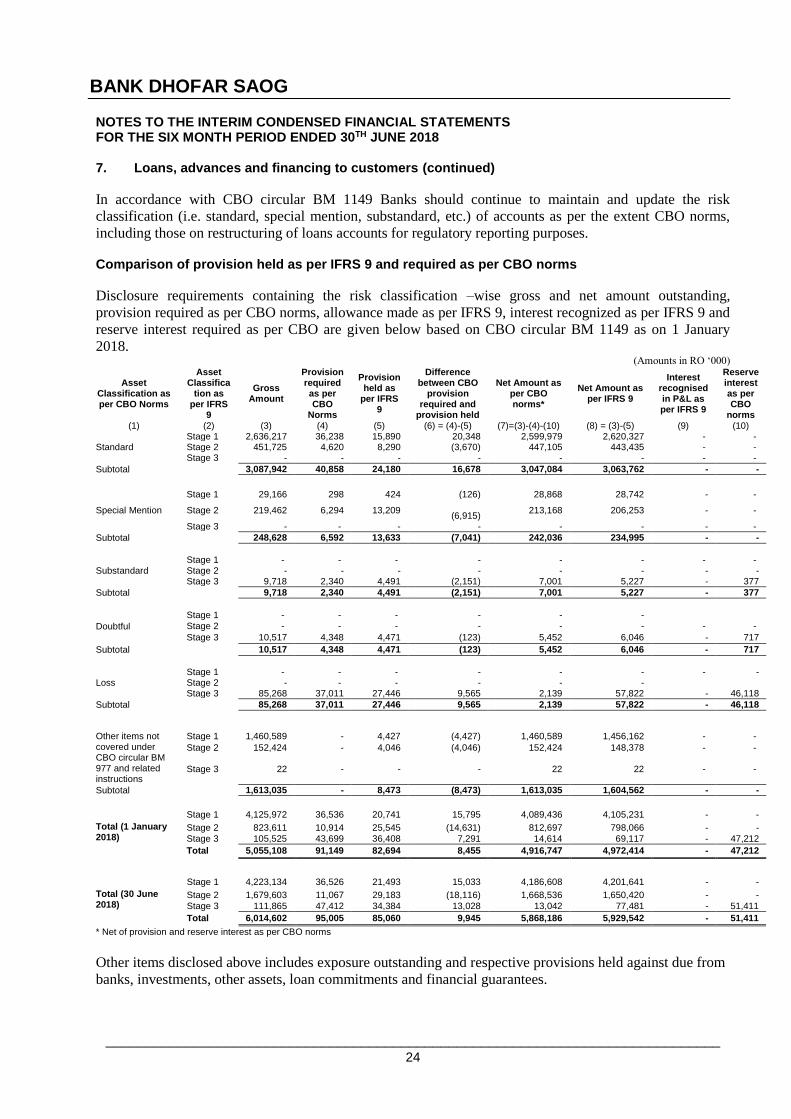
In accordance with CBO circular BM 1149 Banks should continue to maintain and update the risk
classification (i.e. standard, special mention, substandard, etc.) of accounts as per the extent CBO norms,
including those on restructuring of loans accounts for regulatory reporting purposes. Comparison of provision held as per IFRS 9 and required as per CBO norms
Disclosure requirements containing the risk classification –wise gross and net amount outstanding,
provision required as per CBO norms, allowance made as per IFRS 9, interest recognized as per IFRS 9 and
reserve interest required as per CBO are given below based on CBO circular BM 1149 as on 1 January
2018. (Amounts in RO ‘000)
Asset Classification as per CBO Norms
Asset Classifica
tion as per IFRS
9
Gross Amount
Provision required as per CBO
Norms
Provision held as
per IFRS 9
Difference between CBO
provision required and
provision held
Net Amount as per CBO norms*
Net Amount as per IFRS 9
Interest recognised in P&L as per IFRS 9
Reserve interest as per CBO
norms (1) (2) (3) (4) (5) (6) = (4)-(5) (7)=(3)-(4)-(10) (8) = (3)-(5) (9) (10)
Standard Stage 1 2,636,217 36,238 15,890 20,348 2,599,979 2,620,327 - - Stage 2 451,725 4,620 8,290 (3,670) 447,105 443,435 - - Stage 3 - - - - - - - -
Subtotal 3,087,942 40,858 24,180 16,678 3,047,084 3,063,762 - -
Special Mention
Stage 1 29,166 298 424 (126) 28,868 28,742 - -
Stage 2 219,462 6,294 13,209
(6,915) 213,168 206,253 - -
Stage 3 - - - - - - - -
Subtotal 248,628 6,592 13,633 (7,041) 242,036 234,995 - -
Substandard Stage 1 - - - - - - - - Stage 2 - - - - - - - - Stage 3 9,718 2,340 4,491 (2,151) 7,001 5,227 - 377
Subtotal 9,718 2,340 4,491 (2,151) 7,001 5,227 - 377
Doubtful
Stage 1 - - - - - -
Stage 2 - - - - - - - -
Stage 3 10,517 4,348 4,471 (123) 5,452 6,046 - 717
Subtotal 10,517 4,348 4,471 (123) 5,452 6,046 - 717
Loss Stage 1 - - - - - - - - Stage 2 - - - - - - Stage 3 85,268 37,011 27,446 9,565 2,139 57,822 - 46,118
Subtotal 85,268 37,011 27,446 9,565 2,139 57,822 - 46,118
Other items not covered under CBO circular BM 977 and related instructions
Stage 1 1,460,589 - 4,427 (4,427) 1,460,589 1,456,162 - -
Stage 2 152,424 - 4,046 (4,046) 152,424 148,378 - -
Stage 3 22 - - - 22 22 - -
Subtotal 1,613,035 - 8,473 (8,473) 1,613,035 1,604,562 - -
Total (1 January 2018)
Stage 1 4,125,972 36,536 20,741 15,795 4,089,436 4,105,231 - -
Stage 2 823,611 10,914 25,545 (14,631) 812,697 798,066 - -
Stage 3 105,525 43,699 36,408 7,291 14,614 69,117 - 47,212
Total 5,055,108 91,149 82,694 8,455 4,916,747 4,972,414 - 47,212
Total (30 June 2018)
Stage 1 4,223,134 36,526 21,493 15,033 4,186,608 4,201,641 - -
Stage 2 1,679,603 11,067 29,183 (18,116) 1,668,536 1,650,420 - -
Stage 3 111,865 47,412 34,384 13,028 13,042 77,481 - 51,411
Total 6,014,602 95,005 85,060 9,945 5,868,186 5,929,542 - 51,411
* Net of provision and reserve interest as per CBO norms
Other items disclosed above includes exposure outstanding and respective provisions held against due from
banks, investments, other assets, loan commitments and financial guarantees.
BANK DHOFAR SAOG
_____________________________________________________________________________ 25
NOTES TO THE INTERIM CONDENSED FINANCIAL STATEMENTS FOR THE SIX MONTH PERIOD ENDED 30th June 2018
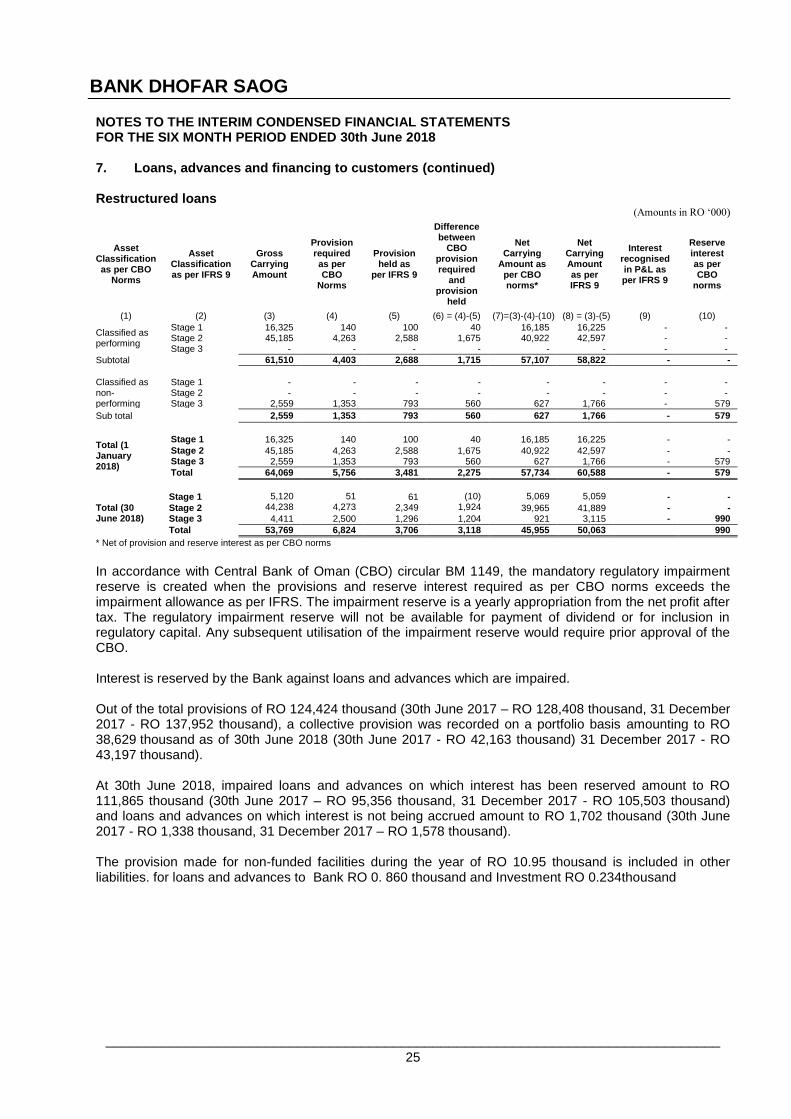
7. Loans, advances and financing to customers (continued) Restructured loans
(Amounts in RO ‘000)
Asset Classification as per CBO
Norms
Asset Classification as per IFRS 9
Gross Carrying Amount
Provision required as per CBO
Norms
Provision held as
per IFRS 9
Difference between
CBO provision required
and provision
held
Net Carrying
Amount as per CBO norms*
Net Carrying Amount as per IFRS 9
Interest recognised in P&L as per IFRS 9
Reserve interest as per CBO
norms
(1) (2) (3) (4) (5) (6) = (4)-(5) (7)=(3)-(4)-(10) (8) = (3)-(5) (9) (10)
Classified as performing
Stage 1 16,325 140 100 40 16,185 16,225 - - Stage 2 45,185 4,263 2,588 1,675 40,922 42,597 - - Stage 3 - - - - - - - -
Subtotal 61,510 4,403 2,688 1,715 57,107 58,822 - -
Classified as non-performing
Stage 1 - - - - - - - - Stage 2 - - - - - - - - Stage 3 2,559 1,353 793 560 627 1,766 - 579
Sub total 2,559 1,353 793 560 627 1,766 - 579
Total (1 January 2018)
Stage 1 16,325 140 100 40 16,185 16,225 - -
Stage 2 45,185 4,263 2,588 1,675 40,922 42,597 - - Stage 3 2,559 1,353 793 560 627 1,766 - 579
Total 64,069 5,756 3,481 2,275 57,734 60,588 - 579
Total (30 June 2018)
Stage 1 5,120 44,238
51 4,273
61 2,349
(10) 1,924
5,069 5,059 - -
Stage 2 39,965 41,889 - - Stage 3 4,411 2,500 1,296 1,204 921 3,115 - 990
Total 53,769 6,824 3,706 3,118 45,955 50,063 990
* Net of provision and reserve interest as per CBO norms
In accordance with Central Bank of Oman (CBO) circular BM 1149, the mandatory regulatory impairment reserve is created when the provisions and reserve interest required as per CBO norms exceeds the impairment allowance as per IFRS. The impairment reserve is a yearly appropriation from the net profit after tax. The regulatory impairment reserve will not be available for payment of dividend or for inclusion in regulatory capital. Any subsequent utilisation of the impairment reserve would require prior approval of the CBO. Interest is reserved by the Bank against loans and advances which are impaired. Out of the total provisions of RO 124,424 thousand (30th June 2017 – RO 128,408 thousand, 31 December 2017 - RO 137,952 thousand), a collective provision was recorded on a portfolio basis amounting to RO 38,629 thousand as of 30th June 2018 (30th June 2017 - RO 42,163 thousand) 31 December 2017 - RO 43,197 thousand). At 30th June 2018, impaired loans and advances on which interest has been reserved amount to RO 111,865 thousand (30th June 2017 – RO 95,356 thousand, 31 December 2017 - RO 105,503 thousand) and loans and advances on which interest is not being accrued amount to RO 1,702 thousand (30th June 2017 - RO 1,338 thousand, 31 December 2017 – RO 1,578 thousand). The provision made for non-funded facilities during the year of RO 10.95 thousand is included in other liabilities. for loans and advances to Bank RO 0. 860 thousand and Investment RO 0.234thousand
BANK DHOFAR SAOG
_____________________________________________________________________________ 26
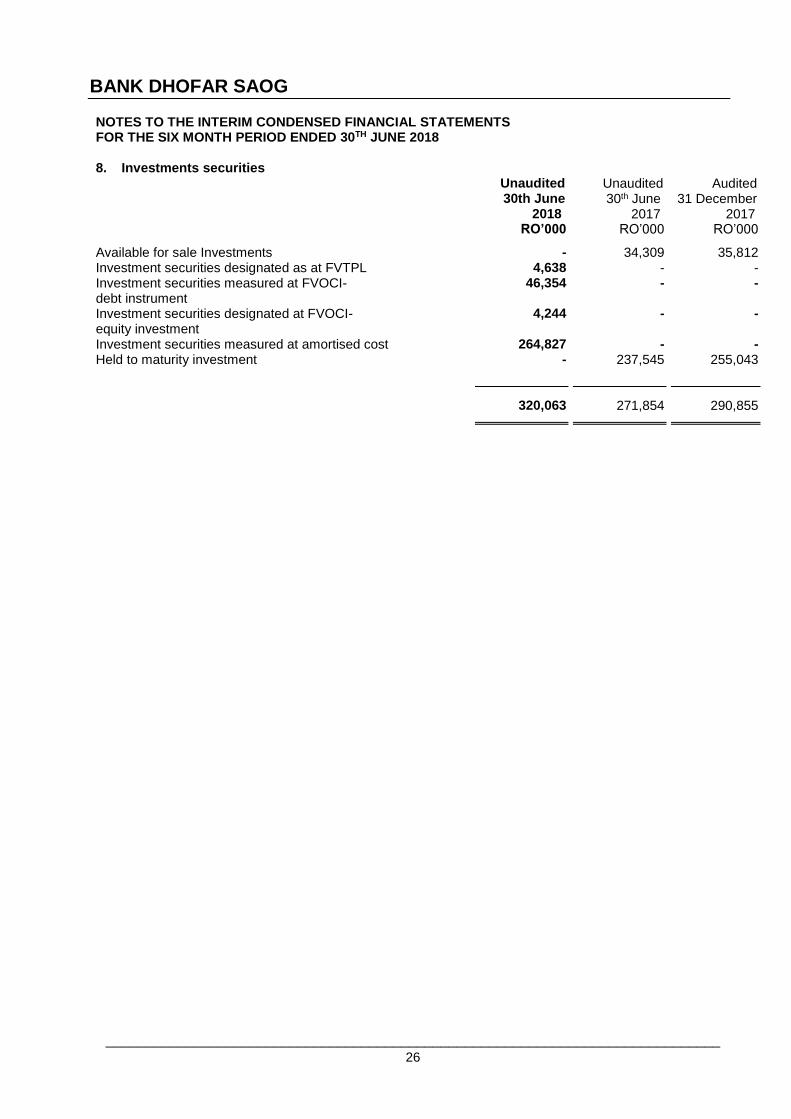
NOTES TO THE INTERIM CONDENSED FINANCIAL STATEMENTS FOR THE SIX MONTH PERIOD ENDED 30TH JUNE 2018 8. Investments securities
Unaudited 30th June
2018
Unaudited 30th June
2017
Audited 31 December
2017 RO’000 RO’000 RO’000
Available for sale Investments - 34,309 35,812 Investment securities designated as at FVTPL 4,638 - - Investment securities measured at FVOCI- debt instrument
46,354 - -
Investment securities designated at FVOCI- equity investment
4,244 - -
Investment securities measured at amortised cost 264,827 - - Held to maturity investment - 237,545 255,043
320,063 271,854 290,855
BANK DHOFAR SAOG
_____________________________________________________________________________ 27
NOTES TO THE INTERIM CONDENSED FINANCIAL STATEMENTS FOR THE SIX MONTH PERIOD ENDED 30TH JUNE 2018
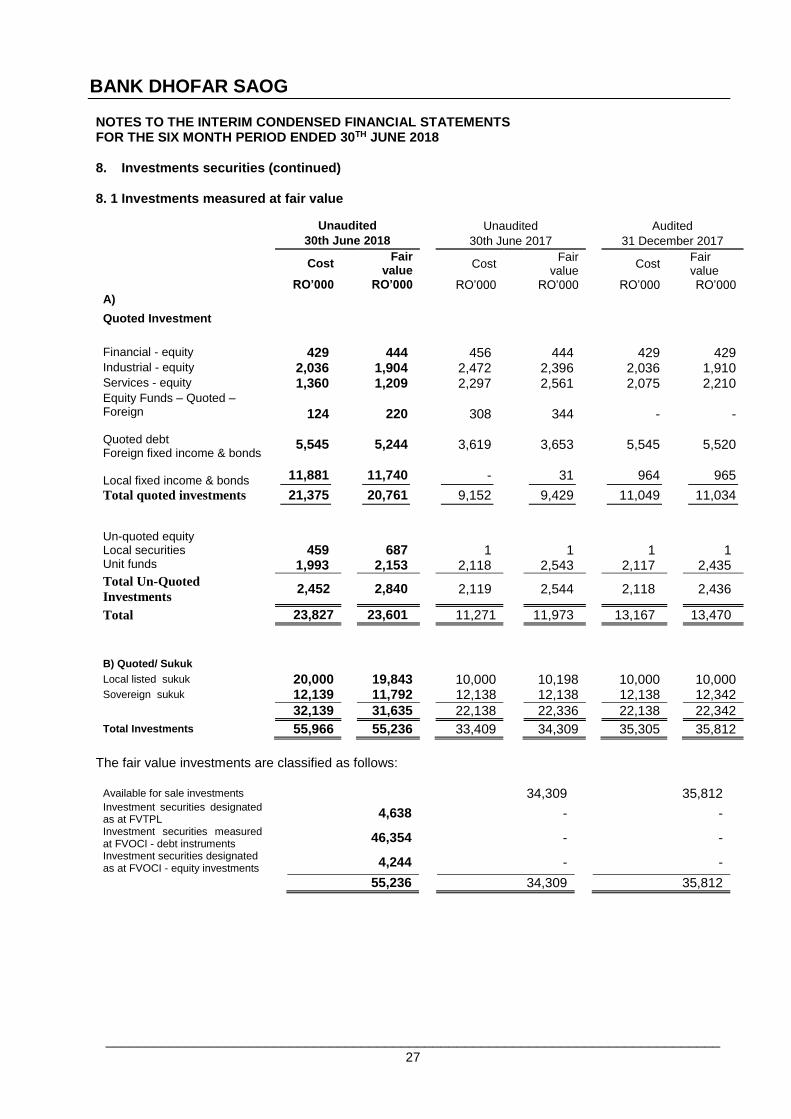
8. Investments securities (continued)
8. 1 Investments measured at fair value
Unaudited
Unaudited
Audited
30th June 2018
30th June 2017
31 December 2017
Cost
Fair
value Cost
Fair
value Cost
Fair value
RO’000
RO’000
RO’000
RO’000
RO’000
RO’000
A)
Quoted Investment
Financial - equity 429 444
456
444
429
429
Industrial - equity 2,036 1,904
2,472
2,396
2,036
1,910 Services - equity 1,360 1,209 2,297 2,561 2,075 2,210 Equity Funds – Quoted – Foreign Quoted debt Foreign fixed income & bonds Local fixed income & bonds
124
5,545
11,881
220
5,244
11,740
308
3,619
-
344
3,653
31
-
5,545
964
-
5,520
965
Total quoted investments
21,375 20,761
9,152
9,429
11,049
11,034
Un-quoted equity Local securities Unit funds
459
1,993 1
687
2,153
1
2,118 1
1
2,543
1
2,117
1
2,435
Total Un-Quoted
Investments 2,452 2,840
2,119
2,544
2,118
2,436
Total 23,827 23,601
11,271
11,973
13,167
13,470
B) Quoted/ Sukuk
Local listed sukuk 20,000 19,843 10,000 10,198 10,000 10,000 Sovereign sukuk 12,139 11,792
12,138 12,138
12,138
12,342
32,139 31,635
22,138 22,336
22,138
22,342
Total Investments 55,966 55,236
33,409 34,309
35,305
35,812
The fair value investments are classified as follows:
Available for sale investments 34,309 35,812 Investment securities designated as at FVTPL 4,638 - -
Investment securities measured at FVOCI - debt instruments 46,354 - -
Investment securities designated as at FVOCI - equity investments 4,244
- -
55,236
34,309 35,812
BANK DHOFAR SAOG
_____________________________________________________________________________ 28
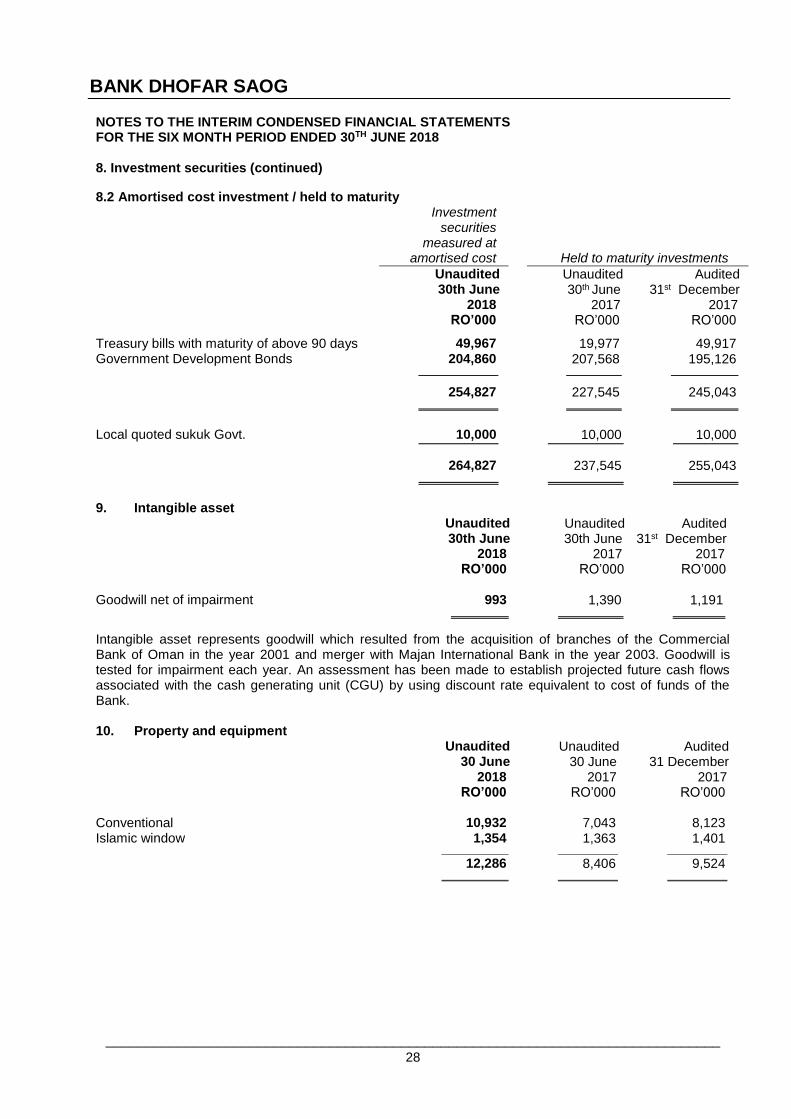
NOTES TO THE INTERIM CONDENSED FINANCIAL STATEMENTS FOR THE SIX MONTH PERIOD ENDED 30TH JUNE 2018 8. Investment securities (continued)
8.2 Amortised cost investment / held to maturity Investment
securities measured at
amortised cost
Held to maturity investments
Unaudited 30th June
2018
Unaudited 30th June
2017
Audited 31st December
2017 RO’000 RO’000 RO’000
Treasury bills with maturity of above 90 days 49,967 19,977 49,917 Government Development Bonds 204,860 207,568 195,126
254,827 227,545 245,043
Local quoted sukuk Govt. 10,000 10,000 10,000
264,827 237,545 255,043
9. Intangible asset
Unaudited 30th June
2018
Unaudited 30th June
2017
Audited 31st December
2017 RO’000 RO’000 RO’000
Goodwill net of impairment 993 1,390 1,191
Intangible asset represents goodwill which resulted from the acquisition of branches of the Commercial Bank of Oman in the year 2001 and merger with Majan International Bank in the year 2003. Goodwill is tested for impairment each year. An assessment has been made to establish projected future cash flows associated with the cash generating unit (CGU) by using discount rate equivalent to cost of funds of the Bank. 10. Property and equipment
Unaudited 30 June
2018
Unaudited 30 June
2017
Audited 31 December
2017 RO’000 RO’000 RO’000
Conventional 10,932 7,043 8,123 Islamic window 1,354 1,363 1,401
12,286 8,406 9,524
BANK DHOFAR SAOG
_____________________________________________________________________________ 29
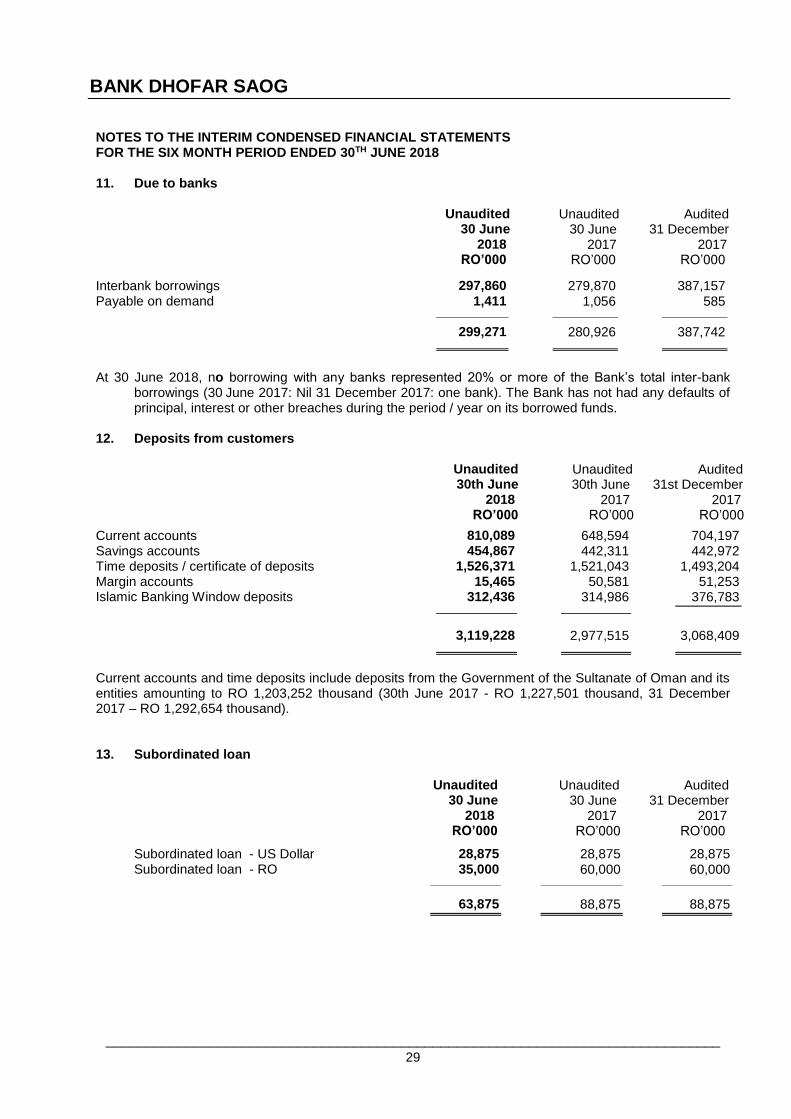
NOTES TO THE INTERIM CONDENSED FINANCIAL STATEMENTS FOR THE SIX MONTH PERIOD ENDED 30TH JUNE 2018 11. Due to banks
Unaudited 30 June
2018
Unaudited 30 June
2017
Audited 31 December
2017 RO’000 RO’000 RO’000
Interbank borrowings 297,860 279,870 387,157 Payable on demand 1,411 1,056 585
299,271 280,926 387,742
At 30 June 2018, no borrowing with any banks represented 20% or more of the Bank’s total inter-bank borrowings (30 June 2017: Nil 31 December 2017: one bank). The Bank has not had any defaults of principal, interest or other breaches during the period / year on its borrowed funds.
12. Deposits from customers
Unaudited 30th June
2018
Unaudited 30th June
2017
Audited 31st December
2017 RO’000 RO’000 RO’000
Current accounts 810,089 648,594 704,197 Savings accounts 454,867 442,311 442,972 Time deposits / certificate of deposits 1,526,371 1,521,043 1,493,204 Margin accounts 15,465 50,581 51,253 Islamic Banking Window deposits 312,436 314,986 376,783
3,119,228 2,977,515 3,068,409
Current accounts and time deposits include deposits from the Government of the Sultanate of Oman and its entities amounting to RO 1,203,252 thousand (30th June 2017 - RO 1,227,501 thousand, 31 December 2017 – RO 1,292,654 thousand).
13. Subordinated loan
Unaudited 30 June
2018
Unaudited 30 June
2017
Audited 31 December
2017 RO’000 RO’000 RO’000
Subordinated loan - US Dollar 28,875 28,875 28,875 Subordinated loan - RO 35,000 60,000 60,000
63,875 88,875 88,875
BANK DHOFAR SAOG
_____________________________________________________________________________ 30
NOTES TO THE INTERIM CONDENSED FINANCIAL STATEMENTS FOR THE SIX MONTH PERIOD ENDED 30TH JUNE 2018
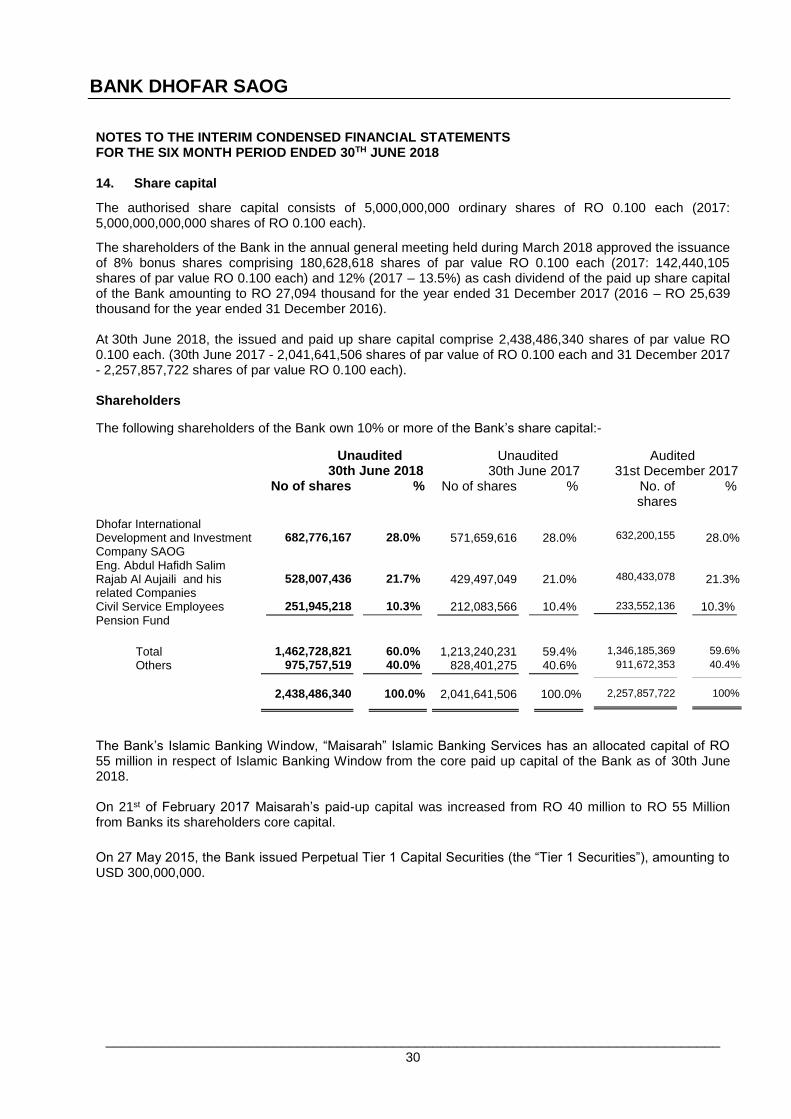
14. Share capital
The authorised share capital consists of 5,000,000,000 ordinary shares of RO 0.100 each (2017: 5,000,000,000,000 shares of RO 0.100 each).
The shareholders of the Bank in the annual general meeting held during March 2018 approved the issuance of 8% bonus shares comprising 180,628,618 shares of par value RO 0.100 each (2017: 142,440,105 shares of par value RO 0.100 each) and 12% (2017 – 13.5%) as cash dividend of the paid up share capital of the Bank amounting to RO 27,094 thousand for the year ended 31 December 2017 (2016 – RO 25,639 thousand for the year ended 31 December 2016). At 30th June 2018, the issued and paid up share capital comprise 2,438,486,340 shares of par value RO 0.100 each. (30th June 2017 - 2,041,641,506 shares of par value of RO 0.100 each and 31 December 2017 - 2,257,857,722 shares of par value RO 0.100 each). Shareholders
The following shareholders of the Bank own 10% or more of the Bank’s share capital:-
Unaudited 30th June 2018
Unaudited 30th June 2017
Audited 31st December 2017
No of shares % No of shares % No. of shares
%
Dhofar International Development and Investment Company SAOG
682,776,167
28.0%
571,659,616
28.0%
632,200,155
28.0%
Eng. Abdul Hafidh Salim Rajab Al Aujaili and his related Companies
528,007,436
21.7%
429,497,049
21.0%
480,433,078
21.3%
Civil Service Employees Pension Fund
251,945,218 10.3% 212,083,566 10.4% 233,552,136 10.3%
Total 1,462,728,821 60.0% 1,213,240,231 59.4% 1,346,185,369 59.6%
Others 975,757,519 40.0% 828,401,275 40.6% 911,672,353 40.4%
2,438,486,340 100.0% 2,041,641,506 100.0% 2,257,857,722 100%
The Bank’s Islamic Banking Window, “Maisarah” Islamic Banking Services has an allocated capital of RO 55 million in respect of Islamic Banking Window from the core paid up capital of the Bank as of 30th June 2018. On 21st of February 2017 Maisarah’s paid-up capital was increased from RO 40 million to RO 55 Million from Banks its shareholders core capital.
On 27 May 2015, the Bank issued Perpetual Tier 1 Capital Securities (the “Tier 1 Securities”), amounting to USD 300,000,000.
BANK DHOFAR SAOG
_____________________________________________________________________________ 31
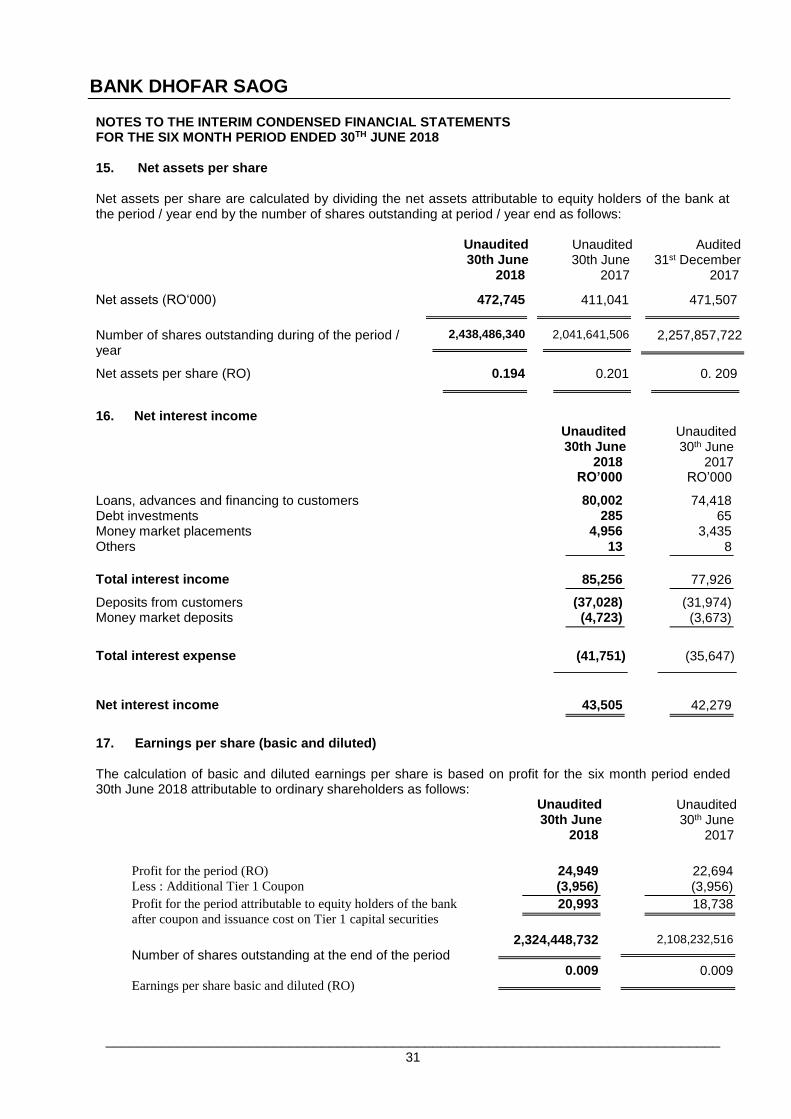
NOTES TO THE INTERIM CONDENSED FINANCIAL STATEMENTS FOR THE SIX MONTH PERIOD ENDED 30TH JUNE 2018 15. Net assets per share Net assets per share are calculated by dividing the net assets attributable to equity holders of the bank at the period / year end by the number of shares outstanding at period / year end as follows: Unaudited
30th June 2018
Unaudited 30th June
2017
Audited 31st December
2017
Net assets (RO‘000) 472,745 411,041 471,507
Number of shares outstanding during of the period / year
2,438,486,340 2,041,641,506 2,257,857,722
Net assets per share (RO) 0.194 0.201 0. 209
16. Net interest income
Unaudited 30th June
2018
Unaudited 30th June
2017 RO’000 RO’000
Loans, advances and financing to customers 80,002 74,418 Debt investments 285 65 Money market placements 4,956 3,435 Others 13 8 Total interest income 85,256 77,926
Deposits from customers (37,028) (31,974) Money market deposits (4,723) (3,673)
Total interest expense (41,751) (35,647)
Net interest income 43,505 42,279
17. Earnings per share (basic and diluted)
The calculation of basic and diluted earnings per share is based on profit for the six month period ended 30th June 2018 attributable to ordinary shareholders as follows:
Unaudited 30th June
2018
Unaudited 30th June
2017
Profit for the period (RO)
24,949
22,694
Less : Additional Tier 1 Coupon (3,956) (3,956)
Profit for the period attributable to equity holders of the bank
after coupon and issuance cost on Tier 1 capital securities 20,993 18,738
Number of shares outstanding at the end of the period 2,324,448,732 2,108,232,516
Earnings per share basic and diluted (RO)
0.009 0.009
BANK DHOFAR SAOG
_____________________________________________________________________________ 32
NOTES TO THE INTERIM CONDENSED FINANCIAL STATEMENTS FOR THE SIX MONTH PERIOD ENDED 30TH JUNE 2018 17. Earnings per share (basic and diluted) (continued) Earnings per share (basic and diluted) have been derived by dividing the profit for the period attributable to equity holders of the bank after coupon on Tier I capital securities by the number of shares outstanding. As there are no dilutive potential shares issued by Bank, the diluted earnings per share is identical to the basic earnings per share.
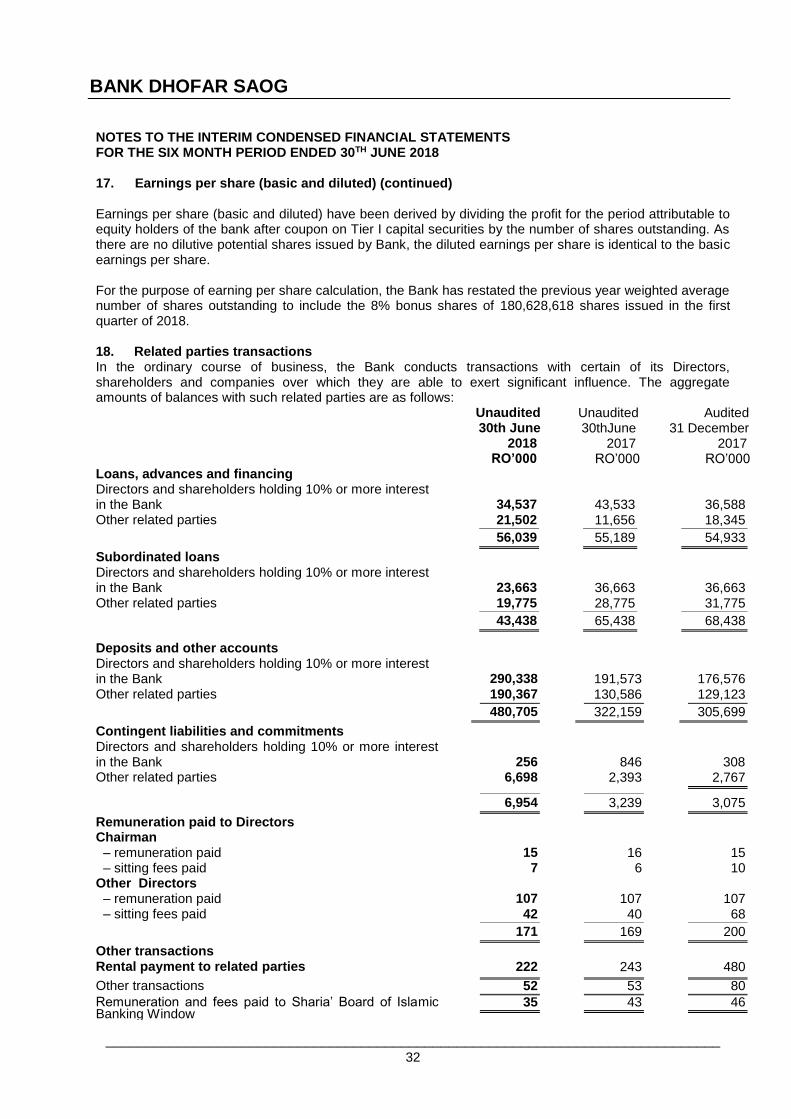
For the purpose of earning per share calculation, the Bank has restated the previous year weighted average number of shares outstanding to include the 8% bonus shares of 180,628,618 shares issued in the first quarter of 2018. 18. Related parties transactions In the ordinary course of business, the Bank conducts transactions with certain of its Directors, shareholders and companies over which they are able to exert significant influence. The aggregate amounts of balances with such related parties are as follows:
Unaudited 30th June
2018
Unaudited 30thJune
2017
Audited 31 December
2017 RO’000 RO’000 RO’000
Loans, advances and financing Directors and shareholders holding 10% or more interest in the Bank 34,537 43,533
36,588
Other related parties 21,502 11,656 18,345
56,039 55,189 54,933
Subordinated loans Directors and shareholders holding 10% or more interest in the Bank
23,663
36,663
36,663
Other related parties 19,775 28,775 31,775
43,438 65,438 68,438
Deposits and other accounts Directors and shareholders holding 10% or more interest in the Bank
290,338
191,573
176,576
Other related parties 190,367 130,586 129,123
480,705 322,159 305,699
Contingent liabilities and commitments
Directors and shareholders holding 10% or more interest in the Bank
256
846
308
Other related parties 6,698 2,393 2,767
6,954 3,239 3,075
Remuneration paid to Directors Chairman – remuneration paid 15 16 15 – sitting fees paid 7 6 10 Other Directors – remuneration paid 107 107 107 – sitting fees paid 42 40 68
171 169 200
Other transactions Rental payment to related parties 222 243 480
Other transactions 52 53 80
Remuneration and fees paid to Sharia’ Board of Islamic Banking Window
35 43 46
BANK DHOFAR SAOG
_____________________________________________________________________________ 33
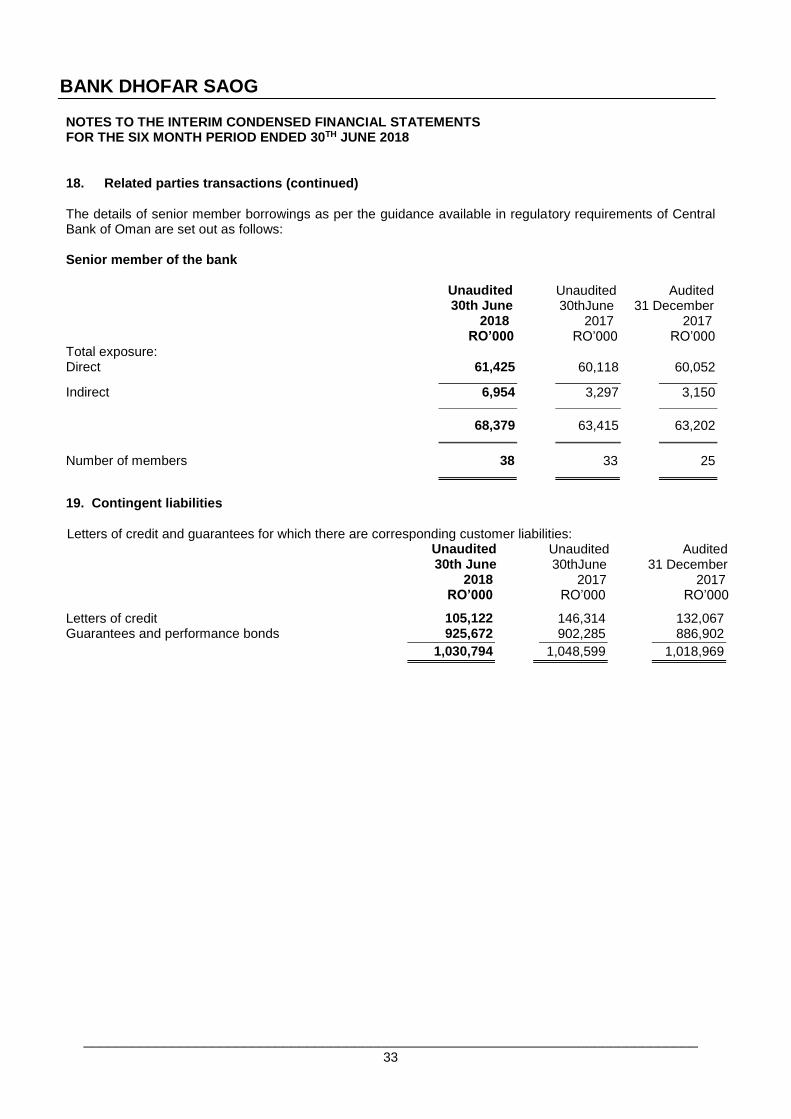
NOTES TO THE INTERIM CONDENSED FINANCIAL STATEMENTS FOR THE SIX MONTH PERIOD ENDED 30TH JUNE 2018 18. Related parties transactions (continued)
The details of senior member borrowings as per the guidance available in regulatory requirements of Central Bank of Oman are set out as follows: Senior member of the bank
Unaudited
30th June 2018
Unaudited 30thJune
2017
Audited 31 December
2017 RO’000 RO’000 RO’000
Total exposure: Direct 61,425 60,118 60,052
Indirect 6,954 3,297 3,150
68,379 63,415 63,202
Number of members 38 33 25
19. Contingent liabilities
Letters of credit and guarantees for which there are corresponding customer liabilities:
Unaudited 30th June
2018
Unaudited 30thJune
2017
Audited 31 December
2017 RO’000 RO’000 RO’000
Letters of credit 105,122 146,314 132,067 Guarantees and performance bonds 925,672 902,285 886,902
1,030,794 1,048,599 1,018,969
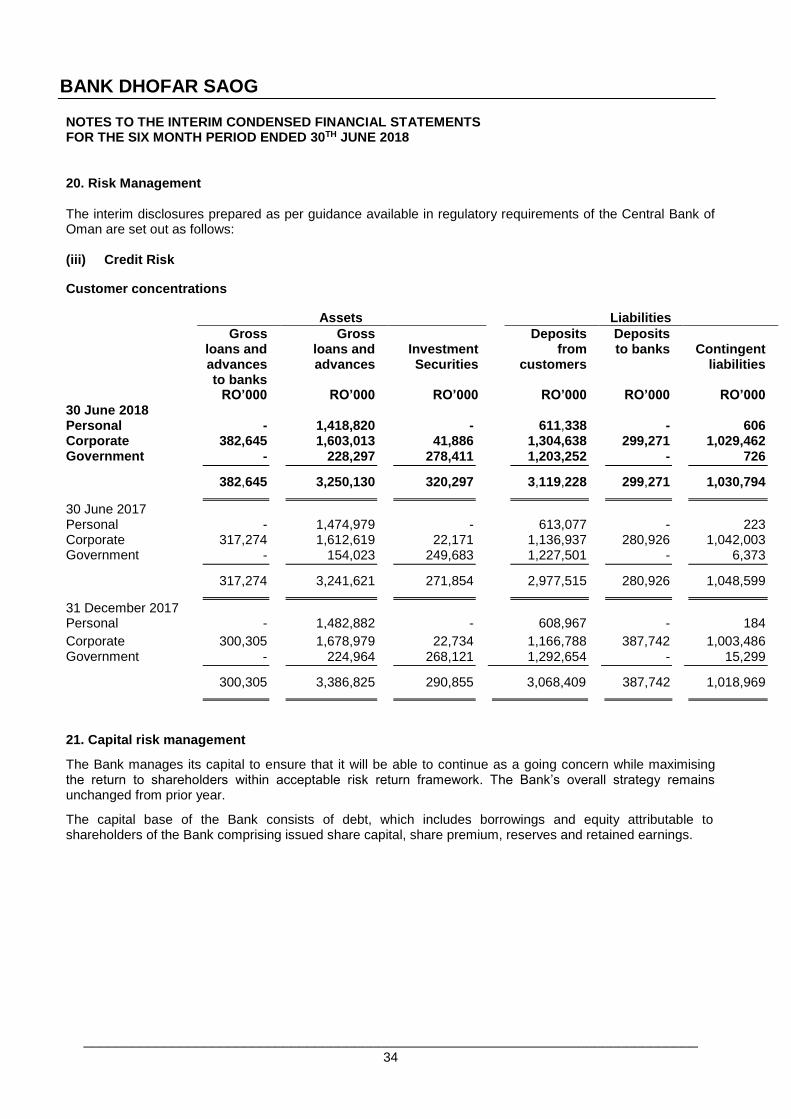
BANK DHOFAR SAOG
_____________________________________________________________________________ 34
NOTES TO THE INTERIM CONDENSED FINANCIAL STATEMENTS FOR THE SIX MONTH PERIOD ENDED 30TH JUNE 2018 20. Risk Management The interim disclosures prepared as per guidance available in regulatory requirements of the Central Bank of Oman are set out as follows: (iii) Credit Risk
Customer concentrations
Assets Liabilities
Gross loans and advances to banks
Gross loans and advances
Investment Securities
Deposits from
customers
Deposits to banks
Contingent
liabilities
RO’000 RO’000 RO’000 RO’000 RO’000 RO’000 30 June 2018 Personal - 1,418,820 - 611,338 - 606 Corporate 382,645 1,603,013 41,886 1,304,638 299,271 1,029,462 Government - 228,297 278,411 1,203,252 - 726
382,645 3,250,130 320,297 3,119,228 299,271 1,030,794
30 June 2017 Personal - 1,474,979 - 613,077 - 223 Corporate 317,274 1,612,619 22,171 1,136,937 280,926 1,042,003 Government - 154,023 249,683 1,227,501 - 6,373
317,274 3,241,621 271,854 2,977,515 280,926 1,048,599
31 December 2017 Personal - 1,482,882 - 608,967 - 184
Corporate 300,305 1,678,979 22,734 1,166,788 387,742 1,003,486 Government - 224,964 268,121 1,292,654 - 15,299
300,305 3,386,825 290,855 3,068,409 387,742 1,018,969
21. Capital risk management
The Bank manages its capital to ensure that it will be able to continue as a going concern while maximising the return to shareholders within acceptable risk return framework. The Bank’s overall strategy remains unchanged from prior year.
The capital base of the Bank consists of debt, which includes borrowings and equity attributable to shareholders of the Bank comprising issued share capital, share premium, reserves and retained earnings.
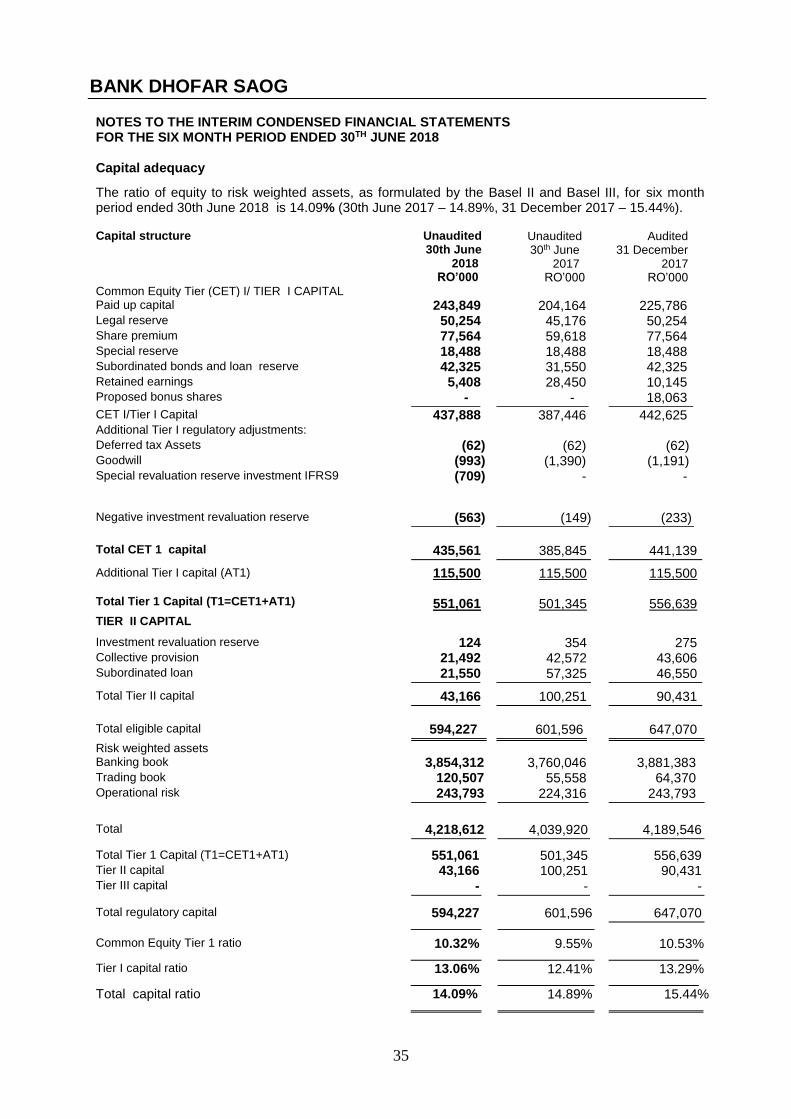
BANK DHOFAR SAOG
35
NOTES TO THE INTERIM CONDENSED FINANCIAL STATEMENTS FOR THE SIX MONTH PERIOD ENDED 30TH JUNE 2018 Capital adequacy
The ratio of equity to risk weighted assets, as formulated by the Basel II and Basel III, for six month period ended 30th June 2018 is 14.09% (30th June 2017 – 14.89%, 31 December 2017 – 15.44%). Capital structure Unaudited
30th June 2018
Unaudited 30th June
2017
Audited 31 December
2017 RO’000 RO’000 RO’000 Common Equity Tier (CET) I/ TIER I CAPITAL Paid up capital 243,849 204,164 225,786 Legal reserve 50,254 45,176 50,254 Share premium 77,564 59,618 77,564 Special reserve 18,488 18,488 18,488 Subordinated bonds and loan reserve 42,325 31,550 42,325 Retained earnings 5,408 28,450 10,145 Proposed bonus shares - - 18,063
CET I/Tier I Capital 437,888 387,446 442,625 Additional Tier I regulatory adjustments: Deferred tax Assets (62) (62) (62) Goodwill (993) (1,390) (1,191) Special revaluation reserve investment IFRS9
(709) - -
Negative investment revaluation reserve (563) (149) (233)
Total CET 1 capital 435,561 385,845 441,139
Additional Tier I capital (AT1) 115,500 115,500 115,500 Total Tier 1 Capital (T1=CET1+AT1)
551,061
501,345
556,639
TIER II CAPITAL
Investment revaluation reserve 124 354 275 Collective provision 21,492 42,572 43,606 Subordinated loan 21,550 57,325 46,550 Total Tier II capital 43,166 100,251 90,431
Total eligible capital 594,227 601,596 647,070
Risk weighted assets Banking book 3,854,312 3,760,046 3,881,383 Trading book 120,507 55,558 64,370 Operational risk 243,793 224,316 243,793
Total 4,218,612 4,039,920 4,189,546
Total Tier 1 Capital (T1=CET1+AT1) 551,061 501,345 556,639 Tier II capital 43,166 100,251 90,431 Tier III capital - - -
Total regulatory capital 594,227 601,596 647,070
Common Equity Tier 1 ratio 10.32% 9.55% 10.53%
Tier I capital ratio 13.06% 12.41% 13.29%
Total capital ratio 14.09% 14.89% 15.44%
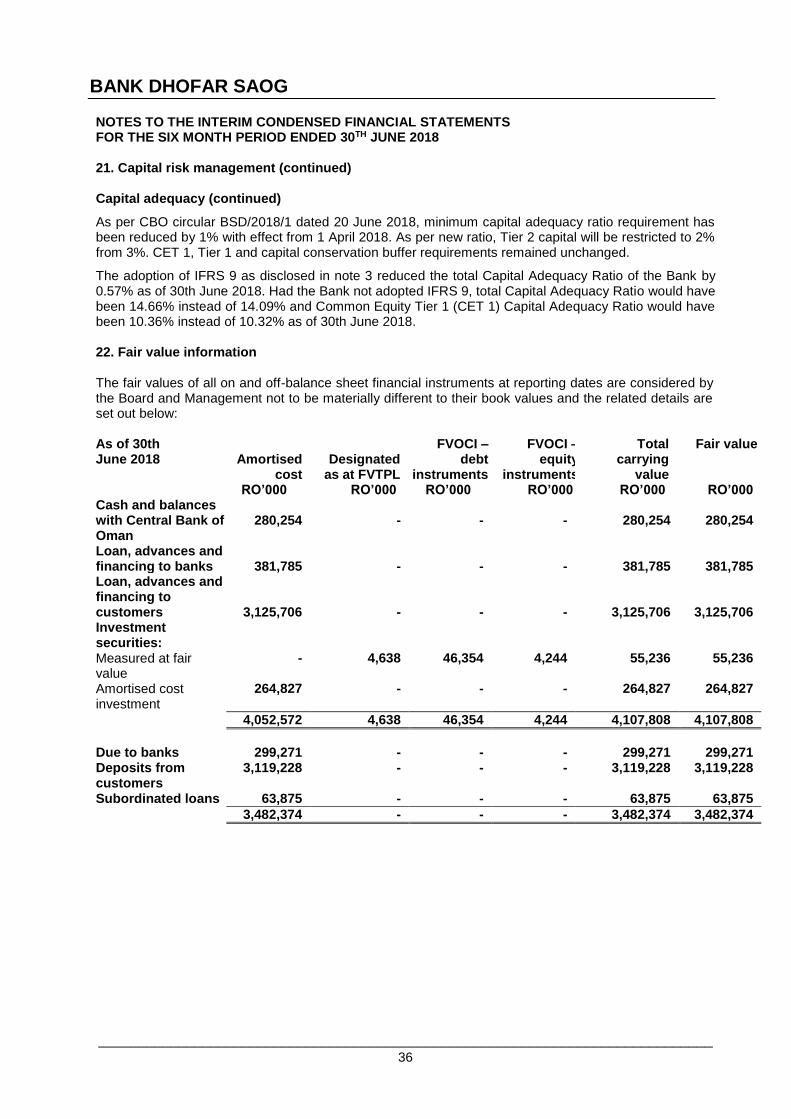
BANK DHOFAR SAOG
_____________________________________________________________________________ 36
NOTES TO THE INTERIM CONDENSED FINANCIAL STATEMENTS FOR THE SIX MONTH PERIOD ENDED 30TH JUNE 2018 21. Capital risk management (continued) Capital adequacy (continued)
As per CBO circular BSD/2018/1 dated 20 June 2018, minimum capital adequacy ratio requirement has been reduced by 1% with effect from 1 April 2018. As per new ratio, Tier 2 capital will be restricted to 2% from 3%. CET 1, Tier 1 and capital conservation buffer requirements remained unchanged.
The adoption of IFRS 9 as disclosed in note 3 reduced the total Capital Adequacy Ratio of the Bank by 0.57% as of 30th June 2018. Had the Bank not adopted IFRS 9, total Capital Adequacy Ratio would have been 14.66% instead of 14.09% and Common Equity Tier 1 (CET 1) Capital Adequacy Ratio would have been 10.36% instead of 10.32% as of 30th June 2018. 22. Fair value information The fair values of all on and off-balance sheet financial instruments at reporting dates are considered by the Board and Management not to be materially different to their book values and the related details are set out below: As of 30th June 2018
Amortised
cost
Designated
as at FVTPL
FVOCI – debt
instruments
FVOCI – equity
instruments
Total carrying
value
Fair value
RO’000 RO’000 RO’000 RO’000 RO’000 RO’000 Cash and balances with Central Bank of Oman
280,254
-
-
-
280,254
280,254
Loan, advances and financing to banks
381,785
-
-
-
381,785
381,785
Loan, advances and financing to customers
3,125,706
-
-
-
3,125,706
3,125,706 Investment securities:
Measured at fair value
- 4,638 46,354 4,244 55,236 55,236
Amortised cost investment
264,827 - - - 264,827 264,827
4,052,572 4,638 46,354 4,244 4,107,808 4,107,808
Due to banks 299,271 - - - 299,271 299,271 Deposits from customers
3,119,228 - - - 3,119,228 3,119,228
Subordinated loans 63,875 - - - 63,875 63,875
3,482,374 - - - 3,482,374 3,482,374
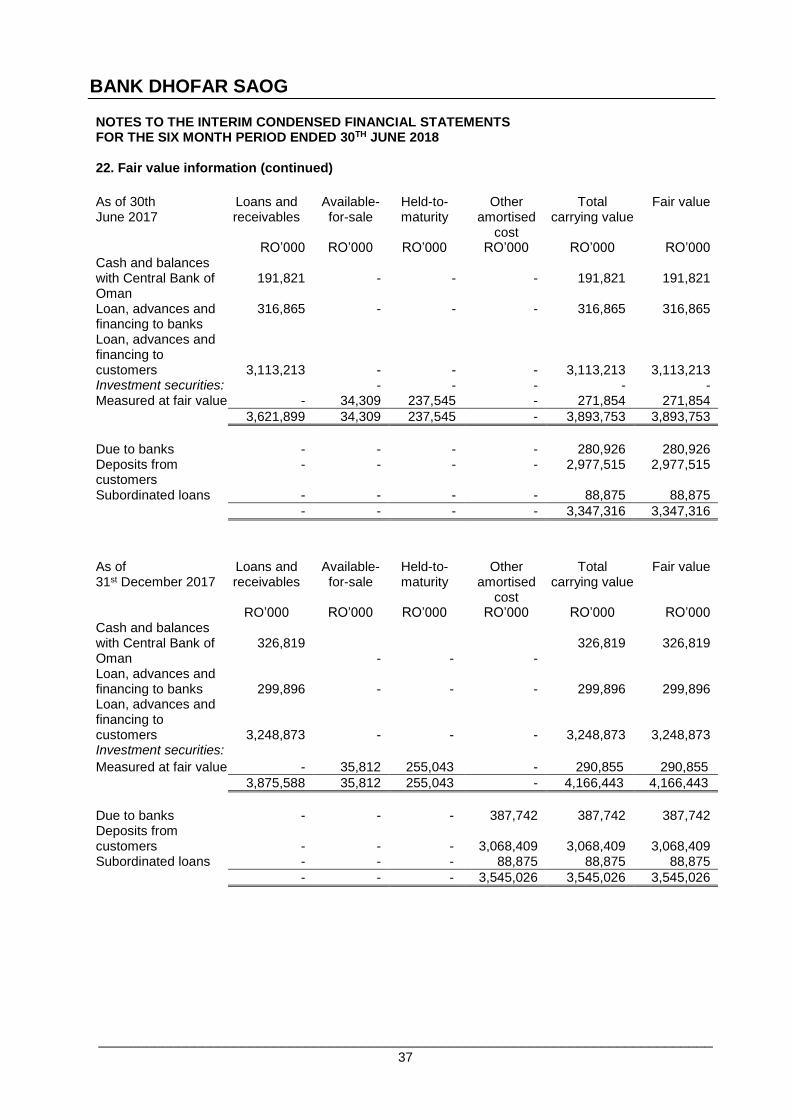
BANK DHOFAR SAOG
_____________________________________________________________________________ 37
NOTES TO THE INTERIM CONDENSED FINANCIAL STATEMENTS FOR THE SIX MONTH PERIOD ENDED 30TH JUNE 2018 22. Fair value information (continued)
As of 30th June 2017
Loans and receivables
Available-for-sale
Held-to-maturity
Other amortised
cost
Total carrying value
Fair value
RO’000 RO’000 RO’000 RO’000 RO’000 RO’000 Cash and balances with Central Bank of Oman
191,821
-
-
-
191,821
191,821
Loan, advances and financing to banks
316,865 - - - 316,865 316,865
Loan, advances and financing to customers
3,113,213
-
-
-
3,113,213
3,113,213 Investment securities: - - - - - Measured at fair value - 34,309 237,545 - 271,854 271,854
3,621,899 34,309 237,545 - 3,893,753 3,893,753
Due to banks - - - - 280,926 280,926 Deposits from customers
- - - - 2,977,515 2,977,515
Subordinated loans - - - - 88,875 88,875
- - - - 3,347,316 3,347,316
As of 31st December 2017
Loans and receivables
Available-for-sale
Held-to-maturity
Other amortised
cost
Total carrying value
Fair value
RO’000 RO’000 RO’000 RO’000 RO’000 RO’000 Cash and balances with Central Bank of Oman
326,819
-
-
-
326,819
326,819
Loan, advances and financing to banks
299,896
-
-
-
299,896
299,896
Loan, advances and financing to customers
3,248,873
-
-
-
3,248,873
3,248,873 Investment securities:
Measured at fair value - 35,812 255,043 - 290,855 290,855
3,875,588 35,812 255,043 - 4,166,443 4,166,443
Due to banks - - - 387,742 387,742 387,742 Deposits from customers
-
-
-
3,068,409
3,068,409
3,068,409
Subordinated loans - - - 88,875 88,875 88,875
- - - 3,545,026 3,545,026 3,545,026
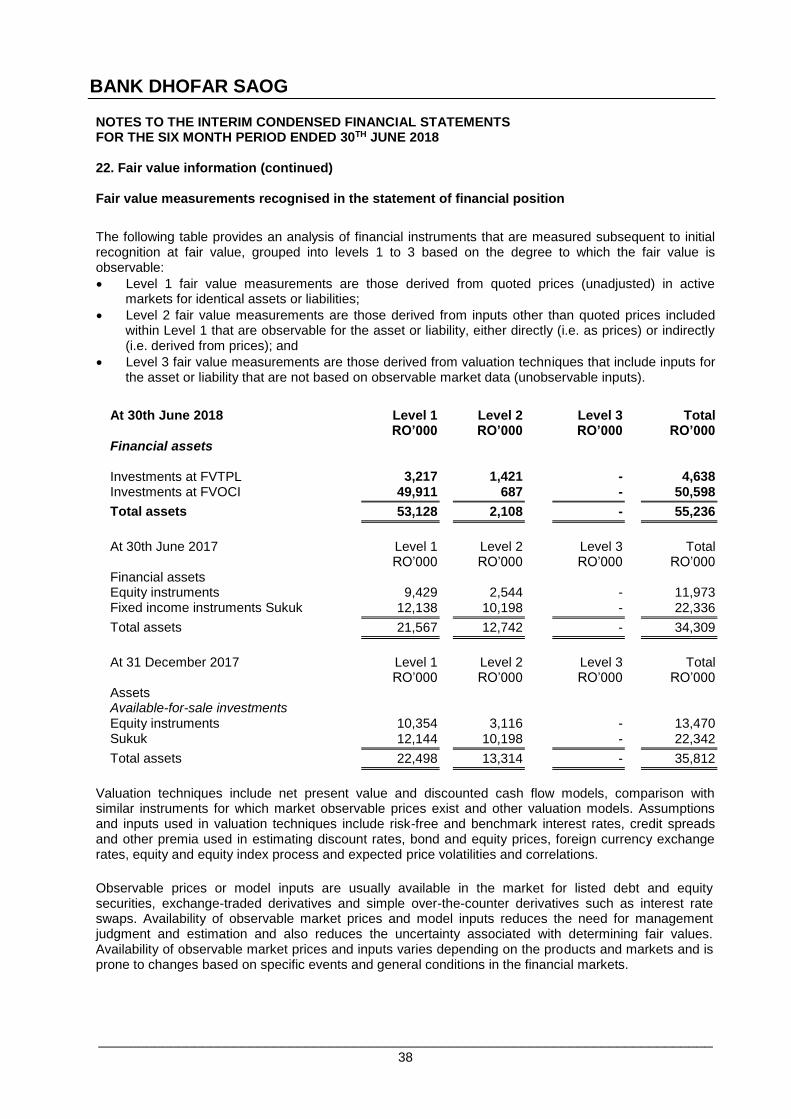
BANK DHOFAR SAOG
_____________________________________________________________________________ 38
NOTES TO THE INTERIM CONDENSED FINANCIAL STATEMENTS FOR THE SIX MONTH PERIOD ENDED 30TH JUNE 2018 22. Fair value information (continued) Fair value measurements recognised in the statement of financial position
The following table provides an analysis of financial instruments that are measured subsequent to initial recognition at fair value, grouped into levels 1 to 3 based on the degree to which the fair value is observable:
Level 1 fair value measurements are those derived from quoted prices (unadjusted) in active markets for identical assets or liabilities;
Level 2 fair value measurements are those derived from inputs other than quoted prices included within Level 1 that are observable for the asset or liability, either directly (i.e. as prices) or indirectly (i.e. derived from prices); and
Level 3 fair value measurements are those derived from valuation techniques that include inputs for the asset or liability that are not based on observable market data (unobservable inputs).
At 30th June 2018 Level 1 Level 2 Level 3 Total RO’000 RO’000 RO’000 RO’000 Financial assets
Investments at FVTPL 3,217 1,421 - 4,638 Investments at FVOCI 49,911 687 - 50,598
Total assets 53,128 2,108 - 55,236
At 30th June 2017 Level 1 Level 2 Level 3 Total RO’000 RO’000 RO’000 RO’000 Financial assets Equity instruments 9,429 2,544 - 11,973 Fixed income instruments Sukuk 12,138 10,198 - 22,336
Total assets 21,567 12,742 - 34,309
At 31 December 2017 Level 1 Level 2 Level 3 Total RO’000 RO’000 RO’000 RO’000 Assets Available-for-sale investments Equity instruments 10,354 3,116 - 13,470 Sukuk 12,144 10,198 - 22,342
Total assets 22,498 13,314 - 35,812
Valuation techniques include net present value and discounted cash flow models, comparison with similar instruments for which market observable prices exist and other valuation models. Assumptions and inputs used in valuation techniques include risk-free and benchmark interest rates, credit spreads and other premia used in estimating discount rates, bond and equity prices, foreign currency exchange rates, equity and equity index process and expected price volatilities and correlations.
Observable prices or model inputs are usually available in the market for listed debt and equity securities, exchange-traded derivatives and simple over-the-counter derivatives such as interest rate swaps. Availability of observable market prices and model inputs reduces the need for management judgment and estimation and also reduces the uncertainty associated with determining fair values. Availability of observable market prices and inputs varies depending on the products and markets and is prone to changes based on specific events and general conditions in the financial markets.
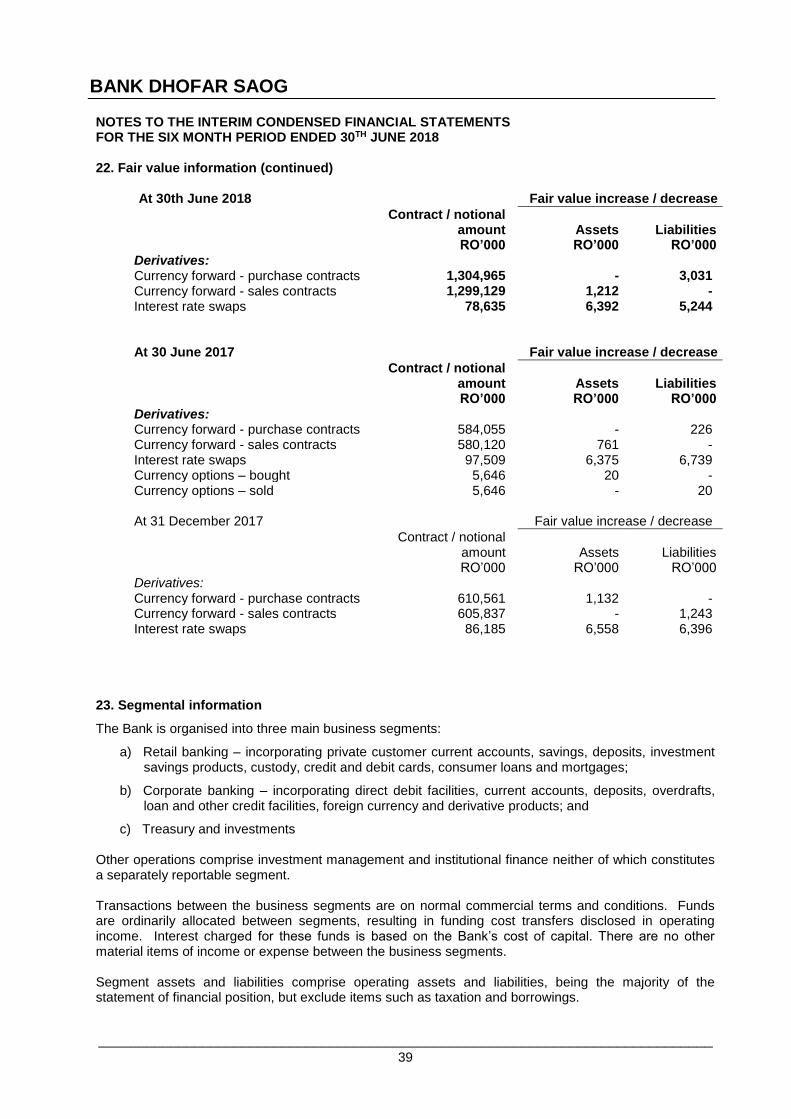
BANK DHOFAR SAOG
_____________________________________________________________________________ 39
NOTES TO THE INTERIM CONDENSED FINANCIAL STATEMENTS FOR THE SIX MONTH PERIOD ENDED 30TH JUNE 2018 22. Fair value information (continued)
At 30th June 2018 Fair value increase / decrease
Contract / notional amount RO’000
Assets RO’000
Liabilities RO’000
Derivatives: Currency forward - purchase contracts 1,304,965 - 3,031 Currency forward - sales contracts 1,299,129 1,212 - Interest rate swaps
78,635 6,392 5,244
At 30 June 2017 Fair value increase / decrease
Contract / notional amount RO’000
Assets RO’000
Liabilities RO’000
Derivatives: Currency forward - purchase contracts 584,055 - 226 Currency forward - sales contracts 580,120 761 - Interest rate swaps Currency options – bought
97,509 5,646
6,375 20
6,739 -
Currency options – sold 5,646 - 20
At 31 December 2017 Fair value increase / decrease
Contract / notional amount RO’000
Assets RO’000
Liabilities RO’000
Derivatives: Currency forward - purchase contracts 610,561 1,132 - Currency forward - sales contracts 605,837 - 1,243 Interest rate swaps
86,185
6,558
6,396
23. Segmental information
The Bank is organised into three main business segments:
a) Retail banking – incorporating private customer current accounts, savings, deposits, investment savings products, custody, credit and debit cards, consumer loans and mortgages;
b) Corporate banking – incorporating direct debit facilities, current accounts, deposits, overdrafts, loan and other credit facilities, foreign currency and derivative products; and
c) Treasury and investments Other operations comprise investment management and institutional finance neither of which constitutes a separately reportable segment. Transactions between the business segments are on normal commercial terms and conditions. Funds are ordinarily allocated between segments, resulting in funding cost transfers disclosed in operating income. Interest charged for these funds is based on the Bank’s cost of capital. There are no other material items of income or expense between the business segments. Segment assets and liabilities comprise operating assets and liabilities, being the majority of the statement of financial position, but exclude items such as taxation and borrowings.
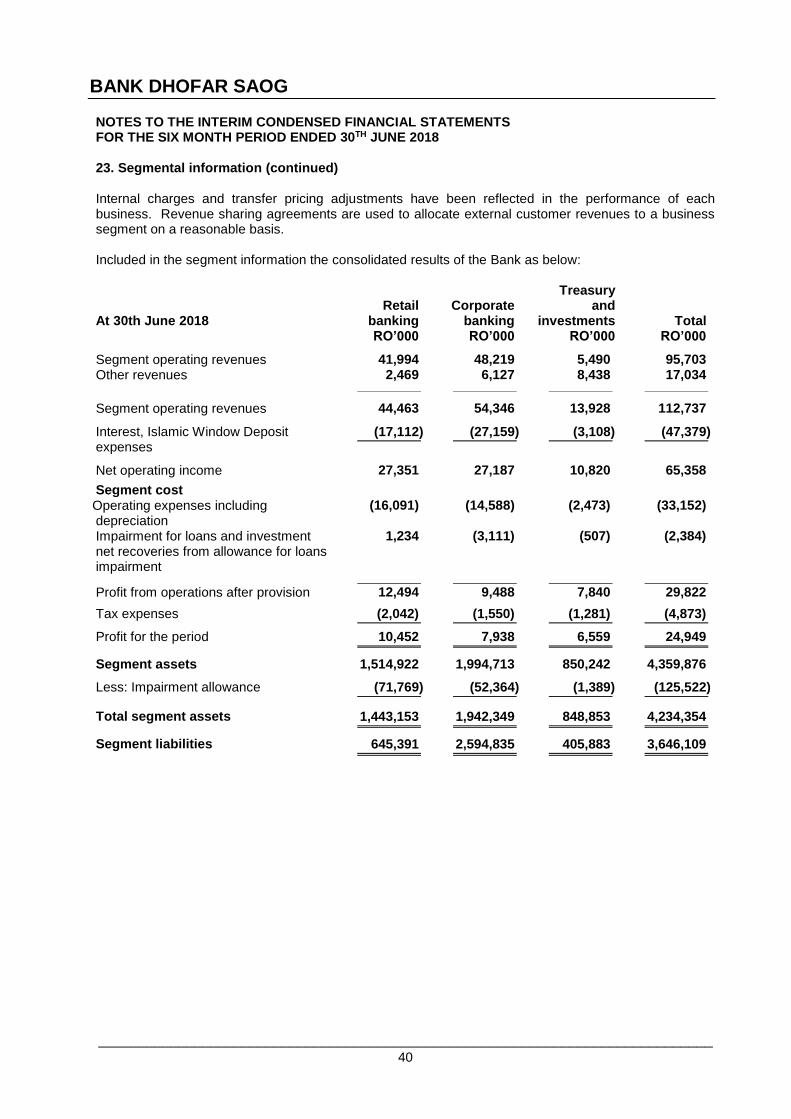
BANK DHOFAR SAOG
_____________________________________________________________________________ 40
NOTES TO THE INTERIM CONDENSED FINANCIAL STATEMENTS FOR THE SIX MONTH PERIOD ENDED 30TH JUNE 2018 23. Segmental information (continued) Internal charges and transfer pricing adjustments have been reflected in the performance of each business. Revenue sharing agreements are used to allocate external customer revenues to a business segment on a reasonable basis. Included in the segment information the consolidated results of the Bank as below:
At 30th June 2018 Retail
banking Corporate
banking
Treasury and
investments Total RO’000 RO’000 RO’000 RO’000
Segment operating revenues 41,994 48,219 5,490 95,703 Other revenues 2,469 6,127 8,438 17,034 Segment operating revenues 44,463 54,346 13,928 112,737 Interest, Islamic Window Deposit expenses
(17,112) (27,159) (3,108) (47,379)
Net operating income
27,351 27,187 10,820 65,358
Segment cost Operating expenses including depreciation
(16,091) (14,588) (2,473) (33,152)
Impairment for loans and investment net recoveries from allowance for loans impairment
1,234 (3,111) (507) (2,384)
Profit from operations after provision
12,494 9,488 7,840 29,822
Tax expenses
(2,042) (1,550) (1,281) (4,873)
Profit for the period 10,452 7,938 6,559 24,949 Segment assets
1,514,922 1,994,713 850,242 4,359,876
Less: Impairment allowance
(71,769) (52,364) (1,389) (125,522) Total segment assets 1,443,153 1,942,349 848,853 4,234,354 Segment liabilities 645,391 2,594,835 405,883 3,646,109
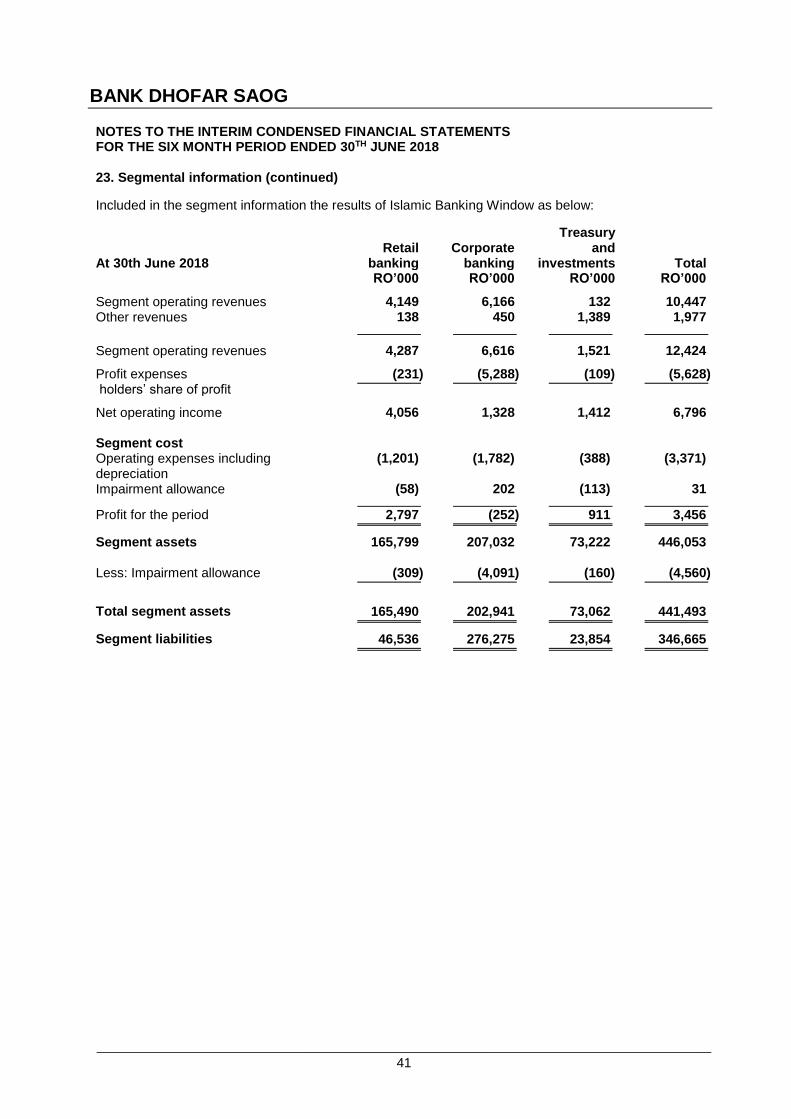
BANK DHOFAR SAOG
_____________________________________________________________________________ 41
NOTES TO THE INTERIM CONDENSED FINANCIAL STATEMENTS FOR THE SIX MONTH PERIOD ENDED 30TH JUNE 2018 23. Segmental information (continued)
Included in the segment information the results of Islamic Banking Window as below:
At 30th June 2018 Retail
banking Corporate
banking
Treasury and
investments Total RO’000 RO’000 RO’000 RO’000
Segment operating revenues 4,149 6,166 132 10,447 Other revenues 138 450 1,389 1,977 Segment operating revenues 4,287 6,616 1,521 12,424 Profit expenses holders’ share of profit
(231) (5,288) (109) (5,628)
Net operating income
4,056 1,328 1,412 6,796
Segment cost Operating expenses including depreciation
(1,201) (1,782) (388) (3,371)
Impairment allowance (58) 202 (113) 31
Profit for the period 2,797 (252) 911 3,456 Segment assets
165,799 207,032 73,222 446,053
Less: Impairment allowance
(309) (4,091) (160) (4,560)
Total segment assets 165,490 202,941 73,062 441,493 Segment liabilities 46,536 276,275 23,854 346,665
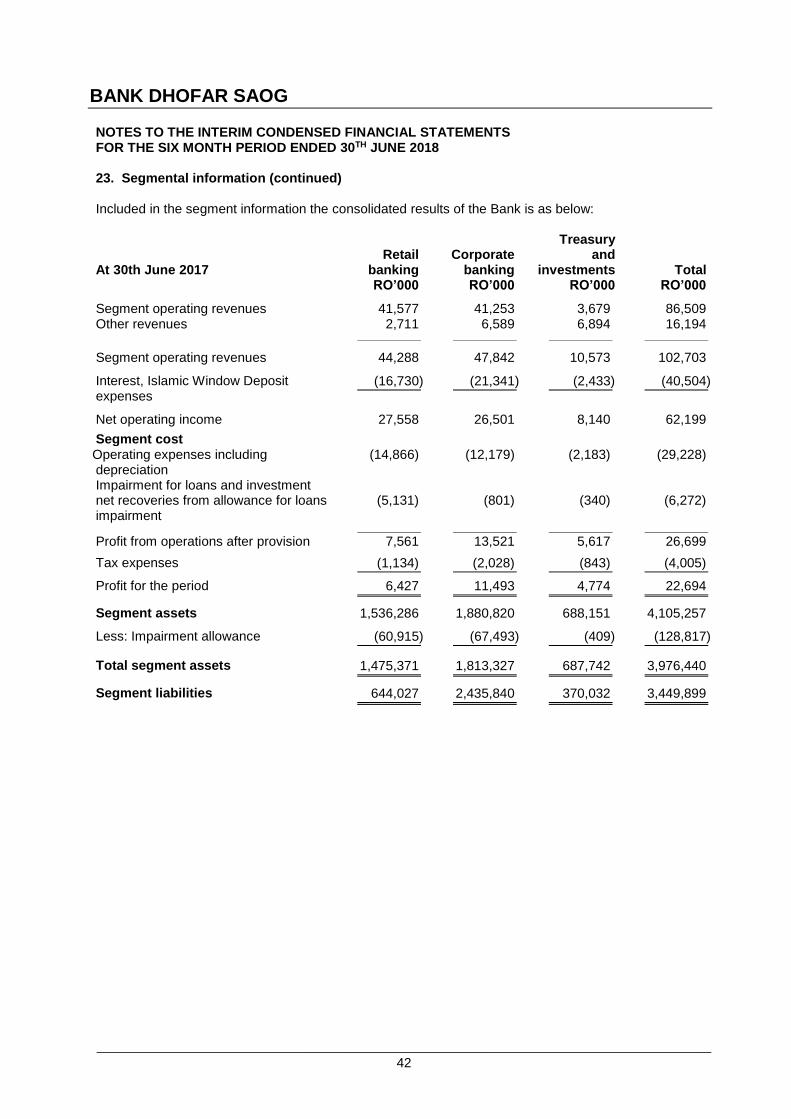
BANK DHOFAR SAOG
_____________________________________________________________________________ 42
NOTES TO THE INTERIM CONDENSED FINANCIAL STATEMENTS FOR THE SIX MONTH PERIOD ENDED 30TH JUNE 2018 23. Segmental information (continued) Included in the segment information the consolidated results of the Bank is as below:
At 30th June 2017 Retail
banking Corporate
banking
Treasury
and investments Total
RO’000 RO’000 RO’000 RO’000
Segment operating revenues 41,577 41,253 3,679 86,509 Other revenues 2,711 6,589 6,894 16,194 Segment operating revenues 44,288 47,842 10,573 102,703 Interest, Islamic Window Deposit expenses
(16,730) (21,341) (2,433) (40,504)
Net operating income
27,558 26,501 8,140 62,199
Segment cost Operating expenses including depreciation
(14,866) (12,179) (2,183) (29,228)
Impairment for loans and investment net recoveries from allowance for loans impairment
(5,131)
(801)
(340)
(6,272)
Profit from operations after provision
7,561 13,521 5,617 26,699
Tax expenses
(1,134) (2,028) (843) (4,005)
Profit for the period 6,427 11,493 4,774 22,694 Segment assets
1,536,286 1,880,820 688,151 4,105,257
Less: Impairment allowance
(60,915) (67,493) (409) (128,817) Total segment assets 1,475,371 1,813,327 687,742 3,976,440 Segment liabilities 644,027 2,435,840 370,032 3,449,899
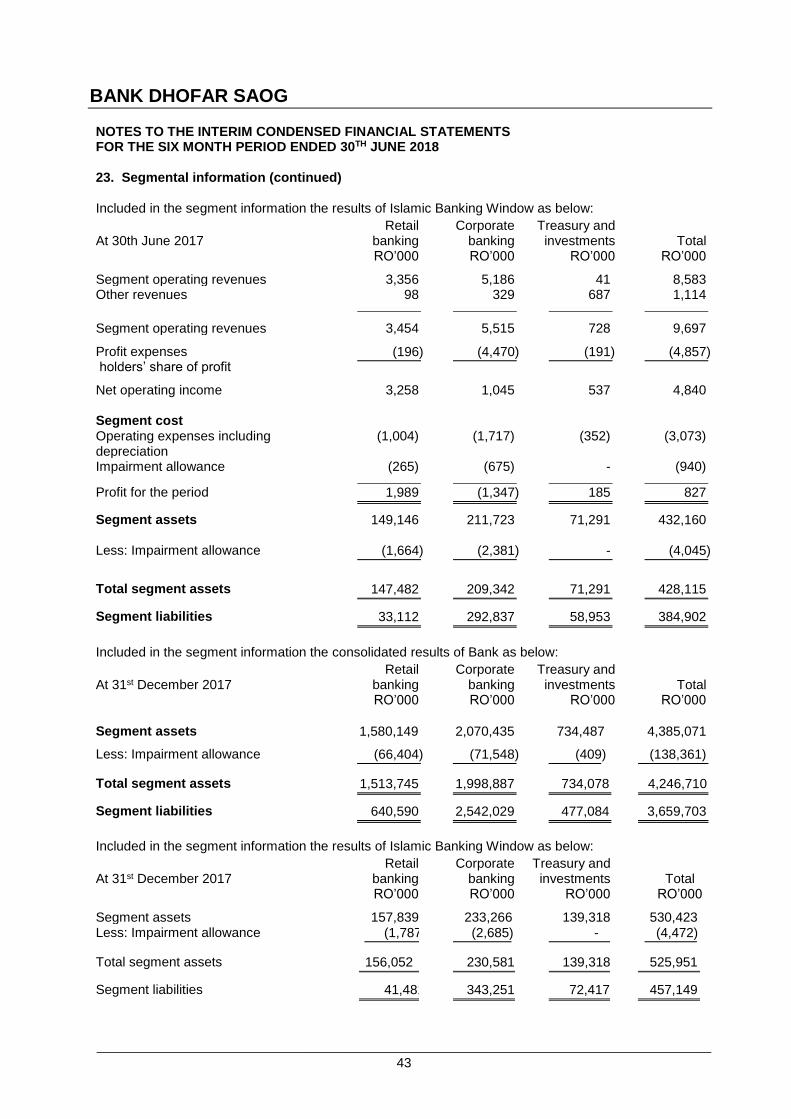
BANK DHOFAR SAOG
_____________________________________________________________________________ 43
NOTES TO THE INTERIM CONDENSED FINANCIAL STATEMENTS FOR THE SIX MONTH PERIOD ENDED 30TH JUNE 2018 23. Segmental information (continued) Included in the segment information the results of Islamic Banking Window as below:
At 30th June 2017 Retail
banking Corporate
banking Treasury and investments Total
RO’000 RO’000 RO’000 RO’000
Segment operating revenues 3,356 5,186 41 8,583 Other revenues 98 329 687 1,114 Segment operating revenues 3,454 5,515 728 9,697 Profit expenses holders’ share of profit
(196) (4,470) (191) (4,857)
Net operating income
3,258 1,045 537 4,840
Segment cost Operating expenses including depreciation
(1,004) (1,717) (352) (3,073)
Impairment allowance (265) (675) - (940)
Profit for the period 1,989 (1,347) 185 827 Segment assets
149,146 211,723 71,291 432,160
Less: Impairment allowance
(1,664) (2,381) - (4,045)
Total segment assets 147,482 209,342 71,291 428,115 Segment liabilities 33,112 292,837 58,953 384,902 Included in the segment information the consolidated results of Bank as below:
At 31st December 2017 Retail
banking Corporate
banking Treasury and investments Total
RO’000 RO’000 RO’000 RO’000
Segment assets
1,580,149 2,070,435 734,487 4,385,071
Less: Impairment allowance
(66,404) (71,548) (409) (138,361) Total segment assets 1,513,745 1,998,887 734,078 4,246,710 Segment liabilities 640,590 2,542,029 477,084 3,659,703
Included in the segment information the results of Islamic Banking Window as below:
At 31st December 2017 Retail
banking Corporate
banking Treasury and investments Total
RO’000 RO’000 RO’000 RO’000
Segment assets 157,839 233,266 139,318 530,423 Less: Impairment allowance
(1,787) (2,685) - (4,472) Total segment assets 156,052 230,581 139,318 525,951 Segment liabilities 41,481 343,251 72,417 457,149