Embed Size (px)
Citation preview

Unaudited resultsfor the six months to
30th June 2017
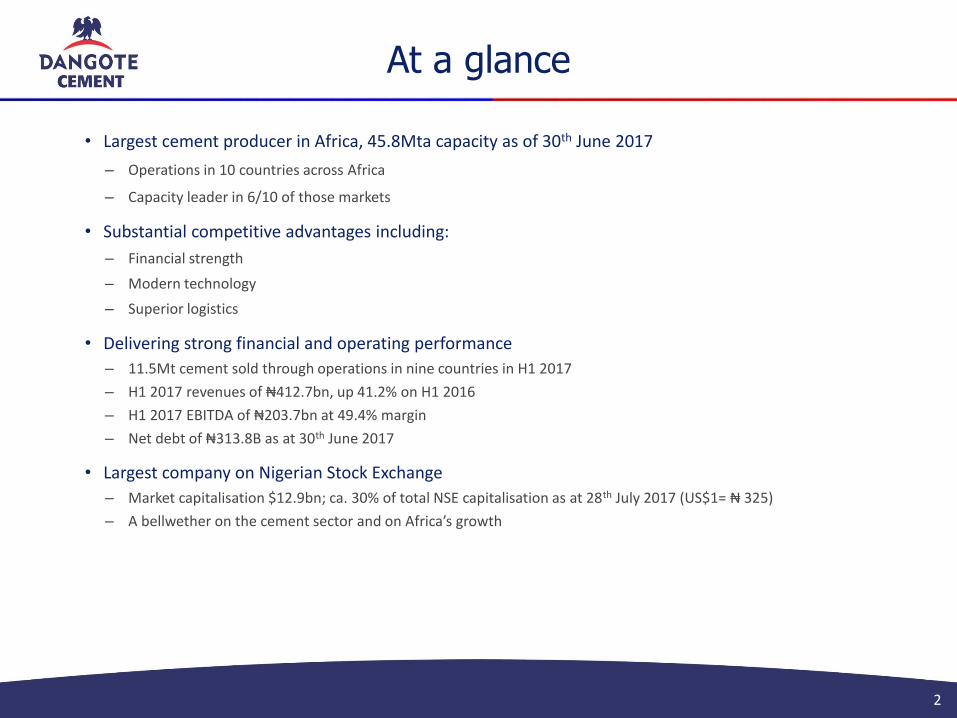
At a glance
2
• Largest cement producer in Africa, 45.8Mta capacity as of 30th June 2017
– Operations in 10 countries across Africa
– Capacity leader in 6/10 of those markets
• Substantial competitive advantages including:
– Financial strength
– Modern technology
– Superior logistics
• Delivering strong financial and operating performance
– 11.5Mt cement sold through operations in nine countries in H1 2017
– H1 2017 revenues of ₦412.7bn, up 41.2% on H1 2016
– H1 2017 EBITDA of ₦203.7bn at 49.4% margin
– Net debt of ₦313.8B as at 30th June 2017
• Largest company on Nigerian Stock Exchange
– Market capitalisation $12.9bn; ca. 30% of total NSE capitalisation as at 28th July 2017 (US$1= ₦ 325)
– A bellwether on the cement sector and on Africa’s growth

Investment highlights
3
Investment attractions
Strong growth
Market leadership
Industry disruptor
High margins
& returns
Low debt
Generous dividend
policy
Reasons to invest
Exposure to Nigerian growth
Exposure to African
Infrastructure spending
Higher return
alternative to mining
Proxy for GDP growth
across Africa
Play on Africa’s
consumer growth
High
Dividend
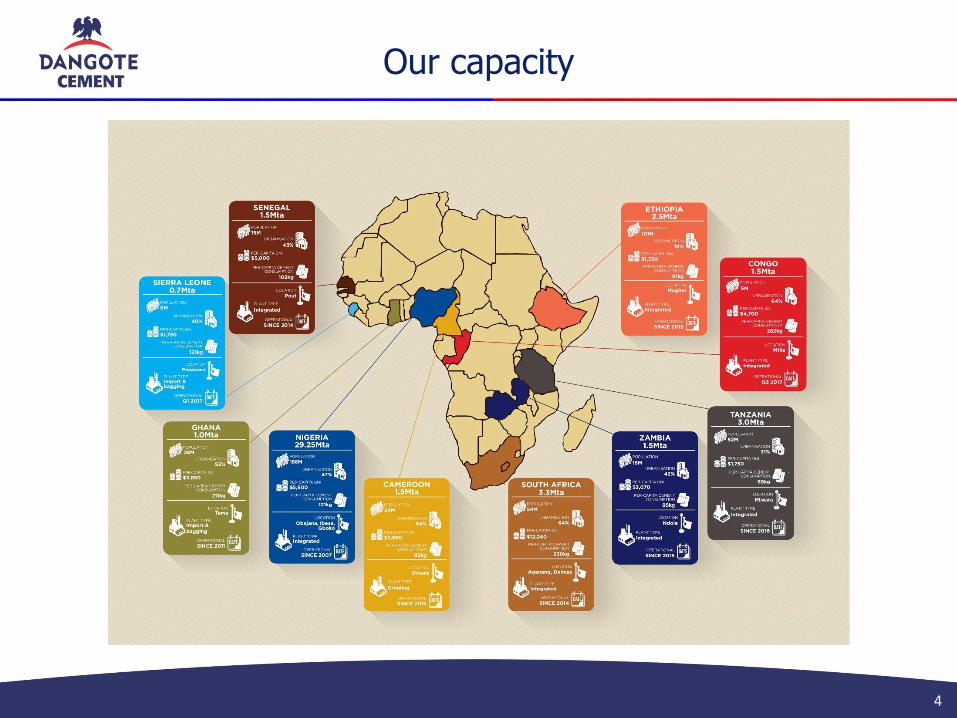
Our capacity
4

Strong financial performance
5
+46%+47%
0
100
200
300
400
500
600
700
2012 2013 2014 2015 2016
Revenue EBITDA Cash flow from operations Capex Dividend paid
₦B

0
5
10
15
20
25
2010 2011 2012 2013 2014 2015 2016
Nigeria Cameroon Ethiopia Ghana Senegal South Africa Tanzania Zambia
Strong volume growth
6
20.4% CAGR
Mill
ion
to
nn
es

Why Sub-Saharan Africa? Why cement?
7
Cement demand driven by
increasing population,
urbanisation and prosperity
Sub-Saharan Africa
significantly lags global
average per-capita cement
consumption
Huge opportunity for African
producers to expand, replace
imports, especially in West
Africa, much of which lacks
limestone
Africa is the last major
growth market for cement
with relatively little surplus
capacity at present
High capital cost of
entry, construction time
and access to resources
are key barriers to entry
Key markets are
Nigeria, Ethiopia, South Africa;
cement ‘majors’ with high net
debt/EBITDA are less able to
take on additional debt to to
finance entry to these markets
Cement is an essential
building material with no
viable substitutes;
Africa needs billions of
tonnes in the coming
decades
Many incumbents are sub-
scale, use older technologies,
so are vulnerable to well-
funded industry disruptors
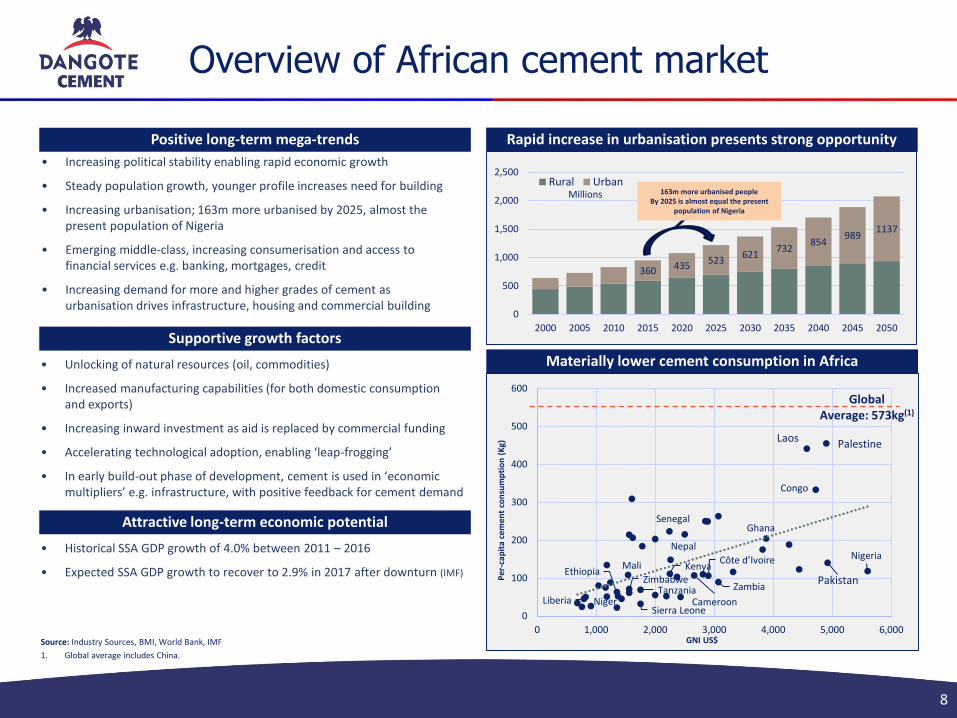
Overview of African cement market
8
• Increasing political stability enabling rapid economic growth
• Steady population growth, younger profile increases need for building
• Increasing urbanisation; 163m more urbanised by 2025, almost the present population of Nigeria
• Emerging middle-class, increasing consumerisation and access to financial services e.g. banking, mortgages, credit
• Increasing demand for more and higher grades of cement as urbanisation drives infrastructure, housing and commercial building
Positive long-term mega-trends
Source: Industry Sources, BMI, World Bank, IMF
1. Global average includes China.
• Unlocking of natural resources (oil, commodities)
• Increased manufacturing capabilities (for both domestic consumption and exports)
• Increasing inward investment as aid is replaced by commercial funding
• Accelerating technological adoption, enabling ‘leap-frogging’
• In early build-out phase of development, cement is used in ‘economic multipliers’ e.g. infrastructure, with positive feedback for cement demand
Supportive growth factors
• Historical SSA GDP growth of 4.0% between 2011 – 2016
• Expected SSA GDP growth to recover to 2.9% in 2017 after downturn (IMF)
Attractive long-term economic potential
Rapid increase in urbanisation presents strong opportunity
Liberia Niger
EthiopiaMali
Zimbabwe
Sierra Leone
Tanzania
Senegal
Kenya
Nepal
Cameroon
Côte d’Ivoire
Zambia
Ghana
Laos
Congo
Palestine
Pakistan
Nigeria
0
100
200
300
400
500
600
0 1,000 2,000 3,000 4,000 5,000 6,000
Global Average: 573kg(1)
Materially lower cement consumption in Africa
GNI US$
Pe
r-ca
pit
a ce
men
t co
nsu
mp
tio
n (
Kg)
360 435523
621732
854989
1137
0
500
1,000
1,500
2,000
2,500
2000 2005 2010 2015 2020 2025 2030 2035 2040 2045 2050
Rural UrbanMillions 163m more urbanised people
By 2025 is almost equal the present population of Nigeria

0
20
40
60
80
100
120
140
0
500
1,000
1,500
2,000
2,500
3,000
3,500
4,000
4,500
2010 2011 2012 2013 2014 2015 2016E 2017F 2018F
Global Cement Consumption 2010-2018F
(Million tonnes)
Australasia Central America Central Europe Eastern Europe
Indian Sub-continent Middle East North Africa North America
North Asia South America South Asia Sub-Saharan Africa
Western Europe Sub-Saharan Africa (RH scale)
SSA demand growing strongly
9
SSA CAGR 7.2%
Glo
bal
co
nsu
mp
tio
nM
illio
n t
on
ne
s
Sub
-Saharan
Africa
Millio
n to
nn
es

Operations in growth markets
10
+46%+47%
GDP growth 2012 2013 2014 2015 2016E 2017F 2018F
Cameroon 4.6% 5.6% 5.9% 5.8% 4.4% 3.7% 4.3%
Congo 3.8% 3.3% 6.8% 2.6% -2.7% 0.6% 8.8%
Ethiopia 8.7% 9.9% 10.3% 10.4% 8.0% 7.5% 7.5%
Ghana 9.3% 7.3% 4.0% 3.9% 4.0% 5.8% 9.2%
Nigeria 4.3% 5.4% 6.3% 2.7% -1.5% 0.8% 1.9%
Senegal 4.5% 3.6% 4.3% 6.5% 6.6% 6.8% 7.0%
Sierra Leone 15.2% 20.7% 4.6% -20.6% 4.9% 5.0% 6.6%
South Africa 2.2% 2.5% 1.7% 1.3% 0.3% 0.8% 1.6%
Tanzania 5.1% 7.3% 7.0% 7.0% 6.6% 6.8% 6.9%
Zambia 7.6% 5.1% 4.7% 2.9% 3.0% 3.5% 4.0%
Source: International Cement Review / www.cemnet.com, June 2017
0
10
20
30
40
50
60
70
80
2012 2013 2014 2015 2016E 2017F 2018F
Cameroon Congo Ethiopia Ghana Nigeria Senegal Sierra Leone South Africa Tanzania Zambia
Source: IMF Regional Economic Outlook, Sub-Saharan Africa May 2017
Cem
ent
con
sum
pti
on
(M
t)
6.1% Total CAGR

Capacity leader in 6/10 countries
11
+46%+47%
Source: Dangote Cement estimates, Global Cement Report XII, June 2017
Nigeria Cameroon Congo Ethiopia Ghana
Producer Capacity Producer Capacity Producer Capacity Producer Capacity Producer Capacity
Dangote Cement 29.3 Cimencam 1.7 Dangote Cement 1.5 Dangote Cement 2.5 Ghacem 4.5
Lafarge Africa 10.4 Dangote Cement 1.5 Others 1.7 Derba Midroc 2.5 Diamond 2.8
BUA 4.0 MEDCEM 0.6 Total 3.2 Mugher Cement 2.2 Dangote 1.5
Purecem 0.1 CIMAF 0.5 Dangote % 46.9% Messebo Cement 2.1 CIMAF 1.1
Total 43.7 Total 4.3 Habesha Cement 1.4 Total 9.9
Dangote % 66.9% Dangote % 39.5% National Cement 1.1 Dangote % 15.2%
Abyssinia 0.9
East Cement Co. 0.8
Capital Cement 0.7
Others 1.4
Total 15.6
Dangote % 16.1%
Senegal Sierra Leone South Africa Tanzania Zambia
Producer Capacity Producer Capacity Producer Capacity Producer Capacity Producer Capacity
Sococim 3.5 Dangote Cement 0.7 PPC 5.0 Dangote Cement 3.0 Dangote Cement 1.5
Ciments du Sahel 3.2 Leocem 0.6 Afrisam 4.0 Twiga 1.9 Lafarge 1.5
Dangote Cement 1.5 Other importers 0.3 Lafarge 3.2 ARM Cement 1.6 Zambezi 0.5
Total 8.2 Total 1.6 Dangote Cement 2.8 Tanga 1.3 Great Wall 0.3
Dangote % 18.3% Dangote % 43.8% NPC Cimpor 1.5 Mbeya 1.1 Oriental 0.1
Mamba 1.0 Lake 1.0 Total 3.9
Total 17.4 Other 1.2 Dangote % 38.7%
Dangote % 16.1% Total 11.0
Dangote % 27.3%

12
Strategic raw material access
• Limestone is the key and irreplaceable ingredientof all types of modern cement
• Commercially viable deposits of limestone are relativelyscarce across many parts of Africa
– Ideally need high-quality limestone to be neardemand centres, fuel and distribution network
• Nigeria has a relative abundance of quality limestoneespecially in key southern regions near to demandcentres, export facilities
– Nigeria also has good-quality coal that we will mineto achieve self-sufficiency in fuel
• Absence of limestone in much of West and East Africa,especially coastal states, forces those countries to importbulk cement or its intermediate product, clinker, usuallyfrom Far East and Nigeria
• Limestone reserves close to existing facilities each with alife of mine in excess of 30 years
• Dangote Cement plans an ‘export to import’ strategy toserve West Africa and Cameroon from Nigerian factories,exporting by road and in time by sea
Limestone in Nigeria is high quality and close to demand centres

Goal
Vision
Strategic initiatives and goals
13
Grow and diversify
across the last and
potentially most
attractive major
growth market for
cement
Strategic pillars / long-term goals
Consolidate expansion across
Africa
Achieve leadership in key
markets
Tap high-value export markets
Capture local markets with
superior quality and service
Adhere to global standards of governance
Improve sustainability
Strive to obtain a #1 or
#2 position in each
market, with at least
30% share
Serve landlocked
markets with high
sales prices and
margins, generate FX
to offset imported raw
materials
Serve markets with
delivered product
instead of factory gate
sales; use financial
strength to improve
service, reduce costs
Achieving international
standing through good
governance enables us
to access global
financial markets
Be most energy and
CO2 efficient company
in our industry, with
low environmental
footprint when
compared to peers
• Key elements of business model
– Target high-growth, populous markets with cement deficits and older/less efficient producers
– Be the leader in quality, costs and service wherever we operate
– Expand quickly and profitably when rivals are hampered by debt or smaller scale
To deliver superior and sustainable risk-adjusted ROI, IRR on our investments
To be Africa’s leading producer of cement, respected for the quality of its products and services and for the way it conducts its business
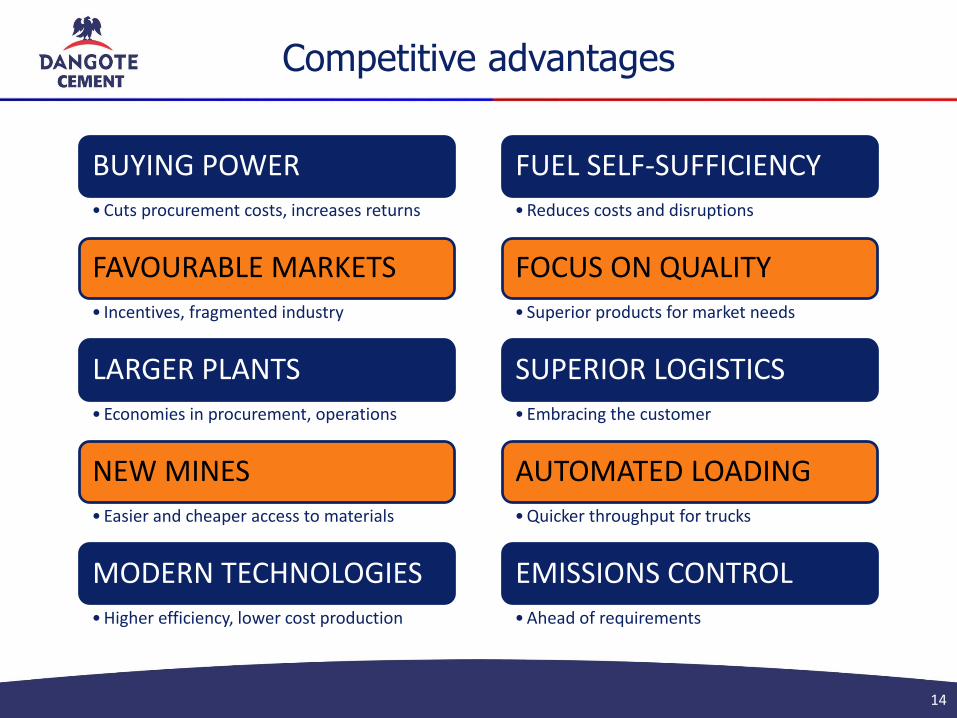
Competitive advantages
14
BUYING POWER
• Cuts procurement costs, increases returns
FAVOURABLE MARKETS
• Incentives, fragmented industry
LARGER PLANTS
• Economies in procurement, operations
NEW MINES
• Easier and cheaper access to materials
MODERN TECHNOLOGIES
• Higher efficiency, lower cost production
FUEL SELF-SUFFICIENCY
• Reduces costs and disruptions
FOCUS ON QUALITY
• Superior products for market needs
SUPERIOR LOGISTICS
• Embracing the customer
AUTOMATED LOADING
• Quicker throughput for trucks
EMISSIONS CONTROL
• Ahead of requirements

Board and Committees
15
Board of Directors
Aliko Dangote (1)
Onne van der WeijdeBrian EganOlakunle AlakeSani DangoteAbdu DantataErnest Ebi*
Devakumar EdwinEmmanual Ikazoboh*
Fidelis MadavoJoseph MakojuOlusegun Olusanya *
Dorothy Ufot *
Douraid Zaghouani
Finance & General Purpose Committee
Olusegun Olusanya(1)
Olakunle AlakeSani DangoteErnest Ebi*Devakumar EdwinEmmanuel Ikazoboh*Fidelis Madavo
Audit, Compliance & Risk Committee
Ernest Ebi*(1)
Olakunle AlakeSani DangoteDevakumar EdwinEmmanuel Ikazoboh*Fidelis MadavoOlusegun Olusanya*Dorothy Ufot*
Remuneration & Governance Committee
Emmanuel Ikazoboh *(1)
Sani DangoteAbdu DantataErnest Ebi*Devakumar EdwinJoseph MakojuOlusegun Olusanya*Dorothy Ufot*
Nomination Committee
Aliko Dangote(1)
Ernest Ebi*Emmanuel Ikazoboh*Olusegun Olusanya*Fidelis Madavo
TechnicalCommittee
Fidelis Madavo(1)
Olakunle AlakeAbdu DantataErnest Ebi*Devakumar EdwinJoseph MakojuDouraid Zaghouani
Statutory Audit Committee(2)
Robert Ade-Odiachi(1)
Nicholas NyamaliSheriff YussufOlakunle AlakeOlusegun OlusanyaEmmanuel Ikazoboh
Note: * denotes Independent Non-Executive Directors.1. Chairman of Committee.2. The Statutory Audit Committee is not a Committee of the Board.

56 58
106 106
166
214232
0
50
100
150
200
250
2010 2011 2012 2013 2014 2015 2016
Annual Report Pages
Strong corporate governance
16
• Achieved Premium Listing status on the Nigerian Stock Exchange, August 2015
• Followed rigorous audit of governance policies
• June 2016 appointment of first female director, Mrs Dorothy Ufot, SAN
• Adds strong legal experience
• Four Independent Non-Executive Directors
• Group-wide risk management initiative
• Improved Annual Report providing stakeholders with more information and greater transparency
• Implementation of key policies to meet international standards of governance
International standards of governance
EHSS commitments
• EHSS Head Massimo Bettanin appointed Q2 2016
• Formerly adviser to DCP during its work with ERM consultancy
• Major Environment, Health & Safety and Social initiative
• Standard approaches to be rolled out across all territories
• Occupational Health & Safety Management System
• Improves on plant-by-plant approach adopted so far
• Teams being recruited to Dangote Cement EHSS programme in 2016
• Working to adopt IFC Performance Standards
• Plan to adopt global sustainability reporting standards in FY2018
• Likely to be based upon GRI G4 Sustainability reporting Guidelines
Improving corporate disclosure

H1 2017 highlights
17
6m to 30th June 2017 2016 Change
Sales volumes ‘000t ‘000t
Nigeria 6,854 8,766 (21.8%)
Pan-Africa 4,747 4,218 12.6%
Inter-company sales (92) (14)
Total 11,509 12,970 (11.3%)
Revenues ₦m ₦m
Nigeria 291,395 216,617 34.5%
Pan-Africa 124,447 76,006 63.7%
Inter-company sales (3,166) (432)
Total 412,676 292,191 41.2%
EBITDA ₦m ₦m
Nigeria 190,089 126,645 50.1%
Pan-Africa 19,632 12,915 52.0%
Inter-company and central costs
(6,048) (7,046)
Total 203,672 132,514 53.7%
EBITDA margin* % %
Nigeria 65.2% 58.5%
Pan-Africa 15.8% 17.0%
Group 49.4% 45.4%
• Strong financial performance despite volume fall
• Revenues up 34.5%
• Group EBITDA up 53.7%– EBITDA margins improve to 49.4%
• Nigeria EBITDA / tonne up 66.1%– Improved fuel mix in Nigeria, own-mined coal
• Pan-African volumes up 12.6%– Gaining share across Africa
• Strong Pan-African performance– Revenues up 63.7%– EBITDA up 52.0%
• Net debt of ₦313.8B – Dividend payment of ₦144.8B in Q2 2017
• Excellent credit ratings published on 5th July:– Moody’s: Ba3 Local Currency Corporate Family Rating
AaaNg National Scale Rating– Global Credit Ratings: Long-term AA+(NG)
Short-term A1+(NG)
* Before central costs and eliminations

Year to date
18
Q1 2017 Q2 2017 H1 2017 H1 2016 % change
Sales volumes ‘000t ‘000t ‘000t ‘000t
Nigeria 3,770 3,085 6,855 8,766 (21.8%)
Pan-Africa 2,342 2,405 4,747 4,218 12.6%
Inter-company sales (87) (6) (93) (14)
Total 6,025 5,484 11,509 12,970 (11.3%)
Revenues ₦m ₦m ₦m ₦m
Nigeria 152,355 139,040 291,395 216,617 34.5%
Pan-Africa 58,715 65,732 124,447 76,006 63.7%
Inter-company sales (2,904) (262) (3,166) (432)
Total 208,166 204,510 412,676 292,191 41.2%
EBITDA ₦m ₦m ₦m ₦m
Nigeria 98,679 91,410 190,089 126,645 50.1%
Pan-Africa 7,483 12,149 19,632 12,915 52.0%
Inter-company and central costs (3,159) (2,890) (6,049) (7,046)
Total 103,003 100,669 203,672 132,514 53.7%
EBITDA margin* % % % %
Nigeria 64.8% 65.7% 65.2% 58.5%
Pan-Africa 12.7% 18.5% 15.8% 17.0%
Group 49.5% 49.2% 49.4% 45.4%
* Before central costs and eliminations

Group financial overview
Six months to 30th June 2017 2016
₦m ₦m % change
Revenue 412,676 292,191 41.2%
Cost of sales (177,552) (139,187) 27.6%
Gross profit 235,124 153,004 53.7%
Gross margin 57.0% 52.4%
EBITDA 203,672 132,514 53.7%
EBITDA margin 49.4% 45.4%
EBIT 163,495 98,042 66.8%
EBIT margin 39.6% 33.6%
Finance income 16,487 43,560 (62.2%)
Finance cost (24,404) (16,712) 46.0%
Profit before tax 155,578 124,890 24.6%
Income tax (expense)/credit (11,536) (21,470) (28.0%)
Profit for the period 144,042 103,420 35.5%
Earnings per share 8.42 6.23 31.4%
19
Income Statement

Group financial overview
20
Movement in net debt
Cash₦B
Debt₦B
Net debt₦B
As at 1st January 2017 115,693 (356,465) (240,772)
Cash generated from operations beforechanges in working capital
197,460 - 197,460
Changes in working capital (49,934) - (49,934)
Income tax paid (2,830) - (2,830)
Additions to fixed assets (37,579) - (37,579)
Other investing activities (682) - (682)
Change in non-current prepayments (2,587) - (2,587)
Net interest payments (26,701) - (26,701)
Net loans obtained (repaid) 53,013 (53,013) -
Dividend paid (144,844) - (144,844)
Other cash and non-cash movements 9,564 (14,874) (5,310)
As at 30th June 2017 110,573 424,352 (313,779)
(cont’d)

21
As at As at30/6/17 31/12/16
₦m ₦m
Property, plant and equipment 1,191,628 1,155,711
Other non-current assets 79,625 64,888
Intangible assets 5,318 4,145
Current assets 250,855 187,471
Cash and cash equivalents 110,573 115,693
Total Assets 1,637,979 1,527,908
Non-current liabilities 84,406 65,841
Current liabilities 306,533 291,947
Debt 424,352 372,775
Total liabilities 815,291 730,563
Net Assets 822,688 797,345
Net debt as % of net assets 38.1% 30.2%
Financial overview
Balance sheet
(cont’d)

22
Analysis of debt
₦B Short-term* Long-term Total %
Naira 187.0 29.4 216.4 51%
US$ 76.3 22.1 98.4 23%
Rand 5.1 42.5 47.6 11%
Other 14.4 47.6 62.0 15%
Total 282.8 141.6 424.4 100%
• Most short-term debt is to parent
• Low US$ debt exposure, mainly in relation to LCs
• DCP Nigeria lends to country operations in US$, which results in gain on translation as Naira devalues
*Including overdraft

Credit ratings published
23
Moody’s (5th July 2017)
Ba3 Local Currency Corporate Family Rating, Aaa.ng National Scale Rating
"Dangote Cement Plc’s Ba3 local currency corporate family rating,one notch above the Government of Nigeria’s own rating, reflects thecompany’s strong standalone credit profile and track record ofdemonstrated financial support from a larger and more diversifiedparent Dangote Industries Limited."
Global Credit Ratings (9th June 2017)
AA+(NG) and A1+(NG) ratings
“The ratings take cognisance of the evolution of DCP into one of theworld’s top 20 cement companies by installed capacity, and its positionas the largest corporate on The Nigerian Stock Exchange (“NSE”). Thishas been achieved through rapid fixed capital formation, whichincreased its capacity to c.44 million tonnes per annum (“Mtpa”) acrosseight countries, from 8Mtpa in 2011.”
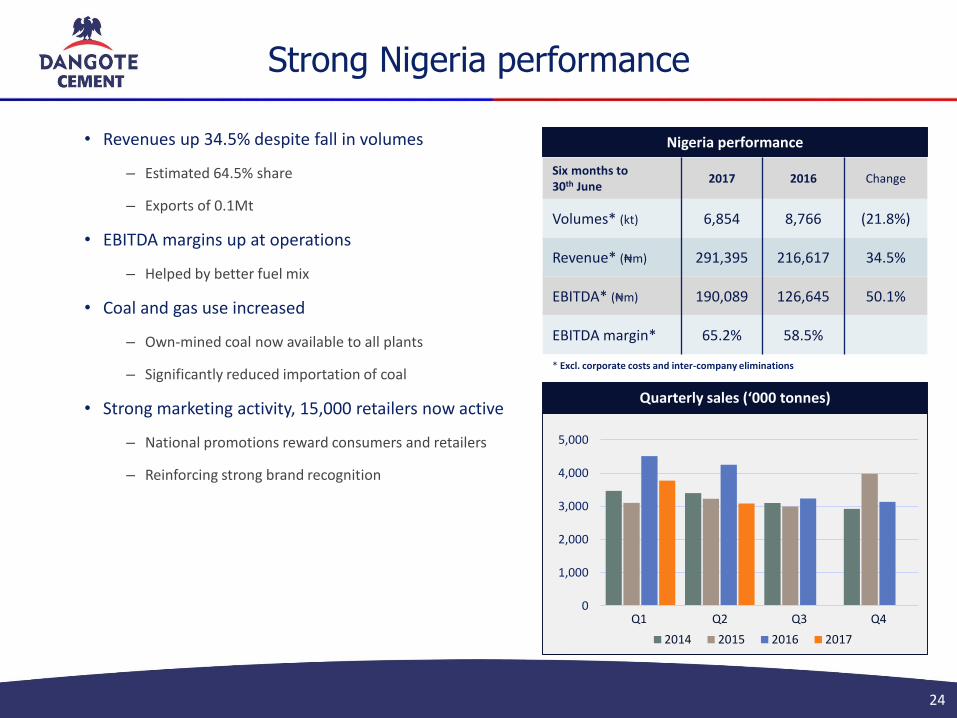
Strong Nigeria performance
24
• Revenues up 34.5% despite fall in volumes
– Estimated 64.5% share
– Exports of 0.1Mt
• EBITDA margins up at operations
– Helped by better fuel mix
• Coal and gas use increased
– Own-mined coal now available to all plants
– Significantly reduced importation of coal
• Strong marketing activity, 15,000 retailers now active
– National promotions reward consumers and retailers
– Reinforcing strong brand recognition
Nigeria performance
Six months to30th June
2017 2016 Change
Volumes* (kt) 6,854 8,766 (21.8%)
Revenue* (₦m) 291,395 216,617 34.5%
EBITDA* (₦m) 190,089 126,645 50.1%
EBITDA margin* 65.2% 58.5%
0
1,000
2,000
3,000
4,000
5,000
Q1 Q2 Q3 Q4
2014 2015 2016 2017
Quarterly sales (‘000 tonnes)
* Excl. corporate costs and inter-company eliminations

₦ 19,780
₦ 23,743
₦ 25,738
₦ 28,192
₦ 37,817
₦ 40,412
₦ 45,084
₦ 12,060
₦ 14,674 ₦ 13,729
₦ 12,407₦ 24,859
₦ 26,175
₦ 29,640
2,500
3,000
3,500
4,000
4,500
5,000
₦ 0
₦ 5,000
₦ 10,000
₦ 15,000
₦ 20,000
₦ 25,000
₦ 30,000
₦ 35,000
₦ 40,000
₦ 45,000
₦ 50,000
Q4 2015 Q1 2016 Q2 2016 Q3 2016 Q4 2016 Q1 2017 Q2 2017
Revenue per tonne EBITDA per tonne* Volume ('000 tonnes)
Strong uplift in Nigeria Q2 EBITDA
25
• EBITDA momentum maintained in Q2 2017
– Q2 margins reflect additional price adjustment of +₦150/bag in Jan, ₦250 in Feb and ₦75 in Apr (inc. VAT)
– Impact of improved fuel mix
61.8% 53.3%44.0%
65.7%
64.8%
*excluding central costs
61.0%
65.7%
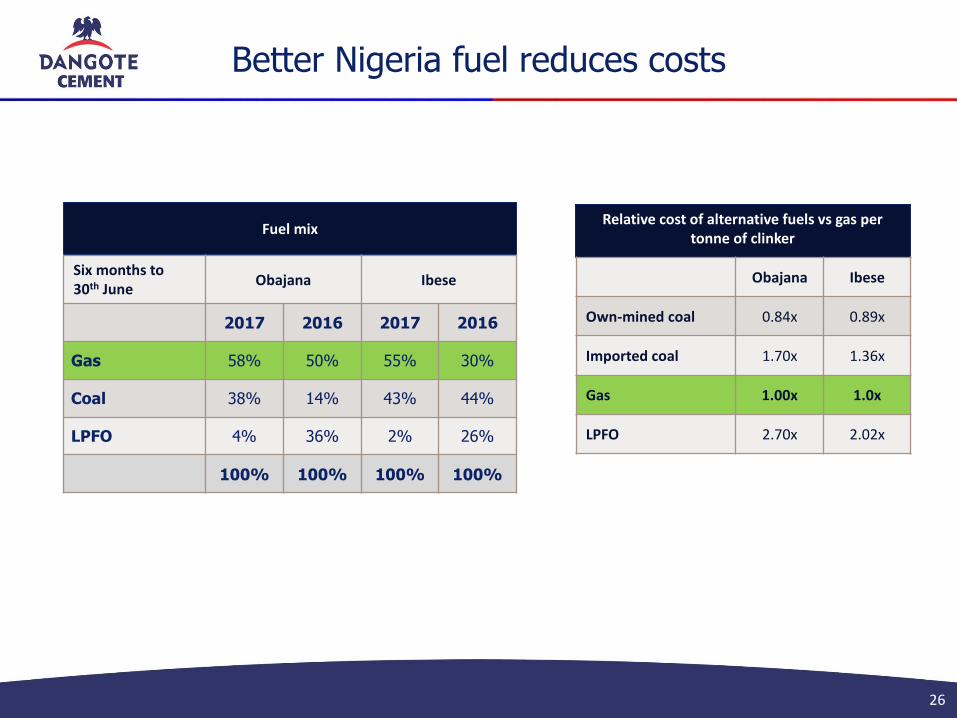
Better Nigeria fuel reduces costs
26
Relative cost of alternative fuels vs gas per tonne of clinker
Obajana Ibese
Own-mined coal 0.84x 0.89x
Imported coal 1.70x 1.36x
Gas 1.00x 1.0x
LPFO 2.70x 2.02x
Fuel mix
Six months to 30th June
Obajana Ibese
2017 2016 2017 2016
Gas 58% 50% 55% 30%
Coal 38% 14% 43% 44%
LPFO 4% 36% 2% 26%
100% 100% 100% 100%

Nigeria cash cost analysis
27
% of average cash costs per tonne (Nigeria, 6m to June 2017)
Cash cost is approximately $37/tonne, 6m to 30th June 2017
Kiln fuel26%
Power Plant14%
Production wages & Salaries, 5%
Maintenance manpower, 3%
Maintenance supplies, 6%O&M Technical, 2%
Contract Maintenance, 1%
SG&A 18%
Plant General, 5%
Mine Cost, 1%Gypsum, 6%
Packaging13%
Refractories, 1%
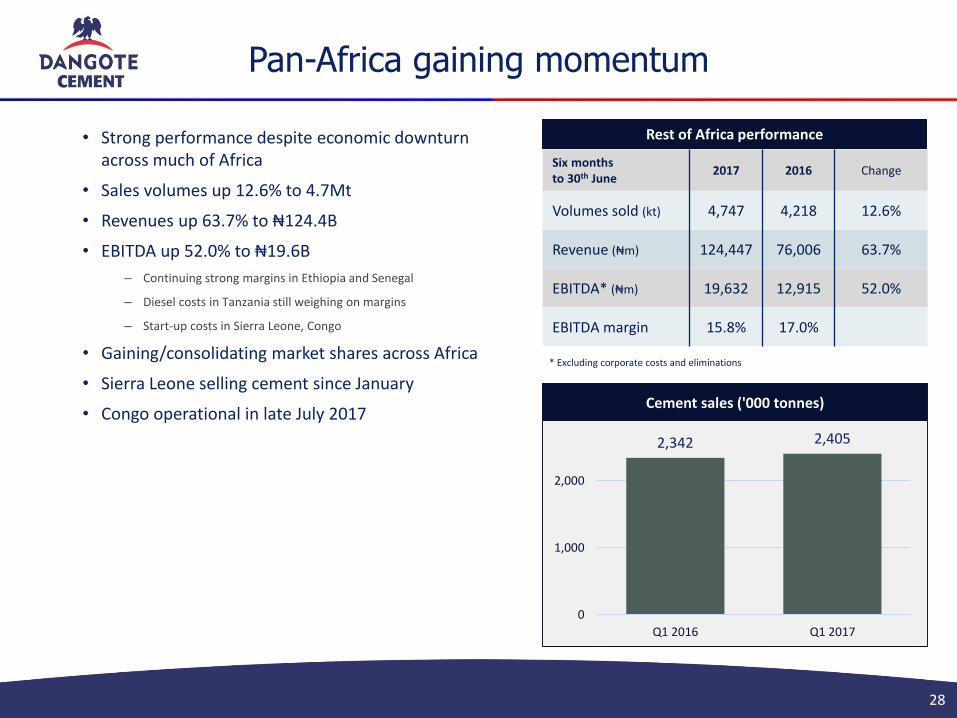
Pan-Africa gaining momentum
28
• Strong performance despite economic downturnacross much of Africa
• Sales volumes up 12.6% to 4.7Mt
• Revenues up 63.7% to ₦124.4B
• EBITDA up 52.0% to ₦19.6B
– Continuing strong margins in Ethiopia and Senegal
– Diesel costs in Tanzania still weighing on margins
– Start-up costs in Sierra Leone, Congo
• Gaining/consolidating market shares across Africa
• Sierra Leone selling cement since January
• Congo operational in late July 2017Cement sales ('000 tonnes)
2,342 2,405
0
1,000
2,000
Q1 2016 Q1 2017
Rest of Africa performance
Six months to 30th June
2017 2016 Change
Volumes sold (kt) 4,747 4,218 12.6%
Revenue (₦m) 124,447 76,006 63.7%
EBITDA* (₦m) 19,632 12,915 52.0%
EBITDA margin 15.8% 17.0%
* Excluding corporate costs and eliminations

Country updates
29
Cameroon
• 3.7% GDP growth forecast by IMF in 2017
• Housing, infrastructure, football driving cement demand
• 627Kt cement sold, up 16.3%
• Increasing brand recognition, strengthening relationships with distributors
• Supply chain initiatives focus on margin improvements
Ghana
• Strong economic growth forecast to support expanding oil and gas industries
• 508kt cement sold in H1 2017, up 8%
• Better availability of cement
• Improved logistics
• Q2 pricing about $110/tonne
Ethiopia
• IMF forecasts 7.5% GDP growth in 2017
• Growth & Transformation Plan driving major projects
• Total market sales of 4.2Mt in H1 2017
• 1.1Mt sold from Mugher plant; 26% share
Senegal
• IMF forecasts 6.8% GDP growth in 2017
• 738Kt cement sold in H1 2017, up 26.5% on H1 2016
• Plant at nearly 100% capacity utilisation
• Strong success of our new 32.5R product
• Exporting to Mali and Gambia
• Strong margins through excellent plant management

Country updates
30
Sierra Leone
• Economy recovering from Ebola, GDP growth expected 5% in 2017 (IMF)
• Steady start after 0.7Mt import facility opened in Q1
• 53Kt cement sold
• Strong marketing drive through retailer outreach/sign-up, TV/radio ads
South Africa
• Economy remains subdued
• Market fell slightly in H1
• New competitor (Mamba)
• Cement sales down 4.9% vs H1 2016
• Peers facing merger doubts provides opportunity to consolidate position as well-funded operator gaining share
Tanzania
• Strong GDP growth continuing
• Large infrastructure projects driving cement demand
• Gas gensets expected by September, with immediate improvement to margins
• New truck fleet to improve deliveries
Zambia
• IMF estimates 3.5% GDP growth in 2017
• Ndola plant sold 331Kt
• Slight fall owing to heavy and prolonged rains
• Retail market constrained by tight monetary policy
• Assuming O&M control from Sinoma
(3m to 30th June)
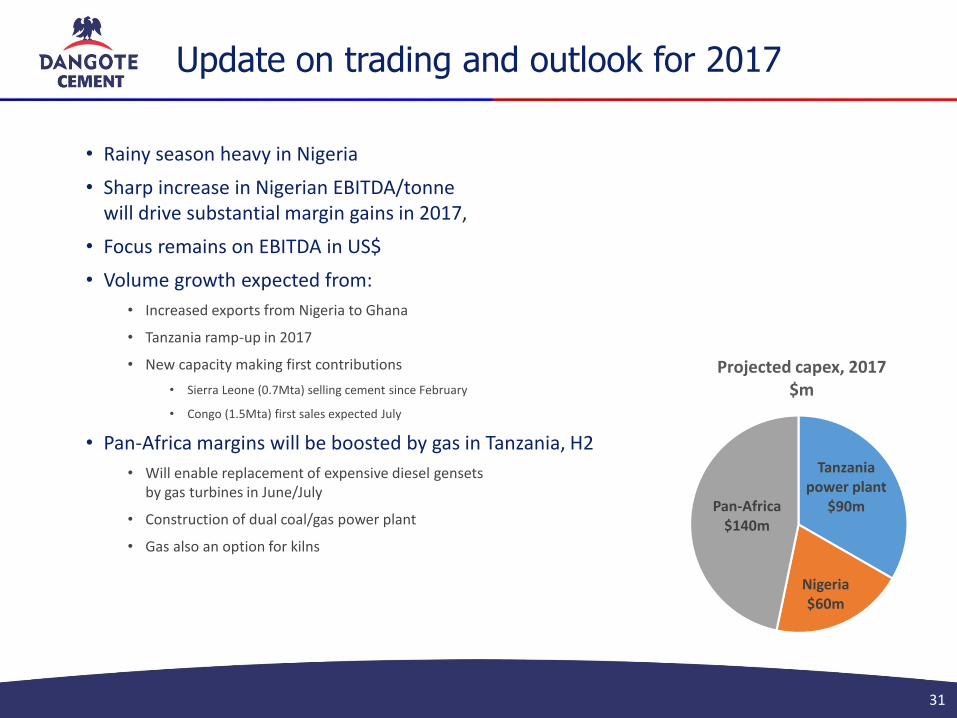
Update on trading and outlook for 2017
31
• Rainy season heavy in Nigeria
• Sharp increase in Nigerian EBITDA/tonne will drive substantial margin gains in 2017,
• Focus remains on EBITDA in US$
• Volume growth expected from:
• Increased exports from Nigeria to Ghana
• Tanzania ramp-up in 2017
• New capacity making first contributions
• Sierra Leone (0.7Mta) selling cement since February
• Congo (1.5Mta) first sales expected July
• Pan-Africa margins will be boosted by gas in Tanzania, H2
• Will enable replacement of expensive diesel gensetsby gas turbines in June/July
• Construction of dual coal/gas power plant
• Gas also an option for kilns
+46%+47%
Tanzania power plant
$90m
Nigeria$60m
Pan-Africa$140m
Projected capex, 2017$m

Sustainability
32
+46%+47%
• Dangote Cement is committed to introducing sustainability reporting in its 2018 Annual Report
• Reporting will be guided by:
• Nigerian Stock Exchange requirements on sustainability reporting
• Cement Sustainability Initiative
• Global Reporting Initiative G4 Sustainability Reporting Guidelines
• Initial focus likely to be upon:
• Carbon disclosure
• Emissions monitoring
• Responsible use of fuel and raw materials
• Employee health and safety
• Biodiversity impacts
• Water impacts
• Timetable
• 2016: Benchmark industry standard reporting, identify relevant reporting standards, develop pilot monitoring studies
• 2017: Review pilot studies, develop policies and finalise KPIs, staff training
• 2018: Roll out monitoring and reporting system across entire business, data assurance, regular management reviews
• 2019: Produce first Sustainability Report

Pioneer Tax schedule
33
+46%+47%Gboko 2008 2009 2010 2011 2012 2013 2014 2015 2016 2017 2018 2019
Line 1
Line 2
Ibese 2008 2009 2010 2011 2012 2013 2014 2015 2016 2017 2018 2019
Line 1
Line 2
Line 3
Line 4 Feb
Obajana 2008 2009 2010 2011 2012 2013 2014 2015 2016 2017 2018 2019
Line 1
Line 2
Line 3
Line 4 Feb
Tax exempt

Investment in plants
34
+46%+47%
$m
Obajana 1,895
Ibese 1,440
Gboko 561
Nigeria $3,897m
Cameroon 138
Congo 312
Ethiopia 521
Senegal 358
Sierra Leone 52
South Africa 330
Tanzania 540
Zambia 358
Pan-Africa $2,609m
Total $6,506m
NB. Total investment in Nigeria is $5.3B including coal mills, logistics and other capital projects
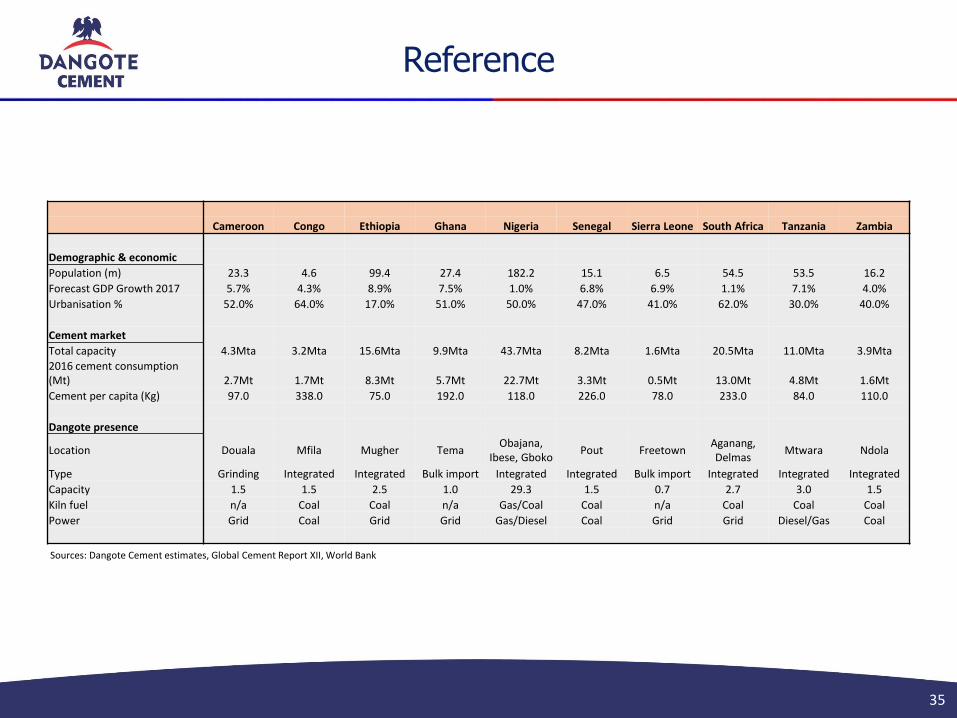
Reference
35
+46%+47%
Sources: Dangote Cement estimates, Global Cement Report XII, World Bank
Cameroon Congo Ethiopia Ghana Nigeria Senegal Sierra Leone South Africa Tanzania Zambia
Demographic & economic
Population (m) 23.3 4.6 99.4 27.4 182.2 15.1 6.5 54.5 53.5 16.2
Forecast GDP Growth 2017 5.7% 4.3% 8.9% 7.5% 1.0% 6.8% 6.9% 1.1% 7.1% 4.0%
Urbanisation % 52.0% 64.0% 17.0% 51.0% 50.0% 47.0% 41.0% 62.0% 30.0% 40.0%
Cement market
Total capacity 4.3Mta 3.2Mta 15.6Mta 9.9Mta 43.7Mta 8.2Mta 1.6Mta 20.5Mta 11.0Mta 3.9Mta
2016 cement consumption (Mt) 2.7Mt 1.7Mt 8.3Mt 5.7Mt 22.7Mt 3.3Mt 0.5Mt 13.0Mt 4.8Mt 1.6Mt
Cement per capita (Kg) 97.0 338.0 75.0 192.0 118.0 226.0 78.0 233.0 84.0 110.0
Dangote presence
Location Douala Mfila Mugher TemaObajana,
Ibese, GbokoPout Freetown
Aganang, Delmas
Mtwara Ndola
Type Grinding Integrated Integrated Bulk import Integrated Integrated Bulk import Integrated Integrated Integrated
Capacity 1.5 1.5 2.5 1.0 29.3 1.5 0.7 2.7 3.0 1.5
Kiln fuel n/a Coal Coal n/a Gas/Coal Coal n/a Coal Coal Coal
Power Grid Coal Grid Grid Gas/Diesel Coal Grid Grid Diesel/Gas Coal

Regional cement consumption trends
36
+46%+47%2010 2011 2012 2013 2014 2015 2016E 2017F 2018F
CAGR 2010-18F
Mt Mt Mt Mt Mt Mt Mt Mt Mt %
Australasia 13.1 13.2 11.9 10.5 11.2 11.3 11.4 11.8 12.0 -1.1%
Central America 50.3 51.7 53.4 52.9 55.0 58.1 59.1 60.6 61.3 2.5%
Central Europe 43.1 46.5 42.5 41.3 42.8 44.7 45.1 45.8 46.1 0.8%
Eastern Europe 131.7 148.9 160.0 175.0 177.8 170.9 164.7 168.8 169.6 3.2%
Indian Sub-continent 273.9 293.5 303.4 318.1 340.6 351.4 372.0 387.2 397.4 4.8%
Middle East 167.1 176.7 180.6 185.0 184.0 182.3 179.6 179.3 183.0 1.1%
North Africa 102.3 96.3 105.1 106.5 112.0 112.6 117.6 127.5 127.5 2.8%
North America 80.0 81.0 87.4 90.8 98.2 101.7 103.0 106.9 109.4 4.0%
North Asia 1,959.7 2,161.2 2,283.4 2,517.9 2,582.3 2,458.4 2,517.1 2,469.7 2,402.3 2.6%
South America 109.1 118.7 125.4 130.8 131.7 127.0 116.4 113.4 114.6 0.6%
South Asia 156.5 165.9 176.2 187.1 196.9 209.0 208.6 217.4 225.5 4.7%
Sub-Saharan Africa 68.6 75.6 82.1 91.7 98.3 103.6 108.5 115.4 119.7 7.2%
Western Europe 156.4 156.0 134.6 125.8 124.3 125.3 126.1 129.3 131.6 -2.1%
Total 3,311.7 3,585.2 3,745.7 4,033.5 4,155.1 4,056.1 4,129.3 4,133.1 4,099.9 2.7%
Source: International Cement Review / www.CemNet.com

Investor Relations contacts
37
For further information contact:
Carl FranklinHead of Investor RelationsDangote Cement Plc
+44 207 399 3070+44-7713 634 [email protected]
www.dangotecement.com
@DangoteCement