Embed Size (px)
Citation preview
Uncertainty and its Applicationin Pesticide Residue Analysis
Canping Pan (China Agricultural University)
Email: [email protected]
Pesticide Residue Workshop, April 28th, 2009, Beijing
Outline of Topics
• 1. Uncertainty concept
• 2. Current Status in residue analysis
• 3. Uncertainty Estimations
• 4. CCPR discussions on uncertainty
• Test Results: product of lab。• Report or Calibration certificate: by test
results
• The quality of test results: express as uncertainty of testing
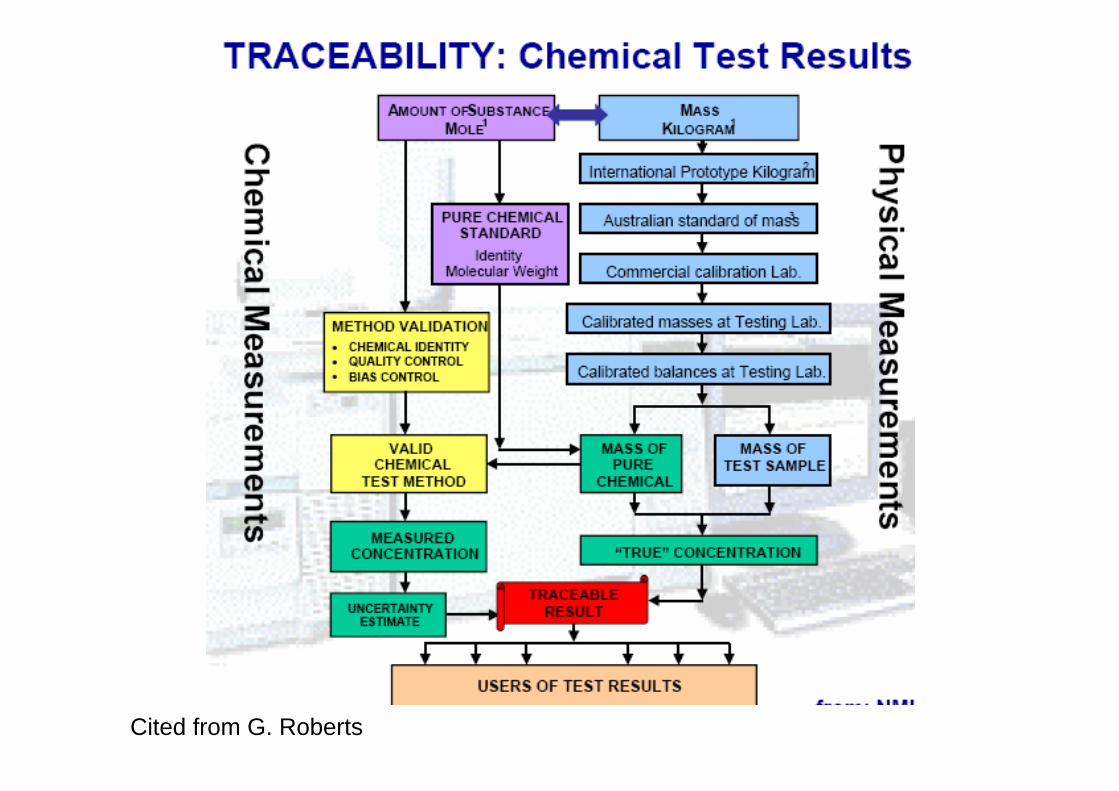
Cited from G. Roberts
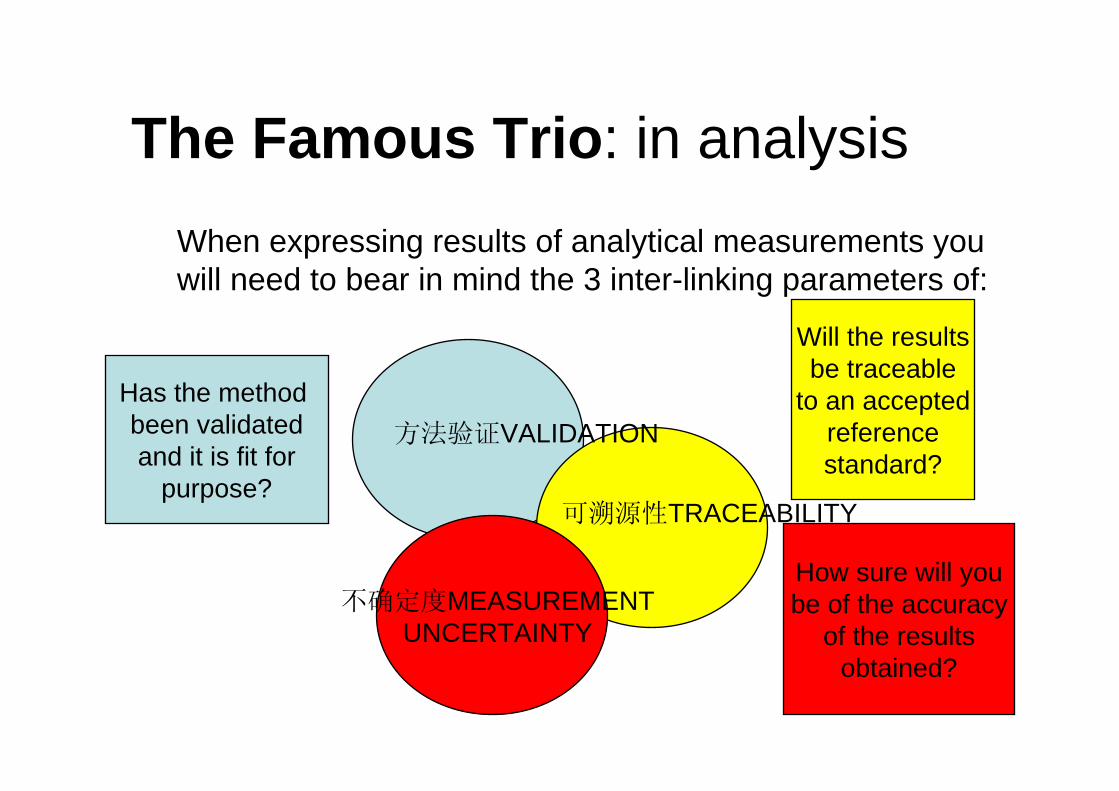
The Famous Trio: in analysisWhen expressing results of analytical measurements youwill need to bear in mind the 3 inter-linking parameters of:
方法验证VALIDATION
可溯源性TRACEABILITY
不确定度MEASUREMENTUNCERTAINTY
Has the method been validatedand it is fit for
purpose?
Will the resultsbe traceable
to an acceptedreferencestandard?
How sure will yoube of the accuracy
of the resultsobtained?

Standards are traceable through a chain of comparisons
SI Units
Primary standards
Industrial reference standards
Industrial working standards
Balances, thermometers, pressure gauges etc found in (for example) undergraduate laboratories
International Primary Standards, set by International Committee of Weights and Measures(CIPM) (Paris)
Maintained by NationalMeasurement Institutes
Used by industry and checked periodically against Primary standards
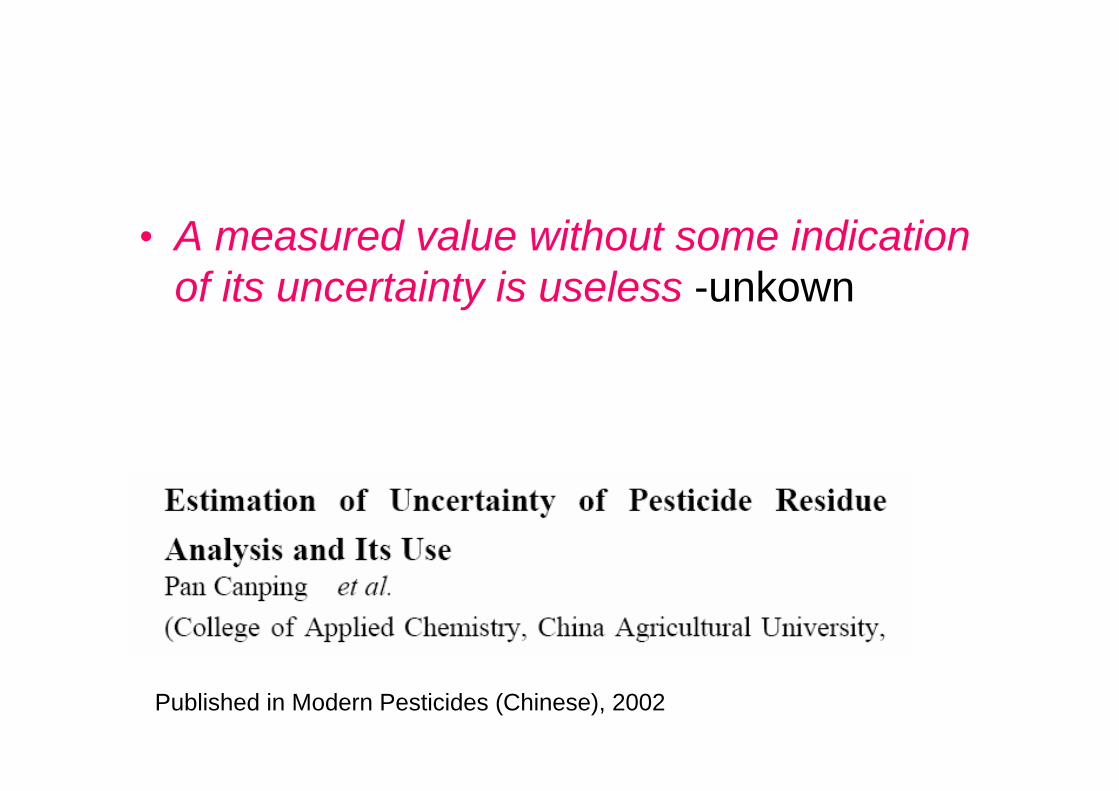
• A measured value without some indication of its uncertainty is useless -unkown
Published in Modern Pesticides (Chinese), 2002
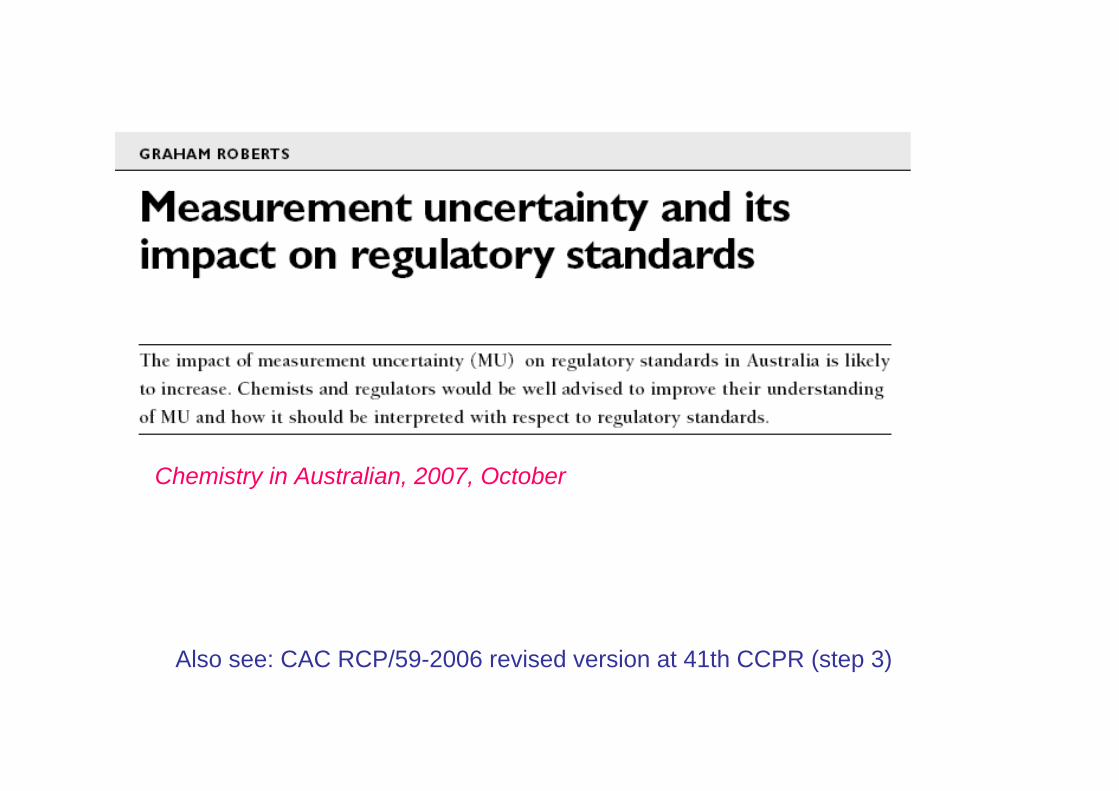
Chemistry in Australian, 2007, October
Also see: CAC RCP/59-2006 revised version at 41th CCPR (step 3)
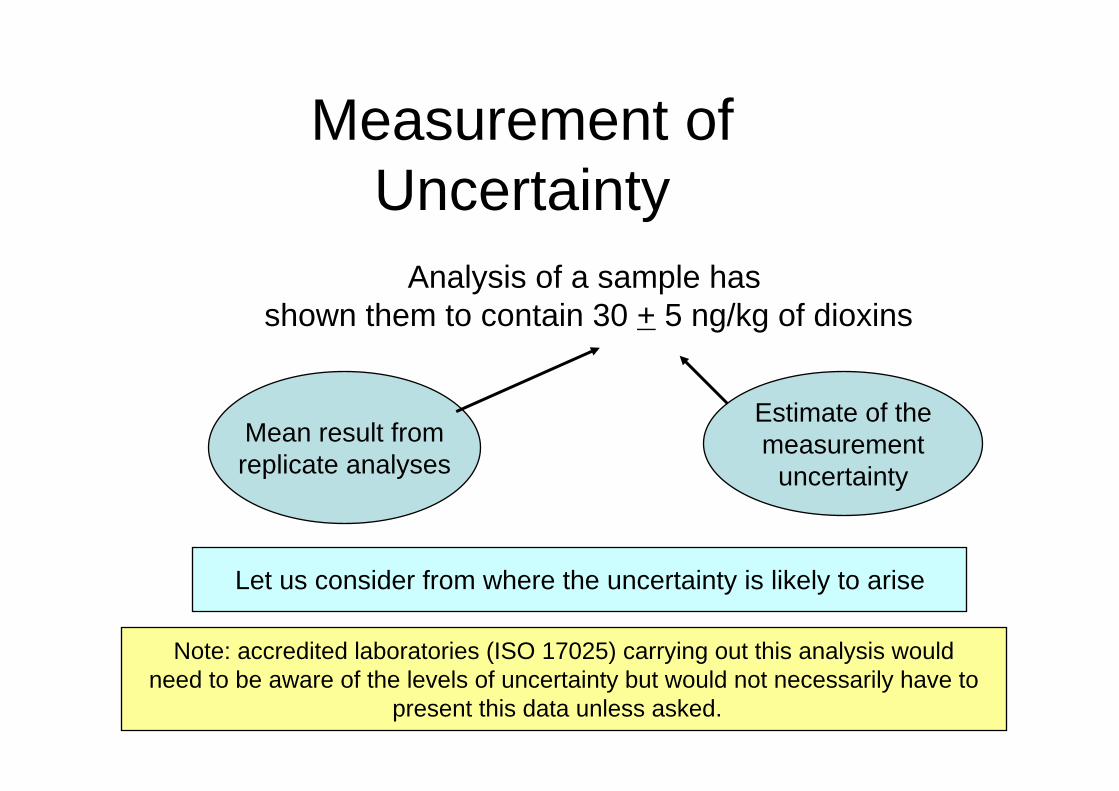
Measurement ofUncertainty
Analysis of a sample hasshown them to contain 30 + 5 ng/kg of dioxins
Mean result fromreplicate analyses
Estimate of themeasurement
uncertainty
Note: accredited laboratories (ISO 17025) carrying out this analysis wouldneed to be aware of the levels of uncertainty but would not necessarily have to
present this data unless asked.
Let us consider from where the uncertainty is likely to arise

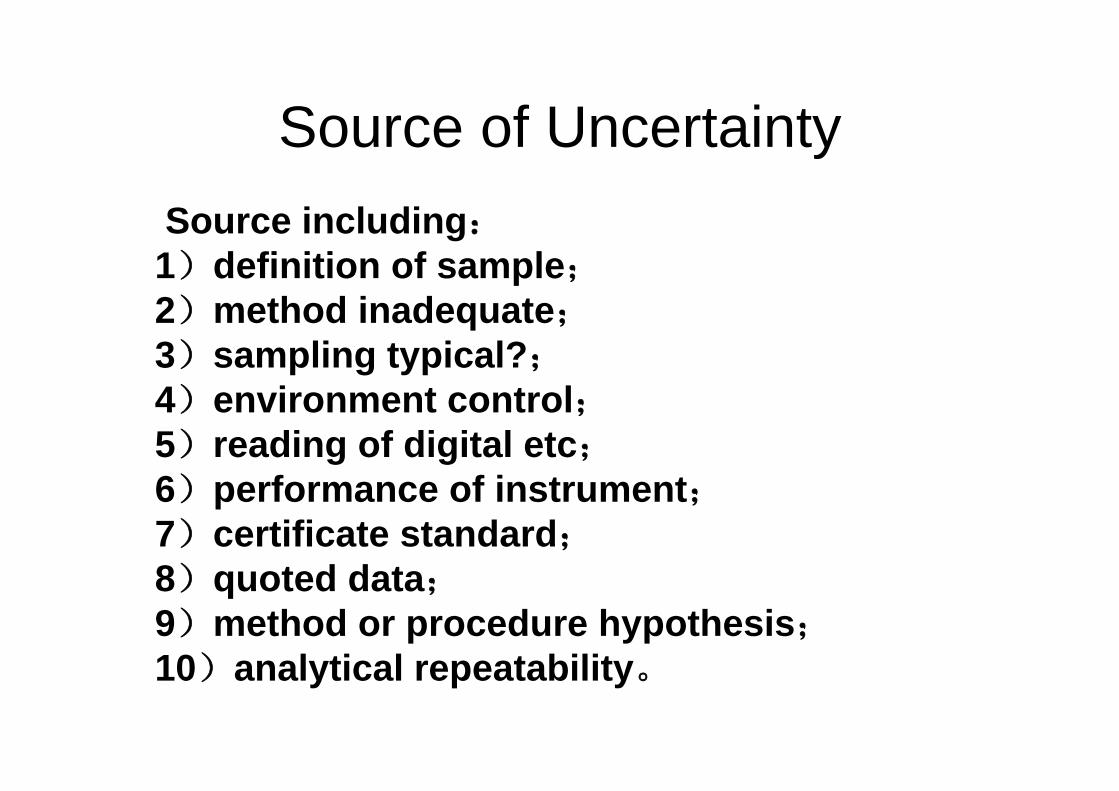
Source of UncertaintySource including:
1)definition of sample;2)method inadequate;3)sampling typical?;4)environment control;5)reading of digital etc;6)performance of instrument;7)certificate standard;8)quoted data;9)method or procedure hypothesis;10)analytical repeatability。
Introduction of uncertainty
• Guide to the Expression of Uncertainty in Measurement was published by the International Organization for Standardization in 1993 in the name of 7international organizations
• Corrected and reprinted in 1995• Usually referred to simply as the “GUM”
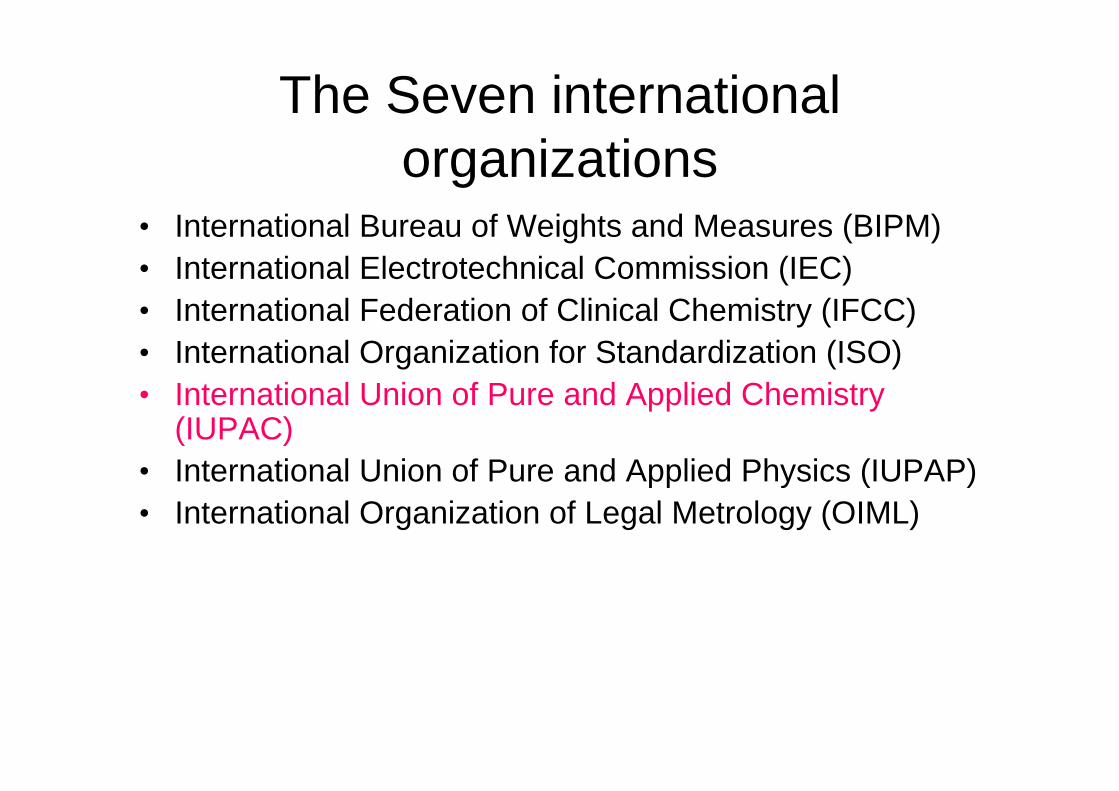
The Seven international organizations
• International Bureau of Weights and Measures (BIPM)• International Electrotechnical Commission (IEC)• International Federation of Clinical Chemistry (IFCC)• International Organization for Standardization (ISO)• International Union of Pure and Applied Chemistry
(IUPAC)• International Union of Pure and Applied Physics (IUPAP)• International Organization of Legal Metrology (OIML)
Uncertainty Concept
• “parameter, associated with the result of a measurement, that characterizes the dispersion of the values that could reasonably be attributed to the measurand” – GUM
• Examples:– A standard deviation (1 sigma) or a multiple of
it (e.g., 2 or 3 sigma)– The half-width of an interval having a stated
level of confidence
Error vs. Uncertainty
• In metrology, error is primarily a theoretical concept, because its value is unknowable
• Uncertainty is a more practical concept• Evaluating uncertainty allows you to place
a bound on the likely size of the error• It is a critical aspect of metrology
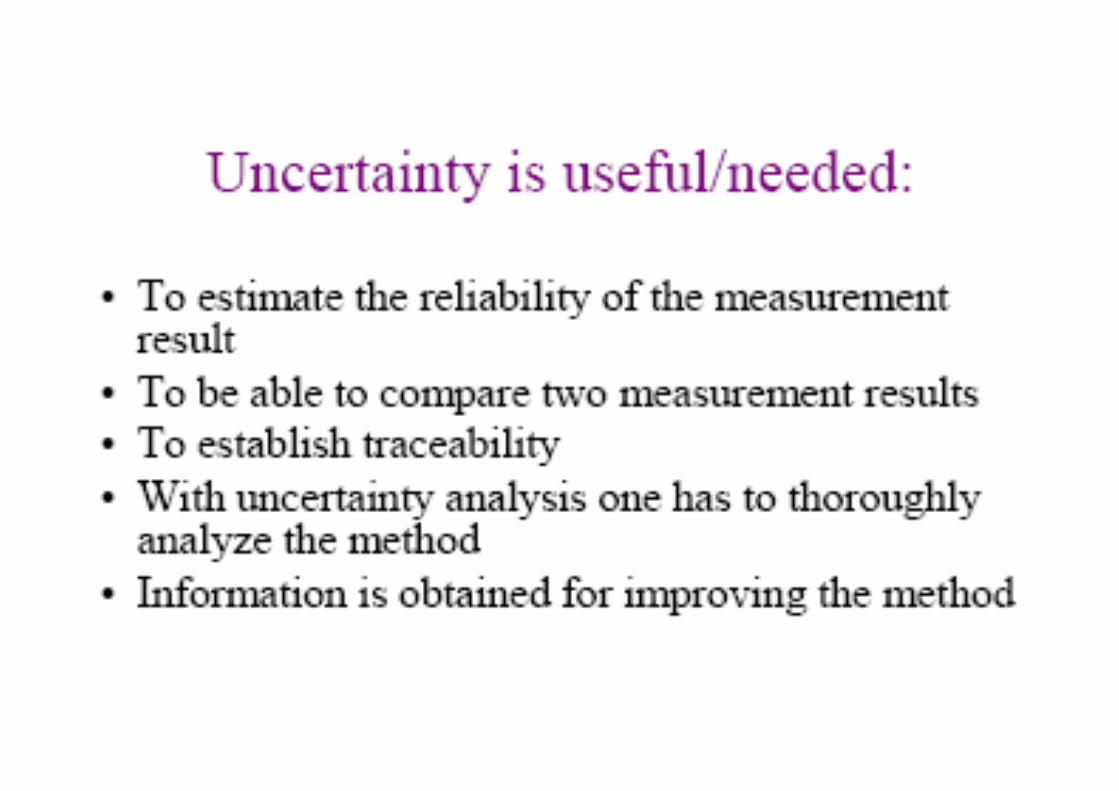
Purpose of estimation of Uncertainty
1) ±U;
2) Corresponding confidence level
*
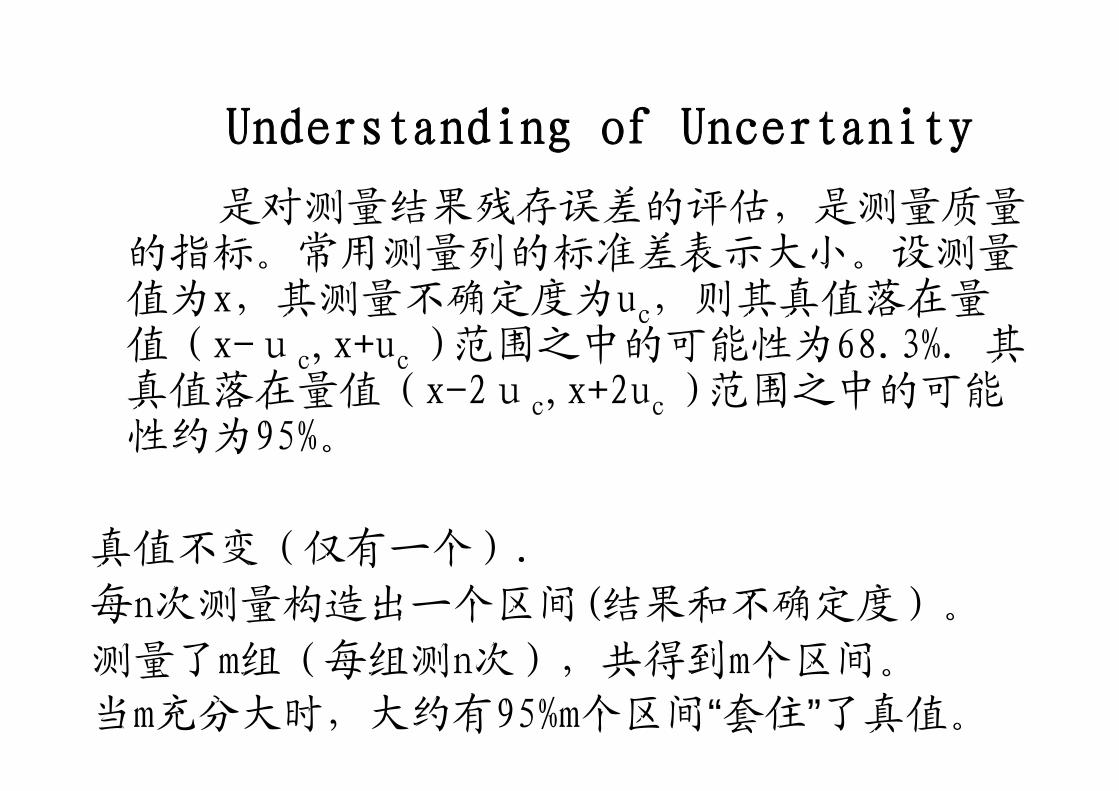
Understanding of Uncertanity
是对测量结果残存误差的评估,是测量质量的指标。常用测量列的标准差表示大小。设测量值为x,其测量不确定度为uc,则其真值落在量值(x-uc,x+uc )范围之中的可能性为68.3%.其真值落在量值(x-2uc,x+2uc )范围之中的可能性约为95%。
真值不变(仅有一个).
每n次测量构造出一个区间(结果和不确定度)。
测量了m组(每组测n次),共得到m个区间。
当m充分大时,大约有95%m个区间“套住”了真值。
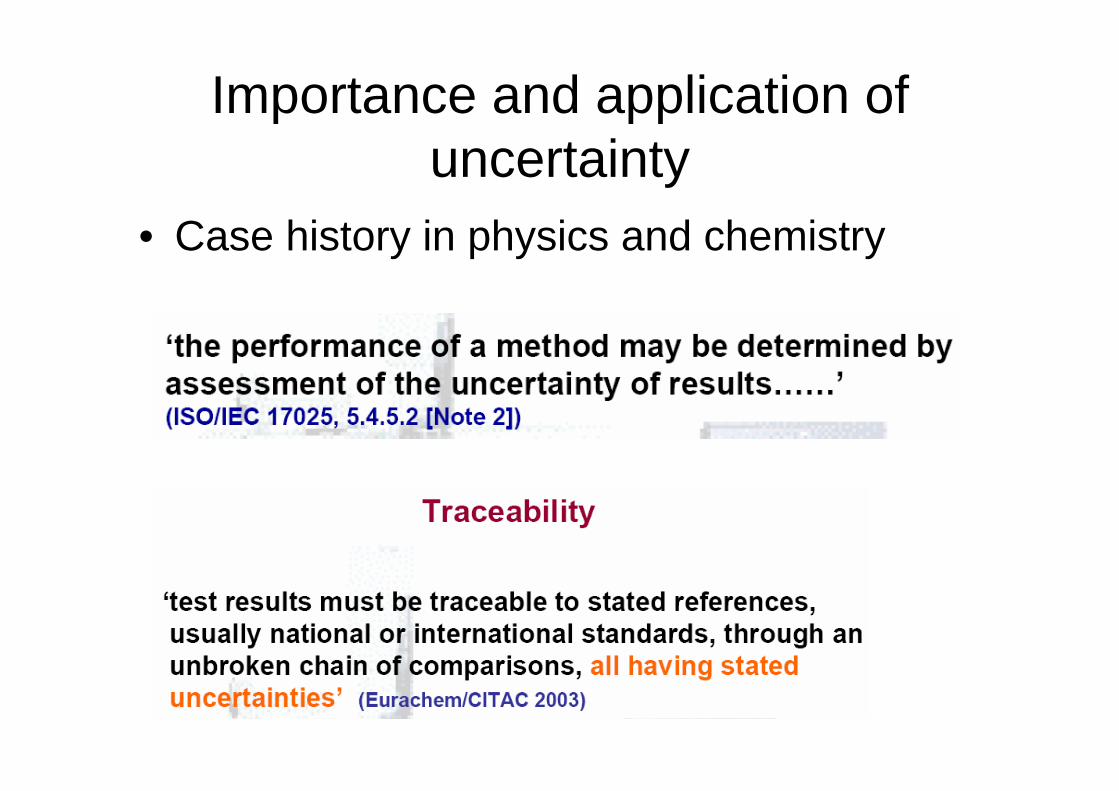
Importance and application of uncertainty
• Case history in physics and chemistry
Example 1 0.46% in density of air→ J.
W. Rayleigh for inert gases→Nobel Prize
• Scientific invention or findings:
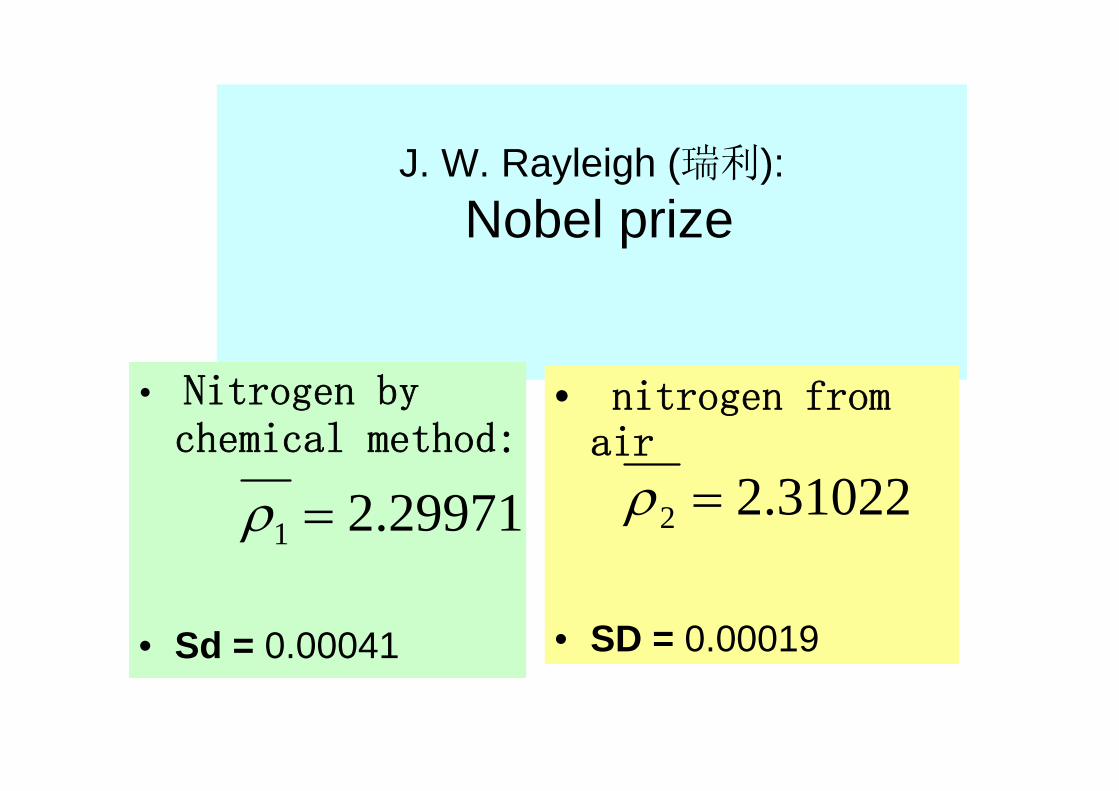
J. W. Rayleigh (瑞利): Nobel prize
• Nitrogen by chemical method:
• Sd = 0.00041
• nitrogen from air
• SD = 0.00019
29971.21 =ρ 31022.22 =ρ
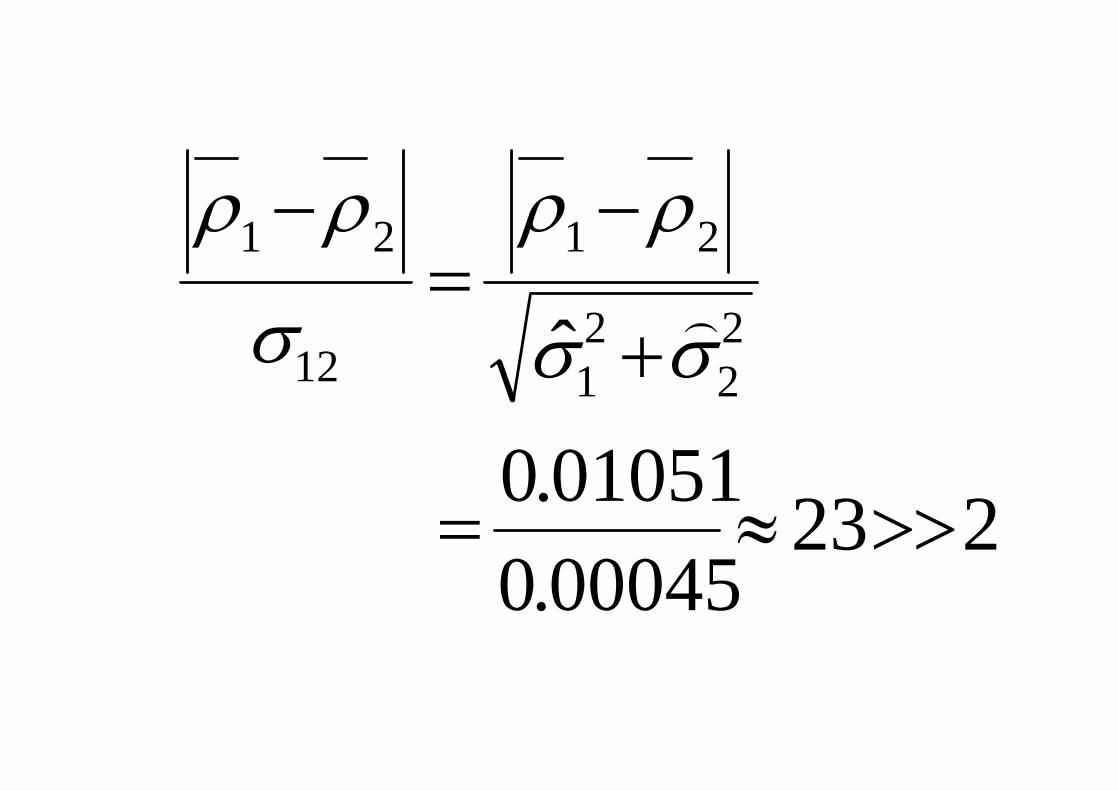
22300045.001051.0
ˆ 22
21
21
12
21
>>≈=
+
−=
−
σσ
ρρ
σ
ρρ)
Example 2: testing the electron capacity 1917-1930
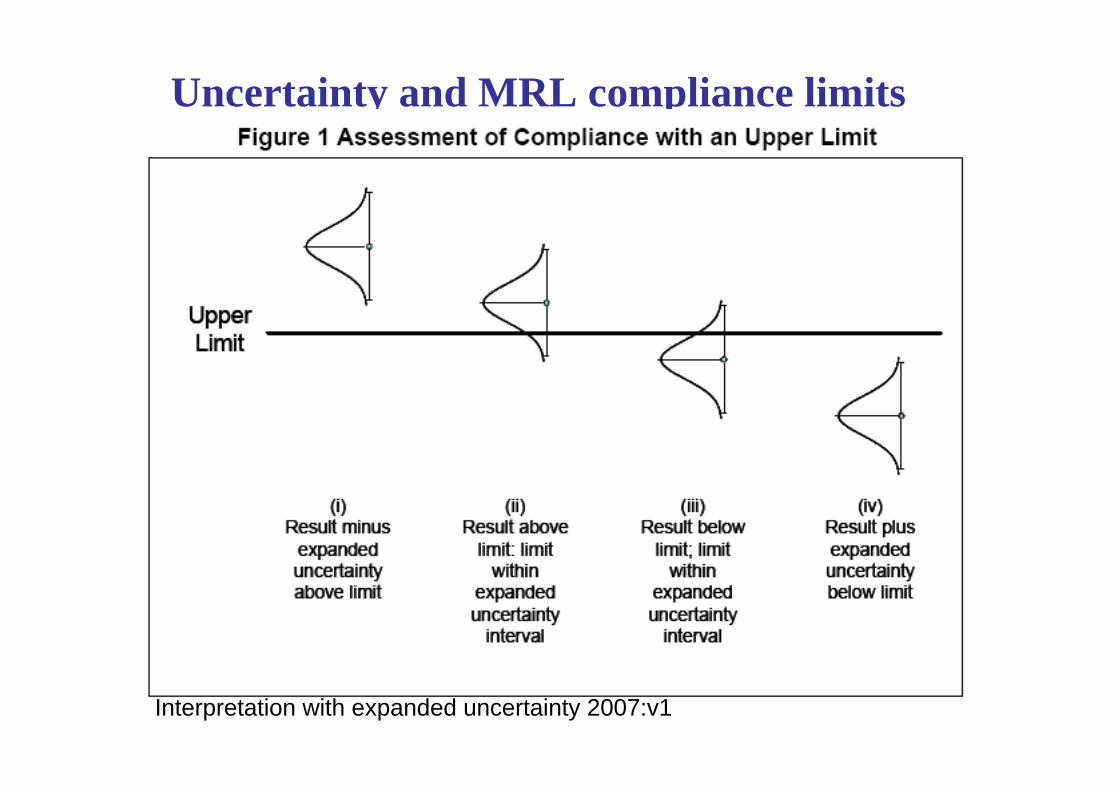
Uncertainty and MRL compliance limits
Interpretation with expanded uncertainty 2007:v1
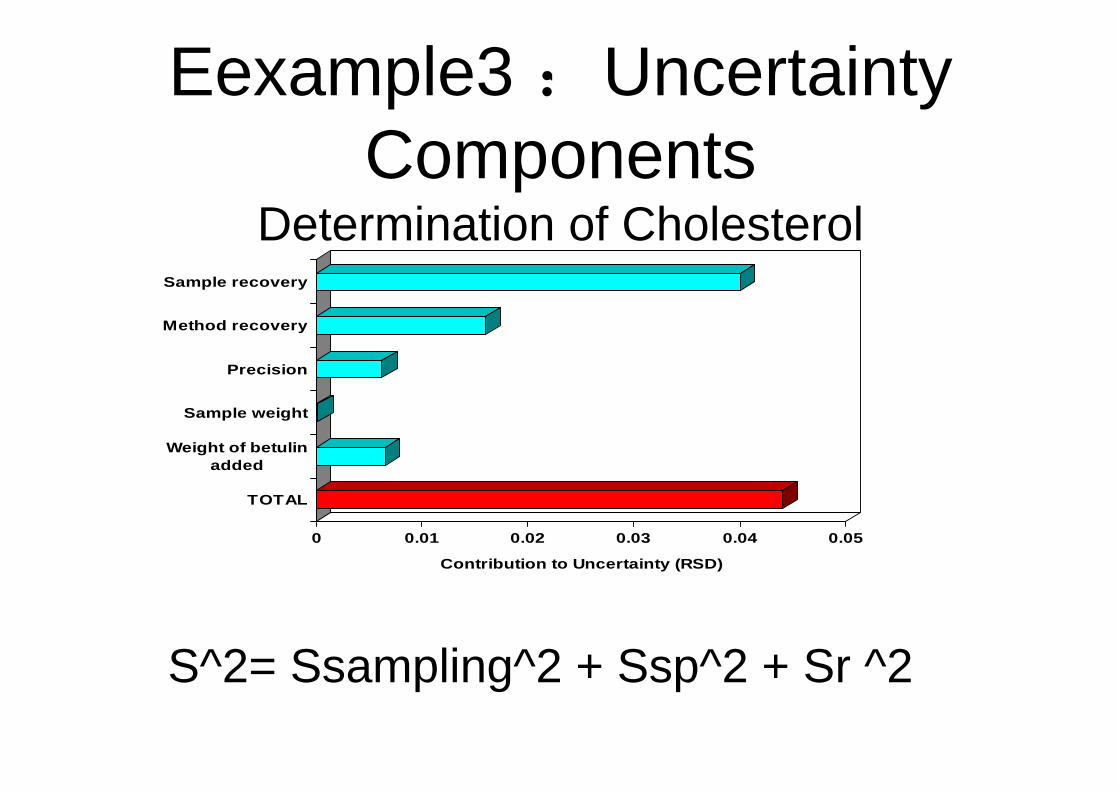
Eexample3 :Uncertainty Components
Determination of Cholesterol
0 0.01 0.02 0.03 0.04 0.05
Contribution to Uncertainty (RSD)
TOTAL
Weight of betulinadded
Sample weight
Precision
Method recovery
Sample recovery
S^2= Ssampling^2 + Ssp^2 + Sr ^2

2. Application and Status of uncertainty
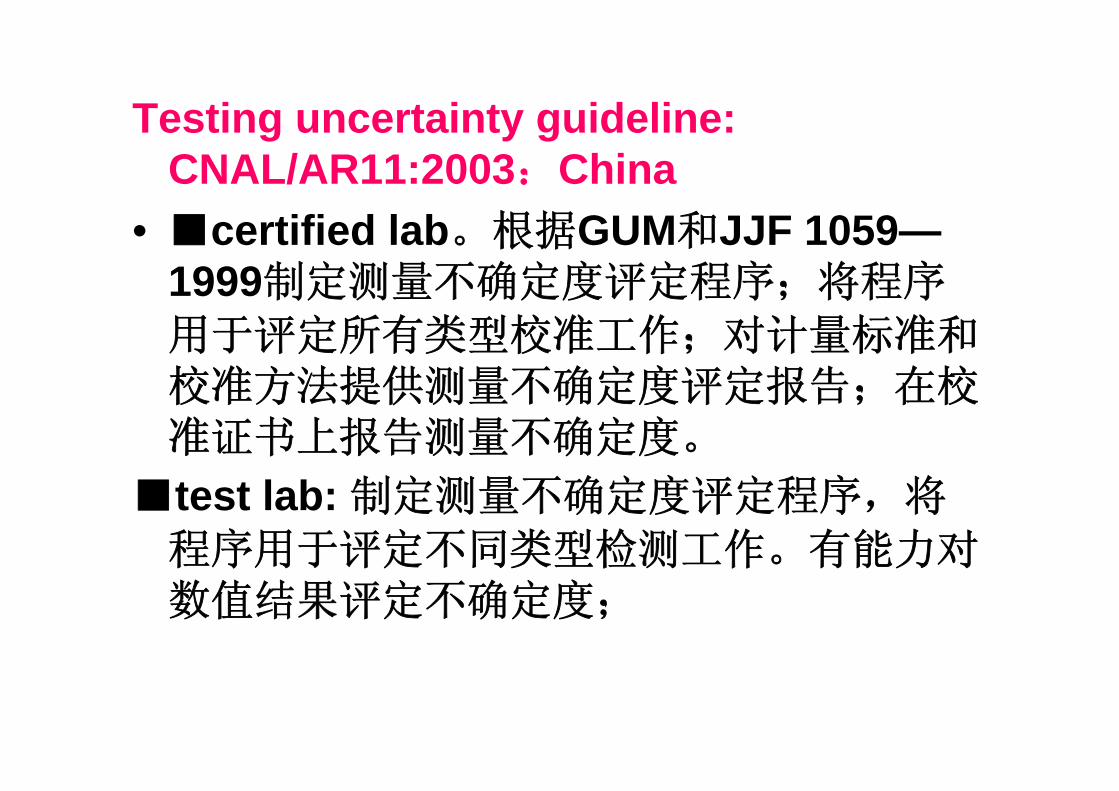
Testing uncertainty guideline: CNAL/AR11:2003:China
• ■certified lab。根据GUM和JJF 1059—1999制定测量不确定度评定程序;将程序
用于评定所有类型校准工作;对计量标准和校准方法提供测量不确定度评定报告;在校准证书上报告测量不确定度。
■test lab: 制定测量不确定度评定程序,将
程序用于评定不同类型检测工作。有能力对数值结果评定不确定度;

www.bipm.org
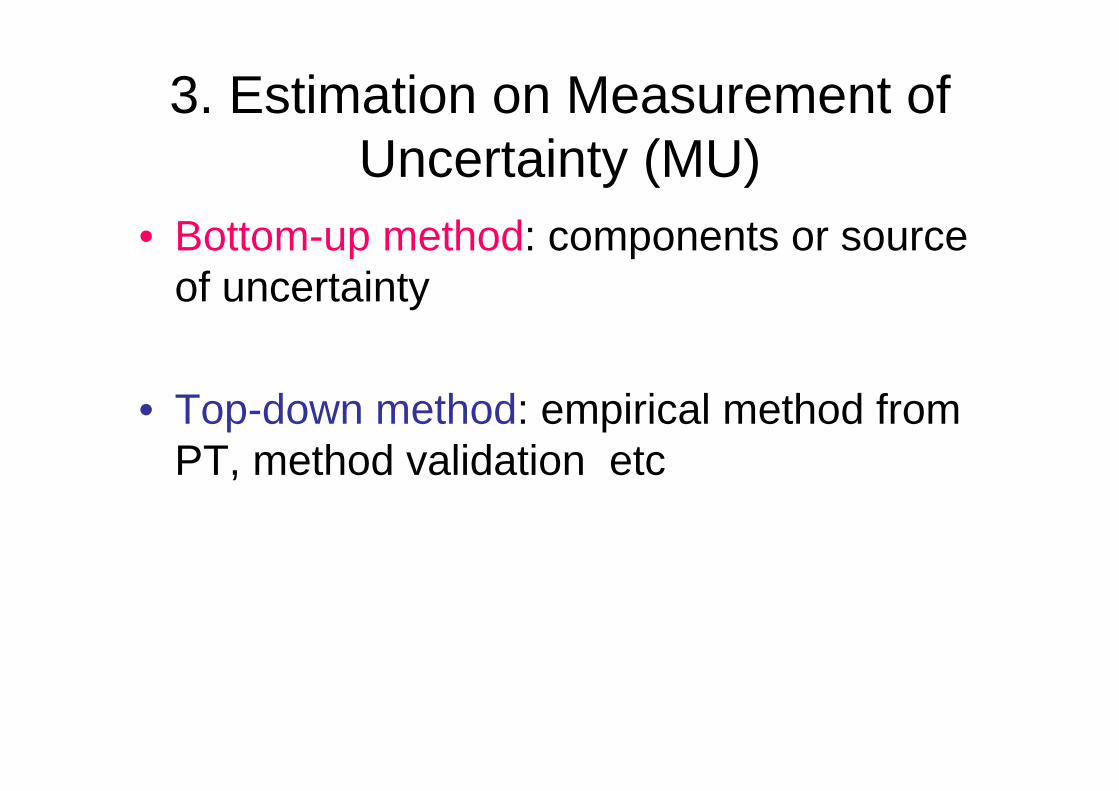
3. Estimation on Measurement of Uncertainty (MU)
• Bottom-up method: components or source of uncertainty
• Top-down method: empirical method from PT, method validation etc
• EURACHEM-CITAC guide is the only MU guide explicitly using validation data!
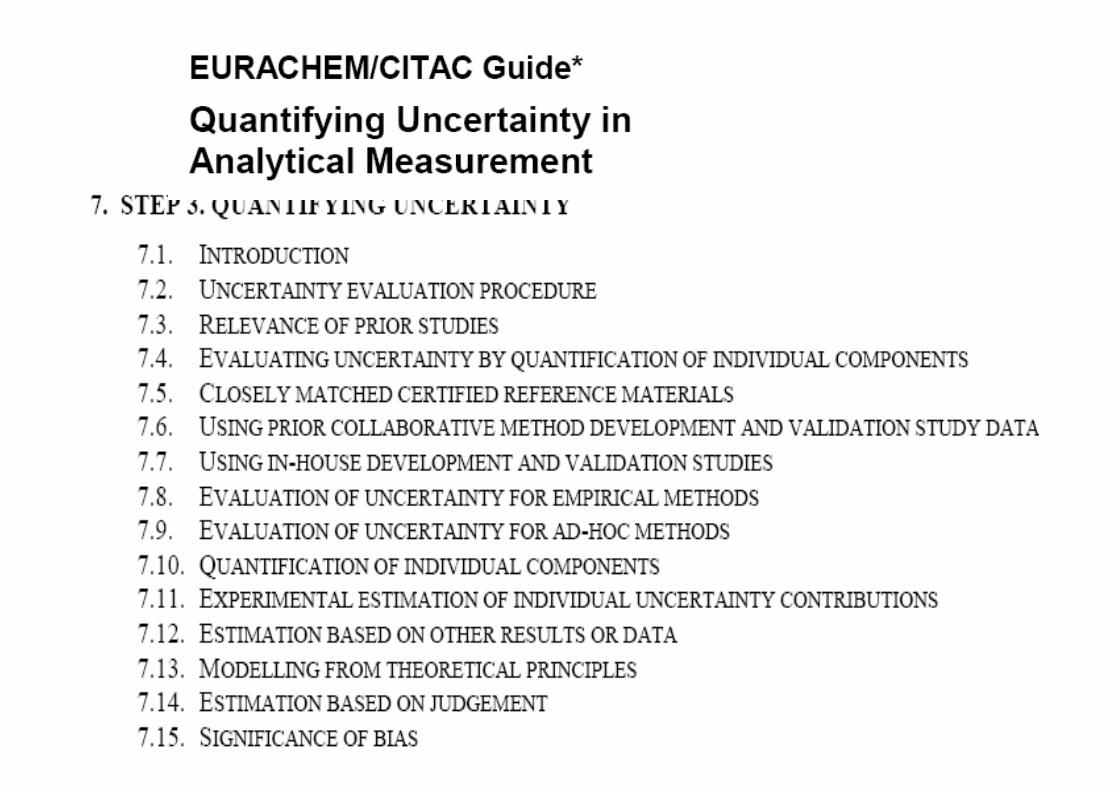
EURACHEM / CITAC Guide
Quantifying Uncertainty inAnalytical Measurement
Second Edition
http://www.eurachem.bam.de/
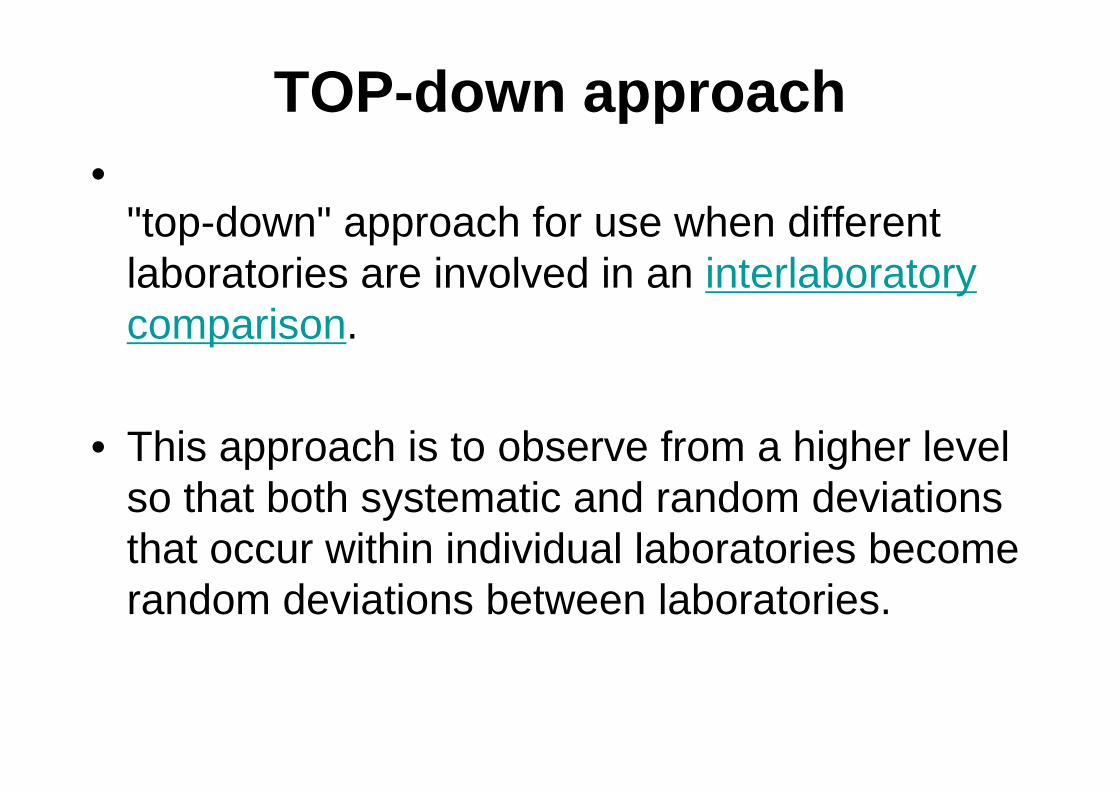
TOP-down approach•
"top-down" approach for use when different laboratories are involved in an interlaboratorycomparison.
• This approach is to observe from a higher level so that both systematic and random deviations that occur within individual laboratories become random deviations between laboratories.
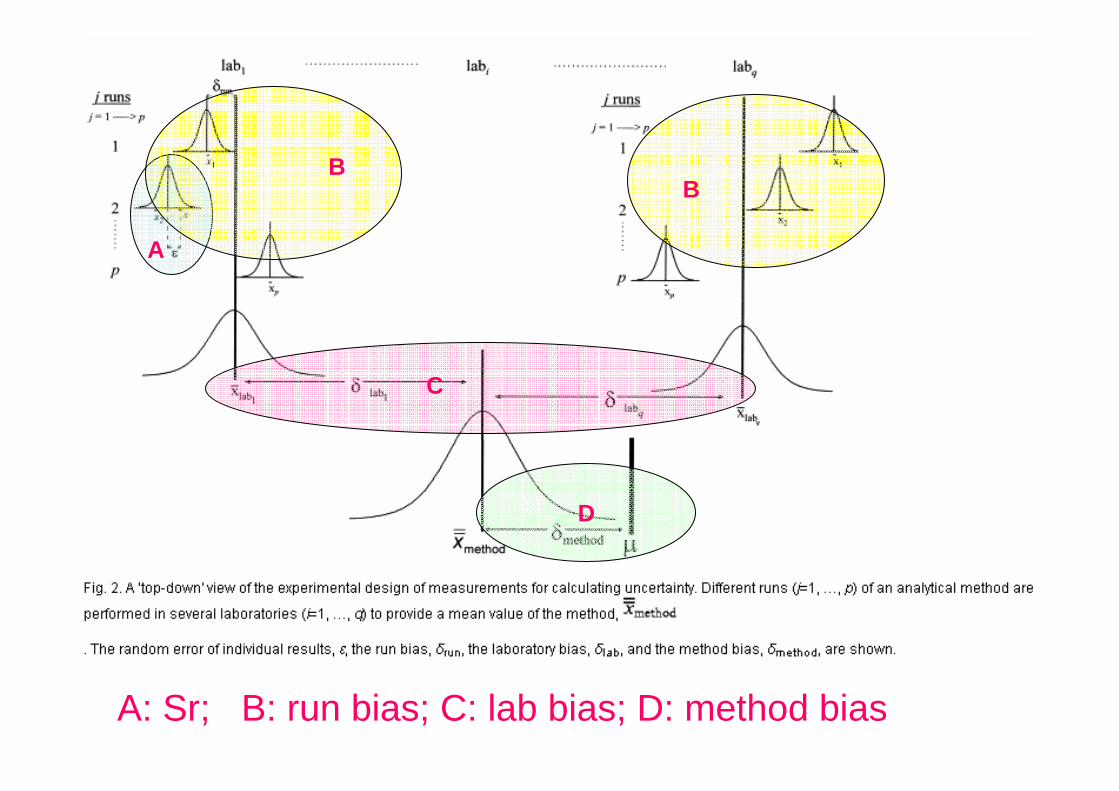
D
A
B
C
B
A: Sr; B: run bias; C: lab bias; D: method bias
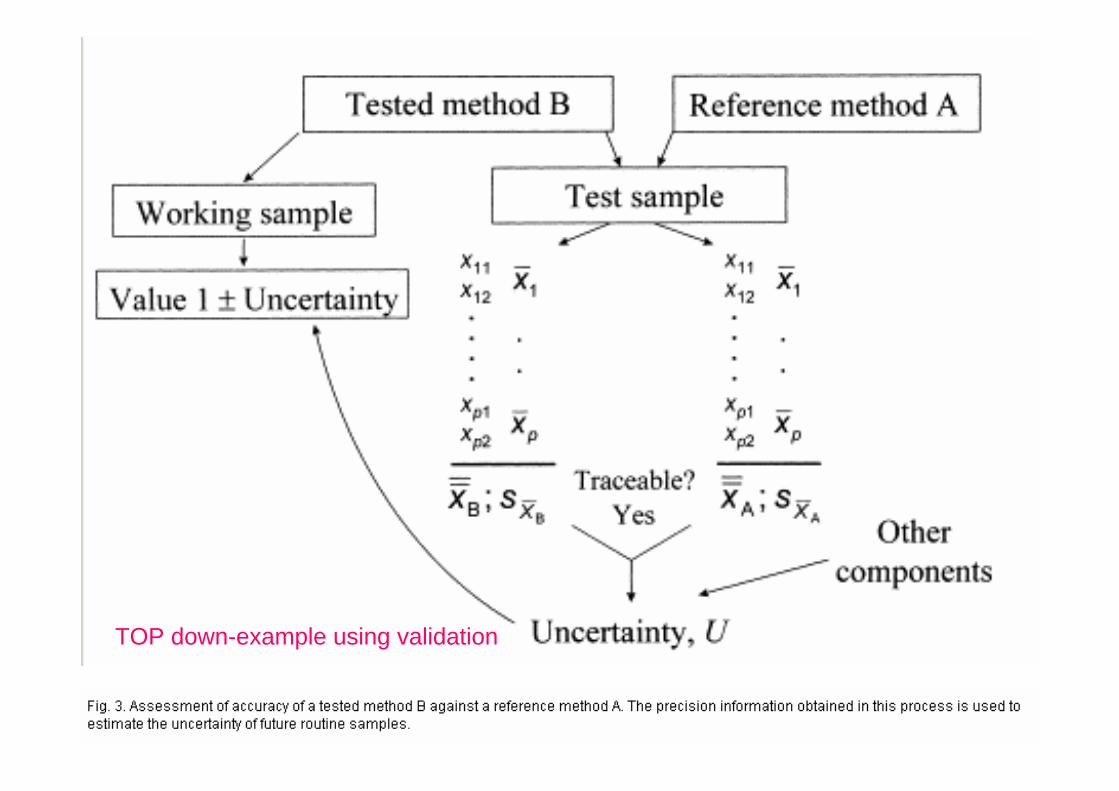
TOP down-example using validation
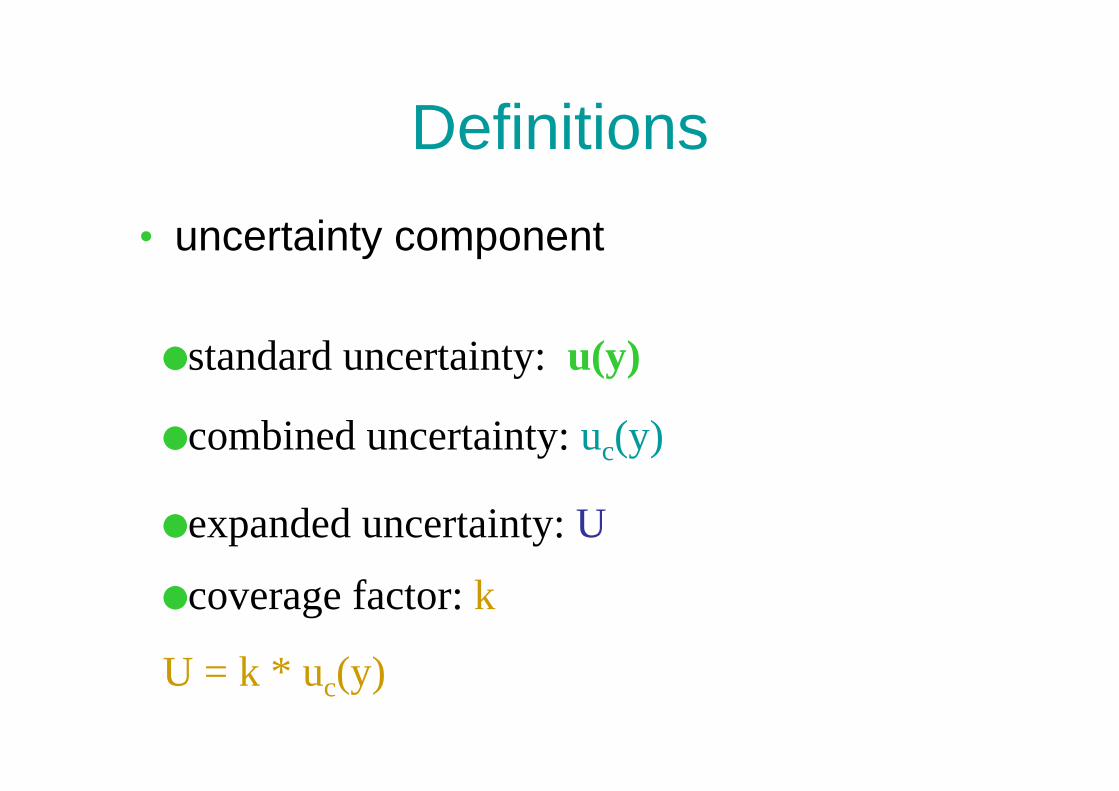
Definitions• uncertainty component
standard uncertainty: u(y)
combined uncertainty: uc(y)
expanded uncertainty: U
coverage factor: k
U = k * uc(y)
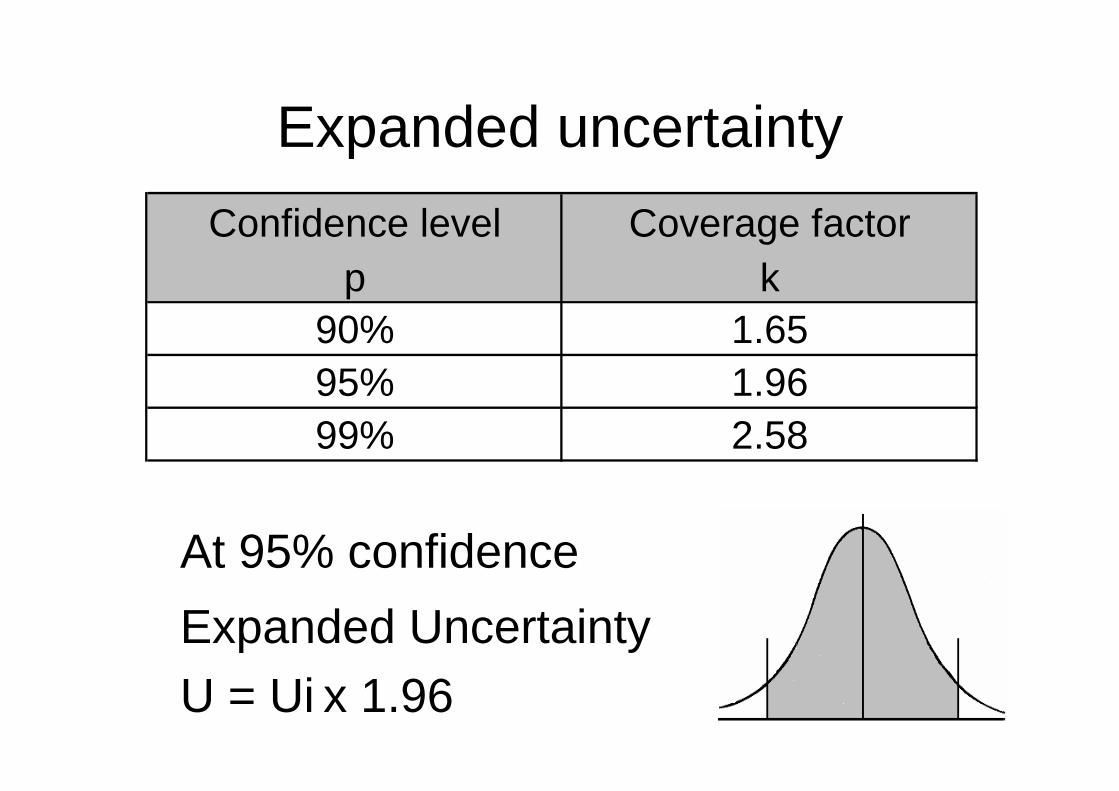
Expanded uncertaintyConfidence level Coverage factor
p k90% 1.6595% 1.9699% 2.58
At 95% confidenceExpanded Uncertainty U = Ui x 1.96

Steps in Estimation of uncertainty
1.Specify measurant2. Identifying source3.Components- standard deviation4.Combined standard uncertainty
Expanded Uncertainty
GUM recommended bottom-up method
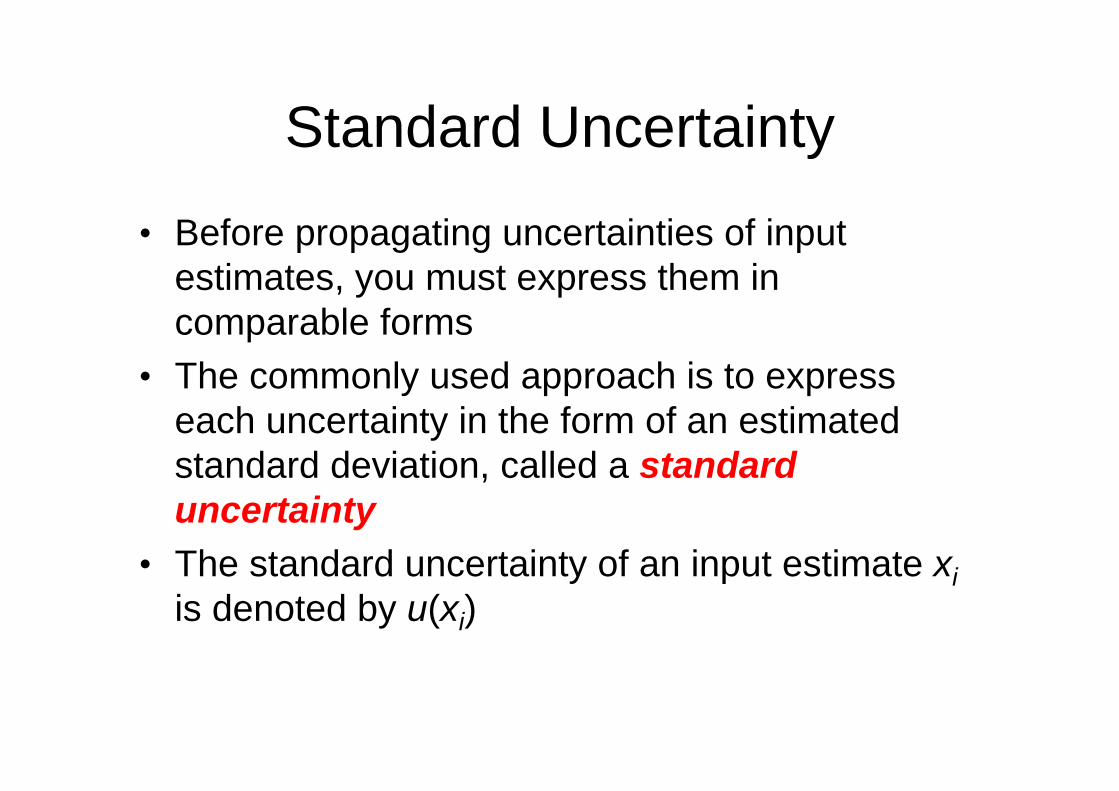
Standard Uncertainty
• Before propagating uncertainties of input estimates, you must express them in comparable forms
• The commonly used approach is to express each uncertainty in the form of an estimated standard deviation, called a standard uncertainty
• The standard uncertainty of an input estimate xiis denoted by u(xi)
Combined Standard Uncertainty
• The standard uncertainty of an output estimate obtained by uncertainty propagation is called the combined standard uncertainty
• The combined standard uncertainty of the output estimate y is denoted by uc(y)
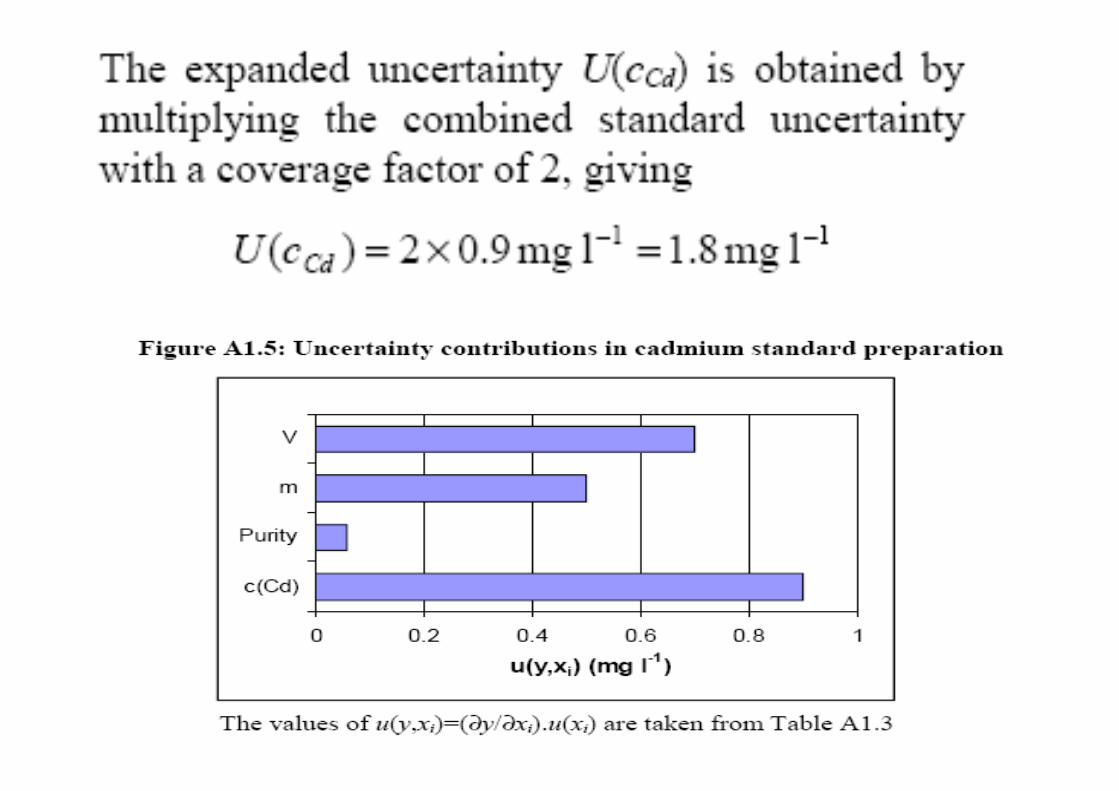
Expanded Uncertainty• It is common to multiply the combined standard
uncertainty, uc(y), by a factor, k, chosen so that the interval y ± kuc(y) has a specified high probability of containing the true value of the measurand
• GUM calls product U = k×uc(y) an expanded uncertainty
• Factor k is called a coverage factor (often k=2 or 3)
• The probability that y ± U contains the true value is called the coverage probability, p
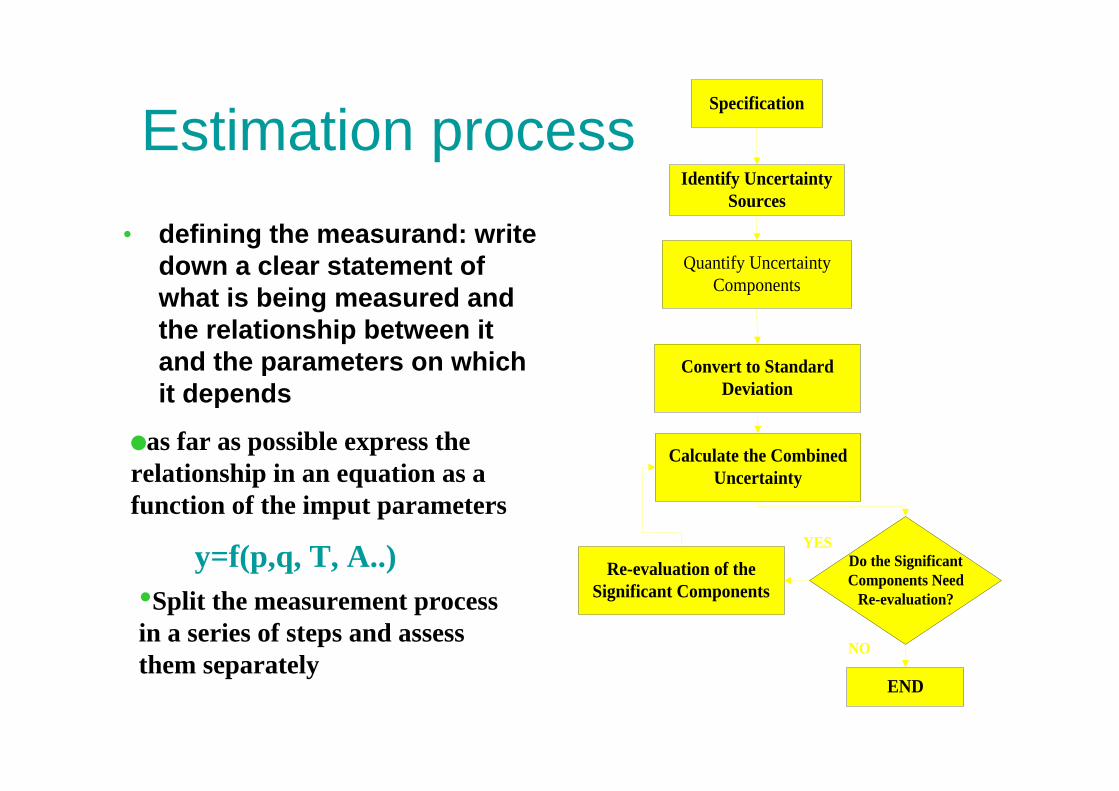
Estimation process
NO
Specification
Identify UncertaintySources
Quantify UncertaintyComponents
Convert to StandardDeviation
Calculate the CombinedUncertainty
Re-evaluation of theSignificant Components
Do the SignificantComponents Need
Re-evaluation?
END
YES
• defining the measurand: write down a clear statement of what is being measured and the relationship between it and the parameters on which it depends
as far as possible express the relationship in an equation as a function of the imput parameters
y=f(p,q, T, A..)•Split the measurement process in a series of steps and assess them separately
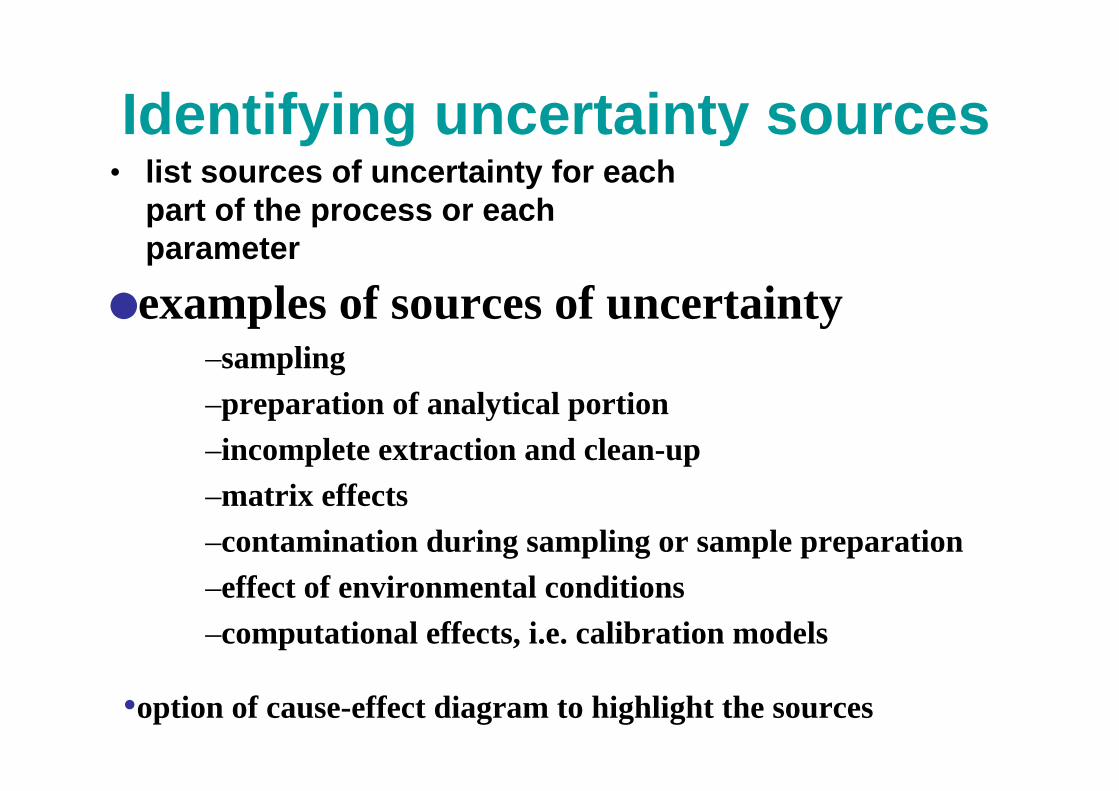
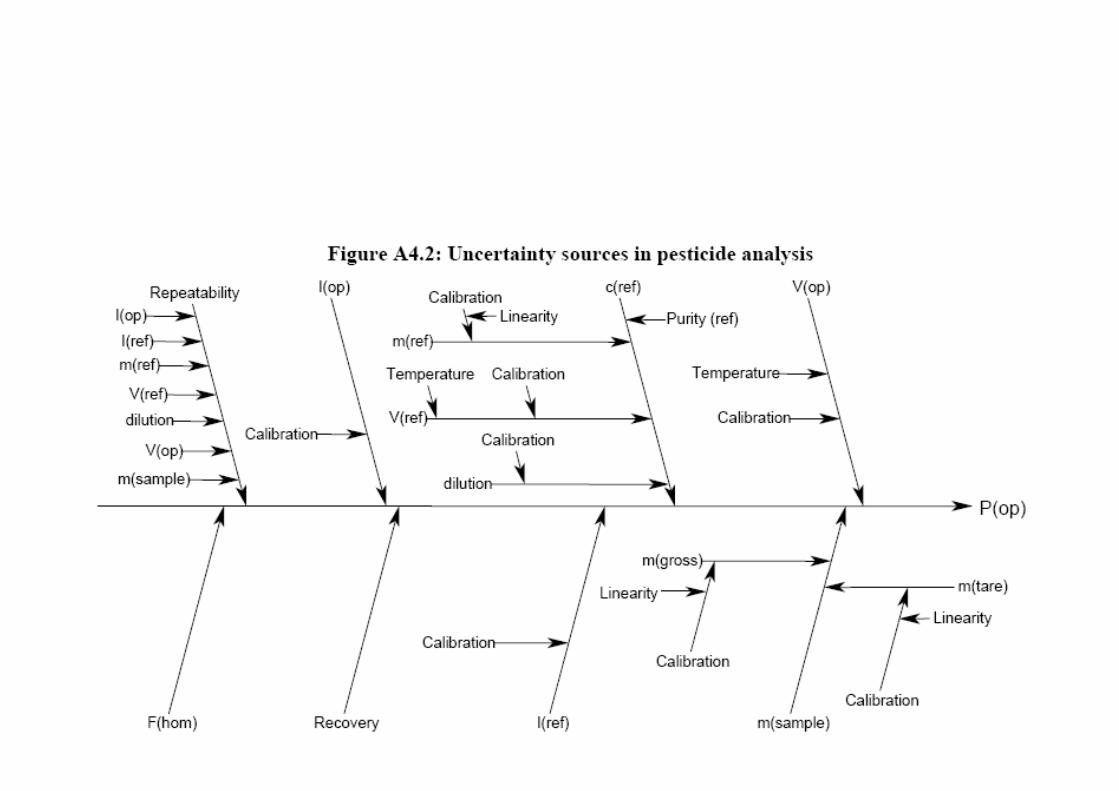
Identifying uncertainty sources• list sources of uncertainty for each
part of the process or each parameter
examples of sources of uncertainty–sampling–preparation of analytical portion–incomplete extraction and clean-up–matrix effects–contamination during sampling or sample preparation–effect of environmental conditions–computational effects, i.e. calibration models
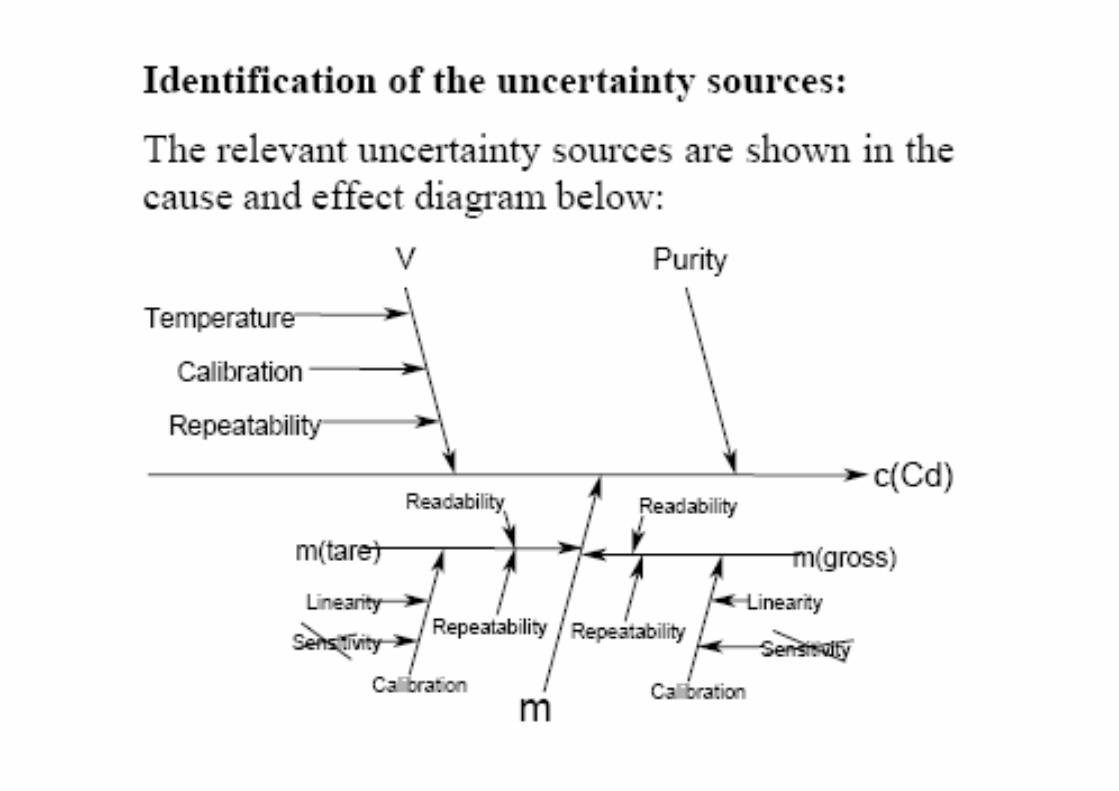
•option of cause-effect diagram to highlight the sources

Identifying uncertainty sources: example Cd solution
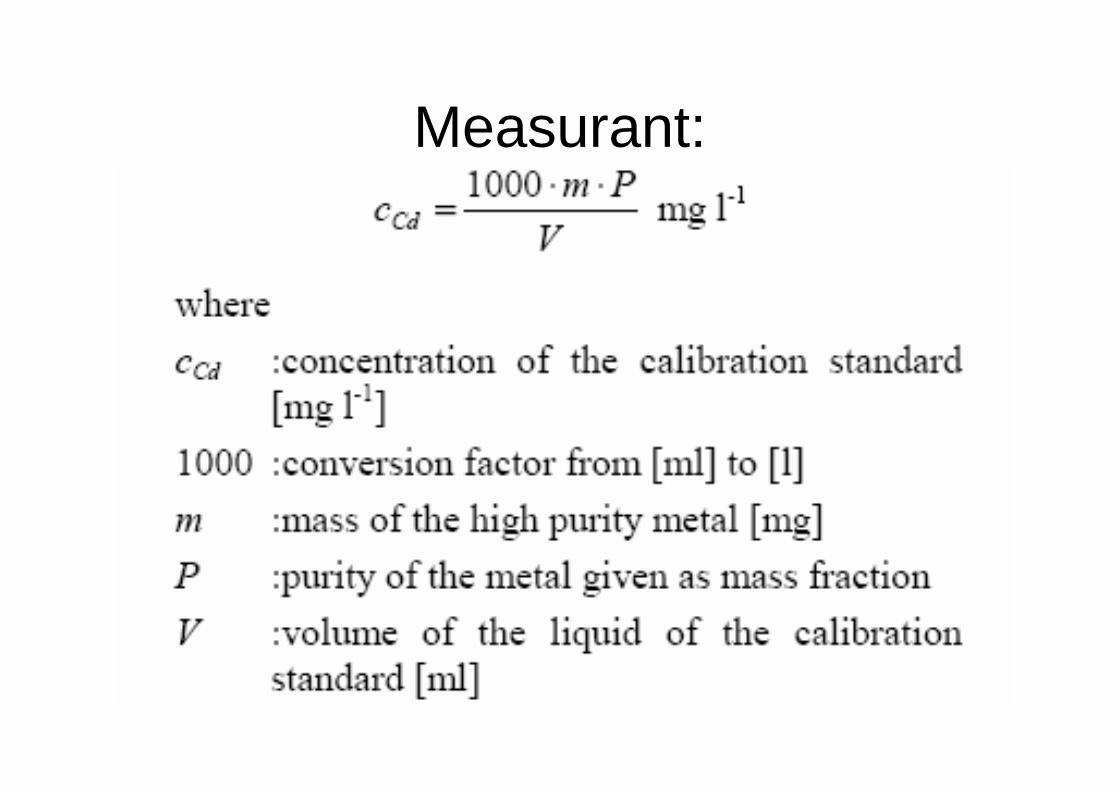
Measurant:
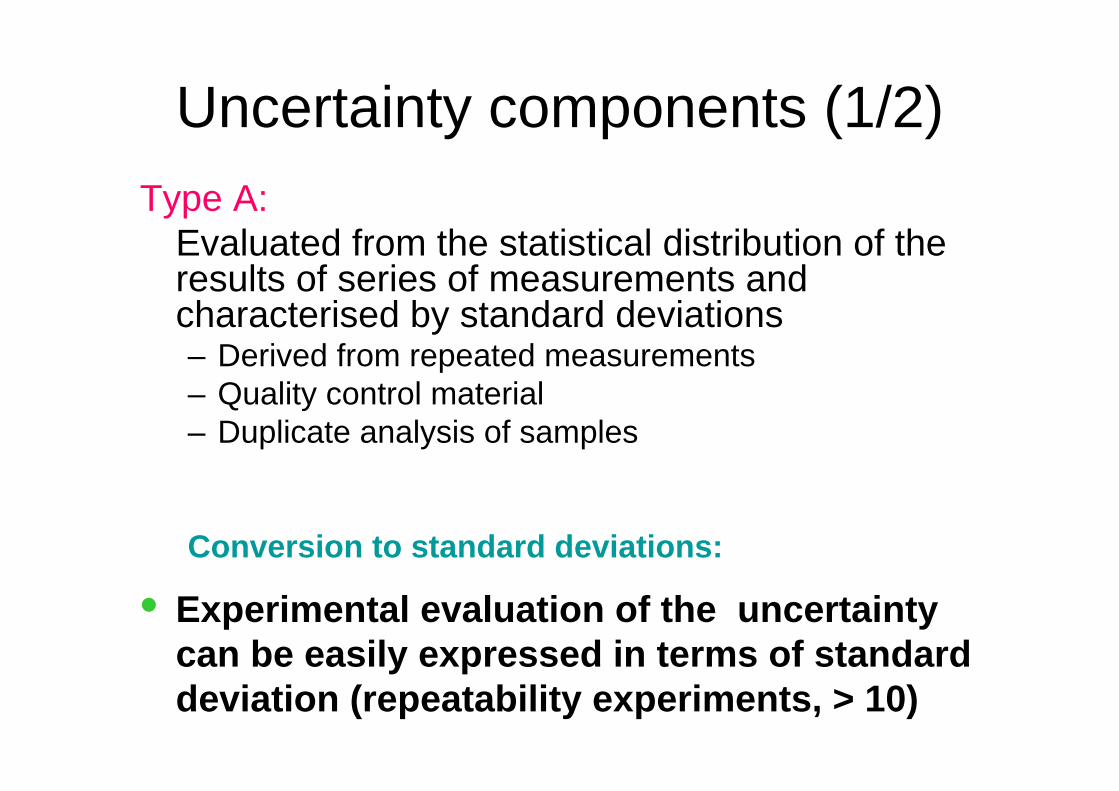
Uncertainty components (1/2)Type A:
Evaluated from the statistical distribution of the results of series of measurements and characterised by standard deviations– Derived from repeated measurements– Quality control material– Duplicate analysis of samples
Conversion to standard deviations:
• Experimental evaluation of the uncertainty can be easily expressed in terms of standard deviation (repeatability experiments, > 10)
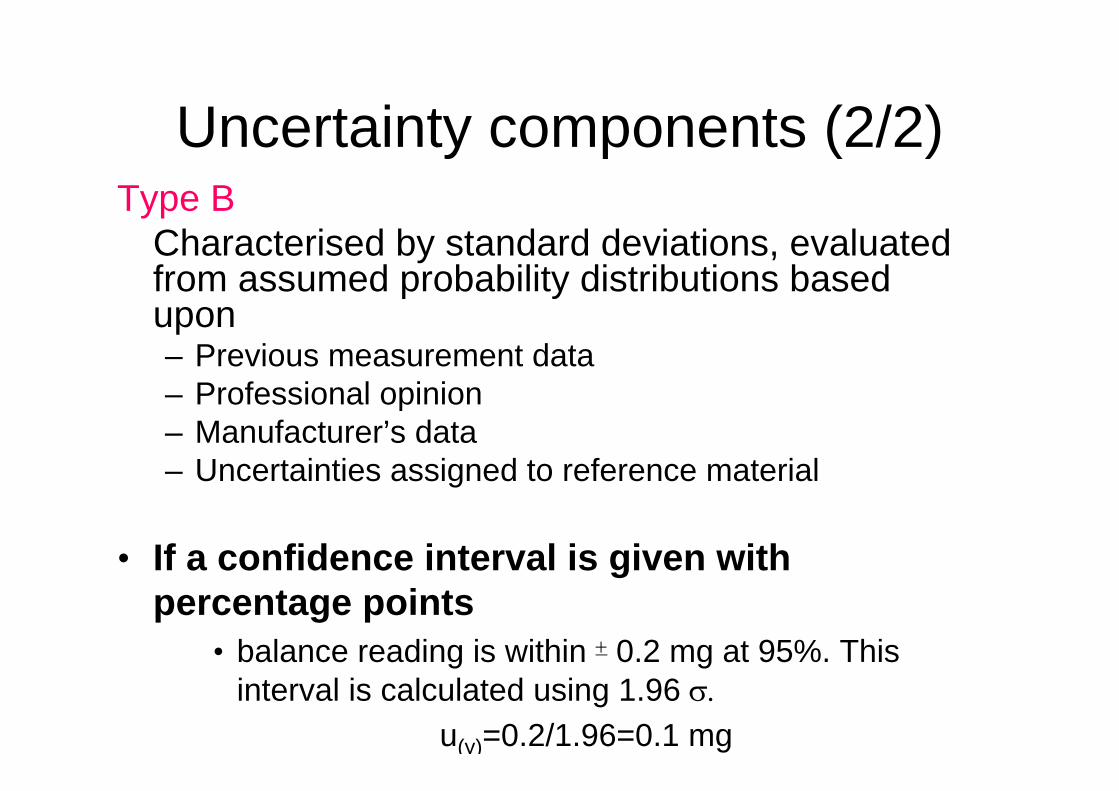
Uncertainty components (2/2)Type B
Characterised by standard deviations, evaluated from assumed probability distributions based upon – Previous measurement data– Professional opinion– Manufacturer’s data– Uncertainties assigned to reference material
• If a confidence interval is given with percentage points
• balance reading is within + 0.2 mg at 95%. This interval is calculated using 1.96 σ.
u(y)=0.2/1.96=0.1 mg
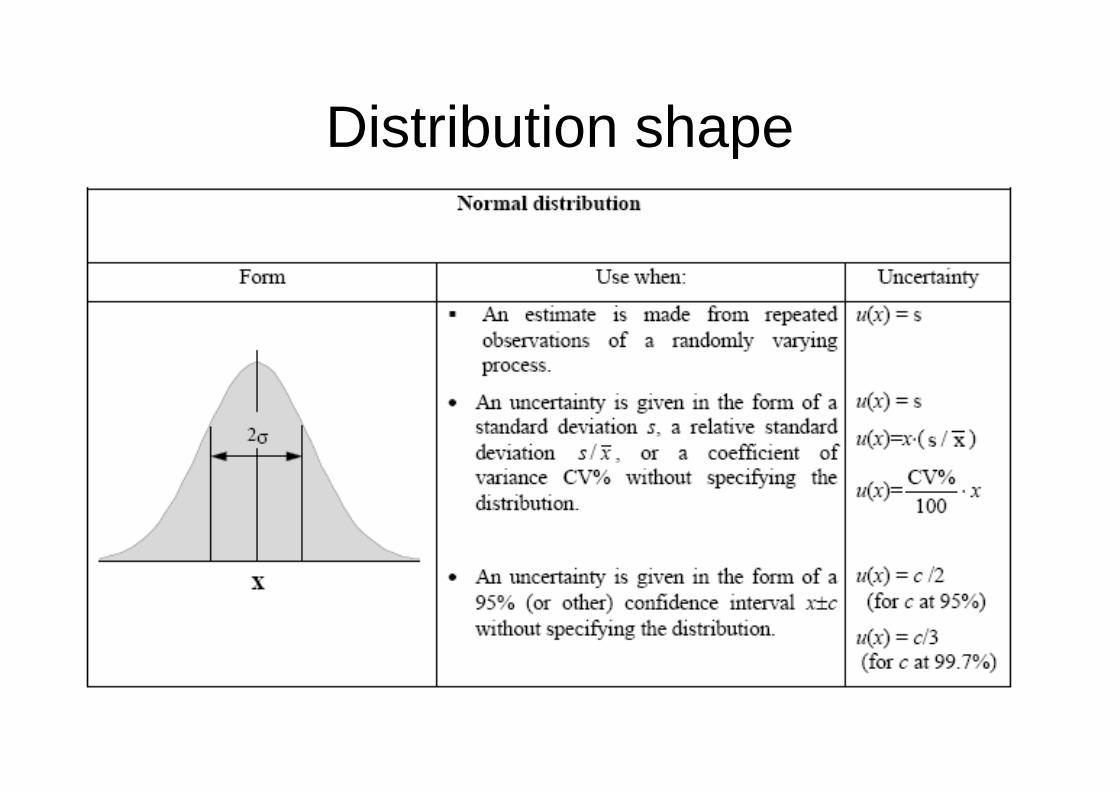
Distribution shape
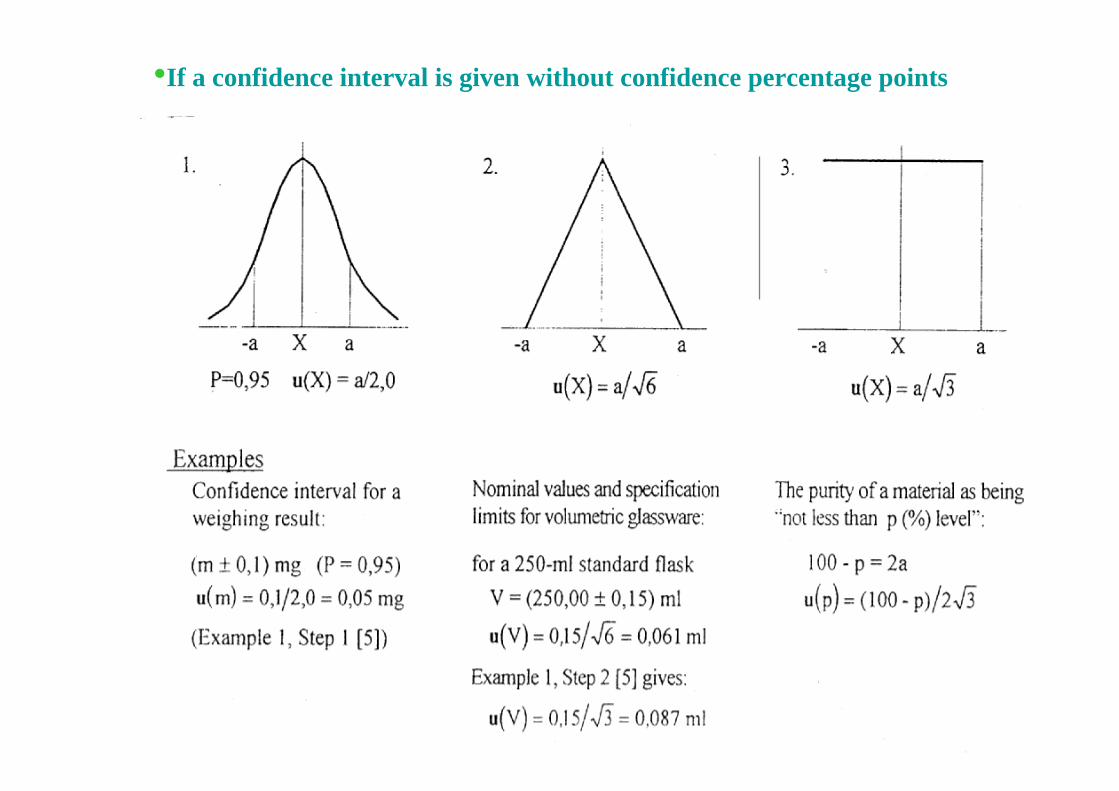
•If a confidence interval is given without confidence percentage points
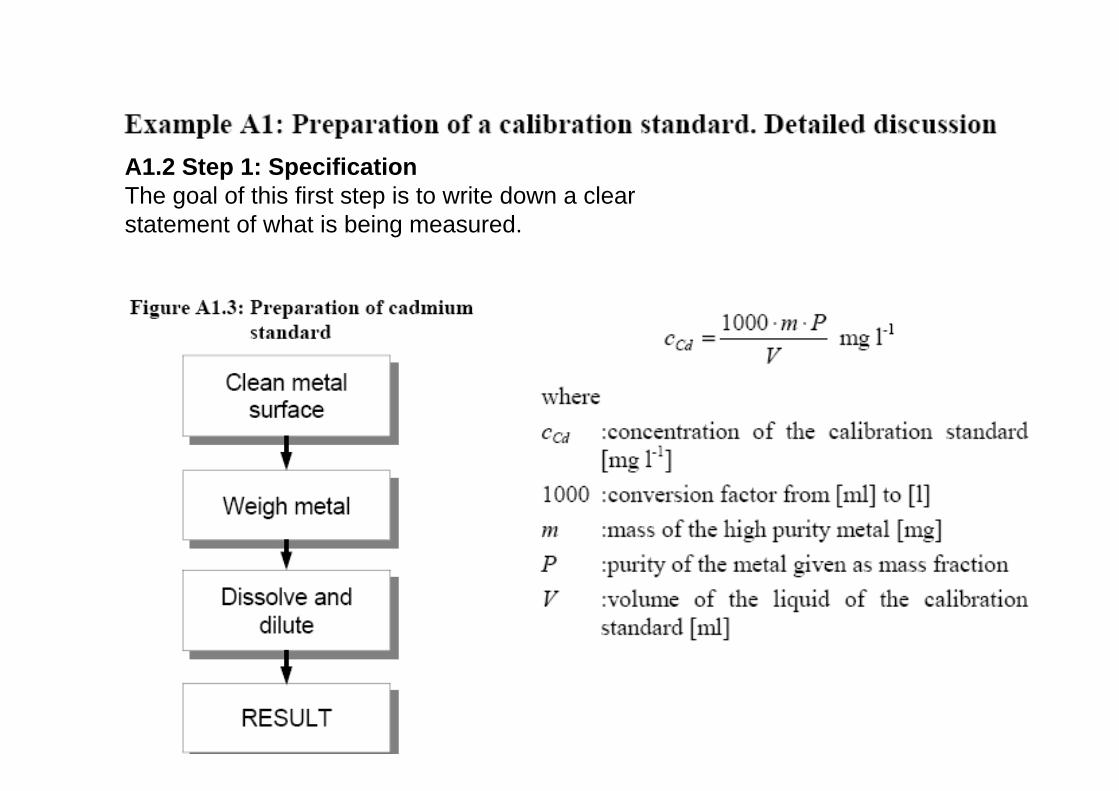
A1.2 Step 1: SpecificationThe goal of this first step is to write down a clearstatement of what is being measured.
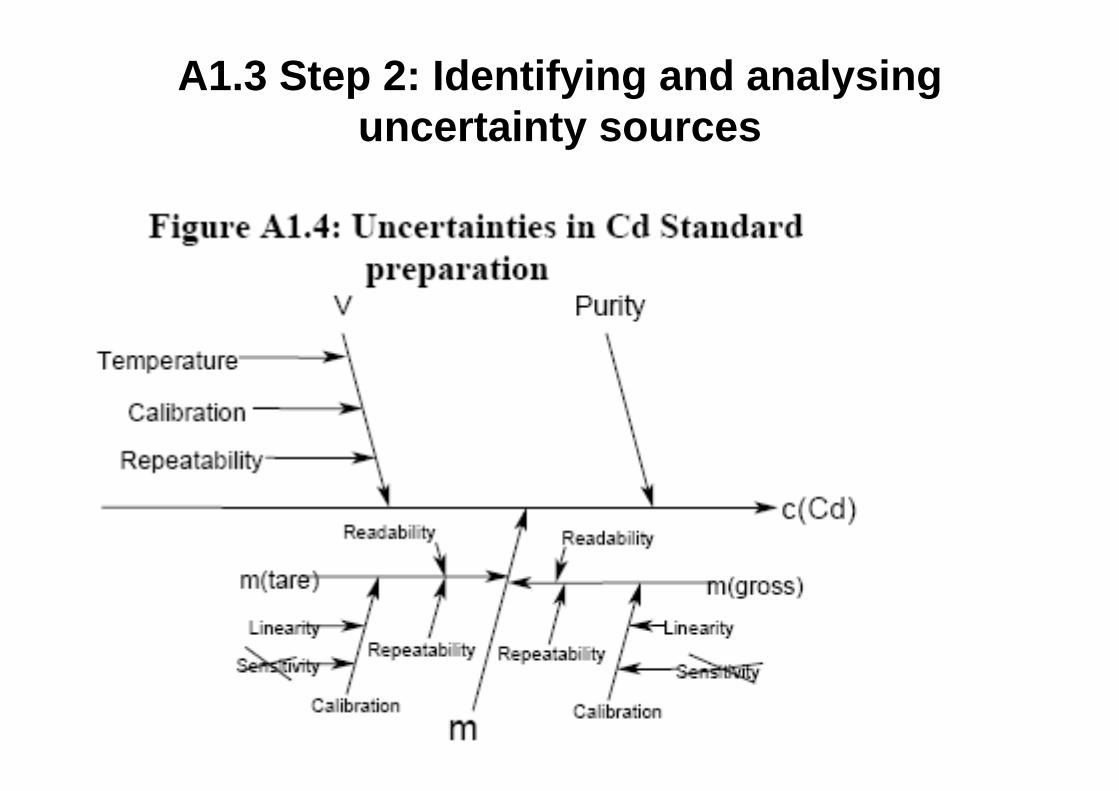
A1.3 Step 2: Identifying and analysinguncertainty sources
A1.4 Step 3: Quantifying the uncertaintycomponents
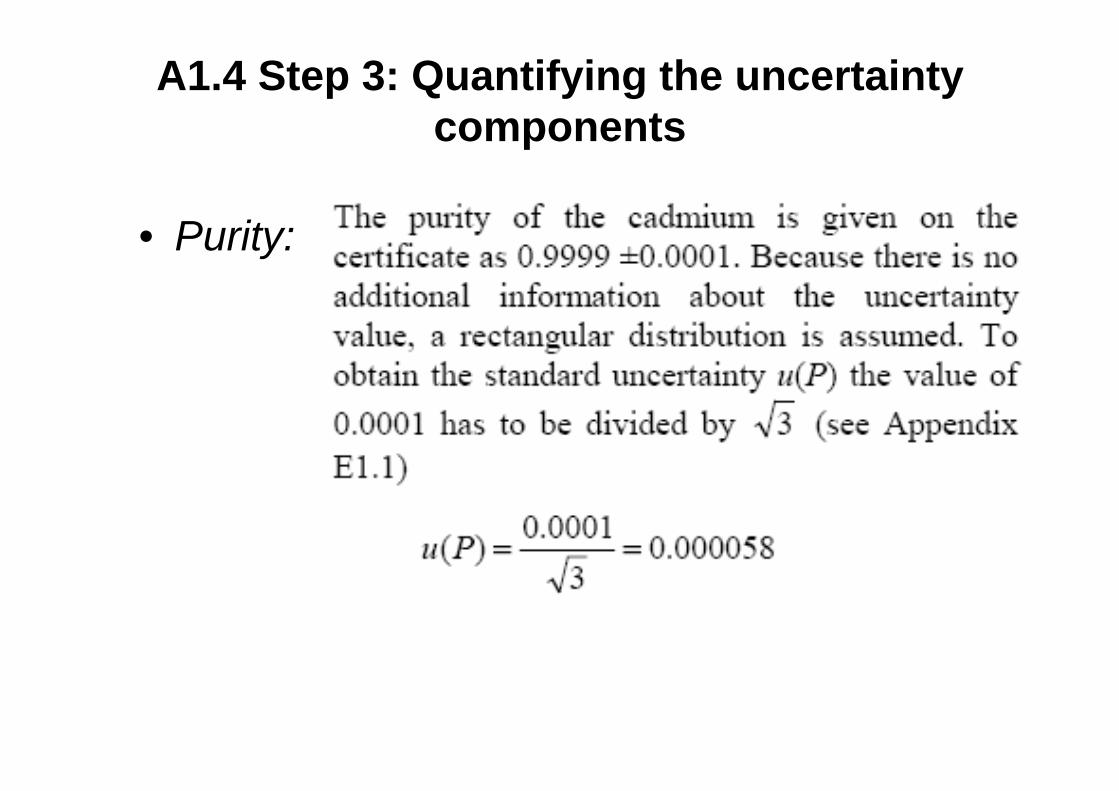
• Purity:
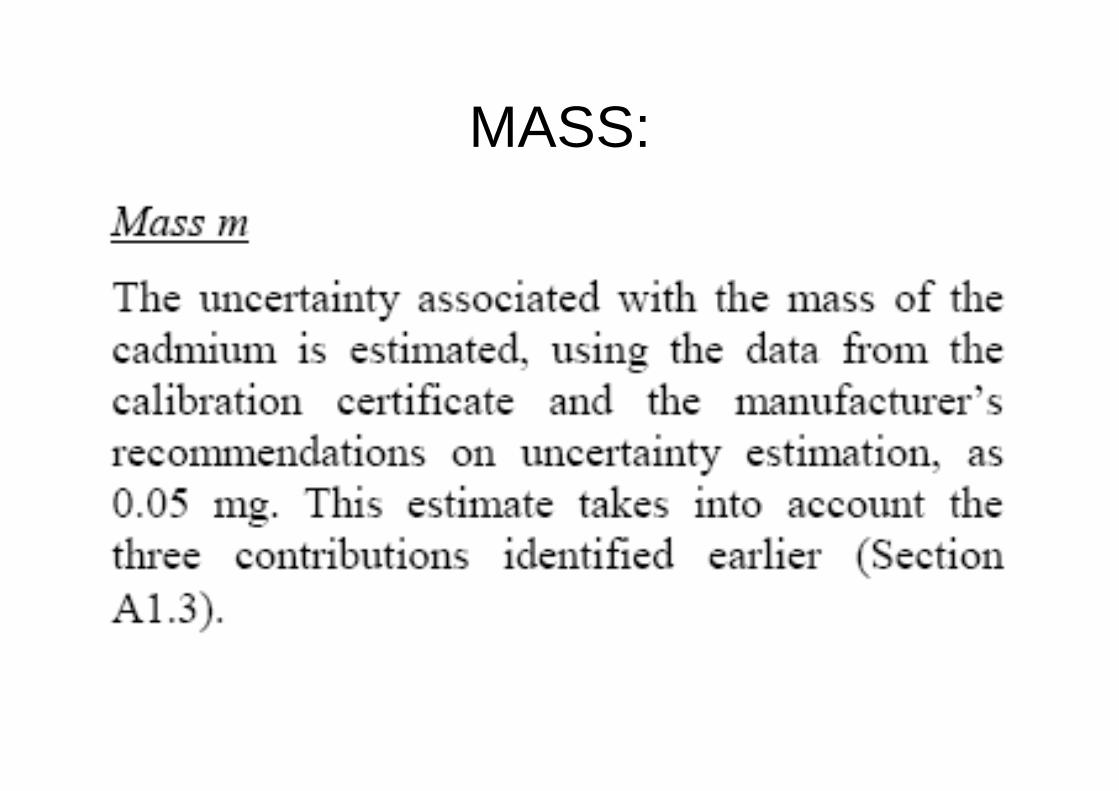
MASS:
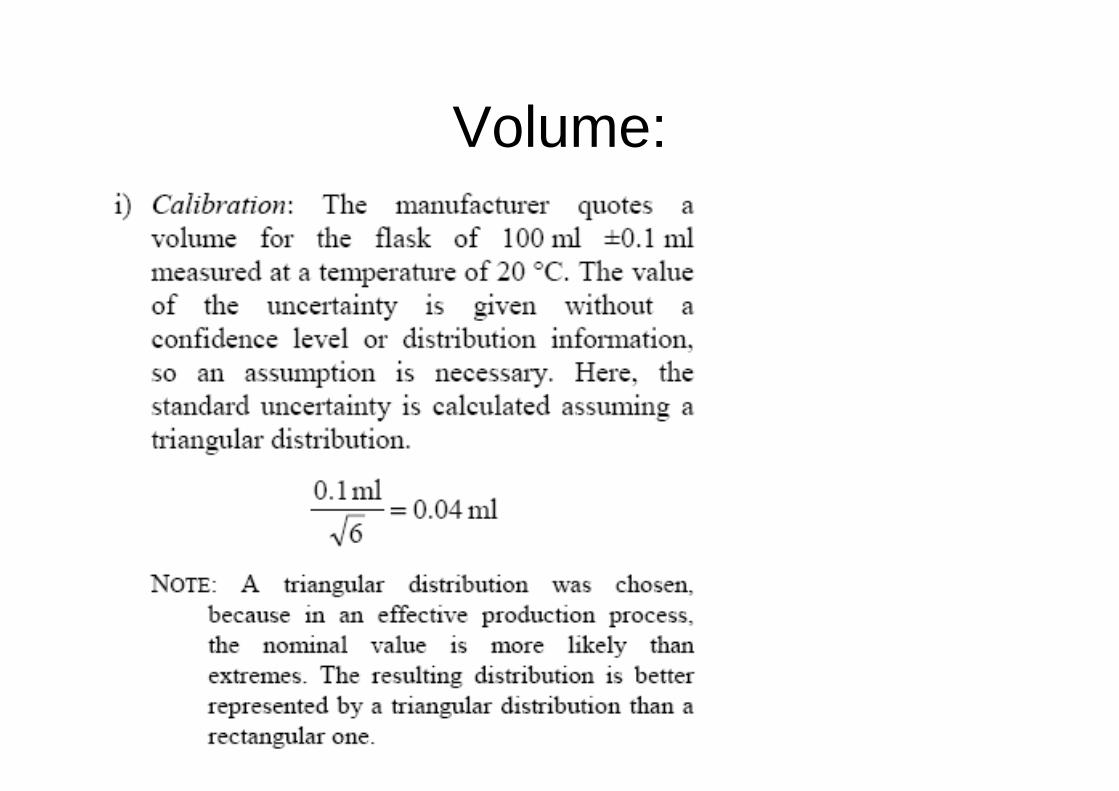
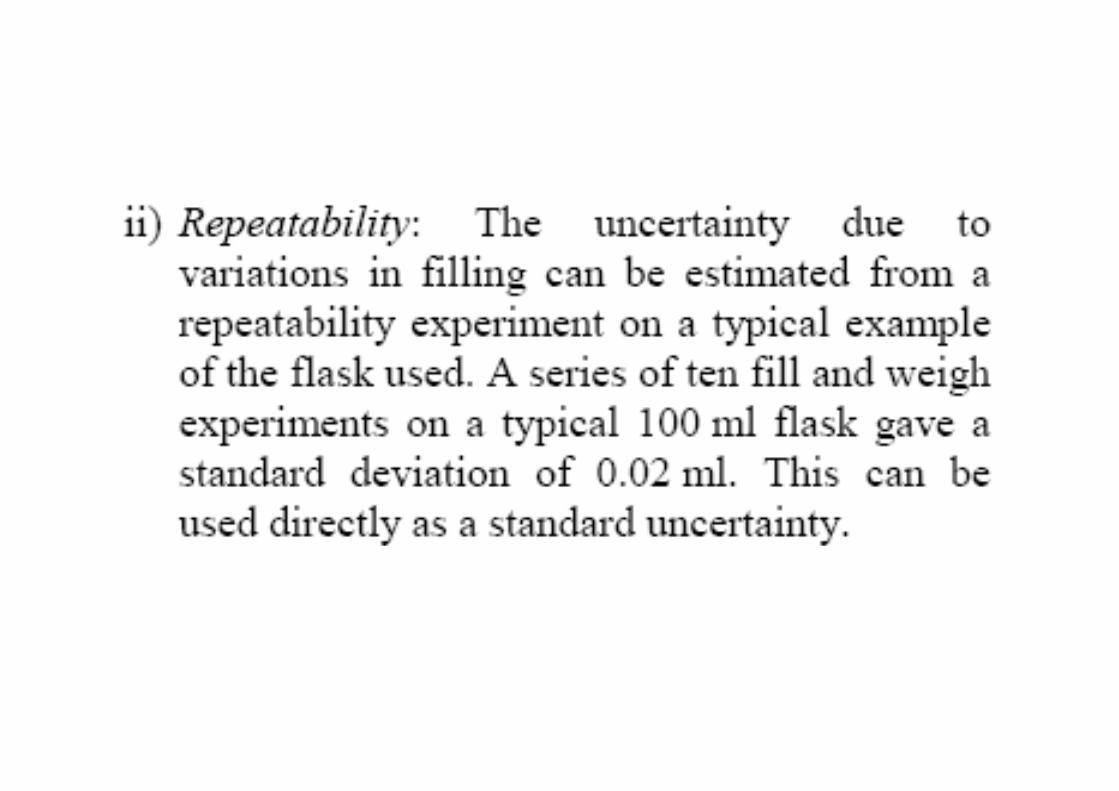
Volume:
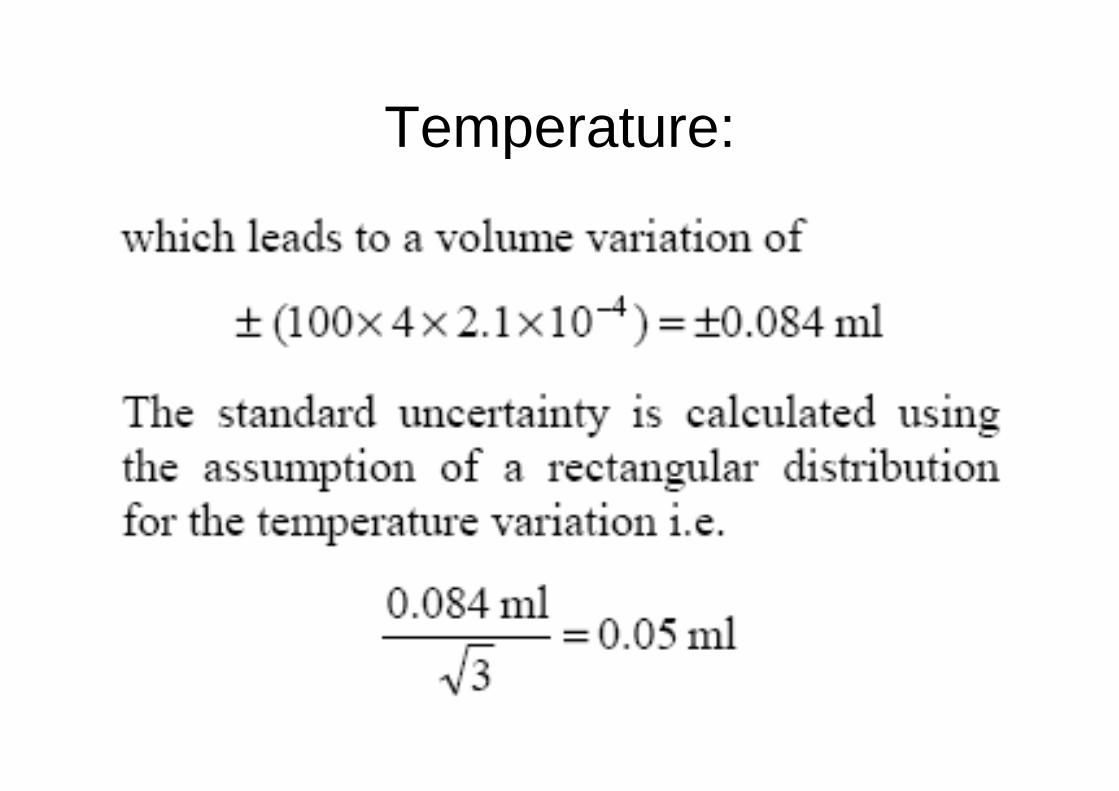
Temperature:
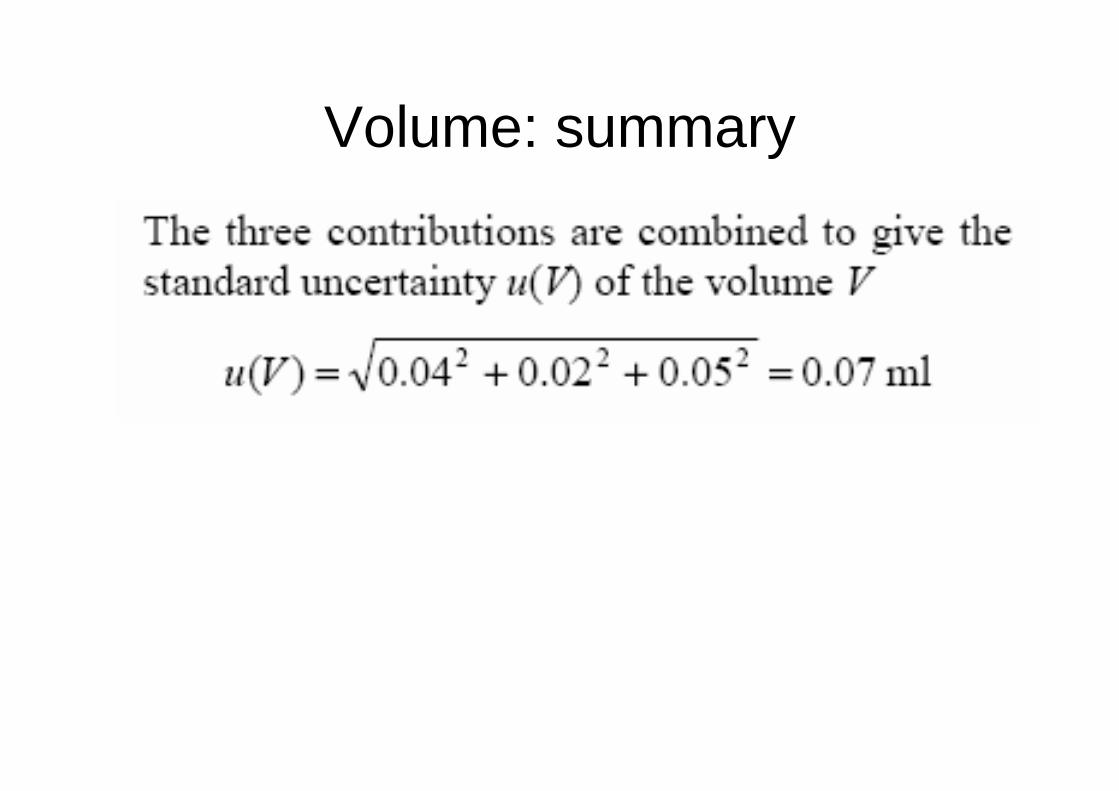
Volume: summary
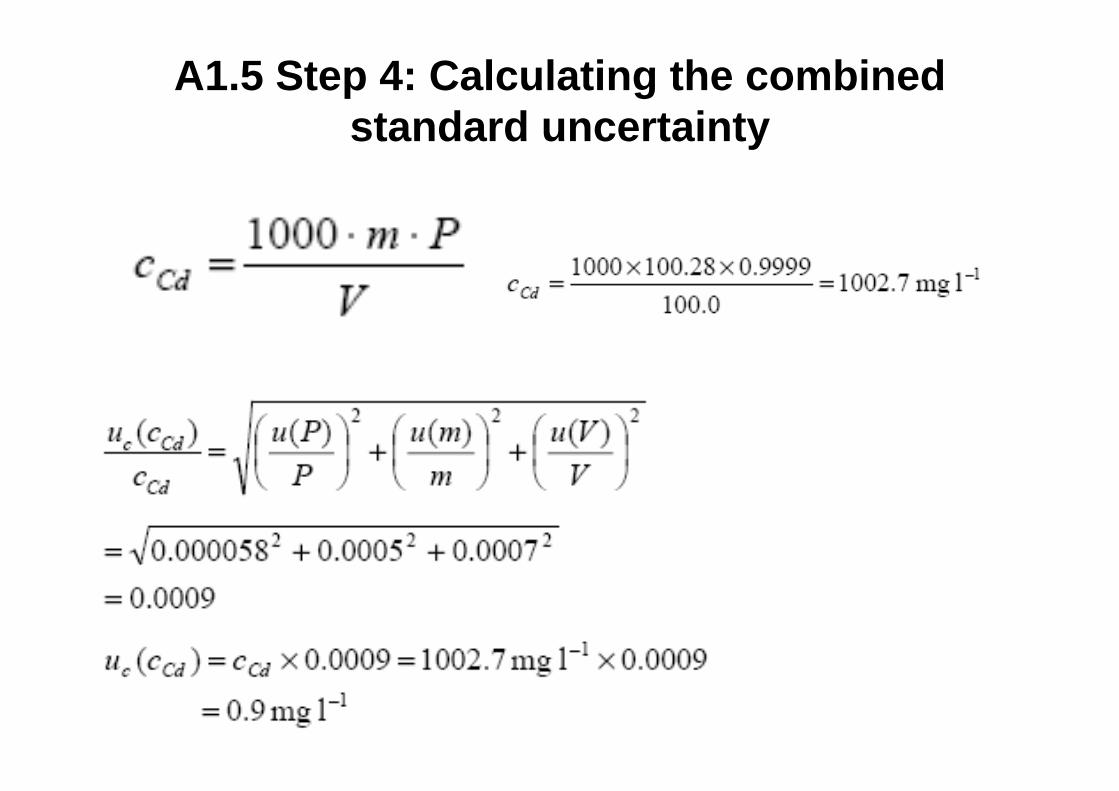
A1.5 Step 4: Calculating the combinedstandard uncertainty
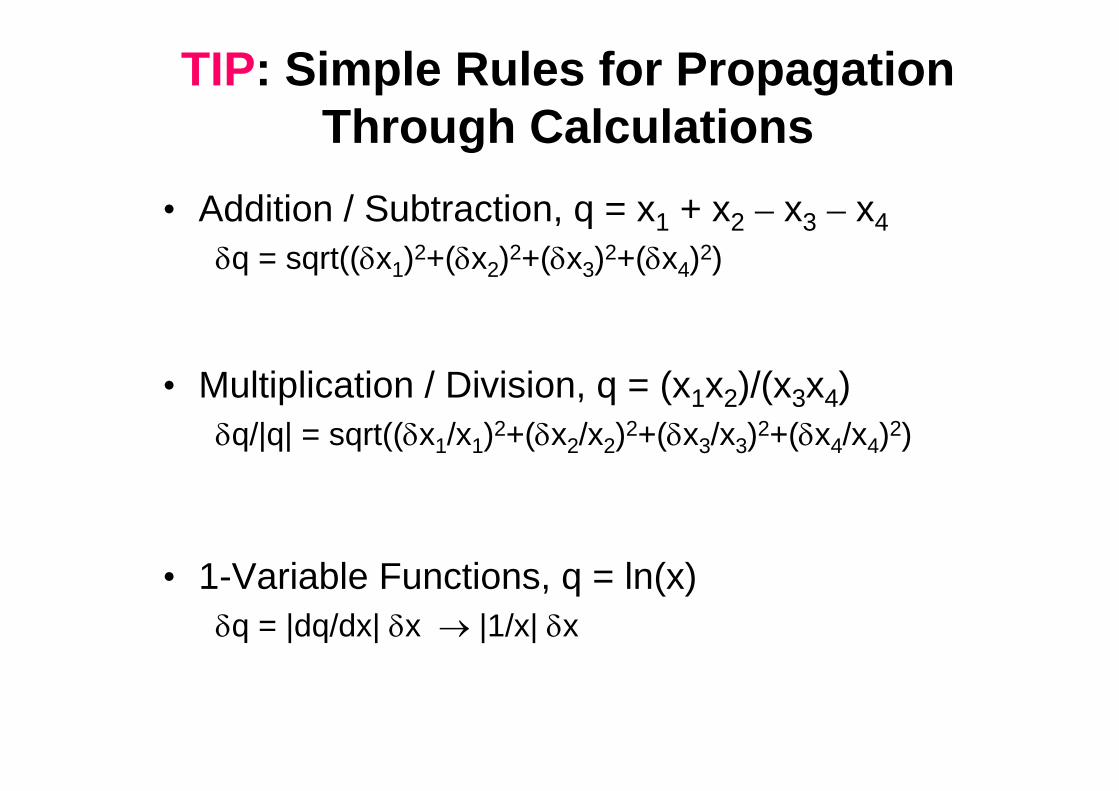
TIP: Simple Rules for Propagation Through Calculations
• Addition / Subtraction, q = x1 + x2 – x3 – x4 δq = sqrt((δx1)2+(δx2)2+(δx3)2+(δx4)2)
• Multiplication / Division, q = (x1x2)/(x3x4) δq/|q| = sqrt((δx1/x1)2+(δx2/x2)2+(δx3/x3)2+(δx4/x4)2)
• 1-Variable Functions, q = ln(x) δq = |dq/dx| δx → |1/x| δx
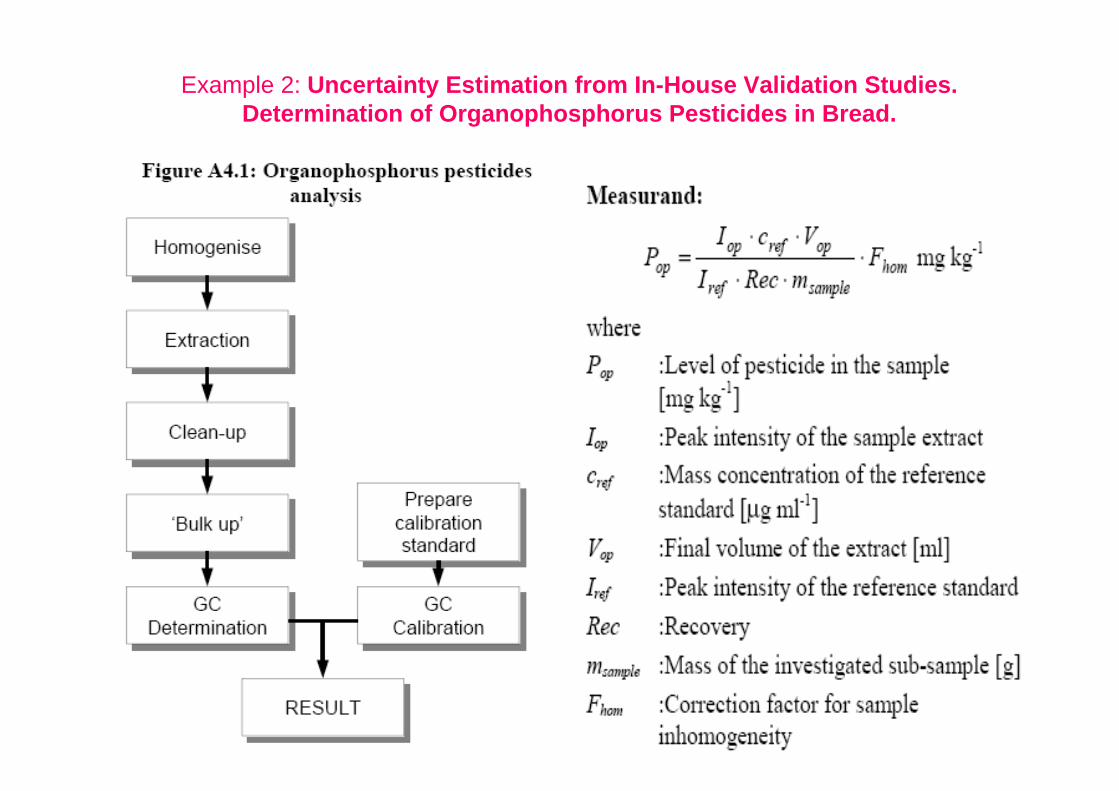
Example 2: Uncertainty Estimation from In-House Validation Studies.Determination of Organophosphorus Pesticides in Bread.
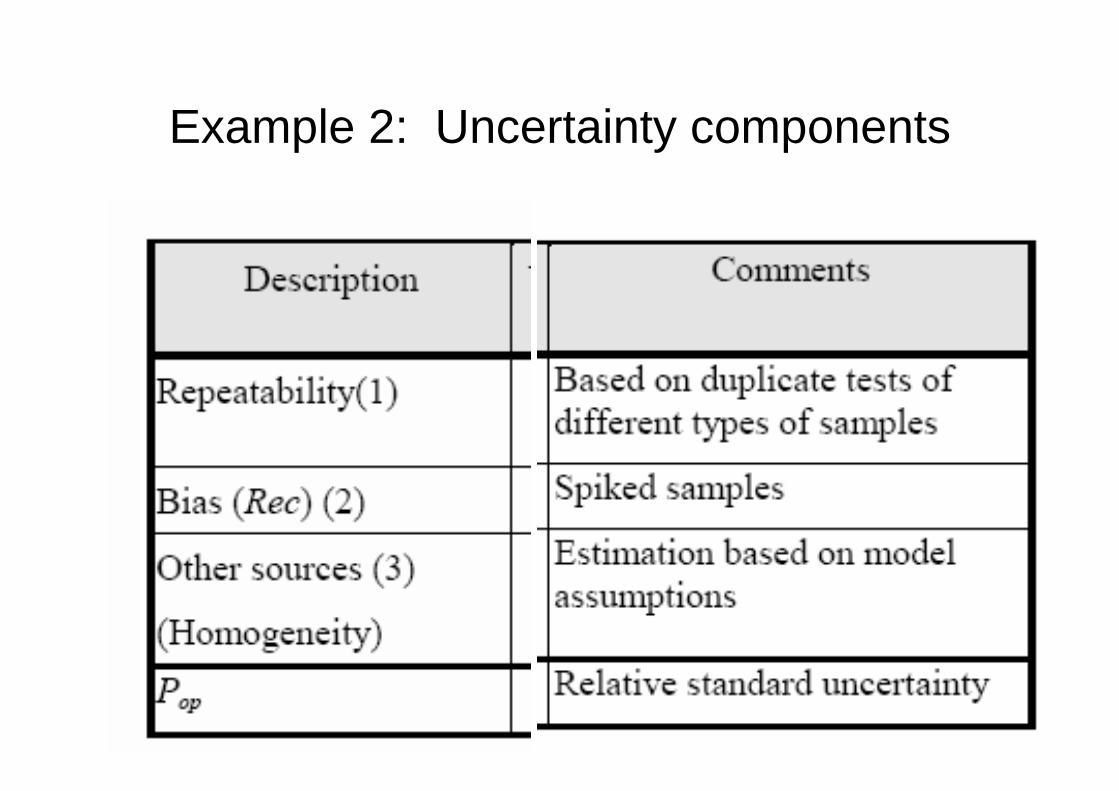
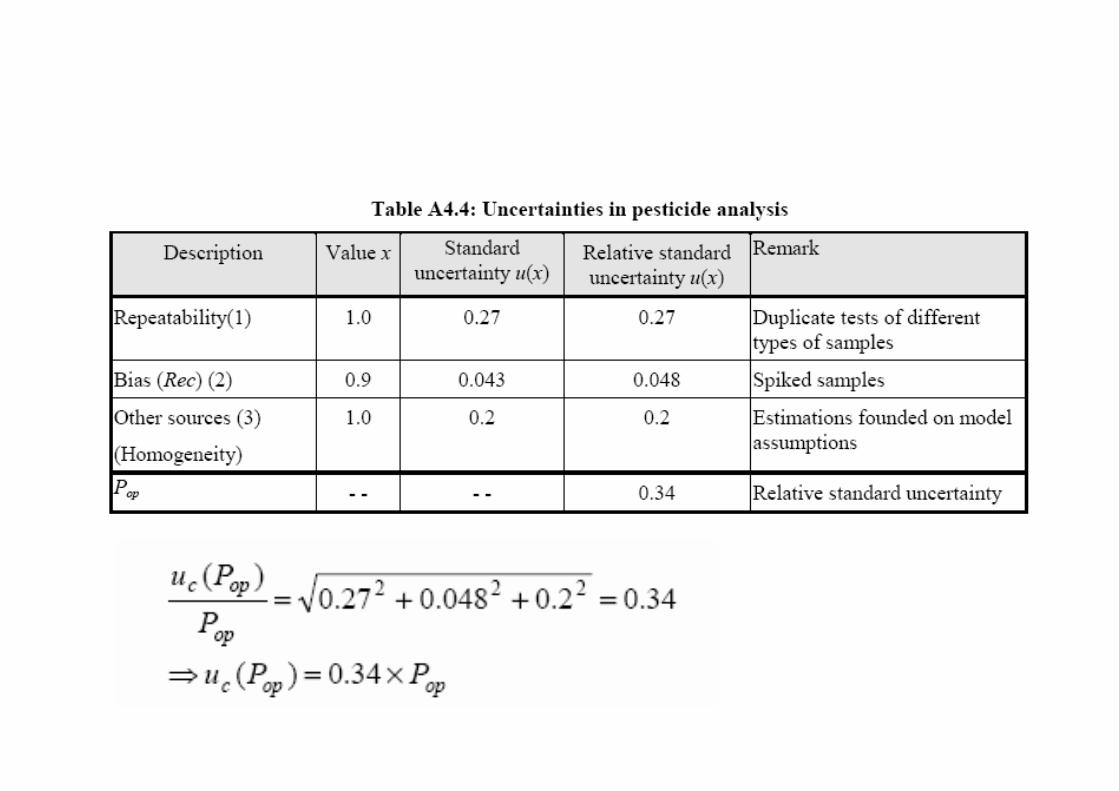
Example 2: Uncertainty components

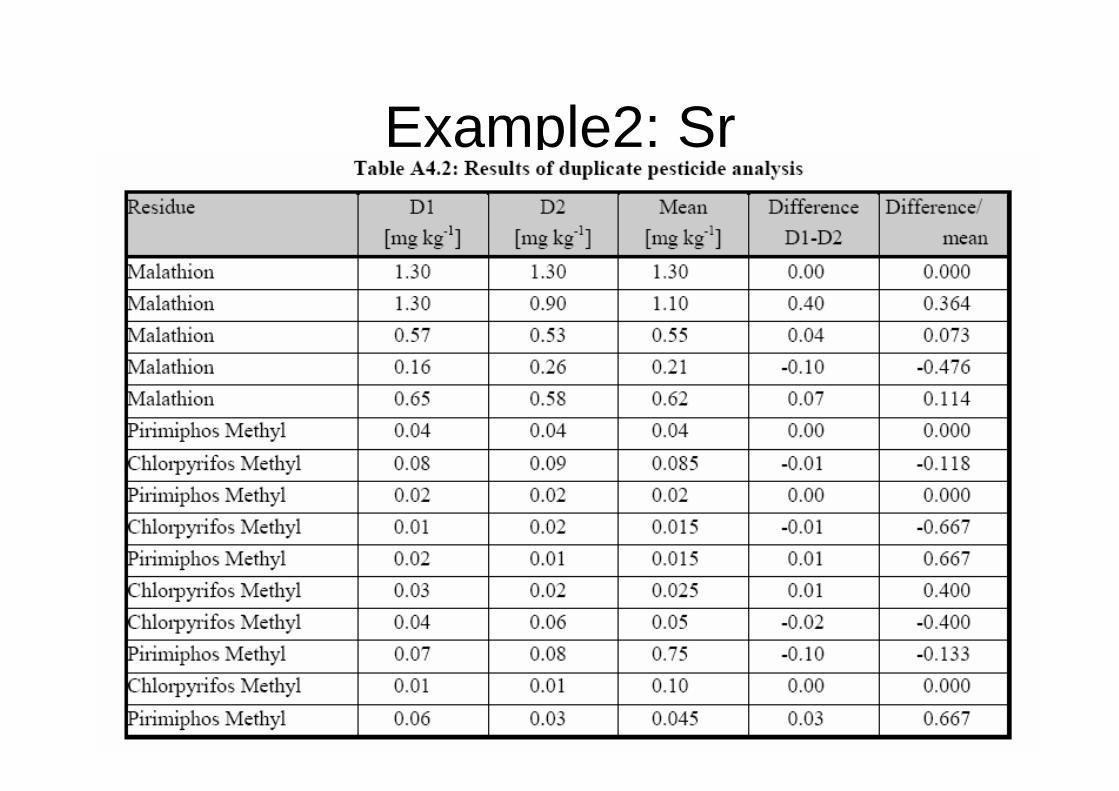
Example2: Sr
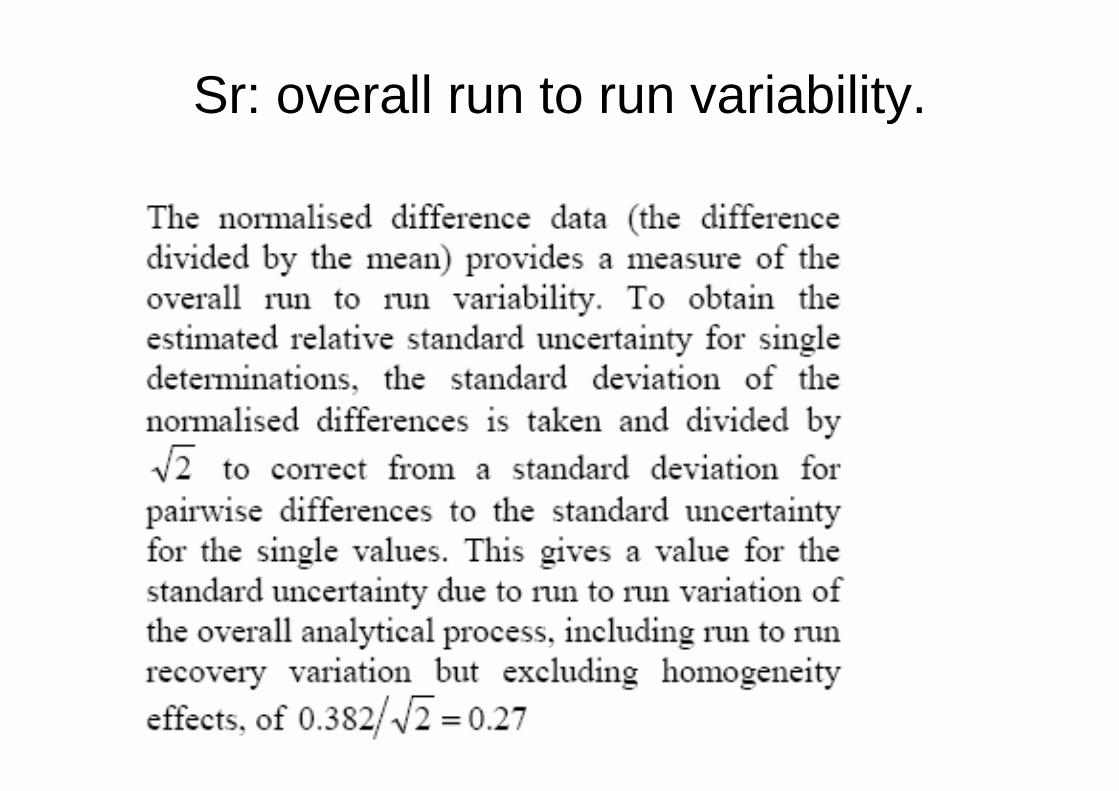
Sr: overall run to run variability.
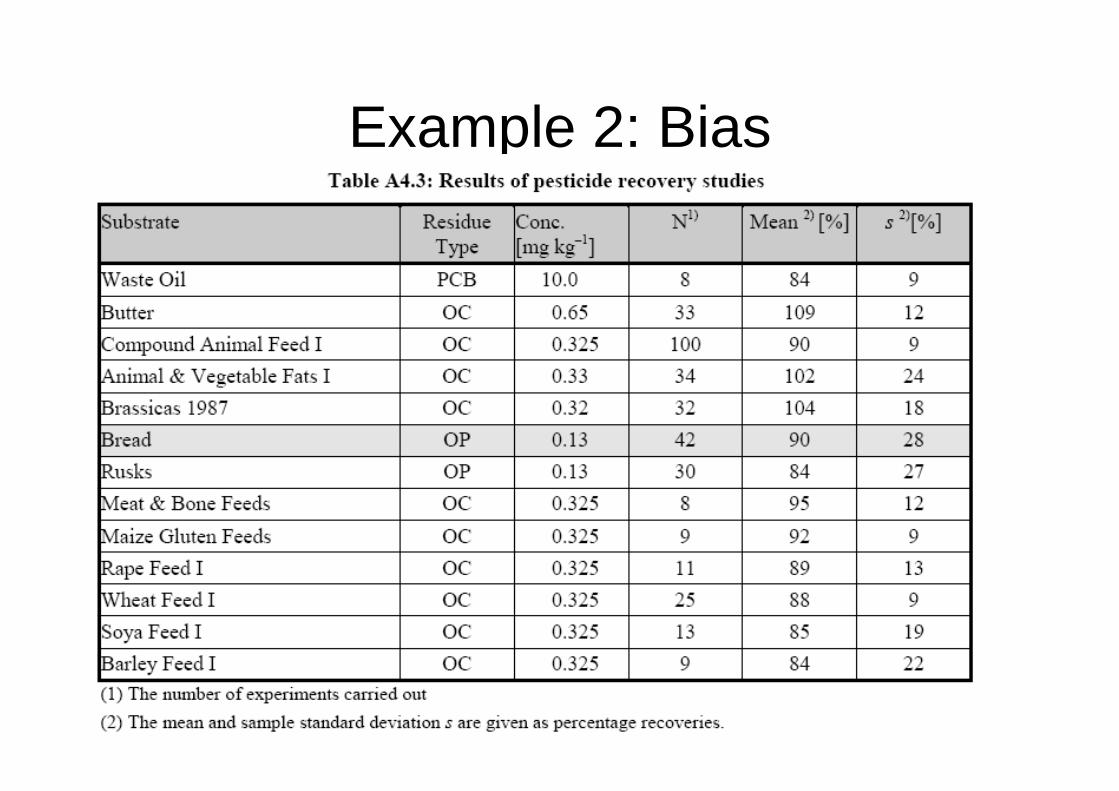
Example 2: Bias
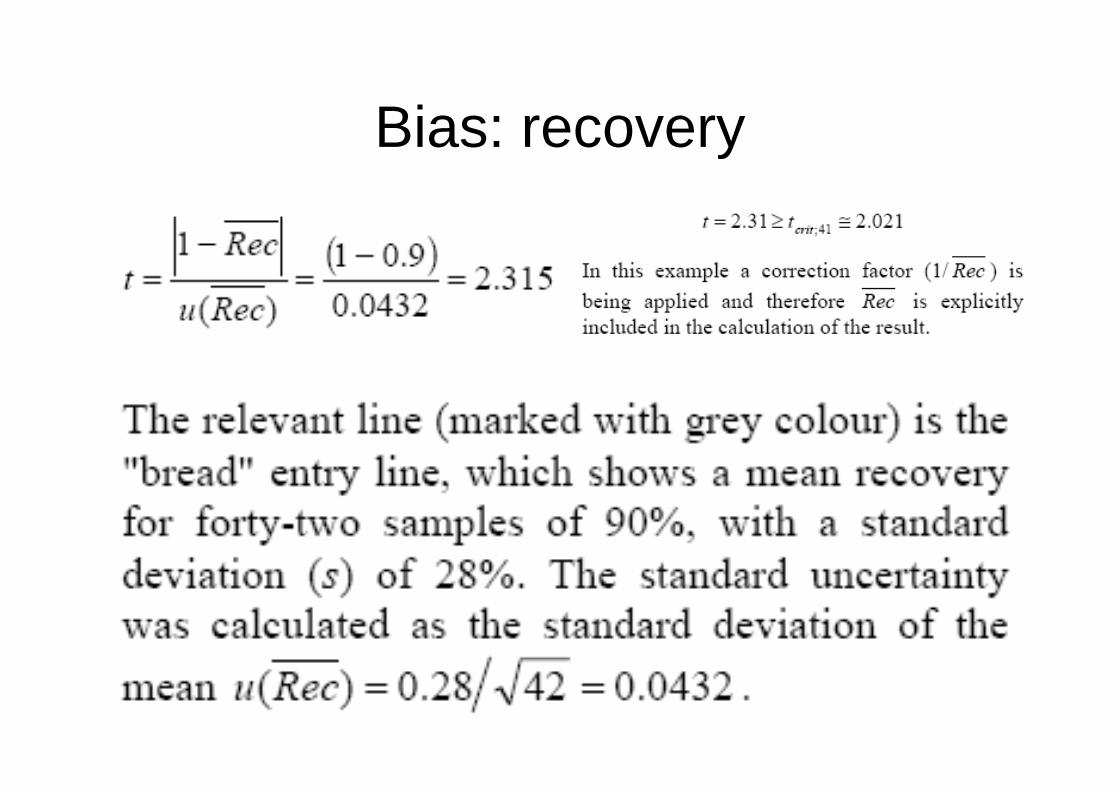
Bias: recovery

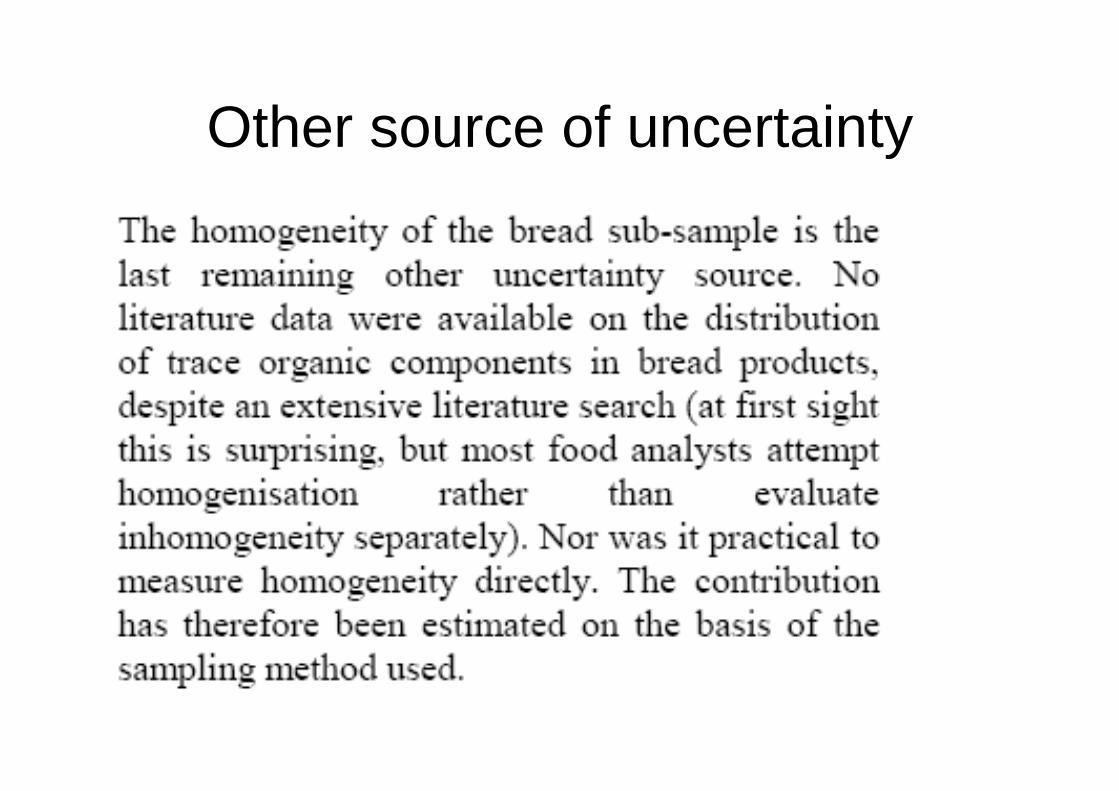
Other source of uncertainty

Distrubition of residue
• Scenario (a) Residue distributed on the top surface only: 0.58.
• Scenario (b) Residue distributed evenly over the surface only: 0.20.
• Scenario (c) Residue distributed evenly through the sample, but reduced in concentration by evaporative loss or decomposition close to the surface: 0.05-0.10 (depending on the "surface layer" thickness).
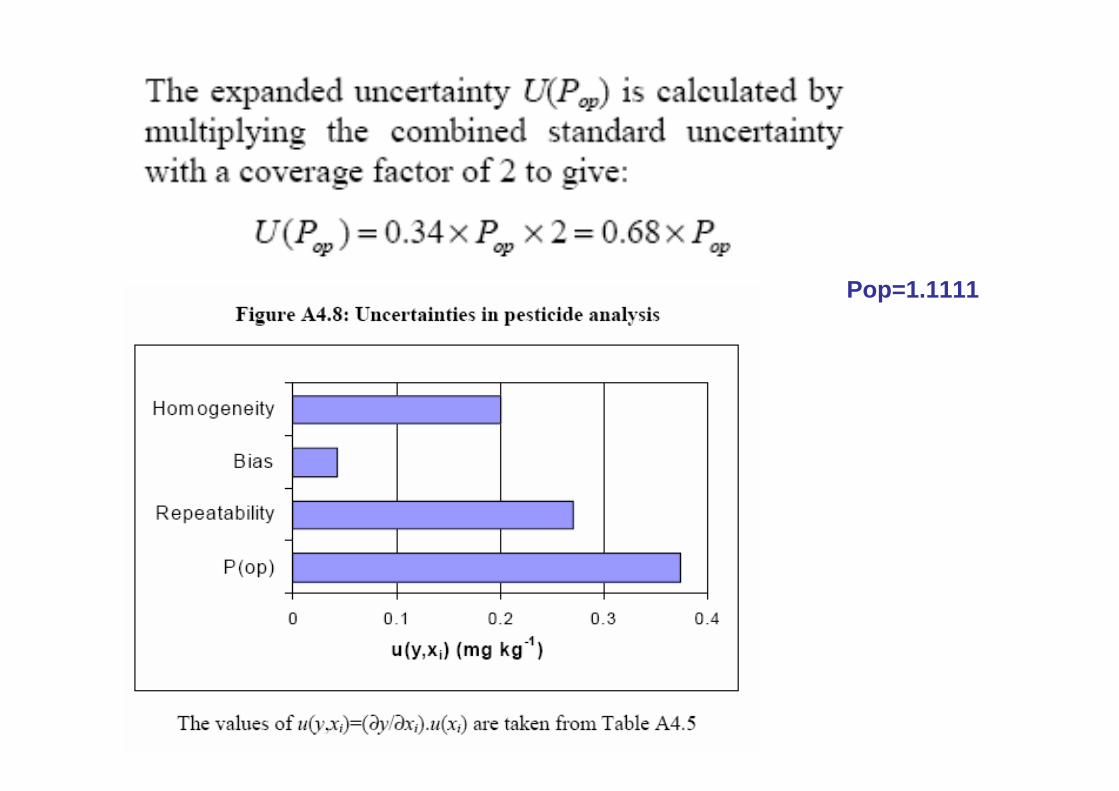
Pop=1.1111

Other methods of estimation for U
• Based on Horwitz formula
PT: Performance Testing data
• FFP: fit for purpose data
– Based on other empirical data
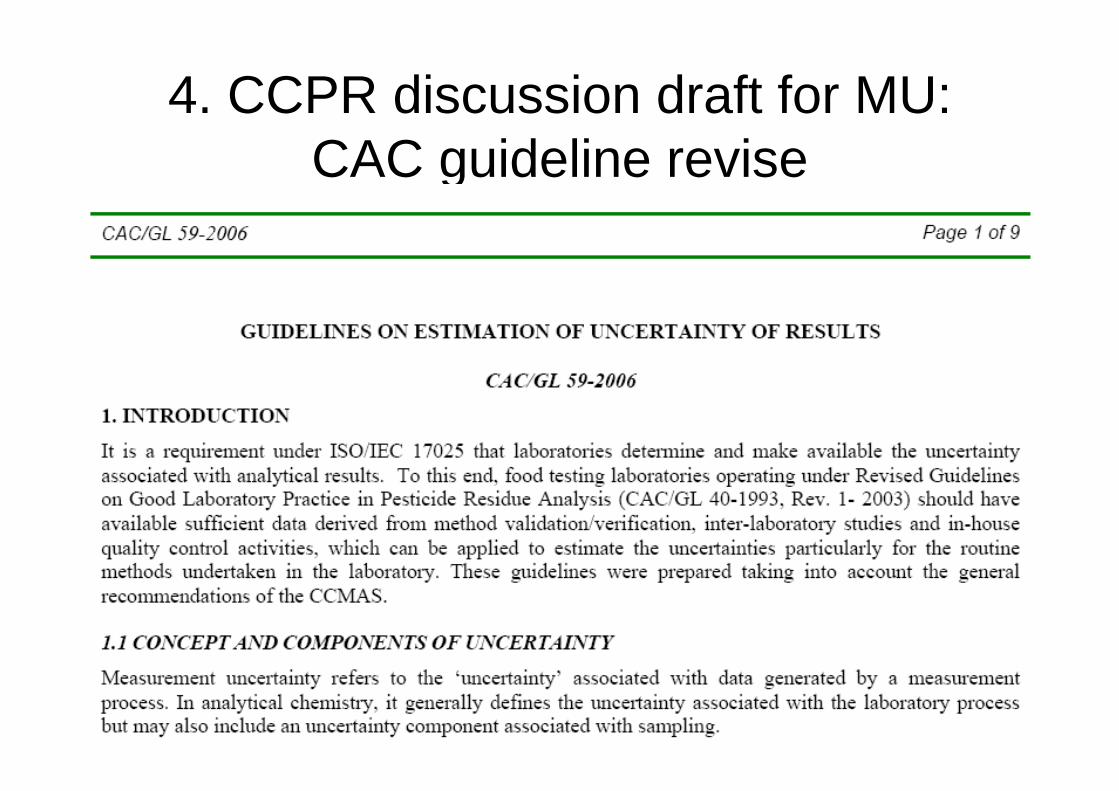
4. CCPR discussion draft for MU: CAC guideline revise


The key objectives of revision of GL• (a) adaptation of MU estimation by taking into
consideration the complexity of pesticide residue analysis (i.e. several working steps eventually involving instrument calibration, chemical changes of the target analytes; limited laboratory resources; large number of combinations of commodities and pesticides);
• (b) elaboration of a practically oriented and straightforward guidance (e.g. based on empirical top-down concepts);
• (c) allowing for simplified MU estimation for the ease of compliance with ISO Standard 17025. Uncertainty related to sampling is not subject of this guideline.
MU discussion background
• With regard to pesticide residue analysis, bottom-up calculations in particular are perceived as overly complicated and extremely laborious.
• there is still incomplete understanding and limited adoption of the uncertainty concept.
• Difficulties related to MU were discussed by CCMAS in 2007 (see ALINORM 07/30/23, paras 6-10)
ISO/TS 21748:2004 • provides additional mathematical concepts especially
for estimating zones of acceptance and rejection around analytical values;
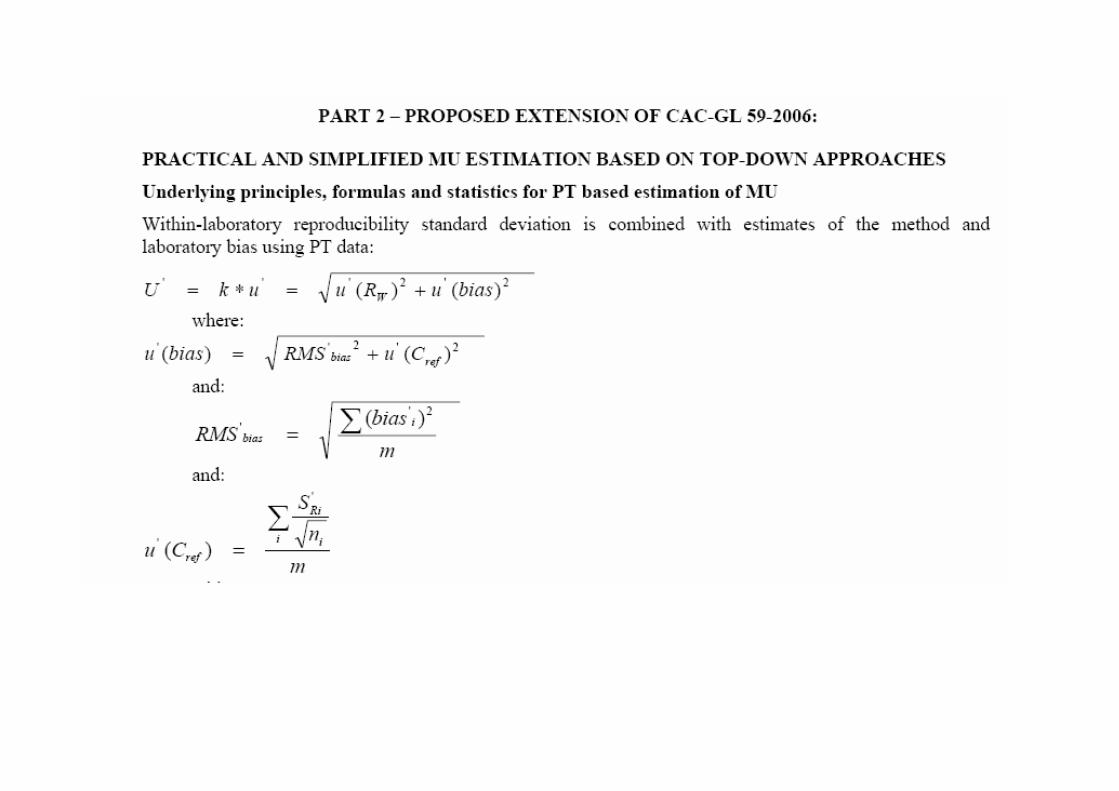
• straightforward top-down approaches• Evaluating uncertainty according to ISO/TS 21748
comprises the following elements:• (a) repeatability, reproducibility and bias estimates
from collaborative study;• (b) laboratory bias and precision within that expected
on the basis of collaborative studies;• (c) laboratory bias and precision under control and
effects appropriately combined to form a combined uncertainty estimate.
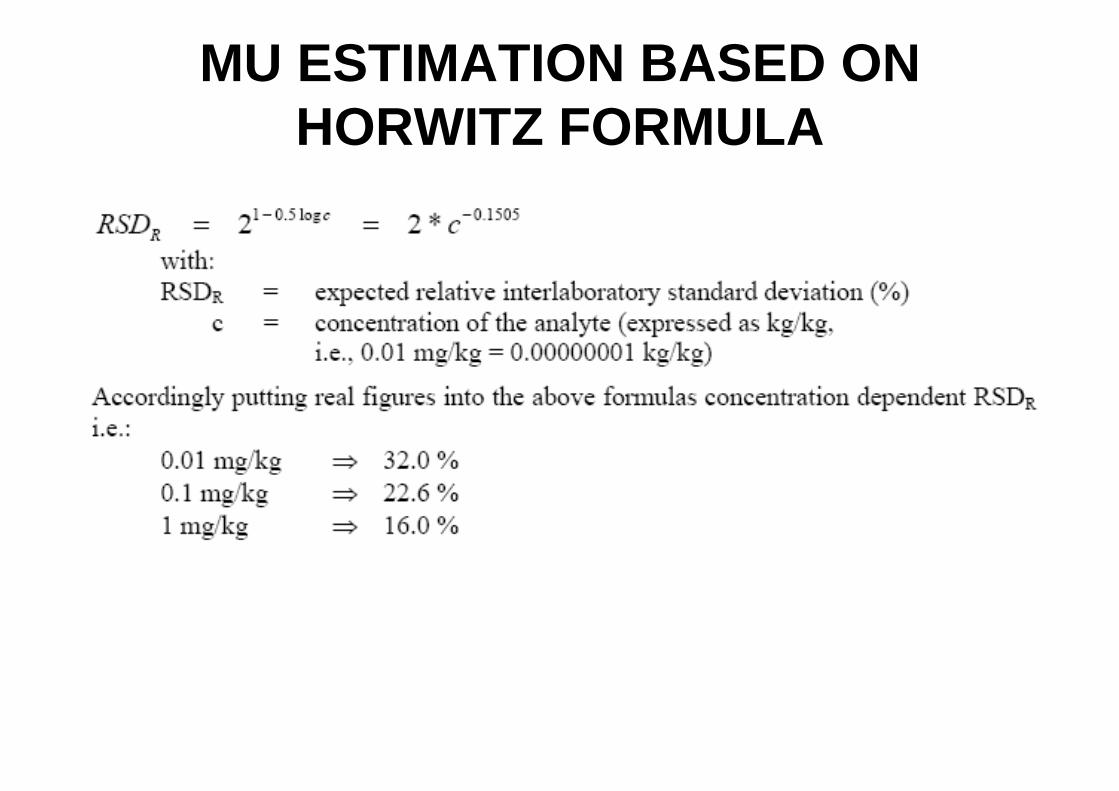
MU ESTIMATION BASED ON HORWITZ FORMULA
PT
• SANCO ACQ Guidelines 5 support this line of action towards evaluating MU associated with proficiency test results.
• Eurolab Technical Report6 and NORDTEST Report7 TR 537 outline in greater detail, among others, the use of method validation and PT data for estimating MU.
FFP
• the evaluation of the recent EC PT schemes demonstrates that a FFP variability of 25% can be accepted as a sound representation of performance under these circumstances. As a consequence, accepting 25% variability as a standard deviation would lead to a generalized assumption of ±50% MU.
guideline EA-4/16, 2003
• describes the use of validation and method performance data for uncertainty evaluation.
• Data accumulated during validation and verification of test methods, interlaboratorystudies according to ISO
5725, accumulated quality control data, and proficiency testing schemes typically characterize test method performance.
• Accepting such a generalized approximation for pesticide multi-residue analysis methods, a generalized top-down approach might result in larger MU values than such derived for each individual pesticide/commodity combination by systematic bottom-up calculations.
• However, the application of generic MU is considerably more practical and easier to obtain. Generalized values, like ±50% MU, mostly would expand safety margins around MRLs.
RECOMMENDATION / PROPOSAL
empirical top-down estimation of ±50% MU could complement a mathematically stringent bottom-up calculation model if the respective empirical quality criteria are met.
Alternatively the Horwitz formula approach of estimating concentration-dependent MU based on the evaluation of results of interlaboratory collaborative tests could be applied as well.
• It is proposed to further develop a specific guidance for the application of empirical MU concepts applicable particularly in the field of pesticide residue analysis of foodstuffs.

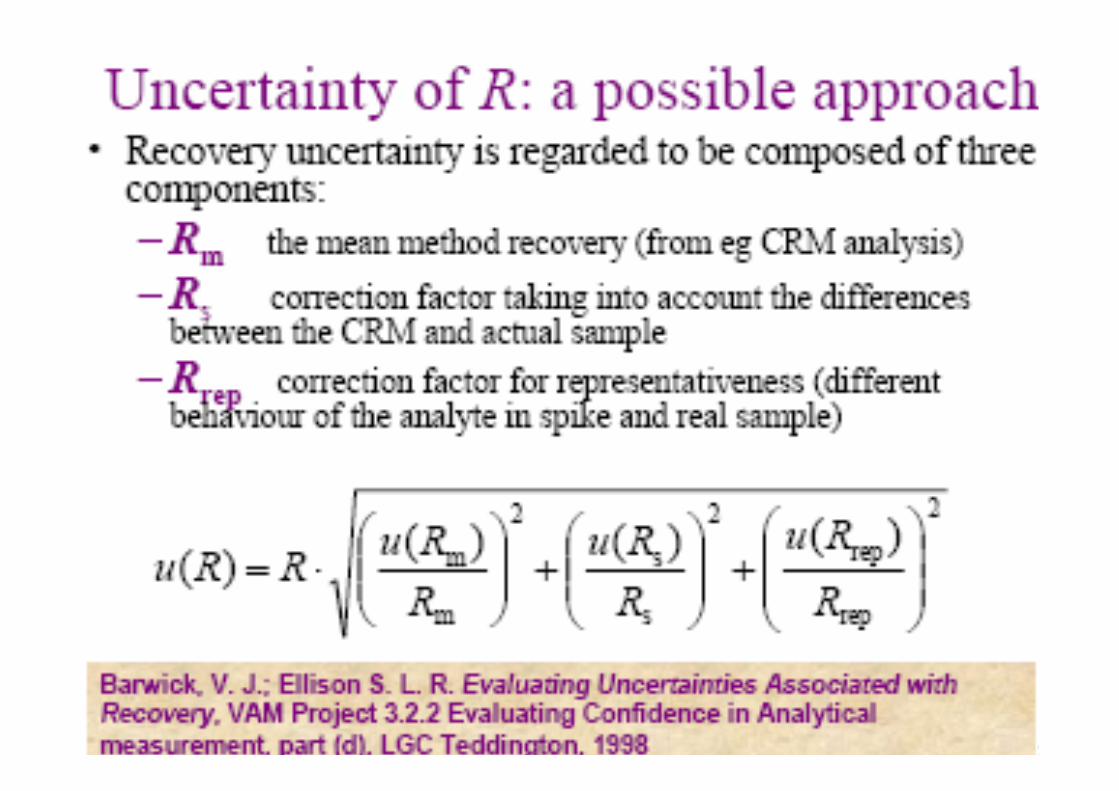
Discussions• Further Complexity on MU: recovery, LOQ level
• Excel and Uncertainty Calculator
• Literature on Uncertainty
•