Embed Size (px)
Citation preview
Uncertainty and Sensitivity Analyses
Marcelo Coca Perraillon
University of ColoradoAnschutz Medical Campus
Cost-Effectiveness AnalysisHSMP 6609
2016
1 / 38

Outline
Defining terms: variability, heterogeneity, uncertainty
Sensitivity analysis: “deterministic” and “probabilistic”
Base case, one-way, two-way, three-way, scenarios
Influential variables: tornado diagrams
More advanced methods: probabilistic sensitivity analysis (PSA)
Probability distributions
Example: HIV model
ANCOVA and Expected Value of Perfect of Information (EVPI)
2 / 38

What is sensitivity analysis
We have already performed some basic sensitivity analyses
It is essentially the study of how changes in model inputs affectmodel outputs
Inputs are quantities, prices, life years, probabilities, and so on. Inessence, all we measured in the CEA study
Outputs are the model outcomes we care about: average or expectedcosts, average or expected benefits, average or expected ICER or NetMonetary Benefit
3 / 38

Deterministic and probabilistic sensitivity analysis
Two types of sensitivity analyses:
1 Deterministic: We choose values for one or more parameters keepingthe rest constant. For example, min or max or a case that has policyrelevance
2 Probabilistic: We assign parameters a probability distribution and usesimulations to compute new ICERs
4 / 38
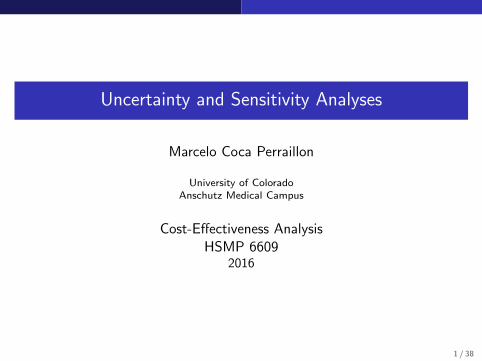
Defining terms
Variability: Variation due to chance; random variability. Even withidentical patients facing the same probability of an event, someexperience the event and some do not. Sometimes called stochasticuncertainty or first-order uncertainty (less common)
Heterogeneity: Differences between patients that can be attributedor explained by patient’s characteristics (think sex, age, income, andso on)
Uncertainty: What sensitivity analysis tries to measure. We do notknow the true value of some input (parameter) or the true way aprocess is generated
Two types of uncertainty: parameter uncertainty and modeluncertainty
5 / 38

Parameter uncertainty
We do not know the true value of a parameter. For example, the trueaverage cost for a procedure in the population
We could estimate the mean cost in a sample but the estimatedparameter (the mean) itself has some variability
In statistics, a measure of uncertainty in the parameter estimation isthe standard error (do not confuse it with the standard deviation)
We can reduce some of this uncertainty if we had a larger sample; thestandard error also depends on the standard deviation
6 / 38

Model uncertainty
Models are simplifications of reality; some models capture the keyelements of reality and some don’t
Remember the classic “All models are wrong; some are useful”
The doubts we have about the model assumptions is modeluncertainty
7 / 38

Analogy with regression
A standard linear regression model can be written as:
y = β0 + β1X1 + ...+ βkXk + ε
where ε is assumed to distribute normal with mean 0 and variance σ2
After collecting data on variables y and X1 to Xk , we can estimatethe model:
y = β0 + β1X1 + ...+ βkXk
Standard errors for the coefficient: SE (βj) are also estimated
With the coefficients and the SEs, it is possible to test hypotheses
8 / 38

Analogy with regression
The random error ε corresponds to stochastic uncertainty orvariability due to chance
Parameter uncertainty is measured by the standard error SE (βj) of
the estimated parameter βj
Heterogeneity of effects is represented by coefficients βj
Model uncertainty is the uncertainty around the assumptions of themodel. Is it correct to assume that the error, and consequently theoutcome y , distribute normal? Are we including all the relevantcovariates X? Should we model y or log(y)?
9 / 38

Cheat sheet
Trying to come up with a common terminology. From Briggs et al(2012):
10 / 38

Deterministic sensitivity analysis
One-way: Change one parameter at a time keeping all othersconstant
Standard way of presenting one-way sensitivity analyses results is toplot the parameter you are changing in the x-axis and an output ofinterest on the y-axis
In the HIV example, we could change the relative risk and analyzewhat happens to average costs in the combination therapy group andthe ICER
11 / 38

HIV transition diagram
See Excel file for more details12 / 38

One-way sensitivity analysis of relative risk (cost)
Lower RR implies combo therapy more effective, so more people stayin states that are costly
13 / 38

One-way sensitivity analysis of relative risk (ICER)
ICER shows more nuance because of more moving parts. Moreeffective drug increases costs but it also increases life expectancy.Less effective combo therapy becomes more similar to mono therapybut costs keep going up
14 / 38

Using a macro for sensitivity analysis in Excel
It is easy to change values in Excel but it is not the most practicalway to perform many sensitivity analyses
Excel has a macro language that is very flexible and relatively easyto use, although it can take a while to master it
It’s based on a version of a programming language, Visual Basic(Visual Basic for Applications, VBA)
Fortunately, you don’t need to master it in order to use it for simpleanalyses
We will use a simple macro for quick sensitivity analyses
15 / 38

Macros in Excel
First, make sure that you can see the Developer ribbon in Excel:
1 Click the File tab.2 Click Options.3 Click Customize Ribbon.4 Under Customize the Ribbon and under Main Tabs, select the
Developer check box
16 / 38

Record a macro
The easiest way to use macros is to record a macro of a repetitivetask like changing the RR and then copying and pasting the resultingICER into a new column
Excel will create VBA code to do the repetitive task
It is then fairly easy to modify the code to complete a task
See accompanying Excel file for an example
17 / 38

Final code
18 / 38

Logic
For each copy-paste step, Excel creates a chunk of code
We used this chunk of code to create a loop so Excel does the samein a range of cells, from rows 5 to 17
We added
1 Dim i As Integer2 For i = 5 To 173 Next i
See http://www.excel-easy.com/vba.html for more Examples
Remember, this code only repeats interactions with Excel that youcould do “by hand”
19 / 38

Tornado diagrams
Tornado diagrams are a nice method to depict results of one-waysensitivity analyses
Provide a way to quickly figure out which parameters has the mostinfluence on outcomes
Not the only way to present results but a common way to do so inCEA
We will do a tornado diagram of the the HIV model
20 / 38

Tornado diagram HIV model
We need to come up with a range of values for the parameters
The most important variables are the cost of the medications and therelative risk
21 / 38

Where do we get these numbers?
The base-case scenario is our best estimate (sometimes calledbaseline values)
The range could be obtained from multiple sources, like drug pricesthat are common for hospitals or prices after discounts
The relative risk was obtained from a meta-analysis, so a confidenceinterval could be available
We can then calculate the ICER corresponding to each of the valuesin the table
22 / 38

Table for tornado diagram
Lb = lower bound; Ub = upper bound
The range is the absolute value of the difference between the upperand the lower bound
Table is sorted from lowest to largest range
A tornado diagram is a graphical representation of this table
23 / 38

Tornado diagram
Vertical line is the ICER for base case ($11,499); the most influentialvariable is the drug price for combination therapySee Excel file for details; see this video to create a similar plot:https://vimeo.com/34389151
24 / 38

Probabilistic Sensitivity Analysis
Instead of changing one or more variables at a time we will change all(or many) variables simultaneously using a simulation (often calledsecond-order Markov simulation)
Instead of coming up with a range of possible values for each variablewe will assume that a parameter has a probability distribution
Remember that a probability distribution assigns a probability to eachpossible outcome of a random variable
We can describe a distribution using its parameters
For example, a normal distribution can be described by its mean andvariance (two-parameters)
25 / 38

Normal distribution
Simulated values for a normal variable with mean 100 and standarddeviation of 50; N(100, 502)
26 / 38

Simulation
If we assume that a variable has a distribution and have theparameters of the distribution, we can use software to generate asample of values
Think of this as asking the computer to pick random numbers foryou. The only condition is that these numbers must come from aprobability distribution with certain characteristics
For example, I used Stata to simulate 10 draws of a normaldistribution with mean of 100 and standard deviation of 50
The first ten values were: 52.32808, 125.6597, 187.7224, 113.5894,113.8938, 138.1172, 74.36327, 77.44591, -21.80569, 37.02974
Digression: technically, computers generate pseudo-randomnumbers; need a “seed”
27 / 38

PSA
The procedure to conduct PSA is simple:
1 Assign a probability distribution to each variable2 Draw a number from these distributions3 Calculate ICER (or any other outcome of interest)4 Save ICER5 Repeat procedure many times (1000 or 10,000 times)6 Plot all ICERs in a cost-effectiveness plane7 Calculate statistics (like the percent of time the ICER is below
threshold)
The resulting “cloud” of ICERs will give you a sense of the overalluncertainty
28 / 38

PAS for HIV example
Campell et al (2014) performed a PSA of the HIV example
Assumed distributions
29 / 38

PAS for HIV example
Performed 10,000 simulation draws
30 / 38
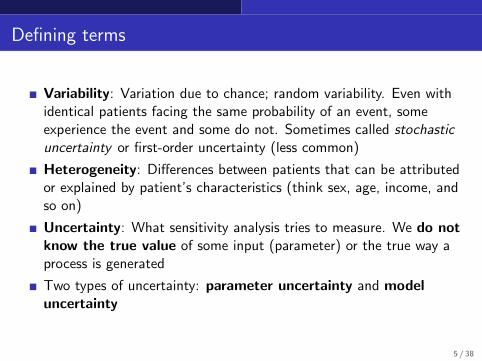
Cost-effectiveness acceptability curve (from M&B, 2016)
For a given threshold (WTP), it shows the proportion of time theintervention would be considered cost-effective
31 / 38

Choosing probability distributions
The normal distribution is the first one you learn about but in CEAfew parameters distribute normal
Costs, for example, cannot distribute normal because they have to be> 0 and costs are usually skewed
Utilities and probabilities must be bounded between 0 and 1
Common distributions in PSA are Gamma, Beta, and Log-normal
32 / 38

Example distributions
See Stata code for simulations33 / 38

Characteristics
Gamma: γ(k , θ) has two parameters (shape and scale), support from> 0 to infinity. Used to simulate costs because costs are positive andskewed
Beta: β(a, b) has two shape parameters, support from 0 to 1. Goodfor simulating utilities or probabilities because they are boundedbetween 0 and 1
Log-normal: the exponent of a normal distribution exp(N(µ, σ2)).Support from 0 to infinity
Note: support is also called the domain of a distribution; the rangeof values for which the distribution is defined
34 / 38

How to simulate numbers
Most statistical packages (SAS, Stata, R, Excel) have randomnumbers generators for common distributions
Inverse Transform Method: It is possible to simulate numbers fromany (continuous) distribution by using a uniform random generator
We only need 1) a random generator for the uniform distribution and2) the formula of the inverse cumulative distribution (may not exist inclosed form)
See Excel file for examples
35 / 38

Other ways of presenting and analyzing PSA
Plots of the cost-effectiveness plane and acceptability curves arecommon ways to present results of PSA
But we may want to quantify the relative effect of eachparameter on the uncertainty of the ICER (or incremental cost orincremental benefit)
One approach: run a regression with ICER as the dependent variableand different values of the inputs as predictors to understand therelative contribution of each input
This is called ANCOVA (Analysis of Covariance); present proportionof sum of squares
Another one: Expected Value of Perfect Information (EVPI). Anattempt to quantify the value of perfect information, or theopportunity cost of uncertainty
36 / 38

ANCOVA
From Briggs et al (2006) 37 / 38
Summary
We have used Markov models as examples, but everything we havelearned apply to decision trees
Sensitivity analyses are vital parts of CEA
PSA may be complicated to implement but it is very easy tounderstand
38 / 38