Embed Size (px)
Citation preview
Uncertainty: some concepts and a firearms example
James Yen
Statistical Engineering Division
NIST
1
NIST, the capital of uncertainty?
• Uncertainty has a special meaning at NIST
• It is NIST policy that each measurement result be accompanied by an uncertainty
• Prioritizing uncertainty estimation has enhanced NIST’s scientific and measurement reputation
• Uncertainty characterizes one’s imperfect state of knowledge
2
Uncertainty conceptually
• In a typical metrology situation, there is measurement of a numeric quantity
• Uncertainty (of measurement) is a quantity that “reflects the lack of exact knowledge of the value of the measurand” (GUM)
– GUM is the Guide to the Expression of Uncertainty in Measurement
3

Uncertainty Operationally
• The uncertainty “characterizes the dispersion of the values that could be reasonably attributed to the measurand” (GUM)
• Standard uncertainty: Uncertainty expressed as a a standard deviation
• Combined standard uncertainty incorporates components of uncertainty from various sources: variability of measurements, uncertainty due calibration standards or moisture correction, etc.
4
Expanded Uncertainty
• Expanded uncertainty “provides an interval about the result of a measurement that may be expected to encompass a large fraction of the distribution of values that could be reasonably attributed to the measurand” (GUM)
• Classic example of expanded uncertainty is (2 x Standard Uncertainty) for an interval with 95% confidence
5

Intervals and Probability • What is an interval with 95% confidence?
• One interpretation: It is a procedure that covers the true value 95 % of the time
• Alternatively, the odds are 19-1 in favor of containing the true value
• 80%, 90%, and 99% are also commonly used
6
Non-typical uncertainties at NIST
• Some uncertainties don’t take the “+/- k x uncertainty “ form
• SRM 2461 has a “ACCF > xx.x” uncertainty statement
• Uncertainties could be in the form of a probability
• Uncertainties have been stated qualitatively (with ongoing efforts for a more quantitative approach)
7
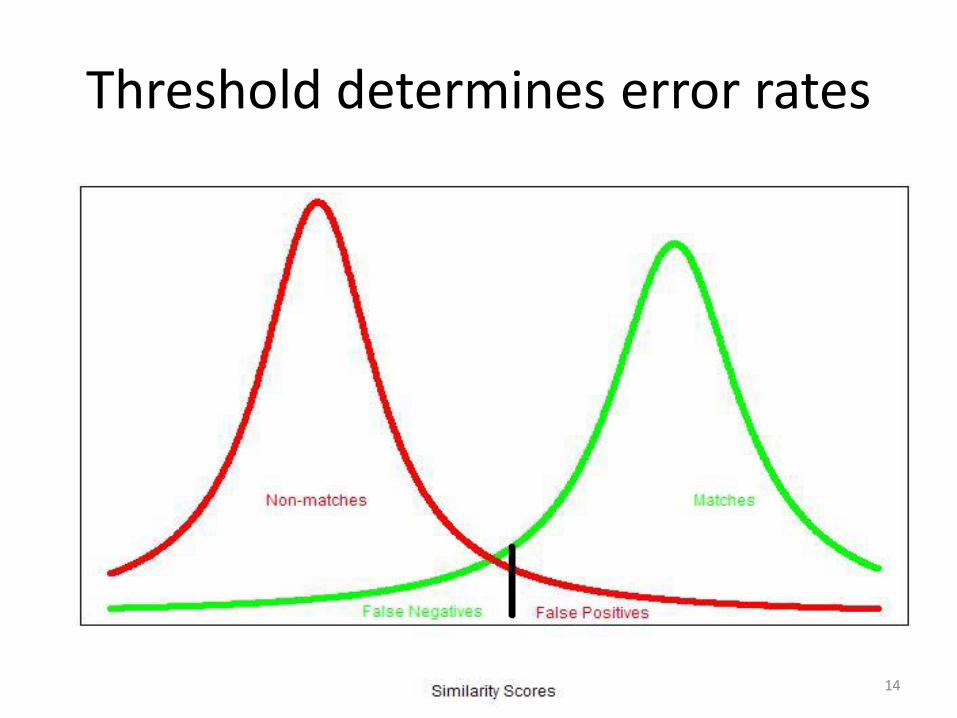
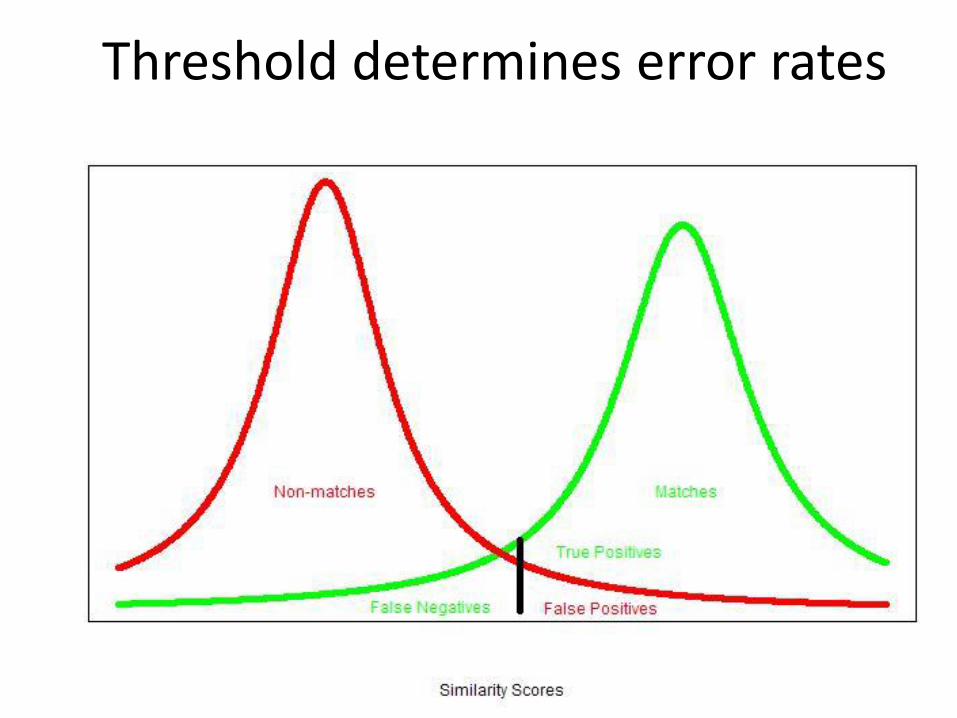
False positives and negatives
• 95% intervals contain those values not rejected by a hypothesis test with “95% significance” ( p-value < 0.05)
• Null Hypothesis : If it were really random, the chances of getting a result this extreme (i.e. this good of a match) is…… – (false positive rate from the ‘background [non-match
distribution’)
• High False negative rates indicates a not very powerful procedure
• Tradeoff between the two error rates
8
Similarity scores
• Quantitative measures of similarity between casings and bullets are being actively researched: Correlation, ACCF, CMS, CMC, number of feature points, etc.
• High=Match, Low=Non-match
9

A possible Matching vs. Non-matching distributions of similarity measures
10
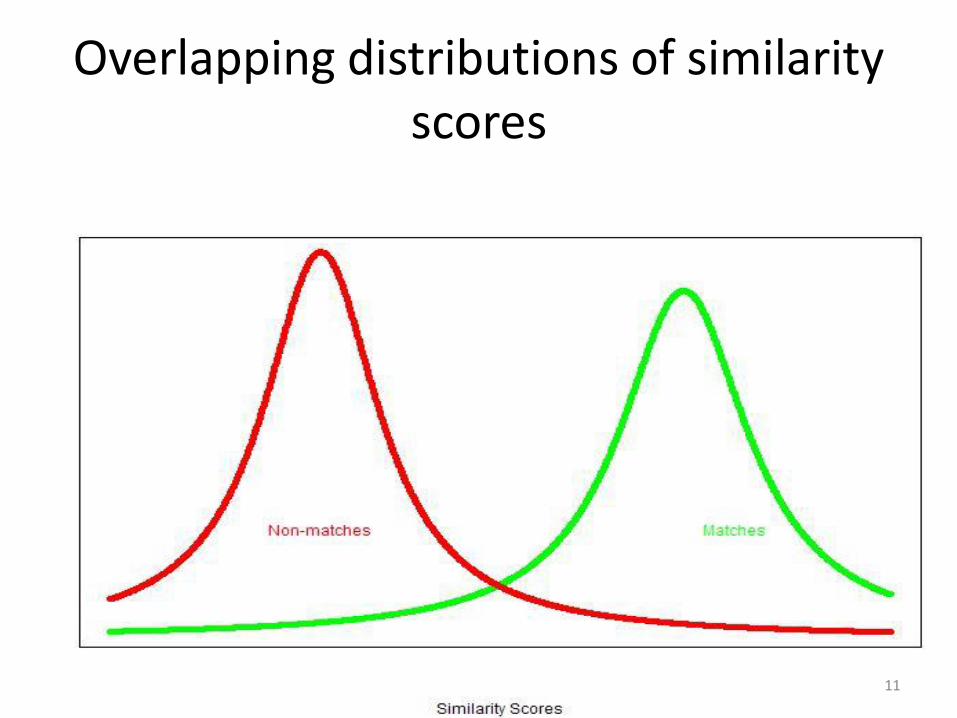
Overlapping distributions of similarity scores
11
Matching and non-matching distributions
• Different pair of distributions for each specific scenario (gun, ammo, etc.)
• We look at the degree of separation or overlap between match and non-match distributions
• There may be scores with uncertain conclusion (inconclusive?)
• What is the threshold(s)?
• Trade off between false positives and false negatives
12
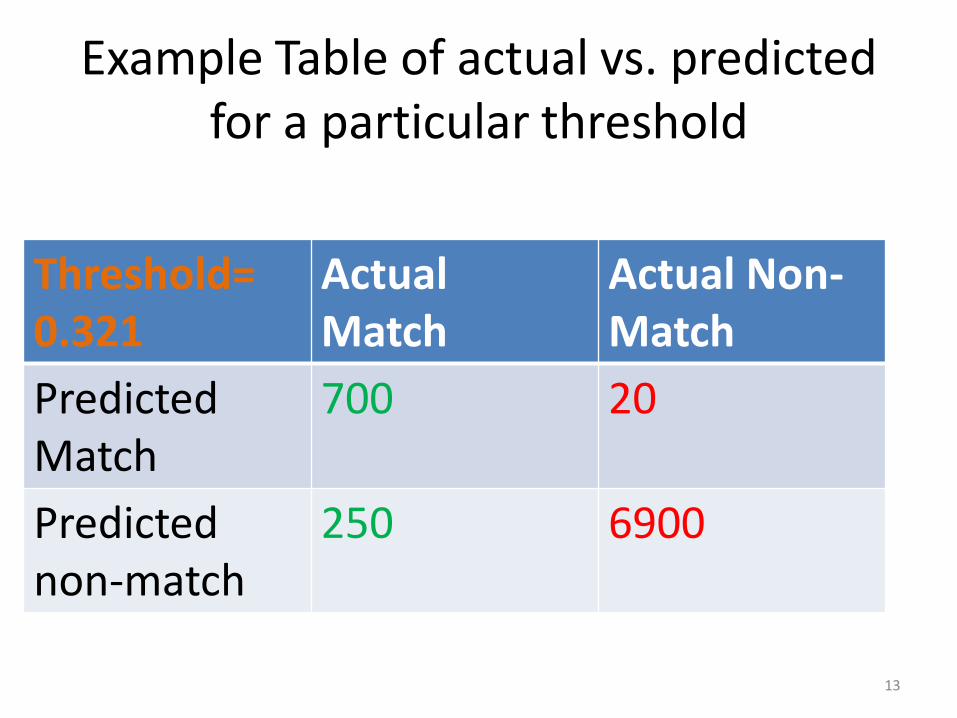
Example Table of actual vs. predicted for a particular threshold
Threshold= 0.321
Actual Match
Actual Non-Match
Predicted Match
700 20
Predicted non-match
250 6900
13
Threshold determines error rates
14
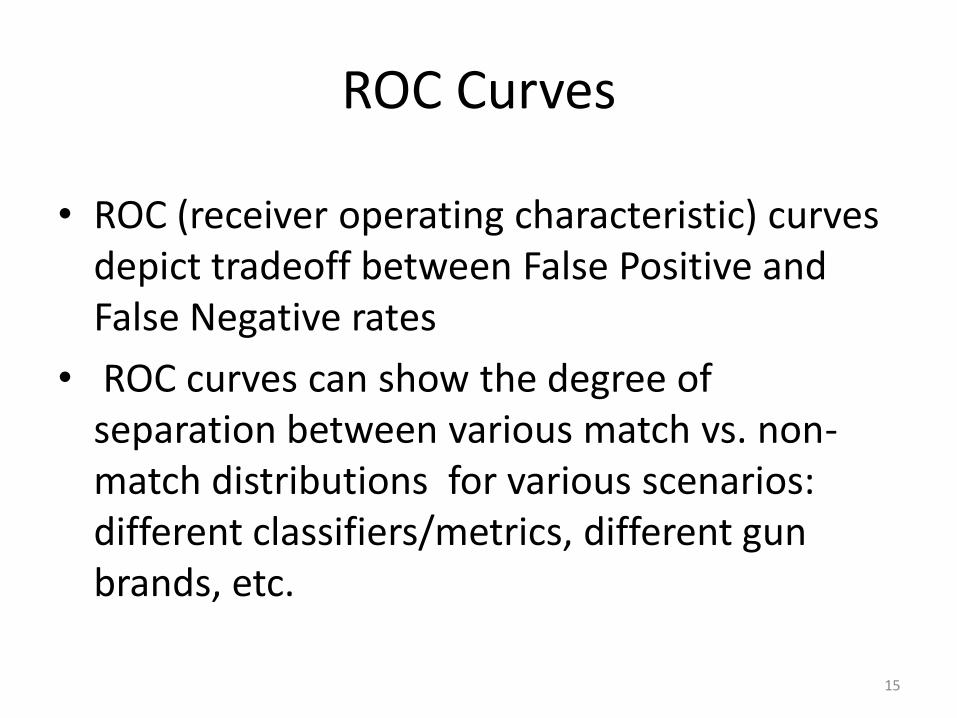
ROC Curves
• ROC (receiver operating characteristic) curves depict tradeoff between False Positive and False Negative rates
• ROC curves can show the degree of separation between various match vs. non-match distributions for various scenarios: different classifiers/metrics, different gun brands, etc.
15
Threshold determines error rates
16
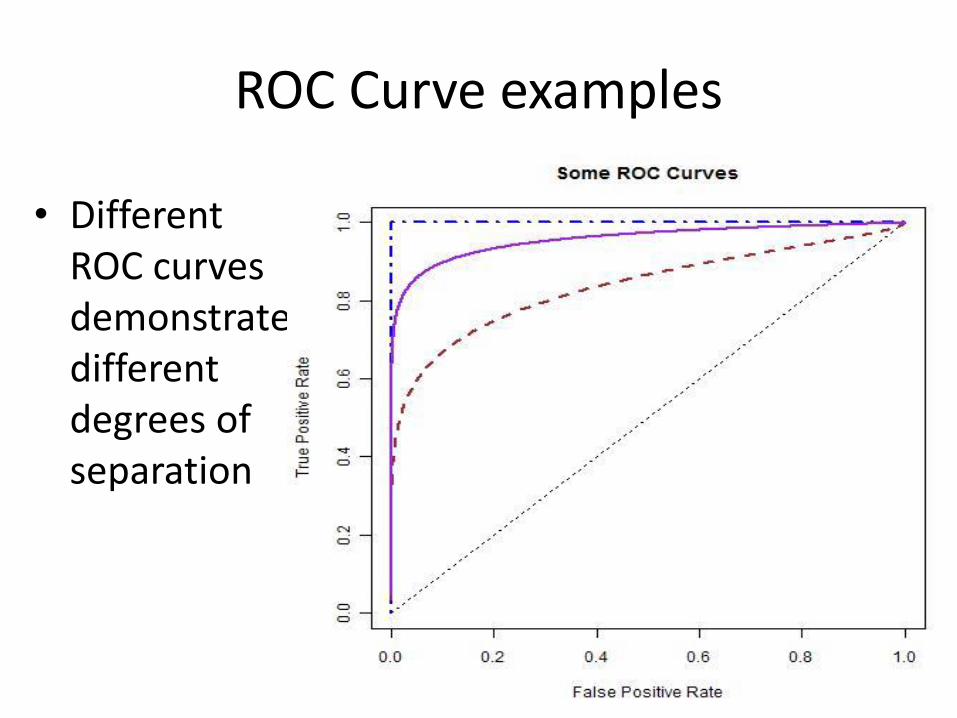
ROC Curve examples
• Different ROC curves demonstrate different degrees of separation
17
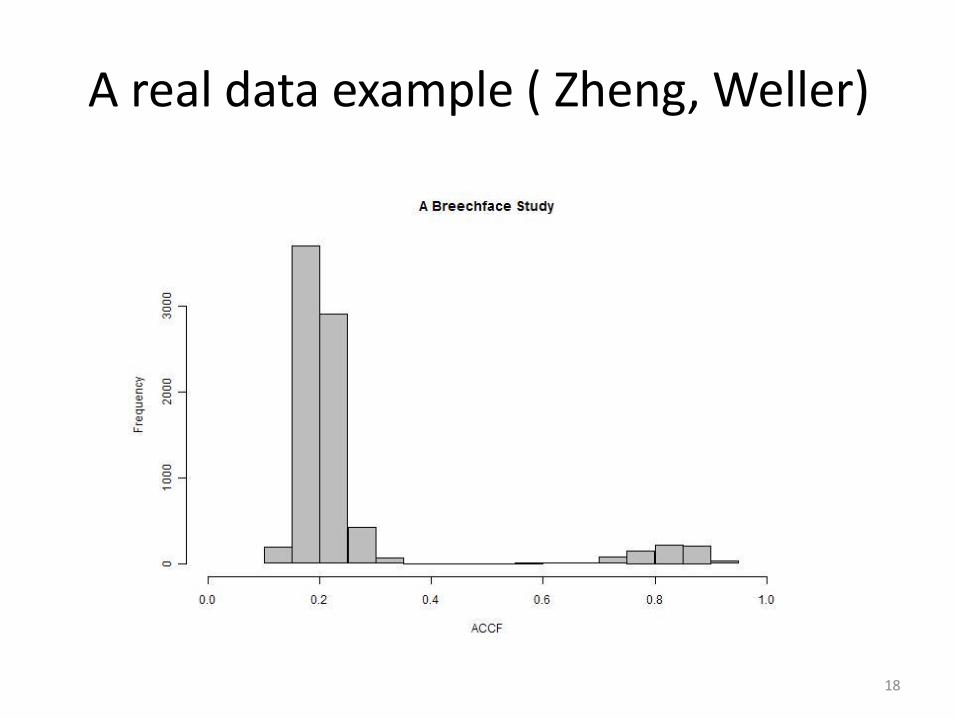
A real data example ( Zheng, Weller)
18
AUC of ROC
• An overlap metric: what is the probability that a randomly chosen non-match score is smaller than a random match score?
• Metric related to Area Under ROC curves (AUC)
• AUC can be estimated various ways: – Fit distributions if they are known
– Use Mann-Whitney procedure (compare every match score to every non-match score and keep score): Equivalent to using empirical distributions
– Integration of area under curve
19

A real data example ( Zheng, Weller)
20
AUC Issues
• One problem with Mann-Whitney procedure: if there is no empirical overlap, estimated AUC=1
• Fitting distributions will estimate AUC<1, but depends on the distribution
• Of course, Uncertainty of AUC estimates can be estimated (bootstrap, etc.)
21
The Future holds…….
• Yet more advanced correlation methods (not just for database searching)
• Databases of topographies leading to databases of match/non-match distributions for various guns, ammunitions, etc.
• Theoretical models of non-match distributions • More repeatability data for similarity measures • In the (far) future, perhaps we can cite probability
statements similar to those in DNA analysis (at least for confirmation)
22