Embed Size (px)
Citation preview

UNCLASSIFIED
UNCLASSIFIED
Activity and Cost Analysis of a Scheduling Problem
Terry WeirJoint Operations Division

UNCLASSIFIED
UNCLASSIFIED
Outline
Introduction Background Problem Data Regression Analysis Simulations Summary

UNCLASSIFIED
UNCLASSIFIED
Introduction
A sample of previous activity and costing studies
Topic Theme Client Report
RAN Fleet Aviation Management Study 1999 Rate of Effort Costs RAN NAFMR
Collins Class Cost of Ownership Sustainment COLSPO DSTO-TR-2131
Collins Class Activity Analysis Readiness CDG DSTO-CR-2012-0230
Parameterisation of the ASW Mission Operational Planning ALG DSTO-TR-2413
Preparedness Modelling and Analysis Tool - Phase 1 Preparedness Management DGDPREP DSTO-TR-2011-0314
Fleet Costing Study 2000 Fleet Options Costing FASRFP
Quantifying Current Aggregate Sea Training Requirements of the Fleet 2010 Collective Training FHQ
KPMG PAL Review (ANZAC Detailed Force Element Review) 2009 Preparedness Management DGDPREP
Productivity Measurement in the Royal Australian Navy: A Preliminary Analysis (CEPA) Productivity Management SCFEG
A Statistical Activity Cost Analysis of a Fleet Scheduling Problem 2010 Fleet Activity Costing NHQ
Engineering Asset Management and
Infrastructure Sustainability
UNCLASSIFIED
UNCLASSIFIED
ReferencesCooper, R., (1988) The rise of activity-based costing – part one: what is an activity-based cost system? Journal of Cost Management, 2, 45-54
Noreen, E., (1991) Conditions under which activity-based cost systems provide relevant costs, J. Man. Acc. Res, Fall, 159-168
Willett, R.J. (1987). An axiomatic theory of accounting measurement. Acc. Bus. Res., 17, 155–171
Willett, R.J. (1988). An axiomatic theory of accounting measurement—part II. Acc. Bus. Res., 19, 79–91
Colin, A., Lambrineas, P., Weir, T. and Willet, R.J. (2011) Statistical Activity Cost Regression Analysis of a Scheduling Problem, in J. Mathew et al. (eds.), Engineering Asset Management and Infrastructure Sustainability, pp 121-131, Springer-Verlag London Limited
Amadi-Echendu , J., Willett, R. J., Brown, K., Matthew, J., Vyas, N. and Yang, B-S. (2010) What Is Engineering Asset Management? In Amadi-Eschendu et al. (eds) Engineering Asset Management Review 1, Definitions, concepts and scope of engineering asset management pp 3-16, Springer-Verlag London Limited.

UNCLASSIFIED
UNCLASSIFIED
Background to this studyTraditional cost accounting
Costs allocated to products based on volume of product or output
Simple to use Little computing power needed
Activity based costing (see eg Cooper 1988) Activities generate costs Two stage allocation
– Activities– Products or outputs
Greater segmentation of costs & fidelity Higher computation requirements Questions over appropriateness of activities Conditions for accuracy and cost separation are very
strong (Noreen 1991)
Both methods suffer from arbitrary allocations and assume recorded costs are deterministic

UNCLASSIFIED
UNCLASSIFIED
Statistical Activity Cost Analysis (Willett 1987, 1988) Axiomatic model addresses:
– Transaction costs– Continuity of production relations– Separability of production relations
Background
C
t
Activity
Costs
timett -1
a0
a2
a1
Asset at t-1
Equity at t
Asset at t
Asset at t-1
Asset at t
Can recover all accounting arithmeticCosts are random variablesApplication to earnings, depreciation and goodwillApplication to reliability analysis, portfolio budgeting and scheduling
R. Willet 2004
UNCLASSIFIED
UNCLASSIFIED
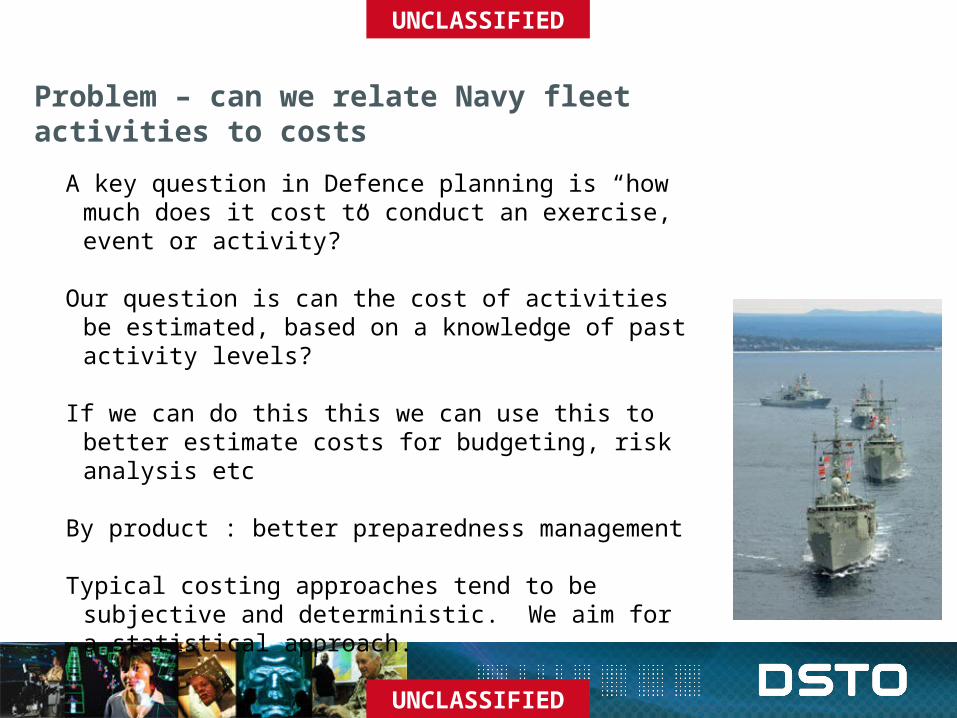
Problem – can we relate Navy fleet activities to costs
A key question in Defence planning is “how much does it cost to conduct an exercise, event or activity?”
Our question is can the cost of activities be estimated, based on a knowledge of past activity levels?
If we can do this this we can use this to better estimate costs for budgeting, risk analysis etc
By product : better preparedness management
Typical costing approaches tend to be subjective and deterministic. We aim for a statistical approach.

UNCLASSIFIED
UNCLASSIFIED
Data Navy Activities
FAMT provides data for the ‘activity’ dimension
Fleet activities generate Navy outputs
Activity data can be described by multiple parameters: duration, type, location, operation….

UNCLASSIFIED
UNCLASSIFIED
DataCosts
Data sourced from Defence ERP systems ROMAN, JFL, SDSS/MILIS, COMSARM, PMKEYS, ADFPAY, CENRESPAY
Consolidated in Navy’s Activity Based Management System
Costs categorised by ship class and expense type
Costs aggregated by quarter
UNCLASSIFIED
UNCLASSIFIED
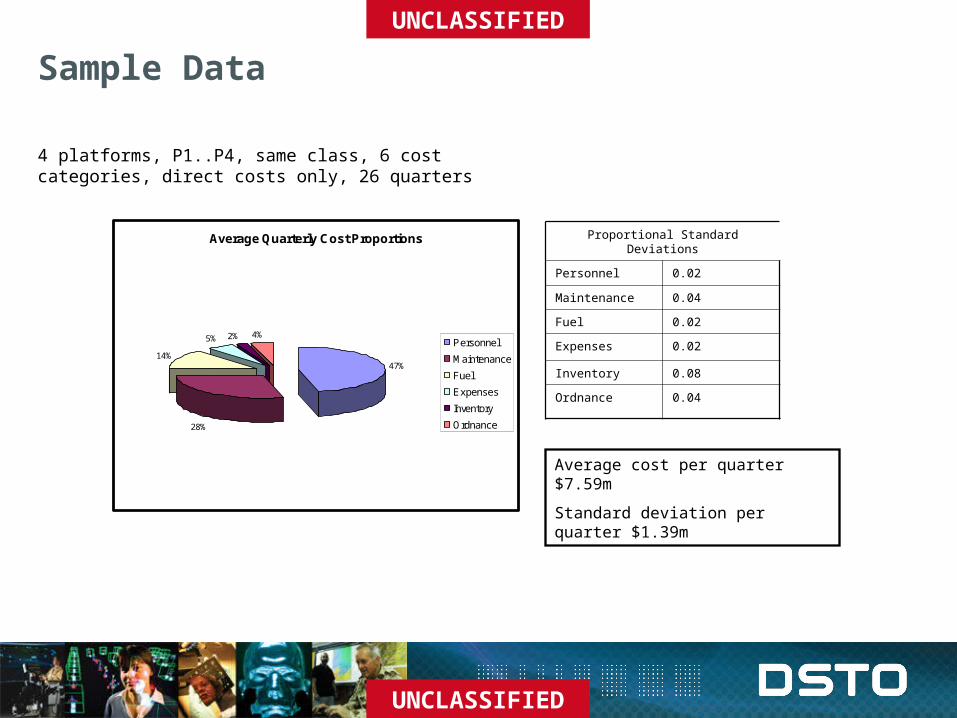
Sample Data
4 platforms, P1..P4, same class, 6 cost categories, direct costs only, 26 quarters
Proportional Standard Deviations
Personnel 0.02
Maintenance 0.04
Fuel 0.02
Expenses 0.02
Inventory 0.08
Ordnance 0.04
Average Quarterly Cost Proportions
47%
28%
14%
5% 2% 4%Personnel
Maintenance
Fuel
Expenses
Inventory
Ordnance
Average cost per quarter $7.59m
Standard deviation per quarter $1.39m

UNCLASSIFIED
UNCLASSIFIED
Observed correlations
Average correlations between cost categories
Total Fuel Expenses
Inventory
Ordnance
Personnel Maintenance
Total 1.00
Fuel 0.30 1.00
Expenses 0.17 0.22 1.00
Inventory 0.39 -0.15 -0.28 1.00
Ordnance 0.46 0.03 -0.02 0.39 1.00
Personnel 0.61 0.13 0.51 -0.05 0.32 1.00
Maintenance
0.51 -0.23 -0.13 0.28 0.05 -0.19 1.00
Cost
Cost
M
I ?
EF
PO ?

UNCLASSIFIED
UNCLASSIFIED
RegressionWhen durations of events are included: No simple contemporaneous relationship between
costs and events in current time periods But if lags are considered, a systematic pattern
emerges Simple model:
, , , , 1 , 1 , 2 , 2 , 3 , 3i t i i t i t i t i t i t i t i t i t iY A A A A
Yi,t are the costs in each category
Ai,t are the away from home port times
i are the fixed costs
i,t are prices of variable away times
Current costs depend on past activities! This is not what is expected from ABC!
UNCLASSIFIED
UNCLASSIFIED
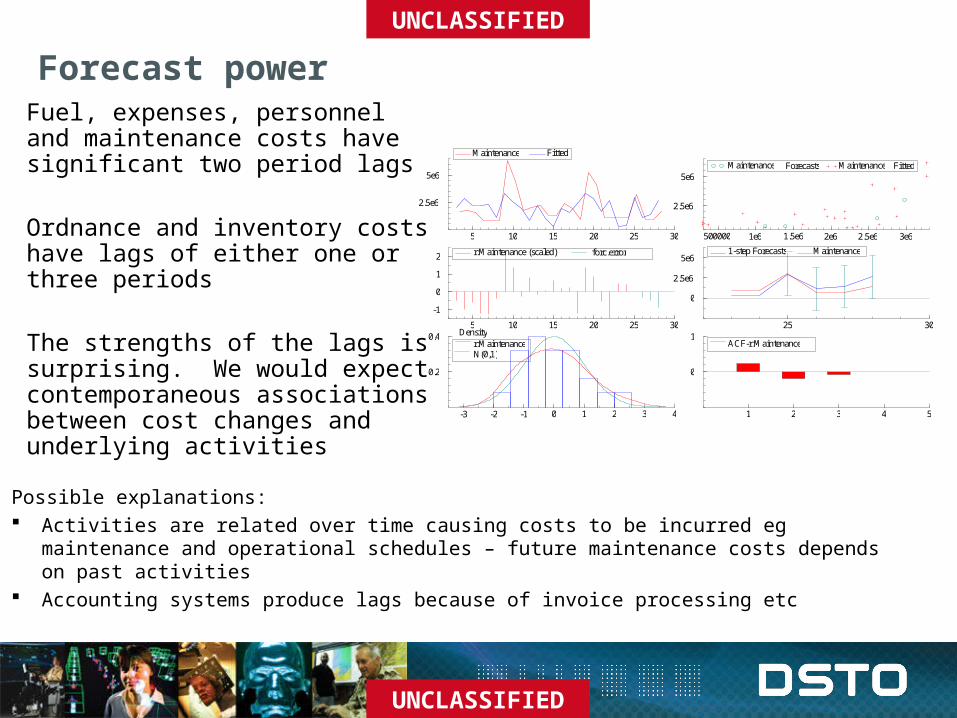
Forecast powerFuel, expenses, personnel and maintenance costs have significant two period lags
Ordnance and inventory costs have lags of either one or three periods
The strengths of the lags is surprising. We would expect contemporaneous associations between cost changes and underlying activities
5 10 15 20 25 30
2.5e6
5e6
Maintenance Fitted
500000 1e6 1.5e6 2e6 2.5e6 3e6
2.5e6
5e6 Maintenance Forecasts Maintenance Fitted
5 10 15 20 25 30 -1 0 1 2 r:Maintenance (scaled) forc.error
25 30
0
2.5e6
5e6 1-step Forecasts Maintenance
-3 -2 -1 0 1 2 3 4
0.2
0.4 Density r:Maintenance N(0,1)
1 2 3 4 5
0
1 ACF-r:Maintenance
Possible explanations: Activities are related over time causing costs to be incurred eg maintenance and
operational schedules – future maintenance costs depends on past activities Accounting systems produce lags because of invoice processing etc

UNCLASSIFIED
UNCLASSIFIED
Forecast powerMore advanced model Costs as a function of alongside time, at sea time, maintenance
time Again statistically significant lagged relationships But the improvement is not remarkable
Simply adding more data does not necessarily improve forecast power
2000 2005 0
1e6
2e6
C f , t = 1 6 1 5 0 2 0 - 1 2 4 6 4 A a , t - 1
- 1 5 0 7 3 A m , t - 1 FuelDeflated Fitted
250000 500000 750000 1e6 1.25e6 1.5e6 0
1e6
2e6 FuelDeflated Fitted
FuelDeflated Forecasts
2000 2005 -1 0 1 2 Residuals:
FuelDeflated (scaled) Forecast error
2005 2006 2007 0
1e6
2e6 1-step Forecasts FuelDeflated
-2 -1 0 1 2 3 4
0.2
0.4
Density Residuals:FuelDeflated N(0,1)
0 5
0
1 ACF-Residuals:FuelDeflated

UNCLASSIFIED
UNCLASSIFIED
Simulations
SACA is based upon the objective of providing an improved description of the relationships between physical processes and financial measurements.
In this it is similar to activity based costing.
SACA integrates statistical theory into the analysis of these relationships.
If alternate attributes such as capability or risk measures can be related to physical tasks, then we can model the interaction of costs, capability and risk

UNCLASSIFIED
UNCLASSIFIED
Example Simple Simulation
We assume ‘Capability’ is a decaying function of time from last major maintenance. Capability is refreshed in maintenance
The simulator generates events
Maintenance periods are quarterly or biannual
Platform activities are uniformly distributed over a six month period beginning with the start of maintenance
The duration of maintenance periods are randomly generated from a beta distribution
Platform activities arrive randomly conditional upon their planned maintenance; non-zero probabilities of multiple platforms in maintenance simultaneously
Costs are generated using the away times generated by the maintenance schedules
Overall fleet capability is measured on a daily basis by averaging individual daily capability
Ships
P1
P2
P3
P4
Simulated Maintenance and Away Periods
Time
Beta Distribution
0
0.5
1
1.5
2
2.5
3
0 0.2 0.4 0.6 0.8 1

UNCLASSIFIED
UNCLASSIFIED
Example Sample Simulation
22.5
23
23.5
24
24.5
25
0 0.1 0.2 0.3 0.4 0.5 0.6 0.7 0.8 0.9 1
Capability
Cost (Arb. $)
Three month schedule Six month schedule

UNCLASSIFIED
UNCLASSIFIED
Summary & ConclusionsGood results exhibit potential to use SACA in modelling cost and activity data
The model demonstrated here has a fixed and variable component. Better understanding of ‘cost drivers’ will enable models to eliminate lags as much as possible
Capability and capacity metrics can be utilised in simulations based on SACA
Automation of data capture etc should allow for decision support tools
Direct applicability to cost generation in FAMT
5 10 15 20 25 30
2.5e6
5e6
Maintenance Fitted
500000 1e6 1.5e6 2e6 2.5e6 3e6
2.5e6
5e6 Maintenance Forecasts Maintenance Fitted
5 10 15 20 25 30 -1 0 1 2 r:Maintenance (scaled) forc.error
25 30
0
2.5e6
5e6 1-step Forecasts Maintenance
-3 -2 -1 0 1 2 3 4
0.2
0.4 Density r:Maintenance N(0,1)
1 2 3 4 5
0
1 ACF-r:Maintenance
, , , , 1 , 1 , 2 , 2 , 3 , 3i t i i t i t i t i t i t i t i t i t iY A A A A
22.5
23
23.5
24
24.5
25
0 0.1 0.2 0.3 0.4 0.5 0.6 0.7 0.8 0.9 1
Capability
Cost (Arb. $)
Three month schedule Six month schedule