Embed Size (px)
Citation preview
AD
UNCLASSIFIED
4 5062 1
DEFENSE DOCUMENTATION CENTER FOR
SCIENTIFIC AND TECHNICAL INFORMATION
CAMERON STATION ALEXANDRIA. VIRGINIA
UNCLASSIFIED
NOTICE: When goveranent or other drawings, speci- fications or other data are used for any purpose other than in connection with a definitely related govermnent procurement operation, the U. S. Government thereby incurs no responsibility, nor any obligation whatsoever; and the fact that the Govern- ment may have fonnulated, furnished, or in any way supplied the said drawings, specifications, or other data is not to be regarded by implication or other- wise as in any manner liceiidin^ the holder or any other person or corporation, or conveying «my rights or pemission to manufacture, use or sell any patented invention that may in any way be related thereto.
BEST AVAILABLE COPY
, ..
v-w' '■■-■■"v^^. ■'-"• ^
5 JS
^RAFFICABILITY TESTS WITH THE MARSH SCREW AMPHtBiAN ON
GRAINED AND FINE-GRAINED SOILS
450621
T6CHNICAL RiPORT NO. 3-6*1 m
Jtauwy (964
SpenMr*d by
Advanced Rwwarch Project» Agency ARPA Old« N» 400
Pm^g
air? m\A D
U. S. Army Engineer Weterwej« ExpensniMit: Station CORPS OF ENSINiiRS
Vicksburg, Mississippi
. ■-r-i"v<,iy ■.,:■■:,.;;:,,■..-.:-^ ■,, ■ -.^ ■\.±!t.: ■■■■>jy.:-::''■■■■■■■. ■'.■■.■J-:\ ■■■■■■■■'■:■..::■*,■ i-'fi ;' ■
mc kvmmity ffotwi.
THE CONTENTS OF THIS REPORT ARE NOT TO BE
USED FOR ADVERTISING, PUBLICATION, OR
PROMOTIONAL PURPOSES
PREFACE
The trafficability tests with the Marsh Screw Amphibian reported
herein were requested by the Advanced Research Projects Agency (ARPA) in a
letter to U. S. Army Materiel Command dated 9 August I963. Funds were pro-
vided under ARPA order No. kOO, amendment No. k. The tests were conducted
at four sites within a 20-mile radius of Vicksburg, Miss., during the
period 22 August-23 October 1963 by personnel of the U. S. Army Engineer
Waterways Experiment Station, Army Mobility Research Branch, under the gen-
eral supervision of Messrs. W. J. Turnbull, Technical Assistant for Soils
and Environmental Engineering; W. G. Shockley, Chief of the Mobility and
Environmental Division; S. J. Knight, Chief of the Army Mobility Research
Branch; and E. S. Rush, Acting Chief of the Trafficability Section.
Messrs. A. B. Thompson and B. G. Stinson of the Trafficability Section
supervised the field testing. This report was prepared by Messrs. Knight,
Rush, and Stinson. This program was conducted under the sponsorship and
guidance of the Directorate of Research and Development, U. S. Army Mate-
riel Command.
Acknowledgment is made to the Office of Naval Research for its part
in making the Marsh Screw available and to personnel of Chrysler Corpora-
tion Defense Engineering, builders of the Marsh Screw, for assistance and
support during the tests.
Col. Alex G. Sutton, Jr., CE, was Director of the Waterways Experi-
ment Station during the testing program and preparation of this report.
Mr. J. B. Tiffany was Technical Director.
iii
CONTENTS
Page
PREFACE iil
SUMMARY vli
PART I: BACKGROUND, PURPOSE, AND SCOPE 1
Background 1 Purpose 2 Scope 2
PART II: DESCRIPTION OF THE MARSH SCREW AMPHIBIAN 3
Vehicle Characteristics k Propulsion System 5 Driver's Observations of Vehicle Performance 6
PART III: TEST PROGRAM 7
Location and Description of Test Areas 7 Soils Tested 10 Tests Conducted 10 Test Procedures and Data Collected 10
PART IV: ANALYSIS OF DATA 15
Tests on Coarse-Grained Soils 15 Tests on Fine-Grained Soils 22 Tests in Water 1+6 Tests in Transitional Zone Between Deep Water
and Water-Free Soil Surfaces 1+6
PART V: CONCLUSIONS AND RECOMMENDATIONS 1+8
Conclusions 1+8 Recommendations 51
TABLES 1-6
PLATES 1-11+
APPENDIX A: DETERMINATION OF VEHICLE CONE INDEX FOR MARSH SCREW AMPHIBIAN Al
Mobility Index Al Vehicle Cone Index A2
APPENDIX B: DISCUSSION AND COMPUTATIONS OF THE POWER TRAIN SYSTEM Bl
SUMMARY
The Marsh Screw Amphibian is of interest in the Army's mobility re- search program because of its unusual concept of locomotion vhich is based on the Archimedean screw. It moves by means of two counterrotating rotors which give forward and backward thrust to the vehicle. When both rotors are made to turn in the same direction, the vehicle will move laterally; however, there is no provision for steering when the vehicle is moving laterally.
Trafficability tests with the Marsh Screw were performed to determine its performance on three soil types: sand, clay, and silt. Repetitive- pass tests and speed tests were conducted on clay and sand; towing tests on clay, silt, and sand; slope-climbing tests on sand; and obstacle tests on silt. For comparison, tests with an M29C weasel were conducted and performance curves from previous test programs were utilized. Test re- sults indicate that:
a. On sand the Marsh Screw, unloaded, could travel although progress was labored and speed was LIOW; loaded, it could not travel in reverse because of a lower torque multiplica- tion ratio in the transmission reverse gear. It could tow a reasonable load or climb a reasonable slope, but at only ap- proximately 0.5 mph.
b. In fine-grained soil the Marsh Screw could travel on ex- tremely low soil strengths (lower than any vehicle previously tested) provided free water was present, but on soils with no free water present it became immobilized in soft, sticky con- ditions and firm conditions because of inadequate power.
c. The Marsh Screw could travel laterally on all soil conditions except those of very low strengths, but could not be steered.
d. Obstacle crossing ability of the Marsh Screw on simulated rice-field dikes was poor because of its unsprung suspension system.
Appendix A presents a detailed description of the determination of mobility indexes and vehicle cone index for the Marsh Screw. Appendix B discusses the power train system.
vii
TRAFFICABILITY TESTS WITH TEE MARSH SCREW AMPHIBIAN
ON COARSE-GRAINED AMD FIKE-GRAIMED SOILS
PART I: BACKGROUND, PURPOSE, AND SCOPE
Background
1. The Marsh Screw Amphibian is an experimental vehicle designed to
operate in marshy soils and water. Its unusual propulsion system, consist-
ing of two threaded pontoons, has never before been incorporated into a
full-size, working vehicle. Two counterrotating rotors give forward and
backward thrust to the vehicle, and when both rotors turn in the same
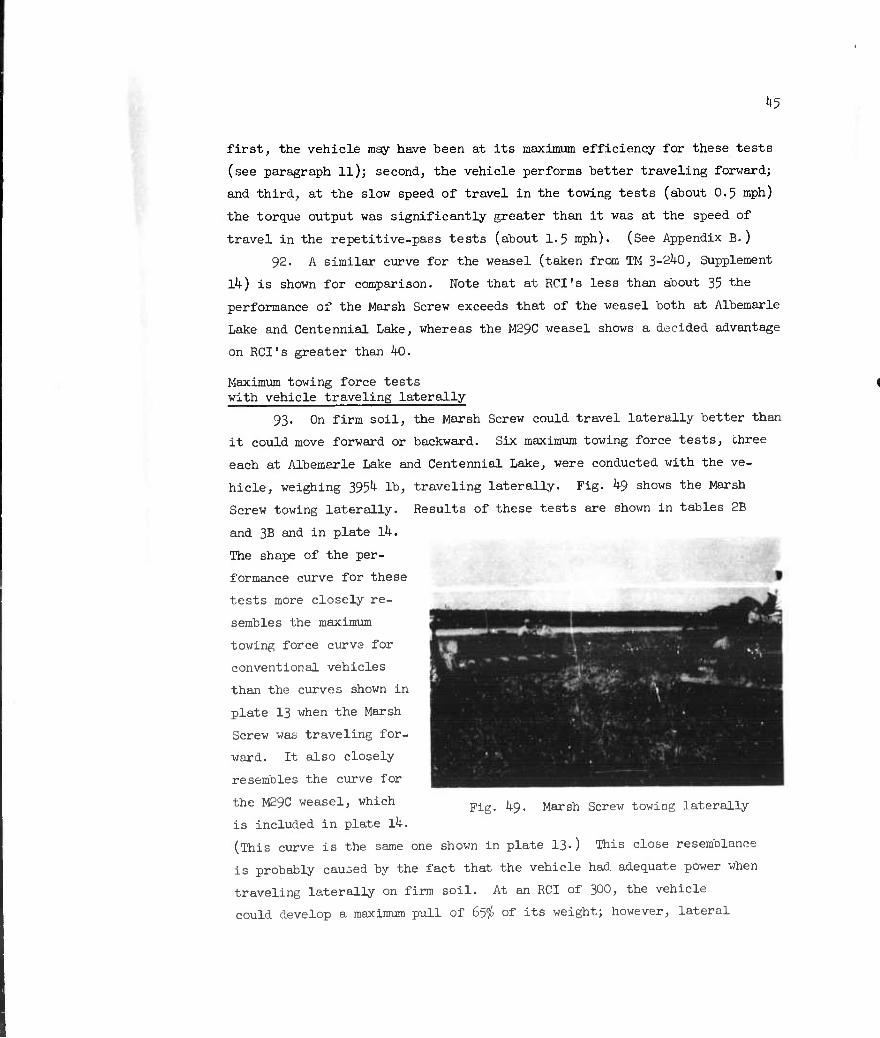
direction, the vehicle will move laterally. However, there is no provision
for steering when the vehicle is moving laterally. The vehicle was de-
signed and built by Chrysler Corporation Defense Engineering for the
Bureau of Ships, Department of the Navy, under contract No. NObs '+558,
Code 529V. Requirements for the vehicle and funds for its development
originated at the Advanced Research Projects Agency (ARPA).
2. The Marsh Screw Amphibian was subjected by its builders to con-
siderable testing on water, marshland, tidal mud flats, sand, and snow, and
in some cases, up slopes and across ditches. The tests showed the vehi-
cle to have good performance characteristics in water, marshland, tidal mud
flats, and snow, but low performance levels in sand and firm, dry, fine-
grained soils.
3. Since quantitative measurements of terrain conditions were not
made in the Chrysler testing program, it was impracticable to compare di-
rectly the Marsh Screw's performance with that of other vehicles on similar
terrain conditions. Accordingly, the U. S. Navy Bureau of Ships requested
the Waterways Experiment Station (WES) to undertake a limited program of
testing with the Marsh Screw on soil conditions occurring near Vicksburg,
Miss. Because of the vehicle's unusual method of propulsion, the Marsh
Screw was of Interest to the WES in connection with Its mobility research
program.
Purpose
k. The primary purpose of the test program was to determine quanti-
tatively the performance of the Marsh Screw Amphibian in soft soils. Of
particular importance was the determination of the minimum soil strength
required for the vehicle to propel itself (vehicle cone index, VCl). Other
measures of vehicle performance investigated were towing force, slip,
speed, maneuverability, and slope-climbing ability. Soil end terrain
parameters measured were strength, moisture content, slope, and vegetation.
Establishmen+ of these quantitative vehicle-soil-terrain relations will
facilitate comparison of the Marsh Screw's performance with that of the
many military wheeled and tracked vehicles that have been tested by the WES.
Scope
5. Tests were conducted with the Marsh Screw at two different
weights, on three soil types ranging from heavy clay to fine sand, in the
vicinity of Vicksburg, Miss., during the period 22 August-23 October I963.
Twelve tests with an M29C weasel also were conducted for comparative
purposes.
6. The scope of the program was limited by the soil conditions that
prevailed during the test period. The program, therefore, should not be
considered as an exhaustive testing of the Marsh Screw.
PART II: DESCRIPTION OF THE MARSH SCREW AMPHIBIAN
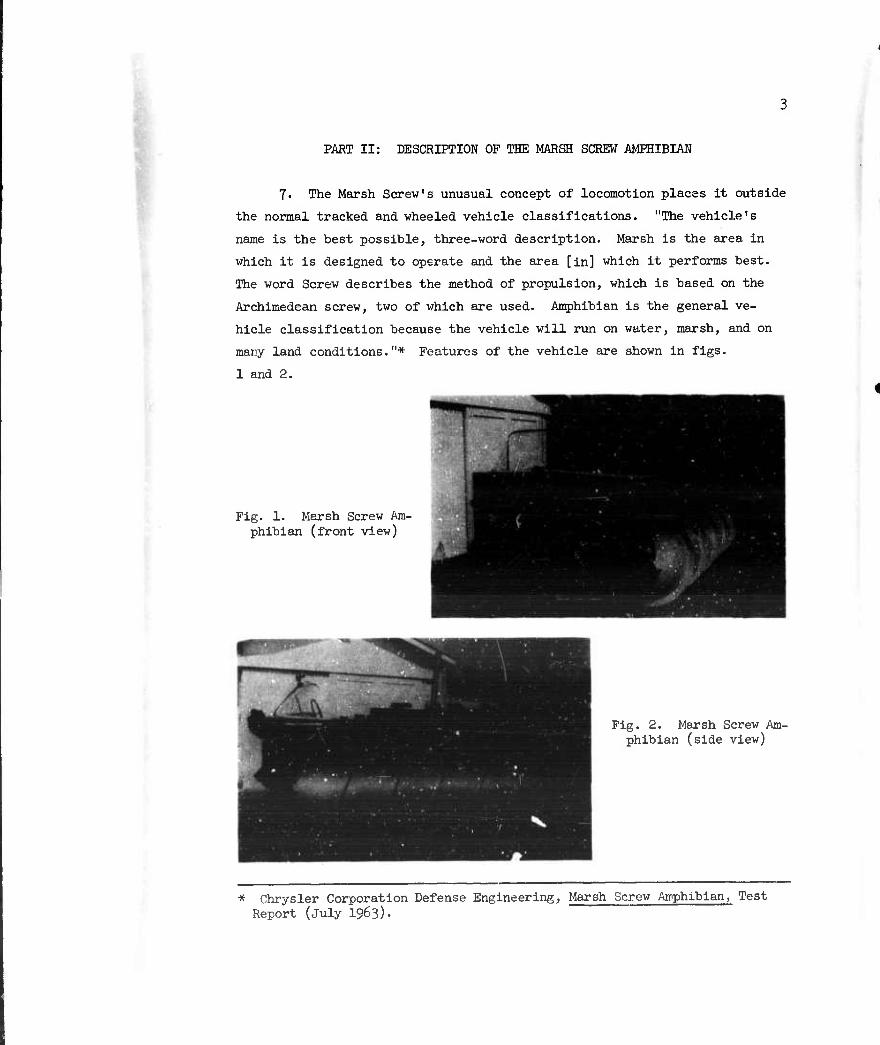
7. The Marsh Screw's unusual concept of locomotion places it outside
the normal tracked and wheeled vehicle classifications. "The vehicle's
name is the best possible, three-word description. Marsh is the area in
which it is designed to operate and the area [in] which it performs best.
The word Screw describes the method of propulsion, which is based on the
Archimedean screw, two of which are used. Amphibian is the general ve-
hicle classification because the vehicle will run on water, marsh, and on
many land conditions."* Features of the vehicle are shown in figs.
1 and 2.
Fig. 1. Marsh Screw Am- phibian (front view)
Fig. 2. Marsh Screw Am- phibian (side view)
* Chrysler Corporation Defense Engineering, Marsh Screw Amphibian, Test Report (July 1963)-
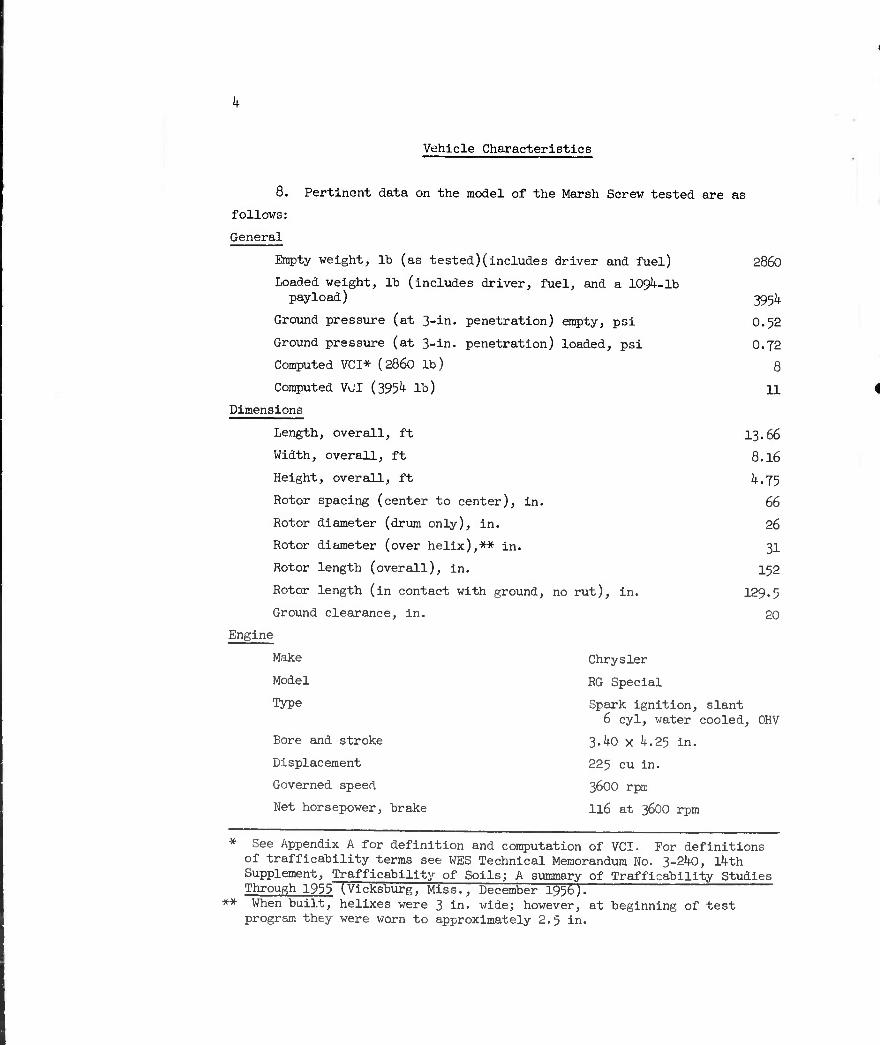
Vehicle Characteristics
8. Pertinent data on the model of the Marsh Screw tested are as
follows:
General
Empty weight, lb (as tested)(includes driver and fuel) 2860
Loaded weight, lb (includes driver, fuel, and a 1094-lb payload) 3954
Ground pressure (at 3-in. penetration) empty, psi O.52
Ground pressure (at 3-in. penetration) loaded, psi 0.J2
Computed VCI* (2860 lb) 8
Computed VOI (395^ lb) 11
Dimensions
Length, overall, ft 13.66
Width, overall, ft 8.16
Height, overall, ft 4.75
Rotor spacing (center to center), in. 66
Rotor diameter (drum only), in. 26
Rotor diameter (over helix),** in, 31
Rotor length (overall), in. 152
Rotor length (in contact with ground, no rut), in. 129.5
Ground clearance, in. 20
Engine
Make Chrysler
Model RG Special
Type Spark ignition, slant 6 cyl, water cooled, OHV
Bore and stroke 3.k0 x 4.25 in.
Displacement 225 cu in.
Governed speed 36OO rpm
Net horsepower, brake 116 at 36OO rpm
* See Appendix A for definition and computation of VCI. For definitions of trafficability terms see WES Technical Memorandum No. 3-240, l^th Supplement, Trafficability of Soils; A summary of Trafficability Studies Through 1955 ^Vicksburg. Miss.. December 1QS6).
** When built, helixes were 3 in. wide; however, at beginning of test program they were worn to approximately 2.5 in.
Power train
Transmission: Chrysler torqueflite model A-727, 3-speed transmission with electric clutch/brake controlled by a steering wheel through a chain-driven, double-reduction final drive, ratio 6.55:1.
Electrical system
12-volt/w alternator
Materials
Body and rotors
Engine block
Transmission housing
Final drive housing
6o6l T6 aluminum
Aluminum
Aluminum
Aluminum
Propulsion System
Tractive elements
9. The principle of propulsion of the Marsh Screw is the worm
(Archimedes screw). The vehicle travels on two tapered-end cylinders or
rotors. Each rotor is filled with polyurethane foam to prevent entry of
water in case of puncture of the thin metal skin. The ends of the rotors
are truncated to provide a flat section for attaching hull supports. Two
helical blades are welded to each rotor in a continuous pattern from front
to rear. The lead of the helix (the distance the inclined helix travels in
one complete circle around the rotor) is k8 in., and the helix angle is ap-
proximately 32 degrees with the vertical. The rotors are counterrotated to
give forward or backward thrust to the vehicle. Turning is accomplished by
reducing power and applying brakes to one rotor while applying power to the
other. When both rotors are made to turn in the same direction, the ve-
hicle will move laterally; however, there is no provision for steering the
vehicle while it is moving laterally.
Power train
10. Power is transmitted from the engine through a torque converter
and transmission system to a final chain drive connected to each rotor.*
* For discussion and computations, see Appendix B.
Driver's Observations of Vehicle Performance
11. Ona driver, a man with more than 20 years experience as a ve-
hicle operator and mechanic, operated the Marsh Screw Amphibian throughout
the entire test program. During the course of the tests, the driver made
the following qualitative observations on vehicle performance:
a. When the engine was operating at greater than 1500 rpm, there was no overheating. When the engine was operating at less than 1500 rpm, overheating usually occurred.
b. In periods of engine overheating, the torque converter fluid also became heated. The thinner, heated fluid apparently- caused a net reduction of power to the rotors.
£. During the test program the vehicle could sometimes tow an appreciable load in the same soil condition in which it was barely able to propel Itself. The driver's observation was that the engine efficiency was higher during the towing tests because the engine had time to cool between tests (while personnel examined recorder tapes, etc.) whereas during other tests the vehicle often operated with a hotter engine.
d. The vehicle did not have enough power to propel Itself for- ward at low gear in firm, dry soils.
e. The steering mechanism was not very effective in maneuvering the vehicle.
f. The vehicle appeared to travel with less strain in forward gear than in reverse gear, especially when deep rutting was occurring.
PART III: TEST PROGRAM
Location and Description of Test Areas
12. The test areas were located on a Mississippi River beach and at
Albemarle Lake, Centennial Lake, and the WES. All test areas were within a
20-raile radius of Vicksburg, Miss, (see plate l).
Mississippi River beach
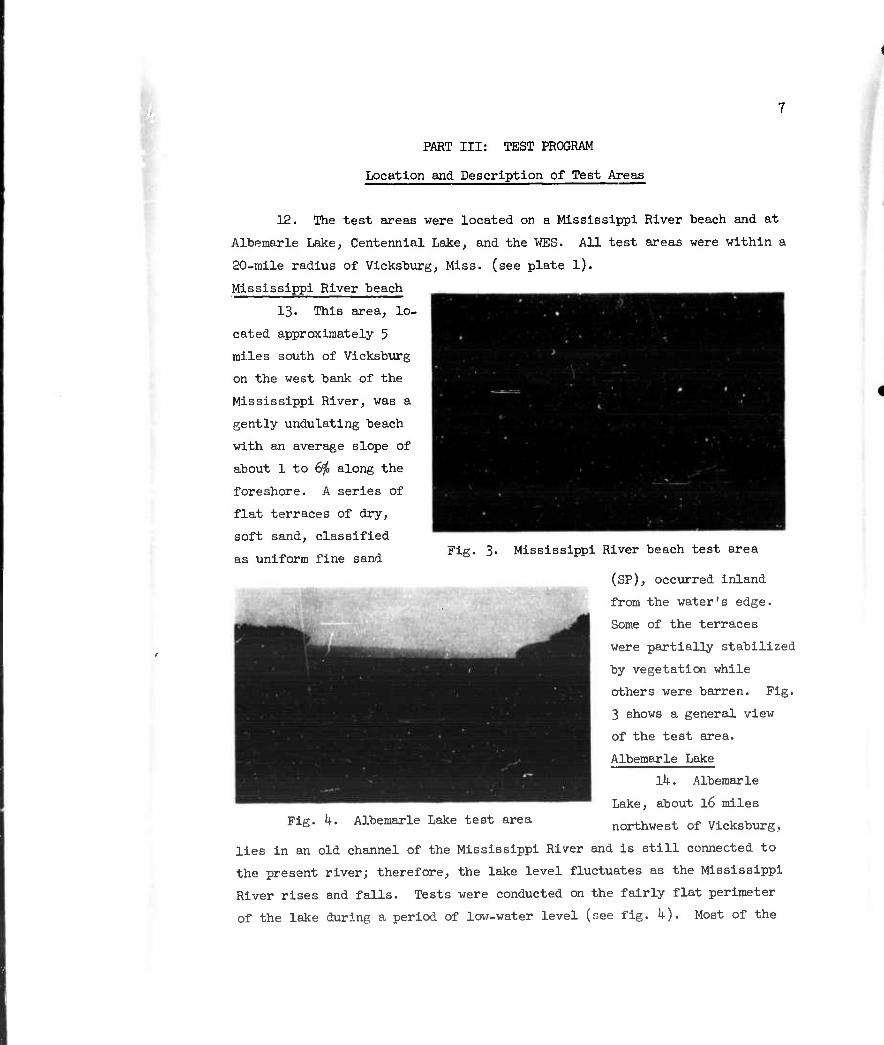
13. This area, lo-
cated approximately 5
miles south of Vicksburg
on the west bank of the
Mississippi River, was a
gently undulating beach
with an average slope of
about 1 to 6^ along the
foreshore. A series of
flat terraces of dry,
soft sand, classified Fig. 3. Mississippi River beach test area
as uniform fine sand
(SP), occurred Inland
from the water's edge.
Some of the terraces
were partially stabilized
by vegetation while
others were barren. Fig.
3 shows a general view
of the test area.
Albemarle Lake
Ik. Albemarle
Lake, about 16 miles Fig. k. Albemarle Lake test area northwest of Vicksburg,
lies in an old channel of the Mississippi River and is still connected to
the present river; therefore, the lake level fluctuates as the Mississippi
River rises and falls. Tests were conducted on the fairly flat perimeter
of the lake during a period of low-water level (see fig. k). Most of the
8
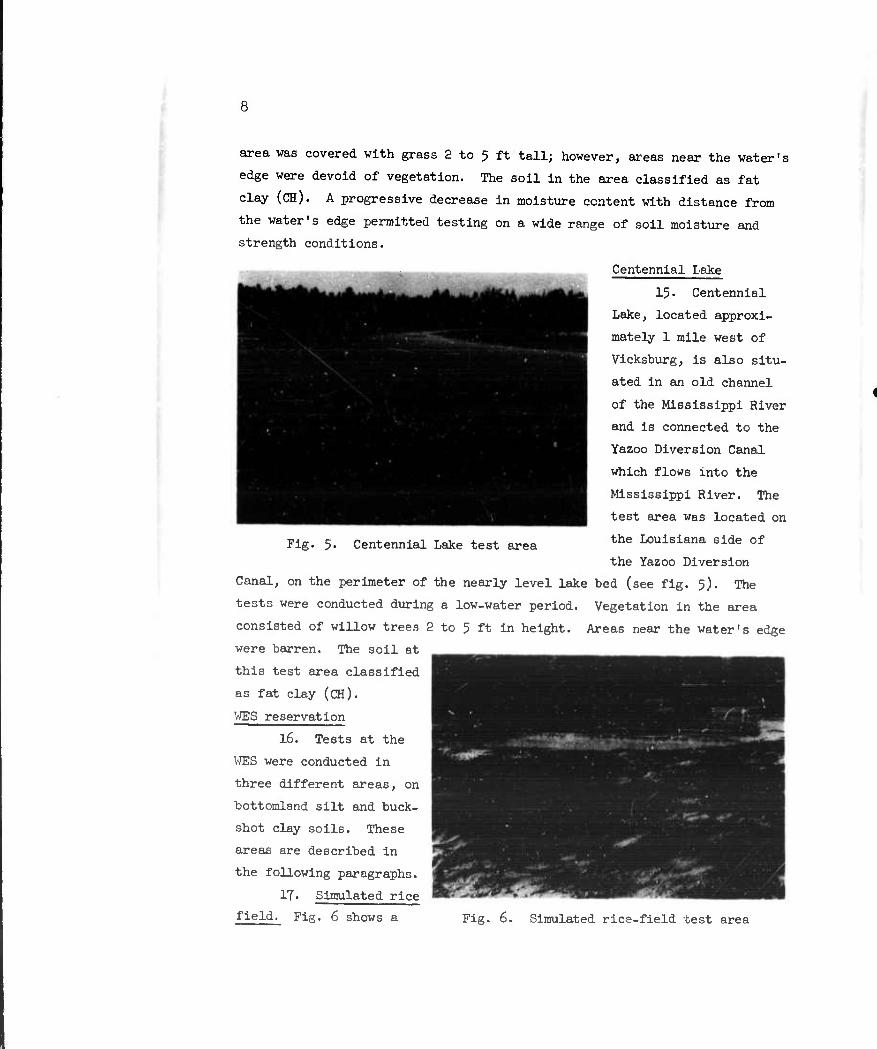
area was covered with grass 2 to 5 ft tall; however, areas near the water's
edge were devoid of vegetation. The soil in the area classified as fat
clay (CH). A progressive decrease in moisture content with distance from
the water's edge permitted testing on a wide range of soil moisture and
strength conditions.
Centennial Lake
15• Centennial
Lake, located approxi-
mately 1 mile west of
Vicksburg, is also situ-
ated in an old channel
of the Mississippi River
and Is connected to the
Yazoo Diversion Canal
which flows into the
Mississippi River. The
test area was located on
the Louisiana side of
the Yazoo Diversion
Canal, on the perimeter of the nearly level lake bed (see fig. 5). The
tests were conducted during a low-water period. Vegetation in the area
consisted of willow trees 2 to 5 ft in height. Areas near the water's edge
were barren. The soil at
this test area classified
as fat clay (CH).
WES reservation
16. Tests at the
WES were conducted in
three different areas, on
bottomland silt and buck-
shot clay soils. These
areas are described in
the following paragraphs.
IT« Simulated rice fleld- Fig. 6 shows a Fig. 6. Simulated rice-field test area
Fig. 5« Centennial Lake test area
9
13 IST
I. if .1 I. JO" .1 -Jß^-J u
•■
/.
/is
r
DIKE 4
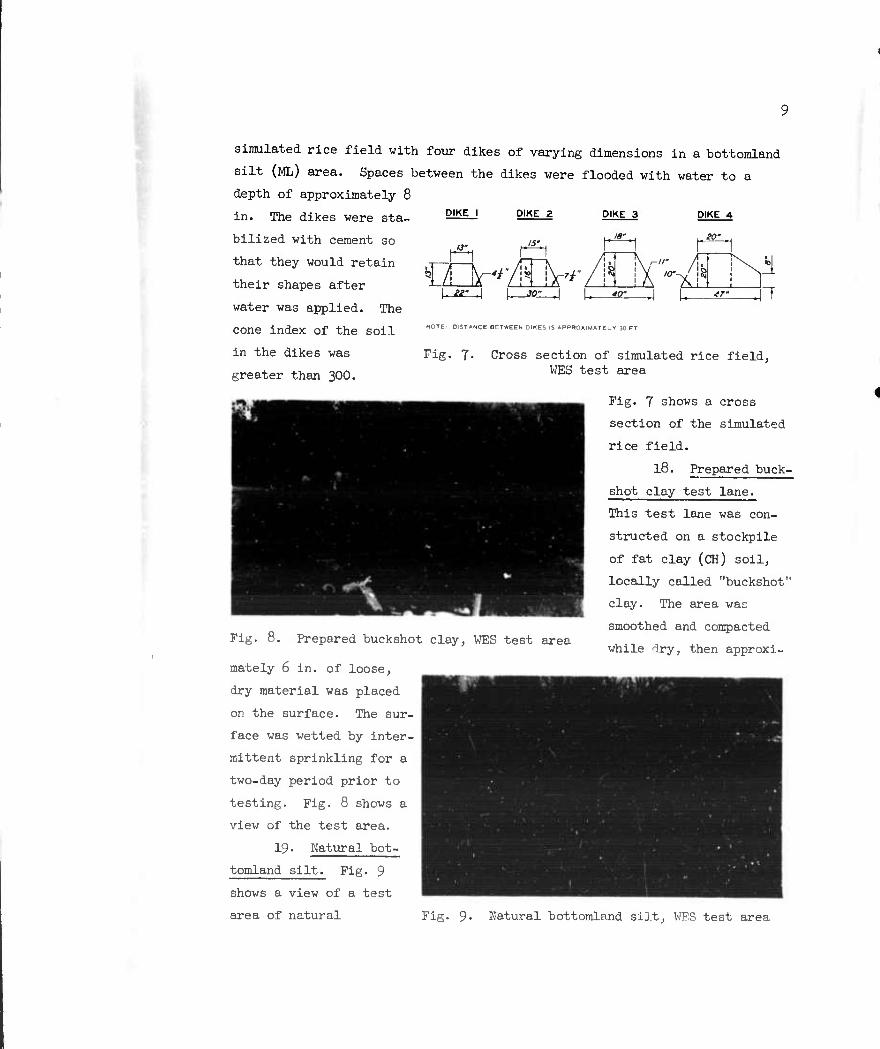
simulated rice field with four dikes of varying dimensions in a bottomland
silt (ML) area. Spaces between the dikes were flooded with water to a
depth of approximately 8
in. The dikes were sta- 5MJ DIKE_2 DIKE 3
bilized with cement so
that they would retain
their shapes after
water was applied. The
cone index of the soil
in the dikes was Fig. 7.
greater than 300.
IO--J |^
_40-_
NOTE: DISTANCE BETWEEN DIKES IS APPROXIMATELY 30 FT.
Cross section of simulated rice field, WES test area
Fig. 7 shows a cross
section of the simulated
rice field.
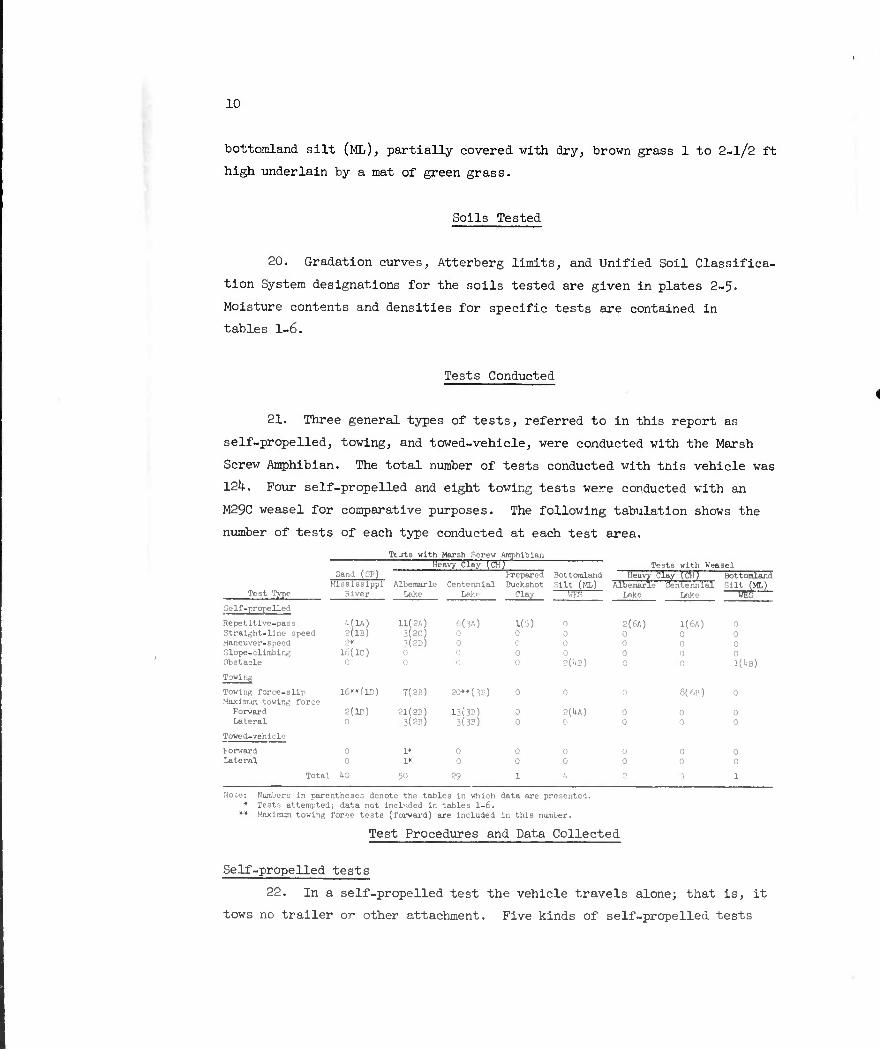
18. Prepared buck-
Fig. 8. Prepared buckshot clay, WES test area
mately 6 in. of loose,
dry material was placed
on the surface. The sur.
face was wetted by inter-
mittent sprinkling for a
two-day period prior to
testing. Fig. 8 shows a
view of the test area.
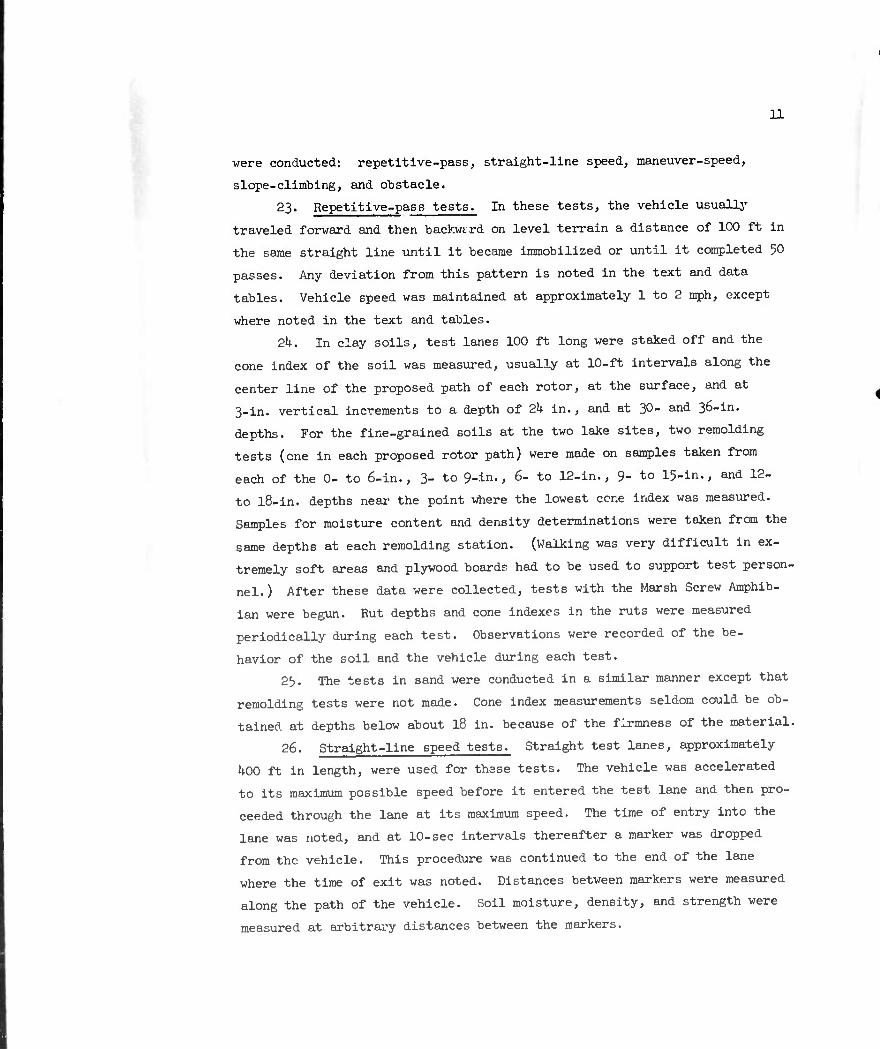
19. Natural bot-
shot clay test lane.
This test lane was con-
structed on a stockpile
of fat clay (CH) soil,
locally called "buckshot"
clay. The area was
smoothed and compacted
while ^ry, then approxi-
tomland silt. Fig. 9
shows a view of a test
area of natural Fig. 9- Natural bottomland silt, WES test area
10
bottomland silt (ML), partially covered with dry, brown grass 1 to 2-1/2 ft
high underlain by a mat of green grass.
Soils Tested
20. Gradation curves, Atterberg limits, and Unified Soil Classifica-
tion System designations for the soils tested are given in plates 2-5.
Moisture contents and densities for specific tests are contained in
tables 1-6.
Tests Conducted
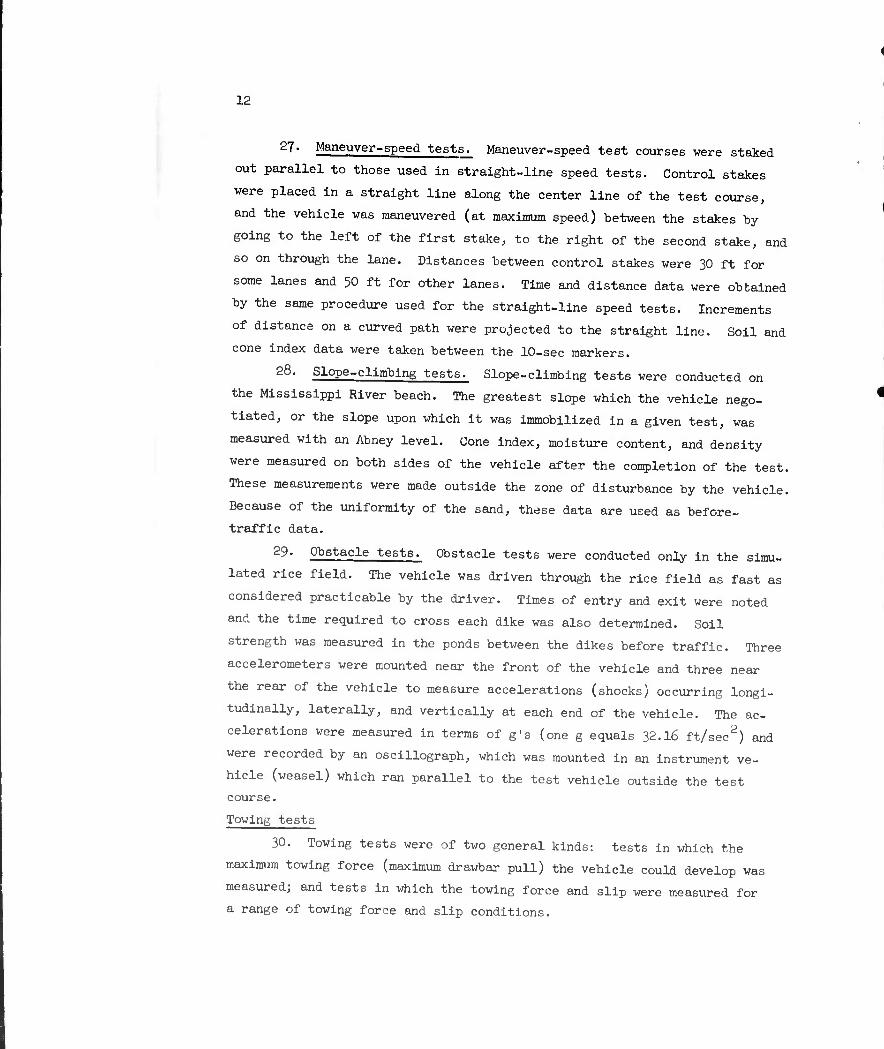
21. Three general types of tests, referred to in this report as
self-propelled, towing, and towed-vehicle, were conducted with the Marsh
Screw Amphibian. The total number of tests conducted with tnls vehicle was
12h. Four self-propelled and eight towing tests were conducted with an
M29C weasel for comparative purposes. The following tabulation shows the
number of tests of each type conducted at each test area.
TtJts vith Marsh Screw Amphibian
Sand (SP) Mississippi
River
Heavy Clay Tor " Bottomland Silt (ML) —m—
Tests with Weasel
Albemarle Lake
Centennial Le>.r
Prepared Buckshot
Clay
Heavy :W a.) Test Type
Albemarle Lake
Centennl Lekc
a] i^L Self-propelled
Repetitive-pass Straight-line e Maneuver-speed Slope-cllinblni? Obstacle
peed UflA) 2{1B) 2*
16(1C) 0
11(2A) 3(2C) 3(2D) 0 D
-,(3A) 0 0 0 0
1(5) 0 0 0 0
0 0 0 0 2(UB)
2(6A) 0 0 0 0
1(6A) 0 0 0 0
0 ') 0 i
1(UB)
Towing
Towing force-slip Maximum towing force
Forward Lateral
16*«(LD)
2(1D) 0
7(2B)
21(2B) 3(2B)
20** (3E
13(3B) 3(3B)
) 0
0 0
0
2(UA) 0
1
0 0
8(6B)
o 0
0
0 0
Towed-vehicle
tor-ward 0 1« 0 0 0 0 0 0 Lateral 0 1» 0 0 0 0 0 0
Total 1*0 50 ■\l 1 ■ ? ' 1
Noce; Numbers In parentheses denote the tables In which data are presented. * Tests attempted; data not Included In tables 1-6.
** Maximum towing force tests (forward) are included in this number.
Test Procedures and Data Collected
Self-propelled tests
22. In a self-propelled test the vehicle travels alone; that is, it
tows no trailer or other attachment. Five kinds of self-propelled tests
11
were conducted: repetitive-pass, straight-line speed, maneuver-speed,
slope-climbing, and obstacle.
23. Repetitive-pass tests. In these tests, the vehicle usually
traveled forward and then backwtrd on level terrain a distance of 100 ft in
the same straight line until it became immobilized or until it completed 50
passes. Any deviation from this pattern is noted in the text and data
tables. Vehicle speed was maintained at approximately 1 to 2 mph, except
where noted in the text and tables.
2k. In clay soils, test lanes 100 ft long were staked off and the
cone index of the soil was measured, usually at 10-ft intervals along the
center line of the proposed path of each rotor, at the surface, and at
3-in. vertical increments to a depth of 2k in., and at 30- and 36-in.
depths. For the fine-grained soils at the two lake sites, two remolding
tests (one in each proposed rotor path) were made on samples taken from
each of the 0- to 6-in., 3- to 9-in., 6- to 12-in., 9- to 15-in., and 12-
to 18-in. depths near the point where the lowest ccne index was measured.
Samples for moisture content and density determinations were taken from the
same depths at each remolding station. (Walking was very difficult in ex-
tremely soft areas and plywood boards had to be used to support test person-
nel. ) After these data were collected, tests with the Marsh Screw Amphib-
ian were begun. Rut depths and cone indexes in the ruts were measured
periodically during each test. Observations were recorded of the be-
havior of the soil and the vehicle during each test.
2J). The tests in sand were conducted in a similar manner except that
remolding tests were not made. Cone index measurements seldom could be ob-
tained at depths below about 18 in. because of the firmness of the material.
26. Straight-line speed tests. Straight test lanes, approximately
UOO ft in length, were used for these tests. The vehicle was accelerated
to its maximum possible speed before it entered the test lane and then pro-
ceeded through the lane at its maximum speed. The time of entry into the
lane was noted, and at 10-sec intervals thereafter a marker was dropped
from the vehicle. This procedure was continued to the end of the lane
where the time of exit was noted. Distances between markers were measured
along the path of the vehicle. Soil moisture, density, and strength were
measured at arbitrary distances between the markers.
12
27- Maneuver-speed tests. Maneuver-speed test courses were staked
out parallel to those used in straight-line speed tests. Control stakes
were placed in a straight line along the center line of the test course,
and the vehicle was maneuvered (at maximum speed) between the stakes by
going to the left of the first stake, to the right of the second stake, and
so on through the lane. Distances between control stakes were 30 ft for
some lanes and 50 ft for other lanes. Time and distance data were obtained
by the same procedure used for the straight-line speed tests. Increments
of distance on a curved path were projected to the straight line. Soil and
cone index data were taken between the 10-sec markers.
28- Slope-climbing tests. Slope-climbing tests were conducted on
the Mississippi River beach. The greatest slope which the vehicle nego-
tiated, or the slope upon which it was immobilized in a given test, was
measured with an Abney level. Cone index, moisture content, and density
were measured on both sides of the vehicle after the completion of the test.
These measurements were made outside the zone of disturbance by the vehicle.
Because of the uniformity of the sand, these data are used as before-
traffic data.
29- Obstacle tests. Obstacle tests were conducted only in the simu-
lated rice field. The vehicle was driven through the rice field as fast as
considered practicable by the driver. Times of entry and exit were noted
and the time required to cross each dike was also determined. Soil
strength was measured in the ponds between the dikes before traffic. Three
accelerometers were mounted near the front of the vehicle and three near
the rear of the vehicle to measure accelerations (shocks) occurring longi-
tudinally, laterally, and vertically at each end of the vehicle. The ac-
celerations were measured in terms of g's (one g equals 32.16 ft/sec2) and
were recorded by an oscillograph, which was mounted in an instrument ve-
hicle (weasel) which ran parallel to the test vehicle outside the test
course.
Towing tests
30. Towing tests were of two general kinds: tests in which the
maximum towing force (maximum drawbar pull) the vehicle could develop was
measured; and tests in which the towing force and slip were measured for
a range of towing force and slip conditions.
13
31« Maximum towing force tests. These tests vere performed on level
terrain with the Marsh Screw attached to a load vehicle (a weasel) by means
of a cable and a dynamometer. As the Marsh Screw moved forward in a
straight line at full throttle, the load on the Marsh Screw was gradually
increased by decelerating the weasel. Continuous measurements of the pull
being developed and the speed of the Marsh Screw were recorded on paper
tape. Maximum pull was arbitrarily determined to be the load that could
be moved by the Marsh Screw operating at full throttle and traveling at a
speed of 0.5 mph or slightly greater. Higher pulls were usually obtained,
but these caused the Marsh Screw to halt or to significantly decrease its
speed below 0.5 mph. The area in which the maximum pull occurred was noted
and soil strength, moisture, and density were measured adjacent to the area
in a manner similar to that used for the repetitive-pass tests.
32. Towing force-slip tests. Towing force-slip tests were conducted
in the same general manner as the maximum towing force tests except that
the distance the vehicle moved forward, the number of revolutions of the
rotors, and the pull developed by the vehicle were measured simultaneously.
The distance the vehicle traveled was measured by means of a wheel attached
to the rear of the vehicle (fig. 10), and the number of revolutions made by
the rotors was measured by means of a microswitch and collar fitted on the
support shaft of the rotor (fig. ll). Test procedures for obtaining
Fig. 10. Wheel for meas- uring distance traveled
Fig. Microswitch for measuring rotor revolutions
Ik
towing force measurements were similar to those described under maximum
tewing force tests, except loads were varied to obtain a number of pull-
slip combinations between zero slip and 100^ slip.
33. When a conventional vehicle moves forward at nr slip, the dis-
tance that a point on the periphery of its track (or wheel) moves in space
is equal to the distance that the vehicle moves along the ground. Finite
slips are computed according to the expression:
. inn x dist traveled by track or wheel - dist traveled by vehicle f, slip - 100 x dist traveled by track or wheel
The lead of the helixes on the pontoons of the Marsh Screw is ^8 in.;
therefore, when the vehicle moves forward at no slip, it travels ^8 in.
for each complete revolution of the pontoons. When 100^ slip occurs, the
pontoons spin but the vehicle makes no progress. Finite slips for this
vehicle were computed according to the expression:
(W x no. of revolutions of pontoon) - dist traveled by cL inn y vehicle in inches r sllP " 100 UÖ X no. of revolutions of pontoons
Towed-vehicle tests
3I+. In these tests, measurements were made of the force required to
tow the Marsh Screw across level terrain. These tests are normally per-
formed with the vehicle in neutral gear. Only limited tests were conducted
since the vehicle did not respond well to being towed forward or backward.
Measurements also were made of the force required to tow it laterally.
15
PART IV: ANALYSIS OF DATA
35. Development of comprehensive relations between soil conditions
and the tractive performance of the Marsh Screw was hampered somewhat be-
cause the engine power of the vehicle was not sufficient to turn its rotors
in certain soil conditions. In such conditions, immobilization was there-
fore primarily a result of vehicle characteristics rather than a result
of soil failure. This problem has seldom been encountered with more conven-
tional vehicles, since these can nearly always spin their tracks or wheels
when they have become immobilized. If free water, especially surface water,
was present, the Marsh Screw had little difficulty in traveling. However,
when the surface was relatively dry and there was not enough water in the
subsurface layers to be squeezed out and mixed with the surface layer, the
friction created between the rotors and the soil usually was greater than
could be overcome by the engine power and drive system, and the vehicle
could not move forward or backward, but the vehicle could travel laterally.
Tests on Coarse-Grained Soils
36. Repetitive-pass, straight-line speed, maneuver-speed, slope-
climbing, and towing tests were conducted at the Mississippi River beach
area on uniform fine sand (SP). Table 1 summarizes results of these tests.
37. In previous test programs with wheeled and tracked vehicles, the
0- to 6-in. layer was established as the critical layer* in clean sand for
all vehicles tested thus far; therefore, this layer was used as the basis
for analysis of the Marsh Screw's performance in sand. Previous testing
with wheeled and tracked vehicles also established that if a vehicle could
negotiate the given sand and slope condition on the first pass, it could
travel in the same ruts for any number of passes. However, since the Marsh
Screw has an unusual locomotion principle it was decided to conduct
repetitive-pass tests as well as slope-climbing and towing tests to de-
termine if criteria established for other vehicles would be appropriate for
the Marsh Screw.
Repetitive-pass tests
38. Four repetitive-pass tests on level sand were conducted with the
If—Critical layer is defined as the layer of soil most pertinent in es- tablishing relations between soil strength and vehicle performance.
16
Marsh Screw at full throttle, two with the vehicle empty (2860 lb), and two
with it loaded (3954 lb). A summary of the data and results of these tests
is given in table 1A.
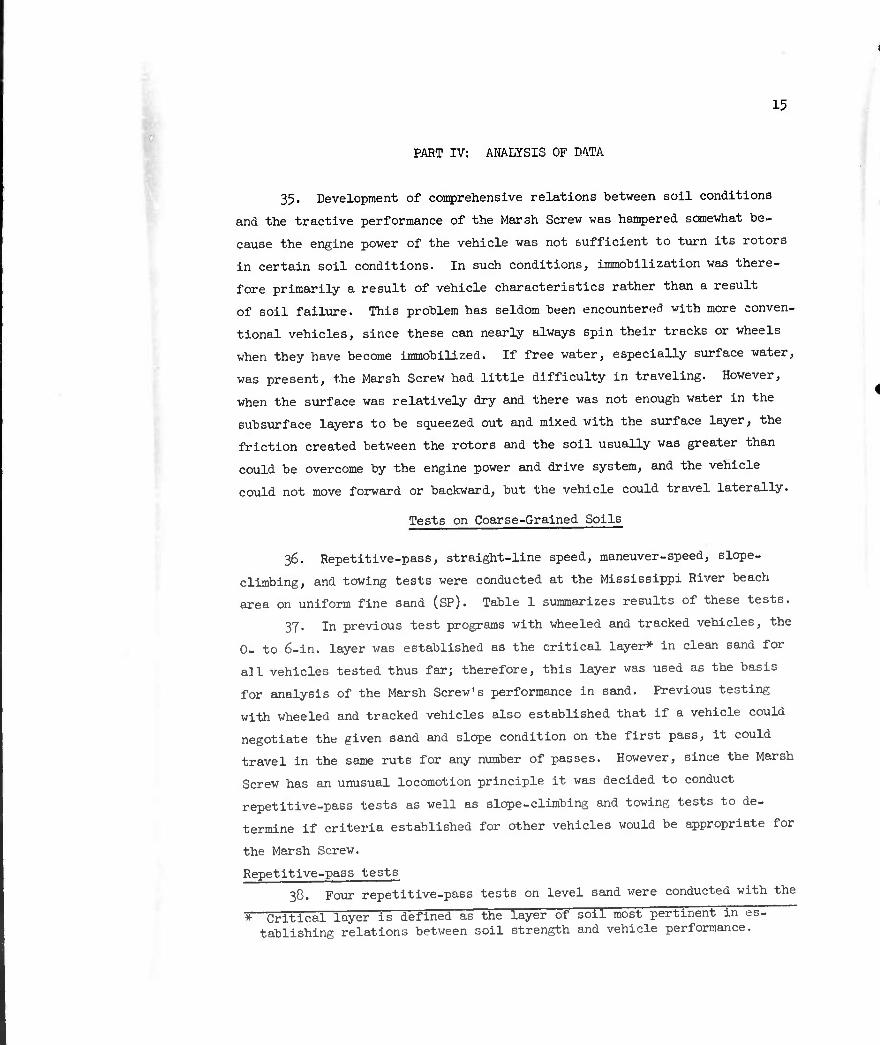
39- In the two tests at 2860 lb (tests 39 and 57), the operator ex-
perienced difficulty in keeping the vehicle in the test lane for the first
few passes; however, after ruts about 6 in. deep had been developed the ve-
hicle had no great difficulty following the same track on each pass. The
action of the unloaded Marsh Screw on level sand can be illustrated by a
series of photographs made for test 39- In this test, the 0- to 6-in. cone
index was 60. Fig. 12 shows the test area prior to the test. Fig. 13
shows the path left after one pass of the vehicle; the ruts are about 5.6
in. deep. The average speed on the first pass was about 1 mph. Since the
vehicle was at full throttle, this may be considered a maximum speed. Con-
siderable difficulty was experienced on the first pass in keeping the ve-
hicle in a straight line; it was necessary for the driver to steer con-
tinuously. Finally after a series of short, abrupt steering actions, the
vehicle could not continue to turn its rotors and move forward. At this
point, the vehicle was put in reverse and the test was continued. Fig. Ik
shows the test lane after 5 vehicle passes; ruts were about 7.8 in. deep.
Fig. 15 shows the path left after 20 passes. Note the curves in the test
Fig. 12. Test 39, before traffic
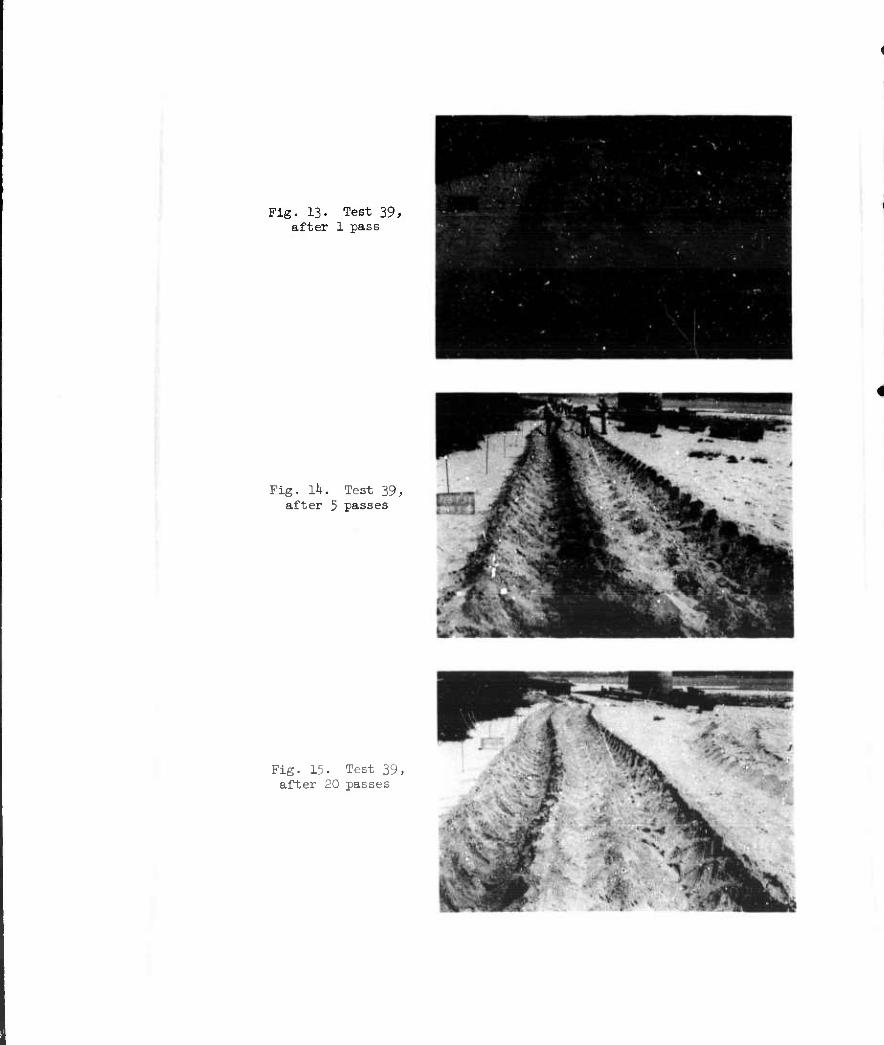
Fig. 13- Test 39, after 1 pass
Fig. lit. Test 39, after 5 passes
Fig. 15. Test 39, after 20 passes
18
lane, which indicate difficulty in steering. The ruts were about 8.6 in.
deep. At the end of 50 passes, the ruts were somewhat shallower, about 7-9
in. deep. In a similar test (57)> on a cone index of 58 in the top 6-in.
sand layer, the vehicle performed similarly except that it was not im-
mobilized on the first pass, as had happened in test 39-
kO. When loaded, the vehicle was unable to travel in reverse and
could make only two or three passes going forward. The average maximum
speed on the first pass was about 1 mph. Test kO was conducted on sand
with a low moisture content (1.85&), while test 56 was conducted on sand
with a relatively high moisture content (20.2^), but no free water. Aver-
age cone indices were 107 and 52 in tests ^0 and 56, respectively.
kl. Although the vehicle (loaded or unloaded) had difficulty travel-
ing forward and backward, it could travel laterally with ease across level
sand. It could not, however, extricate itself from ruts more than about
8 in. deep by moving laterally.
k2. It was concluded from these tests that the performance of the
Marsh Screw in level sand was very poor because ths frictional resistance
of the sand against the rotors nearly matched (and in fact, often ex-
ceeded) the available tractive power of the vehicle. The unloaded vehicle
performed better than the loaded vehicle. The loaded vehicle obviously
performed better traveling forward than it did in reverse. Unloaded, the
difference between its ability to travel forward and in reverse was not
quite so obvious. The most facile movement was in the lateral direction.
In the opinion of the test personnel, a more powerful engine combined with
an adequate gear train would definitely improve performance in sand. It is
also possible that redesign of the rotors and helixes would improve per-
formance; however, no specific recommendation can be offered for redesign
of these features.
Straight-line speed tests
h^. Two tests (59 and 60) were conducted to determine the maximum
speed the loaded vehicle could develop on the sand area. Test data are
summarized in table IB. As described in paragraph 26, markers were dropped
from the vehicle at 10-sec Intervals throughout the test coturse, and cone
index data were measured between the interval markers. The highest speed
the vehicle attained in any 10-sec interval was 2.3 mph, while the lowest
19
speed was 1.0 raph. The average maximum speed over the two test courses was
approximately 1.6 mph. The average oone index for the 0- to 6-in. depth
was about 95, while the range was from k6 to 159. No definite relations
were developed between speed and cone index. It was noted, however, that
higher speed could probably have been attained if greater engine power had
been available.
kh. In these tests, the throttle was held wide open, and steering of
the vehicle was kept to the minimum necessary to follow a reasonably
straight line. While the greatest speed obtained was 2.3 raph, this was
maintained for only a short period during which the vehicle was not under
full control. Had the driver attempted to hold a straighter course, it is
very likely that the maximum speed would have been practically the same as
in the repetitive-pass tests.
Maneuver-speed tests
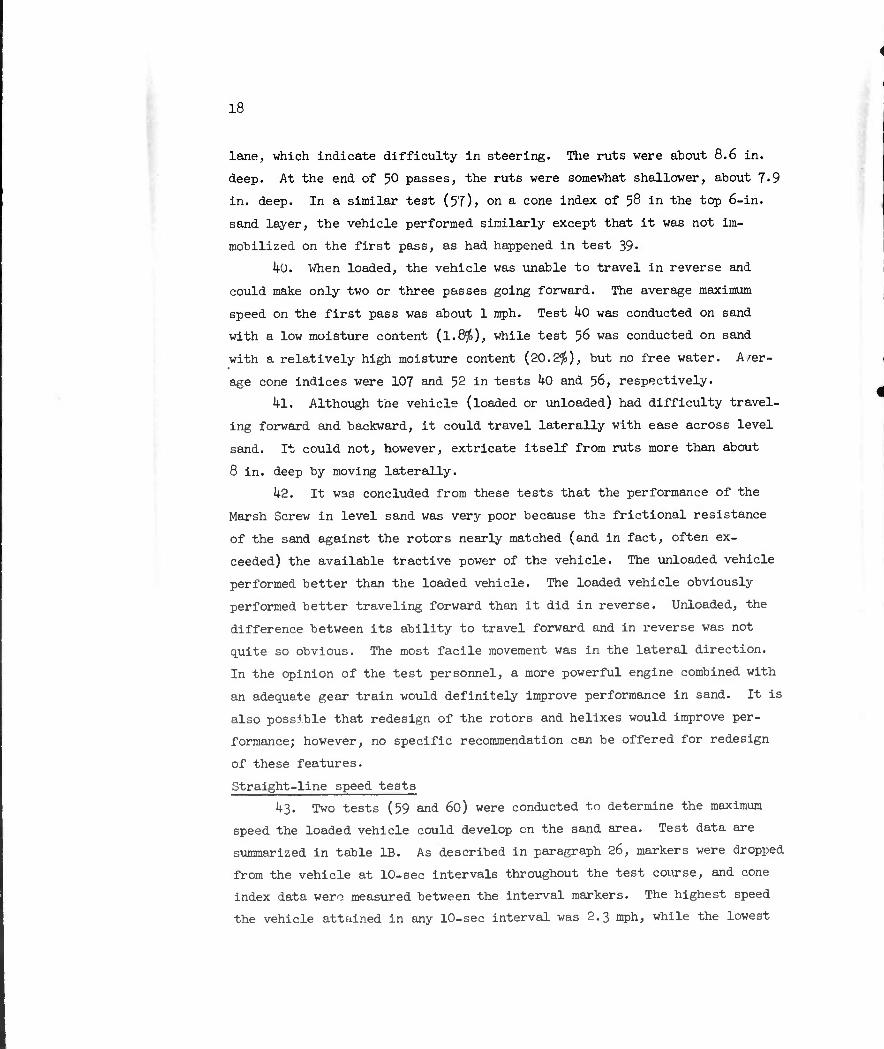
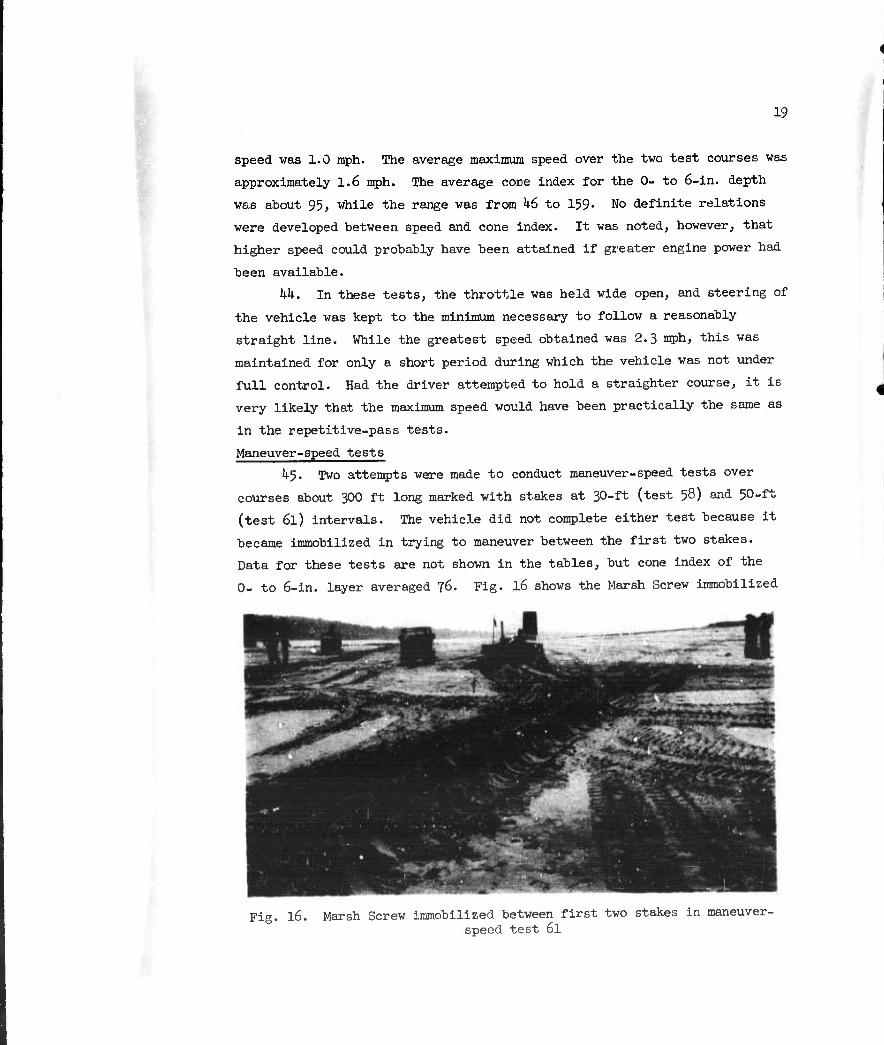
k3. Two attempts were made to conduct maneuver-speed tests over
courses about 300 ft long marked with stakes at 30-ft (test 58) and 50-ft
(test 6l) intervals. The vehicle did not complete either test because it
became immobilized in trying to maneuver between the first two stakes.
Data for these tests are not shown In the tables, but cone index of the
0- to 6-in. layer averaged 76. Fig. 16 shows the Marsh Screw immobilized
Fig. l6. Marsh Screw immobilized between first two stakes in maneuver- speed test 6l
20
between the first and second stakes in test 6l. The ruts in the foreground
show the approach to the beginning of the test course.
Slope-climbing tests
k6. Eleven slope-climbing tests with the loaded vehicle and five
with the unloaded vehicle were conducted on sand with cone indices ranging
between 62 and 12^+ in the 0- to 6-in. layer. One test, with the unloaded
vehicle, was performed by backing up the slope. Data for these tests are
contained in table 1C and are plotted in plate 6. Maintaining a straight
course was just as difficult on the slopes as it had been on level sand.
The maximum speed on the slopes was only about 0.5 mph. The data are
limited in extent, and do not permit the development of a slope-climbing
ability versus cone index curve. The data merely show that the Marsh
Screw, when loaded, can climb an 18^ slope but cannot climb a 21^ slope on
a cone index of about 75«
Towing force-slip tests
kj. Several towing force-slip tests were made on level sand and the
results are plotted in plate 7« Cone index and speed are given for each
test. The data exhibit considerable scatter, but it is considered that the
curve shown represents approximately the towing force-slip relations when
the cone index is 100 to 150 in the 0- to 6-in. layer. Note that there is
a pronounced decrease in vehicle speed as the curve ascends (slip in-
creases). Also note that the two points well above the curve (65K and 65L)
represent tests in which the cone index was 200. A curve for the M29C wea-
sel, developed on a harrowed sand, is shown for comparison. This curve is
taken from TM 3-240, 15th Supplement, Trafficability of Soils; Tests on
Coarse-Grained Soils with Self-Propelled and Towed Vehicles, 1956 and 1957,
and is not meant to represent the curve which would have been produced in
tests on the natural sand beach on which the Marsh Screw was tested, how-
ever, it is believed that such a curve would have been similar to the
hypothetical curve shown in plate J, which means that in the same sand
the weasel would have performed better than the Marsh Screw.
Maximum towing force tests
1+8. Two maximum towing force tests (64D and 65G) were conducted on
level sand. The maximum towing force was raeas\u-ed as the load the vehicle
21
could pull with full throttle at a speed of approximately 0-5 mph. Addi-
tional load above that measured merely stalled the vehicle because there
was insufficient power to turn the rotors. Theoretically, the maximum
towing force a vehicle can develop on a given level surface, expressed as
a percentage of the vehicle weight, is the same as the maximum slope it
can climb on the same surface. In practice, however, it has been found
that the maximum towing force attainable on level ground is usually about
2^ higher than the maximum slope for the same relatively low cone index.
Accordingly, the results of the slope-climbing tests (circles) and the
maximum tow_ng force tests (squares) were plotted together in plate 6
to provide sufficient data to develop vehicle performance-cone index rela-
tions. The scale for towing force is shown on the left and that for the
slope on the right. A flat curve can be drawn joining the two towing
tests. This curve also divides the "go" and "no-go" slope-climbing tests.
The practically insignificant effect of cone index shown by this curve is
not surprising since previous test programs revealed that tracked vehicles
develop similar flat cxirves. A curve for the M29C weasel, taken from
TM 3-240, 17th Supplement, Trafficability of Soils; Tests on Coarse-
Grained Soils with Self-Propelled and Towed Vehicles, 1938-1961, is shown
for comparison.
Discussion of slope-climbing and maximum towing force tests
k-S). Inasmuch as the Marsh Screw performed poorly on level sand in
the repetitive-pass tests, especially while traveling in reverse, the facts
that it was able to negotiate slopes up to 18^, and tow loads up to about
2k'jl) of its test weight were somewhat unexpected. Three reasons are of-
fered: first, the vehicle was observed to travel better in a forward di-
rection than in reverse (and the slope-climbing and towing force tests were
made in a forward direction); second, the vehicle develops a much higher
torque output when traveling at 0.5 mph (as it did in the slope-climbing
and towing force tests) than it does at 1 to 2 mph, the speed at which the
repetitive-pass and straight-line speed tests were conducted; and third,
the vehicle engine may have been cooler in the slope-climbing and towing
force tests (see paragraph ll).
22
Tests on Fine-Gralned Solls
50. Tests on fine-grained soils were conducted in three locations:
Albemarle Lake, Centennial Lake, and the WES reservation. Summaries of
the test data and results are presented in tables 2-6 and are discussed in
the following paragraphs.
Repetitive-pass tests
51. The principal purpose of the repetitive-pass tests on level ter-
rain was to determine experimentally the vehicle cone index (VCl) of the
Marsh Screw. The VCI is the minimum soil strength, expressed in terms of
rating cone index (RCl), required for a vehicle to negotiate kO to 50
passes in a straight-line path. The VCI computations for the Marsh Screw
are presented in Appendix A.
52. The critical soil layer of fine-grained soils for conventional
wheeled and tracked vehicles of weight similar to that of the Marsh Screw
is the 3- to 9-in. depth; however, because of the possibility that the un-
usual means of locomotion might require redefinition of the critical layer
for the Marsh Screw, soil strength data for the 0- to 6-ln., 3- to 9-ln.,
6- to 12-ln., and 9- to 15-in. depths are shown in the tables and plotted
against vehicle performance in plates 8 and 9.
53- Albemarle Lake tests. Ten tests were conducted in the CH soil
at Albemarle Lake with the Marsh Screw loaded (395^ lb) and one test (7)
with it empty (2860 lb). The data are shown in table 2A. In addition, two
tests were conducted with the M29C weasel (weight I+96O lb). Data for the
weasel tests are shown in table 6. Rating cone index values are plotted
against performance for the Marsh Screw and weasel in plate 8.
51*-. The Marsh Screw was able to complete 50 passes In tests 1, k, 5,
7, U, 12, and 35- These tests were conducted on test lanes covered with
grass about 18 in. to 5 ft high and with 1/2 to 2 in. of water on the sur-
face. Four of the tests {k, 5, 12, and 35) were conducted on an RCI in
the 3- to 9-in. layer equal to approximately 5; the other two loaded-
vehicle tests (l and ll) were conducted on RCI's in the 3- to 9-in. layer
of 3h and 16, respectively.
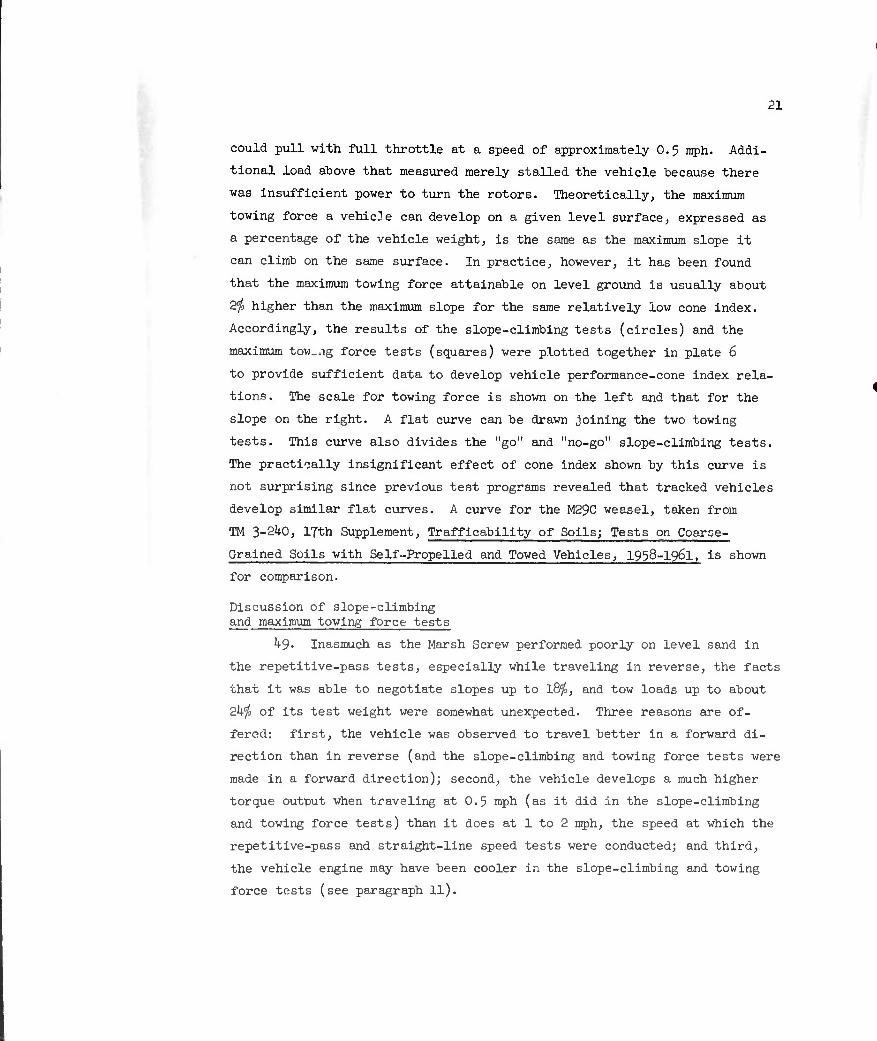
55- The soil in test 1 was the firmest in this series of tests.
A view of the actual test site before traffic, with personnel measuring
23
Fig. 17. Site of test 1 at Albemarle Lake. Personnel are taking cone in-
dex measurements before traffic
Fig. 18. Test site 1 after 1 pass
before-traffic data, is shown in fig. 17. Note the high grass. Although
not visible, shallow water stood in small surface depressions, such as
those left by cattle hooves. Fig. 18 shows the path left by one pass of
the Marsh Screw. The grass in the path has been pressed down, and rather
definite traces of the Marsh Screw's helix can be seen; however, the path
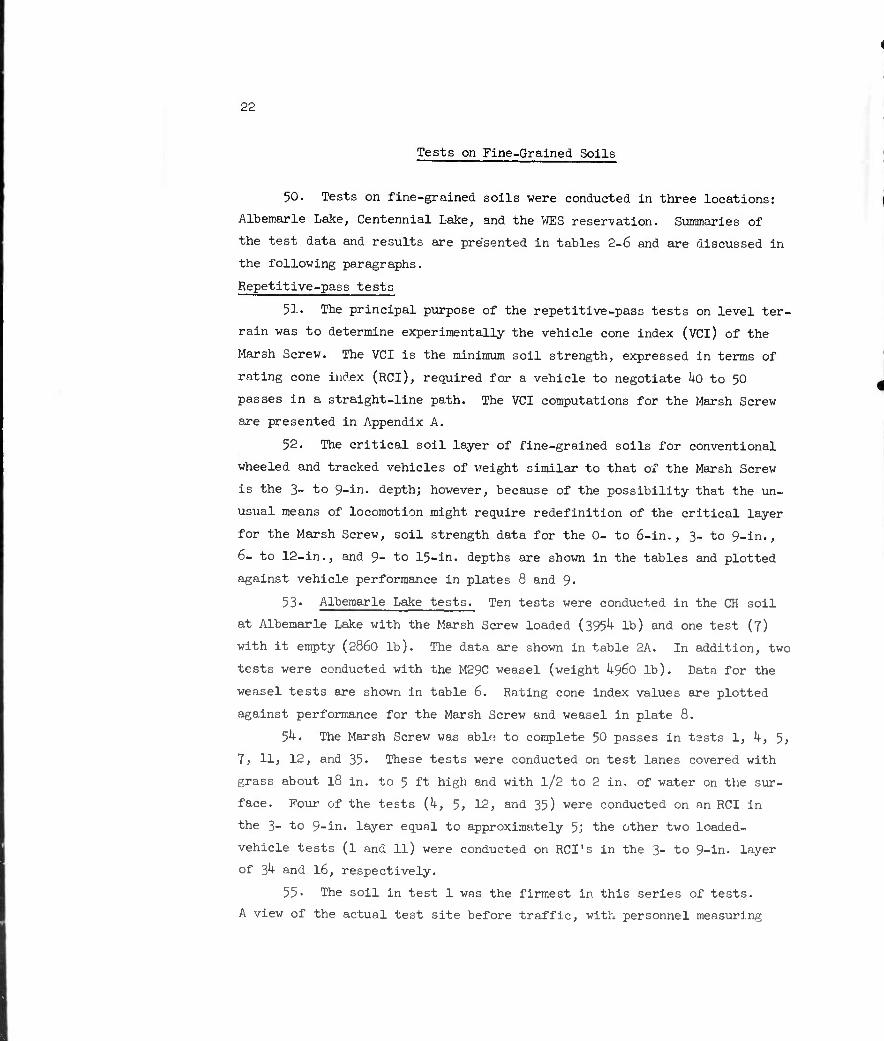
is poorly defined and ruts are obviously shallow, in fig. 19 the ve-
hicle is shown on its seventh pass. Ruts remain shallow (1.5 in.).
Fig. 19. Vehicle on 7th pass in test 1
2k
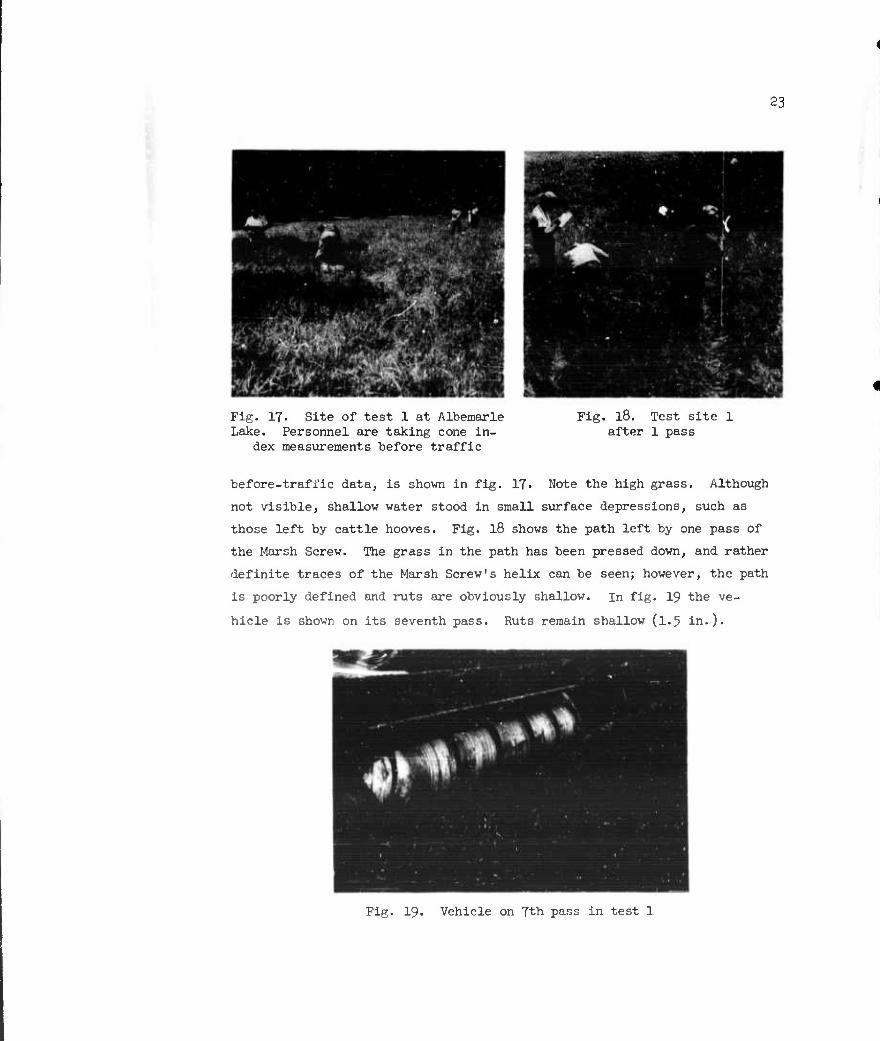
Fig. 20 is a view of the test
oughly defined, but ruts are
inspection of the photograph
on the surfaces of the ruts,
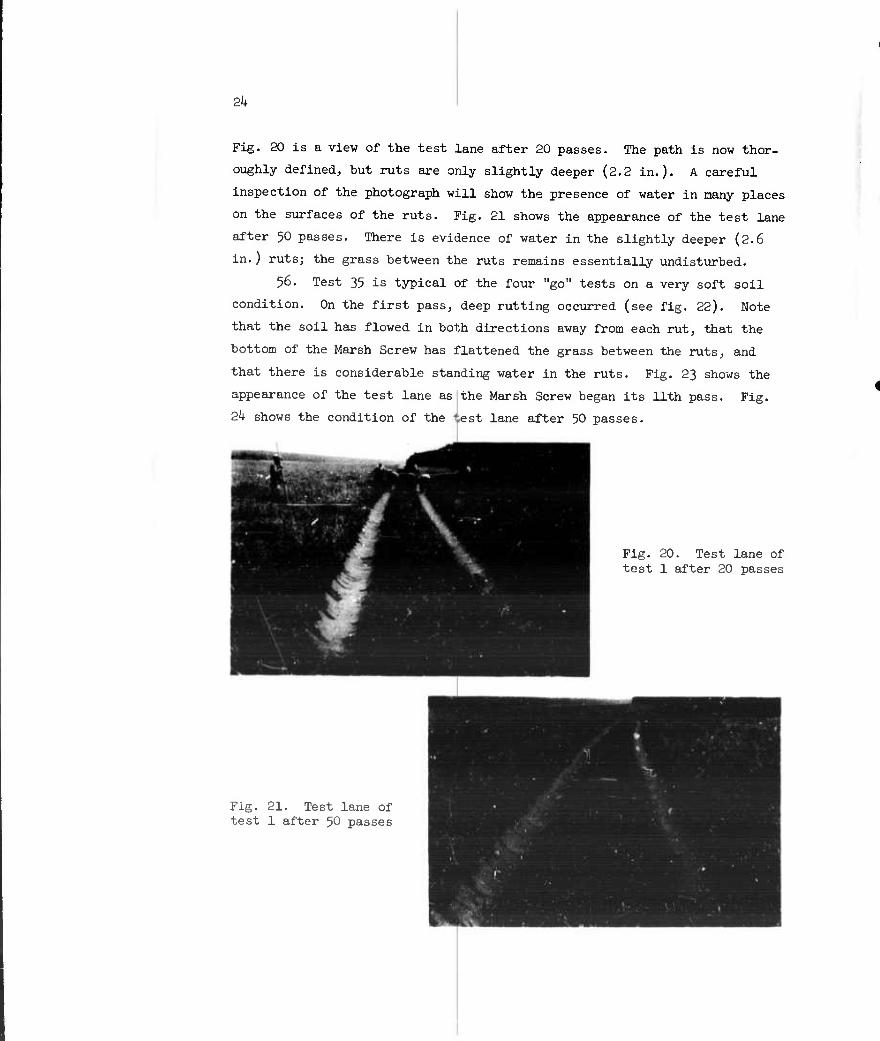
after 50 passes. There is
in.) rutsj the grass between
56. Test 35 is typical
condition. On the first pass,
that the soil has flowed in
bottom of the Marsh Screw has
that there is considerable
appearance of the test lane as
2k shows the condition of the
evidence
the
lane after 20 passes. The path is now thor-
slightly deeper (2.2 in.). A careful
will show the presence of water in many places
I'ig. 21 shows the appearance of the test lane
of water in the slightly deeper (2.6
ruts remains essentially undisturbed,
^f the four "go" tests on a very soft soil
deep rutting occurred (see fig. 22). Note
both directions away from each rut, that the
flattened the grass between the ruts, and
standing water in the ruts. Fig. 23 shows the
the Marsh Screw began its 11th pass. Fig.
test lane after 50 passes.
Fig. 20. Test lane of test 1 after 20 passes
Fig. 21. Test lane of test 1 after 50 passes
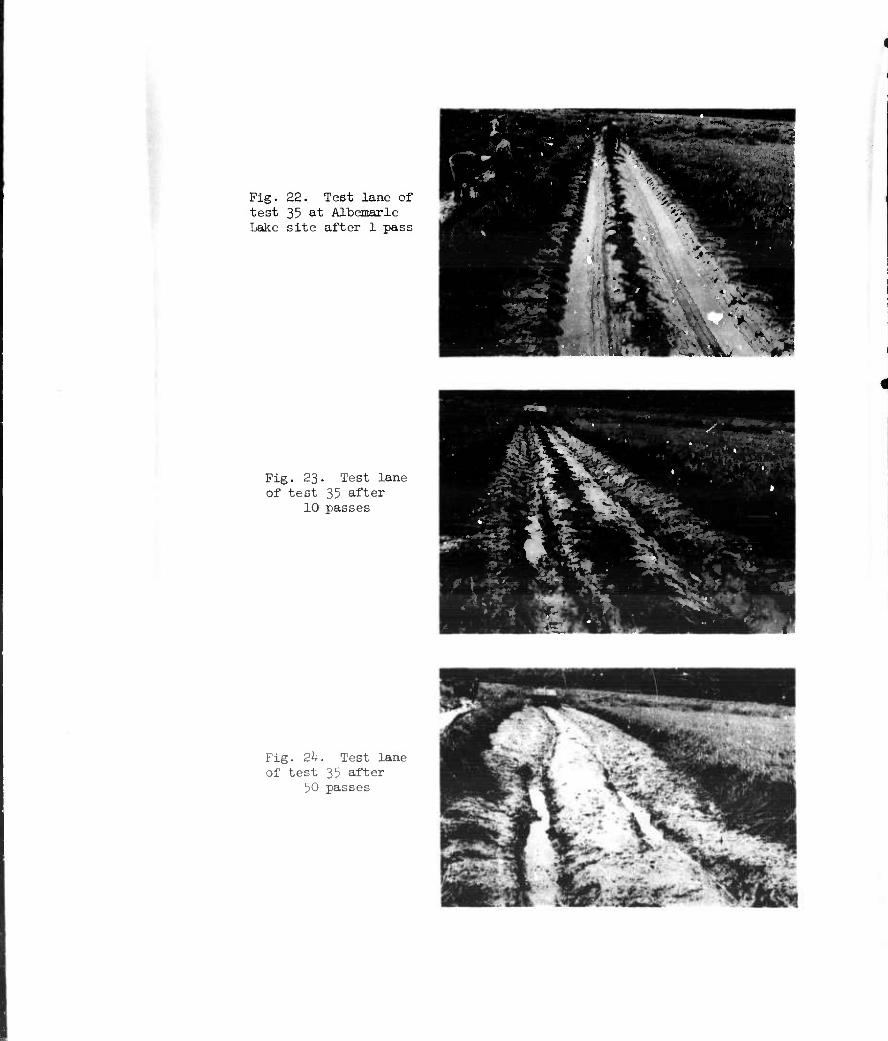
Flg. 22. Test lane of test 35 at Albemarle Lake site after 1 pass
^K ^^H I^BMB^I V^b < iBfw'*- 1 ^r^| HSiiiHwS
~ flik-4i '' ''■■ ''' ■ ;
- -.
■ *%ß&£ ^^mOki. 2L
r '■-■- » \ 9HkJ '' wt^
Fig. 23. Test lane of test 35 after
10 passes
1 •
* 4\ai - .
y .
• . 4^ Sf* * * . . • sy ;\^ K^V
»
. !^ ^v^r « *• ^ % ^t. ' ^k- ' ^ffluH JT ■ I
•■'•^ fi^ ]^L^' ^^l g : X»* r .' • •*NI3 Eb
Ä^^if' i m ^ -r ^^ ̂ r^..
0^ -.^ i .■a • ^r » '*- t 1» fe^
^h',S5
:^n
-^fe
. .^Si ri.' -, 4 •
Fig. 2k. Test lane of test 35 after
50 passes
26
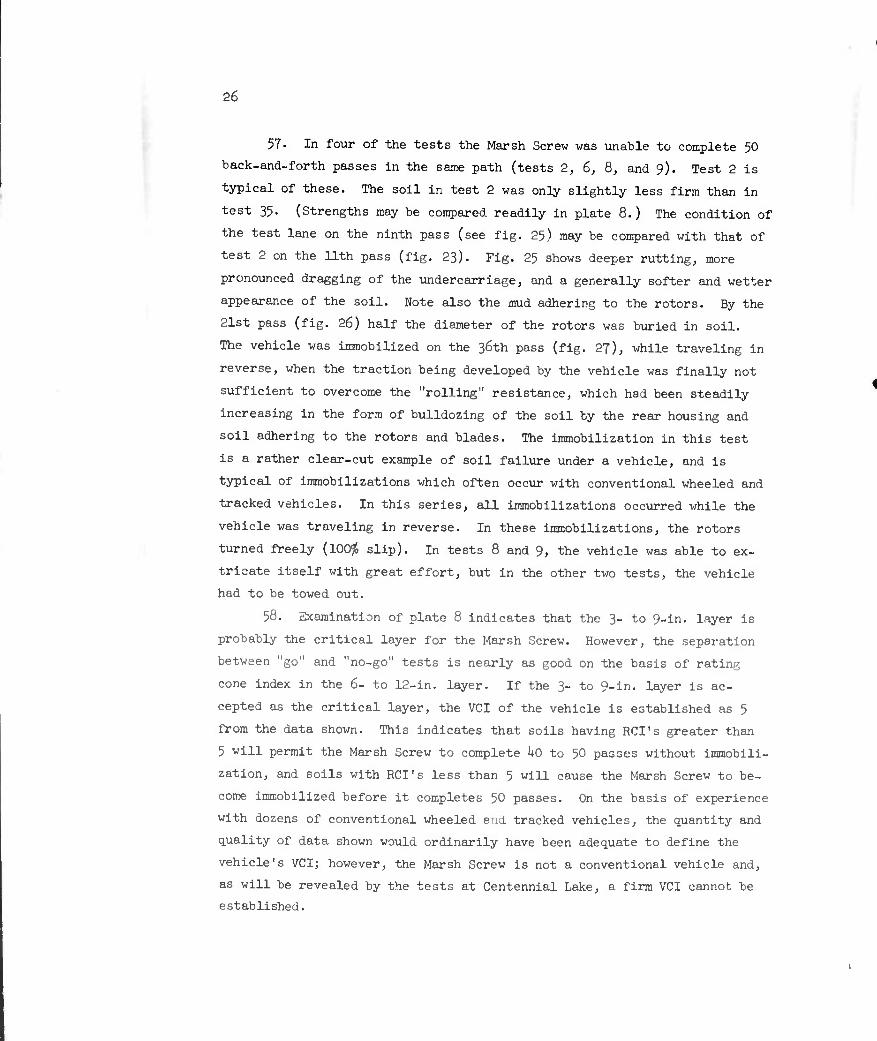
57- In four of the tests the Marsh Screw was unable to complete 50
back-and-forth passes in the same path (tests 2, 6, 8, and 9). Test 2 is
typical of these. The soil in test 2 was only slightly less firm than in
test 35. (Strengths may be compared readily in plate 8.) The condition of
the test lane on the ninth pass (see fig. 25) may be compared with that of
test 2 on the 11th pass (fig. 23). Fig. 25 shows deeper rutting, more
pronounced dragging of the undercarriage, and a generally softer and wetter
appearance of the soil. Note also the mud adhering to the rotors. By the
21st pass (fig. 26) half the diameter of the rotors was buried in soil.
The vehicle was immobilized on the 36th pass (fig. 27), while traveling in
reverse, when the traction being developed by the vehicle was finally not
sufficient to overcome the "rolling" resistance, which had been steadily
increasing in the form of bulldozing of the soil by the rear housing and
soil adhering to the rotors and blades. The immobilization in this test
is a rather clear-cut example of soil failure under a vehicle, and is
typical of immobilizations which often occur with conventional wheeled and
tracked vehicles. In this series, all immobilizations occurred while the
vehicle was traveling in reverse. In these immobilizations, the rotors
turned freely (100^ slip). In tests 8 and 9, the vehicle was able to ex-
tricate itself with great effort, but in the other two tests, the vehicle
had to be towed out.
58. Examination of plate 8 indicates that the 3- to 9-in. layer is
probably the critical layer for the Marsh Screw. However, the separation
between "go" and "no-go" tests is nearly as good on the basis of rating
cone index in the 6- to 12-in. layer. If the 3- to 9-in. layer is ac-
cepted as the critical layer, the VCI of the vehicle is established as 5
from the data shown. This indicates that soils having RCI's greater than
5 will permit the Marsh Screw to complete ko to 50 passes without immobili-
zation, and soils with RCI's less than 5 will cause the Marsh Screw to be-
come immobilized before it completes 50 passes. On the basis of experience
with dozens of conventional wheeled and tracked vehicles, the quantity and
quality of data shown would ordinarily have been adequate to define the
vehicle's VCI; however, the Marsh Screw is not a conventional vehicle and,
as will be revealed by the tests at Centennial Lake, a firm VCI cannot be
established.
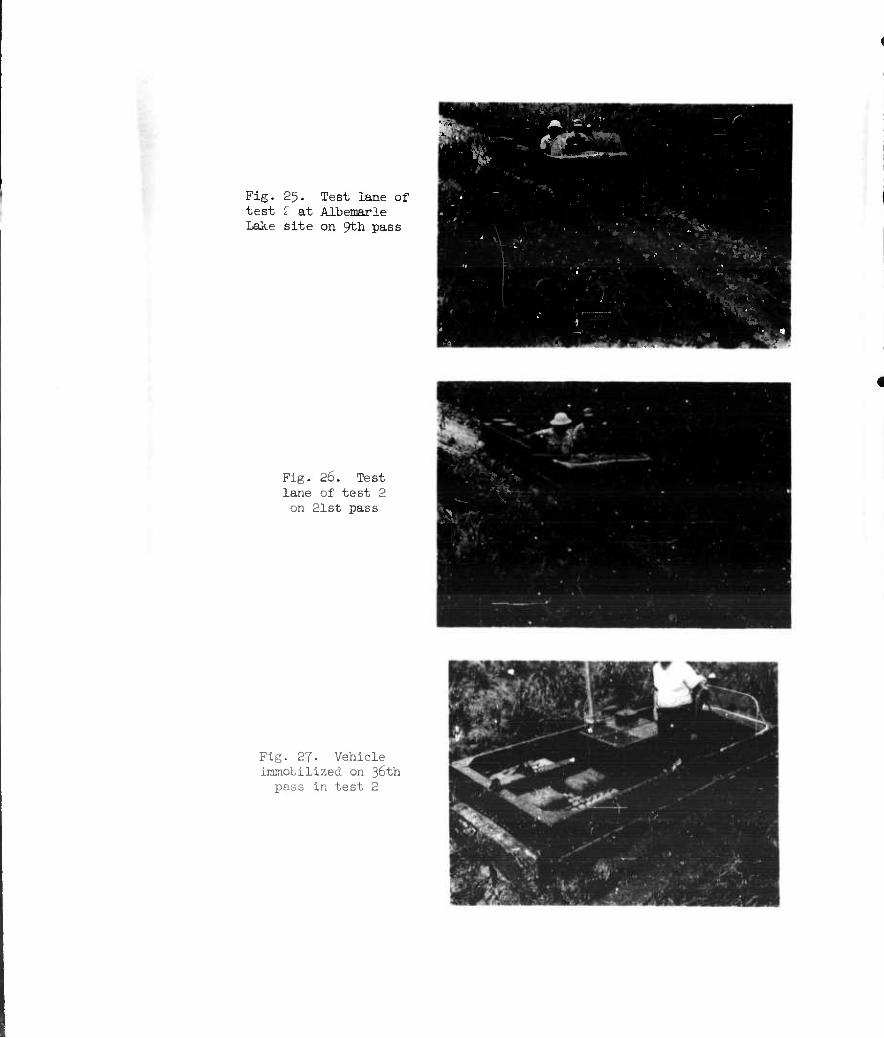
Fig. 25. Test lane of test ; at Albemarle Lake site on 9th pass
L_: ■ ■>. ,*"' KM ... - ' ':." _ •J>' r-3 ^ - »
■ • . ■ ■ • .
"T " .
\ -..■■ .
*'.- : ' " ■' J ■. ." "■ ' ':. '
■ ■»
5
, .^Ir
Fig. 26. Test lane of test 2 on 21st pass ""•N
Fig. 27- Vehicle iramoLilized on 36th pass in test 2
28
?9- Results of the tests at Albemarle Lake suggest that it would be
almost impossible to immobilize the Marsh Screw going forward in the soft
wet soil. Its good one-pass performance ability is demonstrated in tests
2 and 9 in which it completed 35 and 19 passes, respectively, on soil
strength of 3 RCI in the 3- to 9-in. layer.
60. Two tests (3 and 10; see table 6) were conducted with the M29C
weasel; data are plotted in plate 8 as squares. Test 3 was parallel and
adjacent to test h of the Marsh Screw. In test 3, the weasel was immo-
bilized on the fourth pass after completing three passes without diffi-
culty. The Marsh Screw completed 50 passes without difficulty in test k.
In test 10, the weasel was immobilized on a straight-line path in attempt-
ing to approach the test lane. A comparison of the squares with the
circles in plate 8 shows clearly that the Marsh Screw was able to complete
50 passes on weaker soil vhan that which caused an early immobilization of
the weasel. The data indicate that the weasel requires an RCI in the 3-
to 9-in. layer greater than 5. In other test programs, the weasel has
occasionally completed 50 passes on a soil strength of 8 or 9 RCI; how-
ever, very sticky soils are likely to cause the weasel to become immo-
bilized when they have built up between the tracks and the body. To allow
for this, a conservative value of 25 has been assigned to the M29C weacel
as its VCI for 50 passes. A one-pass VCI is estimated to be 18 for the
weasel.
61. It should be noted that free water was present on the surface
and in the top layer of all the soils in the Albemarle Lake tests. The
presence of free water is extremely helpful in reducing the friction be-
tween the soil and the rotors of the Marsh Screw. This point will be de-
veloped further under the discussion of the Centennial Lake tests which
follows.
62. Centennial Lake tests. Tests (table 3A) were conducted at
Centennial Lake because the soil surface there was known to be relatively
dry. Observation of the performance of the Marsh Screw at Albemarle Lake
led to the suspicion that unless free water is present on or in a soil,
the vehicle will probably experience difficulty. Also, it was felt that
a stickier soil condition than that at Albemarle Lake would cause trouble
29
for the Marsh Screw. Performance-rating cone index data are plotted in
plate 9« 63. Despite the fact that the RCI of the soil at Centennial Lake was
greater than 5, which, according to test results at Albemarle Lake, should
have meant that the Marsh Screw would not have been immobilized, each of
the six tests conducted resulted in immobilization. In test 69, the ve-
hicle was empty; it was loaded (395^ lb) for the other tests. Four of the
tests (67, 68, 69, and JO) were similar in that immobilization occurred
on a reverse pass early in the test and the vehicle could not turn its
rotors because of insufficient power. The Marsh Screw was immobilized on
its first pass in test 72 because of deep sinkage and insufficient traction
in a natural soil condition. This was the only instance in the entire test
program in which a first-pass immobilization occurred.
61K Test 67 is typical of four (67, 68, 69, and 70) of the five
tests in which immobilizations occurred while the vehicle was traveling in
reverse. Pig. 28 shows the teet lane before traffic. The vehicle
Fig. 28. Site of test 67 at Centennial Lake before traffic
proceeded down the lane, but had difficulty in maintaining a straight path.
It left a rut h.k in. deep. The vehicle remained stationary at the end of
the test lane for about 10 min while personnel measured soil data in the
ruts. When an attempt was made to back it up, the vehicle merely raced its
30
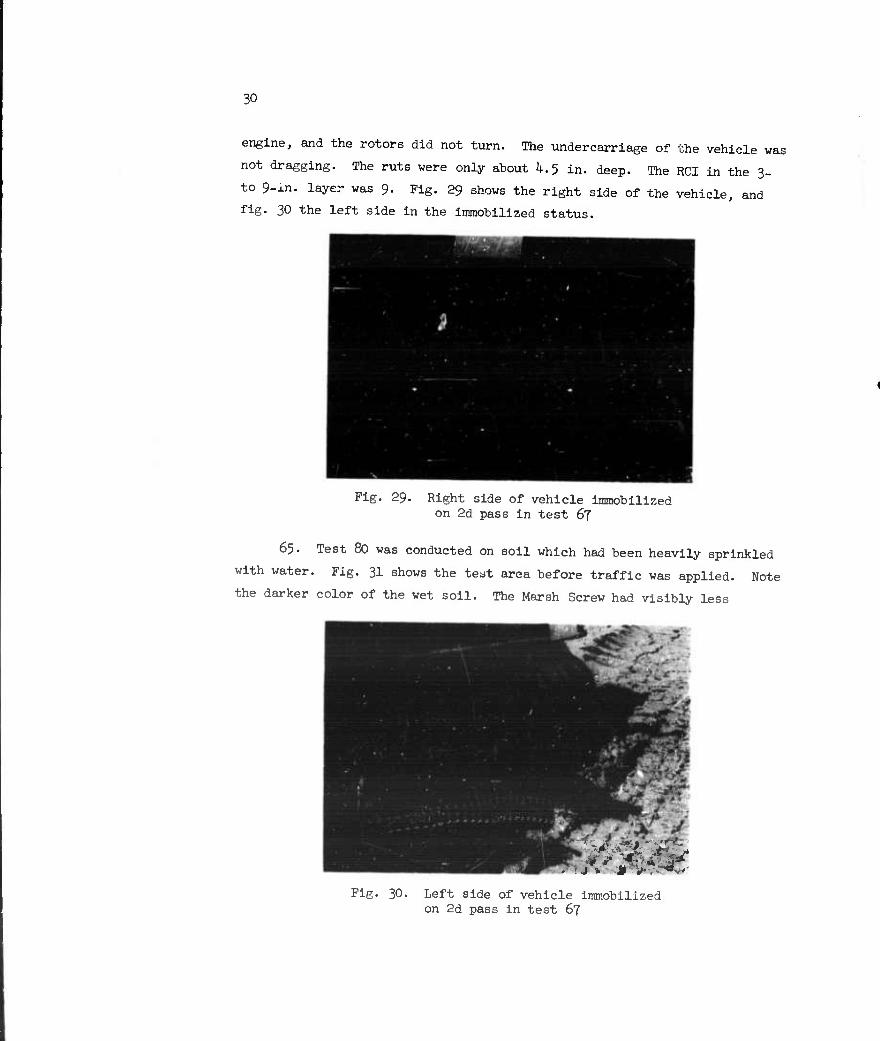
engine, and the rotors did not turn. The undercarriage of the vehicle was
not dragging. The ruts were only about 4.5 in. deep. The RCI in the 3-
to 9-xn. layer was 9- Fig. 29 shows the right side of the vehicle, and
fig. 30 the left side in the immobilized status.
Fig. 29. Right side of vehicle immobilized on 2d pass in test 67
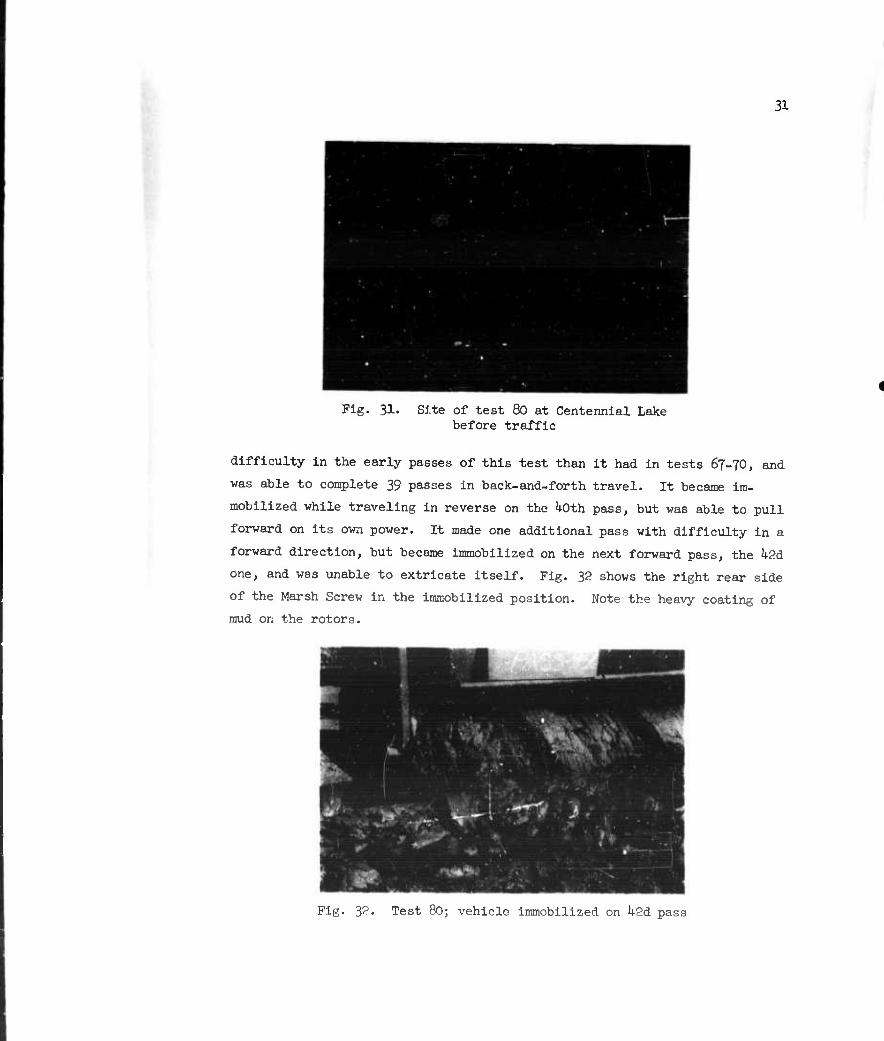
65. Test 80 was conducted on soil which had been heavily sprinkled
with water. Fig. 31 shows the teat area before traffic was applied. Note
the darker color of the wet soil. The Marsh Screw had visibly less
Fig. 30. Left side of vehicle immobilized on 2d pass in test 67
31
Fig. 31. Site of test 80 at Centennial Lake before traffic
difficulty in the early passes of this test than it had in tests 67-70, and
was able to complete 39 passes in back-and-forth travel. It became im-
mobilized while traveling in reverse on the ^Oth pass, but was able to pull
forward on its own power. It made one additional pass with difficulty in a
forward direction, but became immobilized on the next forward pass, the k2ä.
one, and was unable to extricate itself. Fig. 32 shows the right rear side
of the Marsh Screw in the immobilized position. Note the heavy coating of
mud or: the rotors.
Fig. 32. Test 80; vehicle immobilized on ^2d pass
32
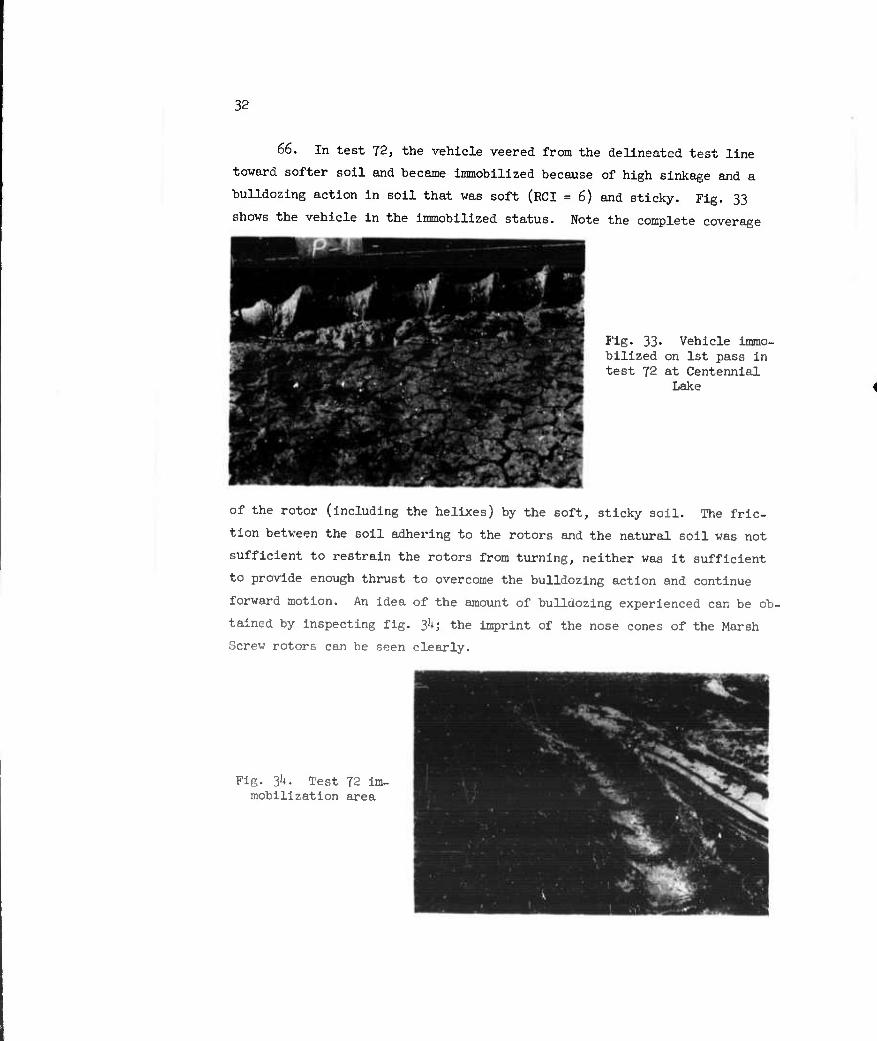
66. In test 72, the vehicle veered from the delineated test line
toward softer soil and became immobilized because of high sinkage and a
bulldozing action in soil that was soft (RCI = 6) and sticky. Fig. 33
shows the vehicle in the immobilized status. Note the complete coverage
Fig. 33- Vehicle immo- bilized on 1st pass in test 72 at Centennial
Lake
of the rotor (including the helixes) by the soft, sticky soil. The fric-
tion between the soil adhering to the rotors and the natural soil was not
sufficient to restrain the rotors from turning, neither was it sufficient
to provide enough thrust to overcome the bulldozing action and continue
forward motion. An idea of the amount of bulldozing experienced can be ob-
tained by inspecting fig. 3k; the imprint of the nose cones of the Marsh
Screw rotors can be seen clearly.
Fig. 3k. Test 72 im- mobilization area
33
67- When the vehicle became immobilized on a reverse pass (because
of insufficient power to turn the rotors) in tests 67, 68, 69, 70, and 80,
the tests were continued by driving the vehicle forward, turning out of the
test lane, and then reentering it going forward. This process was repeated
until the soil in the test lane had been thoroughly mixed and softened,
when normal back-and-forth travel was resumed. The following tabulation
lists the pass in each of these tests on which original immobilization oc-
curred, the number of passes made in a forward direction before back-and-
forth travel was resumed, and the pass number on which the "final" im-
mobilization occurred.
Original Test Immobilization No. Pass No.
67 2 68 2 69 8 70 2 80 1+0
No. of Forward Passes
2 5 6
Final Immobilization
Pass No.
2^ (reverse) 6 (forward)
Vf (forward)
k2 (forward)
68. One test (test 71) was conducted with the M29C weasel very
close to the site of test 67 with the Marsh Screw. On a rating cone index
of 8 (see table 6A) the vehicle completed 1.8 passes despite the fact that
it began to drag on about the sixth pass. It was immobilized on the IQth
pass in the conventional manner, i. e. deep sinkage, bulldozing, and
spinning of tracks occurred. On the basis of this test and of previous
tests with the M29C weasel, it was obvious that the performance of the
M29C weasel was superior to that of the Marsh Screw in the particular soil
conditions at Centennial Lake.
69. Prepared buckshot clay tests. A special test course (see
table 5 for test data) was constructed of buckshot clay for the purpose of
determining whether a relatively thin, soft, sticky layer over a rirm one
would provide difficulty for the Marsh Screw. A stockpile of buckshot clay
was partially leveled and compacted. Very dry, loose, powdery buckshot
clay soil was then spread about 6 in. thick on the surface, and water was
applied to the surface by fire hoses intermittently over a two-day period.
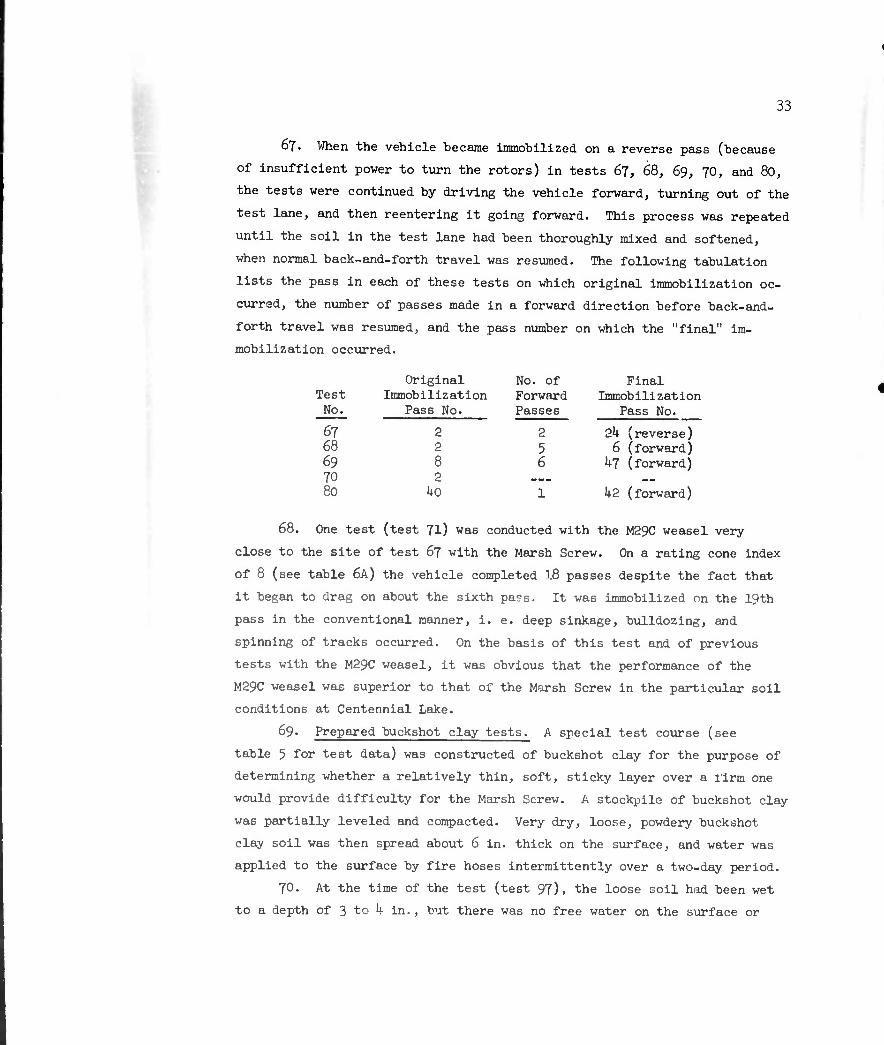
70. At the time of the test (test 97), the loose soil had been wet
to a depth of 3 to ^ in., but there was no free water on the surface or
3^
Fig. 35. Test 97 on the buc'ishot clay area with vehicle immobilized on 1st pass (first attempt)
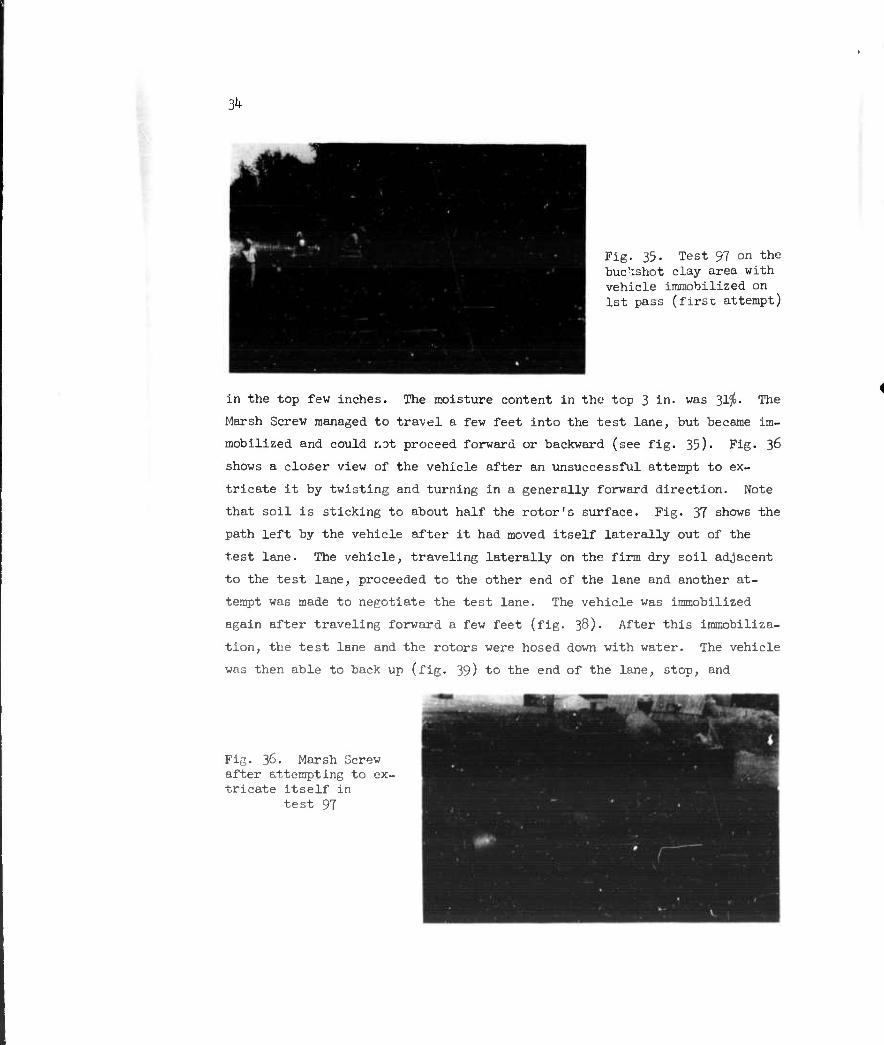
in the top few inches. The moisture content in the top 3 in. was 31^. The
Marsh Screw managed to travel a few feet into the test lane, but became im-
mobilized and could nDt proceed forward or backward (see fig. 35). Fig. 36
shows a closer view of the vehicle after an unsuccessful attempt to ex-
tricate it by twisting and turning in a generally forward direction. Note
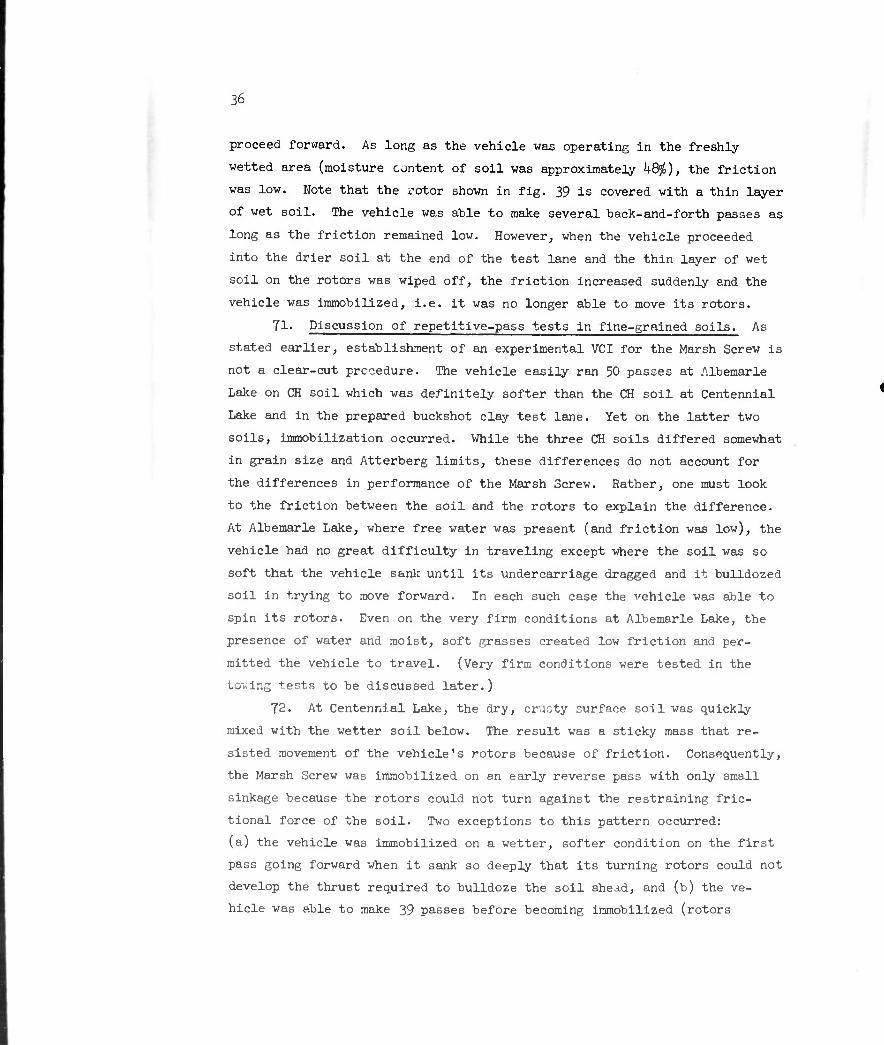
that soil is sticking to about half the rotor's surface. Fig. 37 shows the
path left by the vehicle after it had moved itself laterally out of the
test lane. The vehicle, traveling laterally on the firm dry soil adjacent
to the test lane, proceeded to the other end of the lane and another at-
tempt was made to negotiate the test lane. The vehicle was immobilized
again after traveling forward a few feet (fig. 38). After this immobiliza-
tion, the test lane and the rotors were hosed down with water. The vehicle
was then able to back up (fig. 39) to the end of the lane, stop, and
Fig. 36. Marsh Screw after attempting to ex- tricate itself in
test 97
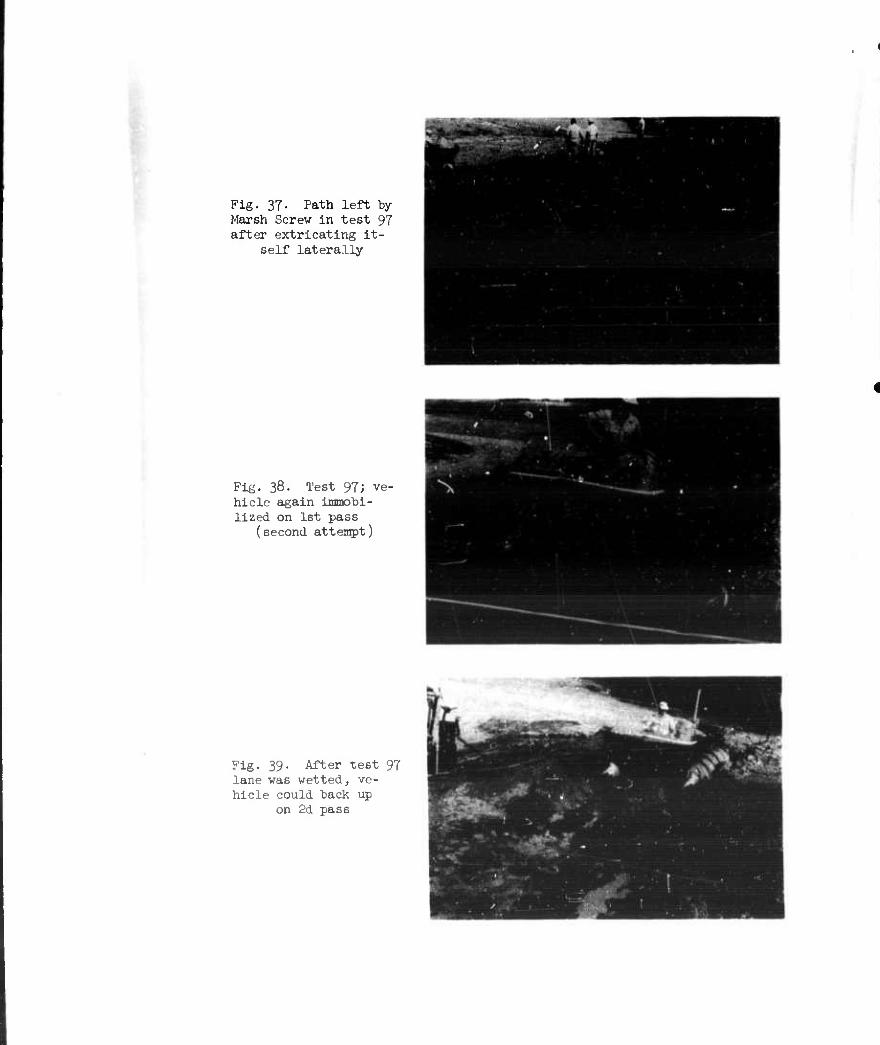
Flg. 37. Path left by Marsh Screw in test 97 after extricating it-
self laterally
Fig. 38. Test 97; ve- hicle again immobi- lized on 1st pass
(second attempt)
Fig. 39. After test 97 lane was wetted, ve- hicle could back up
on 2d pass
36
proceed forward. As long as the vehicle was operating in the freshly-
wetted area (moisture content of soil was approximately 48^), the friction
was low. Note that the rotor shown in fig. 39 is covered with a thin layer
of wet soil. The vehicle was able to make several back-and-forth passes as
long as the friction remained low. However, when the vehicle proceeded
into the drier soil at the end of the test lane and the thin layer of wet
soil on the rotors was wiped off, the friction increased suddenly and the
vehicle was immobilized, i.e. it was no longer able to move its rotors.
71. Discussion of repetitive-pass tests in fine-grained soils. As
stated earlier, establishment of an experimental VCI for the Marsh Screw is
not a clear-cut procedure. The vehicle easily ran 50 passes at Albemarle
Lake on CH soil which was definitely softer than the CH soil at Centennial
Lake and in the prepared buckshot clay test lane. Yet on the latter two
soils, immobilization occurred. While the three CH soils differed somewhat
in grain size and Atterberg limits, these differences do not account for
the differences in performance of the Marsh Screw. Rather, one must look
to the friction between the soil and the rotors to explain the difference.
At Albemarle Lake, where free water was present (and friction was low), the
vehicle had no great difficulty in traveling except where the soil was so
soft that the vehicle sank until its undercarriage dragged and it bulldozed
soil in trying to move forward. In each such case the vehicle was able to
spin its rotors. Even on the very firm conditions at Albemarle Lake, the
presence of water and moist, soft grasses created low friction and per-
mitted the vehicle to travel. (Very firm conditions were tested in the
towing tests to be discussed later.)
72. At Centennial Lake, the dry, cructy surface soil was quickly
mixed with the wetter soil below. The result was a sticky mass that re-
sisted movement of the vehicle's rotors because of friction. Consequently,
the Marsh Screw was immobilized on an early reverse pass with only small
sinkage because the rotors could not turn against the restraining fric-
tional force of the soil. Two exceptions to this pattern occurred:
(a) the vehicle was immobilized on a wetter, softer condition on the first
pass going forward when it sank so deeply that its turning rotors could not
develop the thrust required to bulldoze the soil ahead, and (b) the ve-
hicle was able to make 39 passes before becoming immobilized (rotors
37
not turning) when the surface of the soil was artificially wetted.
73« The testing on the prepared buckshot soil test Ian« also clearly-
demonstrated the extreme importance of low friction to the successful
operation of the Marsh Screw. Unable to move on the soil when no free
water was present, the Marsh Screw moved easily when water was sprinkled
on the surface, and continued to move freely until mixing of the wet soil
with drier soil (and perhaps evaporation) had reduced the water content of
the soil upon which it was operating.
7^. The majority of immobilizations occurred while the vehicle was
traveling in reverse. The loaded vehicle is designed to ride with a high
bow in water. The rear end will thus begin to drag and bulldoze before the
front end in a repetitive-pass test on soil. In the immobilizations that
occurred at Albemarle Lake, the vehicle had sunk deeply and was bulldozing,
with rotors turning. However, at Centennial Lake, the vehicle's "initial"
immobilizations occurred, for the most part, with no bulldozing, and were
the result of insufficient power to turn the rotors against the soil. Ac-
cording to the manufacturer, the screw action is exactly the same whether
the vehicle travels forward or backward, but the torque and final drive
output are slightly higher in low forward gear (ratio of 2.^5:1) than in
reverse (ratio of 2.20:1). The unequal weight distribution partially ex-
plains the generally better performance while traveling forward. It was
noted, however, that in the tests at Centennial Lake which were continued
after the initial Immobilization, subsequent Immobilizations occurred
while the vehicle was traveling forward in back-and-forth tests. The ad-
vantage of traveling forward, therefore, probably cannot be considered
great.
Straight-line speed tests
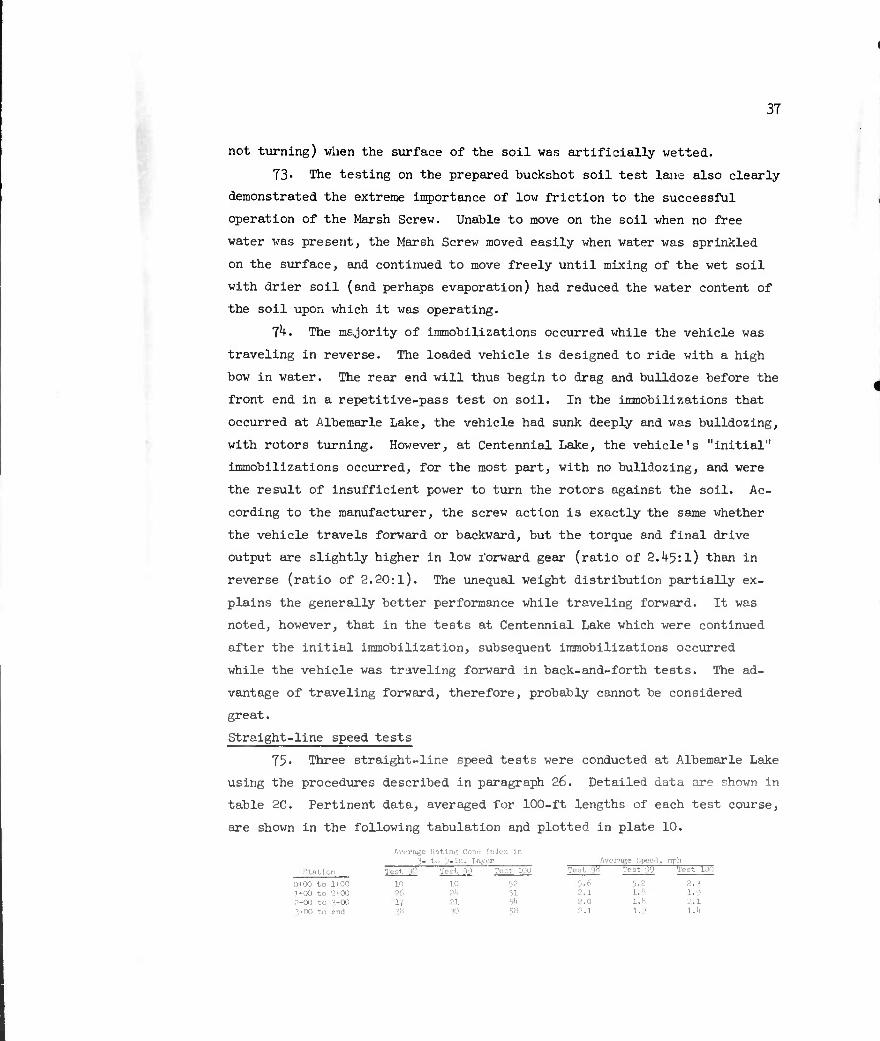
75- Three straight-line speed tests were conducted at Albemarle Lake
using the procedures described in paragraph 26. Detailed data are shown in
table 2C. Pertinent data, averaged for 100-ft lengths of each test course,
are shown in the following tabulation and plotted in plate 10.
Avc ra+jc Rating COHL' [nde ; In - to 9-11 . r,)ty T Avc f:ir/' ..p'"' : mph
ijtatlon
10
01 Test
10
22 Tc ;l 100
52
Teat 90
5.6
Test 09
5.2 t. -ct lort
OK» to 11-00 2.1
3+00 to 2+00 26 'A 51 2.1 i.e 1.9 2+00 to 3+00 17 21 si. 2.0 1.8 2.1 3100 to end -'/' » 5B 2.1 1.9 l.lt
38
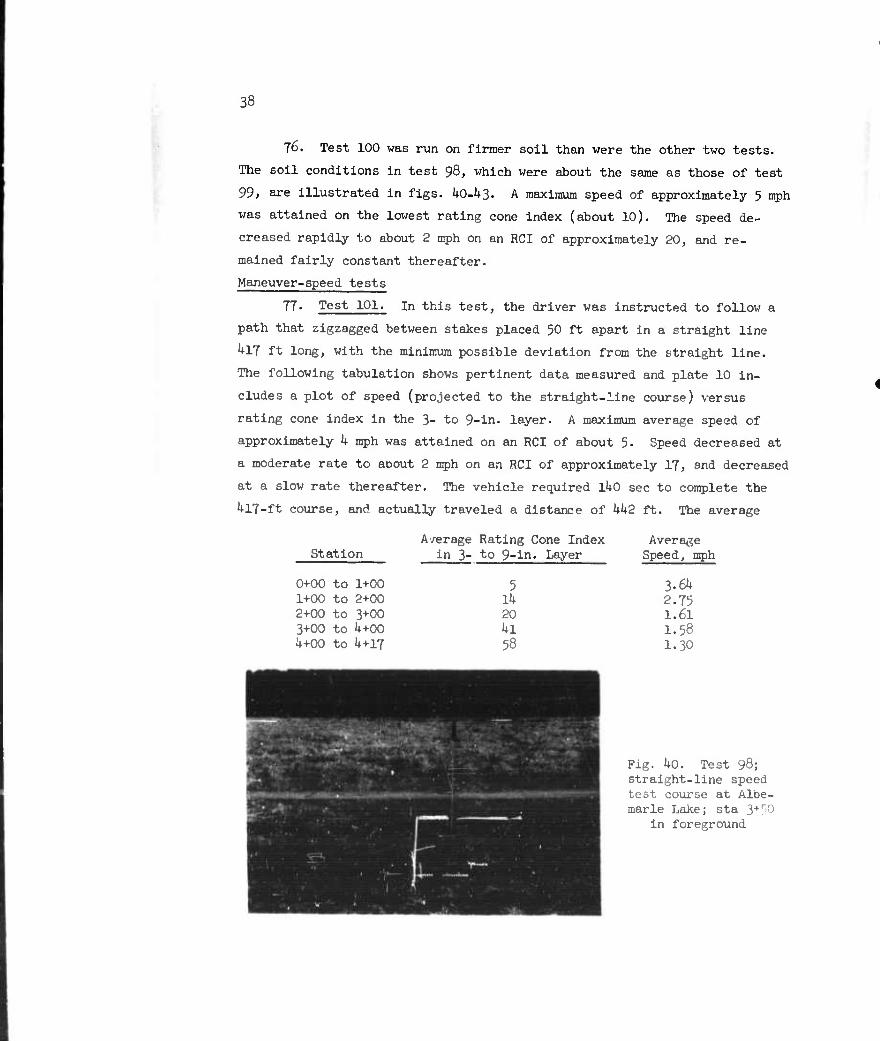
76. Test 100 was run on firmer soil than were the other two tests.
The soil conditions in test 98, which were about the same as those of test
99, are illustrated in figs. 40-43. A maximum speed of approximately 5 mph
was attained on the lowest rating cone index (about 10). The speed de-
creased rapidly to about 2 mph on an RCI of approximately 20, and re-
mained fairly constant thereafter.
Maneuver-speed tests
77- Test 101. in this test, the driver was instructed to follow a
path that zigzagged between stakes placed 50 ft apart in a straight line
kn ft long, with the minimum possible deviation from the straight line.
The following tabulation shows pertinent data measured and plate 10 in-
cludes a plot of speed (projected to the straight-line course) versus
rating cone index in the 3- to 9-in. layer. A maximum average speed of
approximately k mph was attained on an RCI of about 5. Speed decreased at
a moderate rate to aoout 2 mph on an RCI of approximately 17, and decreased
at a slow rate thereafter. The vehicle required lUO sec to complete the
14-17-ft course, and actually traveled a distance of kk2 ft. The average
A/erage Rating Cone Index Average Station in 3- to 9-in. Layer Speed, mph
0+00 to 1+00 5 3.64 1+00 to 2+00 14 2.75 2+00 to 3+00 20 1.61 3+00 to 4+00 41 1.58 4+00 to 4+17 58 1.30
Pig. 40. Test 98; straight-line speed test course at Albe- marle Lake; sta S4^
in foreground
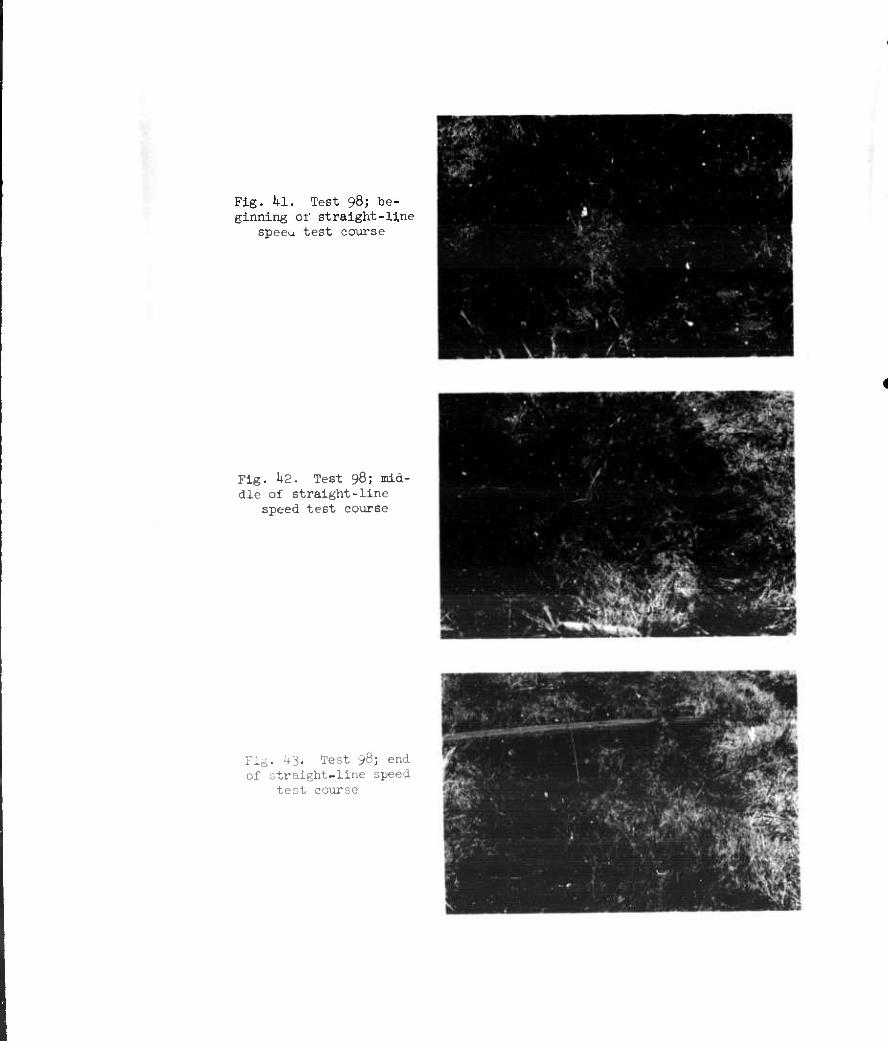
Fig. la. Test 98; be- ginning of straight-line
spee<-i test course
Fig. k2. Test 98; mid- dle of straight-line
speed test course
Fig. ^3. Test 98; end of straight-line speed
test course
ko
speed developed along the straight course was 2 mph; the actual average
speed of the moving vehicle on its sinuous course was 2.2 mph.
78. Test 102. In this test, the driver was instructed to complete
the course in the fastest possible time, using lateral movement of the ve-
hicle to maneuver between stakes spaced at 50-ft intervals along a 525-ft-
long path whenever he felt this would be advantageous. The time required
to complete the course was 150 sec, and the actual distance traveled was
63O ft. The net speed was thus 2.k mph, and the actual speed was 2.9 mph.
No attempt was made to relate speed to soil strength in this test because
of the complexity caused by the lateral movements. The RCI varied fairly
uniformly from about 3 at the start of the course to about ^0 at the end.
79- Test 103. A straight-line course 480 ft long was marked with
stakes 30 ft apart. The driver was instructed to maneuver between the
stakes in the fastest possible time. He employed a significai.o amount of
lateral movement in traversing the course. The total time was 210 sec; the
total actual distance covered was 6l6 ft. The average net speed for the
course was 1.6 mph; the actual average speed of movement over the 6l6 ft
was 2.8 mph. The soil condition was very similar to that in test 102.
Obstacle tests
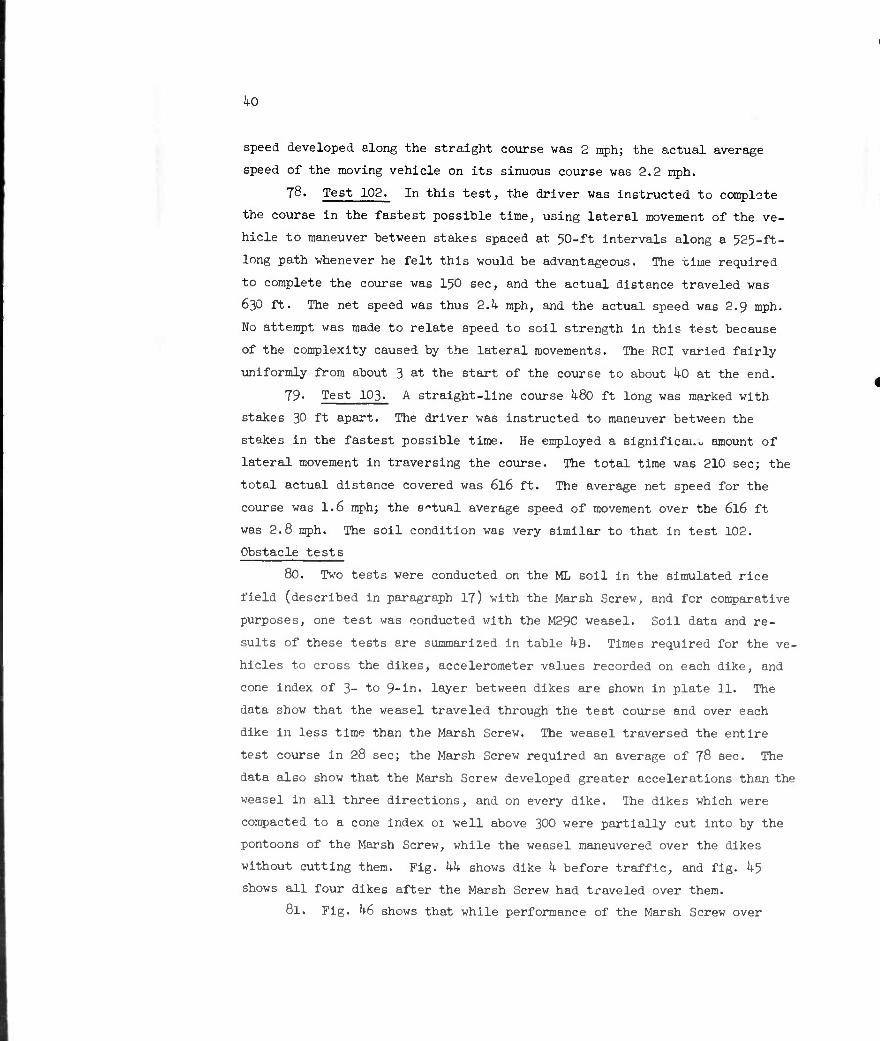
80. Two tests were conducted on the ML soil in the simulated rice
field (described in paragraph 17) with the Marsh Screw, and for comparative
purposes, one test was conducted with the M29C weasel. Soil data and re-
sults of these tests are summarized in table kB. Times required for the ve-
hicles to cross the dikes, accelerometer values recorded on each dike, and
cone index of 3- to 9-ln. layer between dikes are shown in plate 11. The
data show that the weasel traveled through the test course and over each
dike in less time than the Marsh Screw. The weasel traversed the entire
test course in 28 sec; the Marsh Screw required an average of 78 sec. The
data also show that the Marsh Screw developed greater accelerations than the
weasel in all three directions, and on every dike. The dikes which were
compacted to a cone index 01 well above 300 were partially cut into by the
pontoons of the Marsh Screw, while the weasel maneuvered over the dikes
without cutting them. Fig. kk shows dike k before traffic, and fig. ^5
shows all four dikes after the Marsh Screw had traveled over them.
81. Fig. k6 shows that while performance of the Marsh Screw over
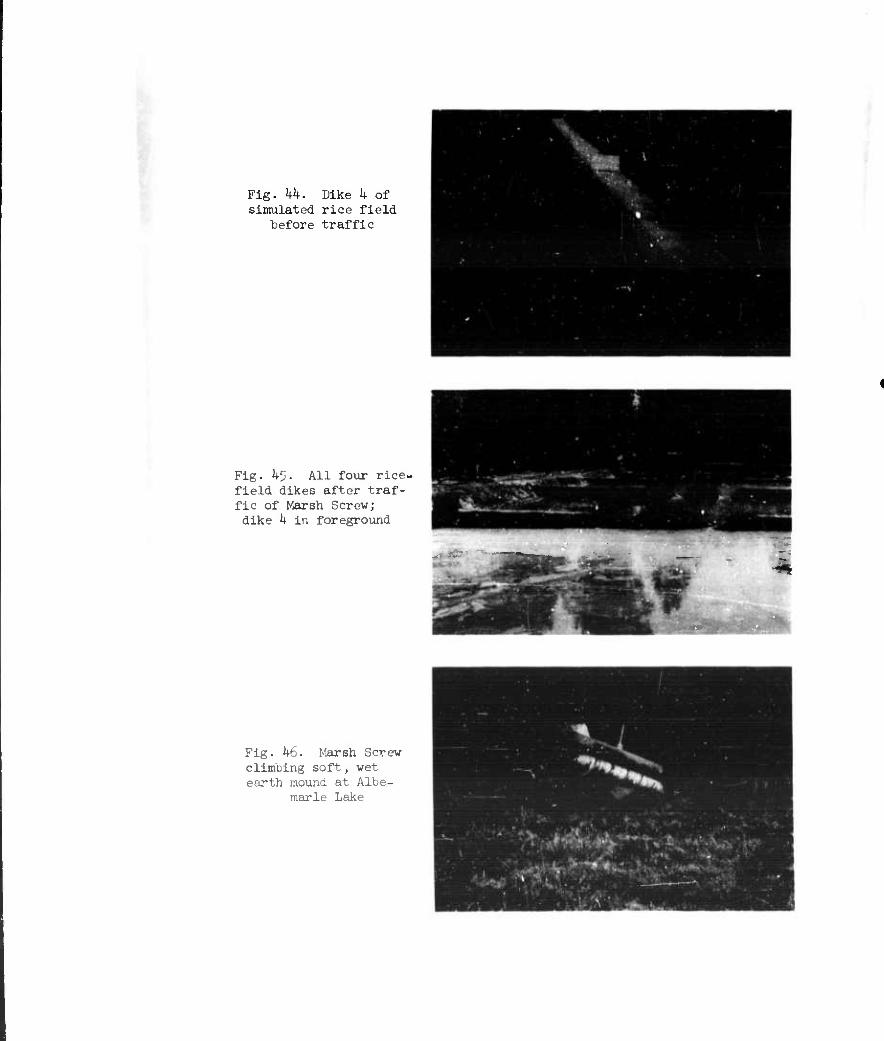
Fig. kk. Dike k of simulated rice field
before traffic
Fig. 45. All four rice, field dikes after traf- fic of Marsh Screw; dike k in foreground
Fig. ^6. Marsh Screw climbing soft, wet earth mound at Albe-
marle Lake
h2
the firm, stabilized dikes of the simulated rice field was generally con-
sidered poor, the vehicle could climb 3-ft-high, wide-based, soft mounds of
wet earth (at Albemarle Lake) with little difficulty.
82. Attempts were made to test an M37 3/^-ton truck and an M38AI
jeep on the prepared test course, but both of these vehicles were immobi-
lized on dike 2.
Towing force-slip tests
83. Data collected in towing force-slip tests with the Marsh Screw
at Albemarle Lake and Centennial Lake are shown in tables 2B and 3E,
respectively, and similar data for the M29C weasel are shown in table 6B.
All data are plotted in plate 12. The Marsh Screw test data appear as
circles (Albemarle) and squares (Centennial), while the weasel test data
appear as triangles. Test numbers, rating cone index, and vehicle speed
are shown for each test.
8h. When a sufficient number of tests have been made with a vehicle
in the same or similar soil conditions, it usually is feasible to develop a
towing force-slip curve. Such a curve is shown for the M29C weasel, and it
is fairly typical for tracked vehicles on fine-grained soils. The dashed
extension of the curve Is assumed on the basis of previous knowledge of
towing force-slip relations for the M29C weasel in fine-grained soils.
85. The many data points shown for the Marsh Screw cover a wide
range of soil strength and appear, at first glance, to be meaningless.
However, It was possible to select eight points which represented a narrow
range of strength, i.e. RCI between 19 and 31. These points, six of which
represent a wet surface at Albemarle Lake, appeared to define a fairly
smooth curve, which was therefore drawn and is shown in plate 12. Note
that the curve reaches a maximum value of towing force (42^) at a
slip of about 28^, and that thereafter towing force decreased with in-
creasing slip. In general, the other data points in plate 12 for the
Marsh Screw appear to be located properly with respect to the curve drawn.
Note, for example, that tests T^B and 76 conducted on soil with RCI's
much lower than 19 fall well below the curve, while tests conducted on soil
with higher RCI's are, for the most part, above or to the left of the
curve. While there are some anomalies among the data points, it neverthe-
less is considered that the curve shown for the Marsh Screw can be
^3
accepted, at least tentatively, as a reasonably accurate measure of its
towing force-slip relations on fine-grained soil with an RCI between about
20 and 30.
86. The curve for the M29C weasel lies well above that for the Marsh
Screw. Moreover, the M29C curve Indicates retention of maximum towing
force with Increasing slip, whereas the Marsh Screw curve Indicates a re-
duction in towing force (from a peak value) with increasing slip. Since
the small difference in soil strength involved is not considered to be the
cause of the relative positions of the two curves, it must be concluded
that the M29C exhibits superior towing force-slip characteristics.
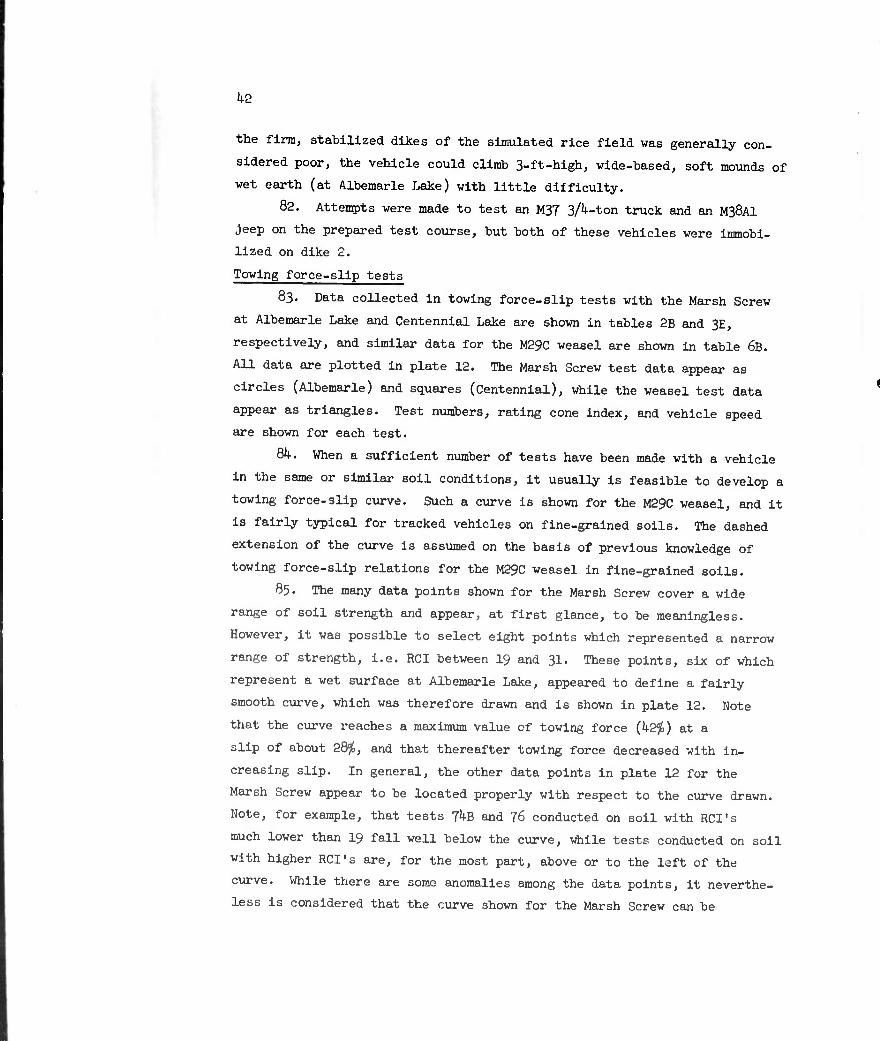
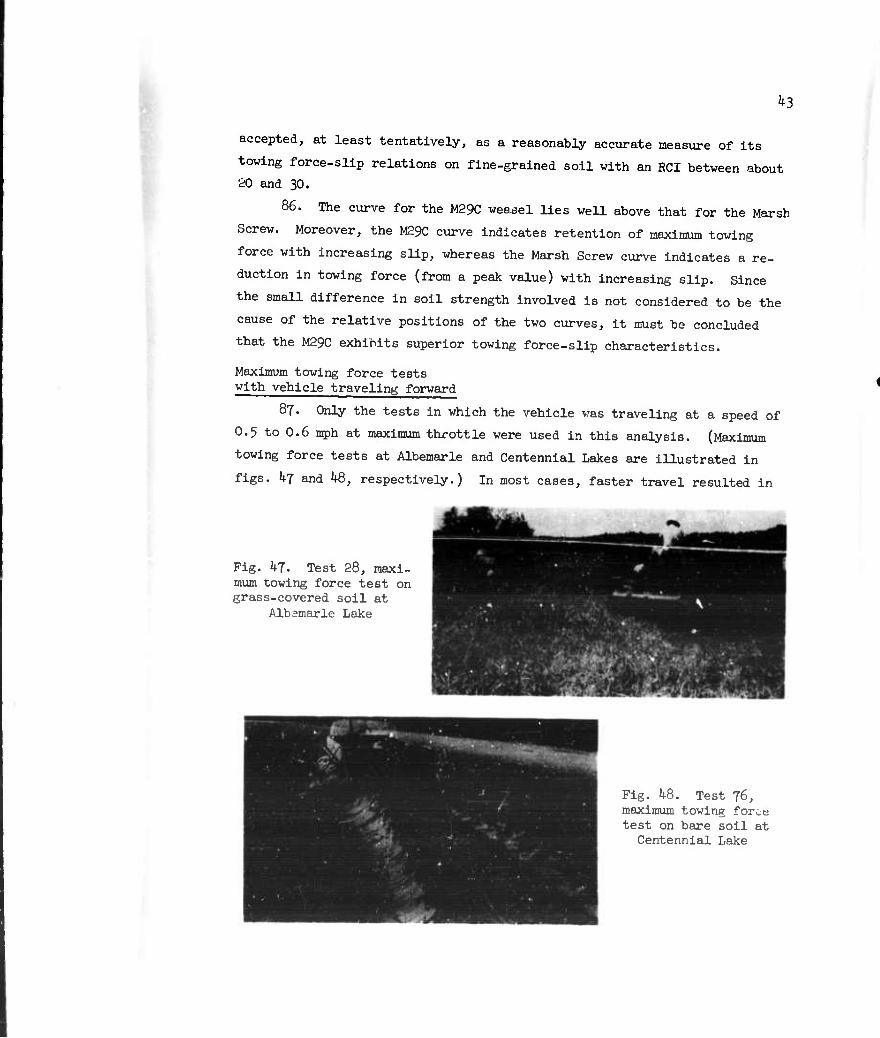
Maximum towing force tests with vehicle traveling forward
87. Only the tests in which the vehicle was traveling at a speed of
0.5 to 0.6 mph at maximum throttle were used in this analysis. (Maximum
towing force tests at Albemarle and Centennial Lakes are illustrated in
figs, kj and h8, respectively.) In most cases, faster travel resulted in
Fig. 47. Test 28, maxi- mum towing force test on grass-covered soil at
Albsmarle Lake
Fig. ho. Test 76, maximum towing force test on bare soil at
Centennial Lake
kk
smaller towing forces, and slower travel in larger towing forces, on the
same soil conditions. The speed selected for this analysis, while very-
slow, appeared to be commensurate with the normal speed of about 2 mph at-
tainable at no load on most soil conditions tested in this program.
88. The towing force and rating cone index data from Albemarle and
Centennial Lakes and WES are shown in tables 2B, 3B, and kA, respectively,
and are plotted in plate 13. For each test, the test number, slip (when
measured), and speed are shown. Because of the difference in vehicle per-
formance in repetitive-pass tests at the two lake sites, data in this anal-
ysis have been identified with the site at which the test was run. The
Albemarle Lake tests appear as circles. Centennial Lake tests as squares,
and the one WES test as a triangle.
89. The smooth curve drawn for the Albemarle points appears to fit
them quite well and also appears to include the one WES point. A maximum
drawbar pull at about kO RCI appears reasonable, since at this strength the
soil is firm enough to limit rutting but soft enough to allow penetration
of the helixes. Although the soil at the WES site did not meet the crite-
rion of surface wetness met by the Albemarle tests, there was a good stand
of grass at the WES site that provided the low friction the Marsh Screw
s^fms to need for good performance.
90. The curve drawn for the Centennial Lake soils was influenced by
the shape of the Albemarle-WES curve. It does not represent its points
quite as well as did the Albemarle-WES curve. Note that two Centennial
Lake tests (82C and 8^B) fall among the Albemarle test data. Test 82C is
the only one conducted at Centennial Lake on grass-covered soil; the soil
in the remainder of the tests at Centennial Lake was bare. The soil in all
the Albemarle-WES tests was covered with grass. No juch explanation exists
for the poor fit of test 84B to the curve.
91. In view of the generally poor performance in the repetitive-pass
tests at Centennial Lake, the high maximum towing forces developed on the
same soil are surprising. Note, for example, from plate 13, that the Marsh
Screw developed a pull equal to hZfy of its weight on an RCI of about
hO, whereas in the repetitive-pass tests it was immobilized on the second
pass on an RCI in the 3- to 9-in. layer of 11 (see test 70, plate 9). The
towing forces generated are explained qualitatively by three observations:
^5
first, the vehicle may have been at its maximum efficiency for these tests
(see paragraph ll); second, the vehicle performs better traveling forward;
and third, at the slow speed of travel in the towing tests (about 0.5 mph)
the torque output was significantly greater than it was at the speed of
travel in the repetitive-pass tests (about 1.5 mph). (See Appendix B.)
92. A similar curve for the weasel (taken from TM 3-2^0, Supplement
l^) is shown for comparison. Note that at RCI's less than about 35 the
performance of the Marsh Screw exceeds that of the weasel both at Albemarle
Lake and Centennial Lake, whereas the M29C weasel shows a decided advantage
on RCI's greater than ^0.
Maximum towing force tests with vehicle traveling laterally
93. On firm soil, the Marsh Screw could travel laterally better than
it could move forward or backward. Six maximum towing force tests, chree
each at Albemarle Lake and Centennial Lake, were conducted with the ve-
hicle, weighing 393k lb, traveling laterally. Fig. k-S shows the Marsh
Screw towing laterally. Results of these tests are shown in tables 2B
and 3B and in plate lk.
The shape of the per-
formance curve for these
tests more closely re-
sembles the maximum
towing force curve for
conventional vehicles
than the curves shown in
plate 13 when the Marsh
Screw was traveling for-
ward. It also closely
resembles the curve for
the M29C weasel, which
is included in plate lk.
(This curve is the same one shown in plate 13.) This close resemblance
is probably cau3ed by the fact that the vehicle had adequate power when
traveling laterally on firm soil. At an RCI of 300, the vehicle
could develop a maximum pull of 6% of its weight; however, lateral
Fig. ^9. Marsh Screw towing laterally
k6
pulls were noticeably harmful to the structural components of the vehicle.
Toved-vehlcle tests
9^. An attempt was made to tow the Marsh Screw at Albemarle Lake on
an RCI of 300+ using the M29C weasel. However, the pintle hook on the
Marsh Screw was pulled out of shape in movinj the vehicle, and the attempt
was halted.
95- On the same soil condition, a force of 650 lb was required to
move the Marsh Screw laterally at a speed of about 1 mph.
Tests in Water
96. Quantitative tests in water were not scheduled, but several ex-
cursions of the Marsh Screw into the Mississippi River for motion picture
purposes permitted some general observations. The vehicle appeared to be
quite stable in water, responded readily to steering, and traveled at what
was estimated to be 5 or 6 mph. It had no difficulty, beyond the normal
difficulty it had on level sand, in entering the water from the sand beach
(slope about 1 to 6^) and returning to the beach from the water.
Tests in Transitional Zone Between Deep Water and Water-Free Soil Surfaces
97- Quantitative tests to determine the Marsh Screw's performance,
in terms of speed, across the zone between deep water and water-free soil
surfaces were not scheduled since previous testing in marshland conditions
indicated the vehicle performed well, at least on a one-pass basis, in
areas where ample water was present to wash the rotors free of cohesive
soils. On a number of occasions, the Marsh Screw traveled across this zone
at Albemarle Lake to reach deep water in order to wash the rotors free of
soil after completion of tests in which soil adhered to the undercarriage
and rotors. On a typical "run" from deep water to water-free soil sur-
faces, the Marsh Screw appeared to travel at speeds of 5 and 6 mph in deep
water; when the vehicle approached the water's edge and the rotor blades
began to bite into the soil beneath the water, the vehicle's speed was
noted to Increase considerably (perhaps to 20 or 25 mph) through a certain
zone where water covered the coll surface, but vehicle speed decreased
47
rather suddenly as the vehicle ran out onto the water-free soil surfaces.
In attempts to reach deep water from water-free soil surfaces, the weasel
became immobilized in the very soft soil (RCI approximately 5)- Water was
approximately 2 in. deep where the vehicle became immobilized.
1+8
PART V: CONCLUSIONS AND RECOMMENDATIONS
Conclusions
98. Based on the results of the testing accomplished in this program
with the Marsh Screw and the M29C weasel, and upon known performance of the
latter in previous test programs,* the following conclusions are offered
regarding the performance of the Marsh Screw on various media, particularly
in comparison to the M29C weasel.
Performance on sand
99- The performance of the Marsh Screw Amphibian on a natural beach
sand with a cone index ranging from 50 to 150 was as follows:
Vehicle Condition
Unloaded
Performance
Could complete 50 or more back-and-forth passes, but steering was difficult, progress labored, and speed slow, especially in the early stages of the tests.
Loaded Could not travel in reverse and could only make two or three passes going forward.
Attained a maximum speed on the first pass of 2.3 mph, but only for a brief period. The average maximum speed attained was about 1.6 mph.
Could not execute even moderately severe maneuvers.
Could climb an 18^ slope, but could not climb a 21^ slope.
On a CI of approximately 100 to 150, developed enough thrust to barely propel itself at about 1 mph and about 20^ slip.
On a CI of about 100 to 150, could exert a maximum towing force of 26^ at 55^ slip and at a speed of only 0.5 mph when traveling at full throttle. For slips greater than 55%, towing force remained constant at about 26^.
Loaded or Could travel laterally with greater speed and fa- unloaded cility than it could travel forward or backward,
but could not be steered.
* WES TM 3-2^0, Trafficability of Soils, and Supplements 1-17 thereto; and WES MP ^-^39, Trafficability Tests with the Airoll on Organic and Mineral Soils (August 1961).
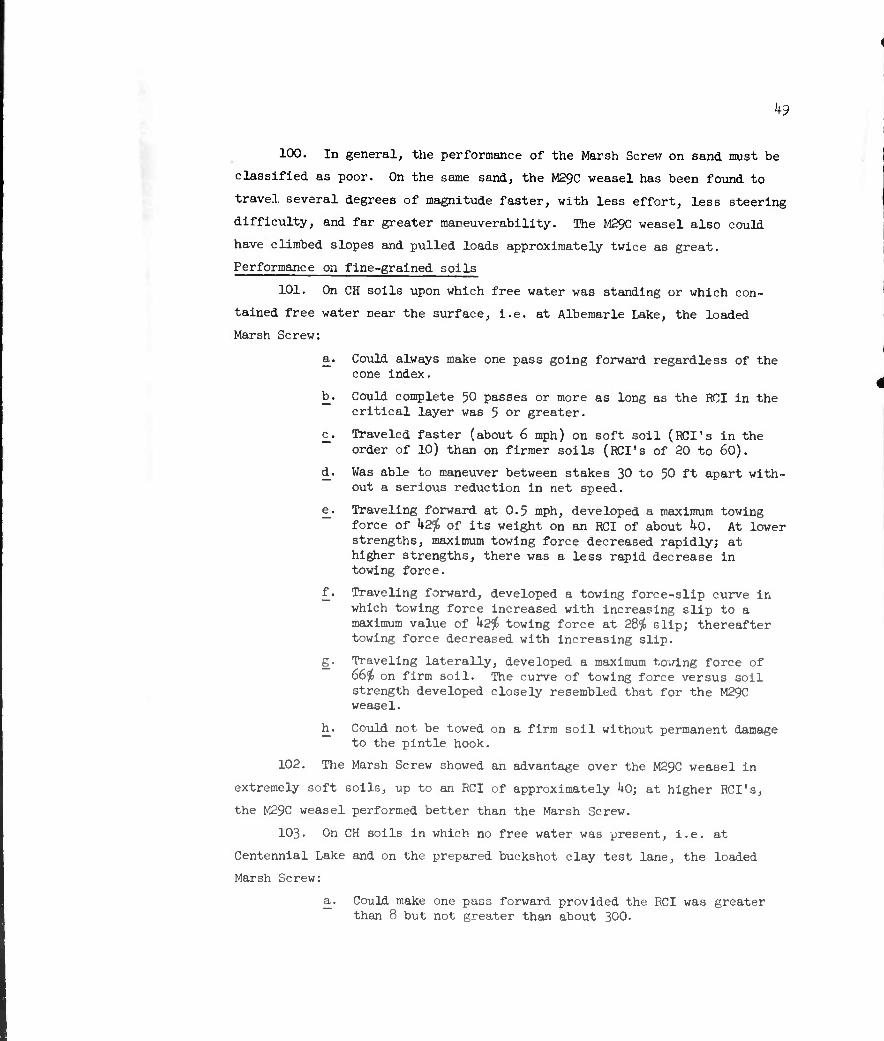
h9
100. In general, the performance of the Marsh Screw on sand must be
classified as poor. On the same sand, the M29C weasel has been found to
travel several degrees of magnitude faster, with less effort, less steering
difficulty, and far greater maneuverability. The M29C weasel also could
have climbed slopes and pulled loads approximately twice as great.
Performance on fine-grained soils
101. On CH soils upon which free water was standing or which con-
tained free water near the surface, i.e. at Albemarle Lake, the loaded
Marsh Screw:
a. Could always make one pass going forward regardless of the cone index.
b. Could complete 50 passes or more as long as the RCI in the critical layer was 5 or greater.
c. Traveled faster (about 6 mph) on soft soil (RCI's in the order of 10) than on firmer soils (RCI's of 20 to 60).
d. Was able to maneuver between stakes 30 to 50 ft apart with- out a serious reduction in net speed.
e. Traveling forward at 0.5 mph, developed a maximum towing force of k2f, of its weight on an RCI of about ho. At lower strengths, maximum towing force decreased rapidly; at higher strengths, there was a less rapid decrease in towing force.
f. Traveling forward, developed a towing force-slip curve in which towing force increased with increasing slip to a maximum value of 1+2^ towing force at 28$ slip; thereafter towing force decreased with increasing slip.
g. Traveling laterally, developed a maximum towing force of 66% on firm soil. The curve of towing force versus soil strength developed closely resembled that for the M29C weasel.
h. Could not be towed on a firm soil without permanent damage to the pintle hook.
102. The Marsh Screw showed an advantage over the M29C weasel in
extremely soft soils, up to an RCI of approximately hO; at higher RCI's,
the M29C weasel performed better than the Marsh Screw.
103. On CH soils in which no free water was present, i.e. at
Centennial Lake and on the prepared buckshot clay test lane, the loaded
Marsh Screw:
a. Could make one pass forward provided the RCI was greater than 8 but not greater than about 300.
50
b. Became immobilized on the first pass on an RCI below 8. Deep sinkage, bulldozing, and spinning of tracks attended the immobilization.
c. On soil strengths of about 300 01, became immobilized on the first pass because the vehicle's power was not suf- ficient to turn the rotors against the frictional forces acting between the soil and the rotors.
d. Could not make more than a few passes on an RCI of 8 to 15. In such sticky soil, the vehicle usually was immobilized on a backward pass. Sinkage was not excessive; rotors could not be turned.
e. Traveling forward at 0.5 mph, developed a maximum towing force of about 35^ of its weight on an RCI of about 30. At lower and higher strengths, the towing force diminished rapidly.
f. Was able to travel when soil which otherwise would not allow its rotors to turn was sprinkled with water.
g. Could travel easily in a lateral direction on firm soils that would not permit it to travel forward or backward.
lOh. The loaded Marsh Screw was decidedly inferior to the M29C
weasel in every important aspect of performance on the sticky, water-free,
soft soils at Centennial Lake except one; namely, the Marsh Screw developed
higher towing force (in percentage of vehicle weight) than the M29C weasel
on RCI's less than about 35- In the sticky, firm soil on the prepared
buckshot clay test lane, the Marsh Screw could not even turn its rotors
until the soil was sprinkled with water.
Performance over obstacles
105. In simulated rice-field obstacle-crossing tests, the Marsh
Screw traversed the test course in 78 sec (average), and the M29C weasel
traversed the course in 28 sec. The obstacle-crossing speed of the Marsh
Screw is limited by the austere, unsprung de.ign of the rotor suspension
system. The shocks (as indicated in terms of r;celerations) experienced
by the Marsh Screw were consistently higher than those experienced by the
M29C weasel, often as much as 2-l/2 to 3 times as high. The Marsh Screw
took almost three times as long to traverse the course as did the
M29C weasel.
General performance
106. The Marsh Screw's engine became overheated quickly when it was
being strained, i.e. when the vehicle was traveling or attempting to travel
51
on soils that provided high frictional resistance. Overheating apparently
resulted in reduced vehicle power for traction purposes.
107- Steering of the vehicle was relatively difficult in all but the
softest soils and where free water was present.
108. Obstacle-crossing ability of the Marsh Screw over firm, stabi-
lized dikes was poor because of its rigidity.
109. The vehicle could travel with ease in a lateral direction on
firm soils on which it could not even turn its rotors in a forward or
reverse direction; however, when traveling laterally, the vehicle co\ild
not be steered.
110. The vehicle performed better when traveling forward than when
traveling in reverse.
111. Most immobilizations occurred when vehicle power was not suf-
ficient to overcome the friction of the soil against the rotors. Greater
engine power and a properly designed transmission would undoubtedly in-
crease the ability of the Marsh Screw to travel under such conditions. The
improved performance on such soils would probably not be at the expense of
its excellent performance on very wet, soft soils (unless weight and con-
tact pressure were increased disproportionately).
Recommendations
112. The testing program, while not exhaustive, is considered to
have been sufficiently comprehensive to evaluate the performance of the
vehicle in mineral soils. Therefore, no additional testing of the present
model in mineral soils is recommended.
113. The unusual propulsion system of the Marsh Screw makes it
appear suitable for use in muskeg, snow, and very soft marshes of the type
found in southwest Louisiana. It is recommended that its performance in
such media be tested.
Ilk. It is recommended that efforts be made to improve the per-
formance of the vehicle in highly sticky or frictional soil conditions.
Specifically, it is suggested that Teflon coating be applied to the rotors,
that the engine power and gear train be redesigned to provide greatly in-
creased traction, and that consideration be given to auxiliary traction
52
systems mainly for traveling on firm soils, including ground effects sys-
tems and means of steering the vehicle while it is traveling laterally.
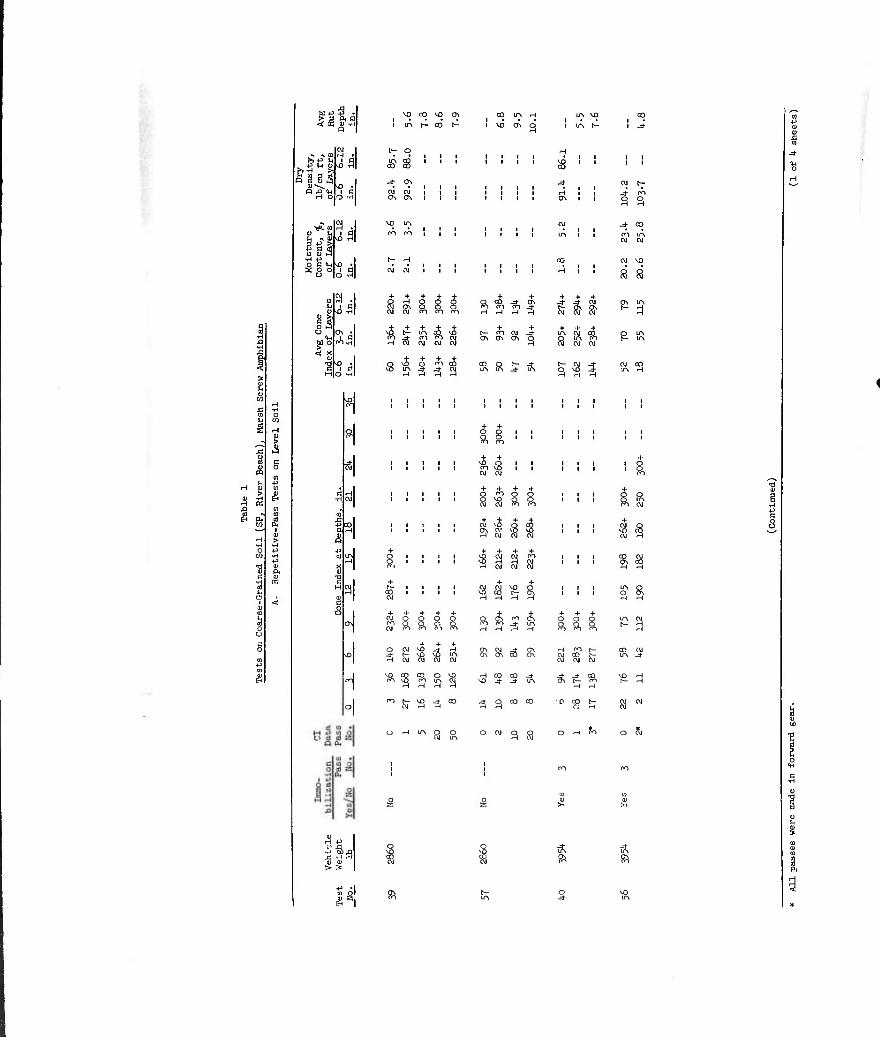
%
>fP u l d -P (fH 0) J3 •H •H >:
333 OJ--^ ■O Q Ä In I a
r-{ o o ■H
OJ I u ^ <_ P -Ü ^ pad (□(UM •H -P o a «M SOO
§3
H
(U H JJ
■H ^ fl jd ■--i H
OJ <u > »
■p .1 in ol S3!
\£) CO \D CT\ I • • • • i in t— co t—
co ir\ H in vo i • ■ I IA t^
H
I + + + + +
| CM M m KS ^i
9, Ä
v5 o OJ OJ
Ä S,
^O Q eg a* vö vö C\J OJ OJ
^8 at (M w
OJ C\J c\j
CO o -o m LA aj r-r H 'H
Sr
OJ CU VD Q VO 03 t^ Ch H H rH H
Ä ft S1 s H W ^-1 w
ON cvj .j rn a\ o\ cö o\
H CO CO -* vo ^J- j- uS
^f O CO CO
O O Q Ä ft ft
*
(h
CO I
cr\ I I i i I r
H i 1 1 en
3
^c m OJ Jf CO
cA ro l 1 i i 1 m i i
1 1
OJ in OJ
b- H CO OJ MD
aj OJ 1 1 i i 1 H i
1 1 8 i
+ +
8f i li ft cS m
+ + i +
8 Ä % I— '3 m
+ t-
3 + in
OJ OJ OJ s
+ c^
+
3 + in
8 +
OJ in OJ
R in m
S in
+ o fO CO ^ OJ. m
o m in q
OJ -3 3 OJ ■n
Pn c\i
R
I S
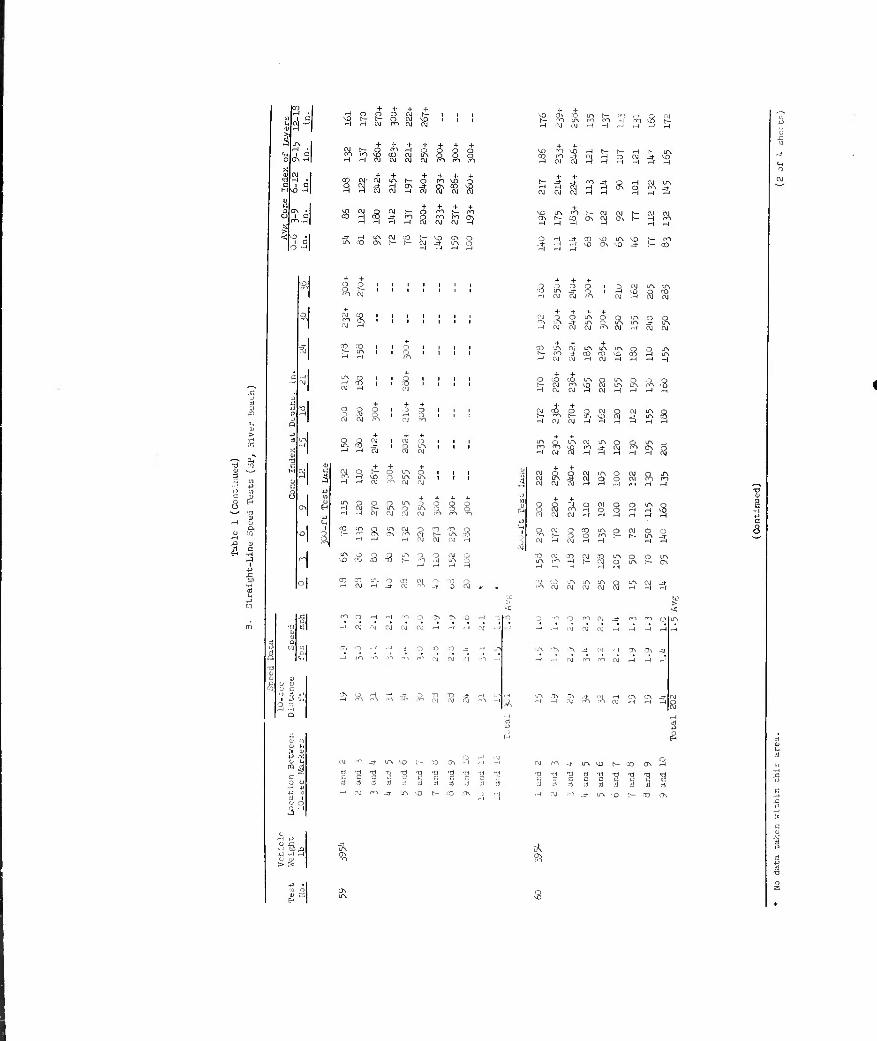
1^1 CM OJ
VD 0\ ~0 ITi C— t~~ rn ITS en fl S
CM t^- Q r*'' H ro ro M5 cO OJ H H C\J C\J CU CVJ m ro
U) ^"O \o Q CVI j* SO
co oj- C\J m t-- o
8?
OJ f— ö no t^ m
lA OD ON r~-
i
■i
i
£
? ^ ^ OJ oj ?n
Ä 2
OJ f\J
OJ o
Sj OJ
OJ OJ
lA Q '-A CM O r-" ON C\ fO (*J —I »-I -H r>j
O Q Q m O fv -Ö T5 r^ --.-i
rt r» o r- IA -O <\J C\I -*
Op OJ O T? p f\J ^ _T 0 CVJ
[\j ur\ tn
OJ oj fn
T>OlAOQL-NOO
ojoiajnocywojcxi
tTN i/\ ro
i>J fO p Q W Q W ^_ T-» f- '-A VO Sj _^ H OJ OJ H W H H
S
IA
H
O IA
ru OJ r-l
IA :3 ft IA
2f a
^1 + +
OJ Si S IA O
O
3 SI ft
Si OJ OJ 3 3 F-i d ft CM
OJ
l-l § 05
3 H ^ OI R ^
^ J oo
as OJ 00 "1
IA P R R
OJ CM OJ OJ
c; ' 1
:t .' ■'.
a» s n
ff •H .1 *J 1 si 1 () ,i H
ro o - ' -1 fO ■' ON T. •O -I ^ T)
-1 -J OJ OJ OJ a: —J -< -i
■; • ' -• -, o -H ^ J o r) ■o ^ _i
" n~\ fn fin ro OJ OJ -1 ■o -i
C\ ft • ■' ^ ■.\ Ä ro
i 3 vr>
■O h- 03 GN
tJ "0 13 TJ I= C G C n =1 a d
■A vo r— co
3 c-i o r>-) ■j -* rO (*"» o IT»
J .-* C\J OJ OJ W -* 'H H . '
•> TN TN -* OJ < ON ON ■r
-* —i OJ on r*"* OJ M -H •"'
^ ON ON OJ
-+ ft OJ S 2f OJ
IA VO t— CO ON
0) (1)
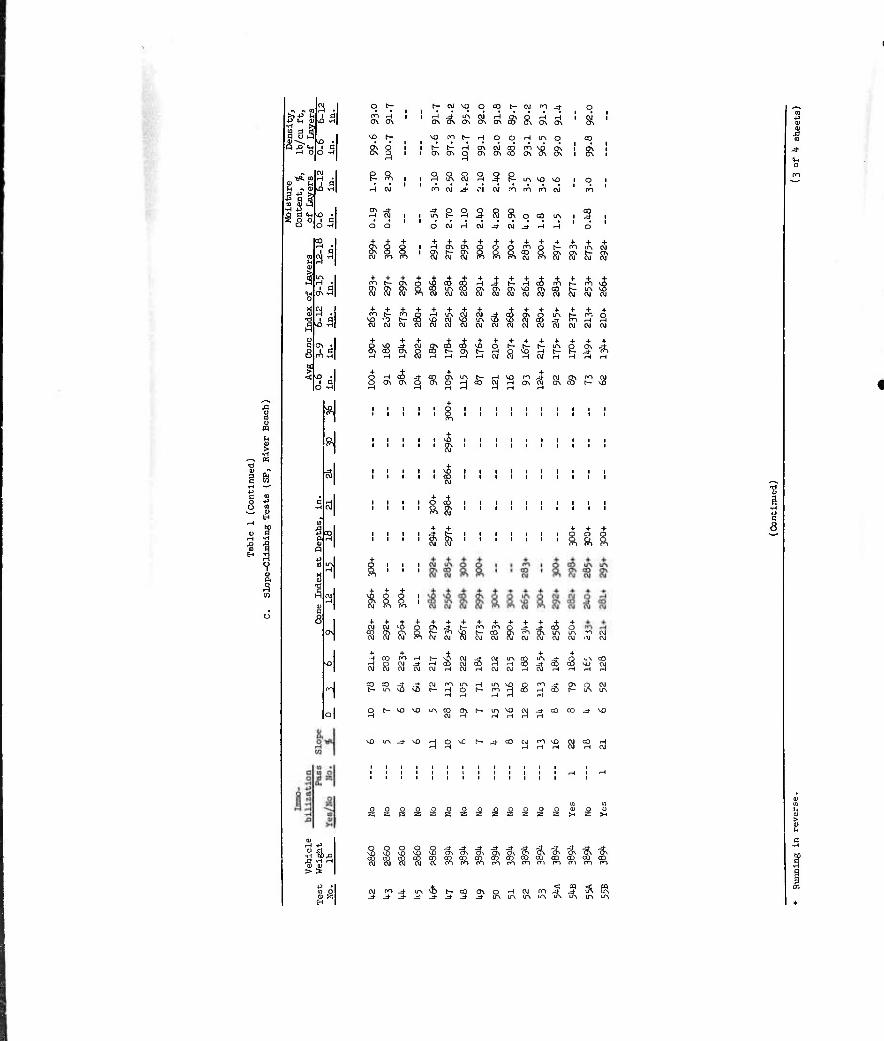
* .* to
+> llH J),
oc— i^cvjvoooot-niroj- • • i i «.•..... .
VO CO t- H
III ■H +> T ß in Ig o
I
i nl
^
H
q O Q O Q o Hmc\JH-ä-t— irvvovo to
3 S 8. o co oj J OJ Jt H
I 8
1 ^ & 3 Ö oj rH
. s + 0\
+ 2> I 0\ t- ON
W CM OJ ro rn Pi OJ ^
ir\ 1 CO
H d +
en + +
& ft
+ + + + + + + + + + + + + + + + rnt— gsövöcoro HJ- t-Hco ror-mvö OXONONöCO mcO ONONa\vi3 Q\ <X> ^-u^vö cvjoiwrhcyajcyftjajÄicuaicyajajaj
+ + + + + + + + tn t- {*> Q HlACU OJ-d-
c\jajc\jc\Jc\iajojc\joj CO OJ OJ C\J CM W
coco\o o t-t-t-tr\ ay?-d-ojQ>cOcbvo o t- a5o\paDh-o\t— HO
HHHOJHHHHOjflj t": 1*7 -* #,
H CD J- o\ ON O
co o\ i/% h- m 3 d ^ OJ H ON CVJ CA
»| ^
^ ©
ft P. s, ?,
OJ 03
aj
ft l§ -*-
OJ 1 rn +
OJ i +
01 i Ol
+ Q ni
+
OJ
<9 SI 5 ^7
OJ OJ i si cu
5? 21 OJ
1A
OJ 5 H 75
+ 3
12 CD US 3 * OJ m
-! o H
r-i H s m H ä P R
t*-vovo mco o\r^-if\vo s a
VO u-v ^f vo
O O O O O 0 H; w K a ä a
j- co eg fn vo oj co
jj -H H
> :* vovovovo^ö ONaso\aNONcr\ONcr\0>ONON COCOCOCOCOOOCOCOCDCOOOCOCOCOCDCO OJ OJ OJ OJ CMmmrnmoncnmmmmrn
OJ m j- ir\ vb jf ^ -^ j* 3
< m -i « OJ ro _=!■ _d- lA iTv
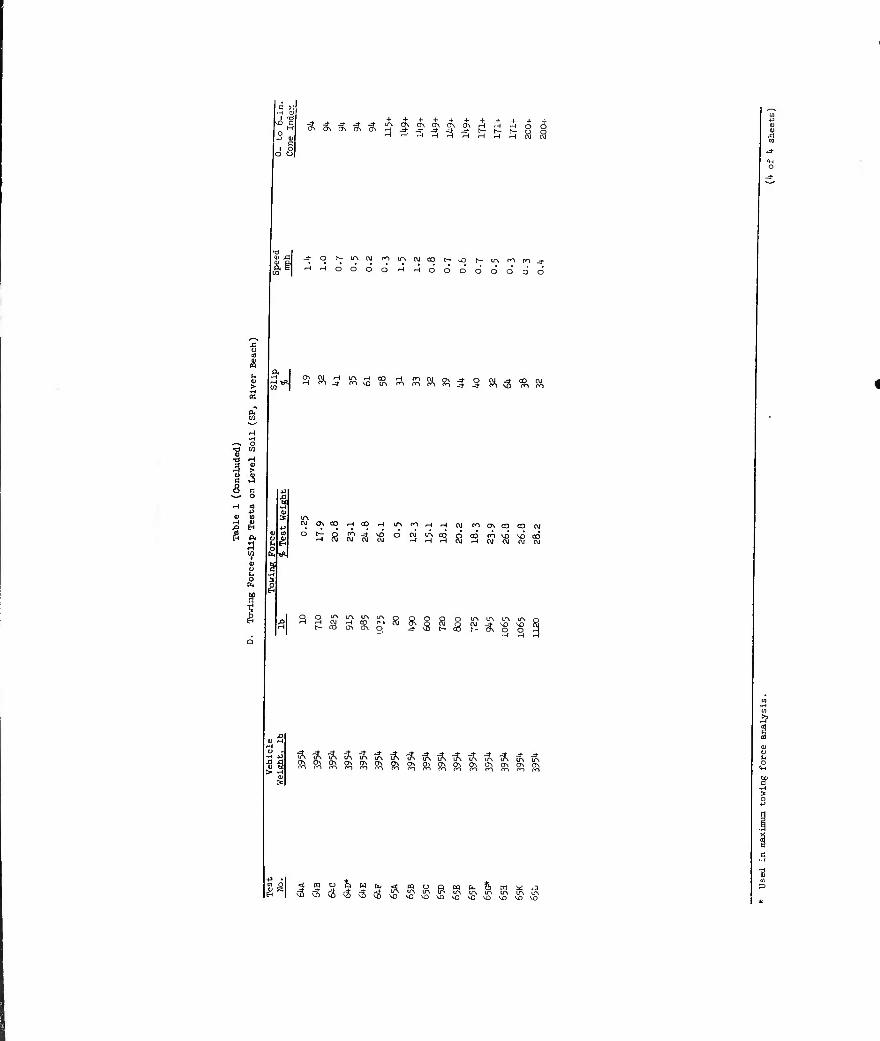
-* -ä: -^ -* rä1 0\ o\ o\ OS ö\ u^- o\ <j\ o\ os a\ t-t
H H cy OJ
C~- LTi CM
odd Lr\ oj co t^- u3
^ "H O O O
r- ir\ m m j-
o o o o d
iH ft", f^ vo ir\ ro m 8", S Ä
C\J a\ co H co cxj fn o\ co co c\j
p <Ö ro vO vo cd cy H (\i cy oj oj
IA m iA ITv CO f» W ö\ S "1 C7\ O J- vß h-
ITN ir\ in iA o OJ -* \0 M3 M [■- a\ o o H
i-1 H H
t
v (2 > ^
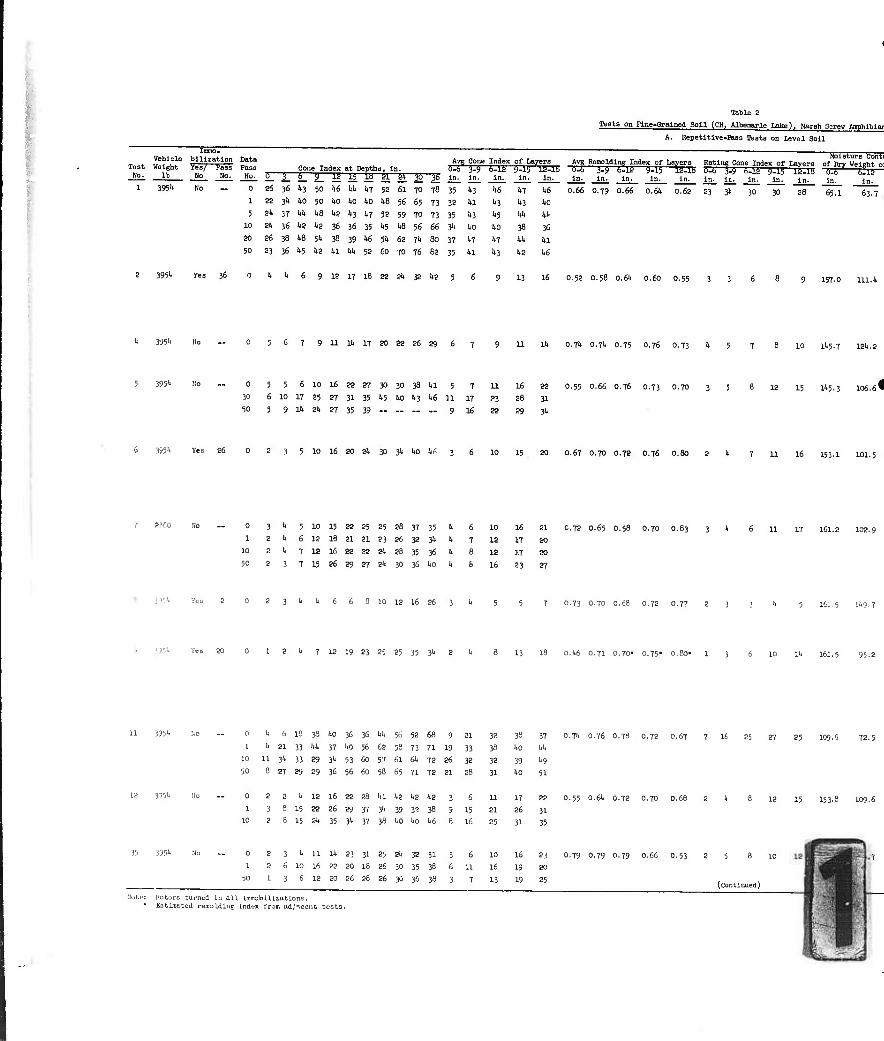
Tahle 2
Teats on Flne-Gralned Soil (CH, Albemarle lake). Marsh Screw Amphlblar.
A. Repetltlve-Paaa Tests on Level Soil
Test Vehicle Weight
lb
Inmo- blllzation ?es/ Pass
No No.
No
Data Pass
No.
0
Cone Index at Deptha, in. Avg Cone
0-6 3-9 in. In.
35 43
Index 632 in.
46
of Layers j-iris-it;
In. In.
47 46
Avg Remolding Index of Layers Ö-E 3-3 6-12 9-15 In. in. in. in.
0.66 0.79 0.66 0.64
12-18 0_ 26
3. 36
°_ 1. 43 50
12
46
15 1« 21 24
44 47 52 61 3ö 70
36 73 1 395lt 0.6a
1 22 3"t 40 50 4o 40 40 48 56 65 73 32 41 43 43 4c 5 24 37 44 46 42 43 47 52 59 70 73 35 43 45 44 44
10 24 36 42 42 36 36 35 45 48 56 66 34 40 40 38 36 20 26 38 48 54 38 39 46 54 62 7« 80 37 47 47 41. 41
50 23 36 45 42 41 44 52 60 70 76 82 35 41 43 42 46
Moisture Conti Rating Cone Index of Layers of Dry Weight ol 6-b 3-$ (..IS 5.15 ß.18 "ES fellS ■ in. in. in. in. in. in. in.
23 3» 30 30 28 65.1 63.7
3954 9 12 17 18 22 24 32 1(2 5 13 16 0.52 O.58 0.64 0.60 O.55 157.0
4 3954 Ho .- 0 5 6 7 9 11 14 17 20 22 26 29 6 7 9 11 14 0.74 0.74 0.75 O.76 O.73 4 5 10 145.7 124.2
5 3954 0 5 5 6 10 16 22 27 30 30 38 41 5 7 11 16 22 0.55 0.66 0.76 O.73 0.70 3 5
30 6 10 17 25 27 31 35 45 lio 43 1.6 11 17 ?3 28 31
50 5 9 14 24 27 35 39 9 16 22 29 34
12 15 145.3 106.6'
6 3954 Yea 26 0 2 3 5 10 16 20 24 30 34 40 46 3 6 10 15 20 0.67 0.70 0.72 O.76 0.80 2 4 7 U 16 153.1 101.5
T ??60 >io .. 0 3 4 5 10 15 22 25 25 28 37 35 4 6 10 16 21 C.72 O.65 O.58 0.70 O.83 3 i
1 2 t 6 12 18 21 21 23 26 32 34 4 7 12 17 20
10 2 4 Y 12 16 22 22 24 28 35 36 4 8 12 )7 20
50 2 3 7 15 26 29 27 24 30 36 40 4 6 16 23 27
11 17 161.2 102.0
J?54 Vcs 2 0 2 3 4 U 6 6 0 10 12 16 26 3 4 5 5 7 0.73 0.70 0.68 0.72 O.77 2 J 3 4 5 161.5 H9.7
;■ 5954 Ye» jo 0 I 2 4 7 12 19 23 2; 25 35 34 2 4 8 13 18 0.1.6 0.71 0.70- 0.75- O.BO- 1 J 6 10 H. 16:.5 95.2
3954
3954
0 4 0 18 38 40 36 36 41. 56 52 68
1 4 21 33 W, 37 1.0 56 62 58 73 71 19
10 11 31. 33 29 31. 53 60 57 61 64 72 26
50 8 27 29 29 36 56 60 58 65 71 72 21
0 2 2 4 12 16 22 28 M 1.2 1.2 1.2
1 3 8 15 22 26 29 37 34 39 32 38
10 2 8 15 24 35 31. 37 38 liO UO U6
3 4 U 14 23 31 25 24 32 31
6 10 16 ?2 20 18 26 30 35 38
3 6 12 20 26 28 26 30 36 38
9 01 32 38 37
9 33 38 40 1.1.
>6 32 32 39 49 1 28 31 40 51
3 6 11 17 22
9 15 21 26 31 8 16 25 31 35
3 6 10 16 21 6 11 16 19 20
3 7 13 19 25
Rüturs turned in all iramüblllzations. Eotimuted t-emulding Indtjx from ad.Kcent tests.
0.74 0.76 O.78 0.72 0.67
0.55 0.64 0.72 0.70 0.68
0.79 0.79 0.79 0.66 0.53
25 109.6
(Continued)
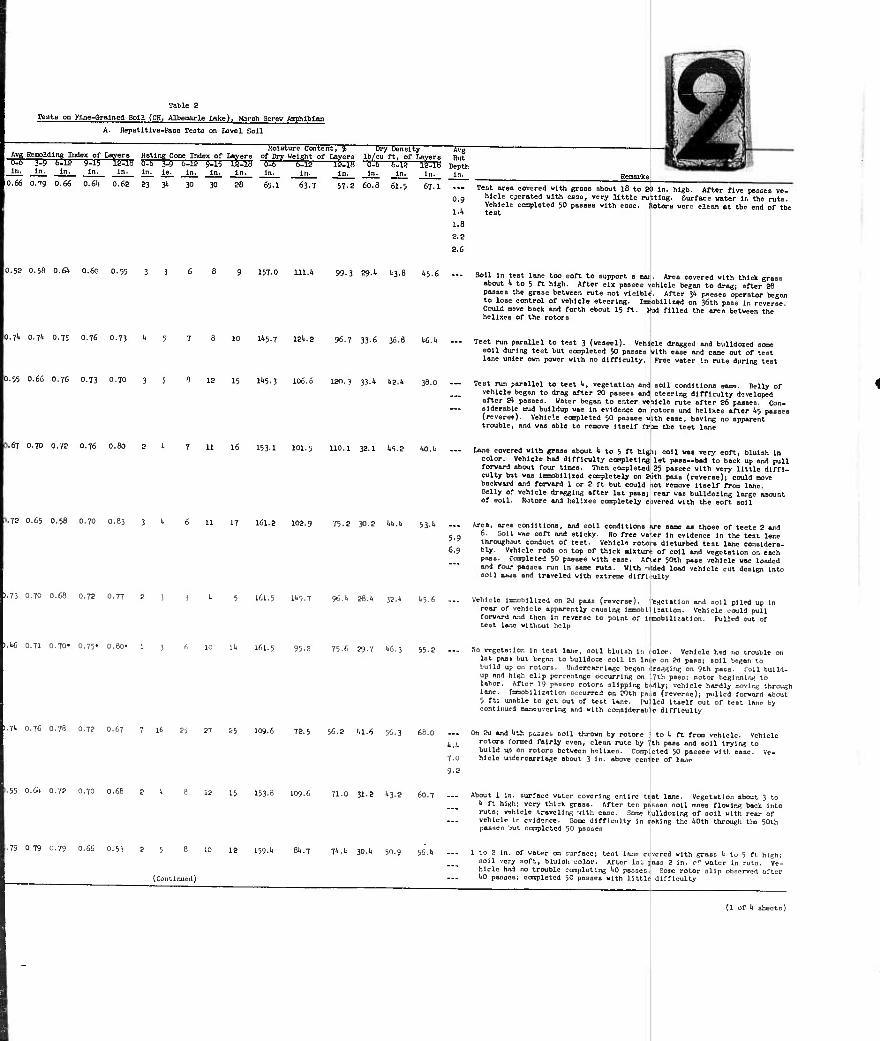
Table 2
Teats on Flne-Gralned Soll (CH, Albenarle lake). Marsh Screv Amphibian
A. Repetltlve-Paas Tests on Level Soil
Avg Remolding Index of 1 ö-S 3-5
In.
0.66 O.^
In.
0.66
of Layers ^15 lEIB In.
0.61»
Rating Cone Index of Layers Ö-6 5-5 6-15 5-15 1S-1B
Moisture Content ^ 5b Dry Density
0.62
in.
23
6-12 In. in.
88
of Dry Weight of Layers Ib/cu ft, of Layers ■53 Sis TÜriB -■'- —'■" In,
65.1 63-7
0.52 0.58 0.61t 0.60 O.55 157.0
In. In.
57.2
In.
60.8
in. 12-1H In.
Avg Rut
Depth In.
61.5 67.1
0.9
i .a
2.6
99.3 29-1' l»3-6 1.5.6
rks
Test area covered with grass about 18 to 20 In. high. After five passes ve- hicle operated ylth ease, very little rutting. Surface unter In the ruts. Vehicle completed 50 passes ulth ease. Rotors were clean at the end of the test
Soil In teat lane too soft to support a man. Area covered with thick grass about li to 5 ft high. After six passes vehicle began to drag; after 28 pseaes the grass between ruts not vlalblt. After 3I1 pnaaea operator began to lose control of vehicle steering. Inrcbllited on 36th paaa In reverse. Could Mve back and forth about 15 ft. Hud filled the are« between the helixes of the rotora
0.T1 0.71» 0.7; 0.76 0.73 11.5.7 I».2 96.7 33-6 36-8 W.fc ... Teat run parallel to teat 3 (weasel). Vehicle dragged and bulldoted some
soil during teat but ccopleted 50 pasaea with eaae and came out of test lane unler own power with no difficulty. Free water in ruts during teat
O.55 0.66 0.76 0.73 0.70 3 l'"5.3 106.ö 120.3 33.1 Ii2.li Teat run parallel to teat 1", vegetation and aoll conditions same. Belly of vehicle began to drag after 20 pasaea and cteerlng difficulty developed after 2» pasaea. Water began to enter vehicle ruta after 26 passes. Con- siderable cud buildup was In evidence on rotora und helixes after I15 pasaea (revcra«). Vehicle completed 50 pasaes with ease, havlnf no apparent trouble, and was able to remove Itaelf from the teat lone
0.67 0.70 0.72 0.76 0.80 16 153.1 101.5 110.1 J2.1 1.5.2 Lane covcreil with graaa about 1. to 5 ft high! «oil vos very soft, blulah In color. Vehicle had difficulty cccpletlng let paaa—bod to bock up and pull forward obout four tlmea. Then completed 25 paases with very little diffi- culty but woo Imaoblllied completely on 2<>th paaa (reverae); could move bockward and forward 1 or 2 ft but could not remove Itaelf from lane. Belly of »chicle dragging after let paaa; rear was bulldotlng large amount of aoll. Rotors and hellxea completely covered with the aoft aoll
1.72 O.65 O.58 0.70 O.83 3 I 17 161.2 102.9 752 30.2 tt.k 53.1.
5-9 6.9
Area, area conlltlona, and aoll conditions are aase as thoae of teata 2 and 6. soil woo soft and sticky. Bo free water In evidence In the teat lane tnroughiRit conduct of teat. Vehicle rotora disturbed teat lone conaldero- bly. Vehicle rode on top of thick mixture of aoll and vegetation on each pooa. Completed 50 pasaea with ease. After 50th pasa vehicle waa loaded and four pasaea run In ao=e ruta. With -.Ided load vehicle cut design Into soil ajus and traveled with extreme dlffl-rulty
1.73 0.70 0.66 0.72 0.77
1.1.6 0.71 0.70« 0.75' o.BO"
161.5 11.9.7
161.5
96.1. 28. 32.i 1.5,6
75-6 29-7 1.6.3 552
I.71. O.76 0.78 0.72 0.67
.55 O.Oi 0.72 0.70 0.66
25 109.6 72.5 56.2 1.1.6 56.3 68.0
k.U
7.0
9.2
153-8 109.6 71.0 31.2 1.3.2 60.7
Vehicle IsxJblllted on 2d pasa (reverse). Vegetation and aoll piled up In rear of vehicle apparently coualng Imobll notion. Vehicle could pull forward and then In reverae to point of Iraoblllzotlon. pulled out of t«»t lone without help
Ho vegcto-.lon In teat lone, aoll blulah In Jolor. Vehicle had no trouble lot poai but began to bulldoze ooll In loje on 2d paaa; aoll began to build up on rolore. Undercarriage began iSro^gln^ on 9th poaa. roll build- up and high Blip perccntogc occurring on l?th paoa: motor beginning to labor. Af.cr 19 puniiea rotora slipping badly; vehicle hardly movlw. through lane, raooblllration occurred on SOth ptua (reverae); pulled forward oboul 5 ft; unable to got out of teol lane, pulled Itaelf out of lest lane by continued moncuverlng and with conaldcroble difficulty
On 2d and ktb ,......;.. aoll thrown by rotors ;j to 1. ft from vehicle. Vehicle rotora formed fairly even, clean ruta by 7th paaa and soil trying to build Wf on rotora between helixes. Completed 50 paases with eooo. Ve- hicle uidercorrloge obout 3 In. above center of la.jc
About 1 In. curface water covering entire test lane. Vegetation about 3 to 1. ft hltih; very thick grass. After ten ponseo soil mass flowing bsek. Into ruts; v-hlcle traveling vlth ease. Some lulldotlng of noil with rear of vehicle in evidence. Some difficulty in iraklng the 1.0th through the 50th pannes jut completed 50 posses
.79 0 79 0.79 0.66 0.53 159. li Bit. 7 71*.'. 30.U 50.9 56. li
(Cüntinued)
high; 1 to 2 in. of water on curfnee; test lane ccvercd with «ross 1. tu noil very soft, bluish color. After lal iiaas 2 In. of water in hide hud no trouble completing 1.0 panoes. Some rotor slip observed nfter 1.0 passes; completed 50 poosoD with little difficulty
(1 of 1. sheets)
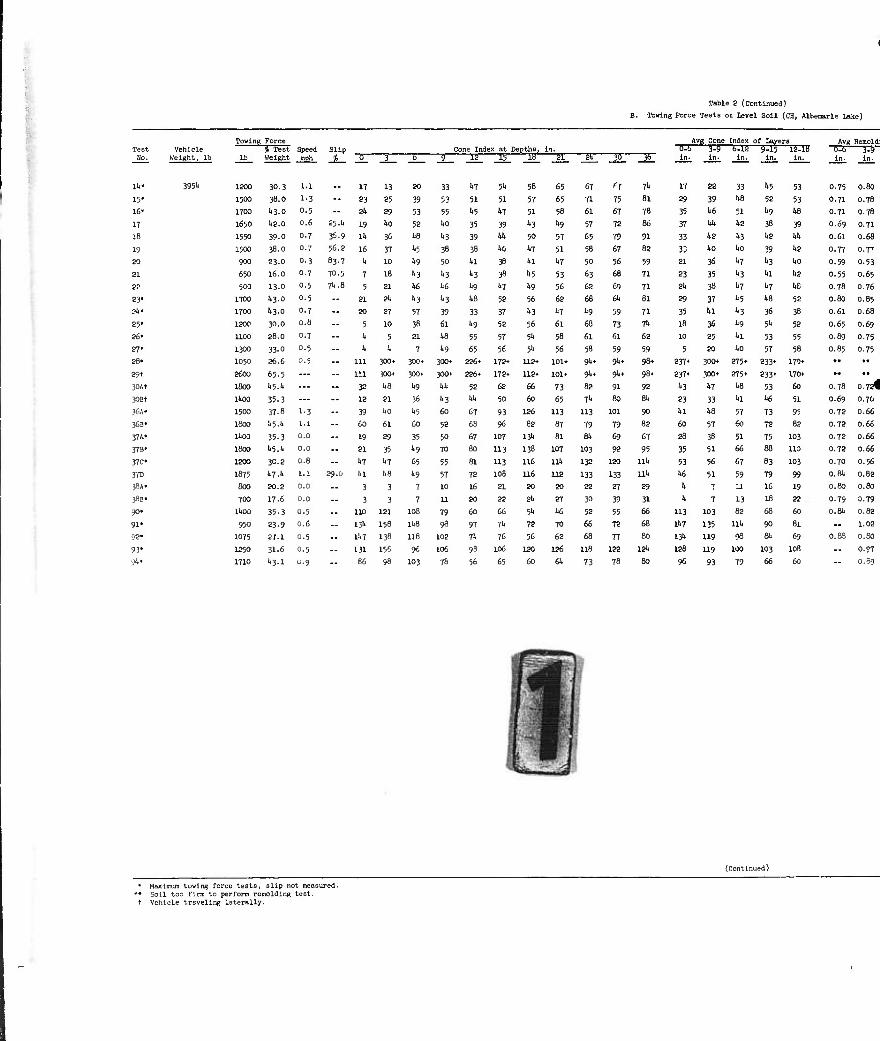
Table 2 (Continued)
B. Towing Force Tests on Level Soil (CH, Albemarle Lake)
Vehicle Weight, lb
Towing Force * -rest Speed
lb Weight mph Slip
^57- i b Cone Index at Depths, in.
9 15 15 IB 51 Si 34 ■' 36
Avg Cone Index of Layers Avg Remold Tost No.
6-6 3-$ 6-12 9-Ö la-IB in. in. in. In. in.
a.6 3-$ in. In.
Ik"
15"
16"
17
18
19
SO
21
2?
83«
85"
86«
87«
88"
89t
30At
30Bt
Vin-
36B«
3TA'
3TB»
rrc« 37D
!-/.• 38B«
90«
91'
98«
93'
<*>
39^ 1200
1500
1700
1650
1550
1500
SWO
650
500
1700
1700
1?3C
1100
1300
low
2C00
1800
liiOO
15!»
1600
itoo
ieoo
12O0
1875
too
7CO
11.0J
950
10T5 lP5a
mo
30.3
38.0
113.0
liS.O
39.0
38.0
23.0
16.0
13-0
I43.0
I43.0
30.0
28.0
33.0
86.6
65.5 U5.l1
35-3
37.8
35-3
1.5.Ii
30.2
UJ.U
20.2
17. b
35-3
23.9
27.1
31.6
M.l
1.1
1.3
0.5
0,6
0.7
0.7
0.3
0.7
0.5
0.5
0.7
u.B
0.7
0.5
0.5
1.3
L.l
0.0
0.0
0.8
1.1
0.0
0.0
0.5
0.6
0.5
0.5
u.9
85.1.
3^-9
56.2
83.7
70.5
711.8
17
23
Sll
19
lit
16
1.
7
5
21
20
5 u k
111
111
38
12
39 60
19
21
'.7
M
3
3 no 13^
1*7
131
86
13
25
29
1.0
36
37
10
18
21
?1.
27
10
5 !i
300.
300*
US
21
UO
il
89
35
Ii7
hB
3
3
121
158
13"
156
96
20
39
53
52
1.8
1.5
'■i9
1.3
1.6
Ul
57
38
21
7 300.
300«
!,9
36
"•5 60
35 1,9
65
1.9
7
7
103
HB
1)8
9«
103
33
53
55
1.0
1.3
33
50
1.3
U6
1.3
39
61
1.8
1.9
300-
300.
1.1.
1.3
Co
52
50
70
55
57
10
U
79
98
102
106
7t
1.7
51
1.5
35
39
38
111
1.3 1.9
1.6
33
1.9
55
65
226*
226.
52
hh
67
68
67
So 81
78
16
80
60
97
7''
51.
51
1.7
39
Mi
1.0
38
38
1.7
52
37
52
57
56
172*
172*
62
50
93
96
107
113
113
108
81
88
66
n 76
10;,
65
58
57
51
1.3
50
1.7
1.1
1.5
1.9
56
1*3
56
51.
51.
112»
112*
66
60
126
62
138
116
116
20
21.
5I1
72
56
120
60
65
65
58
1.9
57
51
hi
53
5fi
62
1.7
61
58
56 101*
101.
73
65
113
«7
81
1U7
111.
112
20
27
•'.6
70
62
126
61.
67
71
61
57
65
58
50
63
62
68
1.9
60
61
58
9!.*
9!..
62
71.
113
79
El.
103
132
133
22
30
52
66
68
118
73
n 75
67
72
79
67
56
53
69
61.
59
73
61
59
91.*
91..
91
60
101
79
69
98
120
133
87
39
55 72
77
122
78
Til
81
78
86
91
82
59
71
71
31
71
71.
62
59
98*
98.
92
81.
90
62
67
95
111.
111.
29
31
66
60
1?'-
80
17
29
35
37
33
33
21
23
21.
29
35
IB
10
5
237'
237*
1.3
23
1.1
60
28
35
53
1.6
I.
1.
113
1*7
131.
123
96
22
39
1.6
hh
1.2
1.0
36
35
38
37
Itl
36
25
20
300* 275*
300* 275*
1.7
33
ua 57
38
51
56
51 7
7
103
135
119
119
93
33
1.8
51
1.2
1.3
1.0
1.7
1*7
1.5
1.3 1.9
1.1
1.0
1.8
1.1
57
60
51
66
67
59
U
13
!:2
U*
98
100
79
1.5
52
1.9
38
1.2
39
1.3
l»l
1.7
U8
36
51.
53
57
233*
233*
53
1.6
73
72
75
88
63
79
16
16
68
90
81.
103 66
53
53 U6
39 Itl.
1.2
1.0
1.2
1.C
52
38
52
55
58
170*
170*
60
51
95 62
103
110
103
99
19
22
60
81
69
10«
60
0.75
0.71
0.71
0.69
0.61
0.77
0.59
0.55
0.78
0.80
0.61
0.65
0.89
0.85
0.78
0.69
0.72
0.72
0.72
0.72
0.70
0.81*
0.80
0.79
0.6U
0.88
(Continued)
Maximum tuwlng force tests, slip not measured. Soil too firm to perform remolding test. Vehicle traveling laterally.
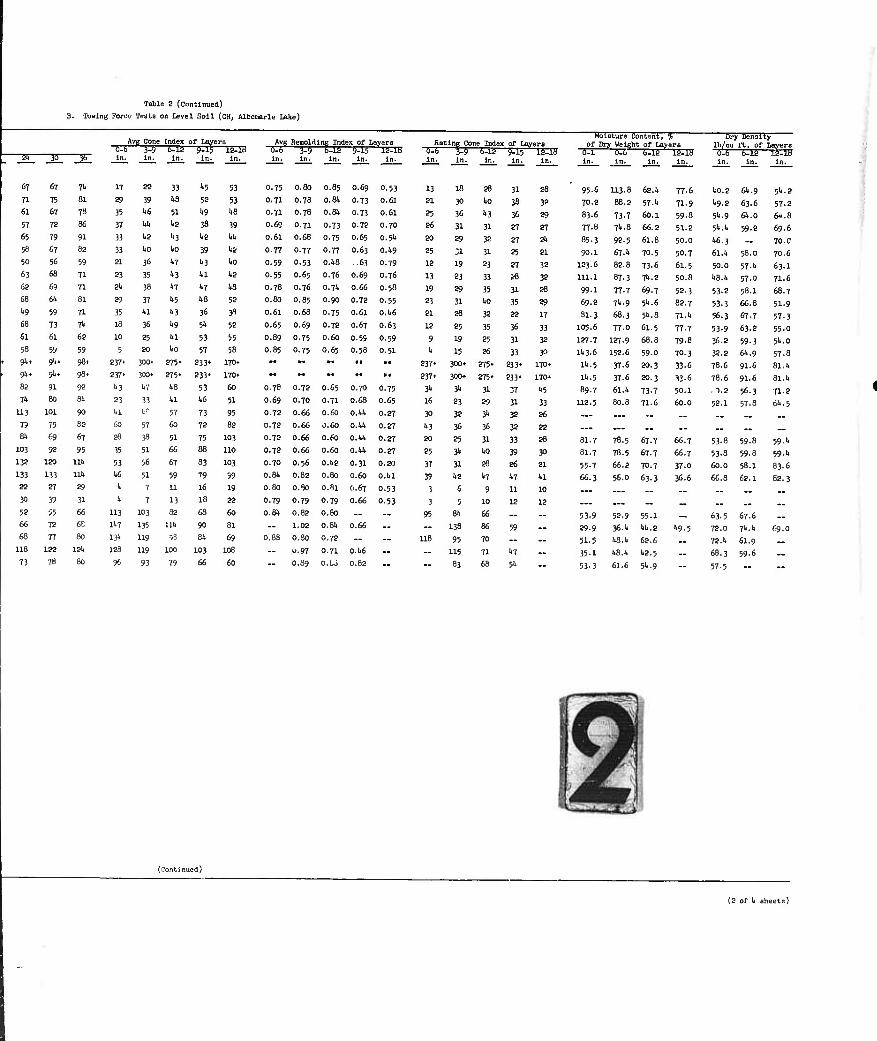
Table 2 (Continued)
Towing Force Tests on Level Soll (CH, Albemarle Lake)
Moisture Content. t - Drv Denaitv Avg cone Index of Layers Avg
■TOT In.
Remolding Index of Layers 3-5 6-1S ■ $-15 T&H in. In. In. In.
Ratln« Cone Index of Lavera of Dry WelKht of Layers Ib/cu -TUT
in.
ft, of 6-lä in.
Layers u-b In.
3-9 In.
6-12 In.
9-15 In.
12-18 In.
Ö.6 In.
3-9 In.
6-15^ in.
^-15 in. in.
-53. in.
-Er- 6-1S in.
14-1H in. SI. 38 36
in.
67 67 T"i 17 22 33 '•5 53 0.75 0.80 O.85 0.69 0.53 13 18 28 31 28 95.6 113.8 62.1. 77.6 1.0.2 61..9 5h.S 71 75 81 29 39 kB 52 53 0.71 0.78 0.81. 0.73 0.61 21 30 1.0 38 3? 70.2 88.2 57.1. 71.9 1*9.2 63.6 57.2 61 67 78 35 1.6 51 1.9 1.8 0.71 O.78 0.81. 0.73 0.61 25 36 1.3 36 29 83.6 73.7 60.1 59.8 51..9 61».0 64.8 57 72 86 37 hh 1.2 38 39 0.6° 0.71 0.73 0.72 0.70 26 31 31 27 27 77.8 7I..8 66.2 5.1.2 5lt.ll 59.2 69.6 65 79 91 33 1.2 t3 1.2 kh 0.61 0.68 0.75 0.65 0.5I. 20 29 32 27 21. 85.3 92.5 61.8 50.0 1.6.3 70.C 56 67 62 33 ho 1.0 39 1.2 0.77 0.77 0.77 0.63 0.1.9 25 31 31 25 21 90.1 67.1. 70.5 50.7 61.1. 58.0 70.6 50 56 59 21 36 1.7 1.3 iO 0.59 0.53 0.1.8 .63 0.79 12 19 23 27 32 123.6 82.8 73.6 61.5 50.0 57.1. 63.1 63 68 71 23 35 1.3 Ul 1.2 0.55 0.65 0.76 0.69 0.76 13 23 33 28 32 111.1 87.3 71.. 2 50.8 1.8.1. 57.0 71.6 62 69 71 2-'. 38 1.7 l»7 1.8 O.78 0.76 0.71. 0.66 0.58 19 29 35 31 28 99.1 77-7 69.7 52.3 53.2 56.1 68.7 68 a 81 89 37 1.5 1.8 52 0.80 0.85 0.90 0.72 0.55 23 31 1.0 35 29 69.2 TM 51..6 82.7 53-3 66.8 51.9 1.9 59 71 35 1.1 1.3 36 38 o.6i 0.68 0.75 0.61 0.1.6 21 28 32 22 17 31.3 68.3 5I..8 TX-k 56.3 67.7 57.3 68 73 Til 18 36 1.9 5k 52 0.65 0.69 0.72 0.67 0.63 12 25 35 36 33 105.6 77.0 61.5 77.7 53.9 63-2 55.0 61 £1 C2 10 25 1.1 53 55 0.89 0.75 0.60 0.59 0.59 9 19 25 31 32 127.7 127.9 68.8 79.8 36.2 59.3 51..0 58 59 59 5 20 1.0 57 58 0.85 0.75 0.65 O.58 0.51 1. 15 26 33 30 11.3.6 152.6 59.0 70.3 32.2 61..9 57.8
v 91.* 9'.. 98. 237> 300. 275- 233' 170« M " IM • ■ Ml 237» 300. 275» 233* 170« H.. 5 37.6 20.3 33.6 78.6 91.6 81.1. . 9!.. 94- 99. 237» 300* 275* 233* 170> • • M •* M • • 237< 300* 275» 233* 170» U.5 37.6 20.3 33-6 78.6 91.6 81.1.
Si 01 92 1.3 Vi 1.3 53 60 0.78 0.72 0.65 0.70 0.75 31. $ 31 37 '.5 89.7 61.1. 73-7 50.1 ■1.2 56.3 71.2 71. 80 Bti 23 33 1.1 1.6 51 0.69 0.70 0.71 0.68 0.65 16 23 29 31 33 U2.5 80.8 71.6 60.0 52.1 57.6 *.5
113 101 90 ■'.1 f 57 73 95 0.72 0.66 0.60 o.w. 0.27 30 32 31. 32 26 -- 73 79 BS 60 57 CO 72 82 0.72 0.66 0.60 0.1.1. 0.27 1.3 36 36 32 22 _- __ .. Bd 69 67 26 38 51 75 103 0.72 0.66 0.60 0.1.1. 0.27 20 25 31 33 28 81.7 78.5 67.7 66.7 53.8 59-8 59.1.
103 92 95 35 51 66 88 no 0.72 0.66 0.60 O.W. 0.27 25 » to 39 30 81.7 78.5 67.7 66.7 53.8 59.8 59.'' 132 120 in 53 56 67 83 103 0.70 O.56 0.1.2 0.31 0.2O 37 31 23 2-6 21 55-7 66.2 70.7 37.0 60.0 55.1 83.6 133 133 11!. k6 51 59 79 99 0.81. 0.82 0.80 0.60 0.1.1 39 1.2 1.7 1.7 1.1 66.3 56.0 63.3 36.6 66.8 62.1 82.3 22 rt 2? 1. 7 u 16 19 0.80 0.80 0.81 0.67 0.53 3 6 9 11 10 -_ 30 39 31 1. 7 13 If) 22 0.79 0.79 0.79 0.66 0.53 3 5 10 12 12 .. .. .. .. 52 55 66 113 103 62 68 60 0.81. 0.82 0.80 — — 95 SI. a, — __ 53-9 52-9 55.1 ... 63.5 67.6 .. 66 72 6C UT 135 lit 90 81 - 1.02 0.61. 0.66 - - 138 66 59 — 29-9 j6.k W..2 I.9.5 78.0 7'..1 69.0 63 77 80 13* U9 98 Bh 69 0.88 0.80 0.72 - - ua 95 70 — — 51-5 1.8.1. 62.6 72.1. 61.9
118 122 121. 12? 119 100 103 108 - U.97 0.71 0.1.6 — — 115 71 1.7 .. 35.1 1.8.1. 1.2.5 68.3 59.6 „
73 78 80 9« 93 79 66 60 - O.89 o.Li 0.82 -- - 83 68 5* - 53-3 61.6 5^-9 — 57.5 __
(Continued)
(2 of k sheetß)
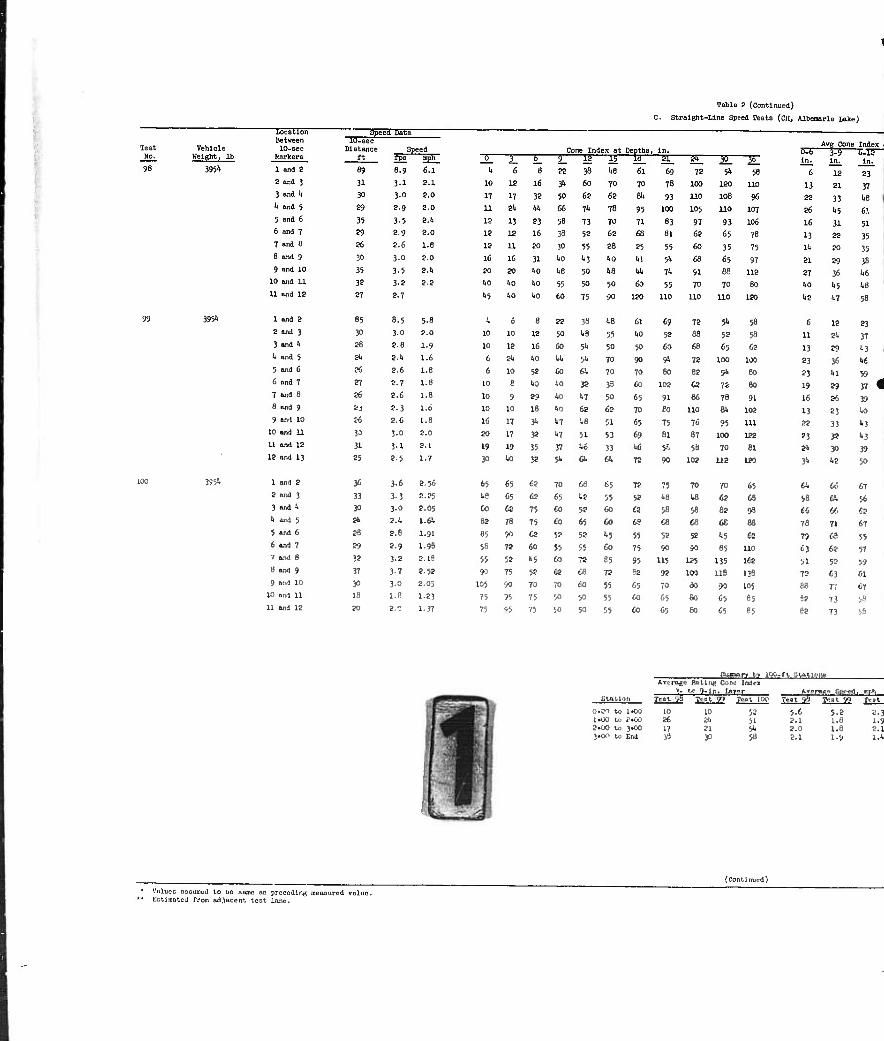
Table 2 (Continued)
C. Straight-Line Speed Tests (CH, Alberaarle Lake)
Vehicle Weight, lb
Location Between ID-sec
Markers
Spe id Data
Cone Index at Depths, In. Avg Cone Tect
10-sec Distance
ft Speed
Index ü.fa In.
5-9 in. In.
No. fgs mph ' 6 3_ 6_ 9_ IS 15 1H_ ^L SL 3ö_ "H 98 3951* 1 and 3 89 8.9 6.1 li 6 8 22 38 1.8 61 69 72 5". 58 6 12 23
8 and 3 31 3-1 2.1 10 12 16 3* 60 70 70 78 100 120 110 13 21 37 3 and 1» 30 3.0 2.0 17 17 32 50 62 62 81. 93 110 108 96 22 33 ta It and 5 29 2.9 2.0 11 » Uh 66 71. 78 95 100 105 110 107 26 1.5 61 5 and 6 35 3-5 2.1. 12 13 23 58 73 70 71 83 97 93 106 16 31 51 6 and 7 29 2,9 2.0 12 12 16 38 52 62 68 81 62 65 76 13 52 35 7 and 8 36 2.6 1.8 12 11 20 30 55 88 85 55 60 35 75 It 20 35 8 and 9 30 3.0 2.0 16 16 31 ho ••3 to 1.1 5t 66 65 57 21 89 38 9 and 10 35 3-5 8.4 eo 20 1.0 US. 50 W U 7* 91 88 112 27 36 t6
10 and 11 32 3-8 8.E to 1.0 1.0 55 50 50 60 55 70 70 60 to t5 ts 11 and 19 87 2.7 1.5 10 ..o to 75 90 ISO 110 110 110 120 1.2 Vf 58
99 3951- 1 and 2 85 8.5 5-8 j 6 8 88 38 te 61 69 78 5* 58 6 12 23 2 and 3 30 3.0 8.0 10 10 12 50 U 55 to 58 ee 58 58 11 8t 37 3 and li gfi 8.8 1-9 10 12 16 to 5t 50 50 60 68 65 68 13 89 1.3 li and 5 » 2.t 1.6 6 8t to Ui 5t 70 90 9t 78 100 ICO 83 36 t£ 5 and 6 26 5.6 1.8 6 10 58 60 et 70 70 60 88 9k BO 83 tl 59 6 and 7 *l 8.7 1.8 10 8 !.:. liO V J" 60 lor- 68 78 to 19 89 37 4 7 and 8 26 8.6 1.8 10 9 89 to t7 'jO 65 -.1 >■„ 78 .1 16 et 39 8 and 9 63 8.3 1.6 !0 10 IS to 68 68 70 BO 110 n 109 13 83 to 9 and 10 li 8.6 1.8 li 17 * t7 ta 51 65 75 7<: 95 111 88 33 t3
10 and U 30 3.0 e.o 80 17 38 t7 51 53 <■':■ Cl 87 too 188 »3 ja t3 U and 12 Jl 3-1 ?.i 19 19 W f! tfi M u ?■ 58 TO i:l 8t JO 39 12 and 13 25 8.5 1.7 y> to 38 5t a 6t IS 90 108 11.- 180 3t te 50
-■j 3951 1 and 2 36 3.6 2.56 65 ■■;• 68 70 -.- 65 7» 75 TO TO 65 6t <<; 67 2 and 3 33 33 885 W -■ 68
-•■ ~: 5'. ■■■■■
te is ..? <.-'■ 58 a ■'■
3 »nd "• JO 3-0 805 OS 68 75 >.= '? .:,: a • ■ 58 <■? ■■■ ti " 61 1> ind 5 2t> 8.«i 1.6k 88 78 75 60 65 GO 68 ...~ t> • ■■- se 78 71 67 5 and 6 r- 8.8 1.91 !", 90 -:■ 58 58 t5 55 58 58 -■: 68 79 «6 55 6 and 7 r-- 8-9 1.98 58 78 (A3 H J5 60 75 '« n '-, no 63 68 57 V and 8 32 38 2.16 " 58 k5 •.:• 78 85 :•• üi m I» 168 51 58 59 8 and 9 37 3.7 2.52 90 ■;• 58 £8 68 78 88 ',:■ !W u- 118 n ■! 61 9 and 10 30 J.O 8.05 to; 90 70 ','■■•
... V, 65 ■■.• 80 JO U>! 88 77 67 10 aM 11 v- i.e 183 75 •• .■'> 50 50 55 6o ■:• Bo 6) -.. 38 73 5« 11 and 12 20 2.0 1.37 75 95 71 ■ 50 55 ,..-. 65 Bo 65 65 es 73 58
Avrn^r Kat'.r^ Co&c Inde* 3- te 9-sn. Uy-r A'^nw« 6l--'<l.
5.6 5.2
—* Station
in TVst » !>■«■. 100 fv-ot
0.O to 1.00 10 52 2.3 1.00 U) 2*00 .... a si 2.1 1.8 1.9 2riX) to 3^X1 17 21 5t 2.0 1.8 2.1 5<W to End }9 30 58 2.1 1.9 l.t
Viiluen Qooumcd to DC same ac preceding meftsured value. Eetlinated from adjacent tect lane.
(Continued)
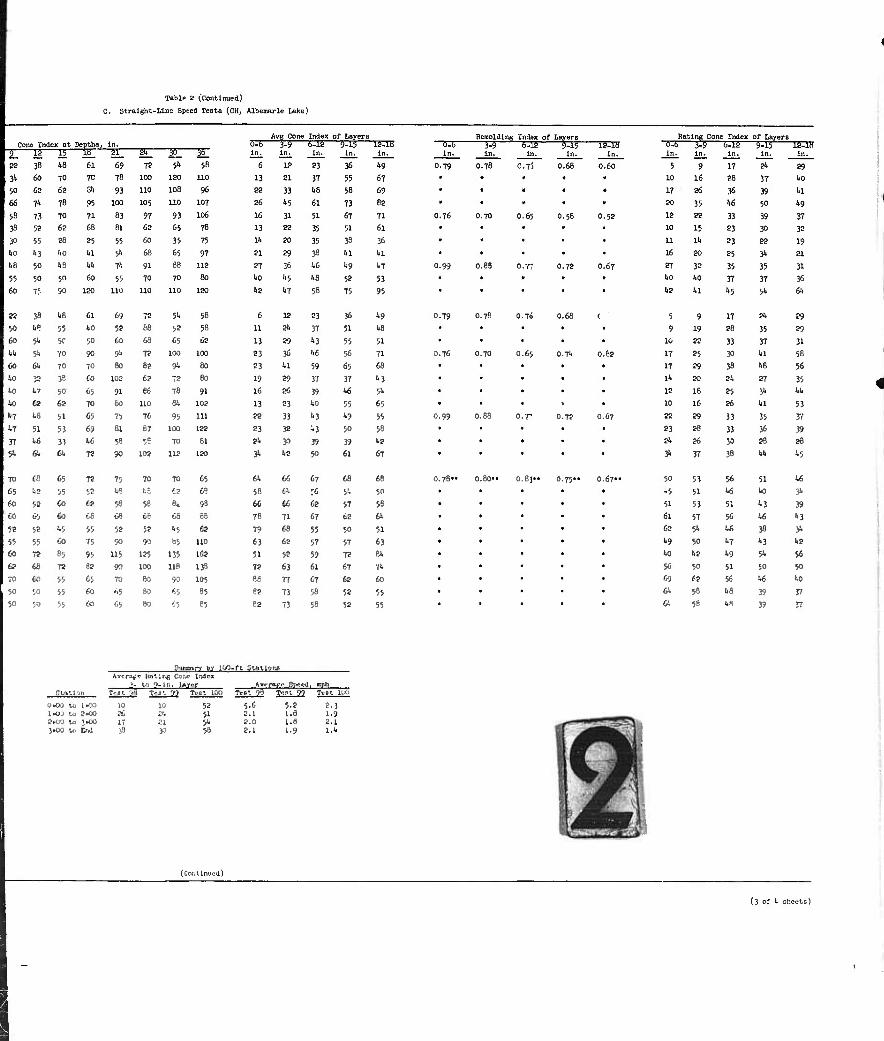
Table 2 (Continued)
C. Straight-Line Speed Tests (CH, Albemarle Lake)
ll Cone Index at Depths, in. Avg Cone Index of Layers Rerooldlng Index of Layers Rating Cone Index of Layers
0.6 In.
6
3-9 In.
1?
6-1* In.
23
5-15 In.
36
18J.B In.
49
Ö-6 In.
3-5 In.
5-14 In.
$-15 In.
1S38 In. In.
5
3-9 In.
9
6.1a in.
17
5-15 In.
24
■153m In.
22
12
38
15 1.8 61
81
69 72 51. 53 0.79 O.78 C.71 0.68 0.60 29
34 60 70 70 78 100 120 110 13 21 37 55 67 10 16 28 37 40
50 68 62 31. 93 110 108 96 22 33 1.8 58 69 17 26 .36 39 41
66 T* 78 95 100 105 110 107 26 1.5 61 73 82 20 35 1.6 JO 49
58 73 70 71 83 97 93 106 16 31 51 67 71 O.76 0.70 0.63 O.58 0.52 12 22 33 39 37
38 52 6i 68 ei 62 65 78 13 22 35 51 61 10 15 23 30 32
P 55 28 25 55 60 35 75 14 20 35 38 36 11 Ik 23 22 19
M) kj bO til 54 68 65 97 21 29 38 41 41 16 20 25 34 a 1.8 50 US U 7'< 91 88 112 27 36 46 1.9 47 0.99 0.88 0.77 0.72 0.67 Zi 32 35 35 31
55 50 50 60 55 70 70 80 40 45 46 52 53 UO 40 37 37 36
to 7f 90 1?3 UO 110 no 120 1.2 47 58 75 95 1.2 1.1 45 54 64
i? 38 t>8 61 69 72 54 58 6 12 23 36 49 0.79 O.78 0.70 0.68 C ' 5 9 17 24 89
50 W 55 ko 52 •■e 52 58 11 24 37 51 48 9 19 23 35 2-3
to s* 5C 50 to 68 65 6? 13 29 43 55 51 10 22 33 37 31
U 5«. TO 90 9* 72 100 100 23 36 46 56 71 0.76 0.70 0.65 0.74 0.62 17 25 30 41 56
w « TO TO Ho 6? 94 80 23 41 59 65 68 17 23 38 46 56
!.0 38 ja 60 102 62 72 80 19 29 37 37 43 It 20 21 27 35 < i:.l t7 JO 65 91 86 78 91 lo 26 39 46 5* 12 16 25 34 44 '
ko 62 62 TO BO UO 84 102 13 23 40 55 65 10 lo 26 hi 53
i? 18 51 6) 75 76 95 IV. 22 33 43 •■9 55 0.99 0.68 o.r 0.72 0.67 22 29 33 35 37
•-■; 51 53 f 61 87 100 '.:■? 23 J2 13 50 ■<■ 23 28 33 36 39
Y! W !! 1.6 58 58 7- 81 2^ 5'- 39 s ■-7- 24 26 30 26 26
'- -- a TO 90 102 U2 120 •■■ 42 50 61 67 34 37 38 44 45
TJ ta «■ 72 75 TO TO ■:.'. 64 66 67 ts t.'- 0.78" o.eo" 0.8)»« 0.75" 0.67" 50 53 56 51 46
f. 42 ■'■ 52 48 :.• 62 68 58 64 f6 54 50 -5 51 46 40 34
£0 ■.:■ & 62 58 58 ■■. 98 ,< «- 62 57 V 51 53 51 •■3 39
60 65 <■- .,'■ 68 ,- 68 .v 78 Tl 67 62 64 61 57 56 46 43
9« 52 fc? 55 52 58 45 63 79 68 55 53 51 62 54 46 l". 34
S! 55 ,,, 75 V, 90 b5 UO 63 62 57 57 63 49 50 47 43 42
60 72 - 95 115 1*5 135 162 51 52 59 TO 84 40 42 49 54 56
fa m TO 82 92 100 lie 138 72 63 61 67 74 56 50 51 50 50
■: 60 55 65 TO 60 90 105 88 77 67 62 60 69 62 56 46 40
■ ■ 55 ,., 65 80 •■:■ ■", 82 73 58 $2 55 64 58 46 39 37
50 ■-- 55 60 65 SB '■■: -; r 73 58 52 55 64 58 48 39 J7
f-ironr/ tit iw-rt gmtaa Avrratf"
>- to 9-:r,. Uy ■r hv- r^^ :■] rrl, ra* Station
OK» lo IKJO IK» to 2*00 2<oa to 3.00 IK» u. End
11
17
**l 99
; ■
.■•
21
r^-et 100
52 51 54 58
mt 90
5.6 2.1 ;.vi 2.1
tssi n 5.2 1.6 1.8 1-9
Tist iyj
2.3 1.9 2.1 1.4
(Continued)
(3 of 1* sheets)
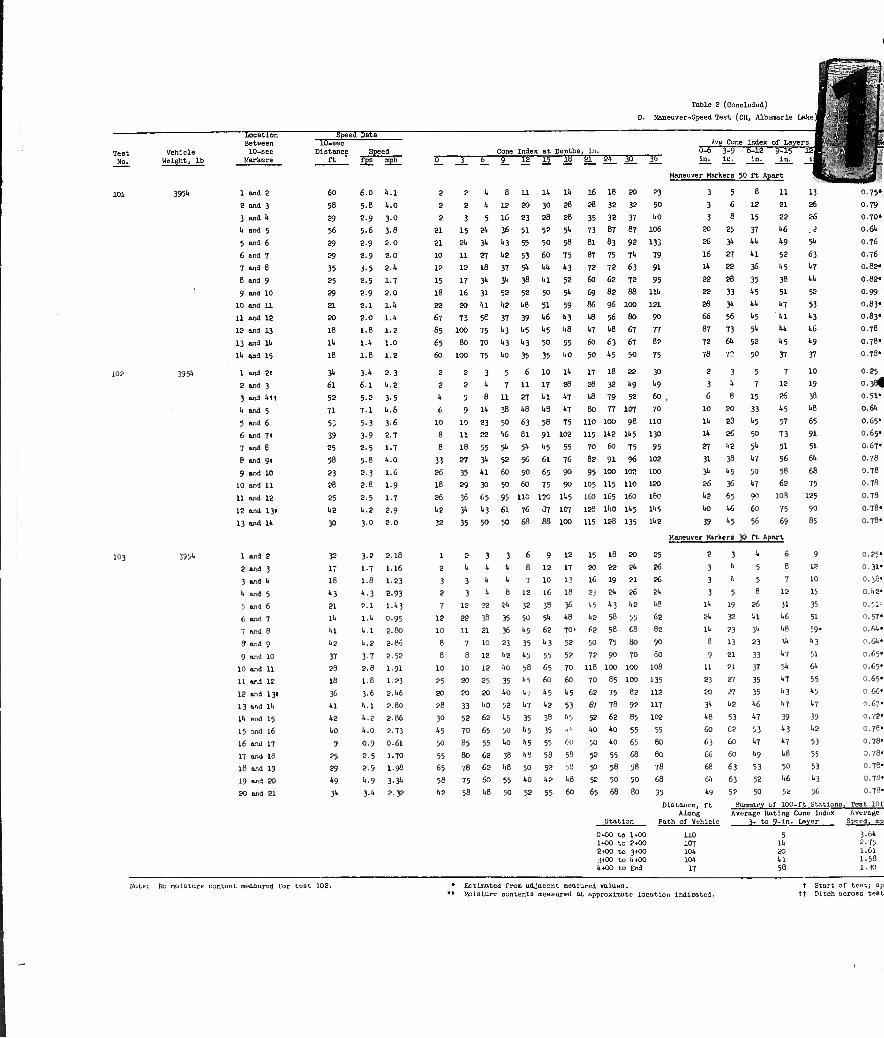
Table 2 (Concluded)
D. Maneuver-Speed Test (CH7 Albtmarle lÄke)j
Vehicle Height, lb
3951«
Location Between 10-sec
Markers
öpeed Öata
Cone Index at tenths , In.
Maneuve
Avg Cone Index of Layers ftÜ HI IT lO.sec Distance
ft Speed
fps mph
6.0 It.i
^R'- E£ Test 0-6^ 3-9 6-12 9-15
in. In. in. In.
r Markers 50 ft Apart
3 5 8 11
^ Jp> No. 0_
2
A.
2
6_
It
9_
8
18
11
15
111
IB
Ik 16 18 20 23 1 end S 60
m^*J 101 13 0.73*
2 and 3 58 5.8 It.O 2 s li 12 20 30 28 28 32 32 50 3 6 12 21 26 0.79
3 and It 29 2.9 3.0 2 3 5 16 23 28 28 35 32 37 ko 3 8 15 22 26 0.70»
U and ; 56 5.6 3.8 21 15 21. 36 51 52 5k 73 87 87 106 20 25 37 k6 .8 0.6k
fi and 6 29 2-9 2.0 21 2U 3". '0 55 50 58 81 83 92 133 26 31. kk 1.9 5k O.76
6 and 7 29 2.9 2.0 10 11 27 1.2 53 60 75 87 75 7k 79 16 27 kl 52 63 0.76
7 and 8 35 3.5 2.It 12 12 18 37 5"t W» k3 72 72 63 91 Ik 22 36 k5 k7 o.8a«
8 and 9 25 2.5 1-7 15 17 31. 31. 3B 1.1 52 60 62 72 95 22 28 35 38 1.1. o.8a»
9 and 10 29 2-9 2.0 18 16 31 52 52 50 5k 69 62 B8 Ilk 22 33 1.5 51 52 0.99
10 and U 21 2.1 1.1. 22 20 1.1 1.2 1.8 51 59 66 96 100 121 28 31. hh k7 53 0.83«
11 and 13 20 2.0 1.1. (37 73 58 37 39 1.6 1.3 1.8 56 80 90 66 56 k5 kl k3 0.83'
12 and 13 18 1.8 1.2 65 100 75 1.3 1.5 1.5 1.8 k7 1.8 67 n 87 73 5k Ui 1.6 0.78
13 and lit 111 l.U 1.0 65 80 70 1.3 1.3 50 55 60 63 67 82 72 6k 52 1.5 1.9 0.78»
lit and 15 IB 1.8 1.2 CO 100 75 1.0 35 35 ko 50 1.5 50 75 76 72 50 37 37 0.78»
102 395^ 1 and 2t » ■>■'' 8-3 a 2 3 5 6 10 Ik 17 18 22 30 2 3 5 7 10 0.85
2 and 3 61 6.1 !..2 2 2 It 7 11 17 28 88 32 1.9 1:9 3 b 7 12 19 o.38|
3 and Ittt 52 5-2 3-5 1. 5 8 U 27 1.1 1.7 1.8 79 52 60 6 8 15 26 38 0.51"
It and J 71 7.1 It.8 6 0 11. 38 w >id 1.7 80 77 107 70 10 50 33 k5 k8 0.6k
5 and 6 5: 5-3 3-6 10 10 23 50 63 58 75 no 100 98 no Ik 83 1.5 57 65 0.65"
6 and 7« 39 3.9 2.7 8 11 22 « 81 91 102 115 11.2 JA5 130 Ik 86 50 73 91 0.65«
7 and 8 25 a. 5 1.7 8 16 55 51' 51. 1.5 55 70 60 75 95 27 1.2 5k 51 51 0.67»
8 and 91 53 5.8 .'..o 33 27 3'. 52 56 61 76 8a 91 96 102 31 38 k7 56 6k 0.78
9 and 10 S3 a. 3 1.6 86 35 1.1 60 50 65 ■JO 95 100 102 100 3k k5 50 58 68 0.78
10 and 11 SB a.e 1.9 IB 89 30 50 60 75 91 105 115 110 120 26 36 1.7 62 75 O.Tfl
U and 12 25 8.5 1.7 86 36 65 55 no iso U5 160 165 160 180 ka 65 90 10Ä 125 0.78
12 and 131 bi it.a 8.9 1.7! V> M 61 76 or 107 188 ll.O 1*5 lk5 kO 1.6 60 75 90 0.78«
13 and lit 30 3.0 2.0 32 35 50 50 68 88 100 115 12R 135 tia 39 k5 56 63 85 0.78>
Maneuver Klrkcra 30 ft Apart
»3 ■•■- I and 2 38 3.2 a. 18 1 2 3 3 6 9 18 15 18 w 85 2 3 k 6 9 0.85«
2 and 3 17 l.T 1.16 2 1. '-. 1. 8 18 17 50 25 21. 86 3 1. 5 s. 18 0.31'
3 and b IB 1.8 1.83 3 3 It It 7 10 U 16 IS 81 96 3 i 5 7 10 0. J9»
It and J "•3 M 2.93 a 3 It 8 1? 16 18 83 » S£ 8k 3 5 8 18 15 o.w
5 and 6 ex 8.1 I.k3 7 I? 28 2lt 38 38 36 1.5 k3 ka kfl Ik 19 86 31 35 0.51-
6 and 7 !'■ I.It 0.95 12 88 38 35 50 5k k8 1.8 5J 55 6a 8k ■:■ kl l.., 51 0.57«
7 and 8 u It.t 8.80 10 11 81 36 ■•5 6a TO» 68 5ft eft 88 Ik 83 3k kB 59* 0.6k>
9 and 9 It2 it.a 2.8« 8 7 10 83 35 "•3 58 50 T5 80 90 8 13 83 V. k3 0.6k«
9 and 10 37 37 2.52 8 8 12 ba •■5 55 58 78 90 70 80 9 81 33 k7 51 0.65«
10 and 11 28 8.8 1.91 10 10 18 ItO 58 65 70 118 100 100 108 11 81 37 5k 6k 0.65'
U and 1? IB 1.8 1.23 85 80 85 35 15 60 60 70 85 100 135 83 87 35 k7 55 0.65'
12 and 131 3« 3.6 a.itfi ao eo 80 ItO 1.5 kS 1.5 68 75 8a 112 ao 87 35 k3 k5 0 66-
13 and lit 1.1 It. I 8.80 as 33 1.0 58 i.f ka 53 67 78 98 117 3k ka k6 k7 k7 0.67*
lit .Mid 15 i.? it.a 8.86 30 58 6a ■'S 35 38 I15 58 62 85 108 k8 53 k7 39 39 0.78»
15 and 16 uo It.O a.73 It5 70 65 50 1.5 35 1.0 1.0 55 55 60 68 53 k3 ka 0.79>
16 and 17 9 0.1 0.61 50 85 55 ItO l'5 55 60 50 kO 65 80 63 60 1-7 k7 53 0.78'
17 and 18 25 a.5 1.70 55 80 68 38 w 58 5B 58 55 68 80 66 60 k9 k8 55 0.78"
18 and 19 89 a.9 1.98 65 78 62 1.0 50 52 58 50 58 58 78 68 63 53 50 53 0.78-
19 and 20 lt9 it.9 3.3lt 58 75 60 55 1.0 ka kB 52 50 50 68 6k 63 58 I16 k3 0.78-
20 and 21 3k 3.1. 8.32 US 58 l.U 50 58 55 60 65 68 80 95 k9 58 50 52 56 0.73'
0 1
r
Station
Distance, ft Along
Path of Vehicle
110 107 10lt 10lt
17
SujTSTurv of 100 Average Rating
3- to_9-ln.
-ft Stations -one Index lÄVer
, Tent 101 Average
Speed, rap
*00 to l*O0 tOO to 2*00 400 to 3*OC 400 to ktOC ♦00 to End
5 Ik 20 1.1 56
3.6k 2-75 1.61 I.58 1.30
Ho moisture content raeaaured Vor test 102. * Eetijnated from adjacent neaoured values. ** MoiGturo contents measured at approximate location indicated.
t Start of tect; op tt Ditch across test
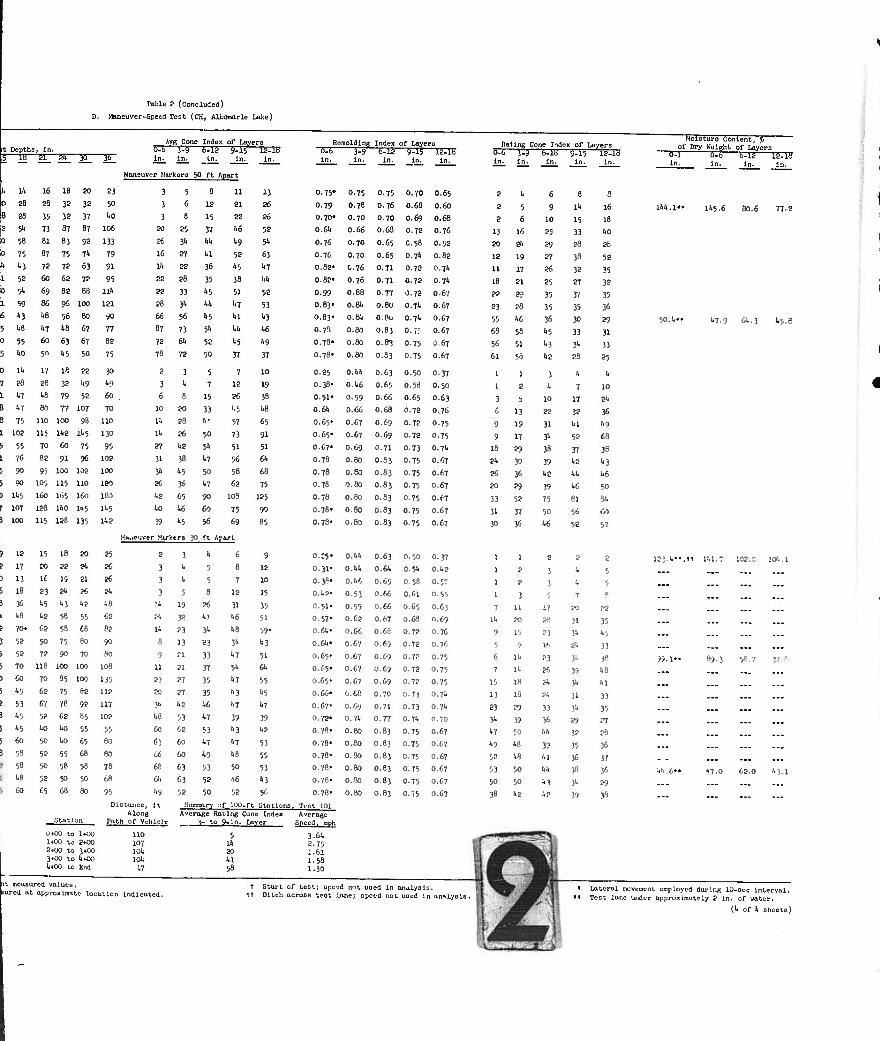
Table ^ (Concluiied)
D. Maneuver-Speed Test (CH, Albemarle Lake)
i, In. 55—53 35-
ih
28
28
54
58
75
U3
51.
59
'3
1.8
55
liO
!■'.
88 kT kT 75
102
55
76
« 90
'.!■■;
107
103
17
13
18
36
1.8
70.
5»
5?
70
60
'•5
53
k5
".5
60
58
58
l>8
60
16
28
35
73
81
3,
72
60
69 86 I18
i.7
60
50
17
26
60
no U.5
TO 88
95 105 160 12«
US
18
32
32
87
83
75
72
62
82
96
56
1-8
63
"•5
Ifl
32
79 77
KO
Ids 60
91
100
U5
165
UO
128
15
K
It
83 k5 li8
68
■n
78
118
70
68
67
58
ho
50
58
50
58
£5
!'■
88
19 8b
'«3 58 58
75
90
100
85
75
78
68
i.O
UO
55
58
50
68
20
32
37
87
92
71.
63
72
88
100
CO
67
67
50
88
1.9
58
107
98
1*5
75
96
108
110
1'0
1-5
135
?J
:■■■
81
it hi
55
68
80
7'-
100
I"-,
88
98
65
55
65
68
58
50
80
AVR Cone Index of Layers o-b 3-9 EHS 5^5 I5IIH In. In. in. In. In.
23
50
1.0
106
133
79
91
95
lit
121
90
77
68
75
30
I19
60
70
no 130
95
ico
-co
180
l£0
1*5
1-2
25
r-: 86 8* kB
68
88
90
I'.'-
115
1 !.-
117
108
55
80
60
78
68
95
Maneuver Markers 50 ft Apart
3 5
3 6
3 20
26
16
111
22
22
88
66
87
78
78
2
3
6
10
1*
1*
87
31
3k
86
k8
kO
39
25
3* 27
22
28
33
3!.
56
73
6!.
72
3
* 8
80
2S
26
k8
38 k5 36 65 k6 k5
12
15
37
Ui
1.1
36
35
1.5
It*
k?
5k
58
50
5
7
15
33
*■:
50
5k
•-I
50
k7
■»
to 56
11
21
22
1.6
1.9
52
k5
38
51
k7 kl U 1.5
37
7
12
86
1.5
57
73
51
56
58
68
103
75
69
13
26
26
52
5* «3 k7 w.
52
53
k3 1.6
k9 37
10
19 38
65 91 51 6k 68 75
125 90 85
Hh.^'-ivcr jfcrtgrg ^0 ft Artu-t
8
J
3
! ;k
8k
Ik
8
9
LI
83
80
«1
k8
60
63
66
68
6k
k9
It
-S3 In
Remolding Index of Layers J^j 6-12 9-15 ^IB in. in. in. in.
0.75*
0.79
0.70»
0.6*
0.76
0.76
0.82'
0.68'
0.99
O.BS' 0.83'
0.7«
0.78>
0.76«
0.25
0.}8>
0.51«
0.6k
0.65*
0.65'
0.67'
0.78
0.78
O.78
0.78
0.78»
0.78«
StaUon
utOO to IKK) 1*00 to 2*00 2«« to 3*00 3+00 to U+OO '.tOO to End
Distance, Along
Path of VehlcU-
110 107 10k lOk
17
3 k 6 9 o.:5> k 5 8 18 o.ji-
k 5 7 10 o.}9«
5 8 18 15 o.i.?«
19 86 31 35 0.51«
38 k) 1.6 51 0.57«
83 3k k8 59. o.t!..
13 83 3k k3 0.64«
21 33 k7 51 0.65'
81 37 5k W 0.65«
87 35 k? 55 0.65'
27 35 M 1,5 o.^.
k? k6 k7 k7 0.67«
53 k7 39 39 0.78'
62 53 k} ka 0.78«
60 k7 1.7 53 0.78'
60 1.9 1.8 55 0.78»
63 53 50 53 0.7e«
63 58 ''& k3 0.76'
52 50 52 56 0.7e'
"uranary of 100-ft Sttttlono, T'.-ot 101 Average Rating Cone Index V to 9-in. lüyc
5 lk 20 kl 50
0.75
O.78
0.70
0.66
0.70
0.70
C.76
0.76
0.88
0.8k 0.8*
0.80
0.80
0.80
0.**
O.kfi
0.59
0.66
0.67
0.67
0.69
0.80
o.Sa 0.60
0.80
0.80
0.60
O.kl
O.k*
0.k6
0.53
>.; . 0.68
O.U
0.61
0.67
0.67
0.67
',.(.:• 0.0<J
0.7k
O.BO
o.eo 0.80
0.60
0.00
0.80
Average Speed, nph
3.61. 8-75 1.61 1.58 1.30
O.75
O.76
0.70
0.68
0.65
O.65
0.71
0.71
0.77
0.8Ü
o.eo 0.83
0.8-3
0.63
0.63
0.6;
0.66
0.68
0.69 0.69
0.71
0.83
0.83
0.83
0.83
0.83 0.83
0.63
0.6k
0.65
0.66
0.66
0.67
0.66
0.69
0.69
a.69
0.69
0.70
0.71
0.77
O.83
O.83
O.83
O.83
0.63
0.83
0.70
0.68
O.69
0.72
O.56
0.7k
0.72
0.78
0.78
O.T.
0.71.
0.75
0.75
0.75
O.50
0.58
O.65
0.78
0.78
0.78
0.73
0.75
0.7'.
0.75
0.75
0.75
0.75
0.50
0.5k
0.58
-• '! 0.65
,..,> 0.78
.71
0.78
0.78
0.78
0.73
0.7k
0.75
0.75
0.75
0.75
0.75
0.75
O.65
0.60
0.68
0.76
0.52
0.88
0.7k
0.?!.
0.6Y
0.67
0.67
O.67
0.67
0.67
0.37
0.50
0.63
0.76
0.75
0.75
0.7*
O.67
0.67
0.67
0.67
0.67
B.67
0.37
0.1,8
O.5C
0.55
0.1 J
r,.,..
.■'
0.76
0.75
0.75
0.75
O.7I1
0.7k
0.1«
0.67
0.67
0.67
0.67
0.67
O.67
Rating Cone Index of Layers ÖTE ■P? 5^B 9115 iäns in. in. In. in. in.
it measured values, »ured at approx ünatc location indicated.
t tt
Start of test; speed not used in analysis. Ditch across teat lane; speed not used in analysis.
2 1. 6 8 3
2 5 9 lk 16
2 6 10 15 18
13 16 25 33 kO 20 ?i. 89 88 88
12 19 87 38 58 11 17 86 32 35 18 21 85 87 38 88 89 35 37 35
83 88 35 35 36
55 k6 36 30 89 68 58 k5 33 31 56 51 •■>■', 3k 33 61 58 ki :■■■ 85
1 1 3 k !. 1 8 .'. 7 10
3 5 10 17 8k
■:. 13 88 38 36 9 19 31 kl k9
9 17 3k 58 68 is 89 J« n i- 8* 30 39 k8 k3 86 96 k8 U k6 80 89 39 k6 • 1
53 58 75 81 8k
31 J7 50 56 60
30 36 k6 5? 57
1 1 I ? .•■
1 8 3 b • 1
1
8
3
3 k
7 5 B
7 11 17 :• :■:
lk 80 88 31 55 9 15 83 3k b5 5 9 1* 8k 53 6 lk 83 .,:. }8 7 lk 86 39 te
15 18 8k 3k ki
13 18 8k 31 33
:" 89 33 3* 35 3k ■• ., 89 87 k7 50 kl 38 86 1.9 ■■'■ 39 35 }6
58 k8 kl 36 37 53 50 111. 38 36 50 50 k3 3k 89 38 k8 k» 39 38
Moisture Content, ?. of Dry Height of Layers
"^ 53 BUS 1538 t". in. in. In.
Ikk. !•• Ik5.6 80.6 77.2
50.li' k7.9 6k.3 k5.8
183.i.".M lkl.7 108.C 10ä,.l
79.i" 69.3 58.7 37.e
i'..6<< 1.7.O 68.0 1.3.1
♦ Lateral movement employed during 10-scc interval. ** Test lane under approximately 2 in. of water.
(k of 1. sheets)
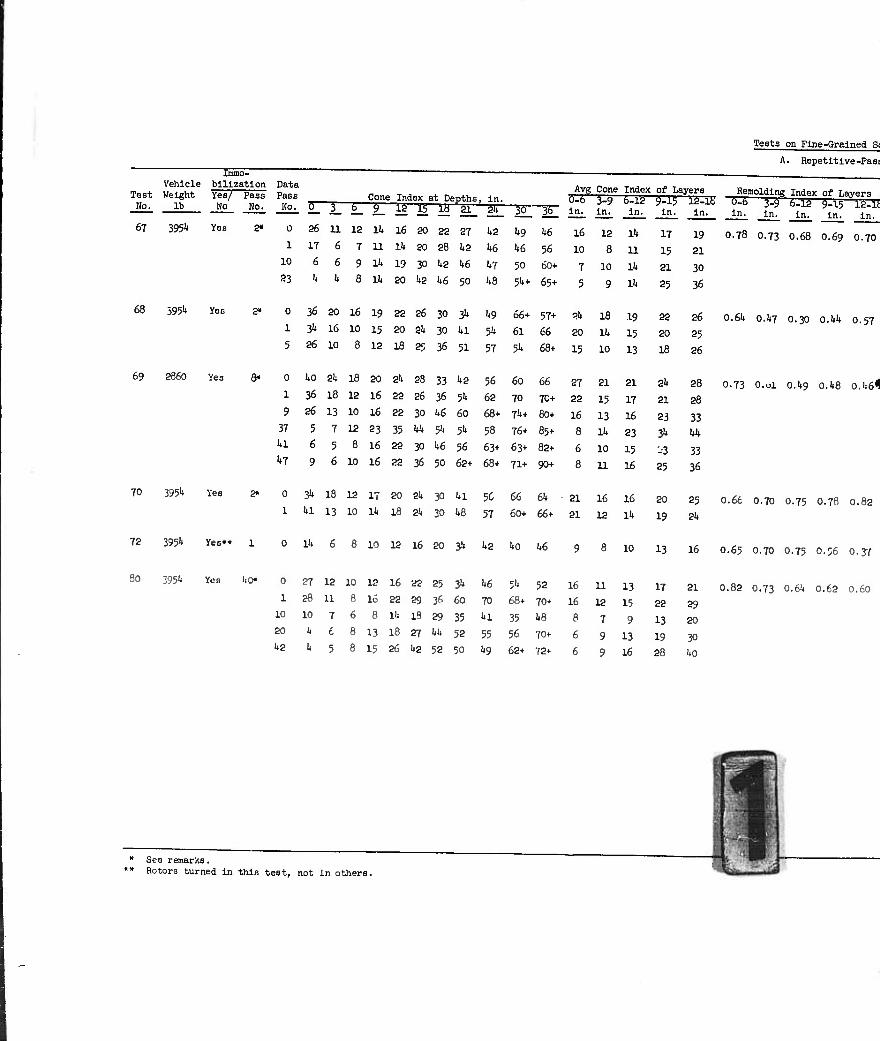
Tests on Fine-Grained Sc
A. Repetitive-Pass
Test Vehicle Weight
bllizatlon Yes/ Pass No No.
Yes 2»
Data Pass No.
0
1
Cone Index i it De-Dths . in. Avg (TTT
Cone TT
Index 6.ig
of Layers TTTC—rs-nr Remolding Index of Lavers
No.
67
lb
3951*
ö_
26
17
3_
11
6
6_
12
7
14
11
ET
16
14
15
20
20
11 22
28
21
27
42
42
46
30
49
46
36
46
56
in.
16
10
in.
12
8
in.
14
11
in.
17
15
in.
19
21
Kj-o j.y o-i2 9_15 12_lt In. in. in. in. In.
0.78 0.73 0.68 O.69 0.70
10 6 6 9 Ik 19 30 42 46 47 50 60+ 7 10 14 21 30 23 It 1. 3 14 20 42 46 50 48 54+ 65+ 5 9 14 25 36
68 3951* Yes 2» 0
1
36
3^
20
16
16
10
19
15
22
20
26
24
30
30
34
41
49
54
66+
61
57+
66
24
20
13
14 19
15
22
20
26
25
0.64 0.47 0.30 0.44 0.57
5 26 10 8 12 18 25 36 51 57 54 68+ 15 10 13 18 26
69 2860 Yes Ö* 0
1
ho
36
2h
18
18
12
20
16
24
22
28
26
33
36
42
54
56
62
60
70
66
7C+
27
22
21
15
21
17
24
21
28
28
0.73 O.ol O.49 0.48 0.46<!
9 26 13 10 16 22 30 46 6o 68+ 74+ 8-0+ 16 13 16 23 33 37 5 7 12 23 35 44 5U 54 58 76+ 85+ 8 14 23 34 44 in 6 5 8 16 22 30 46 56 63+ 63+ 82+ 6 10 15 -•3 33 '•7 9 6 10 16 22 36 50 62+ 63+ 71+ 90+ 8 11 16 25 36
70 3951* Yes 2» 0
1 in 10
13
12
10
17 14
20
IS
24
24
30
30
41
U8
5C
57
66
6o+
64
66+
21
21
16
12
16
14
20
19
25
24
0.66 0.70 0.75 O.78 0.82
72 3954 Yes« 1 14 8 10 12 16 20 34 42 40 46 8 10 13 16 O.65 0.70 0.75 O.56 O.37
80 395I1 yes 40» 0 27 12 10 12 16 22 25 34
1 28 11 8 16 22293660
10 10 7 6 8 14 IS 89 35
20 4 £ 8 13 18 27 44 52
42 4 5 8 15 26 42 52 50
46 54 52 16 11 15 17 21 TO 68+ 70+ 16 12 15 Z-2 89 41 35 kB 8 7 9 13 20
55 56 70+ 6 9 13 13 30 ho 62+ 72+ 6 9 16 28 40
0.82 0.73 o.öt 0.62 0.60
• See remarks. ♦* Rotors turned in this test, not In others.
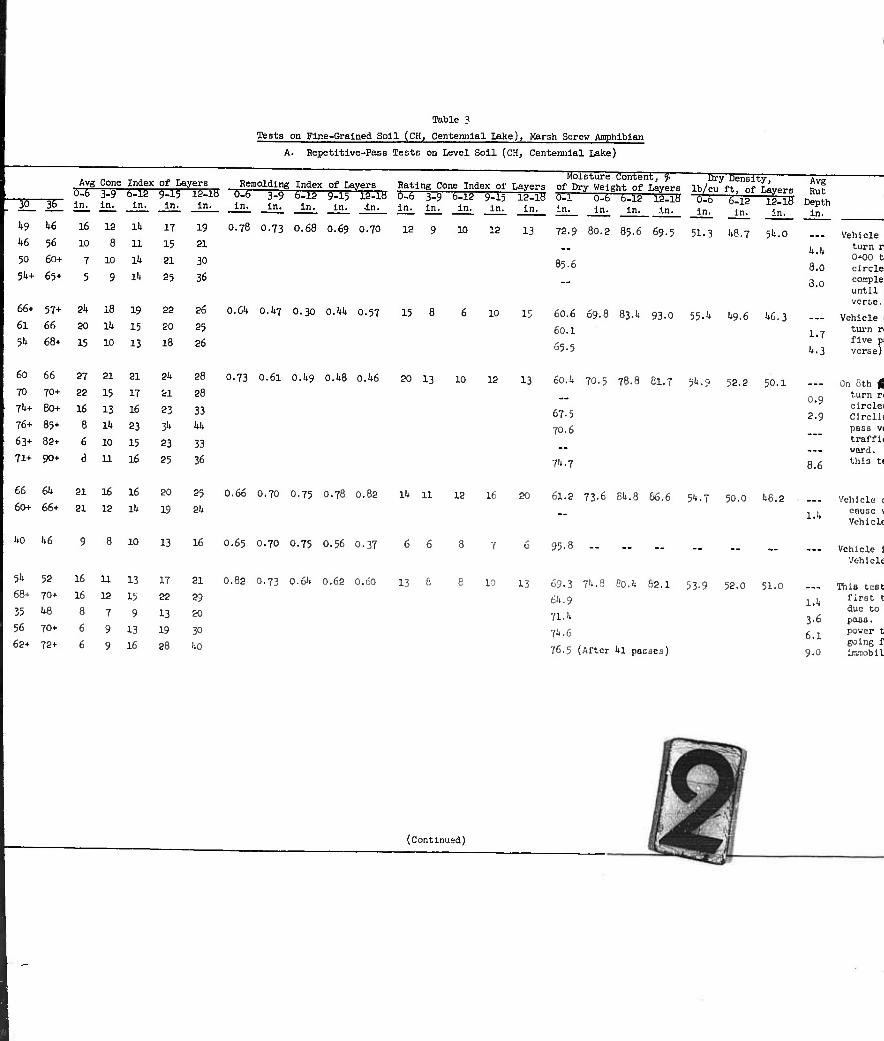
Table 3
Teats on Flne-Gralned Soil (CH, Centennial Lake), Marsh Screw Amphibian
A. Repetitive-Pass Tests on Level Soil (CH, Centennial Lake)
30 36
h9 46
h6 56
50 6o+
5h+ 65+
60 66
70 70+
7U+ 80+
76+ 85+
63+ 82+
71+ 90+
Avg Cone 0-6 3-9 in. in.
16 12
10 8
7 10
5 9
Index of Layers
66+ 57+ 2k
61 66 20
51* 68+ 15
27
22
16
8
6
a
iii
10
21
15
13
Ik
10
11
6^2 in.
lit
11
Ik
Ik
19
15
13
21
17
16
23
15
16
66 61» 21 16 16
60+ 66+ 21 12 lU
9-15 in.
17
15
21
25
22
20
18
21;
21
23
*
23
25
20
19
in.
I»0 l»6 8 10 13
19
21
30
36
26
25
26
28
28
33
kk
33
36
25
2k
16
Remolding Index of Layers - J**"-—■ - -
in
Moisture Content, f try Density,
in.
O.78
_in.
0.73
,ng Index of Layers Rating Cone Index of Layers of Dry Weight of Layers Ib/cu ft, of Layers 5 6-12 9-I5 l^-lH 0-6 3-9 6-12 9-15 12-10 33 0-6 tlS iLlH u-b blig 12 18 :l ln- I»- -l"- In. in. in. in. in. in. in. in. in. in. in In
0.68
in
0.69 0.70
in
12
O.Ck 0.1*7 0.30 O.kh 0.57 15 8
0.73 0.6l 0.1»9 O.I18 0.1*6 20 13
0.66 O.70 0.75 O.78 0.82 lk u
O.65 0.70 0.75 O.56 0.37
10
10
1?
10
12
It
13 72.9
85.
15
20
In.
80.2 85.6 69.5
In.
51.3
in.
1*8.7
60.6
60.1
65.5
54.0
69.8 83.1* 93-0 55.1» 1*9.6 1*6.3
13 60.1* 70.5 78.8 81.7 51».9 52.2 50.1
67.5
70.6
7ii.7
61.2 73-6 81*.8 66.6 51»." 50.0 1*6.8
Avg Rut
Depth in.
k.k
3.0
3.0
l.Y
4-3
0.9
a.9
8.6
l.lt
95.8
51» 52 16 11 13
68+ 70+ 16 12 15
35 48 879
56 70+ 6 9 13
62+ 72+ 6 9 16
17 21 0.82 O.73 0.61* 0.62 0.60 13 8
22 29
13 20
19 30
28 1*0
10 13 69.3 74.8 80.1* 82.1 53.9 52.0 51.0
&>-9 1.1*
71-'' 3.6
T^ö 6.1
76.5 (After 1*1 paoses) 9.0
(Continued)
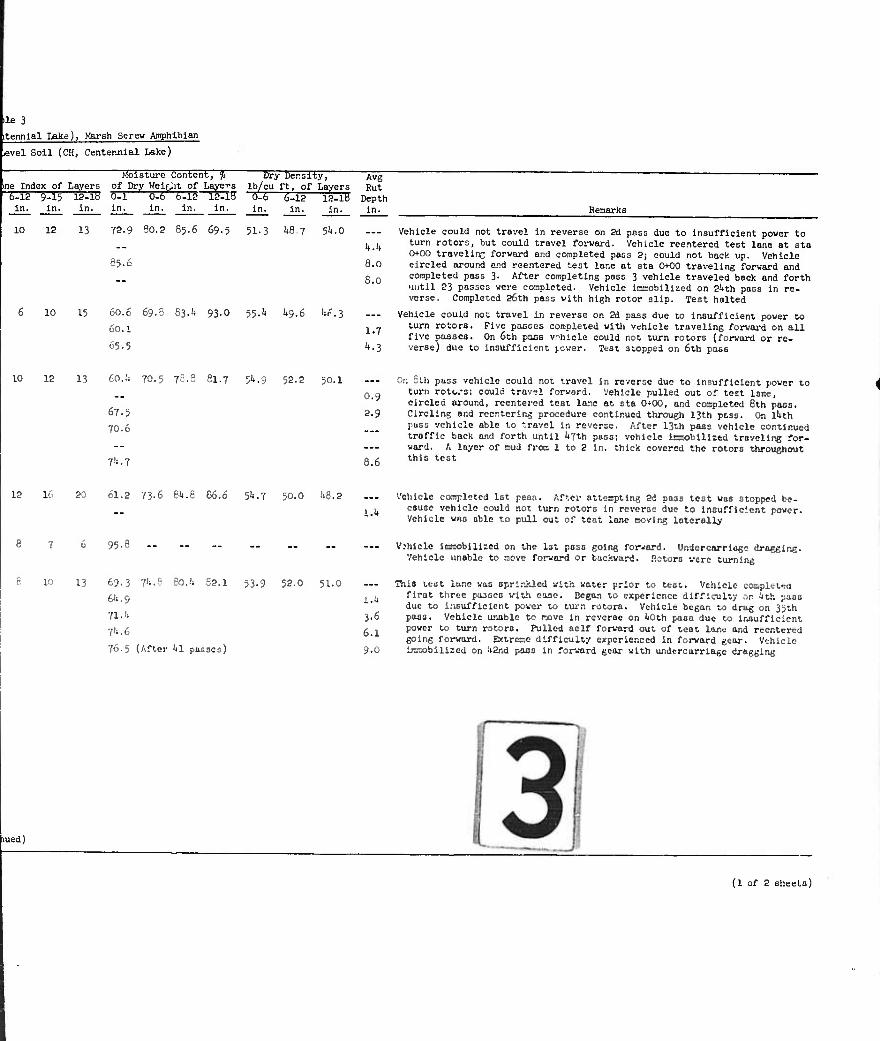
ile 3
itennlal Lake), Marsh Screw Amphibian
■eve! Soll (CH, Centennial Lake)
Moisture Content, % Dry Density, Avg me Index of Layers of Dry Weic".it of Layers Ib/cu ft, of Layers Rut 6-12 9-15 12-10 SU 0.6 6-12 12-lH "ÄS gllä TR^S Depth in. in. in. in. in. in. in. in. in. in. in.
10 12 13
10 15
72.9 80.2 85.6 69.5 51.3 W.? 5k.0
85.
60.6
60.1
65.5
69.8 83.U 93.0 55.U U9.6 Ui'.3
it. 1.
8.0
3.0
1.7
Remarks
Vehicle could not travel in reverse on 2d pass due to insufficient power to turn rotors, but could travel forward. Vehicle reentered test lone at sta 0+00 travellne forward and completed pass 2; could not back up. Vehicle circled around and reentered test lane at sta 0+00 traveling forward and completed pass 3. After completing pass 3 vehicle traveled back and forth until 23 passes were completed. Vehicle Inaoblllzed on 2Uth pass in re- verse. Completed 26th pass with high rotor slip. Test halted
Vehicle could not travel in reverse on 2d pass due to insufficient power to turn rotors. Five pasoee completed with vehicle traveling forward on all five nasses. On 6th pass vehicle could not turn rotors (forward or re- verse) due to insufficient j.cwer. Test stopped on 6th pass
10 IS I-. 60.!i 70.5 78.
67.5
7O.6
71*.7
Si.7 5M 52-2 50.1
0.9
2.9
a.6
On 8th pass vehicle could not travel In reverse due to Insufficient power to turn rotc.-s; could travel forward. Vehicle pulled out of test ler.e, circled around, reentered test lane at sto 0*00, and cosploted 8th pass. Circling and reenterlnä procedure continued through 13th ptss. On ihth pass vehicle able to travel In reverse. After 13th pass vehicle continued traffic back and forth until Ij7th pass; vehicle icsoblllzed traveling for- ward. A layer of mud fron 1 to 2 In. thick covered the rotors throughout this test
IS I- :■ 61.2 73-6 fiJt.B 86.6 5U.7 50.0 li8.2 Vehicle coopleted lot pass. After atteoptlng Sd pass teat was stopped be- ^ ^ cause vehicle could not turn rotors In reverse due to inoufflclent power.
Vehicle «as able to pull out of test lane coving laterally
95-8
10 13 69.3 7''.e 60.1; 82.1 53.9 52.0 51-0
6^.9 i.u
71.'' 3.6
7i<.6 6.1
76.5 (After Ul passes) 9.0
Vehicle InssobllUed on the Ist pass going forward. Ur.dercnrrlage dragging. Vehicle unable to aove forward or backward. Rotors were turning
Tnia test lane was sprinkled with water prior to test. Vehicle cocpiet«! first three pjuscs with ease. Began to experience dlfflcully on Hh poos due to Insufficient power to turn rotors. Vehicle began to drag on 35th pass. Vehicle unable to move In reverse on ItOth pass due to Insufficient power to turn rotors. Pulled self forward out of test lane and reentered going forward. Extreae difficulty experienced In forward gear. Vehicle imuobillzed on Uand pass in forward gear with undercarriage dragging
lued)
(1 of 2 sheets)
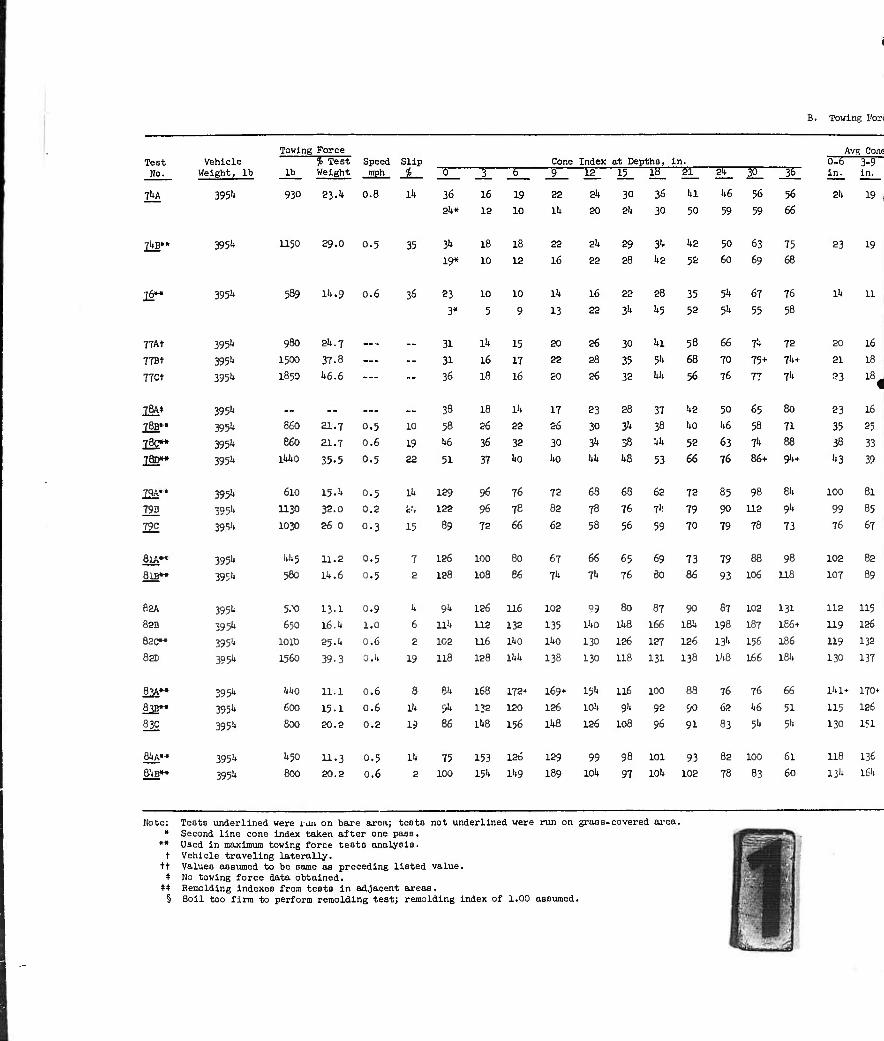
B. Towing Fort
Vehicle Weight, lb
To«lng
lb
Force 5t Test Weight
Speed mph
Slip Cone Index at Depths, in. Avg Conö
Test 0-6 in.
3-9 in. No. Ö 3 6 9 12 15 18 ■ a 2k 30 36
74A 395^ 930 23A 0.8 ih 36 16 19 22 24 30 36 in k6 56 56 21. 19
2k* 12 10 Ik 20 2h 30 50 59 59 66
Jk&* 3951» 1150 29.0 0.5 35 3'* 18 18 22 21. 29 3^ 1.2 50 63 75 23 19
19* 10 12 16 22 28 1.2 52 60 69 68
&• 3951* 589 11*.9 0.6 36 23 10 10 ll. 16 22 28 35 5k 67 76 Ik 11
3* 5 9 13 22 31. '.5 52 5k 55 58
77At 3951* 9S0 2U.7 — .. 31 ll. 15 20 26 30 in 58 66 7^ 72 20 16
77Bt 3951* 1500 37-8 — -- 31 16 17 22 28 35 !* 68 70 75+ 71.+ 21 18
rrct 395U I850 1.6.6 — -- 36 18 16 20 26 32 1.1. 56 76 77 7"» 23 18«
7aA* 3951» mm __ .« 33 18 Hi 17 23 28 37 1.2 50 65 80 23 16
783" 3951» B60 21.7 0.5 10 53 26 22 26 30 * 38 1.0 1.6 58 71 35 2?
760»* 3951» 8<Sü 21.7 0.6 15 k6 36 32 30 3'. 38 :.i. 52 63 7h 88 38 33
Tfty» 3951» 1W»0 35-5 0.5 22 51 37 1.0 1.0 Lii 1.S 53 66 76 86+ 9I1 + '.3 39
JSA" 3951» 610 15."• 0.5 ih 129 96 76 72 68 68 62 72 85 98 81. 100 81
79B 395'' 11^) 32.0 0.2 C-' 122 96 78 1:2 78 76 71: 79 90 112 Ql. 99 85
79C 39Sl» 1030 26 0 0.3 15 89 72 66 62 58 56 59 70 79 78 73 76 67
8lA« m1* kks U.2 0.5 7 126 100 eo 6" 66 65 69 73 79 88 98 102 82
8lB" 3951' 580 1U.6 0.5 2 128 109 K 71. 7U 76 30 86 93 106 115 107 89
B2A 3951* 5.--0 13-1 0.9 1» 91, 126 116 102 99 SO 87 90 87 102 131 112 115
82B 3951' o^o 16.U 1.0 6 ll!: 112 132 135 lUo Xht 166 10. 198 187 166+ 119 126
820" 395'' 1010 25.U 0.6 2 10a U6 lUO lAO 130 126 127 126 13'' 156 186 119 132
F^:; 3954 1560 39-3 0.1» 19 118 125 IW» 138 130 118 131 138 l'»8 166 18U 130 137
a^A« 3951' M;0 ll.l 0.6 8 81. 168 172+ 169+ W 116 ICO 88 76 76 66 lUl* 170+
8^3" 395U too 15.1 0.6 1U 9^ 132 12-0 126 lOl. 9k 92 90 62 1.6 51 115 126
83c 3951* BOO 20.2 0.2 19 86 IhP 156 ii.e 126 108 96 91 83 5"* 3k 130 1?1
SUA" 3951* U50 11.3 0.5 Ut 75 153 126 129 99 98 101 93 82 ICO 61 118 136
61*2" 395;» eoo 20.2 0.6 2 100 151' 1A9 189 lOll 97 101. 102 78 83 60 13'' ic.'.
Note: «
»♦
t tt
Tests underlined were ion on baxe area; teats not underlined were run on grass-covered area. Second line cone index taken after one pass. Used in maximum towing force tests analysis. Vehicle traveling laterally. Values assumed to be same as preceding listed value. No towing force data obtained. Remolding indexes from tests in adjacent areas. Soil too firm to perform remolding test; remolding index of 1.00 assumed.
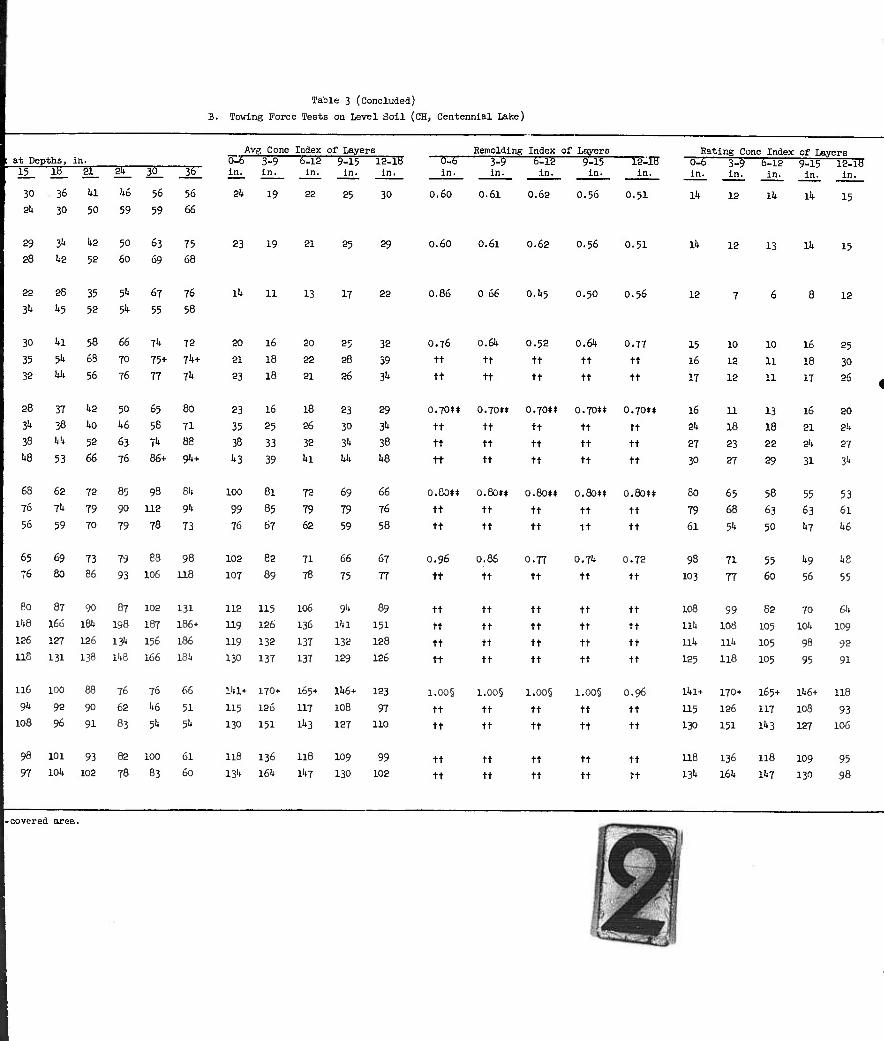
Table 3 (Concluded)
B. Towing Force Tests on Level Soil (CH, Centennial Lake)
at Depths, In. 15
30
2k
IE 36
30
kl h6
50 59
56
59
36
56
66
Avg Cone Index of Layers 0-S 3^5 5^2 9IT5 ICTJ in. in. in. in. in.
2^ 19 22 25 30
—E3- in.
0.60
Remolding Index of Layers 3^ -
in.
0.6l
in.
0.62
9-15 In.
O.56
12-IH in.
0.51
Rating Cone Index of Layers ■5^5 3^9 5^2 9-15 12-10 in. in. in. in.
Ik 12 111 lit
in.
15
29
28
3^
lt2
1.2
52
50
60
63
69
75
68
23 19 21 25 29 0.60 0.61 0.62 0.56 0.51 Ik 12 13 11» 15
22
3'.
26
k5
35
52
51*
5^
67
55
76
58
Ik 11 13 17 22 0.86 0 66 0.1*5 0.50 0.56 12 12
30
35
32
68
76
56
65
76
Po
IW
156
U8
116
9U
106
lil
3k
kk
28 37
3"* 38
38 Uk
kB 53
62
7k
59
69
80
87
I60
127
100
9S
96
56
63
56
1;2
1.0
52
66
73
86
66 yk 72
70 75+ 71*+
76 77 71*
50
1.6
63
76
90
91
76
62
83
65
56
Ik
86+
90 87 102
leu 198 187
126 131. 156
76
5''
eo 71
ÖS
91*+
72 85 93 81.
79 90 112 9k
70 79 78 73
79 88 98
93 106 118
131
186+
186
131 138 11.8 166 181.
66
51
5"»
20
21
23
100
99
76
102
IGT
112
119
U9
130
11.1+
115
130
16
18
18
23 16
35 25
38 33
k3 39
81
85
67
£2
89
115
126
132
137
170+
126
151
20
22
21
18
26
32
1.1
72
79
62
71
78
106
136
137
137
165+
117
1'.3
98 101 93 82 100 61
97 101. 102 78 83 60
118 136 118
131. 16U 11.7
28
26
23
30
31.
kk
69
79
59
66
75
94
lUl
132
129
lk6*
108
127
109
130
32
39
3k
29
3l<
36
U8
66
76
58
67
77
89
151
128
126
123
97
110
99
102
0.76 0.64
tt tt
tt tt
0.52
tt
tt
0.61.
tt
tt
0.77
tt
tt
O.70** 0.70« 0.70** 0.70« O.70**
tt tt tt tt tt
tt tt tt tt tt
tt tt tt tt tt
O.&H* 0.80** 0.80« 0.80** 0.80**
tt tt tt tt tt
tt tt tt It tt
O.96 0.86 0.77 0.71. 0.72
tt tt tt tt tt
tt tt tt tt tt
tt tt tt tt tt
tt tt tt tt tt
tt tt tt tt tt
i.oo§ i.oo§ i.oo§ i.oo§ 0.96
tt tt tt tt tt
tt tt tt tt tt
tt
tt
tt
tt
tt
tt
tt
tt
tt
tt
15 10 10 16 25
16 12 11 18 30
17 12 11 17 26
16 11 13 16 20
21. 18 18 21 21.
27 23 22 2!. 27
30 27 29 31 34
80 65 58 55 53
79 66 63 63 61
61 54 50 1*7 l»6
96 71 55 l»9 1»8
103 77 60 56 55
108 99 £-2 70 6!.
llli 108 105 101» 109
Uli HU 105 9r' 92
125 118 105 95 91
11.1+ 170+ 165+ 11.6+ 118
115 126 117 108 93 130 151 H'3 127 106
118 136 118 109 95 131. 161» 11.7 130 98
-covered area.
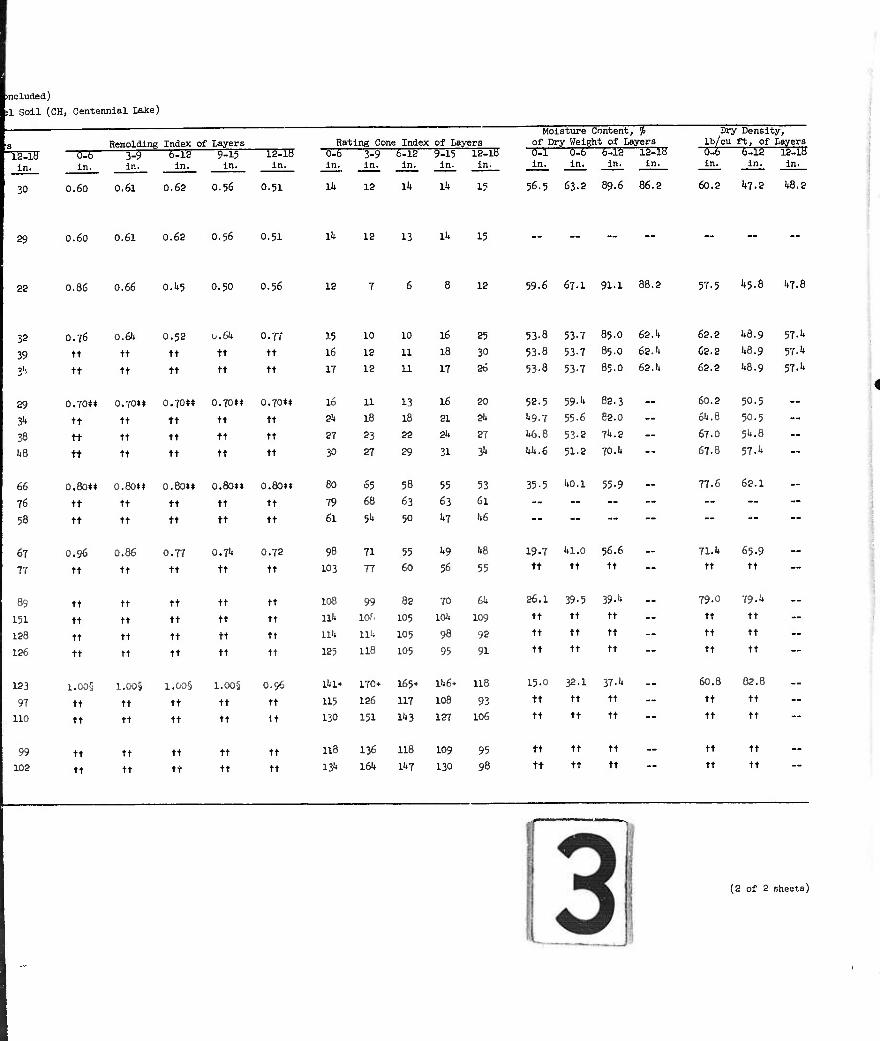
mcluded) >1 Soll (CH, Centennial Lake)
"12^5 In.
30
^3-6 in.
Remolding Index of Layers 3^5 5115 9-15
in. In. in.
o.6o o.6i 0.62 0.56
12-18 in.
0.51
Rating Cone Index of Layers "ÖI5 3^9 5^12 9-15 12-10 in. in. in. in. in.
Ik 12 lit Ik 15
Moisture Content, fi of Dry Weight of Layers
-JEI 5^5—5^5—l£3E in. in. in. in.
56.5 63.2 89.6 86.2
Dry Density, Ib/eu ft, of Layers
~ECB 5tl5 1&35 in. in. in.
60.2 47.2 U8.2
29 0.60 0.6l 0.62 O.56 O.51 Ik 12 13 Ih 15
22 0.86 0.66 0.1*5 0.50 0.56 12 12 59-6 67.1 91-1 88.2 57.5 1*5.8 1*7.
32 O.76 0.61* 0.52 0.6I* 0.77 15 10 10 16 25 53-8 53-7 85.O 62.1* 62.2 1*8.9 57.1*
39 tt tt tt tt tt 16 12 11 18 30 53-8 53-7 85.O 62.1* 62.2 1*8.9 57.!*
^ tt tt tt tt tt 17 1? 11 17 26 53-8 53.7 85.O 62.1* 62.2 U8.9 57.1*
29 0.70** 0.70** 0.70** 0.70** 0.70** 16 11 13 10 3D 52.5 59.1* 82.3 -- 60.2 50.5 —
31* tt tt tt tt tt ?!; IB 18 SI s:. 1*9.7 55.6 82.0 — 61*.8 50.5 —
38 tt tt tt tt tt ST 83 S2 & 27 1*6.8 53-2 71*. 2 — 67.0 51*.8 —
1*8 tt tt tt tt tt 30 S7 89 31 3'» 1*1*.6 51-2 70.1* -- 67.8 57.1* ...
66 0.80« o.eo«* 0.80** o.8o»* 0.80»» 60 65 58 55 53 35.5 1*0.1 55-9 -- 77.6 62.1 —
76 tt tt tt tt tt 79 68 63 63 61 — — — — — — —
58 tt tt tt tt tt 61 5" 50 ^7 i>6 — — — — — ~ —
67 O.96 0.86 O.TT 0.71* 0.72 98 71 55 1*9 1*8 19.7 1*1.0 56.6 -- 71.1* 65.9 --
77 tt tt tt tt tt 103 77 £0 5'5 v5 tt tt tt — tt tt --
89 tt tt tt tt tt 108 ■:■:■ 82 70 6b 26.1 39-5 39.1» -- 79.0 79-1* --
151 tt tt tt tt tt ui* lOf. 105 lOU Log tt tt tt ~ tt tt —
128 ti tt tt tt tt uu 111* 10;; 98 ■'■. tt tt tt -- tt tt --
126 tt tt tt tt tt 125 116 105 95 91 tt tt tt -- *t tt --
123 1.005 l.OOs i.oo§ l.OOj 0.96 llll+ 170 165+ 11.6+ U8 15.0 32.1 37.1* -- 60.8 02.8 —
97 tt tt tt tt tt 115 ISC 117 108 93 tt tt tt — tt tt -
110 tt tt tt tt It 130 151 1U3 127 106 tt tt tt — tt tt --
99 tt tt tt tt tt us 136 118 109 95 tt tt tt — tt tt —
102 tt tt tt tt tt 13* 161. I'-T 130 93 tt tt tt tt tt
(2 of 2 sheets)
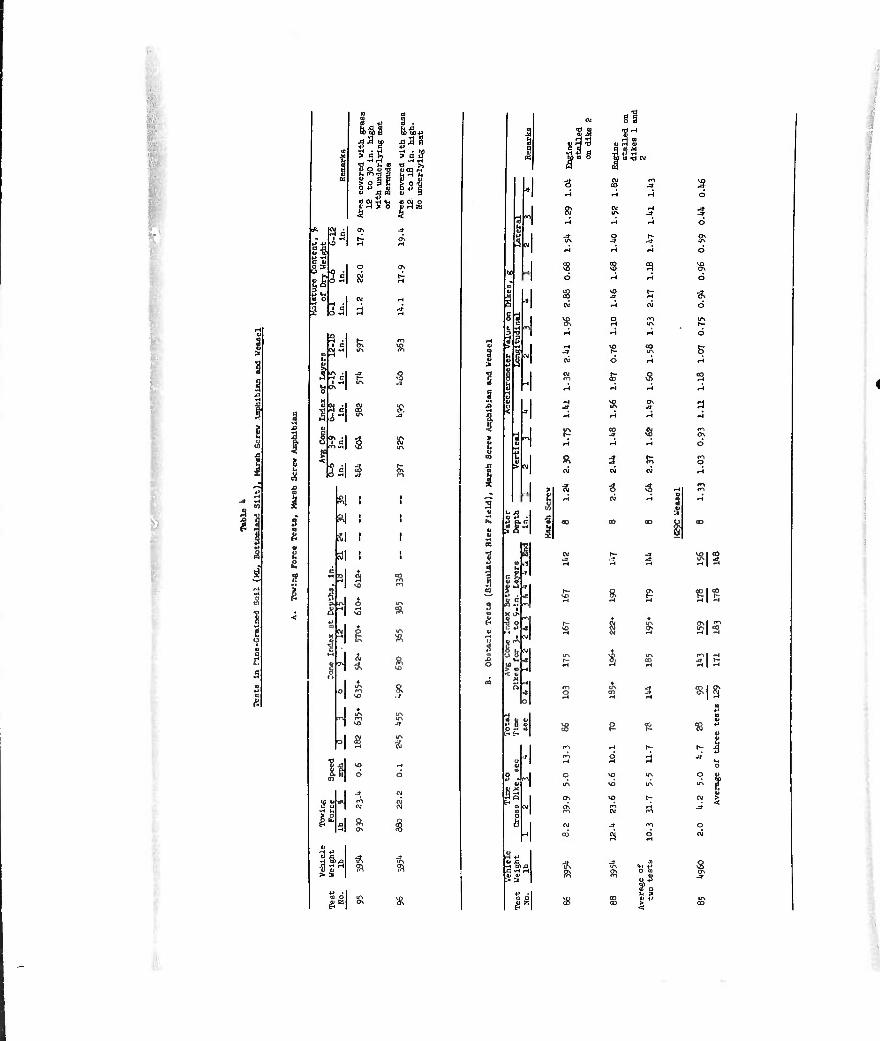
It
®5\
15=1
Lai
a I-
"Oil •■'!
«1 fil SI
-s|
I
^3 gi ^3 B
^ W r-f -H -H
ä o 3 E I o -S O -P a; O 4J c
gas« sag
S
»I s
ft
»
ft
«
sH
H
5 . 1°
i2-i en -* ^|
ßg1
W 0)
«
-ci
*
3' 0) P i
a
^1 w
Ä -3
r* »^ 3 s -H ^H
:? S CJ ci
i 3
S S
^ 1 X UN
a-
3 -«
e fc H t~
S d
d
* d
9
«IS
PI?
RIS1
8 S
8 "
«
a ol
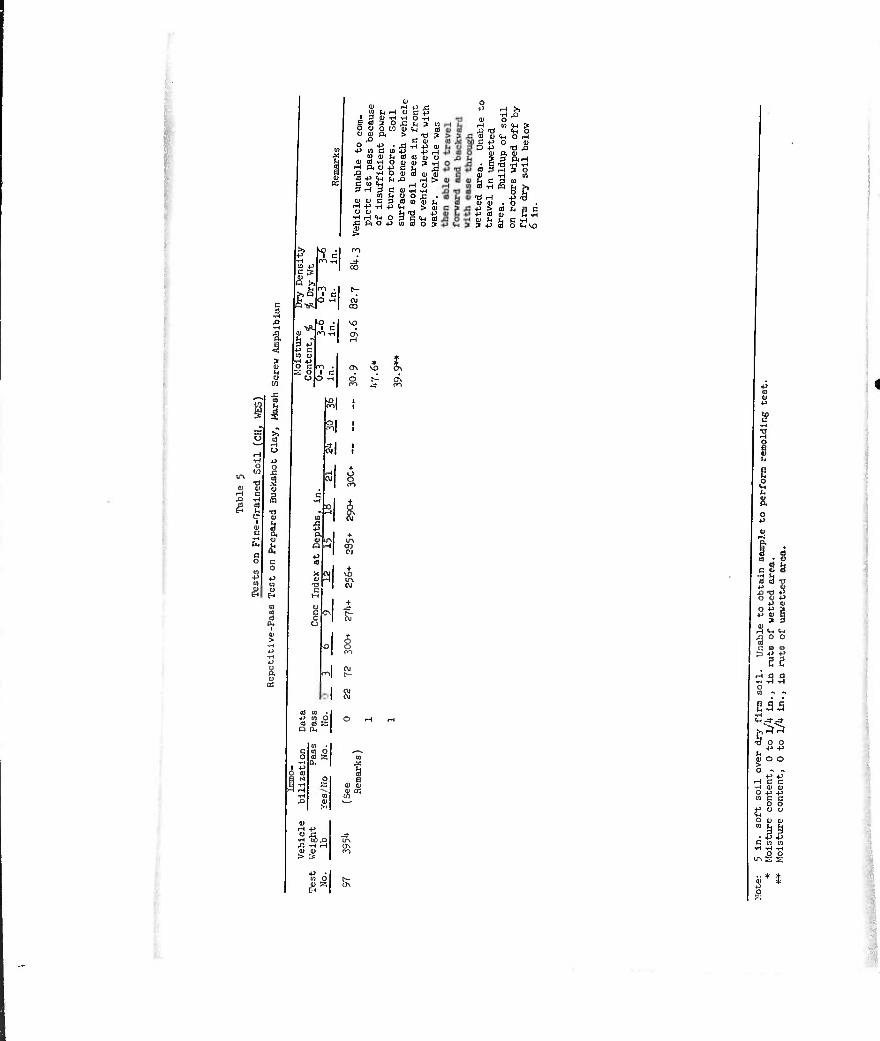
o Cl H -p J3
, ra ti H u b p 1 3 IU -H -rt O -H BaJ^o^jinsw SoBoSsJCiS O (U ft > T3 ? _ ■D CO) q +£ . ,0 .rt 4J o w +> M C M +J p H M w <u (^ ö a aj o aj«THO(uiu9Ü MftO+lCL^rJ ^ -H o a) 3 «j <u §
K 3 H 3 c OJ .rt TH
ciiucgaS'S^ H +> vH +> ^H > S
+J H •rt ^3 IU O
rH W u a ■s •a ifi o a 0) *< 0 H a +J o OJ ö -p -0 fi
01 p. 0) 9 3 ftH
oj § 3 •s O a; •H ta
a c s b « H ^ 'S 0) (1) o
+J > 03 u si ■p a O (U ti ä c •H 5 •p o ii-.VO
^3 . I C
.3 J3
|
o 3"
o a t o u
S
vo ON
0\ vo
R 5r
I 5 P.
?,
.3
fc
EU +J o) OI
-■.■;-.
Q IX,
O M rt
U O a ;-. 0.
o ■H ö .o A •M ^ 0) ID > PC
w O OJ ^
EH
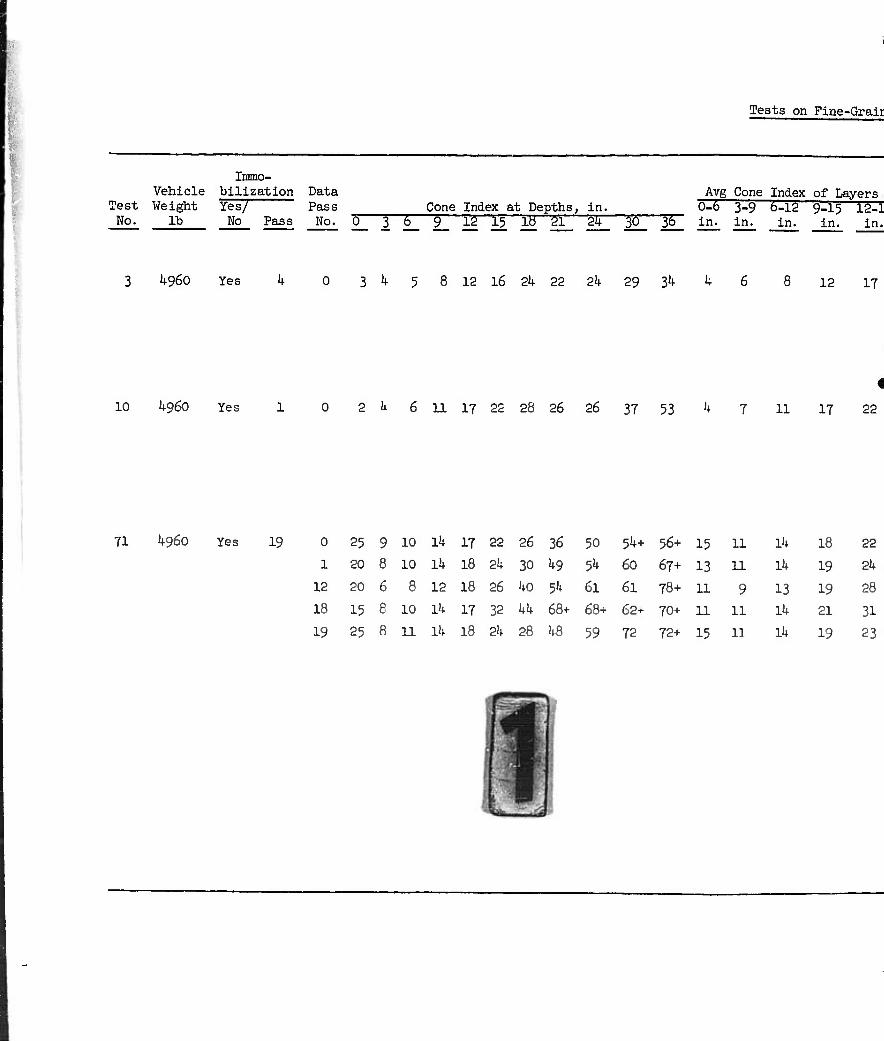
Tests on Flne-Grair
Innno- Vehicle billzation Data
Dest Weight YesT" Pass Cone Index at Depths, In. No. lb No Pass No. Ü 3~5 9 12 15 18 2l 55 55 35" in. in. in, 'in'. in.
Avg Cone Index of Layers 0-b 3-9 ^-12 9-15 12-1
3 U96O Yet 0 3 ^ 5 8 12 16 24 22 24 29 3l4- k 6 8 12 IT
10 4960 Yes 1 0 2 ii 6 11 17 22 28 26 26 37 53 h 7 11 17 22
71 4960 Yes 19 0 25 9 10 Ik 17 22 26 36 50 54+ 56+ 15 11
1 20 8 10 lU 18 2k 30 k9 54 60 67+ 13 11
12 20 6 8 12 18 26 ko 5U 61 61 78+ 11 9
18 15 8 10 Ik 17 32 kk 68+ 68+ 62-r 70+ 11 11
19 25 8 11 ik 18 2k 28 kS 59 72 72+ 15 11
lU 18
lU 19
13 19 Ut 21
Ik 19
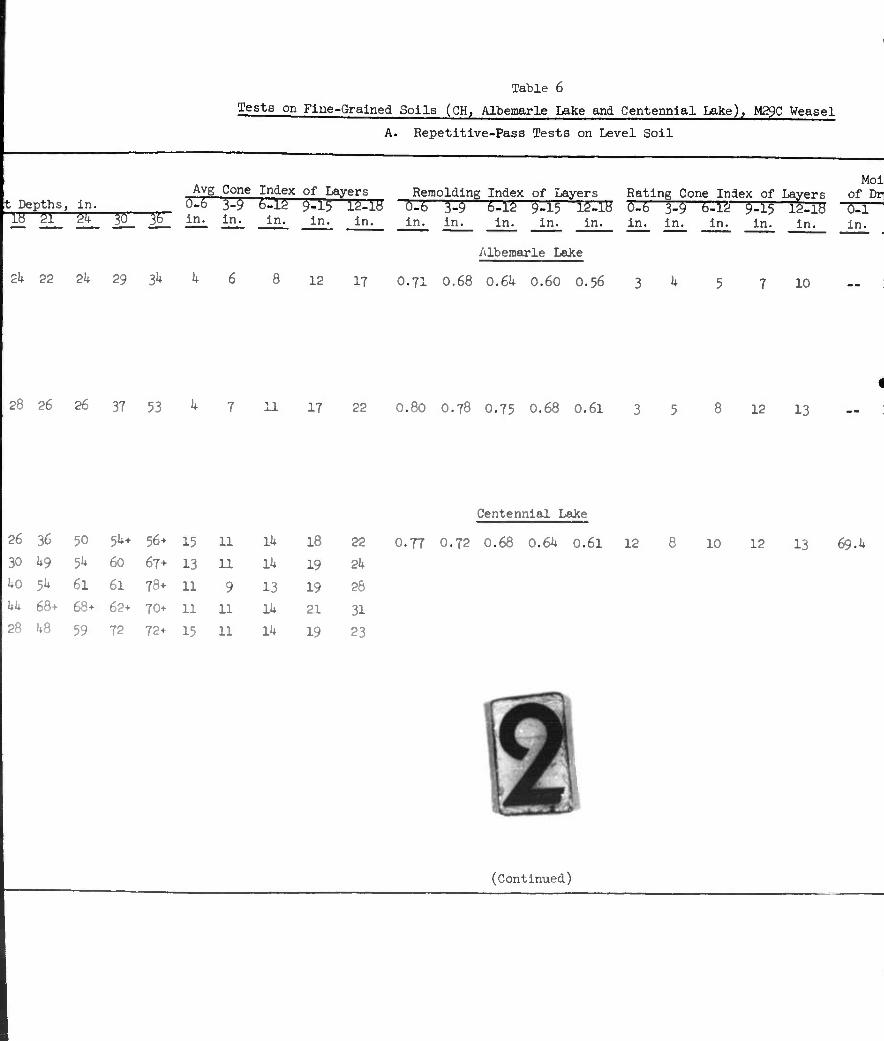
Table 6
Tests on Fine-Grained Soils (CH, Albemarle Lake and Centennial Lake), M29C Weasel
A. Repetitive-Pass Tests on Level Soil
2k 22 24 29 34
Albemarle Lake
8 12 17 0.71 0.68 0.64 0.60 O.56 3 10
Moi Avg Cone Index of Layers Remolding Index of Layers Rating Cone Index of Layers of Dr
fr Depths, in. u-o £5 b-12 $-15 v 15-18 Ö.6 5-5—fc-12 $-15 12-18 Ö-6 fa fe-15 gCIg EEI8 "ü^-^ - 1« 21 24 30 g6 in^ iru in. in. in. in. in. in. in. in. in. in. in. in. in. in.
28 26 26 37 53 11 17 22 0.80 O.78 0.75 0.68 0.61 8 12 13
26 36 50 54+ 56+ 15 11
30 49 54 60 67+ 13 11
40 54 61 61 78+ 11 9
44 68+ 68+ 62+ 70+ 11 11
28 48 59 72 72+ 15 11
V. 18 22
Ik 19 2h
L3 19 28
Ik 21 Jl v. L9 2 3
Centennial Lake
0.77 0.72 0.68 0.64 0.61 12 10 12 13 69.4
(Continued)
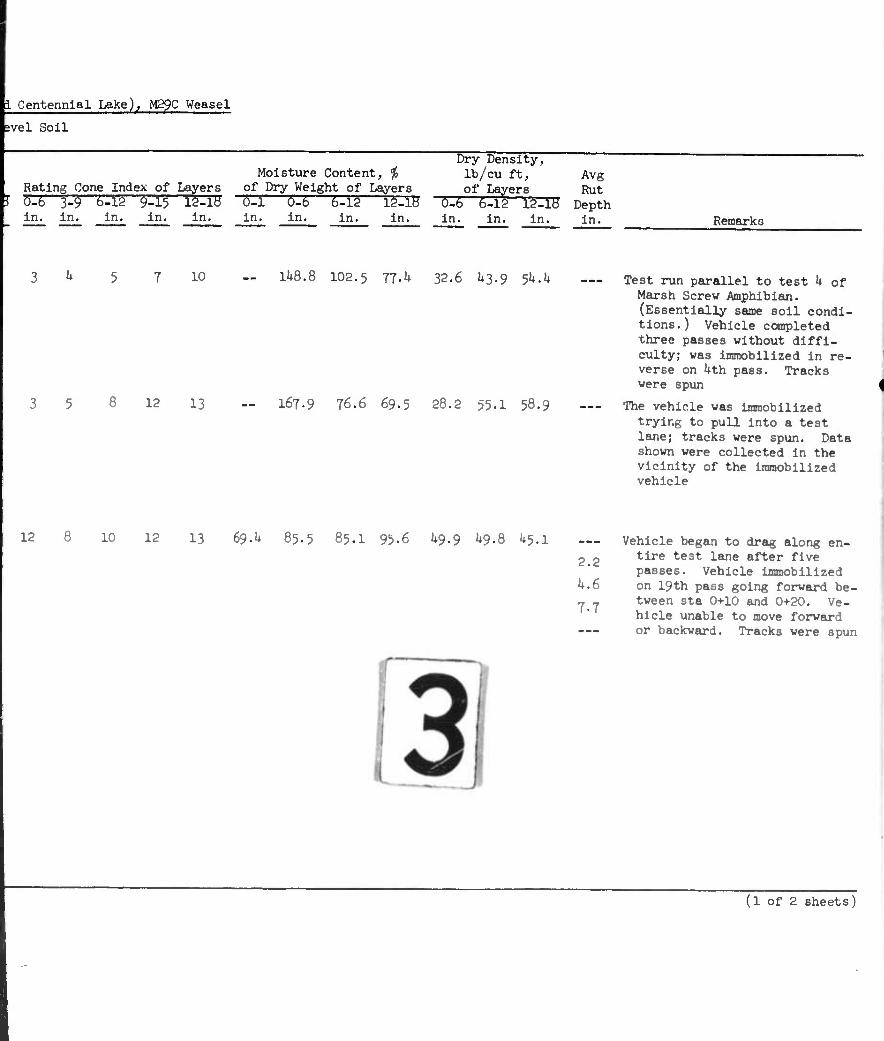
i Centennial Lake), M29C Weasel
5vel Soil
Rating Cone
in. in.
Index of T5- in. in.
Moist\ire Content, % of Dry Weight of Layers
TH TEI—5^—533—fe3B in. in. in. in. in.
m Dry Density, Ib/cu ft, Avg of Layers Rut
Ö-6 6-15 1538 Depth in. in. in. in. Remarks
10 1^8.8 102.5 77^ 32.6 ^3-9 5^ A
12 13 167.9 76.6 69.5 28.2 $5.1 58.9
Test run parallel to test k of Marsh Screw Amphibian. (Essentially same soil condi- tions.) Vehicle ccnpleted three passes without diffi- culty; was immobilized in re- verse on Uth pass. Tracks were spun
The vehicle was inmobilized trying to pull into a test lerne; tracks were spun. Data shown were collected in the vicinity of the inanobilized vehicle
12 8 10 12 13 69.U 85.5 85.1 95-6 l»9.9 ^9.8 U5.I
2.2
k.6
7-7
Vehicle began to drag along en- tire test lane after five passes. Vehicle immobilized on 19th pass going forward be- tween sta 0+10 and 0+20. Ve- hicle unable to move forward or backward. Tracks were spun
(1 of 2 sheets)
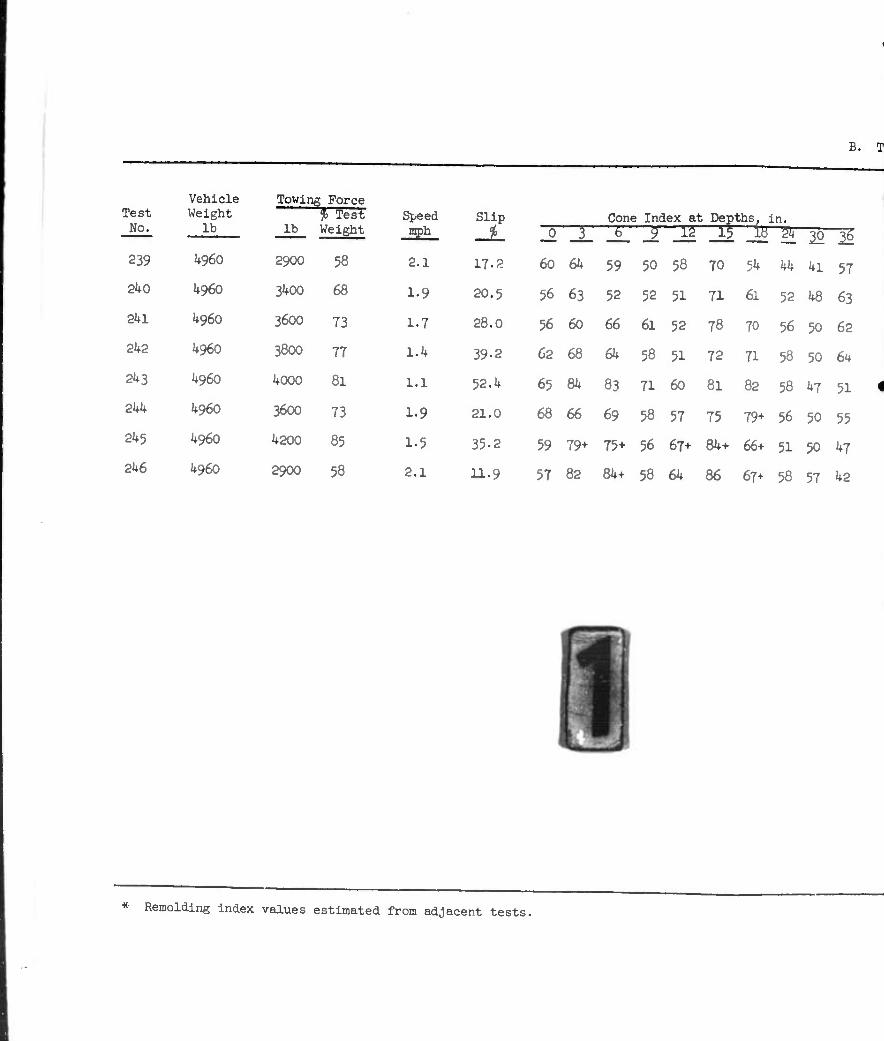
Test No.
239
2^0
2kl
2k2
243
2kk
2k3
2k6
Vehicle Weight
lb
4960
4960
4960
4960
4960
4960
4960
4960
Towing Force f Test
lb Weight
2900
3400
3600
3800
4000
3600
4200
2900
58
68
73
77
"1
73
85
58
Speed _mEh_
2.1
1.9
1.7
1.4
1.1
1.9
1.5
2.1
Slip
_L 17.2
20.5
28.0
39.2
52.4
21.0
35.2
11.9
Cone Index at JPeptns, in.
3 4 -6. !2n5 -1-f g g im 60 64
56 63
56 60
62 68
65 84
68 66
59 50 58
52 52 51
66 61 52
70 5^ 44 41 57
71 61 52 48 63
78 70 56 50 62
64 58 51 72 71 58 50 64
83 71 60
69 58 57
81 82 58 47 51
75 79+ 56 50 55
59 79+ 75+ 56 67+ 84+ 66+ 51 50 47
57 82 84+ 58 64 86 67+ 58 57 42
* Remolding index values estimated from adjacent tests.
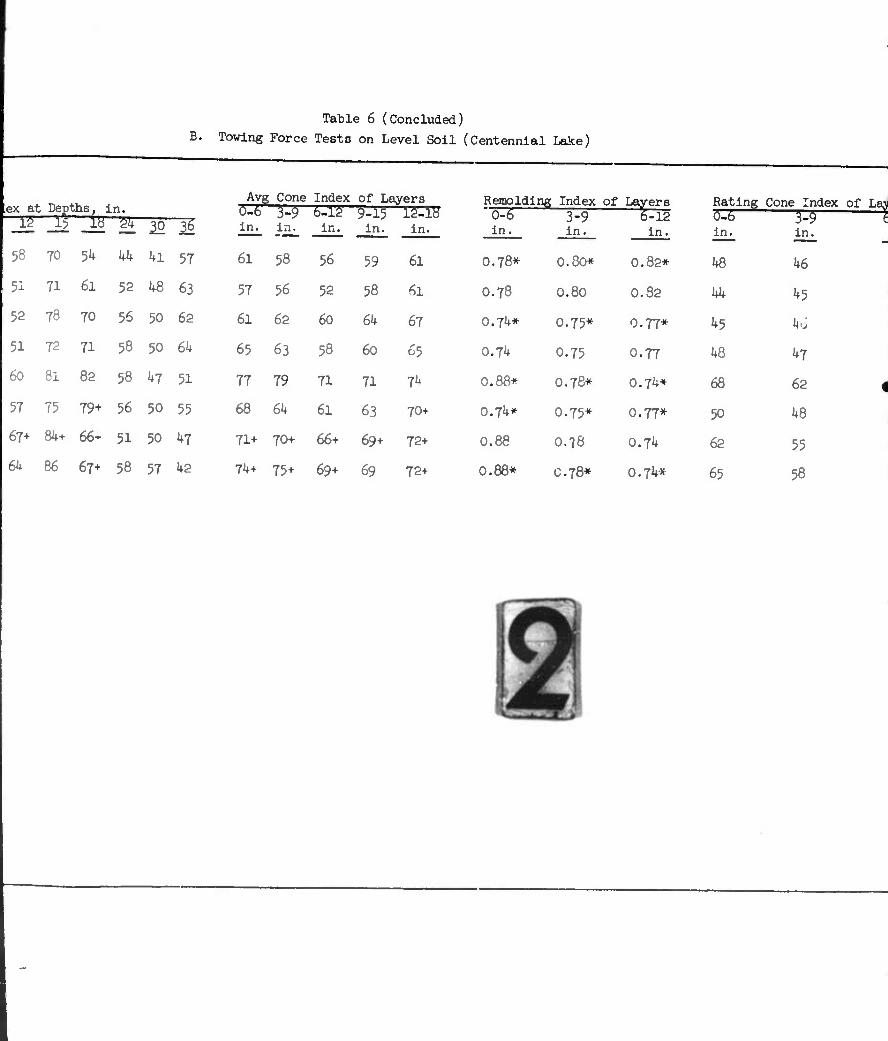
Table 6 (Concluded)
E. Tovlng Force Tests on Level Soil (Centennial Lake)
.ex at Depths, in. jg -k Ja 'Ht 20 as 58 70 5^ kk ki 57
51 71 61 52 k8 63
52 78 70 56 50 62
51 72 71 58 50 64
60 81 82 58 kj 51
57 75 79+ 56 50 55
67+ 8U+ 66+ 51 50 47
64 86 67+ 58 57 42
Avg Cone Index of Layers o-6g 5-$ fe-li EITTCT in. in. in. in. in.
61 58
57
61
65
77
68
56
62
63
79
6J;
71+ 70+
74+ 75+
56
52
60
58
71
61
66+
69+
59
58
64
DO
71
63
69+
69
61
61
07
65
70+
72+
72+
Remolding Index of Layers ""0^5 ~F9 6112 in. in. in.
Rating Cone Index of Lajt vz-*—^ i in. in.
O.78* 0.80* 0.82*
O.78 0.80 0.82
0.74* 0.75* O.77*
0.74 0.75 0.77
0.88* O.78* 0.74»
0.74* 0.75* O.77*
0.88 O.78 0.74
0.88» c.78* 0.74*
48 46
44 45
45 k6
48 47
68 62
50 48
62 55
65 58
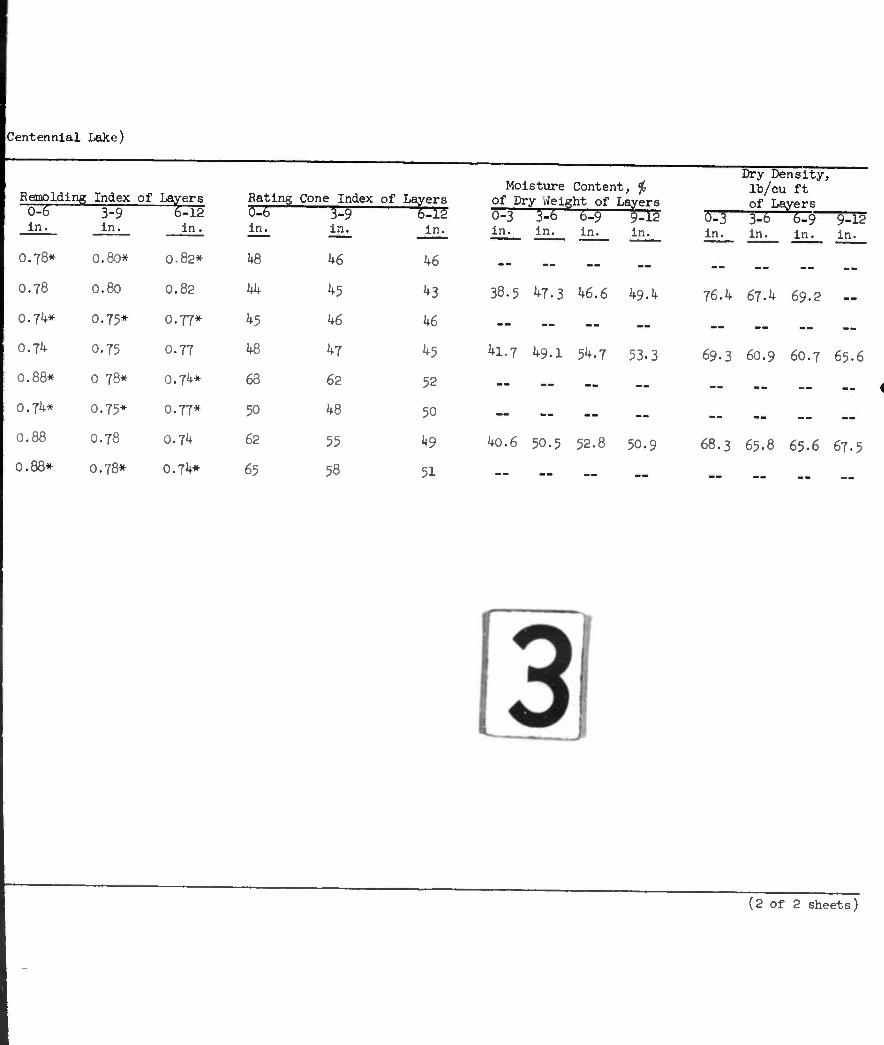
Centennial Lake)
Remolding 0-6 in.
; Index 3-9 in.
of Layers 5-12 in.
Rating
in.
Cone Index 3-9 in.
of Layers
in.
O.78* 0.80* 0.82* h6 k6 hb
O.78 0.80 0.82 hk h5 hi
0.74* 0.75» 0.77* 1*5 he he
0.7^ 0.75 0.77 U8 hi h-
0.88* 078* 0.7k* 68 62 52
0.74* 0.75* 0.77* 50 w 50
0.88 O.78 0.7k t? 55 ^9
0.88* O.78* O.jk* 65 56 51
Moisture Content, $
0-3 in.
3-6 in.
6-$ in.
9-l£ in.
38.5 47.3 U6.6 U9.4
kl.i 49.1 5^.7 53.3
40.6
— —
50.5 52.8 50.9
Dry Density, Ib/cu ft
of Layers SI3—3=5 6-9—5=35 in. in. in. in.
76.U 67.4 69.2 —
69.3 6O.9 6O.7 65.6
68.3 65.8 65.6 67.5
(2 of 2 sheets)
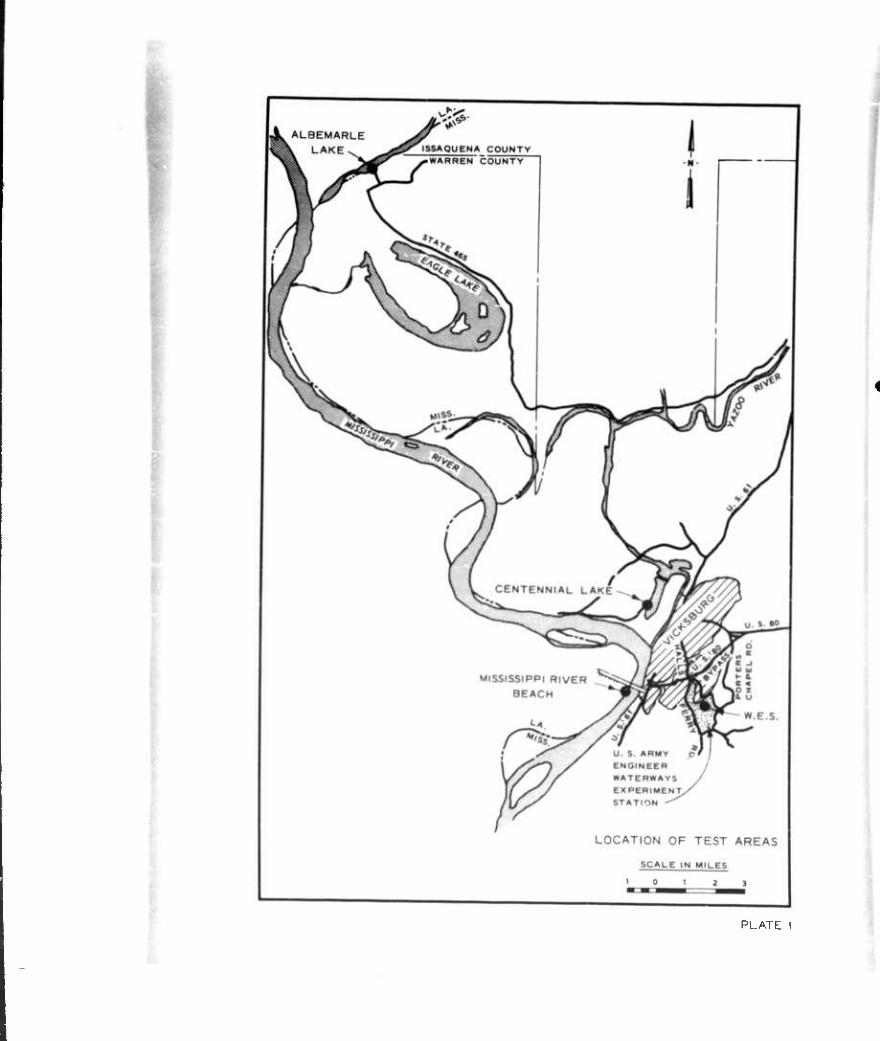
PLATE I
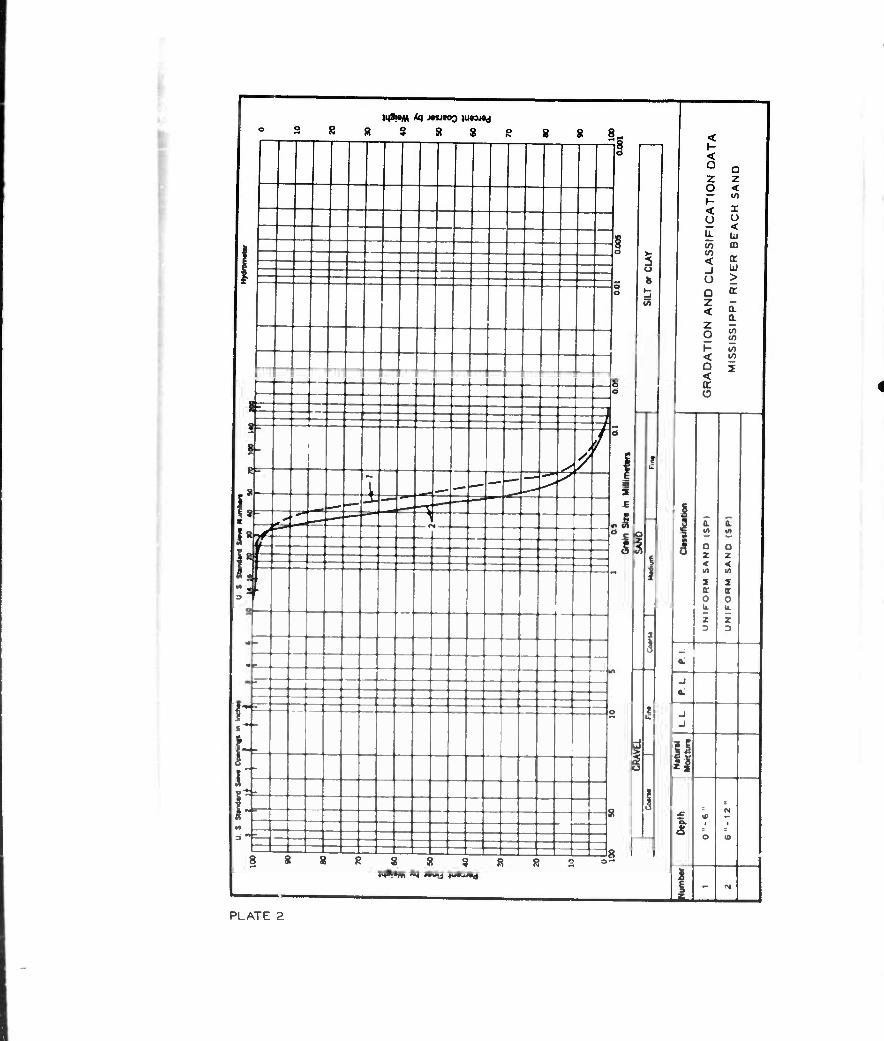
VlSWM *I i«JtO0 tUMMd
2888888 88 8,. < S
1
1
GR
AD
AT
ION A
ND C
LA
SS
IFIC
AT
ION D
AT
MIS
SIS
SIP
PI
RIV
ER B
EA
CH S
AN
D
8 I i ^ | ~ S
001
SIL
T or
■
1= -: 3
r= =— t---J) „ o z < m
X K O u.
i 3
a m o z < M
I K 0 k. Z 3
t» 4 {. ^—-^^--=s ' E
*' eiZ- 1 ,s - rrzr-EEEE' I |f
3 T
^-___. j
■ •" j mi
., -1 a.
\- . o J -1 -1
11 i 5 1
I 1 If
1 1 o
IN
> 10
f. a 1 1 ( a
3 " =
8 S 8 K ä ä s a a * o- ti4»*M Al MUU uwiMy
| - *
F 'LATE 2
I
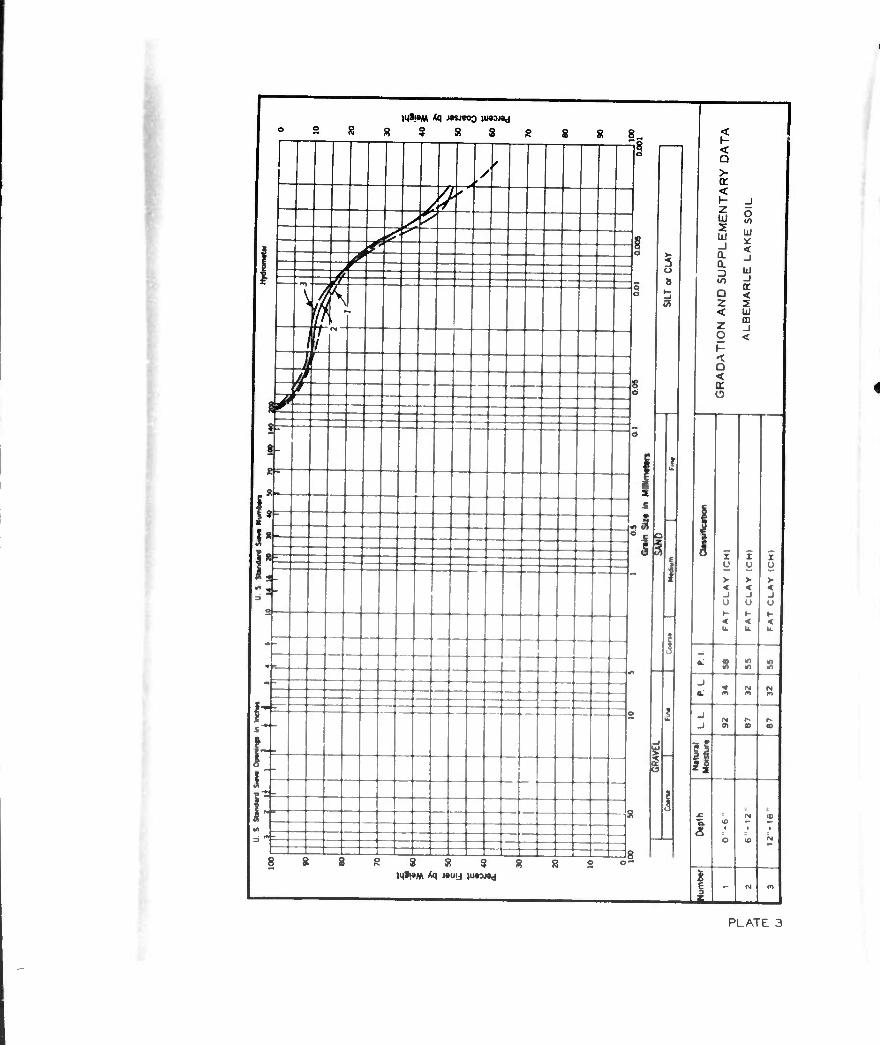
1* < O > < 1- _i
i 3 Q < Z 2 < Ul
O < 1- < o < It o
i- >? ^ ^ fi 1 ^2 i 5
^lf==========:=====ä s If
if iff-
8? . 5
'4- ij
£
>■ < u »- < u.
I y > < j u K tt.
X y >• < J u »- < u.
SL is * «i - {t NT ip ii - fi "a- 3
9
S 1 -i
s
s j-^ . , -i
-i 3 2
11 1 | -- 1 ■ •SB_ ?
I • o
i
■ K * * \ a
b"= —1-
Z - N m
p LA7 E 3
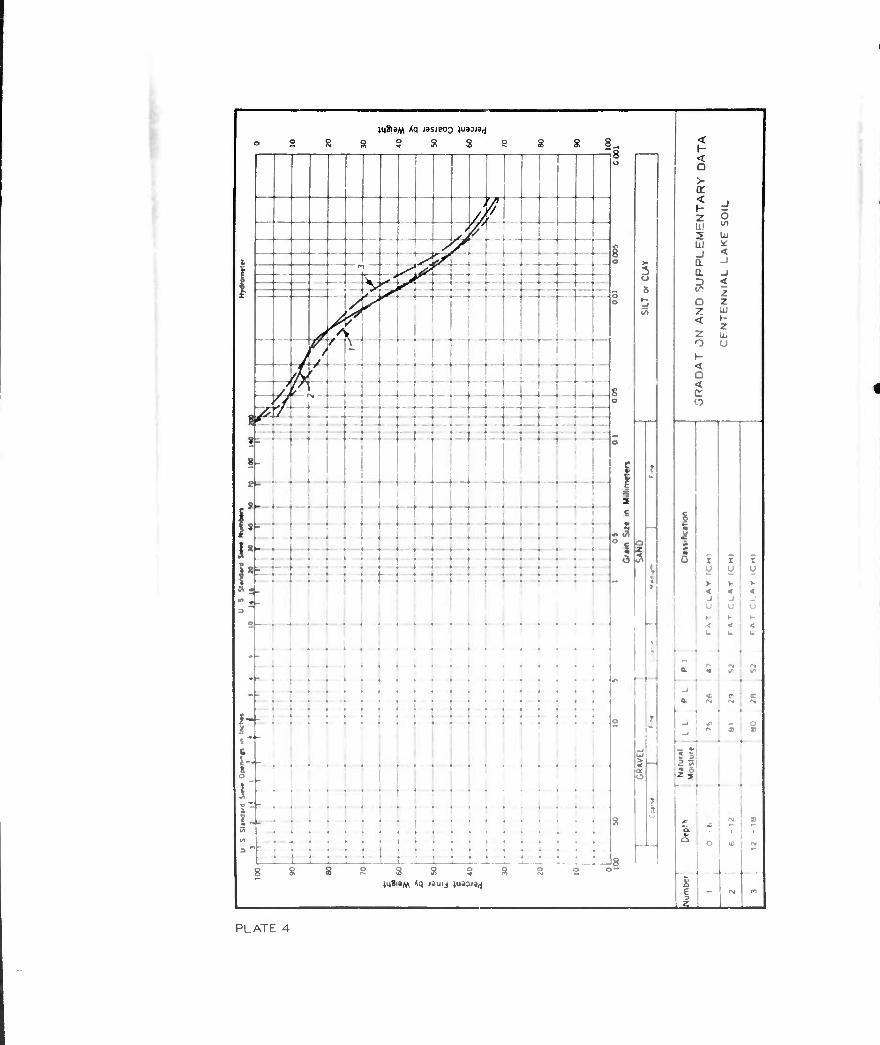
1 >M8l3M ^q JSSJBOO lUSDJSJ
28SSSSS8S8 <-» < < Q
! 1
o b
> a.
J i 5 4 'A* :
1 * i ¥
§ 0 5
c
2 UJ
- ! a _i
^ i
SS Ss/
— ,., s y _J . 4 t> V '-p s
/ ̂ ^ S 5 o Z
Z w < z
> V t — z £ o u // / \
/ 1-
/A/' < o ^
r S -■ 8 O
—
<
^ </ ZJ._4-- ■■ -■*-—
» • • i
. — : ' o
e =—i—
1
1 ?
— ♦
i 1 t
— | k i
f
ill - j u j
-III T ]_ - . I i 1—4 . .
2
. i— ■ ■ i « ■ • 1
y > « u
> 4 J U
4
- * Ü
< u
: r :
- 1
-■
* • r
• •
• • •
*» ~~
•
ä 5 a a
•
■
: • • • : : :
• • fsi
1- • • *
• o
\ 3
1 S 8
||
1 m ■
. • — -
- ■ • • • • ■
• : :
i • * S
5
j ifi
(M <D
■
• ■ • ■ •
9
- & O Ifi OJ
B88S8a8SS2c - mSiSM *q •'»uii »uaajsj 2
t — rsl m
t__
PLATE 4
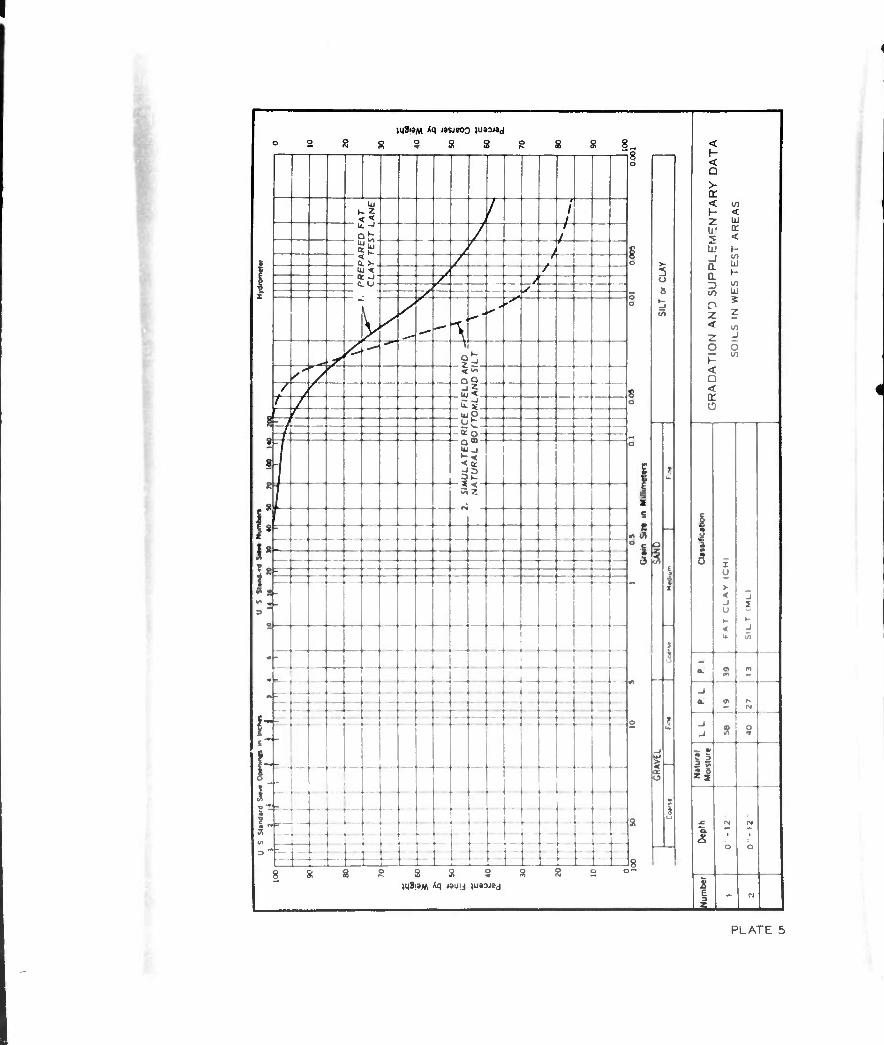
8 o
1 p O
< U
R
_)
GR
AD
AT
ION A
NO S
UP
PL
EM
EN
TA
RY
DA
-
SO
ILS I
N W
ES T
ES
T A
RE
AS
; J-
It;. . >-. i <
i / /
/ u c / u a / r > n / u s / « -J / ,J
y /
V ^ /
t* —- <
.' <•
-^ y A *,,,,'^ 2 "J
S / *
/ / r s? / / ^-Cj. o
■i
! l -öS- —f ——
1
1
1 -
:
1 Z y \ J u
<
J I
J
! «m 8
i - is 9 i 55
i l 9
B
■
3
U
-
K M 3 ••
Z" o. Ä n
— — —
o
-1 a. » ^
IM -
E
-> -1 8 $
11 -
1 I
b * b
- — — — - — —
-U — - — —
i ! T r T r aoooooeooac I« o
iM8 »* <q j JUIJ ,ua: ^d 1 E 3 - n
PLATE 5
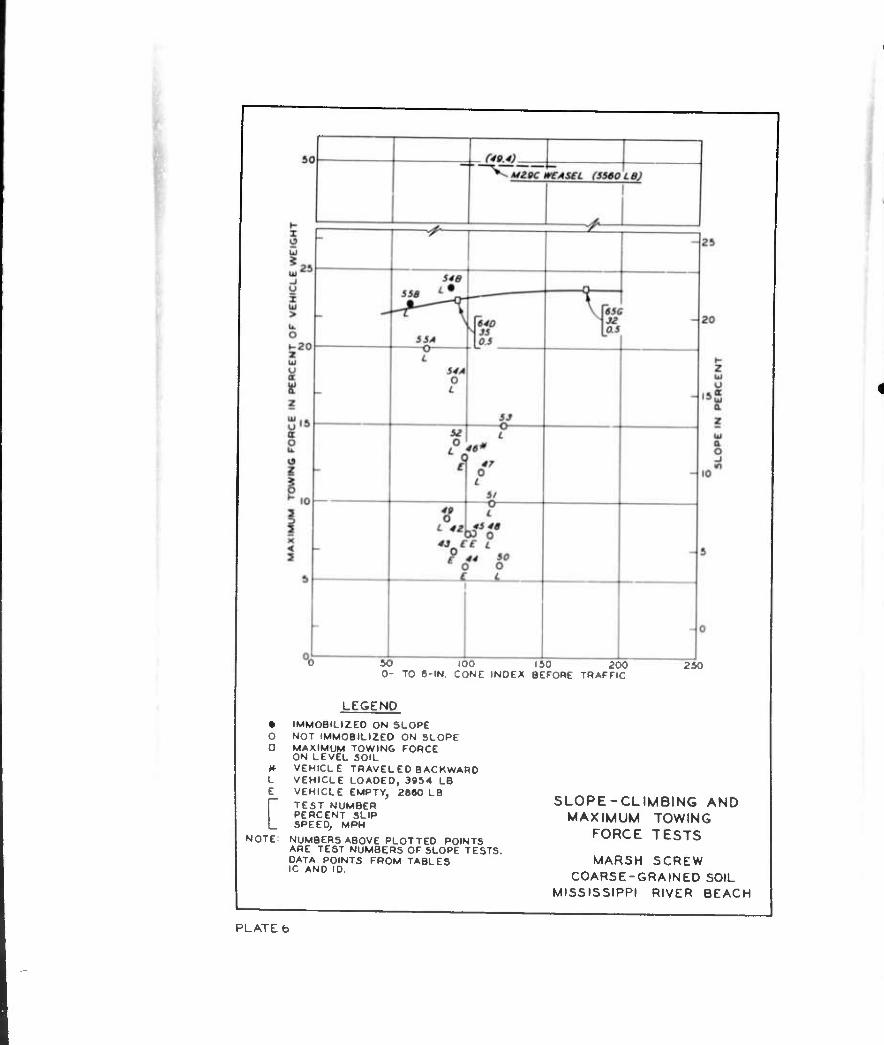
50 0
100 150 200 TO «-IN. CONE INDEX BEFORE TRAFFIC
230
LEGEND
• IMMOBILIZED ON SLOPE O NOT IMMOBILIZED ON SLOPE 0 MAXIMUM TOWING FORCE
ON LEVEL SOIL » VEHICLE TRAVELED BACKWARD L VEHICLE LOADED, 3054 LB E VEHICLE EMPTY, 2860 LB
TEST NUMBER PERCENT SLIP
L SPEED, MPH
NOTE: NUMBERS ABOVE PLOTTED POINTS ARE TEST NUMBERS OF SLOPE TESTS. DATA POINTS FROM TABLES IC AND ID.
SLOPE-CLIMBING AND MAXIMUM TOWING
FORCE TESTS
MARSH SCREW COARSE-GRAINED SOIL
MISSISSIPPI RIVER BEACH
PLATE b
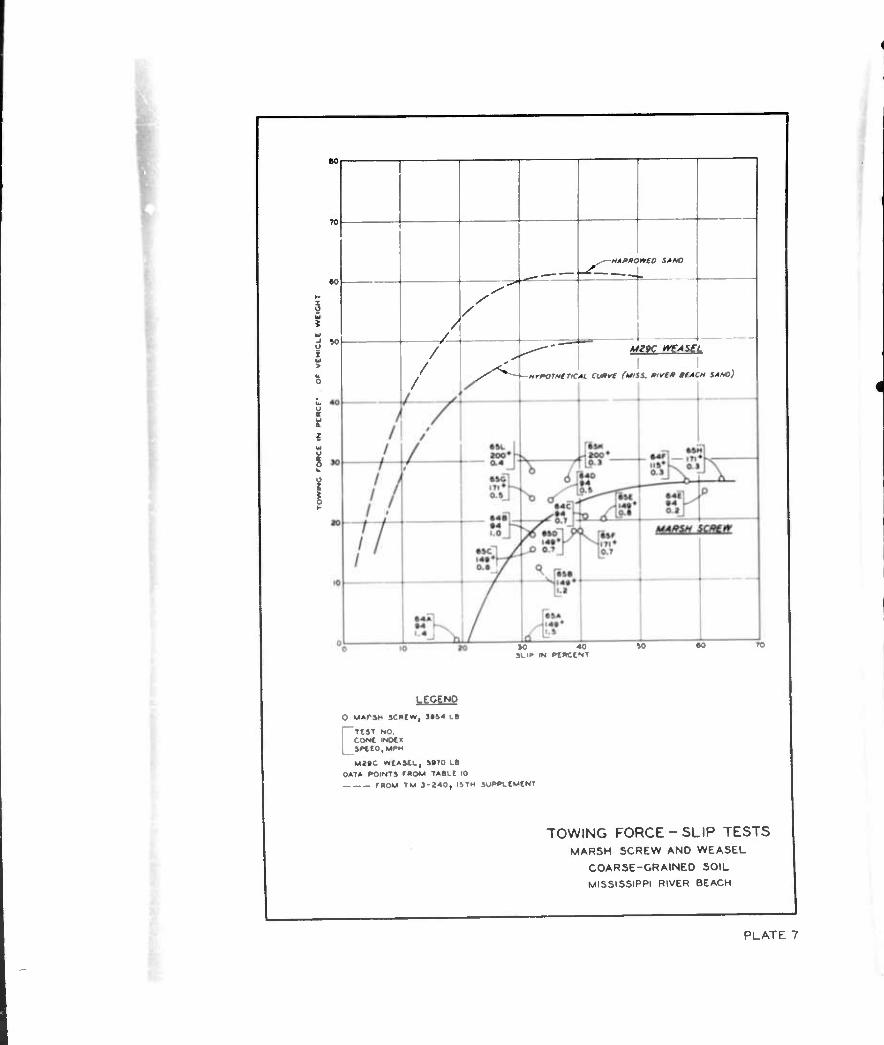
y i 1
i ?
/ j- / /
/ /
/
HAPKOIHtO SANO
UZ9C *e*S£L
MrPOTHtTKM. cmvf (t*SS. iuvtß MACH SAMO)
M «0 St.» M KUCINT
UEfifiHB O MAPSM sent Mr, MM Lt
ETIJT NO. COMC moc« t*m,tm* Mate «t*ML, »rro LB
DATA POINTS fROM TABLC 10 fftOM TM 3-240, l»TM SuM>L(MtNT
TOWING FORCE - SLIP TESTS MARSH SCREW AND WEASEL
COARSE-GRAINED SOIL
MISSISSIPPI RIVER BEACH
PLATE 7
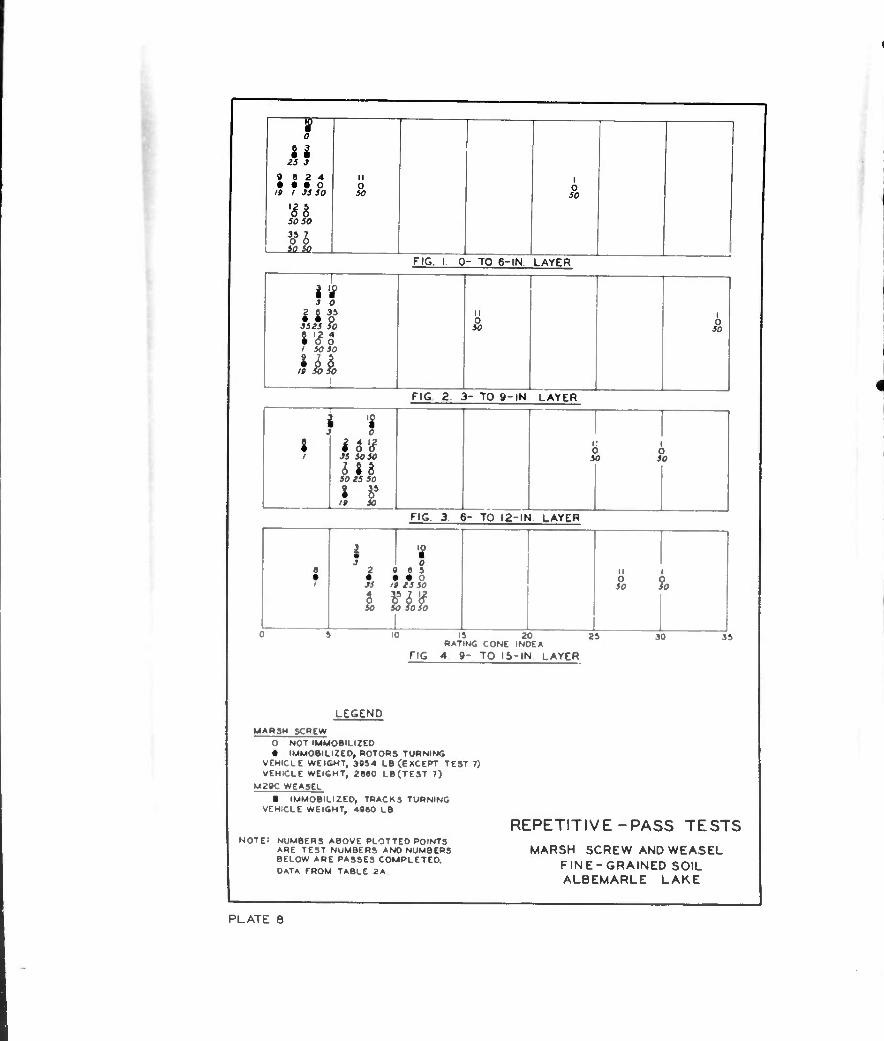
0
II 0 S 2 4 • • • O
19 I JS 50
SO
JOiQ
ii o 50
I O
50
FIG. 1 0- TO 6-IN. LAYER
1 itf 3 0
m 1 k X'ii 1 5050
lii 1
FIG 2 3- TO 9-IN LAYER
1 \ i u soso & i m
i 1' FIG 3 6- TO 12-IN LAYER
i iil SS 19 15 50
iO SO 50%
10 15 20 RATING CONE INDEX
FIG. 4 >- TO 15-IN LAYER
M i
?0 %
2i 30 3i
LEGEND MAW3H 5CWEW
0 NOT IMMOBILIZED • IMMOBILIZED, ROTORS TURNING
VEHICLE WEIGHT, 9094 LB (EXCEPT TEST 7) VEHICLE WEICHT, 2M0 LB (TEST 7)
M20C WEASEL
i IMMOBILIZED, TRACKS TURNING VEHICLE WEIGHT, 4960 LB
NOTE! NUMBERS ABOVE PLOTTED POINTS ARE TEST NUMBERS AND NUMBERS BELOW ARE PASSES COMPLETED. DATA FROM TABLE 2A.
REPETITIVE-PASS TESTS MARSH SCREW AND WEASEL
FINE-GRAINED SOIL ALBEMARLE LAKE
PLATE 8
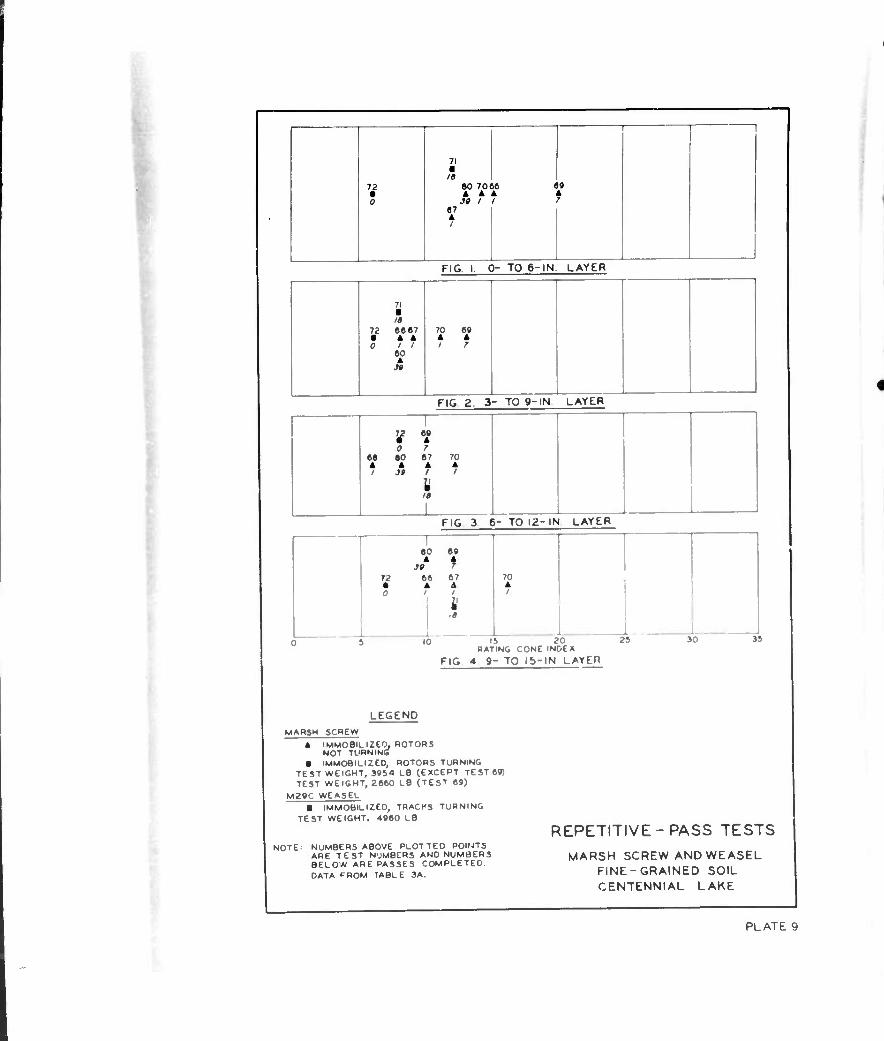
? 67 A I
80 7068 A A A
39 I I
69 A
FIG. 1. 0- TO 6-IN LAYER
71 ■ 7.2
0
6867
/ / 70 «
/ 7
FIG 2. 3- TO 9-IN LAYER
7/ If 0 7 60 67 70
A
\
FIG 3 6- TO 12-IN LAYER
60 SB
.•* t V V v - / 1
70 A
10 IS 20 RATING CONE INDEX
FIG 4 9- TO 15-IN LAYER
29 M 19
LEGEND
MARSH SCREW
A IMMOBILIZED, ROTORS NOT TURN INC
• IMMOBILIZED, ROTORS TURNING TEST WEIGHT, 3954 LB (EXCEPT TEST 69) TEST WEIGHT, 2660 LB (TEST 69)
M29C WEASEL ■ IMMOBILIZED, TRACKS TURNING
TEST WEIGHT, 4960 LB
NOTE: NUMBERS ABOVE PLOTTED POINTS ARE TEST NUMBERS AND NUMBERS BELOW ARE PASSES COMPLETED. DATA CROM TABLE 3A.
REPETITIVE-PASS TESTS
MARSH SCREW AND WEASEL FINE-GRAINED SOIL CENTENNIAL LAKE
PLATE 9
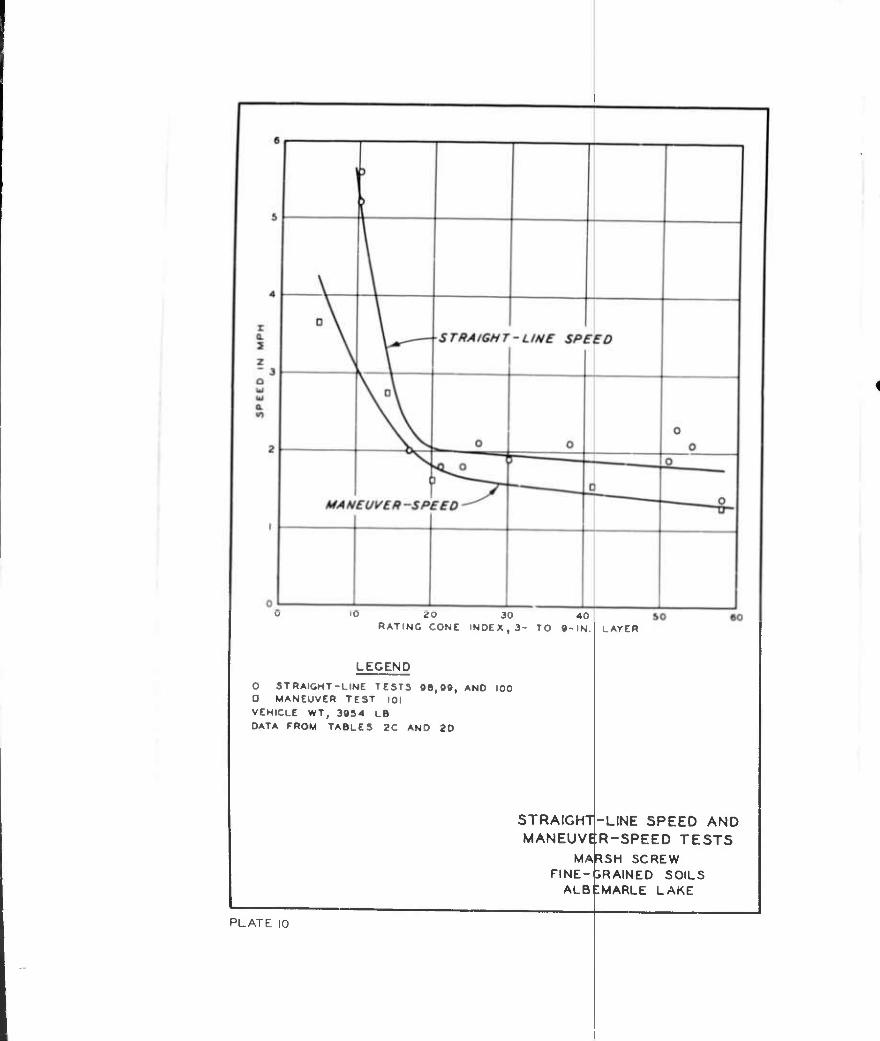
•0 20 30 40 RATING CONE INDEX, 3- TO 9-IN.
LEGEND
O STRAIGHT-LINE TESTS 98,90, AND 100 0 MANEUVER TEST 101 VEHICLE WT, 3934 LB DATA FROM TABLES 2C AND 2D
PLATE 10
LAYER
STRAIGHT-LINE SPEED AND MANEUVER-SPEED TESTS
MARSH SCREW FINE-GRAINED SOILS
ALBiiMARLE LAKE
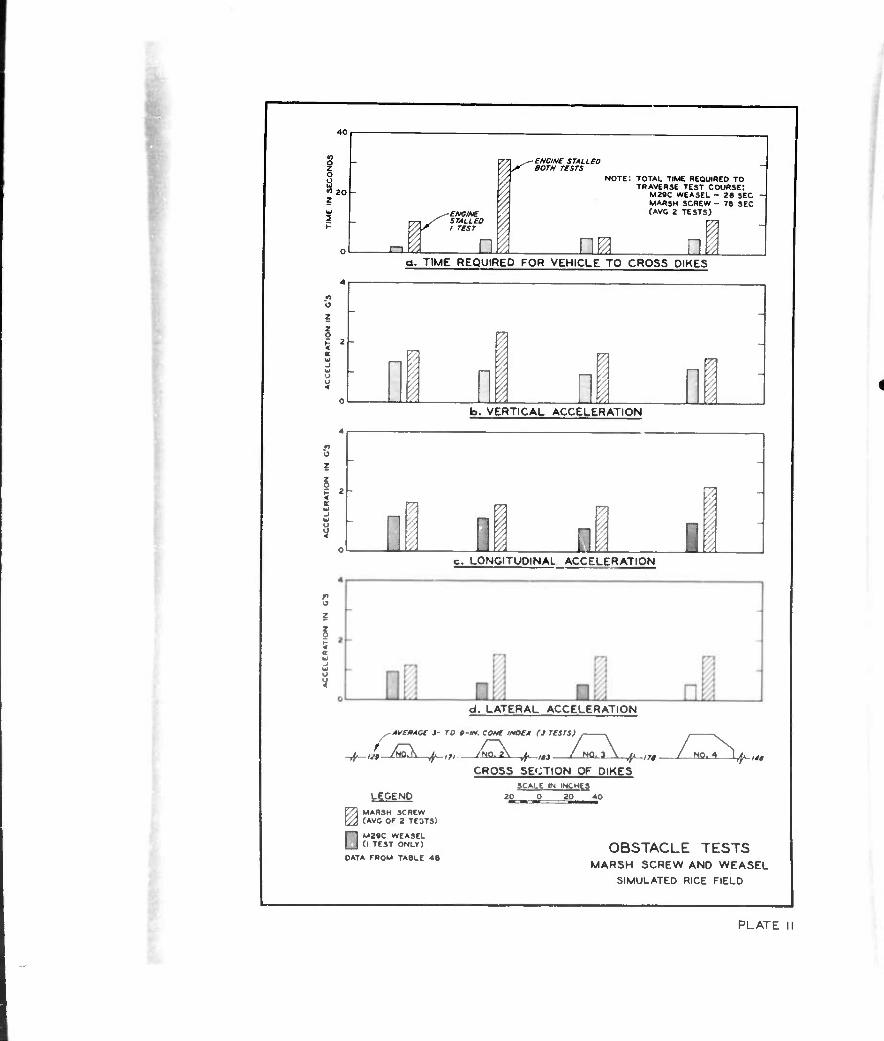
z o y «20 Z
■J
2
J
-m r ENGINC STALLED I TEST
n 1
ENGINE STALLED BOTH TESTS
NOTE: TOTAL TIME REQUIRED TO TRAVERSE TEST COURSE:
M2BC WEASEL - 28 SEC MARSH SCREW - 78 SEC (AVO 2 TESTS)
UK n a. TIME REQUIRED FOR VEHICLE TO CROSS DIKES
b. VERTICAL ACCELERATION
c. LONGITUDINAL ACCELERATION
d. LATERAL ACCELERATION
ArtBACf J- TO »-IN. CONE INDEM (J TESTS)
LEGEND MARSH SCREW (AVC OF 2 TE3TS)
M29C WEASEL (I TEST ONLY)
DATA FROM TABLE 48
CROSS SECTION OF DIKES SCALE IN INCHES
2^ 0 20 40
u
"
-
:
r-. 1 nl I i
- ll li li ll : I ll. IL ill 1^
OBSTACLE TESTS MARSH SCREW AND WEASEL
SIMULATED RICE FIELD
PLATE
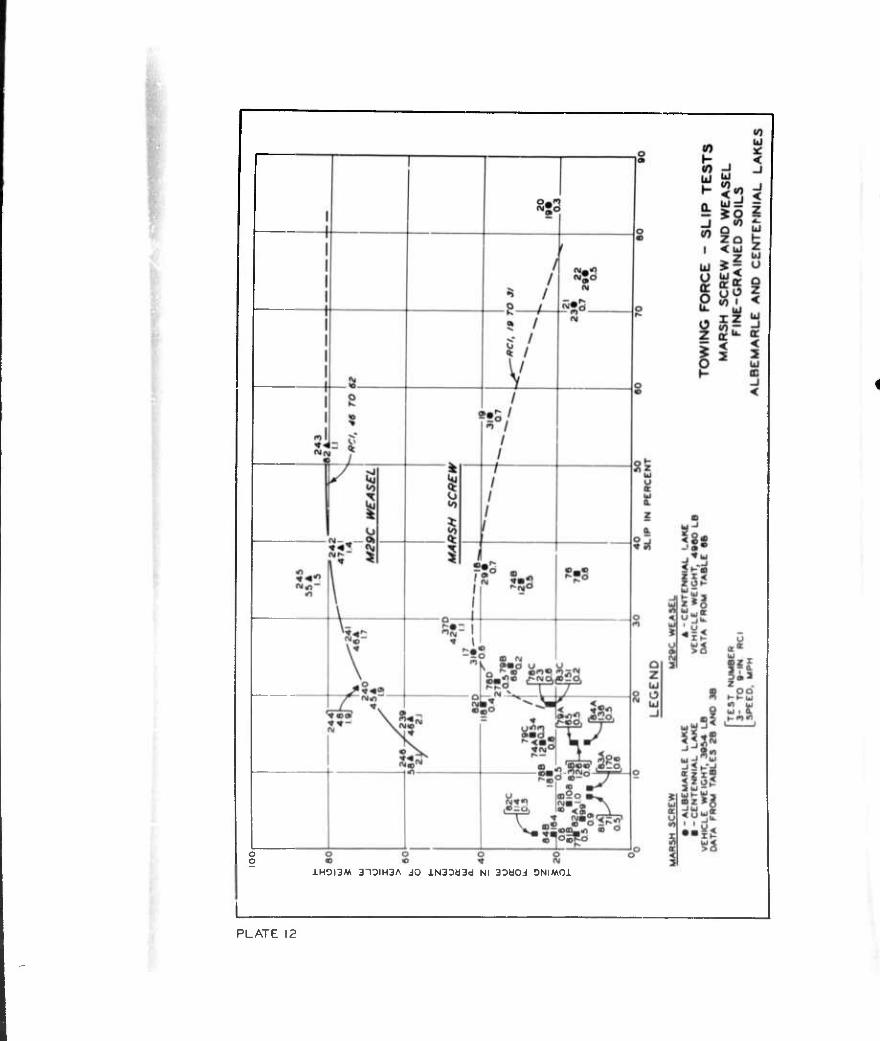
o o
1H0I3M 310IH3A JO lN3Dä3d Nl JOtiOJ ONIMOi
PLATE 12
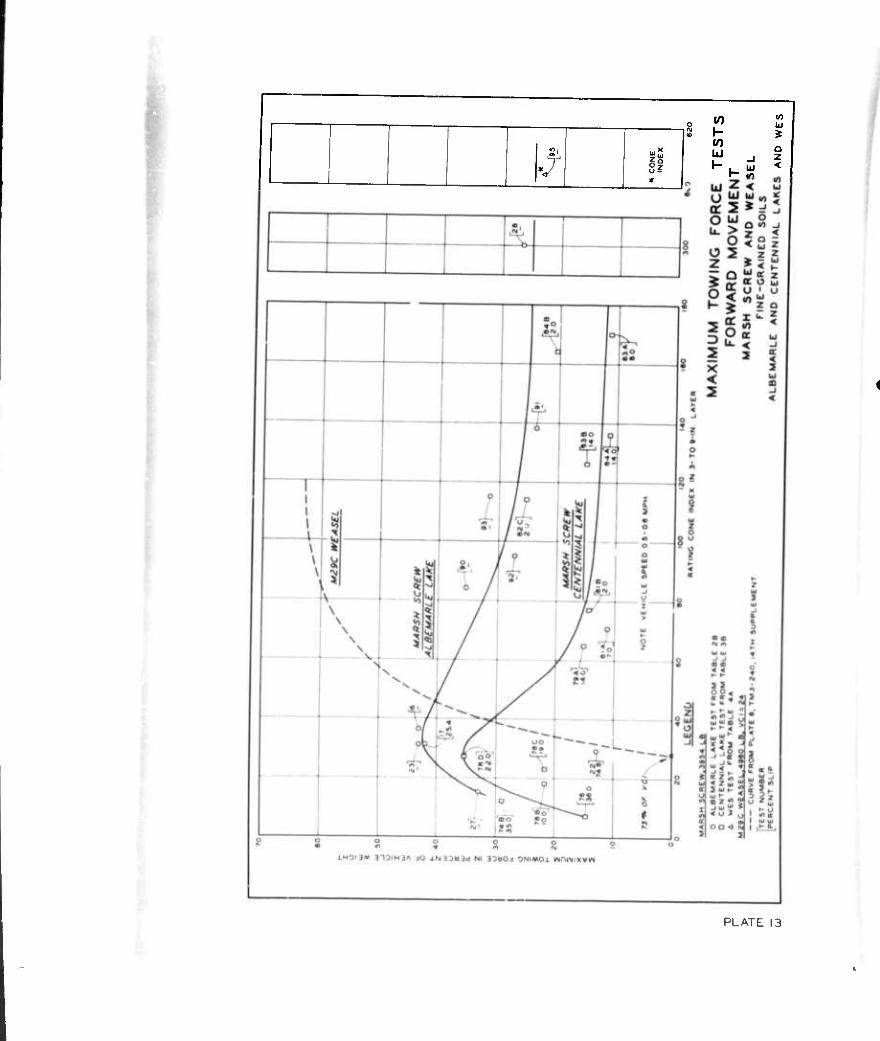
2'
■7
si (f) Q
Z <
PLATE 13
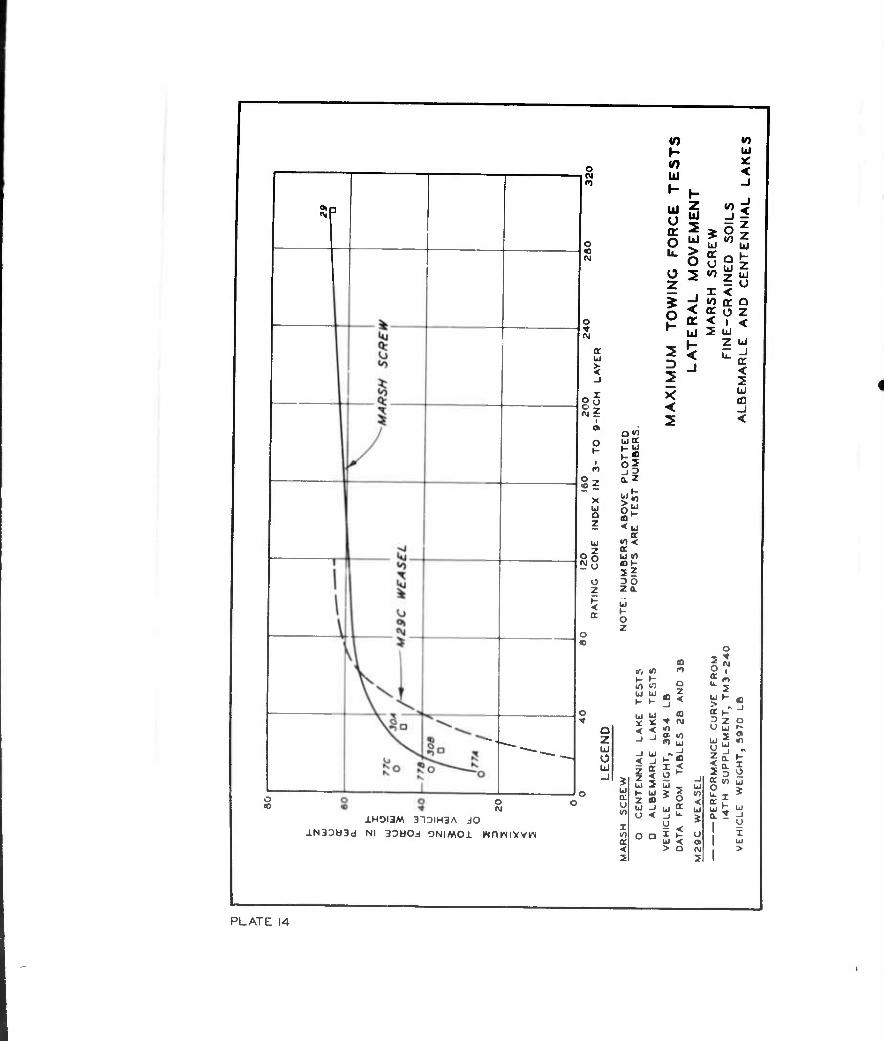
*p
o <0
5
•
X
z
So o z t- <
«0 f-
s| tr • O w
i3
<
O h 2 D
X < 2
!3<
- Ü X < J2 o: Q a o z 5 ' <
cr < u m j <
Q<0
Q. Z
I" a)
um
li SO z a Ü h O z
to m Ul UJ
U ki
_l -I
O N
J.HOI3M 3nDIH3A JO -LN3Td3d Nl BOdOd ONIMOl WOWIVVW o a
a n Q
'J a
•♦ N
» «0 I*) uJ
o H
* o
I? > Q
O
rj i
3 •- O H -■ z o
a t 10 u
I*
u X 111 >
PLATE 14
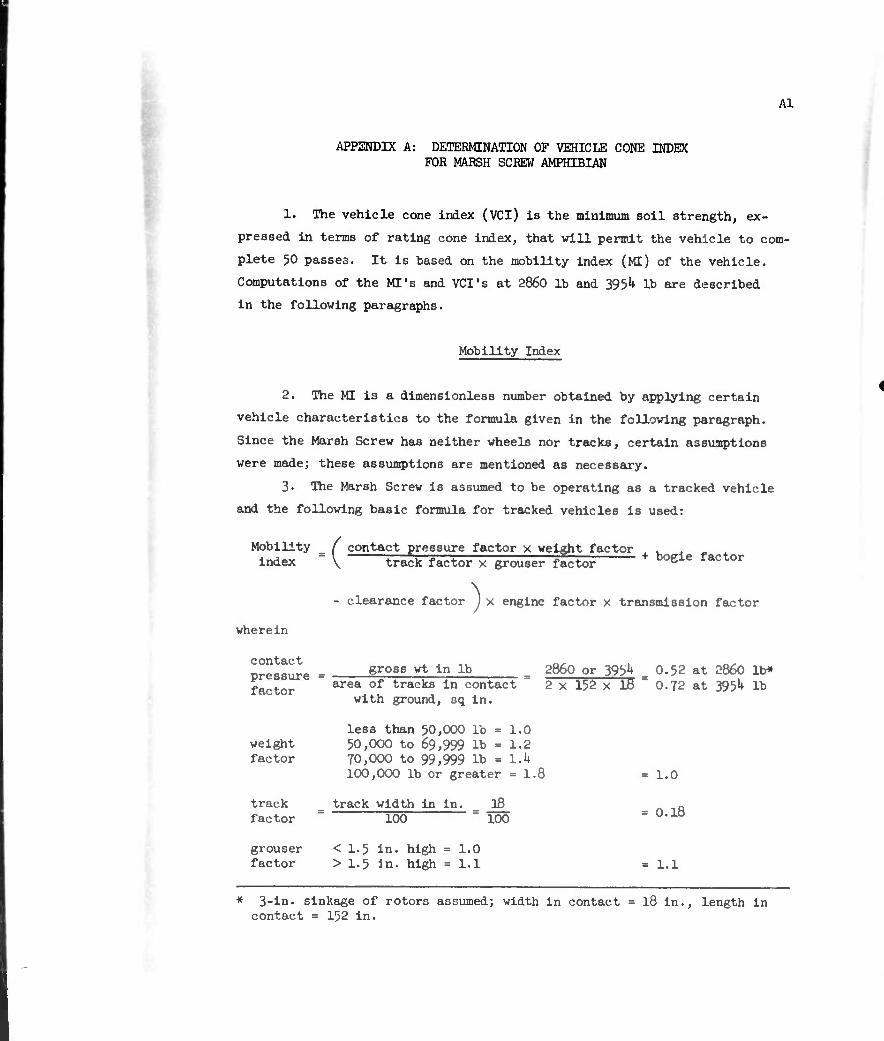
Al
APPENDIX A: DETERMINATION OF VEHICLE CONE INDEX FOR MARSH SCREW AMPHIBIAN
1. The vehicle cone index (VCl) is the minimum soil strength, ex-
pressed in terms of rating cone index, that will permit the vehicle to com-
plete 50 passes. It is based on the mobility index (Ml) of the vehicle.
Computations of the Mi's and VCI's at 2860 lb and 395U lb are described
in the following paragraphs.
Mobility Index
2. The ME is a dimensionless number obtained by applying certain
vehicle characteristics to the formula given In the following paragraph.
Since the Marsh Screw has neither wheels nor tracks, certain assusptions
were made; these assumptions are mentioned as necessary.
3- The Marsh Screw is assumed to be operating as a tracked vehicle
and the following basic formula for tracked vehicles is used:
Mobility _ ( contact pressure factor x weight factor index " \ track factor x grouser factor oogXe factor
clearance factor )x engine factor x transmission factor
wherein
contact pressure • factor
gross wt in lb area of tracks in contact
with ground, sq in.
2860 or 39b1* 2 x 152 x 10
0.52 at 2860 lb» 0.72 at 3951» lb
weight factor
track factor
less than 50,000 lb - 1.0 50,000 to 69,999 lb = 1.2 70,000 to 99,999 lb = l.k 100,000 lb or greater = 1.8
track width in in. iß 100 ~ 100
= 1.0
= 0.18
grouser factor
< 1.5 in. high = 1.0 > 1.5 In. high = 1.1 = 1.1
* 3-in. sinkage of rotors assumed; width in contact = 18 in., length in contact = 152 in.
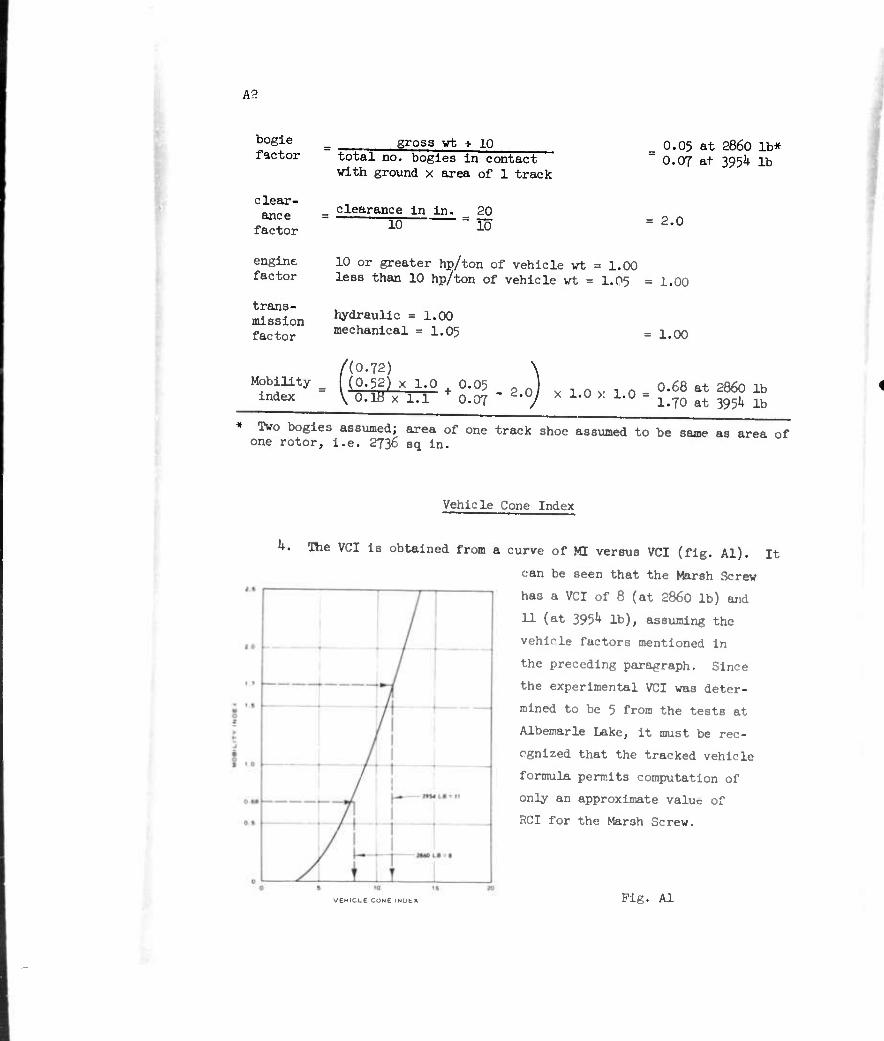
A?
bogie factor
clear- ance
factor
engine factor
trans- mission factor
gross vt + 10 total no. bogies in contact with ground x area of 1 track
_ clearance in in. 20 10 10
0.05 at 2860 lb* 0.07 at 3954 lb
= 2.0
10 or greater hp/ton of vehicle wt = 1.00 less than 10 hp/ton of vehicle vt = 1.05 =1.00
hydraulic =1.00 mechanical ■ I.05 1.00
/(0.72) \ Mobility m (0.52) x 1.0 0.05 . 2 J x , 0 y , n 0.68 at 2860 lb iDdex \ Ö.lB'x 1.1 0.07 2'0J * 1-0 x i'0 " 1.70 at 3954 lb
« Two bogies assumed; area of one track shoe assumed to be same as area of one rotor, i.e. 2736 sq in.
Vehicle Cone Index
U. Die VCI is obtained from a curve of MI versus VCI (fig. Al). It
can be seen that the Marsh Screw
has a VCI of 8 (at 2860 lb) and
11 (at 3951* lb), assuming the
vehicle factors mentioned In
the preceding paragraph. Since
the experimental VCI was deter-
mined to be 5 from the tests at
Albemarle Lake, It must be rec-
ognized that the tracked vehicle
formula permits computation of
only an approximate value of
RCI for the Marsh Screw.
VEHICLE CONE INDEX Fig. Al
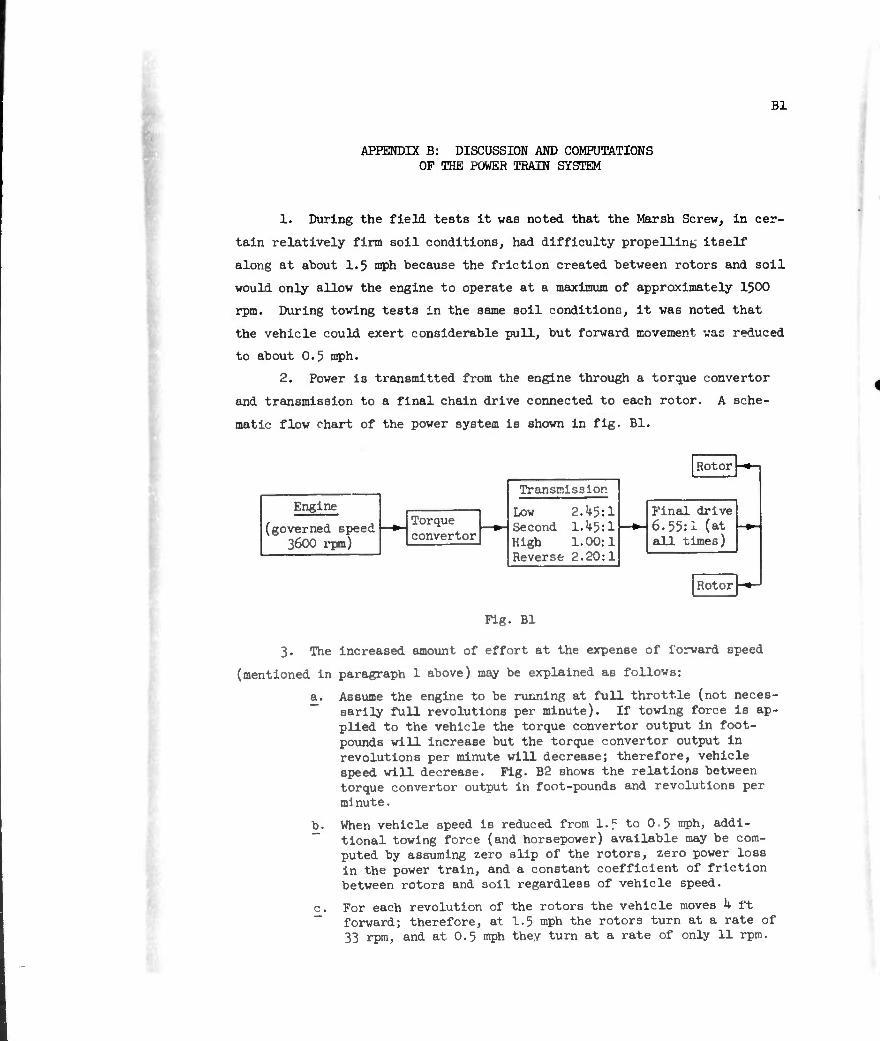
Bl
APPENDIX B: DISCUSSION AND COMPUTATIONS OP THE POWER TRAIN SYSTEM
1. During the field, tests it was noted that the Marsh Screw, in cer-
tain relatively firm soil conditions, had difficulty propelling itself
along at about 1,5 mph because the friction created between rotors and soil
would only allow the engine to operate at a maximum of approximately 1500
rpm. During towing tests in the same soil conditions, it was noted that
the vehicle could exert considerable pull, but forward movement was reduced
to about 0.5 mph.
2. Power is transmitted from the engine through a torque convertor
and transmission to a final chain drive connected to each rotor. A sche-
matic flow chart of the power system is shown In fig. Bl.
Engi ne
(governed speed 36OO rpm)
Torque convertor
Transmlssiop.
Low 2.^5:1 Second 1.^5:1 High 1.00:1 Reverse 2.20:1
Rotor ^*1
Final drive 6.55:1 (at nil times)
-
Rotor -^
Pig. Bl
3. The increased amount of effort at the expense of forward speed
(mentioned in paragraph 1 above) may be explained as follows:
a. Assume the engine to be running at full throttle (not neces- ~ sarlly full revolutions per minute). If towing force is ap-
plied to the vehicle the torque convertor output in foot- pounds will increase but the torque convertor output in revolutions per minute will decrease; therefore, vehicle speed will decrease. Fig. B2 shows the relations between torque convertor output in foot-pounds and revolutions per minute.
b. When vehicle speed is reduced from l.f to 0,5 mph, addi- tional towing force (and horsepower) available may be com- puted by assuming zero slip of the rotors, zero power loss in the power train, and a constant coefficient of friction between rotors and soil regardless of vehicle speed.
c. For each revolution of the rotors the vehicle moves k ft forward; therefore, at 1.5 mph the rotors turn at a rate of 33 rpm, and at 0.5 mph they turn at a rate of only 11 rpm.
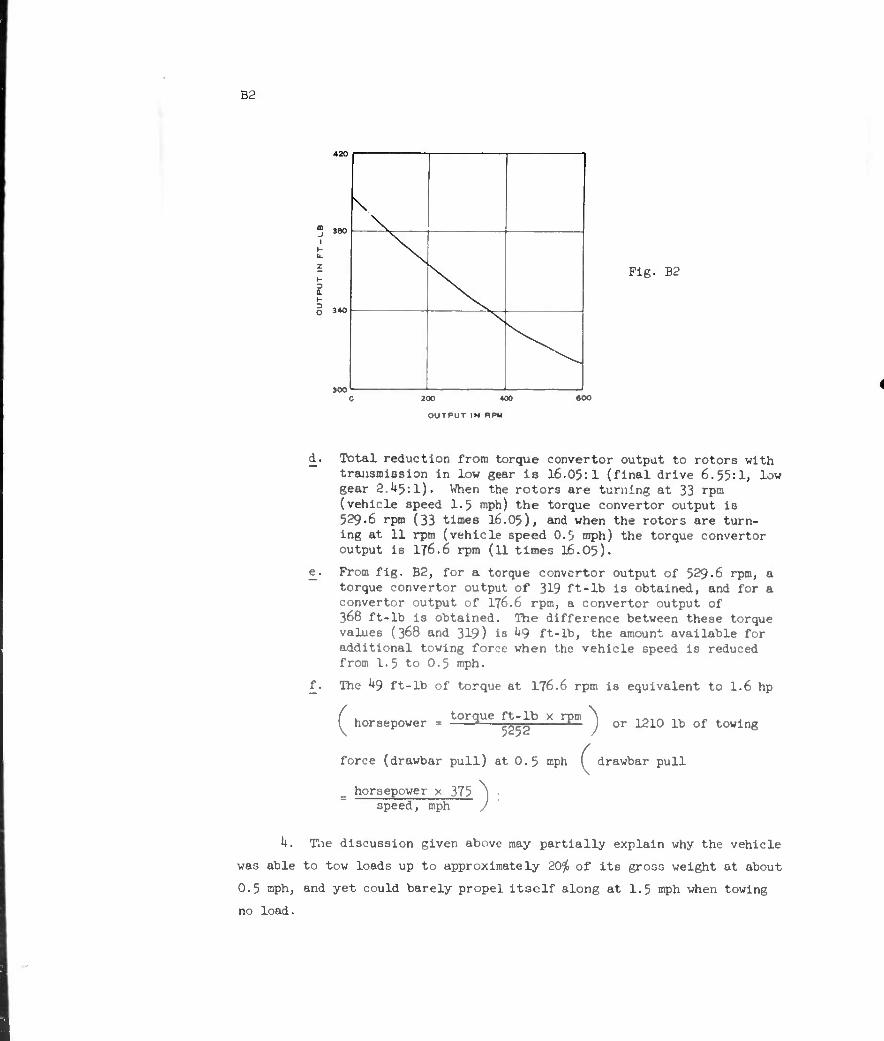
B2
420
S40
300
\
\
N
^-
Fig. B2
200 «C
OUTPUT IN RPU
600
d. Total reduction from torque convertor output to rotors with transmission in low gear is 16.05:1 (final drive 6.55:1, low gear 2.1*5:1). When the rotors are turning at 33 rpm (vehicle speed 1.5 mph) the torque convertor output is 529.6 rpm (33 times 16.05), and when the rotors are turn- ing at 11 rpm (vehicle speed 0.5 mph) the torque convertor output is I76.6 rpm (11 times 16.05).
e. From fig. B2, for a torque convertor output of 529.6 rpm, a torque convertor output of 319 ft-lb is obtained, and for a convertor output of I76.6 rpm, a convertor output of 368 ft-lb is obtained. The difference between these torque values (368 and 319) is kg ft-lb, the amount available for additional towing force when the vehicle speed is reduced from 1.5 to 0.5 mph.
f. The U9 ft-lb of torque at 176.6 rpm is equivalent to 1.6 hp
( horsepower = ^^ ^b x ^m ) or 1210 lb of towing
( force (drawbar pull) at 0.5 mph ( drawbar pull
horsepower x 375 ) • speed, mph /
k. The discussion given above may partially explain why the vehicle
was able to tow loads up to approximately 20^ of its gross weight at about
0.5 mph, and yet could barely propel itself along at 1.5 mph when towing
no load.
+> 3
ä CO a)
3 i OJ W U i H
•(Ave '«.I Wä1 a £ -^ "t *H K «rJ ■«-> 4-> o
U Ü • « « • u a v v
- ■- U C l.
3 ^^
cq > * ^ «5 EH w o ■J i u CO U i H goj u J3
■H Ä H O 4) aj co > S
1
,1 .
5 t 8 I
• M H ;> ) M H H
•H fl > X) o v
If?
J2H
i i a «d n x: € o %H -H c *-> V> -H u d B 3 a -H > O« C C s. * * ^
■T)»^ o an BH
•^Kc « aS"^* r-l *J OH %* v
v p -ö -H - -d
b yy * s^ g.0 « i)CtJuO«H*iB > ^ ft u O t> v
• -• V. K Q l, «
S€^5sä-slg|5 So« *»«S«iqfi
-'äSagJS"^^^!
h ....
Uli 1 «III if ill 3lläli
•-4 ni <^ M *-« M C ,
iK'M v4i
ill" ii:: •«??
&TJ v. « B o >« 3
158|| H ^ V " ö -ö •* " 3 i * ? V
ti I n ? m 3 u q
x: 3 i,
l il.
3*i.
4-) • 0) cn «J
S4i
d x: m
t U i) r* ■ ' o > a ] ft-, -rt o
Lx:-^ r-iiH+j-p-dcj^pH-OH ^> -.oxiP«+J--«a tt-^x B V o a> a m Q, a m ta >, tu oxJH-rt-H-PotBagiuw+Jx:
Sa sl55-sM*slgi2
!^
x: q « J ** & g« ^
x: *> i3 ^ 3 '' S ü 3 « 4» c •
11 s s af 5 B s g Jio 15 ^ y t) «i t- ü « ^ Q 45 ♦J +1 |>
ii U 3 i; at
E i in
ä v tt i
O O 4) O 4^ h -H x: 1-i »I f UX:P H^+J+J-ö«
w 4) 4) Q -H 4) ^-4 *+J> -.O-Oft-tJ ^ a a ■<-» aj VT
- w (j to p. i •H -H -P 4J r > <M -H CC
u x: >
Sx: ^
i- -H £ p. -j >, 4> OJ
_ 4» +j x: x: P T3 ^ +J +J
3 u •*< «5 *> ^: «j •« ^i a<oa--"
.-> £o *» ja ■« o. C ■ B w oi
-H fi x: v*>t>iu't>B'-(i)ii)C
•H 4> (0 XI 4> 4>
S»; > t*x3+J H^,^J+>TJ^,
- d +j > - o x» p* +j ■•> a o a O-HOJ 'U'otti piiuowuropjä
EH in-H o-t^+J >^-H[r; to c
Öd"»
a J] UJ ■*->
O V ■H X Ä >H
in -i S r
dl D +1 Ä ^; +j -d --' -t-1 ^

UNCLASSIFIED
UNCLASSIFIED