Embed Size (px)
Citation preview

UNCLASSIFIED
AD 405 143
DEFENSE DOCUMENTATION CENTERFOR
SCIENTIFIC AND TECHNICAL INFORMATION
CAMERON STATION. ALEXANDRIA. VIRGINIA
UNCLASSIFIED
NOTICE: When goverment or other drawings, speci-fications or other data are used for any purposeother than in connection with a definitely relatedgoverment procuiwent operation. the U. S.Government thereby incurs no responsibi.-ity, nor anyobligation whatsoever; and the fact that the Govern-ment may have formulated, furnished, or in any waysupplied the said dravings, specifications. or otherdata is not to be regarded by implication or other-vise as in any manner licensing the holder or anyother person or corporation, or conveying any rightsor permission to manufacture, use or sell anypatented invention that may in any way be relatedthereto.
'405 14 3 ~-
IN INVESTIGATION OF PLASTIC TORSION IN CIRCULAR PRISMATIC BARSWITH A CONCENTRIC OR ECCENTRIC HOLE USING THE
SAND -HEAP ANALOGY
A Thesis
by
GERALD JOHN CAREY, JR.
4,.F
Submitted to the Graduate School of theAgricultural and Mechanical College of Texas in
partial fulfillment of the requirements for the degree of
MASTER OF SCIENCE
May 1963
Major Subject: Aerospace Engineering
WA-
AN INVESTIGATION OF PLASTIC TORSION IN CIRCULAR PRISMATIC BARS*I2. WITH A CONCENTRIC OR ECCENTRIC HOLE USING THE
SAND -HEAP ANALOGY
A Thesis 60
4)P GERALD JOHN CAREY, JR.
Submitted to the Graduate School of theAgricultural and Mechanical College of Texas in
partial fulfillment of the requirements for the degree of
MASTER OF SCIENCE
jo u c ay 19E-e63
Major Subject: Aerospace Engineering
AN INVESTIGATION OF PLASTIC TORSION IN CIRCULAR PRISMATIC BARSWITH A CONCENTRIC OR ECCENTRIC HOLE USING THE
SAND-HEAP ANALOGY
A Thesis
by
GERALD JOHN CAREY, JR.
Approved as to style and content by:
(Chairman of Committee)
(Head of Department)
May 1963
ACKNOWLEDGMENTS
I wish to express my sincere thanks to Doctor Charles H. Samson, Jr.
and Professor Harry J . Sweet for their help, interest, and many valuable sug-
gestions during this investigation.
My particular gratitude is given to Mr. Ted J . Meiller for his assistance
and suggestions in the construction of the test specimens.
To my wife, Joan, who has been of invaluable assistance, I express
my sincere appreciation.
lit
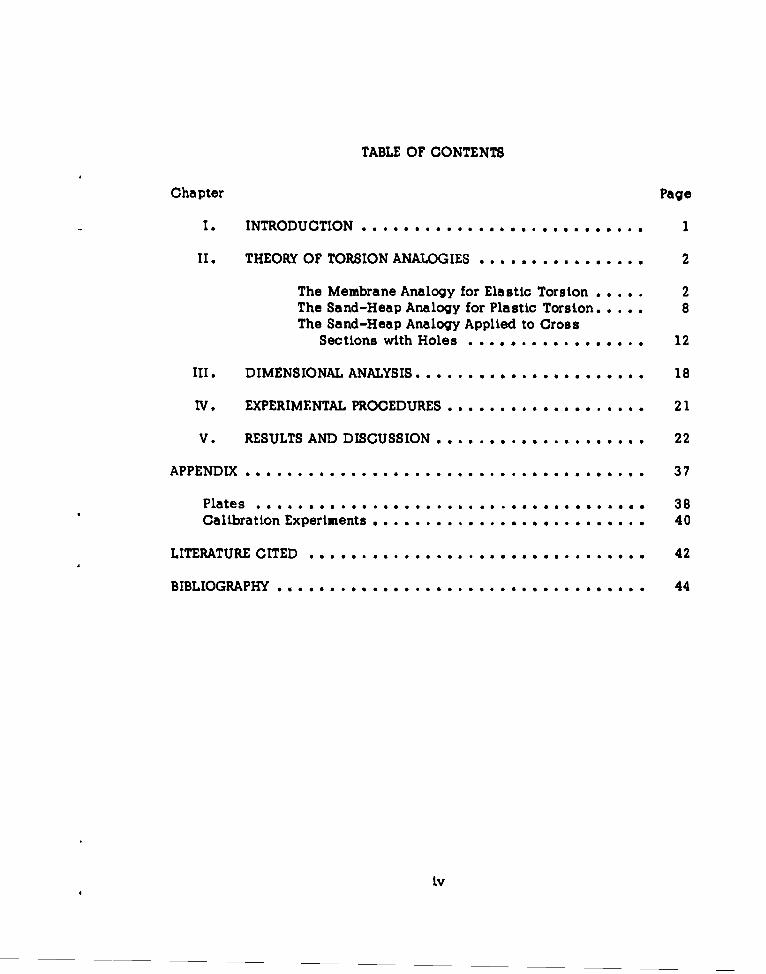
TABLE OF CONTENTS
Chapter Page
I. INTRODUCTION ................. . . .. .. . . . 1
II. THEORY OF TORSION ANALOGIES ....... ° ........ 2
The Membrane Analogy for Elastic Torsion .. ... 2The Sand-Heap Analogy for Plastic Torsion . ... 8The Sand-Heap Analogy Applied to Cross
Sections with Holes .*..e..* ......... 12
III. DIMENSIONAL ANALYSIS ...................... 18
IV. EXPERIMENTAL PROCEDURES ................... 21
V. RESULTS AND DISCUSSION ................ ... 22
APPENDIX ............ . . .. ................ 37
A PP aeNDI . . . . . . . . . . . . . . . . . . a . . . . . . . . 38 a**Plates . .*....................................90 38Calibration Experiments ........................... 40
LITERATURE CITED ....................... . ... ..... 42
BIBLIOGRAPHY ................................. 44
iv
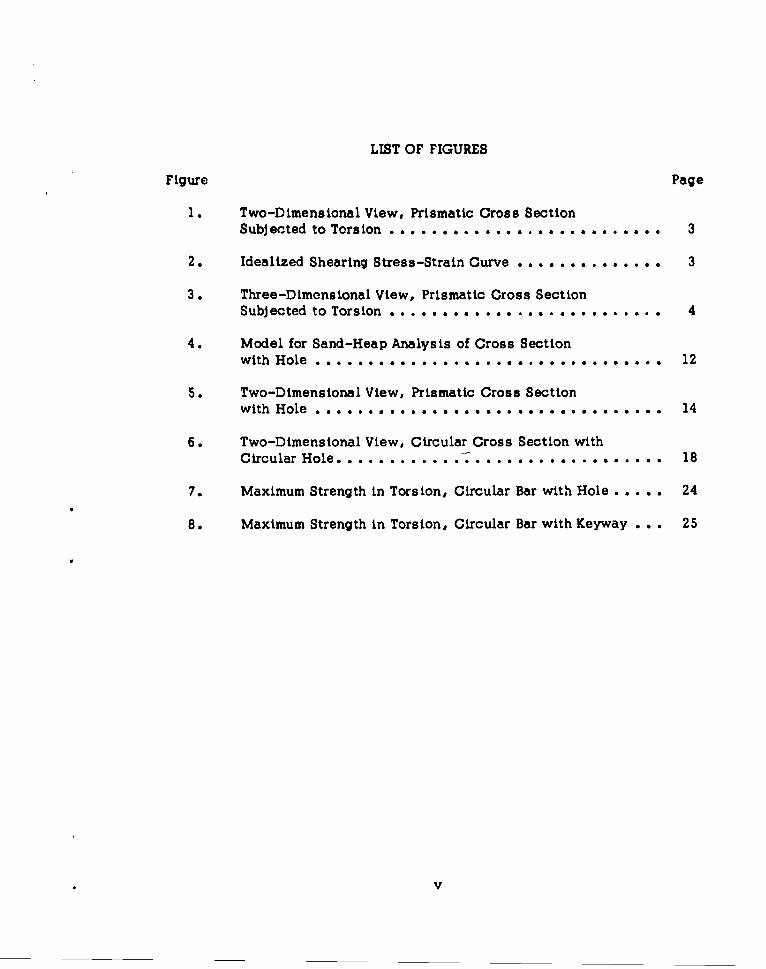
LIST OF FIGURES
Figure Page
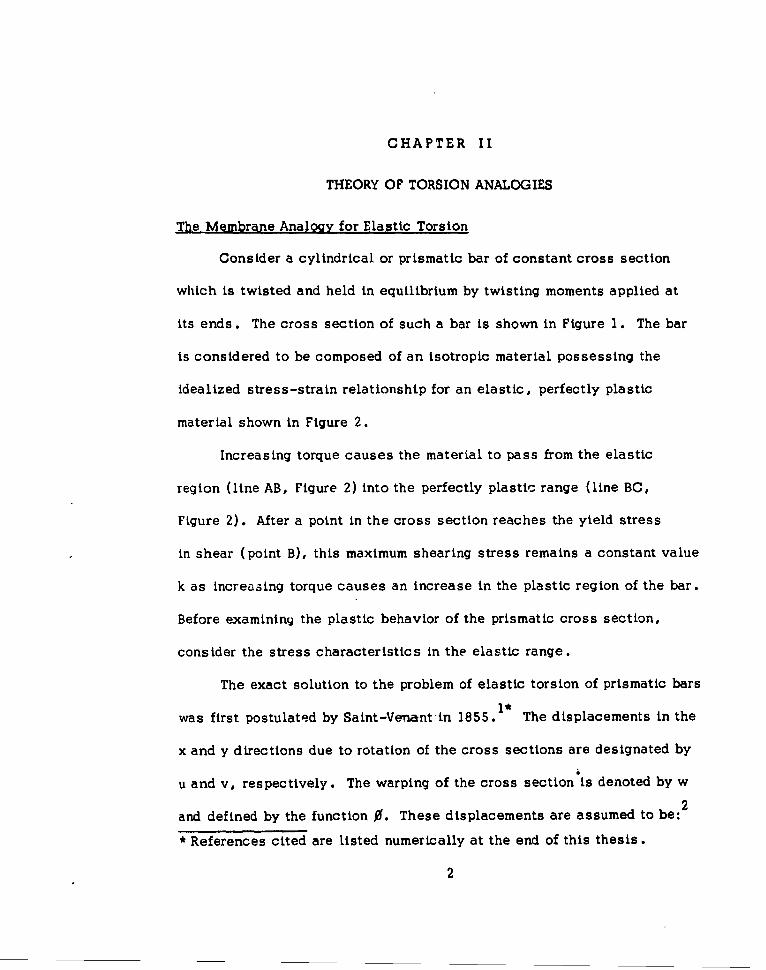
1 Two-Dimensional View, Prismatic Cross SectionSubjected to Torsion ... ......... .* .. ..... . .... 3
2. Idealized Shearing Stress-Strain Curve ... . ... .. . .... 3
3. Three-Dimensional View, Prismatic Cross SectionSubjected to Torsion . .. *.. * * . . . * * .. . . a * . * .. . . . .. 4
4. Model for Sand-Heap Analysis of Cross Sectionwith Hole . . . . .. .... . . .. . . . .. . . ... 12
5. Two-Dimensional View, Prismatic Cross Sectionwith Hole . . . . .. ... . . . 14
6. Two-Dimensional View, Circular Cross Section with
Circular Hole. . . . .. ..... . . . . . ... . . . . . . . . . . . . . . 18
7. Maximum Strength in Torsion, Circular Bar with Hole ..... 24
8. Maximum Strength in Torsion, Circular Bar with Keyway . . . 25
V
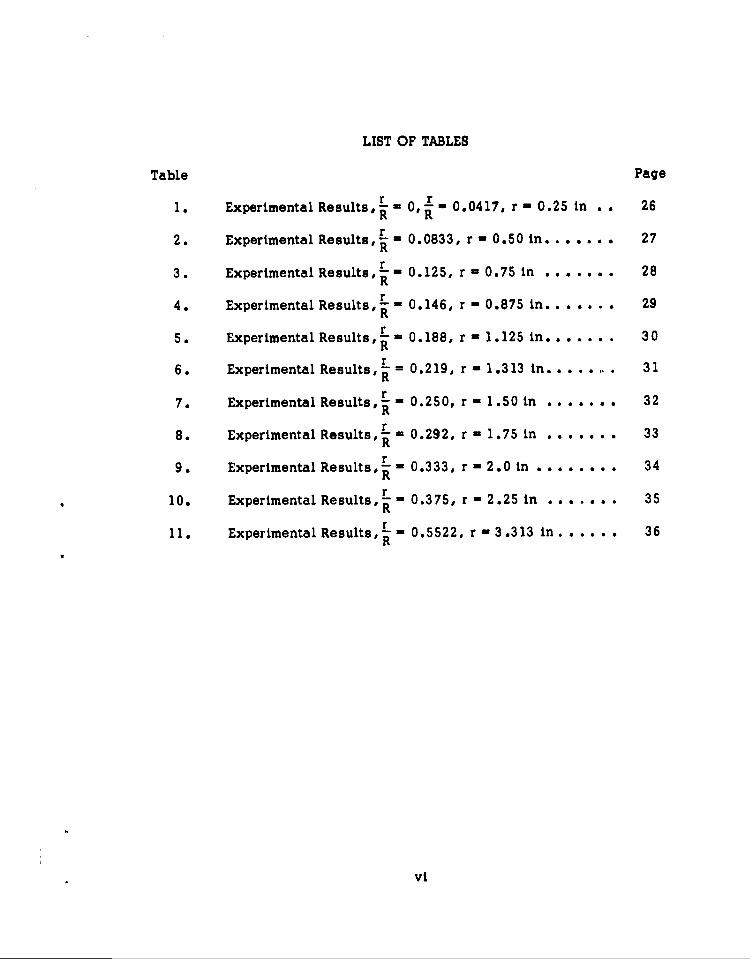
LIST OF TABLES
Table Pager r
1. Experimental Results, 0,jin 0.0417, r - 0.25 in . . 26
2. Experimental Results, - 0.0833, r - 0.50 in. . . .. . . 27R
r3. Experimental Results,-L 0.125, r - 0.875 in . .. . ... 28R
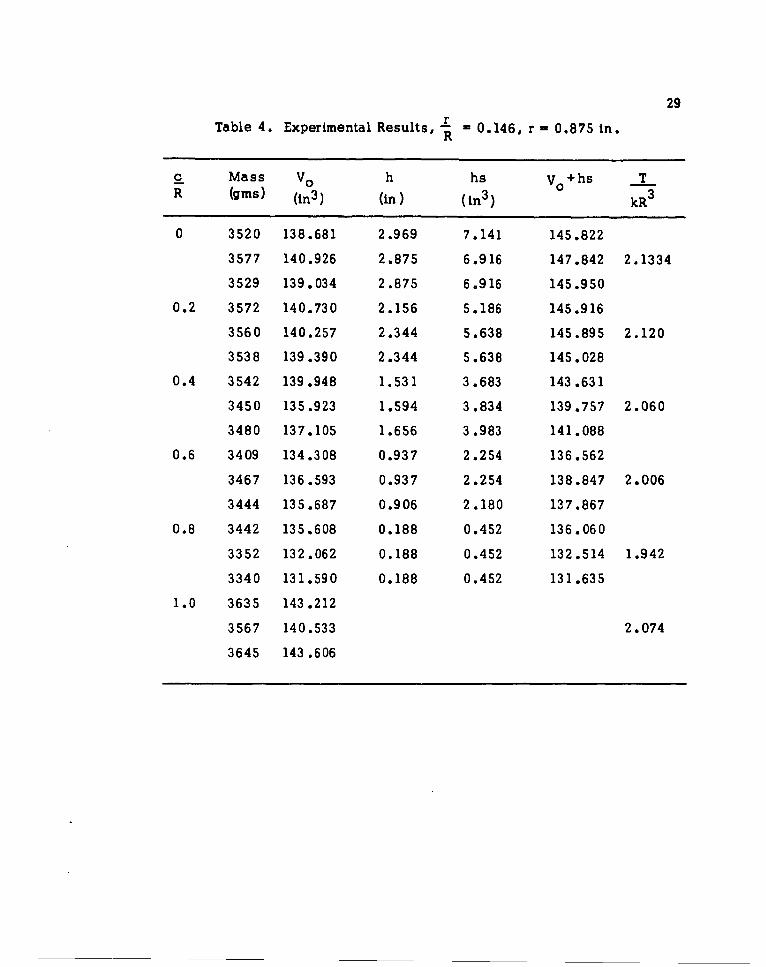
4. Experimental Results,L- 0.146, r - 0.875 in. . . .. . 29R
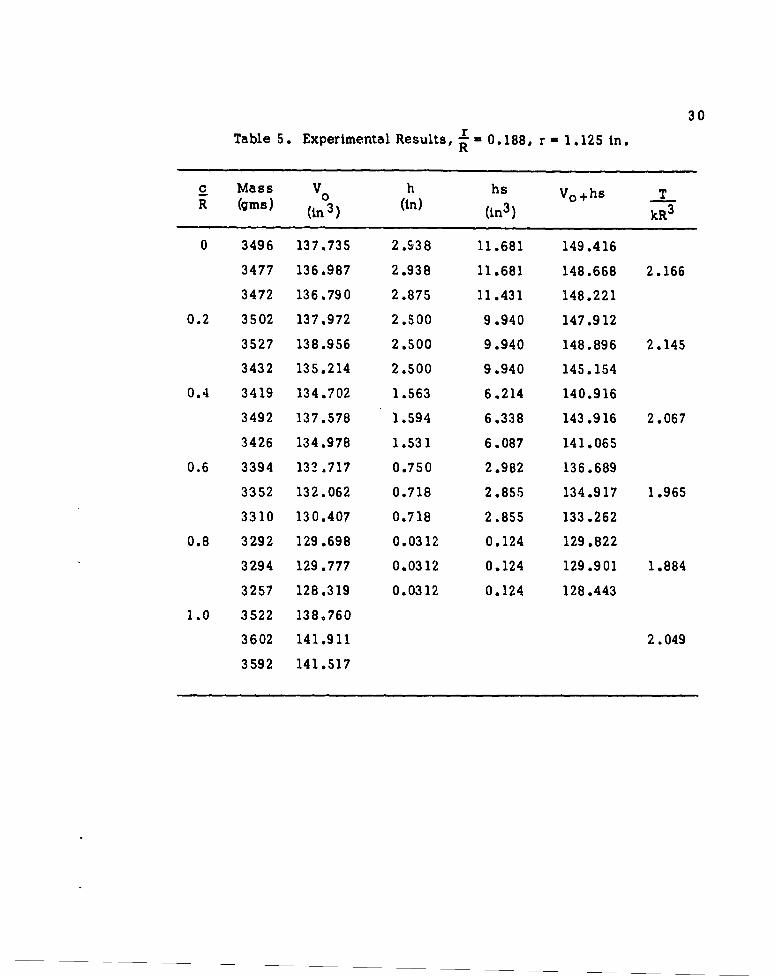
5. Experimental Results, -- 0.188, r - 1.125 in ...... .. 30R
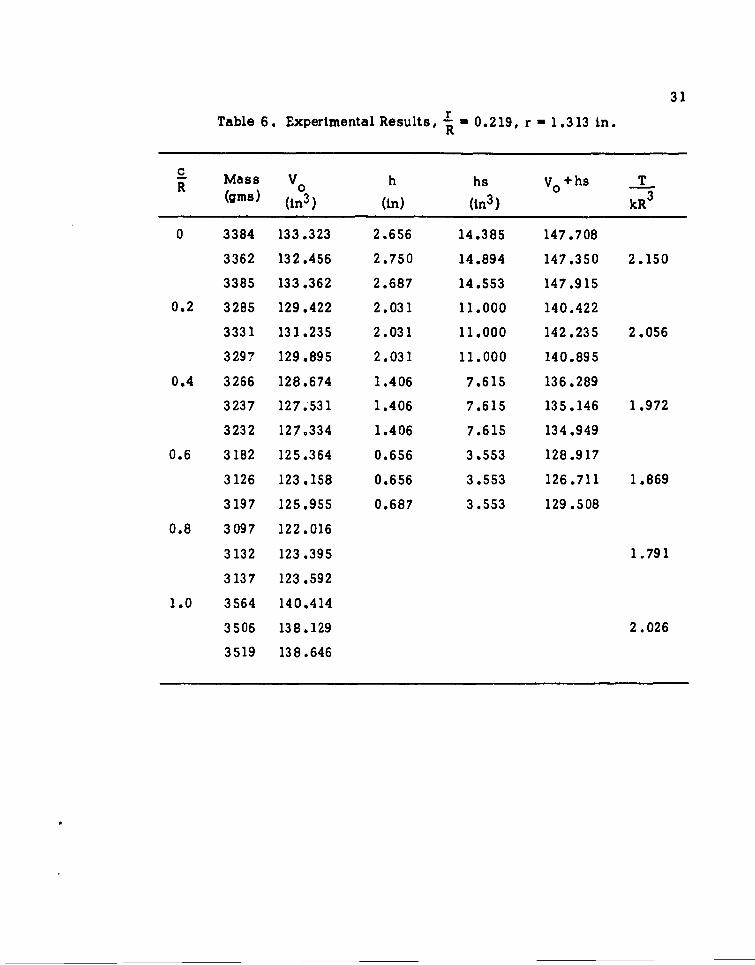
6. Experimental Results, L = 0.219, r - 1.313 in . . . . . 31
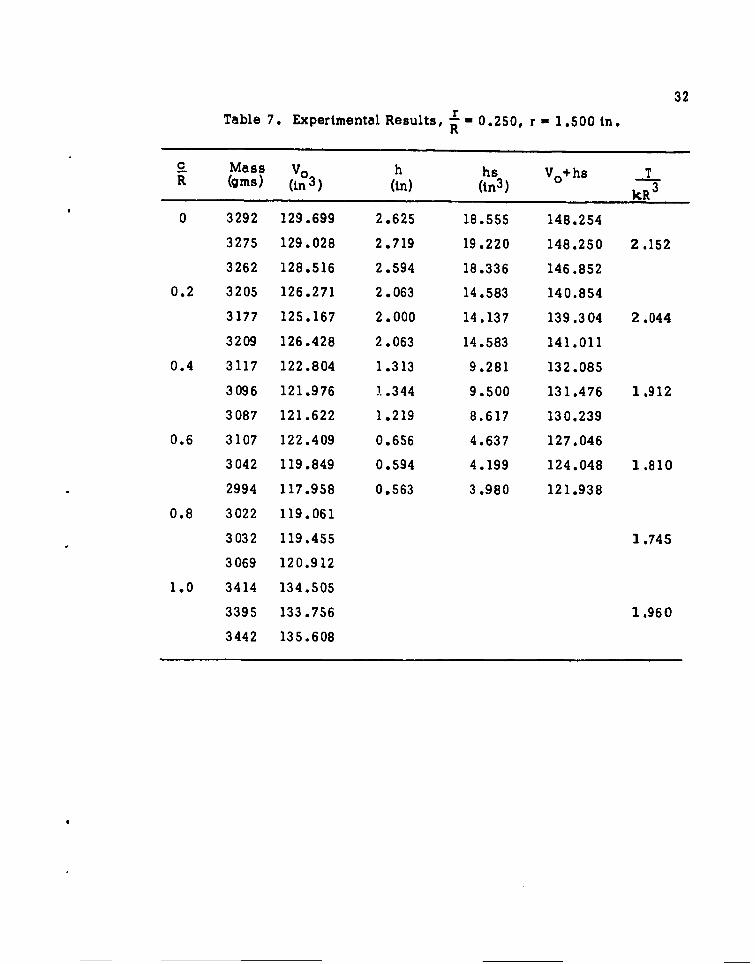
7. Experimental Results, L- - 0.250, r - 1.50 in . . . . . 32R
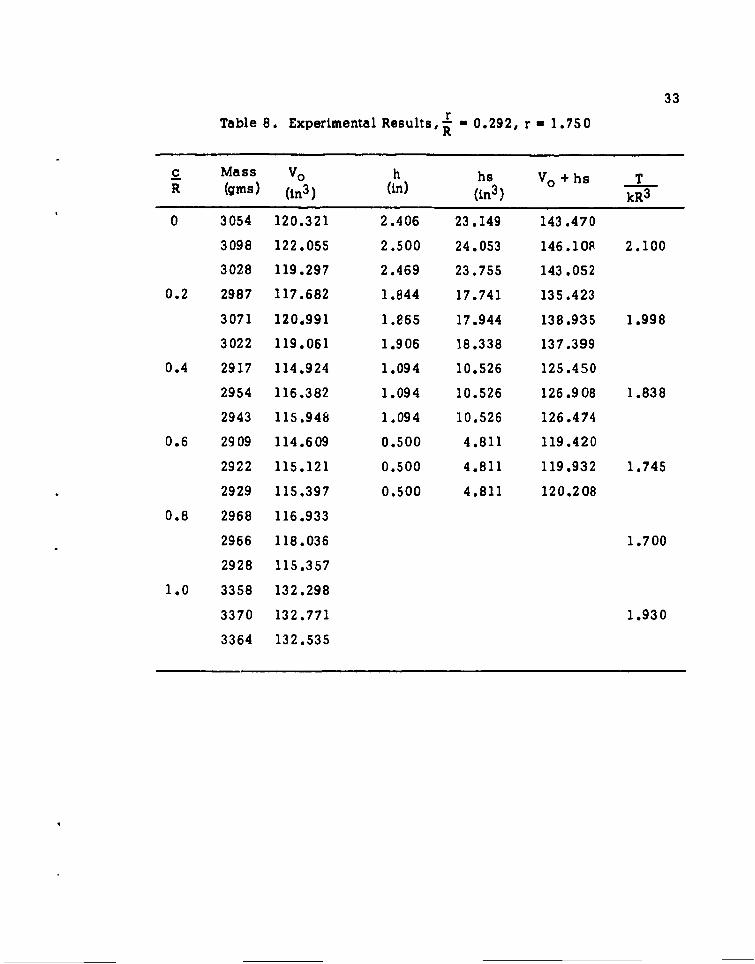
8. Experimental Results,L L 0.292, r - 1.75 in ...... 33R
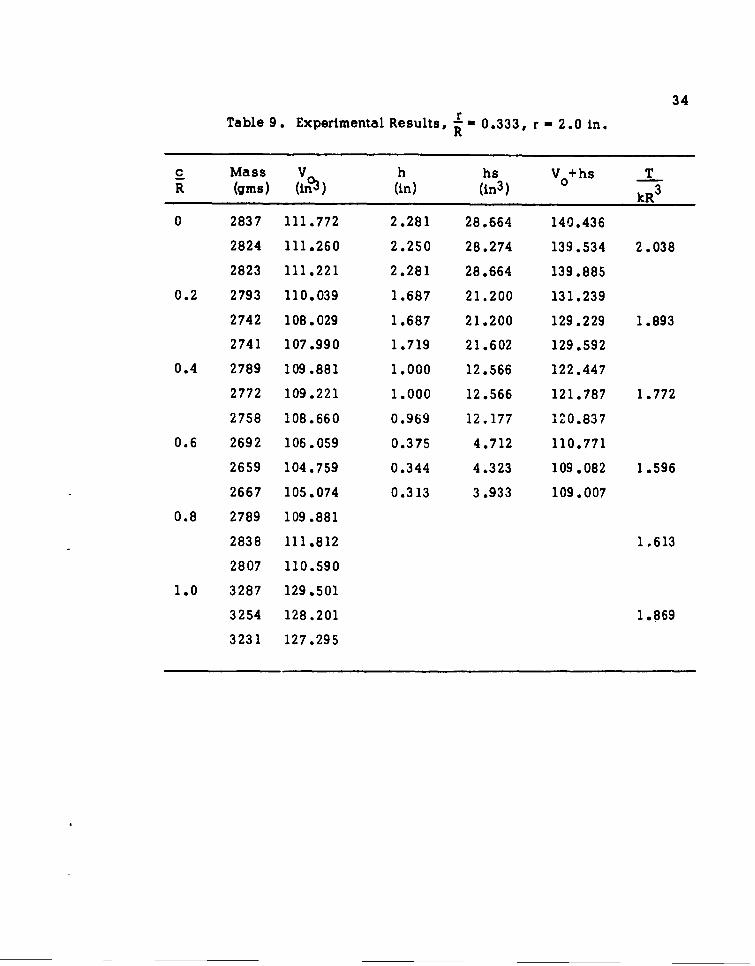
9. Experimental Results,-L- 0.3 33, r - 2. 0 in . . . . . . . * 34R
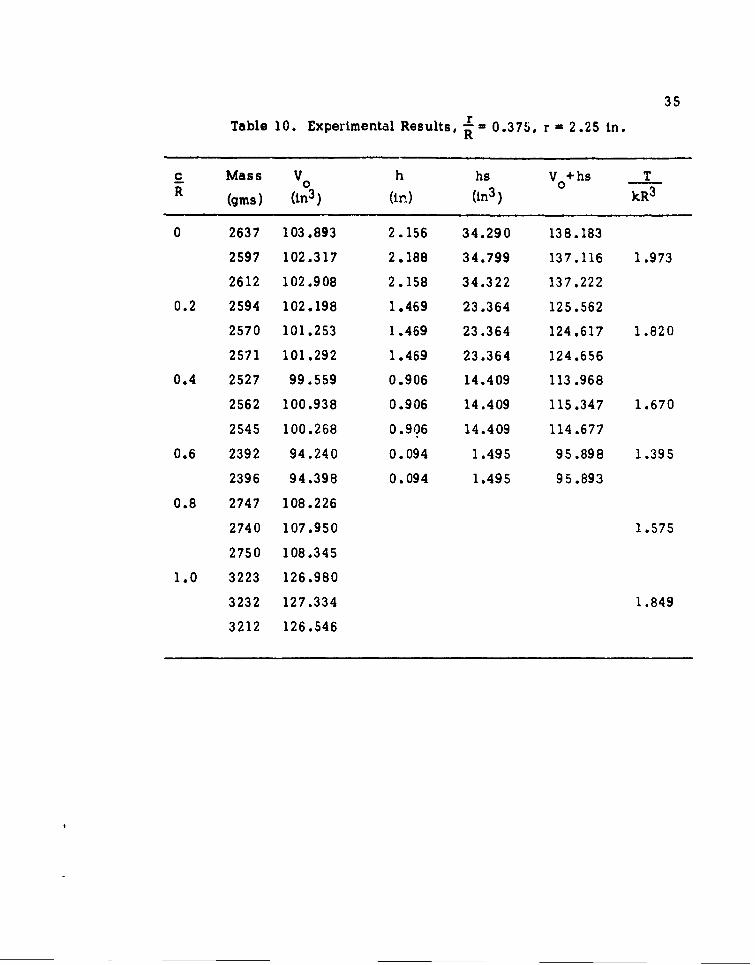
* 10. Experimental Results,-L - 0.3 75, r - 2.25 in *...... 35R
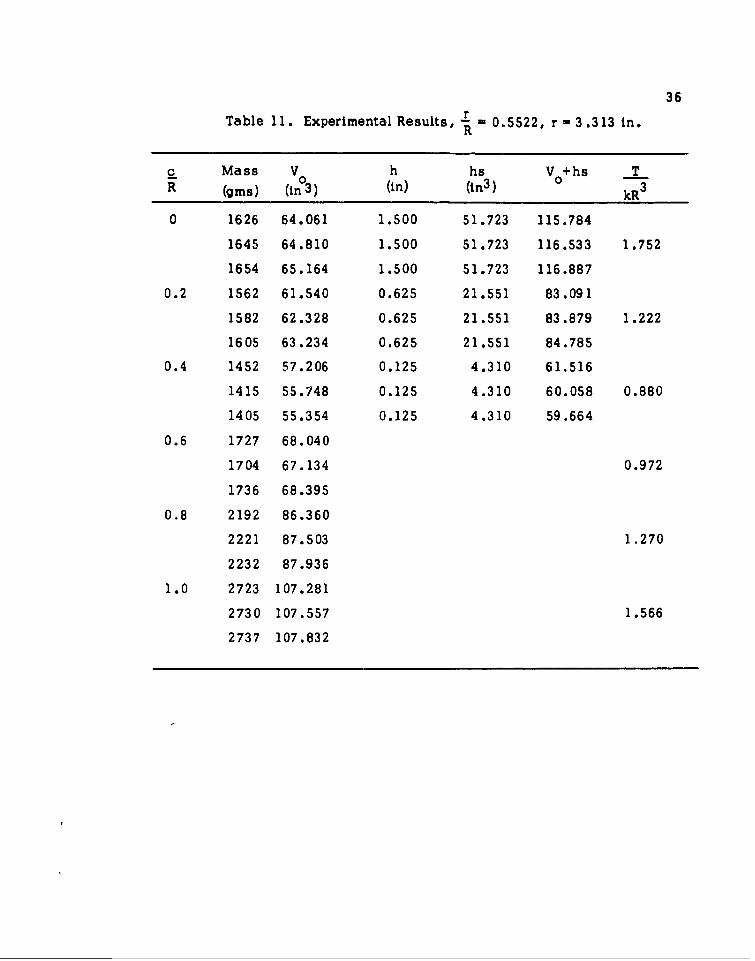
11. Experimental Results, L - 0.5522, r - 3.313 in ..... . 36R
vi
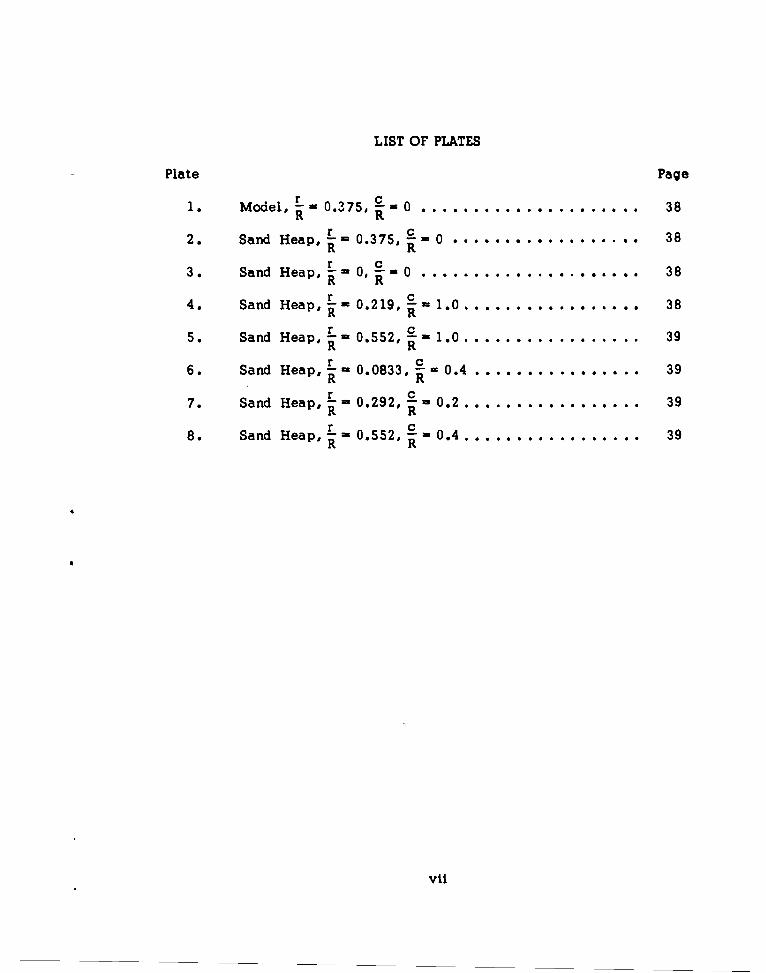
LIST OF PLATES
Plate Page
1. M odel, 0.375, 0 ..................... 38RR
2. Sand Heap, R= 0.375, R-0 .................. 38RR
3. Sand Heap, L 21 0 9, 0 ... .................. 38
R R4. Sand Heap, LR- 0.219, c - 1.0 .. .. .. .. .. .. .. . .. 38
5. Sand Heap, L = 0.552, 2-- 1.0 ...................... 39R * R
6. Sand Heap, L - 0.0833, R = 0.4 ....... . . . ..... 39R R
7. Sand Heap,- - 0.292, c = 0.2 ...................... 39R R
8. Sand Heap,L - 0.552, - = 0.4 . .. .. ........... 39R R
vii
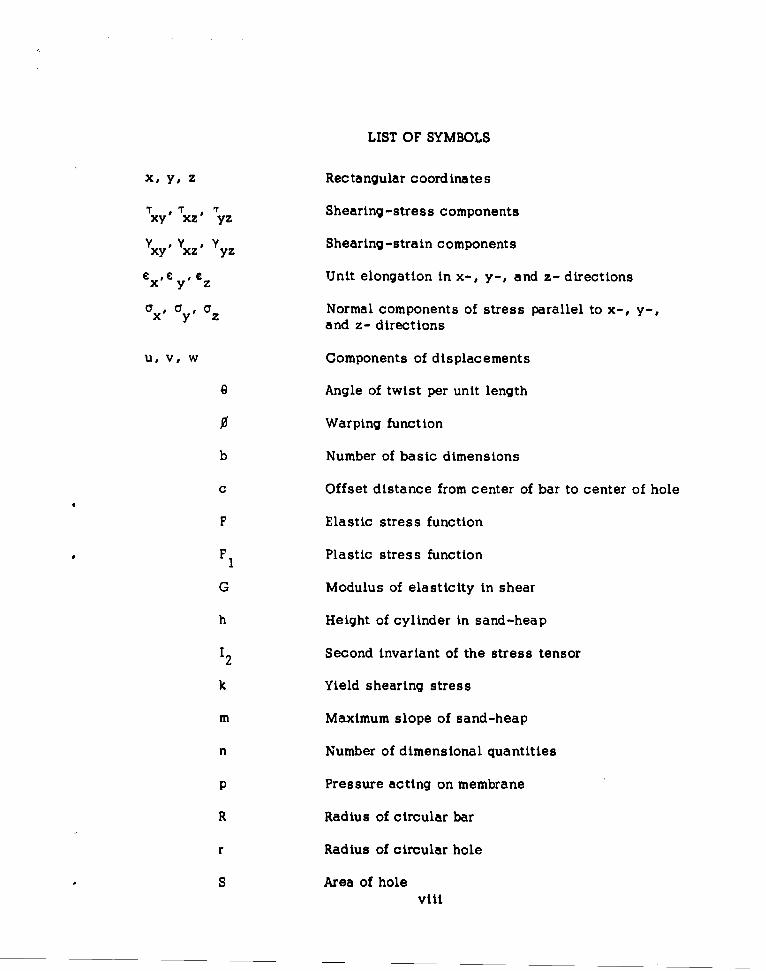
LIST OF SYMBOLS
x, y, z Rectangular coordinates
Txy'Tx' , T Shearing-stress components
y y Shearing-strain components
e 'Ce y' Iz Unit elongation in x-, y-, and z- directions
a x a y ,az Normal components of stress parallel to x-, y-,
and z- directions
U, V, w Components of displacements
0 Angle of twist per unit length
0 Warping function
b Number of basic dimensions
c Offset distance from center of bar to center of hole
F Elastic stress function
F1 Plastic stress function
G Modulus of elasticity in shear
h Height of cylinder in sand-heap
12 Second invariant of the stress tensor
k Yield shearing stress
m Maximum slope of sand-heap
n Number of dimensional quantities
p Pressure acting on membrane
R Radius of circular bar
r Radius of circular hole
S Area of holeviii
s Surface tension developed in membrane
s Number of non-dimensional Trterms
V Total volume
V0 Volume of sand on tray
T Torque
z Vertical deflection of membrane
ix
404685CHAPTER I
INTRODUCTION
In determining the shear stresses developed in a circular shaft by
the action of a twisting moment, the strength of materials approach pro-
vides an exact solution. One major assumption in this analysis is that
plane sections normal to the axis before twisting remain so after twisting.
This assumption is not valid for a non-circular prismatic bar or any
cross section with a non-concentric circular hole. The solution to this
problem is more difficult and considered in the theory of elasticity. As
will be shown, the theory of elasticity embodies a solution assuming a
linearly elastic material and involving the introduction of a stress function,
the appropriate derivatives of which define the shearing stresses. If the
particular stress function satisfies the conditions of equilibrium, boundary
conditions, and compatibility, the solution is mathematically unique.
As the torque is increased, material will pass from the elastic to
the plastic state. There is a limit to the ability of the cross section to
withstand increasing torque. This limit is called the plastic strength in
torsion; it represents that value of torque above which there is no resistance
to flow and complete failure results with continued deformation. At this
condition torque is no longer a function of rotation.
The purpose of this research was to investigate and predict the
plastic strength in torsion of circular prismatic bars with a concentric or
eccentric hole. 1
CHAPTER II
THEORY OF TORSION ANALOGIES
The Membrane Analogy for Elastic Torsion
Consider a cylindrical or prismatic bar of constant cross section
which is twisted and held in equilibrium by twisting moments applied at
its ends. The cross section of such a bar is shown in Figure 1. The bar
is considered to be composed of an isotropic material possessing the
idealized stress-strain relationship for an elastic, perfectly plastic
material shown in Figure 2.
Increasing torque causes the material to pass from the elastic
region (line AB, Figure 2) into the perfectly plastic range (line BC,
Figure 2). After a point in the cross section reaches the yield stress
in shear (point B), this maximum shearing stress remains a constant value
k as increasing torque causes an increase in the plastic region of the bar.
Before examining the plastic behavior of the prismatic cross section,
consider the stress characteristics in the elastic range.
The exact solution to the problem of elastic torsion of prismatic bars1*
was first postulated by Saint-Venant-in 1855. The displacements in the
x and y directions due to rotation of the cross sections are designated by
u and v, respectively. The warping of the cross section is denoted by w
and defined by the function 0. These displacements are assumed to be:2
* References cited are listed numerically at the end of this thesis.
2
3
0 X(-dx)
dy y•xz y )
N
y
Figure 1 Two-Dimensional View, Prismatic Cross SectionSubjected to Torsion.
B C
ShearStress max = k
IShear Strain
Figure 2. Idealized Shearing Stress-Strain Curve
4
u = -Ozy
v = Qzx
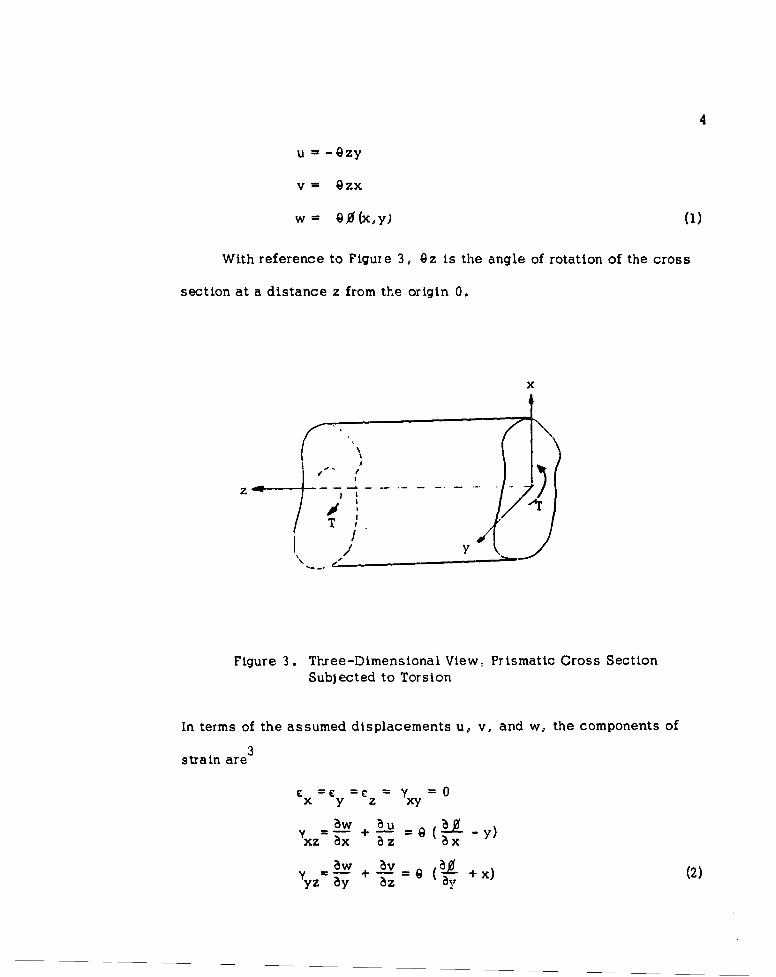
w= &0(x,y) (1)
With reference to Figure 3, Qz is the angle of rotation of the cross
section at a distance z from the origin 0.
x
'K A\
T .
y----- ---
Figure 3. Three-Dimensional View, Prismatic Cross SectionSubjected to Torsion
In terms of the assumed displacements u, v, and w, the components of3
strain are
= C • Y =0x y z xy
ý__ + au a _ y)aw au
S+ 4V + x) (2)yyz= a+ 7- a
5
The corresponding stresses as given by elasticity theory are
a =a 0- 'T =0x y z xy
T GY =G (__y)xz xzx
T =GY G 0 0 + x) (3)yz yz a
4As pointed out by Timoshenko, from the assumed displacements,
there will be no normal stresses acting between the longitudinal fibers of
the shaft or in the longitudinal directions of these fibers. At each point
in the cross section a condition cf pure shear, as defined by the stress
tensor of (4) nelow, exists.
xz0 0 Tx
yz
T T 0 (4)xz yz
From consideration of the equilibrium of forces acting on a rectangular
parallelepiped of sides dx, dy, and dz, the equilibrium equations, neglecting
body forces, reduce to5
6T T'xz + yz = 0
Ex (y
bT bTx.__z = 0, yz = 0 (5)
az ýz
Equation (3) satisfies the last two conditions of Equation (5).
66
The vital step in the analysis, according to Den Hartog, is the
assumption by Saint-Venant that there is a function F (xy) such that the
stresses may be found from it by differentiation, that is:
a F bF (6)xz by yz bx
The expression F (x,y) is called the elastic stress function. Substitution
of the expressions of Equations (6) into (3) yields
T G x y),- -)x = GQ (y+x) (7)8y Cx bx 2
Differentiating the first expression cf Equations (7) with respect to y, the
second expression with respect to x, and subtracting from the first yields
the following partial differential equation in terms of the elastic stress
function F
b2F + B2 F 22+ 2 2G0 (8)
bx 2 by 2
Equation (8) must satisfy the boundary condition that the resultant
shearing stress at the boundary is directed along the tangent to the7
boundary, that is
d-(+ T _x9)xz ds yz ds
where (see Figure 1), cos (N,x)= and cos (N,y) = _- . In termsds ds
of the elastic stress function F, Equation (9) becomes
bF d_ + BF dx = dF (10)by ds Fx ds ds
7
Since the total derivative of the elastic stress function F with respect to the
boundary distance s is zero, the elastic stress function F is constant along
the boundary of the cross section.
The twisting moment T, with reference to Figure 1, is expressed by
the double integral
T= ý(Tyz X-rxzy) dxdy (1)
If the constant value of the stress function F on the boundary curve y =f(X)
of the cross section is taken equal to zero, as may be done for singly
connected boundaries, integration of Equation (11) yields 8
T= 2SS Fdxdy (12)
As Murphy indicates., 9 the actual determination of the stress function
as defined by Equation (8) for all but a few relatively simple cross sections
becomes difficult, if not impossible, to determine analytically.
Quantitative solutions to the differential Equation (81 however, can
be obtained by use of the membrane analogy. Prandtl observed in 1903 that
the equation (8) of the elastic stress function is the same as the differential
equation for the shape of a stretched membrane, originally flat, which is
inflated by air pressure from below. This equation, as derived from the
equilibrium of forces when summed in the direction z, is10
b2 22 + 2 p (13)ax 2 ay 2 s
8
In Equation (13) z is the deflection of the membrane, p is the pressure acting
on the membrane, and s is the surface tension developed in the membrane.
Equation (8), the differential equation of elastic torsion, is identical in
form to Equation (13) if
2 = 2GO (14)s
If in addition the boundary conditions are satisfied, the deflection z w-i+l
equal F (x,y), the elastic stress function. In summary, the stress function
F(x,y) is represented by the curved surface of the membrane and the con-
tour lines of the surface represent the stress lines of the elastically
twisted cross section. The tangent in the xy plane to any contour line of
the membrane is in the direction of the resultant shearing stress T . The
stress is proportional to the slope of the stress surface F (x,y). The
twisting moment T is equal to twice the volume enclosed by the stress sur-
fac e.
These characteristics of the membrane analogy have permitted exten-
sive quantitative measurements of the stresses in a twisted bar within the
elastic range. Griffith and Hetenyi12 outline applications of the membrane
analogy.
The Sand-Heap Analogy for Plastic Torsion
If the cross section of Figure 1 is twisted beyond the yield point,
certain parts of the bar will be deformed plastically. The condition at which
9
plastic deformation commences is, according to Prager, 13 expressed by
2I1 - k = 0 (15)
where 12 is the second invariant of the stress tensor. It is independent of
the orientation of the coordinate axes. 12 is expressed by (see Reference 14)22
2 +o o + a )+ 2 + 2+T 2(16)2 yx 'z zI x xy yz zx
The condition of stress in torsionas represented by the stress tensor of
(4) produces, when substituted in the condition of plasticity of Equation (15),
2 + T 2= k2 = constant (17)xz yz
The yield condition of Equation (15) was first postulated by Von Mises 1 5
but its most widely known physical interpretation is embodied in the
octahedral shearing stress theory introduced by Nadai.1 6
The equilibrium equations (5) must be satisfied in the plastic as well
17as elastic region. As noted by Nadai , Equations (5) are satisfied if
bF 1 (x, Y) b F1I(x, y)T = , =- (18)
xz a y yz ax
in which F1 (x,y) represents the plastic stress function of the cross section.
In those regions of the cross section where plastic flow occurs the con-
dition of plasticity of Equation (17), in terms of the plastic stress function,
is 2 2
-ax + 2(19)
10
The left side of Equation (19) is the square of the largest slope of the sur-
face FI. From the mathematical definition of the gradient, Equation (19)
may be expressed as
Igrad F = k = constant (20)
where k is the maximum shearing stress shown in Figure 2o
As in the case of the elastic stress function F, the shearing stresses
are directed tangentially to the contour lines of the plastic stress surface,
The surface representing this plastic stress function may be thought of as
the maximum value that the elastic stress function can attain. The plastic
stress function may be considered as a "roof" under which the membrane,
geometrically the same as the cross section, expands. When the membrane
touches the "roof," the condition of plasticity of Equation (17) is satisfied
and plastic yielding begins at that point in the cross section. As the torque
is increased, as represented by increasing air pressure on the membrane,
the membrane expands and touches more of the "roof ." At the limit the
membrane fills the entire volume under the roof. The cross section is con-
sidered to have attained a fully plastic state. Following the membrane
analogy, the torque required to achieve the fully plastic state is equal to
twice the volume under the "roof."
The mathematical and physical interpretation of the plastic stress
function F (x,y) for the case of complete yicling, of the entire prismatic
bar can be demonstrated by sand heaps covering a plate similar in cross
section to the twisted bar. This analogy was first presented by Nadai at
11
a meeting of the German Society of Applied Mathematics and Mechanics in
Marburg, Germany in 1923.
18As described by Sadowsky, .. ."A plate whose shape is geometrically
similar to the cross section of the twisted bar series as a horizontal tray
to hold a heap of dry uniform sand. The heap is to be as big as it is pos-
sible to pile by pouring a gentle stream of sand on top of the model, the
excessive sand rolling freely down the slopes of the heap and falling off
the elevated tray. The maximum-size heap being formed, its volume V is
determined by weighing..." The twisting moment T in plastic torsion is
now given by the equation
T = 2 - V (21)m
in which k is the maximum value of the shearing stress in Figure 2 and m
is the maximum value of the slope of the lateral surface of the sand heap.
In addition, the horizontal lines of the heap, projected vertically down on
the supporting tray, give the system of trajectories of the maximum
shearing stress k acting upon the cross section.
19As pointed out by Murphy, the relative strength of cross sections
of different shapes may be determined through use of the sand-heap
analogy. It is the purpose of this investigation to evaluate the effect of
circular holes, of varying size and location, upon the capability of a cir-
culer cross section to sustain plastic torsion. The sand-heap analogy as
developed by Nadaiandas modified by Sadowsky to include holes will
be used.
12
The Sand-Heap Analogy Applied to Cross Sections with Holes
The twisting moment T, as given by Equation (21) is applicable to
cross sections with and without holes. However, in carrying out the
experiment it can be visualized that even the presence of a small hole in
the cross section will permit an excessively large amount of sand to flow
through it. The volume of sand remaining on the tray would not therefore
be proportional to the torque required to obtain a fully plastic condition
in the cross section. 2 0
Therefore, Sadowsky in 1941 modified Nadai's original analogy.
If the cross section has holes, similar holes must be made in the sup-
porting tray. In order to prevent the sand from flowing out through these
holes, cylinders capable of vertical movement must be inserted into the
holes. To hold the tray and to insure vertical travel a device as shown
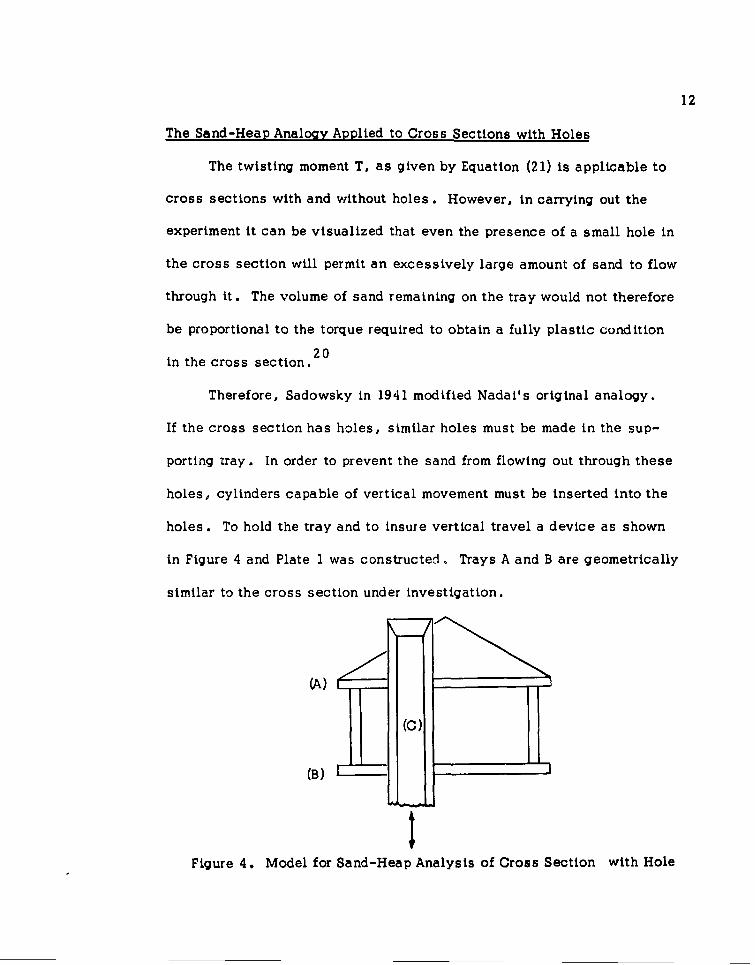
in Figure 4 and Plate I was constructed. Trays A and B are geometrically
similar to the cross section under investigation.
(A)
(B)
Figure 4. Model for Sand-Heap Analysis of Cross Section with Hole
13
It is important that the top of cylinder C be kept horizontal and its inner
conical edges be sharpened so that a grain of sand placed on this edge will
fall through the cylinder.
At the beginning of the experiment, the cylinder C is moved into a
position as high as possible and a maximum sand heap is formed on the
upper tray only. At this stage the cylinder is free of sand standing above
the sand heap. After the maximum heap is formed, as shown in Figure 4,
the cylinder is gradually lowered. At a certain position the top of the
cylinder will reach the surface of the heap and the sand will commence to
fall through the top of the cylinder. The lowering of the cylinder will con-
tinue until the brim of the cylinder is completely submerged in the sand.
In the final position, the cylinder is at the maximum height at which no
part of its lateral surface will protrude from the heap and be visibly
exposed. Although extremely complicated mathematical surfaces may be
formed in three-dimensional sand heaps, the geometric problem solves
itself through the medium of the sand. This procedure applies as well to
cross sections with more than one hole.
Designate V as the volume of the sand remaining on the tray after0
the cylinder or cylinders have been lowered. Let S1 , S2 ... Sn be the
areas of the holes, with depths h 1 , h2 , ... hn - as measured from the
level of the tray up to the top of the cylindrical opening. Then the volume
V as defined by Equation (21) is
14
V-Vo +Sh 1 +S2h2+'..Snhn (22)
The twisting moment T is therefore given by
T-2; (V +S h1 +S 2 h2 + ... S h (23)
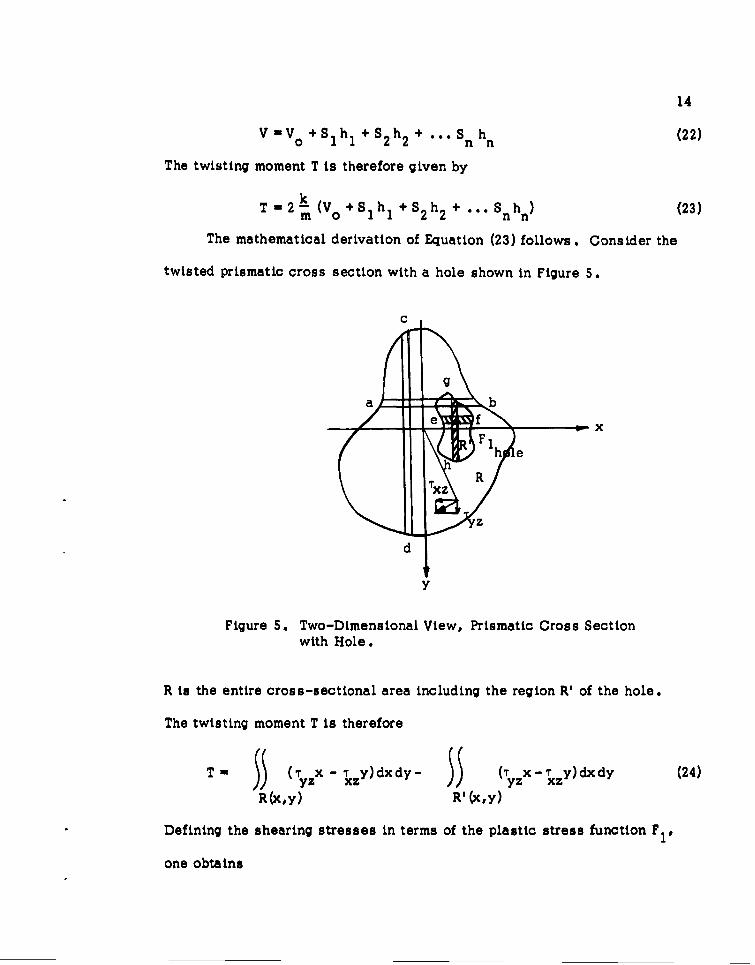
The mathematical derivation of Equation (23) follows. Consider the
twisted prismatic cross section with a hole shown in Figure 5.
Ca•• bg
a - be f --OF, e
Fh e
Ty R
zz
d
y
Figure 5.* Two-Dimensional View, Prismatic Cross Sectionwith Hole.
R is the entire cross-sectional area including the region RI of the hole.
The twisting moment T is therefore
T (T (X - T y)dxdy- (T X-T y)dxdy (24)/, yz xz ii yz xz
R (xy) R'(x, y)
Defining the shearing stresses in terms of the plastic stress function F1,
one obtains
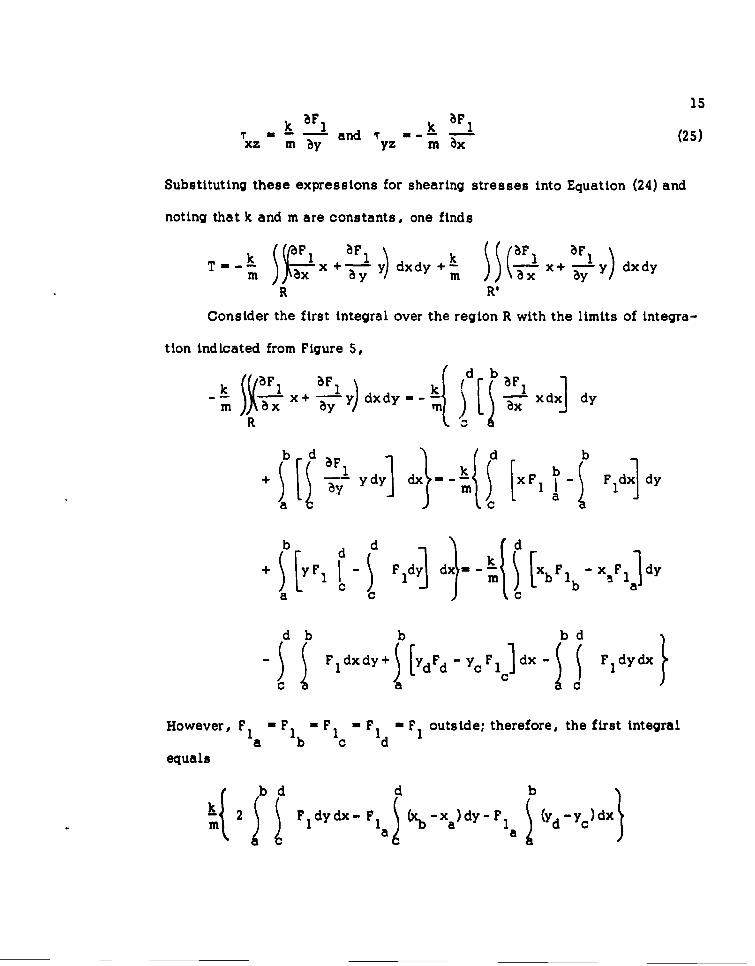
15k BF1I k bF 1
xz- -and yz m x (25)
Substituting these expressions for shearing stresses into Equation (24) and
noting that k and m are constants, one finds
T =- -~ 2.X +.L'y~) dxdy+h' (BF 1x + iL y) dx dym )'x ýY m Bx b
R R'
Consider the first integral over the region R with the limits of integra-
tion indicated from Figure 5,
I ý aFIX+ ýy-'Y) dxd kla UIxR
+ b bdy] dx d [xF bd F dldy
I a Cc a a
equals
2 5 b dX_ dy-xFa (yd -yok db
c aac
d b 16
But 5 (xbxa)dy (Yd --Yc)dx-A, theareaofregionR.
C
Therefore, the first integral equals
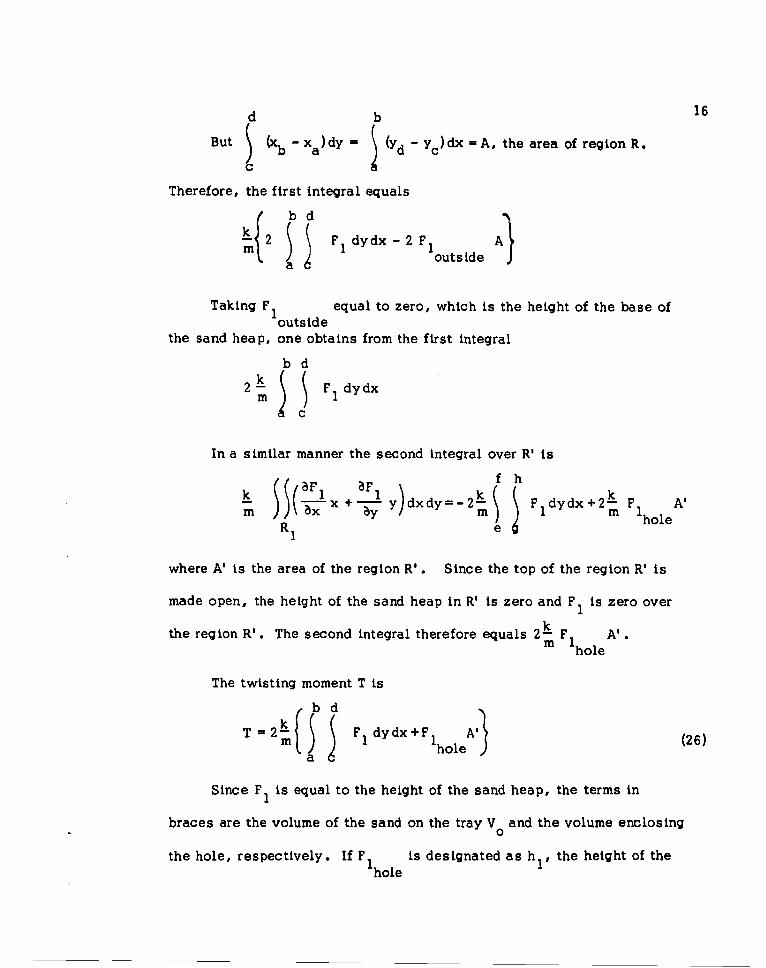
k{2 F 1 dydx - 2 Fo AIn loutside
Taking F1 equal to zero, which is the height of the base ofoutside
the sand heap, one obtains from the first integral
b d
2 i F1 dydx
c
In a similar manner the second integral over R' is
k ý((F IF, kf hm 1x +- 1 y 1dxdy=- mFlhole A-
m Rj L ax byMI hole
where A' is the area of the region R'. Since the top of the region R' is
made open, the height of the sand heap in R' is zero and F1 is zero over
the region R'. The second integral therefore equals 2-- F A'm 1hole
The twisting moment T is
m I 1dd lhole (26)a
Since F1 is equal to the height of the sand heap, the terms in
braces are the volume of the sand on the tray V and the volume enclosing0
the hole, respectively. If Flhl is designated as h1 , the height of the
17
sand heap at the hole, it follows that the twisting moment T as expressed by
Equation (23) and Equation (26) are equal for a cross section with one hole.
For this case
T = 21i V + h 1 S} (27)
This relationship will be used directly for this analysis.
CHAPTER III
DIMENSIONAL ANALYSIS
In order for the results to be of general application, use was made
of the Buckingham Trtheorem to present the experimental results in non-
dimensional form. The Buckingham Tr theorem states that the number of
dimensionless and independent quantities required to express a relation-
ship among the variables in any phenomenon is equal to the number of
quantities involved minus the number of dimensions in which these quan-
tities may be measured. That is, s = n - b, where s is the number of T
terms, n is the total number of quantities involved, and b is the number of
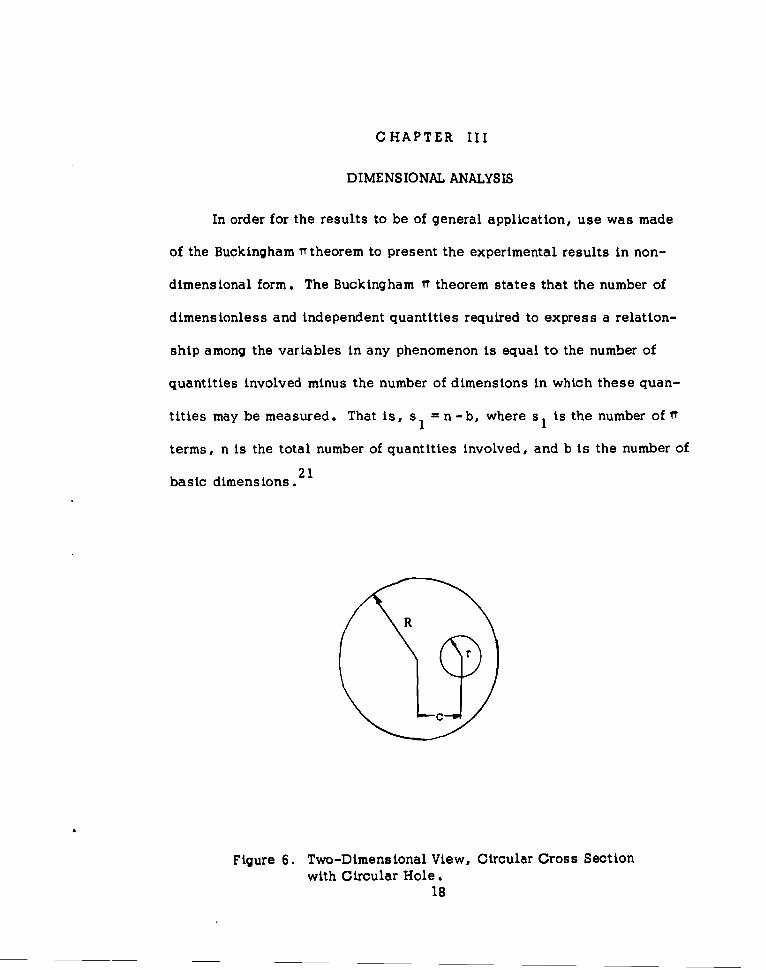
basic dimensions. 21
Figure 6. Two-Dimensional View, Circular Cross Sectionwith Circular Hole.
18
19
For this case (see Figure 6) choose
T f (k, R, r, c) (la)
Dimensionally
T = twisting moment A (FL)
k = maximum shearing stress A (FL- )
R = radius of circular cross section - (L)
r = radius of circular hole _ (L)
c = distance from center of hole to center of crosssection & (L)
Since
s= n-b=5 -2=3
Three TT terms are necessary to describe twisting moment behavior of the
cross section in plastic torsion.
From Equation (la) where A denotes dimensional equivalence
a bc d e1 " (T) (r) (c) (R) (k)
Dimensionally
1 1(FL)a (L)b(L)c (L)d (FL- 2 )e
F: 0- a+e
L: 0A a +b+c +d-2e
Since there are two independent equations in five unknowns,
evaluate d and e in terms of a, b, and c:

20
e - -a
d = -3a - b - c
Therefore
ba bc -3a - b -c (k)-aI (T)_(r) (C) (R)
(--)a (I)b (c)R~k
Expressed functionally,
)=f ( (c.R~k
The experimental results will therefore be expressed in the three non-T r c
dimensional 1T terms of T r RR 3k R ' R
CHAPTER IV
EXPERIMENTAL PROCEDURES
Prior to investigating the effect of a circular hole on the plastic
strength in torsion of a circular section, sections whose plastic stress
function equation were known were investigated. Circular, square, and
rectangular cross sections were tested to verify experimental techniques
The results are contained in the Appendix.
The sand used was Ottawa sand, American Society Testing Materials
designation C-190, produced by the Ottawa Silica Company, Ottawa,
Illinois. Of uniform composition its specific volume was determined as
the arithmetic mean of ten measurements to be 39.398 cubic inches per
kilogram.
Its slope m was determined to be 0.636. The volume V was deter-0
mined by measuring the mass of sand remaining on the tray. The height of
the circular cylinder h was also measured.
The value of - was determined using Equation (27) in terms of thekR
3
sand-heap analogy. In order to measure the effect of varying size and
location of the hole, the radius of the hole was varied as follows: r = 0.25 in.,
0.50 in., 0.75 in., 0.875 in., 1.125 in., 1.313 in., 1.50 in.,
1.750 in., 2.0 in., 2.250 in., and 3.313 in. The radius of the circular
cross section R was constant at six in. The offset c varied as follows:
c = 1.2 in., 2.4 in., 3.6 in., 4.8 in., and 6.0 in.
Plates 1 through 8 (see Appendix) picture the model and several sand
heaps formed. 21
CHAPTER V
RESULTS AND CONCLUSIONS
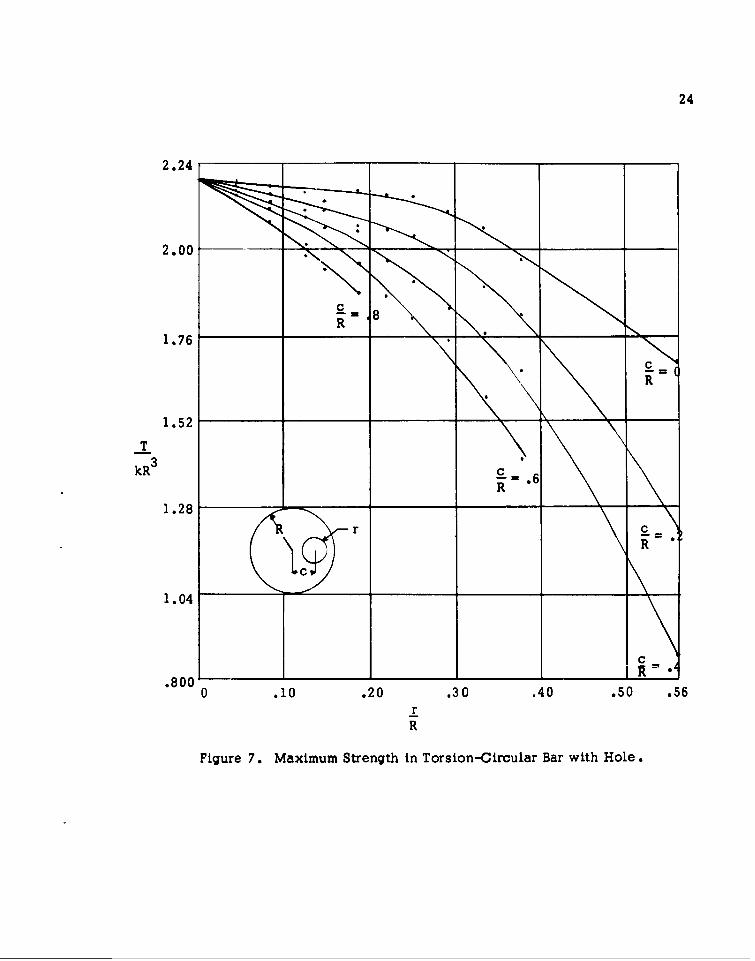
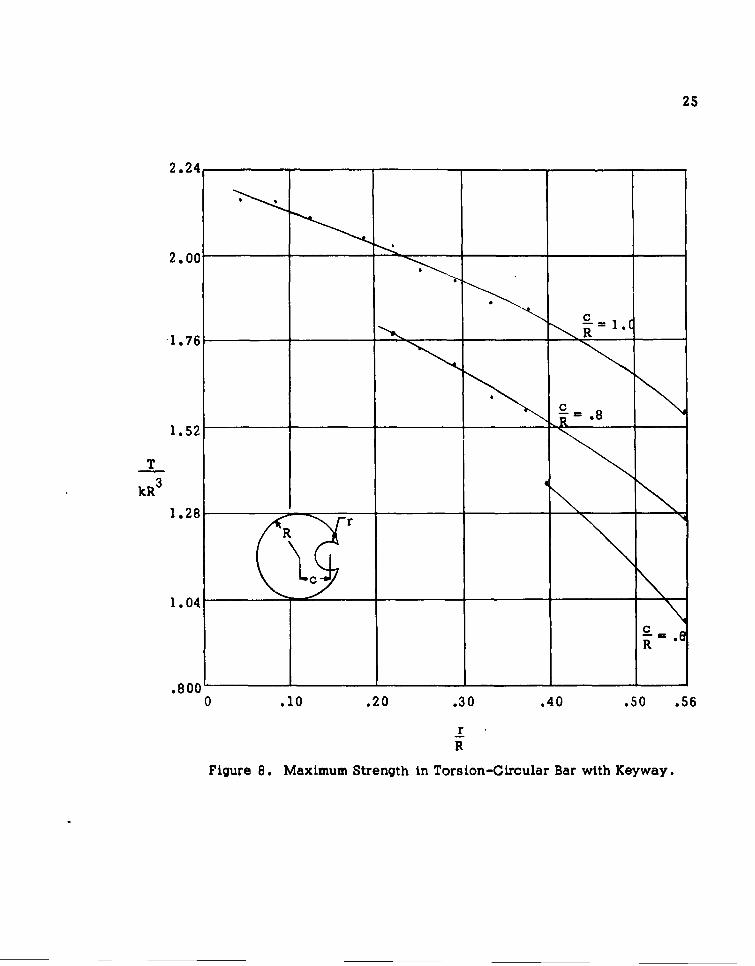
Results are shown in Figures 7 and 8. The data for each size hole and
keyway are tabulated in Tables I through 11. Figure 7 shows the maximum
strength in torsion when the circular shaft has an interior hole. Figure 8
predicts the maximum strength in torsion of a circular sbhat with a keyway.
It is noted in the tables that when the offset distance c has increased to
where the hole has become a keyway, the region becomes singly connected
and the stress function is taken as zero about the keyway circumference.
The curves are used in the following manner. Knowing the size r,T
location c, and radius of the cross section R, the value -- is determinedkR
3
if L < 0.56. The yield stress k is determined from the shearing stress-R -
strain curve of the material. The value of T, the maximum strength in
torsion, is then determined in the appropriate dimensions of k and R.
With the exception of mild steel, which behaves very nearly as a22
perfectly plastic material at the beginning of strain hardening, the
material possessing the characteristics of Figure 2 are rarely found. How-
ever, depending on the degree of conservativeness desired in the design
and the specific material characteristics, an idealization of the shearing
stress-strain curve can be made to determine the value k.
The above analysis assumes that the shearing strains remain small
in order that no components of normal stresses act in sections normal or
parallel to the axis of the bar. 23
22
23
Mindful of these assumptions and resulting limitations, Figures 7 and
8 can be used in predicting the maximum strength in torsion of circular
cross sections with holes.
24
2.24
R1.76
1.52
kR3
R 6
1.28
1 .04
.8000 .10 .20 .30 .40 .50 .56
rR
Figure 7. Maximum Strength in Torsion-Circular Bar with Hole.
25
2.24
2.00
-1.76R
1.52
T R.kR3
1.28Rr
1.04
R
.8000 .10 .20 .30 .40 .50 .56
r
R
Figure 8. Maximum Strength in Torsion-Circular Bar with Keyway.
26
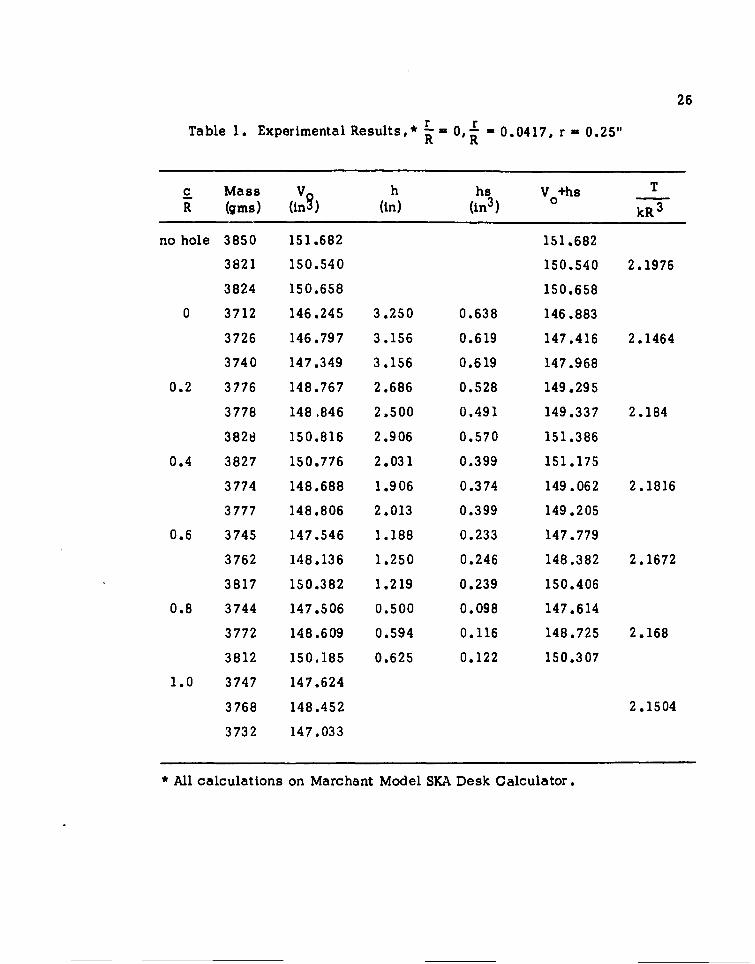
Table 1. Experimental Results,* L 0,! - 0.0417, r = 0.25"
R R
c Mass V h hs V +hs T
R (gms) (in0) (in) (in3 ) 0 kR 3
no hole 3850 151.682 151.682
3821 150.540 150.540 2.1976
3824 150.658 150.658
0 3712 146.245 3.250 0.638 146.883
3726 146.797 3.156 0.619 147.416 2.1464
3740 147.349 3.156 0.619 147.968
0.2 3776 148.767 2.686 0.528 149.295
3778 148,846 2.500 0.491 149.337 2.184
3828 150.816 2.906 0.570 151.386
0.4 3827 150.776 2.031 0.399 151.175
3774 148.688 1.906 0.374 149.062 2.1816
3777 148.806 2.013 0.399 149.205
0.6 3745 147.546 1.188 0.233 147.779
3762 148.136 1.250 0.246 148.382 2.1672
3817 150.382 1.219 0.239 150.406
0.8 3744 147.506 0.500 0.098 147.614
3772 148.609 0.594 0.116 148.725 2.168
3812 150.185 0.625 0.122 150.307
1.0 3747 147.624
3768 148.452 2.1504
3732 147.033
* All calculations on Marchant Model SKA Desk Calculator.
27
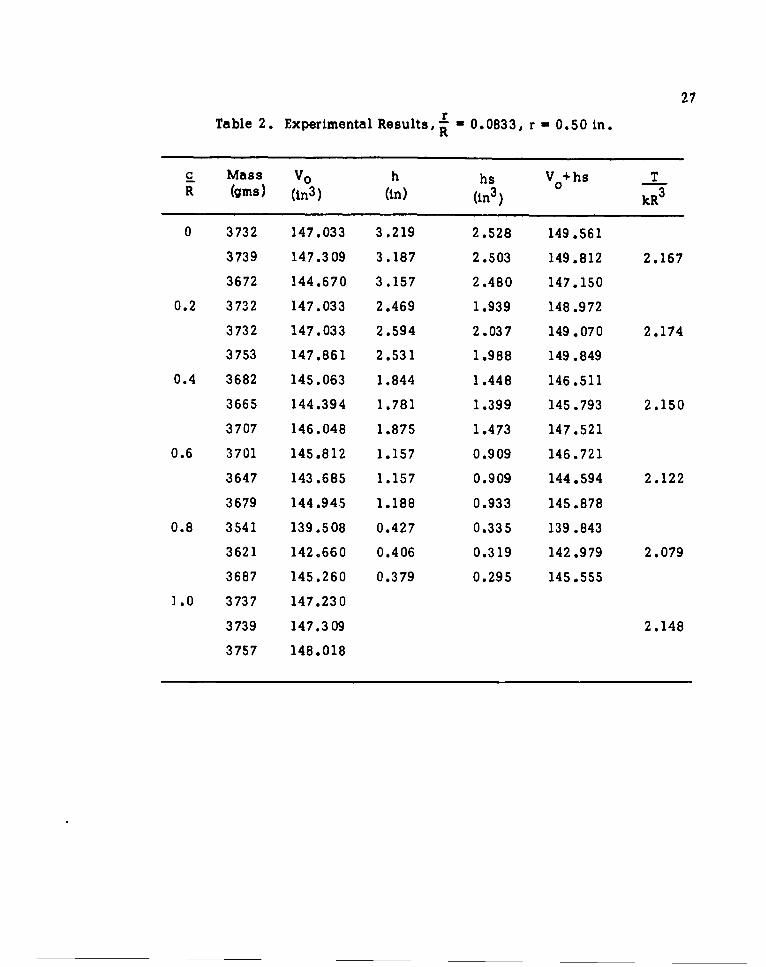
Table 2. Experimental Results,s - 0.0833, r - 0.50 in.
c Mass Vo h hs V +hs TR (gins) (0n3) (in) (in 3 ) kR3
0 3732 147.033 3.219 2.528 149.561
3739 147.309 3.187 2.503 149.812 2.167
3672 144.670 3.157 2.480 147.150
0.2 3732 147.033 2.469 1.939 148.972
3732 147.033 2.594 2.037 149.070 2.174
3753 147.861 2.531 1.988 149.849
0.4 3682 145.063 1.844 1.448 146.511
3665 144.394 1.781 1.399 145.793 2.150
3707 146.048 1.875 1.473 147.521
0.6 3701 145.812 1.157 0.909 146.721
3647 143.685 1.157 0.909 144.594 2.122
3679 144.945 1.188 0.933 145.878
0.8 3541 139.508 0.427 0.335 139.843
3621 142.660 0.406 0.319 142.979 2.079
3687 145.260 0.379 0.295 145.555
1.0 3737 147.230
3739 147.309 2.148
3757 148.018
28
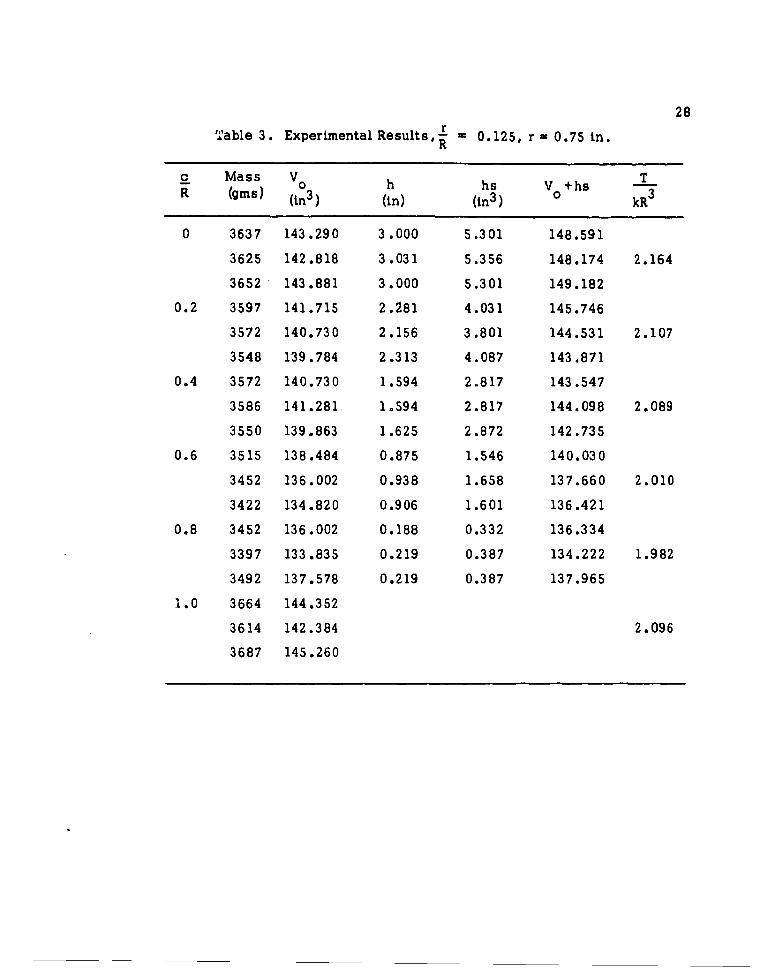
Table 3. Experimental Results,- 0.125, r - 0.75 in.R
c Mass V0 h hs V +hs TR (gins) (in 3 ) (in) (in3 ) 0 kR3
0 3637 143.290 3.000 5.301 148.591
3625 142.818 3.031 5.356 148.174 2.164
3652 143.881 3.000 5.301 149.182
0.2 3597 141.715 2.281 4.031 145.746
3572 140.730 2.156 3.801 144.531 2.107
3548 139.784 2.313 4.087 143.871
0.4 3572 140.730 1.594 2.817 143.547
3586 141.281 1.594 2.817 144.098 2.089
3550 139.863 1.625 2.872 142.735
0.6 3515 138.484 0.875 1.546 140.030
3452 136.002 0.938 1.658 137.660 2.010
3422 134.820 0.906 1.601 136.421
0.8 3452 136.002 0.188 0.332 136.334
3397 133.835 0.219 0.387 134.222 1.982
3492 137.578 0.219 0.387 137.965
1.0 3664 144.352
3614 142.384 2.096
3687 145.260
29
Table 4. Experimental Results, - 0.146, r - 0.875 in.R
c Mass V0 h hs V0 +hs TR (gins) (in3 ) (in) (in 3 ) kR3
0 3520 138.681 2.969 7.141 145.822
3577 140.926 2.875 6.916 147.842 2.1334
3529 139.034 2.875 6.916 145.950
0.2 3572 140.730 2.156 5.186 145.916
3560 140.257 2.344 5.638 145.895 2.120
3538 139.390 2.344 5.638 145.028
0.4 3542 139.948 1.531 3.683 143.631
3450 135.923 1.594 3.834 139.757 2.060
3480 137.105 1.656 3.983 141.088
0.6 3409 134.308 0.937 2.254 136.562
3467 136.593 0.937 2.254 138.847 2.006
3444 135.687 0.906 2.180 137.867
0.8 3442 135.608 0.188 0.452 136.060
3352 132.062 0.188 0.452 132.514 1.942
3340 131.590 0.188 0.452 131.635
1.0 3635 143.212
3567 140.533 2.074
3645 143.606
30
Table 5. Experimental Results, L - 0.188, r - 1.125 in.'R
c Mass V0 h hs Vo+hs TR (gins) (in 3) (in) (id) kR3
0 3496 137.735 2.938 11.681 149.416
3477 136.987 2.938 11.681 148.668 2.166
3472 136.790 2.875 11.431 148.221
0.2 3502 137.972 2.500 9.940 147.912
3527 138.956 2.500 9.940 148.896 2.145
3432 135.214 2.500 9.940 145.154
0.4 3419 134.702 1.563 6.214 140.916
3492 137.578 1.594 6.338 143.916 2.067
3426 134.978 1.531 6.087 141.065
0.6 3394 132.717 0.750 2.982 136.689
3352 132.062 0.718 2.855 134.917 1.965
3310 130.407 0.718 2.855 133.262
0.8 3292 129.698 0.0312 0.124 129.822
3294 129.777 0.0312 0.124 129.901 1.884
3257 128.319 0.0312 0.124 128.443
1.0 3522 138.760
3602 141.911 2.049
3592 141.517
31
Table 6. Experimental Results, I - 0.219, r - 1.313 in.
R
C Mass V h hs V +hs TR0 0(gms) (in3 ) (in) (in 3 ) kR3
0 3384 133.323 2.656 14.385 147.708
3362 132.456 2.750 14.894 147.350 2.150
3385 133.362 2.687 14.553 147.915
0.2 3285 129.422 2.031 11.000 140.422
3331 131.235 2.031 11.000 142.235 2.056
3297 129.895 2.031 11.000 140.895
0.4 3266 128.674 1.406 7.615 136.289
3237 127.531 1.406 7.615 135.146 1.972
3232 127.334 1.406 7.615 134.949
0.6 3182 125.364 0.656 3.553 128.917
3126 123.158 0.656 3.553 126.711 1.869
3197 125.955 0.687 3.553 129.508
0.8 3097 122.016
3132 123.395 1.791
3137 123.592
1.0 3564 140.414
3506 138.129 2.026
3519 138.646
32
Table 7. Experimental Results, x - 0.250, r - 1.500 In.
C Mass Vo h hs Vo+hs TR (gms) (in 3) (in) (tn3 ) kR 3
0 3292 129.699 2.625 18.555 148.254
3275 129.028 2.719 19.220 148.250 2.152
3262 128.516 2.594 18.336 146.852
0.2 3205 126.271 2.063 14.583 140.854
3177 125.167 2.000 14.137 139.304 2.044
3209 126.428 2.063 14.583 141.011
0.4 3117 122.804 1.313 9.281 132.085
3096 121.976 1.344 9.500 131.476 1.912
3087 121.622 1.219 8.617 130.239
0.6 3107 122.409 0.656 4.637 127.046
3042 119.849 0.594 4.199 124.048 1.810
2994 117.958 0.563 3.980 121.938
0.8 3022 119.061
3032 119.455 1.745
3069 120.912
1.0 3414 134.505
3395 133.756 1.960
3442 135.608
33r
Table 8. Experimental Results,- 0.292, r - 1.750R
c Mass Vo h hs Vo + hs TR (gins) (in3 ) (in) (in3) ks3
0 3054 120.321 2.406 23.149 143.470
3098 122.055 2.500 24.053 146.1OP 2.100
3028 119.297 2.469 23.755 143.052
0.2 2987 117.682 1.844 17.741 135.423
3071 120.991 1.865 17.944 138.935 1.998
3022 119.061 1.906 18.338 137.399
0.4 2917 114.924 1.094 10.526 125.450
2954 116.382 1.094 10.526 126.908 1.838
2943 115.948 1.094 10.526 126.474
0.6 2909 114.609 0.500 4.811 119.420
2922 115.121 0.500 4.811 119.932 1.745
2929 115.397 0.500 4.811 120.208
0.8 2968 116.933
2966 118.036 1.700
2928 115.357
1.0 3358 132.298
3370 132.771 1.930
3364 132.535
34
Table 9. Experimental Results, s- 0.333, r - 2.0 in.
c Mass V h hs Vo+hs TR (gms) (tA) (in) (in3 ) kR3
0 2837 111.772 2.281 28.664 140.436
2824 111.260 2.250 28.274 139.534 2.038
2823 111.221 2.281 28.664 139.885
0.2 2793 110.039 1.687 21.200 131.239
2742 108.029 1.687 21.200 129.229 1.893
2741 107.990 1.719 21.602 129.592
0.4 2789 109.881 1.000 12.566 122.447
2772 109.221 1.000 12.566 121.787 1.772
2758 108.660 0.969 12.177 120.837
0.6 2692 106.059 0.375 4.712 110.771
2659 104.759 0.344 4.323 109.082 1.596
2667 105.074 0.313 3.933 109.007
0.8 2789 109.881
2838 111.812 1,613
2807 110.590
1.0 3287 129.501
3254 128.201 1.869
3231 127.295
35
Table 10. Experimental Results, 0.375, r - 2.25 in.
c Mass VO h hs Vo+hs TR (gins) (in3 ) (in) (in 3 ) kR3
0 2637 103.893 2.156 34.290 138.183
2597 102.317 2.188 34.799 137.116 1.973
2612 102.908 2.158 34.322 137.222
0.2 2594 102.198 1.469 23.364 125.562
2570 101.253 1.469 23.364 124.617 1.820
2571 101.292 1.469 23.364 124.656
0.4 2527 99.559 0.906 14.409 113.968
2562 100.938 0.906 14.409 115.347 1.670
2545 100.268 0.906 14.409 114.677
0.6 2392 94.240 0.094 1.495 95.898 1.395
2396 94.398 0.094 1.495 95.893
0.8 2747 108.226
2740 107.950 1.575
2750 108.345
1.0 3223 126.980
3232 127.334 1.849
3212 126.546
36
Table 11. Experimental Results, 0.5522, r - 3.313 in.
c Mass V h hs V +hs TR (gms) (in°3) (in) (0n) o-kR 3
0 1626 64.061 1.500 51.723 115.784
1645 64.810 1.500 51.723 116.533 1.752
1654 65.164 1.500 51.723 116.887
0.2 1562 61.540 0.625 21.551 83.091
1582 62.328 0.625 21.551 83.879 1.222
1605 63.234 0.625 21.551 84.785
0.4 1452 57.206 0.125 4.310 61.516
1415 55.748 0.125 4.310 60.058 0.880
1405 55.354 0.125 4.310 59.664
0.6 1727 68.040
1704 67.134 0.972
1736 68.395
0.8 2192 86.360
2221 87.503 1.270
2232 87.936
1.0 2723 107.281
2730 107.557 1.566
2737 107.832

APPENDIX
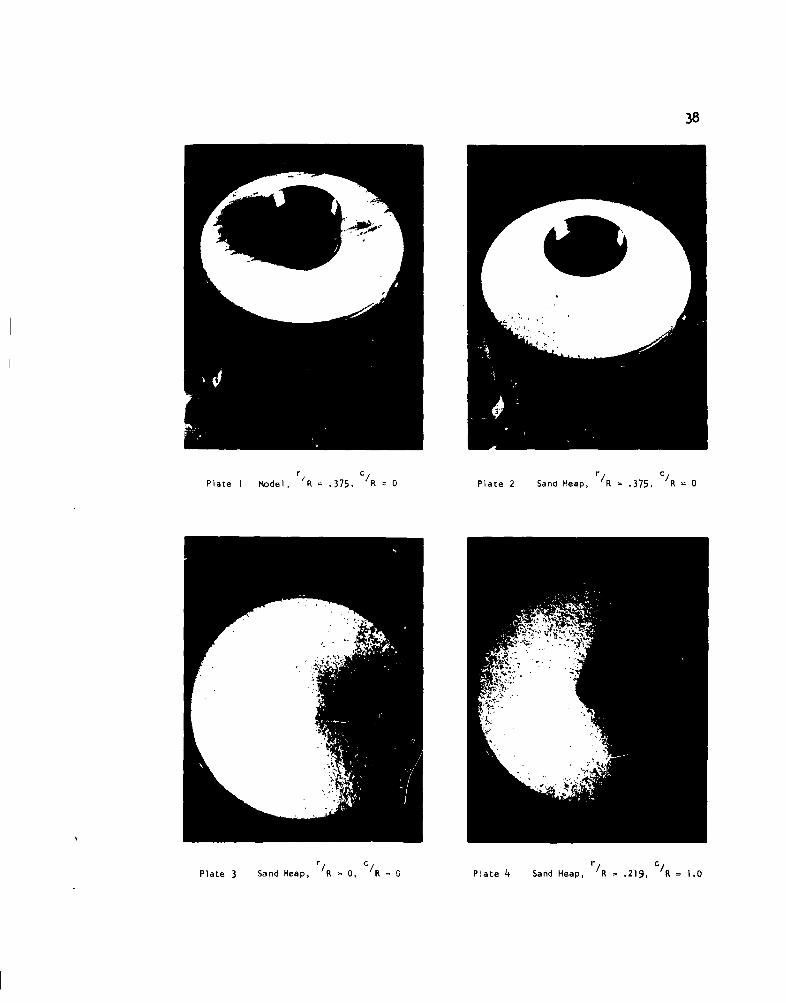
38
Plate I Model, R .375, R 0 Plate 2 Sand Heap/, R .375, R 0
R C r 2 cPlate 3 Sand Heap, R/p 0, /R = 0 P •ate 4 Sand Heap, rR = 219, cR = 1.O
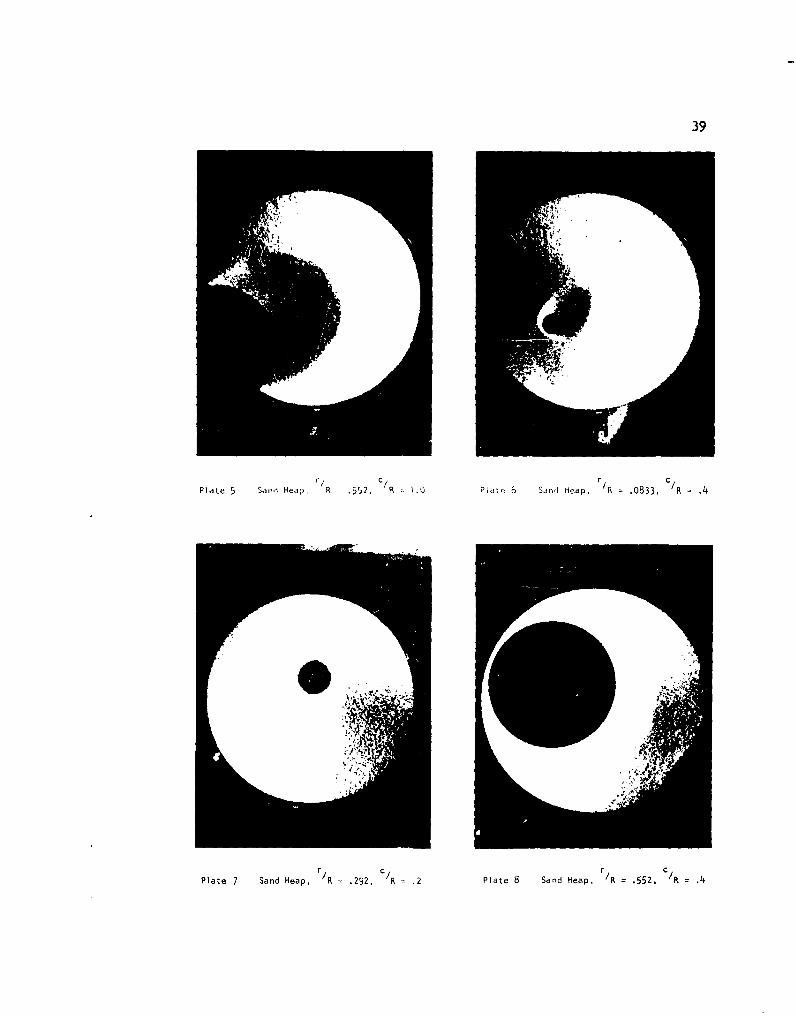
39
r /P la t e 5 S a n d H e a p , R . 5 5 2 . R 1 . 0 P la t e 6 S a n d H e a p , R = .0 8 3 3 , R .4
r l/R
Plate 7 Sand Heap, rR =.292, /R : 2Plate 8 Sand Heap, r/R =.552, ¢R=.
40
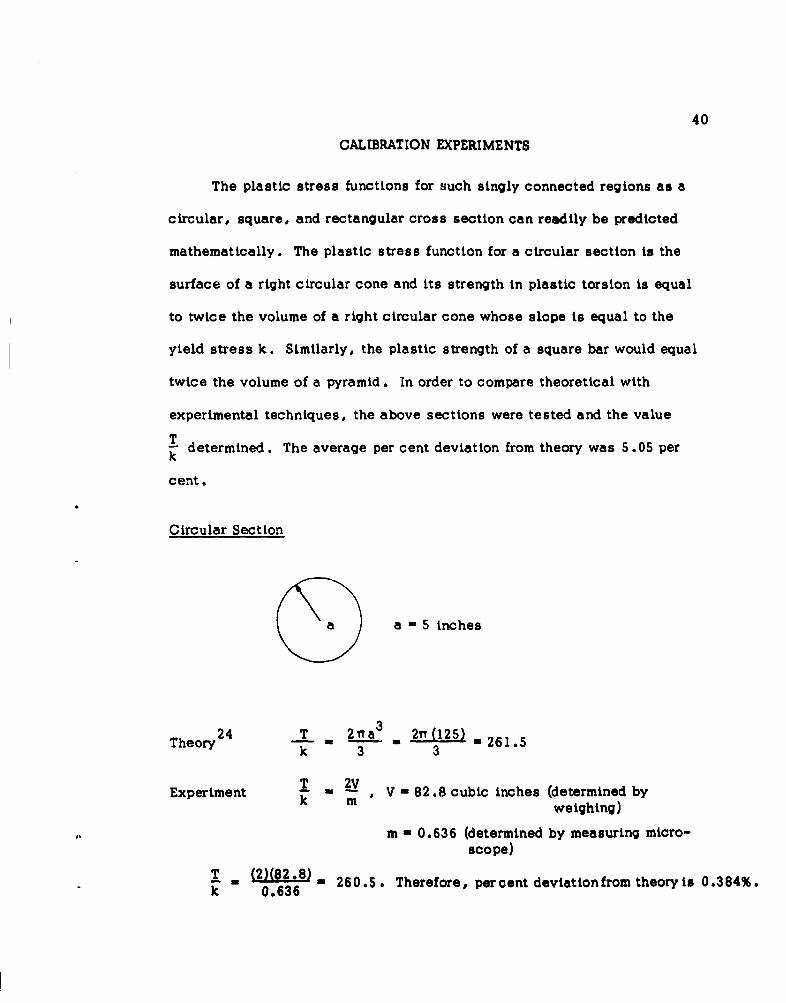
CALIBRATION EXPERIMENTS
The plastic stress functions for such singly connected regions as a
circular, square, and rectangular cross section can readily be predicted
mathematically. The plastic stress function for a circular section is the
surface of a right circular cone and its strength in plastic torsion is equal
to twice the volume of a right circular cone whose slope is equal to the
yield stress k. Similarly, the plastic strength of a square bar would equal
twice the volume of a pyramid. In order to compare theoretical with
experimental techniques, the above sections were tested and the value
T determined. The average per cent deviation from theory was 5.05 perk"
cent.
Circular Section
aa - 5 inches
Theory 2 4 T 2a3 - 2rr (125) -261.5k 3 3
Experment T _ 2VExperiment , V 82.8 cubic inches (determined by
k m weighing)
m - 0.636 (determined by measuring micro-scope)
T _ (2)(82.8) - 260.5. Therefore, percent deviationfrom theory is 0.384%.k 0.636
41
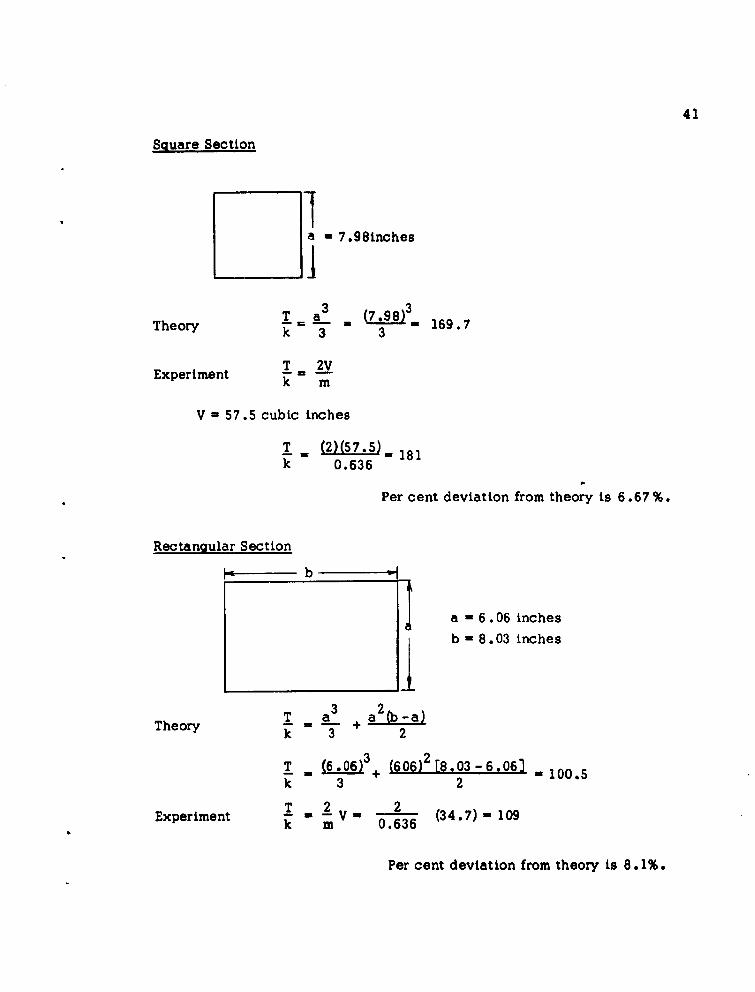
Sguare Section
14T 3 • 3=6.
Theory T a 169.7k 3 3
Experiment T_ 2V
k m
V = 57.5 cubic inches
T2 . (2)(57.5)5 181k 0.636
Per cent deviation from theory is 6.67 %.
Rectangular Section
~- b
a -6.06 inches
b - 8.03 inches
Theory T a + a(k 3 2
13+ 2T 6.06 (606) [8.03 -6,063 -100.5k 3 2
T 2 2Experiment k V 0.3 (34.7) - 109Per 0.636
Per cent deviation from theory is 8.* 1%.
LITERATURE CITED
1. G. Murphy, Advanced Mechanics of Materials (McGraw-Hill BookCompany, Inc., New York, 1946), p. 48.
2. Ibid.
3. S. Timoshenko and J. N. Goodier, Theory of Elasticity (McGraw-HillBook Company, Inc., NewYork, 1951), p. 259.
4. Ibid., p. 260.
5. Ibid., p. 261.
6. J. P. Den Hartog, Advanced Strength of Materials (McGraw-Hill BookCompany, Inc., NewYork, 1952), p. 1.
7. Timoshenko, M2. cit., p. 229.
8. A. Nadat, Theory of Flow and Fracture of Solids (McGraw-Hill BookCompany, Inc., NewYork, 1950), p. 493.
9. Murphy, 2p. cit., p. 159.
10. Ibid., p. 161.
11. A. A. Griffith and G. I. Taylor, Tech. Dept. Nat'l Advisory Comm.Aeronaut., vol. 3, p. 938 (1918).
12. M. Hetenyi, Handbook of Experimental Stress Analysis (John Wileyand Sons, New York, 1950), pp. 723-726.
13. W. Prager and P. J3. Hodge, Jr., Theory of Perfectly Plastic Solids(John Wiley and Sons, Inc., New York, 1951), p. 22.
14. Ibid., p. 34.
15. Ibid., p. 24.
16. Nadai, M. cit., p. 209.
17. Ibid., p. 494.
18. M, A. Sadowsky, "An Extension of the Sand-Heap Analogy in PlasticTorsion Applicable to Cross Sections Having One or More Holes,"Tourn. of Applied Mechanics, December 1941.
42
43
19. Murphy, o2. cit., p. 186.
20. Sadowsky, M. cit., p. 166.
21. G. Murphy, Similitude in Engineering (Ronald Press Company, NewYork, 1950), p. 36.
22. A. Phillips, Introduction to Plasticity (Ronald Press Company, NewYork, 1956), p. 7.
23. Nadat, 2. cit.., p. 490.
24. Ibid., p. 498.
BIBLIOGRAPHY
Den Hartog, J. P., Advanced Strength of Materials. New York: McGraw-Hill Book Company, 1952.
Durelli, A. J., et al., Introduction to the Theoretical and Experimental Analysisof Stress and Strain. New York: McGraw-Hill Book Company, 1958.
Griffith, A. A., and G. I. Taylor, Technical Report National Advisory Com-mittee for Aeronautics, vol. 3, 1917-1918. Washington: GovernmentPrinting Office.
Hetenyi, M., Handbook of Experimental Sttess Analysis. New York: JohnWiley and Sons, 1950.
Marin, J., Mechanical Behavior of Engineering Materials. Englewood Cliffs,New Jersey: Prentice Hall, 1962.
Murphy, G., Advanced Mechanics of Materials. New York: McGraw-HillBook Company, 1946.
, Similitude in Engineering. New York: Ronald Press Company,1950.
Nadai, A., Plasticity. Engineering Society Monograph, New York: McGraw-Hill Book Company, 1931.
, Theory of Flow and Fracture of Solids. New York: McGraw-HillBook Company, 1950.
Phillips, A., Introduction to Plasticity., New York: Ronald Press Company,1956.
Prager, W., and P. G. Hodge, Jr., Theory of Perfectly Plastic Solids.New York: John Wiley and Sons, 1951.
Sadowsky, M. A., "An Extension of the Sand-Heap Analogy in Plastic TorsionApplicable to Cross Sections Having One or More Holes," Tournal ofApplied Mechanics, December 1941, Vol. 8, No. 4, p. A-166.
Timoshenko, S., and J. N. Goodier, Theory of Elasticity. New York: McGraw-Hill Book Company, 1951.
44
45
Trayer, G. W., and H. W. March,, "The Torsion of Members Having SectionsCommon in Aircraft Construction," NACA Report No. 334, Washington:U. S. Government Printing Office.
Westergaard, H. M., Theory of Elasticity and Plasticity. Cambridge:Harvard University Press, 1952.
" _ "Graphostatics of Stress Functions," Transactions of the AmericanSociety of Mechanical Engineers, March 1934, Vol. 56, No. 3, p. 141.


![[XLS]kanplas.comkanplas.com/wp-content/uploads/Transfer-to-Reserve-2016... · Web view1 95 3724 100 150 150 180 180 180 90 405 225 225 3 2 143 770 100 150 150 180 180 180 90 405 225](https://img.pdfslide.net/doc/110x75/5b1f43827f8b9a8a3a8c7c3b/xls-web-view1-95-3724-100-150-150-180-180-180-90-405-225-225-3-2-143-770-100.jpg)


![405 [EDocFind.com]](https://img.pdfslide.net/doc/110x75/577d38851a28ab3a6b97fb10/405-edocfindcom.jpg)