Embed Size (px)
Citation preview

AO-A090 464 ROCKWELL INTERNATIONAL THOUSAND OAKS CA SCIENCE CENTER F/G 19/4
TEXTURE STRENGTHENING OF PLATES FOR BALLISTIC PURPOSES.(U)AUG 80 A K GHOSH. N E PATON DAA6-79-C-0011
UNCLASSIFIED SC519T.6FR AMRC-TR-80-45 NL'. uE/I/IEEEEI-EEEEEEEE/lEI/I///I///lIll/EEl/EEE'..q

* I 8 112 5
1 .01 11 1 11 1111 5
11111 ~.25 111111.6 ______

t/ t- -"9
l6S4AD
AMMRC TR 80-45
TEXTURE STRENGTHENING OF PLATES FOR BALLISTIC PURPOSES
August 1980
(..
A. K. Ghosh and N. E. PatonRockwell International Corporation IScience Center1049 Camino Dos RiosThousand Oaks, California 91360
Final Report Contract Number DAAG46-79-C-011 ' ---
Approved for public release; distribution unlimited.
Prepared for
ARMY MATERIALS AND MECHANICS RESEARCH CENTERWatertown, Massachusetts 02172
o_ T:: i4 111 7

The findings in this report are not to be construed as an officialDepartment of the Army position, unless so designated by otherauthorized documents.
Mention of any trade names or manufacturers in this reportshall not be construed as advertising nor as an officialindorsement or approval of such products or companies bythe United States Government.
DISPOSITION INSTRUCTIONS
Destroy this report when it is no ionge needed.Do not return it to the orinewor.
UNCLASSI FT EDSECURITY.At.tSSFItATIOH OfP THlS UGE ( e on ata Bntered)
REPORT DOCU ISTRUCIONSRCFOR COMPLETING FORMoR [P OEft .. 12, GOVT ACCeSSION NO. 3. PECIQ'FW'f'S CATAL.OG NUMBER
4: TITt.E (and Subtitle) S. T-IOE OF IEPOR*T & PERIOD COVERED
: (1 lFinal Report
( Texture Strengthening of Plates for Balistc 12/19/78 thru 03/18/80C Purposes7C51 ." REPORT NUMBER
I-- .A 01-.TOR GRANT NUMBER(s)
K. Ghosh:0 NAE./Paton ( ' O DAG46-79-C-,We1I
S. PE -RMING ORGANIZATION NAME AND ADDRESS / 10. PPOGPM ;-LEMENT, PROJECT, TASK
--Rockwell International Corporation V/ -A Proj: 6 A1Science Center, 1049 Camino dos Rios _..- AMCMS Code: :B4.001Thousand Oaks, CA 91360
1I. CONTROLLING OFFICE NAME AND ADDRESS 2DATEArmy Materials & Mechanics Research Center ."7 Auqiintwt8Watertown, Mass. 02172 " . NJMUEP1PAGe-
86k,14. MONITORING AGENCY NAME & AODRESS('I dlilerent from Coantolltnh Office) IS. SECURITY CLASS. (of thl report)
Unclassifiedis,. OECLASSIFICATION DOWNGRADING
SCHEDULE N/AIS. OISTRIBUTION STATEMENT (f this. Report)
Approved for public release; distribution unlimited
I?. DISTRISUTION STATEMENT (of the ebetract entered in Block 20, It different from Report)
I|. SUPPLEMENTARY NOTES
1. KEY WORDS (Continue on reveree side It necessary and Identify by block number)
Texture DeformationPreferred orientation BallisticsAlloy steelAluminum alloy
20. ABSTRACT (Continue an reveres side If necessary end Identllp by block number)
-T6Motivated by previous studies in relating texture-based strength to ballisticperformance of 5% Ni steel armor, an investigation was initiated to examineother materials, particularly face-centered cubic materials, for possibletexture strengthening effects. Theoretical and experimental work were carriedout side by side, and significant progress in understanding and achieving thatgoal are reported here. On the theoretical side, (110) and (111) textures wereidentified as the most strong contributors to through-thickness strength, and--
DO 1473 EDITION OF' NCVII OiSOrETEE UNCLASSIFIED
S £ECURITv CLASSiICA-?IQN O TiS PG0t * .%o ,*".....
' - / -s ...
;, ?. 11

UNCLASSI FIEDSECURITY CLASSIFICATION OF TWOS PAGI(Iflien Dat. Enteod)
N['hence ballistic resistance. A computer program to calculate Taylor factorsfrom pole figure data by incorporating spatial crystallite orientationdistribution function was developed. Furthermore, theoretical modeling ofthe ballistic perforation process (-SeetiwR-$validated the previouslyspeculated effects of normal anisotropy as well as showed the effects of othermaterial properties, including strain hardening and strain-rate sensitivity.The experimental work on 7039 aluminum indicated only a weak texture, and /Arelative absence of anisotropy leading to an absence significant ballisticeffects. (Possibilities of altering this situation has been suggested inthe text). Precipitation hardenable austenitic steel, A-286 grade, also usedin this work, does give rise to "brass type" texture in rolled (at 80* and900F) and aged condition and appears to have a high trough-thicknessstrength needed for ballistic resistance.
UNCLASSIFIED

Rockwell IntemationalScience CenterSC5197.6FR
FOREWORD
This report was prepared by the Rockwell International Science Center
under U.S. Army Contract No. DAAG46-79-C-0011. The research was conducted as
part of a cooperative program in which U.S. Steel Research Laboratories had
dveloped high strength armor plates, the deformation mechanics of which was
studied at the Science Center. The contract was administered by the U.S. AraV
Materials and Mechanics Research Center, Watertown, Ma., Mr. Anthone Zarkades,
Contracting Officer Representative. This is a final report and covers work
conducted from December 19, 1978 to March 18, 1980.
J'.
C2589A/bw
...... ...... ....

' L Rockwell Intemational0D1Science Center
SC5197.6FR
TABLE OF CONTENTS'
Page
FOREWORD ................................................................ ii
ABSTRACT ............................................. .......... ...... vii
1.0 INTRODUCTION ........................................................ 1
2.0 TAYLOR FACTORS (M) FOR F.C.C. MATERIALS ............................. 4
3.0 THREE DIMENSIONAL ORIENTATION DISTRIBUTION ON TEXTURE STENGTH ....... 16
3.1 Pole Figures of 7039 Al and Calculated Taylor Factors ....... 21
4.0 EXPERIMENTAL STUDIES ON STEEL AND ALUMINUM .......................... 314.1 7039 Aluminum ............................................... 314.2 5%-Ni Alloy Steel ........................................... 364.3 A-286 Steel ................................................. 414.4 Measurement of Young's Moduli ............................... 52
5.0 BALLISTIC LIMIT CALCULATION FOR FLAT-ENDED PROJECTILE IMPACT ........ 55
6.0 SUMMARY AND CONCLUSIONS ............................................. 757.0 REFERENCES .......................................................... 78
rit
t2iC2589A/bw
____ ____ ____ ____ ___ ,

Rockwell InternationalScience CenterSC5197.6FR
LIST OF FIGURES
Page
Fig. 1 Relationship between impact directions and the orthogonaldirections of the plate ........................................ 7
Fig. 2 Normalized Taylor factors for through-thickness compression .... 11
Fig. 3 Normalized Taylor factors for planar shear ..................... 12
Fig. 4 Normalized Taylor factor for shear as a function of sheetdirection (b.c.c. textures) .................................... 14
Fig. 5 Normalized Taylor factor for through-thickness compression(bo.Cc. textures) .............................................. 15
Fig. 6 (110) pole figures of 5% Ni plates rolled to variousreductions at 1500*F, then quenched and tempered (fromH. Hu, AMMRC Report CTR 77-19. July 1977) ...................... 17
Fig. 7 (a) (111) pole figure of 7039 aluminum (surface).(b) (200) pole figure of 7039 aluminum (surface) ............... 22
Fig. 8 (a) (111) pole figure of 7039 aluminum (center).(b) (200) pole figure of 7039 aluminum (center) ................ 24
Fig. 9 (a) (111) pole figure of 7039 aluminum (rolled to 0.16 in.).(6) (200) pole figure of 7039 aluminum (rolled to 0.16 in.) .... 26
Fig. 10 Shear strength of 7039 aluminum (1.5 in. stock) as a functionof rolling direction ........................................... 33
Fig. 11 Stress-strain curves in compression for 7039 aluminum .......... 35
Fig. 12 (a) Sheer fracture edge and (b) fracture surface for7039 aluminum ......... ....... . . . . . . . . . . . . . . . . ..... 37
Fig. 13 Photomicrograph of 0.2S in. thick rolled 5% Ni steel nearshear edge showing inclusions in banded structure .............. 39
Fig. 14 Micrographs of A-286 steel in two different conditions ofthermal treatment .............................................. 43
Fig. 15 Tensile stress/strain data for A286 steel after rollingand recrystallization .......................................... 45
ivC2589A/bw

9 Rockwell InternationalScience CenterSC5197.6FR
LIST OF FIGURES
Page
Fig. 16 Tensile stress/strain data for rolled A-286 steelcompared against that for recrystallization material ........... 48
Fig. 17 Shear test results as a function of rolling temperaturefor A-286 steel (a) before and (b) after aging treatment ....... 49
Fig. 18 Through-thickness compression test results of rolled andrecrystallized A-286 steel, after aging treatment .............. 51
Fig. 19 Schematic of the shear-based ballistic perforation process
and velocity hodograph (inset) ................................ 57
Fig. 20 Slip line fields for plane strain identation problem ........... 58
Fig. 21 Approximate pressure distribution and friction forces onthe side surface of projectile ................................. 64
Fig. 22 Schematic diagram illustrating the zone and direction ofheat conduction ........................................ 67
Fig. 23 Change in projectile velocity during ballistic penetration ..... 70
Fig. 24 Residual velocity after plug ejection as a function ofinitial projectile velocity .................................... 71
Fig. 25 Improvement in ballistic limit as a function of plasticanisotropy parameter, R, and rate sensitivity constant, L ...... 73
Fig. 26 The effect of strain hardening exponent, n, on ballisticlimit* ................................ ............. 74
v{
C2589Albw

9Rockwell InternationalScience Center
SC5197. 6FR
LIST OF TABLES
Page
Table 1 Ideal Rolling Textures in f.c.c. Materials ................ 9
Table 2 Normalized Taylor Factors (M/Mrad, for 7039 Al .......... 27
Table 3 Mechanical Properties of 5% Ni Steel...................... 35
Table 4 Shear and Tensile Properties of Steel Armor Beforeand After Annealing Heat Treatment ....................... 38
Table 5 Composition of Wrought A-286 Steel (wt %) ............. 38
Table 6 Thermomechanical Treatments of A-286 Steel ................... 40
Table 7 Tensile Properties of A-286 Steel .................... 43
Table 8 Strength Anisotropy of A-286 Steel....................... 49
Table 9 Young's Moduli ....... ............................... 51
viC2589A/bw

Rockwell InternationalScience CenterSC5197.6FR
TEXTURE STRENGTHENING OF PLATES FOR BALLISTIC PURPOSES
ABSTRACT
Motivated by previous studies in relating texture-based strength to
ballistic performance of 5% Ni steel armor, an investigation was initiated to
examine other materials, particularly face-centered cubic materials, for
possible texture strengthening effects. Theoretical and experimental work
were carried out side by side, and significant progress in understanding and
achieving that goal are reported here. On the theoretical side, (110) and
(111) textures were identifiled as the most strong contributors to through-
thickness strength, and hence ballistic resistance. A computer program to
calculate Taylor factors from pole figure data by incorporating spatial
crystallite orientation distribution function was developed. Furthermore,
theoretical modeling of the ballistic perforation process (Section 5)
validated the previously speculated effects of normal anisotropy as well as
showed the effects of other material properties, including strain hardening
and strain-rate sensitivity. The experimental work on 1039 aluminum indicated
only a weak texture and, relative absence of anisotropy leading to an absence
significant ballistic effects. (Possibilities of altering this situation has
been suggested in the text). Precipitation hardenable austenitic steel, A-286
grade, also used in this work, does give rise to "brass type" texture in
rolled (at 806 and 900*F) and aged condition and appears to have a high
through-thickness strength needed for ballistic resistance.
viiC2589Afbw

R ockwell InternationalScience CenterSC5197.6FR
1.0 INTRODUCTION
Based on a study of texture-based strength of steels completed in
late 1978,1 a rationale was developed to relate preferred crystallographic
orientation, and therefore, through-thickness strength anisotropy to ballistic
performance. It was suggested that the first onset of deformation in the
ballistic penetration process occurs by through-thickness compression and
hence the strength in this deformation mode primarily controls penetration
resistance. This rationale was found to explain the V50 ballistic behavior of
a medium carbon 5% Ni-Si-Cu-Mo-V steel manufactured by U.S. Steel, 2 specif-
ically to develop high intensities of (112) and (111) textures. Calculation
of Taylor factor, M, for various ideal textures also showed that highest
through-thickness strength would be expected in the case of these textures.
A detailed study by Zarkades3 shows quantitatively the improvement in
penetration resistance as a function of texture intensity. This is further
supported by the superiority In the weight merit ratio (a real density ratio
for the same penetration resistance) of textured steel over the isotropic
material. The textured steel also exhibited superior fracture toughness over
isotropic material and a large anisotropy in fatigue endurance limit, tensile
properties, impact energy, etc., In the plane of the plate.
Based on these positive results, a systematic study was initiated in
the past year to examine other material systems for improved texture-based
strength properties. The crystal structure of particular interest here is
face-centered cubic materials. Since a number of armored vehicles use 7039
1C2589A/bw

'i Rockwell InternationalScience Center
SC5197.6FR
aluminum alloy, it is of interest to know if texture would influence its
strength or fracture characteristics. Furthermore, there are a number of
precipitation hardenable high strength austenitic steels that could compete
with 4340 or 5% Ni-Steels in terms of strength properties. A-286 steel, a
highly creep resistant material is an excellent example. The possibility of
developing texture-based strength in such an f.c.c. material is thus
interesting and challenging. In this connection, the calculation of Taylor
factors for various ideal crystallographic orientations for f.c.c materials,
is essential for a preassessment of the expected behavior.
The studies on Taylor factors based on ideal orientations are
somewhat subjective since real material plate textures have three-dimensional
distribution of orientations associated with them. A more realistic strength
prediction should include this distribution as well. Based on existing
literature work, a capability needs to be developed to incorporate 3-0
orientation distributions in such calculations, particularly for comparison
with results based on ideal orientations. In the work described here, a
computer program was developed with the consulting help of Prof. John Kallend
of Illinois Institute of Technology, for calculating Taylor factors from two
(for cubic materials) complete pole figure data.
In addition to seeking answers to these questions, two other related
topics are investigated because of their extreme importance to this program.
One relates to the elevated temperature fabrication of components from the
superior 5% NI armor steel. The concern is if the elevated temperature
exposure causes any damage to the mechanical properties of the steel. The
2C2589A/bw
9 Rockwell InternationalScience CenterSC5197.6FR
other topic, treated in Section 5.0, deals with an analytical approach to
looking at the influenece of material's plastic properties, including its
strain-hardening, strain-rate sensitivity and anisotropy effects on ballistic
penetration process. This is an essential part of plate strengthening program
for ballistic purposes.
3C2589A/bw
p.
Rockwell InternationalScience Center
SC5197.6FR
2.0 TAYLOR FACTORS (M) FOR F.C.C. MATERIALS
Background
Strengthening of sheets and plates by altering their crystallographic
texture through various thermomechanical processing techniques is a subject of
continuing interest. In b.c.c. metals like iron and steel texture strengthen-
ing in the through-thickness direction (of plates) is achieved by aligning as
many (111) planes parallel to the rolling plane as possible. Hu, Speich and
Miller2 have taken advantage of this principle in the manufacture of armor
plates of 5% Ni-Si-Cu-Mo-V steel steel. These are primarily martensitic
plates with varying amounts of rolling reduction to impart varying degrees of
texture intensities. They reported significant ballistic improvements with
(111) and (112) textures.
The analytical and experimental work carried out during the last
year1 showed that through-thickness strength is highly instrumental in con-
trolling ballistic perforation resistance. The obvious question is then if
this technique could be used in other crystallographic systems to improve
ballistic performance. Since high strength aluminum is being used in some
armored vehicles at the present time there is interest in studing texture
strengthening of such an aluminum alloy. Other f.c.c. steels, e.g., aus-
tenitic stainless or precipitation hardened austenitic steels could also be
used for the study. In conjunction with this there is the need for calcu-
lating texture based strength to see which ideal textures might be worth
investigating. Of course, there may still remain the problem of actually
4C2589A/bw
9 Rockwell InternationalScience Center
SC5197.6FR
producting a strong rolling texture in a f.c.c. material. We are quite
fortunate with body-centered cubic materials in this respect that pencil glide
provides these materials with a single slip direction (111) and the texture
can be sharpened. Strong recrystallization texture (100) can, however, be
produced in f.c.c. materials and deformation texture in h.c.p. materials.
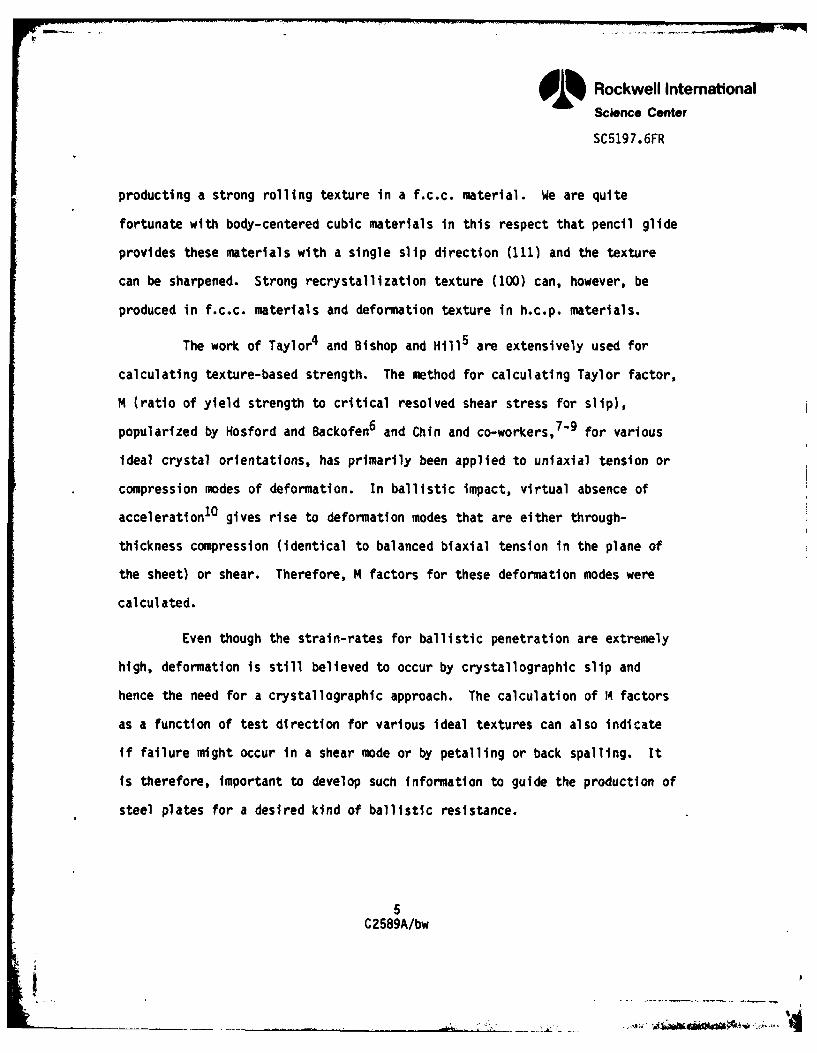
The work of Taylor4 and Bishop and Hill 5 are extensively used for
calculating texture-based strength. The method for calculating Taylor factor,
M (ratio of yield strength to critical resolved shear stress for slip),
popularized by Hosford and Backofen6 and Chin and co-workers,7 "9 for various
ideal crystal orientations, has primarily been applied to uniaxial tension or
compression modes of deformation. In ballistic impact, virtual absence of
acceleration10 gives rise to deformation modes that are either through-
thickness compression (identical to balanced biaxial tension in the plane of
the sheet) or shear. Therefore, M factors for these deformation modes were
calculated.
Even though the strain-rates for ballistic penetration are extremely
high, deformation is still believed to occur by crystallographic slip and
hence the need for a crystallographic approach. The calculation of 14 factors
as a function of test direction for various ideal textures can also indicate
if failure might occur in a shear mode or by petalling or back spalling. It
is therefore, important to develop such information to guide the production of
steel plates for a desired kind of ballistic resistance.
5C 2589A/bw
- :. 4

Rockwell IntemationalScienco Center
SC5197.6FR
Approach
The analytical approach for texture based strength calculations have
been detailed in last year's report. 1 The method is that of Bishop and Hill
and consists of converting an imposed shape change on the plate to crystal-
lographic shear directions and calculating defomation resistance from the
knowledge of slip shear resistance. A brief summary of this method is given
below:
Figure 1 relates the impact direction to the sheet directions:
rolling (r), transverse (t) and thickness (z). The direction cosines between
the impact direction (a,, a2 and a3) and sheet directions are expressed as
follows:
a, a2 a3
t cos 8 sin a -sin e -cos a cos a
r sin 0 sin a cos e -sin 0 cos aL ICos a 0 sina
Writing 1, 2 and 3 in places of a1, and a2 and a3 , the imposed shape changes
for through thickness compression are
de3 a -2de1 - -2dc2; dc12 - d'23 - dc3 1 0 0; (1)
and planar shear are
6C2589A/bw
S - - ... .
o ,€

9 Rockwell InternationalScienco Center
SC5197.6FR
Z (N.D.)
IMPACT DIRECTION
r(R.O.)
t(T.D.)
Fig. I Relationship between impact directions and the orthogonal directionsof the plate.
7C2589A/bw
&p,-

Rockwell IntemationalScience Center
SC5197.6FR
oy21 *0; d 3 1 de 1 dc2 dc3 dy 23 0, (2)
noting that Y21 a 2c21 etc., where y a imposed shear strain and e - component
of the imposed strain tensor.
After these shape changes are resolved4 in the sheet directions using
the above direction cosines, they are resolved in the crystal directions
(100), (010) and (001) for each ideal orientation. Table I lists the ideal
f.c.c. rolling textures found experimentally. The simplest texture is (110)
£112], however, (123) [1I] is extremely common and may be thought to be
composed of (110) and (112) textures. As a reminder, a combination (111) and
(112) textures were found in the strong armor plates of Hu et al. 2 The
direction cosines between the crystallographic directions and the sheet
directions are used in the last transformation scheme.
Knowing the shape change in the crystal direction allows us to use
Bishop and Hill stress-states for (111) <110> slip system for f.c.c. materials
for maximizing the virtual work. These stress-states are given by A - (02 -
B3/)' B 8 (03 - I)//'ts , C- (oI - o2 )/vTs, F - o2 3 /v 'rs, G -31/
's and H a 12/V Ts, which can take values of 0, t 1/2 and t 1, the
stresses being taken with reference to the cube axes, Ts critical resolved
shear stress. M, which is given by dW/TsdY for shear and dW/Tsdc 3 for
through-thickness compression is obtained by finding the maximum value of
d6 d 1 de2 de23 d.21 de12 1
8C2589A/bw

oi% Rockwell InternationalScience ConterSC5197.6FR
from the 28 possible combinations of A, B .... H (de31 stands for dy/2 or
dc13 ). A FORTRAN computer program was written to compute M and the results
are discussed subsequently.
Table 1
Ideal Rolling Textures Inf.c.c. Materials
Cu (110)/[1T2]Cu (123)/[121]
Cu (123)I[lli]
Cu 70% - Zn 30% (110)/[T1121
Cu 70% - Zn 30% (110)/[712]
Cu + 12 at. % Al (123)/E121]Cu + 1.5 at. % Al (110)/[112]
Cu + 3 at. % Au (123)/[121J
Cu + 29.6 at. % Ni (123)/[121)
Cu + 49 at. % Ni (123)/[1l1]
Ni (123)/[12-1Au (123)/12"1]
Au + 10 at. % Cu (11o)/[1121Al (123)/[1711
Al (110)/[112)Al + 2 at. % Cu (11O)/[172J
Al + 1.25 at. T Si (123)/[1Z)
Al + 0.7 at. % Mg (110)/11"23
Ag (110)/[1"12)
Pb + 2 wt % Sb (110)/011)
9C2589A/bw

Rockwell IntemationalScience Center
SC5197.6FR
Results
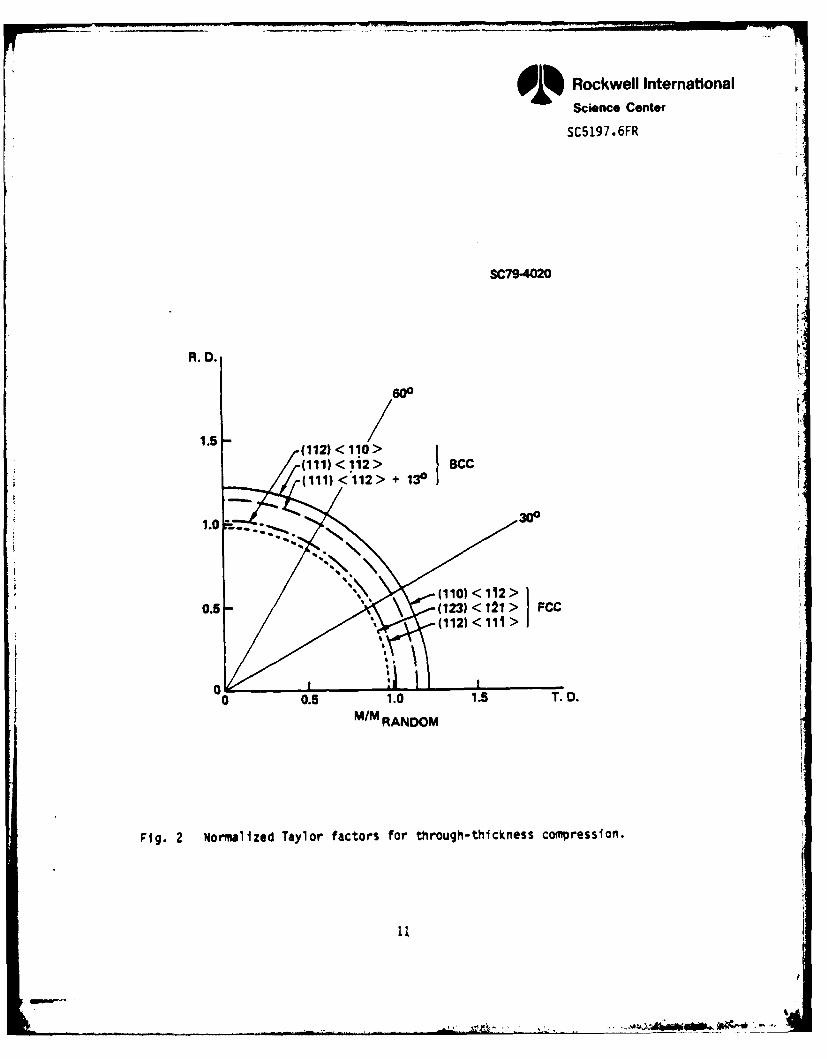
In the results to be presented, the Taylor factors (M) for the
various ideal textures are normalized with respect to M for random crystal
orientation. In the (110) pole figures for 51 Ni steel, 2 a 13* rotation about
the transverse direction of a (111) [112] texture was found to describe the
intensity maxima better than (111) [112 texture itself. Strength calcula-
tions were carried out for this 13* rotated texture and compared with b.c.c.
(111) (11] texture in Figs. 2 and 3 as normalized with respect to random ftexture. While through-thickness strength is reduced on account of the
rotation, the shear strength in the rolling direction is significantly in-
creased, thus producing a strength anisotropy. This effect might be respon-
sible for the preferential penetrator exit direction observed from tests
conducted on these plates.
The calculated strength, for the f.c.c. textures are also shown in
Figs. 2 and 3. The (110) [ff2] texture appears to be the most promising (1.21
times random) with strength equivalent to that of the b.c.c. (111) texture.
The (112) type texture for both b.c.c. and f.c.c. have the same strength,
while (123) texture has the lowest strength (less than random) among these.
Thus, the notion that the strength of (123) would be intermediate between
(111) and (112) type textures is not valid. Ne shear strength values of all
the textures are about the same (less than random), with (123) type showing a
peak In the transverse direction.
10C2589A/bw
9 Rockwell InternationalScience Center
SC5197.6FR
SC79-4020
R. D.
1.5(112) < 110 >(111) < 1i2 > BsCC(111)/<"1,12 > + 130 ;
1.0 --.;. m
. (112) < 111 >
0t
°o 0.5 1.0 1.5 T. D.MIM RANDOM
Fig. 2 Nomalized Taylor factors for through- thickness compression.
9Rockwell International0 % Science Center
SC5197.6FR
SC79-4019
R. D.
600
1.0-
___ BCC
0.0.5
051.0 1.5 T. D.M/M RANDOM
Fig. 3 Normalized Taylor factors for planar shear.
12

Rockwell InternationalScience Center r
SC5197.6FR
The (100) recrystallization texture for the f.c.c. metals is normally
very strong. However, as shown in last year's report,I this texture is weak
in compression (even though extremely strong in shear (see Figs. 4 and 5) and,
therefore, not highly promising for ballistic resistance. Thus the f.c.c.
texture that may be best from the standpoint of ballistic resistance is (110)
[11"2] (or Brass type) if a strong component of this could be produced.
13C2589A/bw
[4'1'

'~Rockwell InternationalScience Center
SC5197.6FR
R.D.1.5 M FOR SHEAR
- -- -- -- - NORMAL IMPACT (10 O >
-- /(100) <301> - CUBE-ON-FACE
(11) <11> -CB-NCRE
4 0
Z ~(110) <001>-m CUBE-ON-EDGE
0.5 1-0
00 0.5 1.0 1.5 TD
M/RANDOM
Fig. 4 Normalized Taylor factor for shear as a function of sheet direction(b.c.c. textures).
14 SC73-912

Rockwell InternationalScience Center
SC5197. 6FR
NORMALIZED M THROUGH THK. COMPRESSION
R.D. (NORMAL IMPACT)
1.5-
S(111) < 112 >, (110) < 001 > TEXTURE
0 .),"(112) <110> TEXTURE
'"- (100) < 023 > TEXTURE
0 0.5 1.0 1.5 - D-M/MRANDOM
Fig. 5 Normalized Taylor factor for through-thickness compression (b.c.c.textures).
15 SC7S-905

'i Rockwell InternationalScience CenterSC5197.6FR
3.0 THREE DIMENSIONAL ORIENTATION DISTRIBUTION EFFECTS ON TEXTURE STRENGTH
Background
While the assigning of ideal orientations to describe plate texture
promotes easier understanding of their influence on strength properties, it is
by no means as accurate as the present-day techniques would allow. A pole
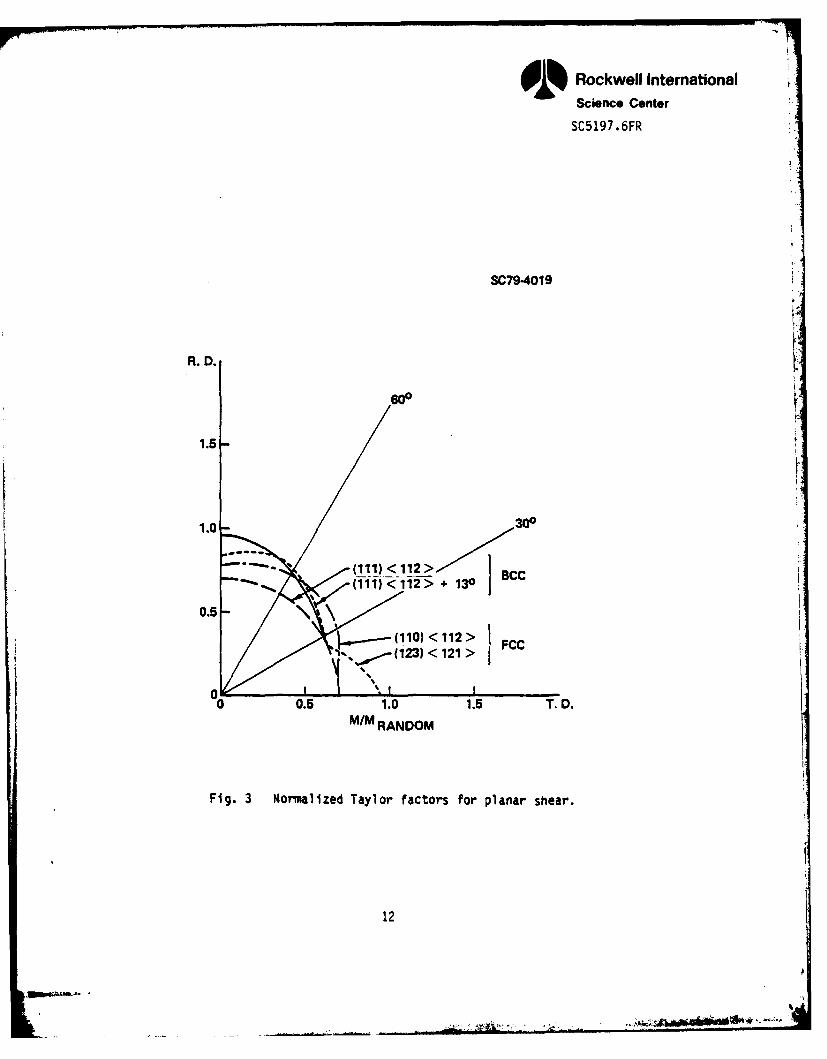
figure shows significant intensity distribution around the observed pole
maxima and is merely a reflection of its spatial distribution. In Fig. 6 a
partial pole figure for 5% Ni steel2 shows that neither (112) [1I0] nor a 130
rotation from (111) E112] describe the details of the intensity distribu-
tion. To determine the effects of all orientations on strength and other
mechanical properties, a description of three-dimensional crystallite orienta-
tion distribution is required.
The complete description of anisotropy has been achieved through
crystallite orientation distribution function (CODF) by a number of investi-
gators. 11'13 This function, w (e, *, 0p) (where e, 0 and * are a set of Euler
angles) may be used with an equivalent description of an anisotropic mechan-
ical and physical property, g (8, 0, ), to predict orientation dependent
properties. For a textured specimen, it is necessary to average work
increment dm, for given imposed strain over all crystallite orientations and
this requires that the contributions due to each crystallite orientation be
weighted by the density of occupation of that orientation. This is what is
described by a three dimensional spherical harmonic function and is derived
from at least two complete pole figures for a cubic material.
16C2589A/bw
Rockwell InternationalScience Center
SC5197.6FR
055 1 0 1
;20
10 2
4O 4 0 0OT
4 3 *5 C 00U
Fig. 6 (110) pole figures of 5% Ni plates rolled to various reductions at1500 0F, then quenched and tempered (from H. Hu, AMMRC Report CTR 77-19, July 1977).
17C2589A/bw

OD) Rockwell InternationalScience Center
SC5197.6FR
To obtain the coefficients of the spherical harmonic function, let us
suppose that the normalized pole figure intensity at an angular coordinate
position, (a, 8) on the pole figure is q (a, ). If the intensity distribu-
tion is describable by means of a spherical harmonic function Plm (8) e-li m ,
and Qim are coefficients, then by definition
- 1q(a, t3 QlmPlm(O) e-ia(4)
1=0 m=-l
Thus from the measured intensity values q (a, 8), the coefficients can be
determined as
1-imi=--7 f f q (a, a Pl (a3) e- m dt~da (5)Qlm =.l4v- all at,a
Similarly COOF represented by w (9, *, f), is given by
1 1 e imiJ e ino (6)w( B, )= .). ). WlmnZlmn(9)e-me-n(6
1 m=-l n=-l
where Wlm are the coefficients to be determined and Zlmn(e) are augmented
Jacobi polynomials. Then the coefficients Qlm and Wlmn are related by a set
of linear equations:
j = 2 T)1/2 1 -ipuj=l 2fy W lmp Plp(n i)e (7)
18C2589A/bw

Rockwell InternationalScience Center
SC5197.6FR
where ni, Pi are the polar coordinates of the plane normal of the diffracting
plane for the jth pole figure, with respect to the CRYSTAL axis.
Hence the Qlm may be found by numerical integration of Eq. (5), and
the Wlmn by solution of Eq. (7). The orientation distribution function can
then be found by substitution in Eq. (6).
[In practice, for symmetrical specimen and crystal geometry, the
exponential terns all reduce to cosine terms, and many of the OLm and WLmn are
identically equal to zero. Additionally,
lm 1 i' Wlmm = Wln " Wl-
and for given values of 1 and m, the Wlm are linearly related. These
conditions are built into the computer program.]
Once COOF is known, which acts as a weighting function, the next step
is to determine a Taylor factor distribution function in terms of Euler
angles. This is done by assuming a crystallite present at each Euler Angle
orientation and calculating the corresponding Taylor factors for an imposed
strain tensor. If this function is given by g ( o, e, *), its average value
for the polycrystalline aggregate is given by
= fJf w(q*, 8,w) g(*, 6,x) sin e do dO d* (8)
all
19C2589A/bw
ii

9 Rockwell InternationalScience Center
SC5197.6FR
If g(*, 8, *) is expanded as a series of spherical harmonics,
g(*, G, ) lmn Zlmn (6)e- i"~ e- in
m n
where the coefficients Glmn are found by numerical integration. Equation (8)
then becomes
=4w,) Wiren G Imn (9)
I m n
For rotations of a about the specimen z axis (i.e., plate normal) the
average Taylor factor may be determined from
4() =42 W Gin cos (ma) (10)
1 m n m ln
Based on the above theoretical background, Prof. J. Kallend of
Illinois Institute of Technology had developed computer programs, which were
acquired at the Rockwell Science Center through his consulting services.
Briefly, the program description is as follows:
Program CUBAN calculates Qlm from pole figure data by numerical
integration. The program also estimates the truncation error in the series
expansion due to termination at a finite (usually 20) order. Program COOF
calculates the crystal orientation distribution function coeffielents, Wlmn,
from coefficients of the spherical harmonic series calculated by the CUBAN
program.
20C2589A/bw
•-

9 Rockwell InternationalScince Center
SC5197.6FR
Program PLASGEN determines the coefficients, Glmn, for the orienta-
tion dependence of the Taylor factor for an imposed strain tensor which is
supplied as data.
Finally, program PLASTIC reads in the coefficients Glm n and Wlmn, and
calculates the average Taylor factor according to Eq. (10).
3.1 Pole Figures of 7039 Al and Calculated Taylor Factors
7039 aluminum plate (1.5 in. thick) has important armor applications
because of its high strength and corrosion resistance. The mechanical proper-
ties of this and other alloys are given in Section 4.0.
In this section the Taylor factor calculations based on actual
crystallographic orientation distributations of this alloy is presented, fol-
lowing the procedure described in Section 3.0.
The crystallographic orientations of the 7039 aluminum armor plates
have been characterized experimentally by their pole figures. From the
1.5 in. thick plate supplied by AMMRC, 1 in. x 6 in. x 0.10 in. strips were
cut from near the surface and center, parallel to the rolling plane for this
work. From 0.16 in. strip of the same material, which was rolled at AMVRC, 1
in. x 6 in. pieces were also cut. All of the test materials were sent to
Boeing Technology Services in Seattle for the pole figure work. Figures 7(a),
(b), 8(a), (b), and 9(a), (b) show, respectively, the (111) and (200) pole
figures for 7039 surface, center (from 1.5 in. thick plate) and the rolled
7039 plate. F.c.c. ideal orientations corresponding to low index planes are
21C2589A/bw
I ,A *

Rockwell InternationalScience Center
SC5197.6FR
46 (113) y,]
AI
2 -Soo Z 1.000 3 G.OO 4 2.000 S 4.000is B.O 7 L4.-CO a 2a a0 S.000 a .C 37.aoa
arT NO-o i- '73-0 RuIALNUt .s"FRCE' Or os-6EP-wRPO2Arto- O.U 91 MXVzaMS C30Tr-rmortCadFI Rr 2 .oO~vSL176- MN2V iE~MTwCE. S14(IV IRECEEVLNOr "'INEEf-OFUC0 . EvPN6SCAW IM7C- 1P6C/M314 72.PNtMzN HHL. ILL#tFp- 2'SY eASE. 23 W10IO SILVER C..LteFlrr)NIFWCYM LWTENStrV LCFLc4 Z01 R IPw 4S.00 rO. 54.-14
Fig. 7(a) (111) pole figure of 7039 aluminum (surface).
22

Rockwell InternationalOD Science Center
SC5197.6FR
JIB.
o(iis) E[) I
I -SOO Z L.O 3 ]-SOlO 4 Z.000C S 4 O0Wis 8-O0 7 L4. 8CO 2a000o0 2S GOO 0 30i.000
LRPTT M~ WO-19-01.871 M39-U QMNUt1.SLPFfCE onE CG4EP-lar~nulrtoN- CUJ OT 3SIrvZm C0UNT-rmnorOmrtCNPR. Pr z&Joj(vSLITS- 2H(2V e4ThRNCE. 5H/IV I!ECELVING ENOINEER-0FIVJ0 0. EVAN6SCAM flRTE- IriL/MIN, ?2Ltt1/M1N M4L.= WOfn R- 2SV eME. 20V Wu'13(aW SELVECaAL 0 IC14MWOOM INTrEN~SIT r CLC &cac 8-.5 F~ AIS-0 Ma 54 .14
Fig. 7(b) (200) pole figure of 7039 aluminum (surface).
23
.4i

Oi% Rockwell InternationalScience Center
Ra SC5197.6FR
AA
I -SOO Z 1.-COO 3 I-SCO 4 2. coo 5 4.00ts IS.000 '7 24.000 13 70-000 9 zS -OO 0 -000
ewr %C MCI -79-0 LB7L 7039-0 9LIJMI4Ut .CEH rER CSTE~ 04-SEP-19R! FIT LOM- QU 'Al WXV/21M a)uvrE?-r0iarr iOaA.. or z .omv6L1TS- eZH/2V ENTI!RNCE. SH/I I'ICEIVINr EW'JEf-OFWEOI Q. EVAN15SC.N fMTE- w6C/rlIJ'. ?2R-P*1f1N I41t. ILIPHR~- ZSV 8SASE. 20V WIWOW SILVSR CFL1.9AIzaNPNO0M INMET6LTY LCFILCI 2876 .4 POa 45.00 FO- 54-14J
Fig. 8(a) (111) pole figure of 7039 aluminum (center).
24

Rockwell International- Science Center
FU SC5197.6FR
o CID-) C.11
1 .600 I -.Coo 3 1.50O 4 7.COG S 4.00c 5.000 7 L4O000 8 70000I a 25.000 0 XCi-000
EMT1 Jae " N.1g-01W71 W39-0 KUUN.C~4EitE 02I 04-sEP-i.9rM3PIlON- CU VT 3--V/21M CCUNmrn!~~'0rtaNPL r z.000(vsLI r5- 2'HI2V FNrm1~CE. wi SR/VECEm( NO MOIEE-O 0I 0. EVAN6scRm mrE- ?iIMIrlN. 73AHLPIffN W=2FIMR- 25V SeA. 204 WINOOW si1LvER CFLBFT~raIRN0QM INT~'66try LCRLCJ M5- Uw225.O0 FG*-S4.14
Fig. 8(b) (200) pole figure of 7039 alumninui (center).
25
Rockwell International- Science Center
A ci1jit
I -SO0 2 1-0013 3 L _E00 4 7.000 5 4.000(s 8-C3 '7 L 4.000 a 20. -a 8 2s .000 0) 300~f
LRM'T LJ NO .79- CI InL '709 - RgUMt NUM .. s CrE CM-SEP-19ff-DIT tON- cAj sr '1i/2wA CMNT~n-Imcramr i. Ar z .00KvS.Lr5- 7H(2V ENVTMrE. Sti/IV MECELVINOr if NEE1R-FV G. EV*4.SCA~N ffP7E& ir6t/JN. ?2PLrtt/MLN hL IuIL 1LFPR- 25Y CPE. 20V WU'400W SCLYEA cA~itefrcaiFT40MT IN T4I rY tCLCC ZUSB.7 11~ 45 .00 Mwz 54.'74
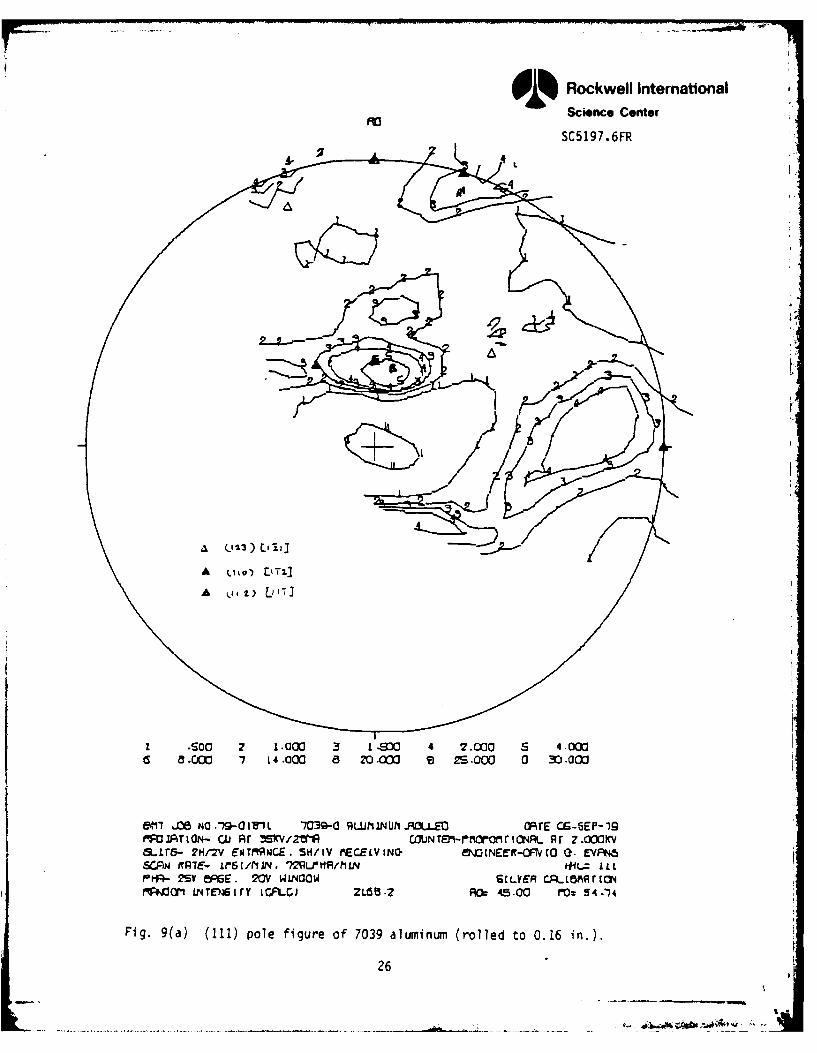
Fig. 9(a) (111) pole figure of 7039 aluminum (rolled to 0.16 in.).
26
... _ _ _ _ _ _ .........
Rockwell InternationalScience Center
RDSCS197.6FR
O (lea) L0011
co 1l23) U -L 2
L .500 2 1.000 3 1.500 4 Z.OWK 5 4.=035 15.000 7 14.400 a 20 .000 a zs -OM 0 IM.0OU
eTJM NO -19-0OIT t ~-G-- 9L.UM INUt1 .OLED aqE os-sf'-79jrgooirtaN- oi Rr mAvi2miR coNrER-rm0ormicmA or z~oa~v6LurS- 211/2V 614MOCE. THWv WCEzvNG CMNEV-ORV1O G. EvRN5scm fmrt- iPsh/miN. 7?...HflM1N M=2fmtf- E'V EASE. 20V WIN03W SILVER CF1LjFirrcNRpicamO irrNstrv tCFLC) M7.-) F13,2= 00 FCJP-S4.j'4
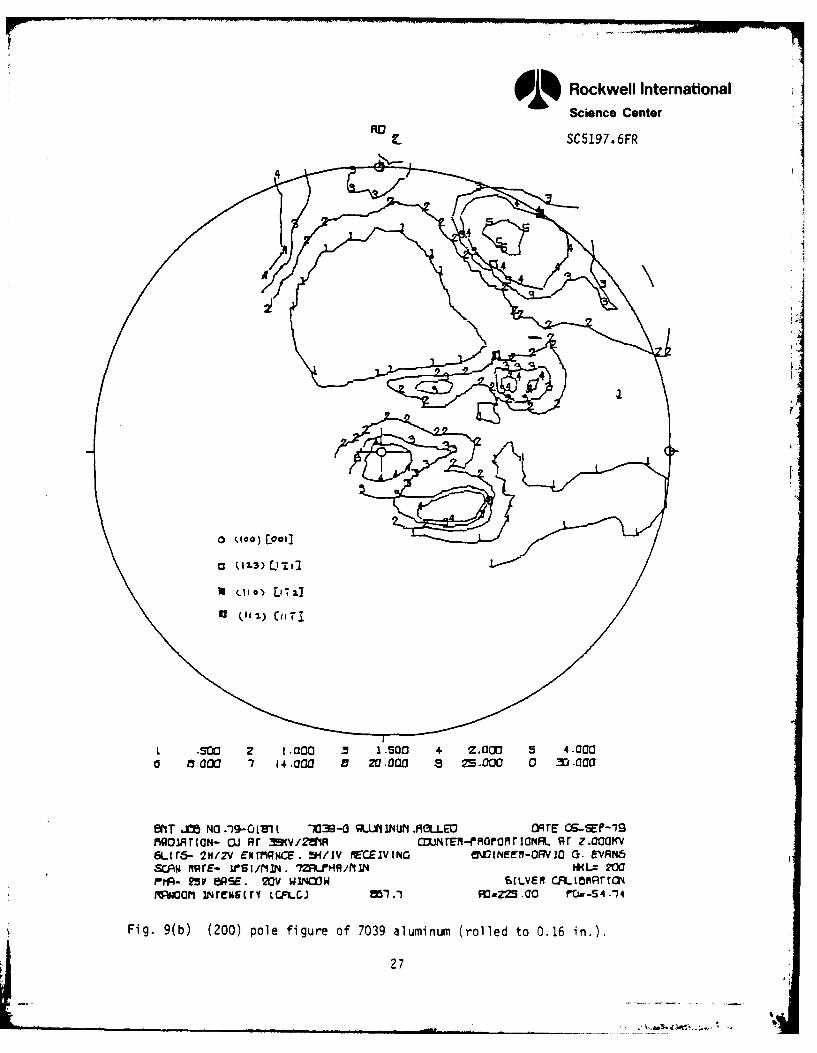
Fig. 9(b) (200) pole figure of 7039 aluminum (rolled to 0.16 in.).
27

E Rockwell InternationalScience Center
SC5197.6FR
indicated on the pole figures by various symbols. The surface texture of the
thick plate is found to be somewhat different from that of the center. All of
the samples showed some degree of cube (100) <001> texture, indicative of
recrystallization. The surface has 5 times random compared to 3 times random
at the center, suggesting that plate underwent fuller recrystallization at the
surface. The surface also has a weak (123) <121> type texture, which is a
typical f.c.c. deformation texture. A 4 times random intensity was also
observed around (113) <121> pole, which is not reported normally for this
material. In fact, this may simply be produced by a combination of (110)
<112> textures. The center of the 1.5 in. plate has a truer representation of
f.c.c. deformation texture (110) <112>, with six times random intensity. The
heavily rolled 7039 alloy is described by (123) <121> fairly well. However,
(110) <112> components might have joined to appear as (113) <121>. Again, a
times four random intensity is observed for the cube texture as well.
Based on Taylor factors (Figs. 2-5) several inferences may be drawn
from them and pole figures. An increased cube texture component in the sur-
face would be expected to make it more shear resistant than the center (as
suggested from Fig. 4). This result has been experimentally shown to be true
in the next section. Comparison for through-thickness compression resistence
in this manner does not seem possible since the intensities of different
deformation textures are not easily added together. However, due to strong
deformation texture the plate is considered to be stronger in the through-
thickness direction than in the plate plane. The plate rolled to 0.16 in. ap-
peared to be equally effective as far as through-thickness properties are
considered.
28
C2589A/bw
a-

0 % Rockwell InternationalScience Center
SC5197.6FR
The results of the detailed orientation distribution on the Taylor
factors are given in Table 2. These are calculated from the pole data
(Figs. 7-9), using the computer program discussed in Section 3.0. This table
indicates, as mentioned previously, that the surface region is expected to be
more resistant to shear deformation due to its higher (100) <001> component.
The reversal of shear and compression strength is also observed in going from
the surface to the center. However, the proximity of these normalized values
to unity do suggest that in all three conditions the anisotropy of plastic
properties is extremely small (fracture anisotropy may, however, be present),
perhaps because of the absence of strong (110) <112> texture. It night be
possible to develop such "brass type" rolling texture in aluminum either by
low temperature rolling, or by alloy modification to reduce stacking fault
energy, or a combination thereof. A grain refinement technique developed at
Rockwell Science Center might be used to proper advantage in this regard.
However, other f.c.c. materials might still offer a significant possibility of
texture strengthening for ballistic purposes, as shown on A-286 steel later in
this report.
29C2589A/bw

Rockwell InternationalScience Center
SC5197.6FR
Table 2
Normalized Taylor Factors (M/Mrandom) for 7039 Al
Stress-State Angle From Surface Center RolledRolling Direction (1.5 in. (1.5 in. (0.16 in.
thick) thick) thick)
0° 1.04 0.949 0.983
15" 1.04 0.955 0.983
Planar Shear 300 1.046 0.955 0.989
(through- 450 1.046 0.9603 0.995
thickness) 600 1.046 0.955 0.995
758 1.046 0.955 0.989
900 1.046 0.955 0.989
Compression
(through- Any 0.934 1.053 0.983
thickness)
30C2589A/bw

i Rockwell InternationalScience Center
SC5197.6FR
4.0 EXPERIMENTAL STUDIES ON STEEL AND ALUMINUM
The two steels included in this study were (1) 5% Ni steel, which was
studied extensively in the past year, and (2) precipitation hardening,
austenitic, A-286 steel. Both steels were specially rolled by Dr. Bill Hu of
U. S. Steel Corporation in an attempt to develop strong textures. The 5% NI
steel was known to have strong textures to promote high strength through
thickness compression and is an ideal material. The study undertaken was to
examine if high temperature fabrication processes such as hot bending or
welding would influence the mechanical properties of the steel. The study on
A-286 steel was a new one - the object was to develop strong textures in face
centered cubic steels, and study the resulting mechanical properties. The
aluminum alloy used in this study is 7039 alloy, which has important armor
applications. The object here was to characterize its crystallographic
texture completely by pole figures, as well as to determine shear 'And
compressive properties. The studies on each material is discussed next;
starting with aluminum.
4.1 7039 Aluminum
The composition of 7039 Al is 0.24% Fe, 0.09% Cu, 0.12% Si, 2.1% Mg,
4% Zn, 0.28% Mn, 0.02% TI and 0.12% Cr. The alloy was supplied in a
naturally-aged and precipitation hardened condition by contracting officer
representative, A. Zarkades of AMMRC. Grain size was somewhat large (50
um). While this plate was 1.5 in. thick, an additional piece rolled to 0.16
31C2589A/bw

OD) Rockwell InternationalScience CenterSC 5197.6 FR
in. was also supplied for examination. The x-ray pole figure data of these
materials have already been reported in Section 3.1. Shear and compression
results are discussed below:
Shear resistance was measured on approximately 0.100", thick strips
cut at various angles (00, 300 and 900) to the plate rolling direction. These
tests were made by pushing a rectangular tungsten carbide block through a
strip held between tungsten carbide dies. For the 1.5 in. thick Al armor
plate, property variation was expected between the surface and the center of
the plate, and therefore, strips parallel to the surface were cut from both
these areas.
Compression tests were also conducted from cylindrical samples (0.25
in. diameter, 0.5 in. tall) machined from rolling, transverse and thickness
directions of the plate, respectively. The combination of shear and
compression data was used to characterize the material.
The shear strength of 7039 Al armor is plotted as a function of di-
rection (in the rolling plane) in Fig. 10. The shear strength here represents
the maximum stress in the shearing operation and not shear yield stress. The
surface region maintains a consistently larger strength in comparison to the
center, even though the magnitude of this difference is approximately 4 ksi.
According to the Taylor factors calculated in Sections 2.0 and 3.1, the
greater surface shear strength is explained by a higher (100) <001> pole
intensity near the surface. While the in-plane shear anisotropy is not large,
the strips along the rolling direction exhibits somewhat greater strength.
32C2 589A /bw

Ol% Rockwell InternationalScience CenterSC5197.6FR
SC79-5081
50.0 SUR FACE .. 300
CENTER
z 3 v. -20
I- z
< 369
-100 X"
10- 7039 Al
-0 30 60 90
ANGLE FROM ROLLING DIRECTION (DEGREES)
Fig. 10 Shear strength of 7039 aluminum (1.5 in. stock) as a function ofrolling direction.
33

Rockwell InternationalScience CenterSC5197.6FR
Teflon and mineral oil combination was used for lubrication during
compression and no barreling was observed up to a strain of 0.2, thereby in-
dicating a uniform compression test at least up to that point. True
stress/true plastic strain curves for three directions in the plate are shown
in Fig. 11. The compressive yield was found to lie between 55 and 60 ksi de-
pending on the test direction. The curves show rapid initial work hardening
followed by a slow approach toward a nearly steady-state stress. The specimen
along the rolling direction exhibits the lowest yield and the lowest overall
curve. While the yield in the thickness and transverse direction are about
the same, the initial work hardening in the transverse direction is greater,
thus suggesting this as the most desirable direction (nonetheless impractical)
for use as armor. With increasing strain the thickness direction eventually
develops slightly greater strength than transverse direction.
The larger compressive strength in the transverse direction logically
fits with a smaller shear strength in that direction, as expected on the basis
of anisotropy-modified von Mises yield criterion. The anisotropy observed
here is not large and to a first approximation, a shear strength of nearly
40 ksi is explainable (a/2) from a nearly saturated uniaxial stress of 80 ksi.
The influence of high strain rate deformation on 7039 aluminum has
been conducted by Wulf. 14 In the strain-rate regime of 103-104/sec, the mate-
rial was found to be highly rate-sensitive. While the flow stress increased
with increasing strain rate, the adiabatic heating it caused led to a soften-
ing at larger strains. Deformation was highly localized in shear bands, which
according to Stock and Thompsoni5 experiences incipient melting. The
34
C2589A/bw

01%Rocwel2 Inernatonal
SC5197. 6FR
- - rTHCKNESS DIRECTION
go- TANSVERSE DIRECTION
01 ROLLING DIRECTION -o
-400
_W1 0.25
7039 Al
30- ~NOMINAL:C - 3.3 x 10⁻²/SEC. -0
-100
0 05.0.5.20 .250TRUE PLASTIC STRAIN
Fig. 11 Stress-strain curves in compression for 7039 aluminum.
35

Oil% Rockwell InternationalScience Center
SC5197.6FR
strain-rate in the present experiment was too low to produce any such effect,
however, the fact that do/de becomes very small beyond a strain of 0.1
provides an ideal condition for strain localization into shear bands and
adiabatic shear tendencies in spite of the high thermal conductivity of Al.
The sheared fracture profile is shown in Fig. 12a, which yields a
shear fracture strain of approximately 2.25. However, the ballistic resis-
tance, provided by such a high fracture strain is not extremely large since
the work hardening rate is rather low. It appears that alloy modification to
either increase the yield strength or increase the work hardening rate (for
this yield strength) would be of value in this respect even at the expense of
fracture strain. Care should be exercised, however, such that low temperature
properties do not become inferior. The fracture profile also shows no unex-
pected effects such as delamination, which were found to occur in 5% Ni steel
at ballistic velocities. Figure 12b is a fractograph from this material show-
ing elongated dimples which are indicative of ductile fracture process. Sub-
stantial inhomogeneity was also noticed in the fracture surface possibly sig-
nifying local segregations. Since these heterogeneities were located closer
to the plate center, the surface to center variation (Fig. 10) might also be
related to this.
4.2 5%-Ni Alloy Steel
Motivated by the improved ballistic performance with increasing
(111) + (112) intensity in the 5% Ni steel plates, a plate was further rolled
to a thickness of 0.25 in., to yield a (111) Intensity in the plate 11 times
36
C2589A/bw
ij ~1.1

Rockwell InternationalOD Science Center
SC5197.6FRSC80-10146 *
y = tan 0= 2.25
(a)
(b)
Fig. 12 (a) Shear fracture edge and (b) fracture surface for 7039 aluminum.
37

Rockwell InternationalScience CenterSC5197.6FR
random. Shear and tensile tests were carried out on this material as well as
two of the 0.5 in. plates from a previous study.' Their mechanical properties
are listed in Table 3 next to their texture intensities.
Table 3
Mechanical Properties of 5% Ni Steel
Texture Yield Tensile Max TotalIntensity Strength Strength Shear Elongation(Thickness) (ksi) (ksi) (Ksi)
A3.8xR(1/2 in.) 230 293.8 189.2 9%
9.lXR(I/2 in.) 260 301.2 195 6% e n
llxR(1/4 in.) 251.5 297.6 178 7.5%
It is observed that total elongation increased and strength decreased with
increase in texture intensity from 9 to 11. The strength decrease is evident
in both tension and shear tests and may be responsible for the poorer
ballistic properties of the 1/4 in. rolled steel. A further microstructural
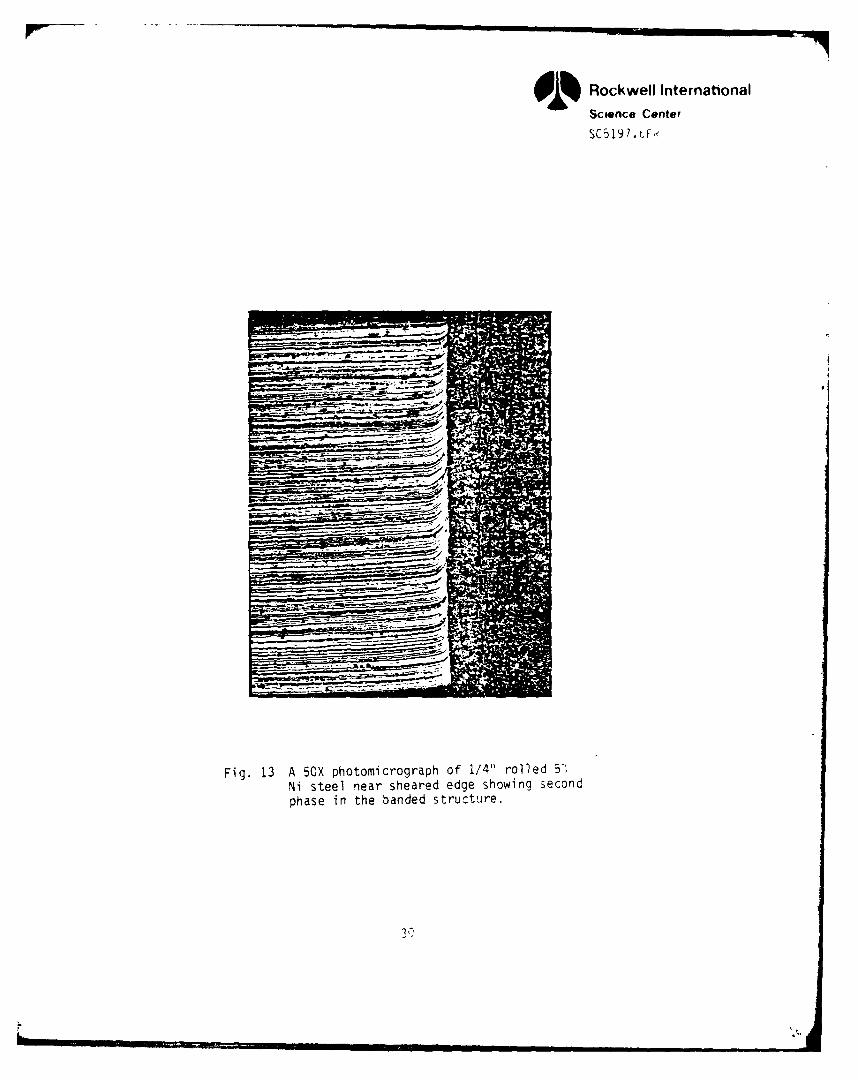
degradation has been observed in the 1/4 in. rolled plates. Figure 13 shows
cross-section of sheared test specimens indicating substantial fiber bending
at the tear location. However, the layers are filled with inclusions and
second phase materials, which tend to join and cause delamination. This has
also been observed in these tests.
Warm fabrication treatment was simulated on the 5% Ni martensitic
st'el (hot rolled and quenched) of Hu et al.,3 which was used in last year's
research program. The simulation amounted to exposures of strips (.080"
38C2589A/bw
E~Rockwell International0 % Science Center
SC 519 7. r-Fs
Fig. 13 A SOX photomicrograph of 1/4" rolled 5-Ni steel near sheared edge showing secondphase in the banded structure.
3')

0 % Rockwell InternationalScience CenterSC5197.6FR
thick) cut from the plate rolling direction at 6210C (1150*F) and 677%C
(1250*F) for 1/2 hour in vacuum environment, followed by air cooling. The
strips were wrapped in Ta foil to minimize oxidation. Both the weakest and
strongest texture intensities Imx 3.8 x and 9.0 x random) were treated in
this manner. Subsequent to the thermal treatment tensile specimens were
ground from some of the strips and both tensile and shear tests were con-
ducted.
The results of vacuum annealing heat treatment on the 5% Ni steel
armor are shown in Table 4 and are expected to indicate roughly the influence
of a warm fabrication process. Actual fabrication would take shorter time
than 1/2 hour, however, heat up time might be longer. The defect structures
introduced during warm fabrication would produce increased strength and tough-
ness in comparison to the values listed in Table 4. With such expected dif-
ferences in mind, the maximum strength in shear is found to drop approximately
22% by annealing at 621% and nearly 25% for the 677% treatment. The differ-
ence between the high and low texture intensity was small. Tensile yield drop
is also about 25% for the intense textured steel (Imax = 9.81) at 621%C but
considerably more (nearly 70%) at 6770C. The lower texture intensity material
also showed a drop to 15% at 6210C and 63% at 677*C. This 560C increased in
temperature appears to be quite dramatic in reducing the tensile strength even
though the shear strength is not altered significantly. A partial reason for
this might lie in the increased tensile ductility as reflected by the total
elongation values. While such large strength reductions may not occur during
the processing step, a 15Z strength loss may be expected on account of warm
processing of the quenched 5% NI armor steel plate.
40
C 2589A/bw

01% Rockwell InternationalScience Center
SC5197.6FR
Table 4
Shear and Tensile Properties of Steel ArmorBefore and After Annealing Heat Treatment
Parameter Texture Intensity Strength (ksi)* for the ConditionMeasured (x Random) As-Received 621°C/30 min 677°C/30 min
Shear Strength 3.8 189.2 151.0 142.4(max)
9.1 195.0 148.4 145.5
Tensile Yield 3.8 230 195.9 84.6Strength
9.1 260 194.5 77.4
Tensile 3.8 9% 12% 15% r
Elongation9.1 6% 11% 14%
*Values averaged from three tests.
4.3 A-286 Steel
This is a heat resistant precipitation hardenable Fe-Ni-Cr-Mo alloy
of the following nominal composition:
Table 5
Composition of Wrought A-286 Steel (wt %)
C Mn Si Cr Ni Mo Ti Al V Fe
0.008 1.35 0.5 15 26 1.25 2.0 0.25 0.3 Remainder
In the precipitation hardened condition this steel offers excellent
combination of strength and toughness. This steel is weldable and has been
used in gas turbine and other creep-resistant applications. While good
41
C2589A/bw

Q % Rockwell InternationalScience Center
SC5197.6FR
ballistic performance is expected of this material in its conventionally
processed condition, it was felt that appropriate thermochemical processing
can generate additional texture strengthening. Since this is an austenite-
stabilized steel, guidance was available from Kula and Lopata's 16 work on 4340
steel, which was rolled in the austenitic(y)state. In their work it was
estimated that a strong texture developed in y which upon quenching gave rise
to a strong (110). texture through Kurdjumov and Sachs transformation. This
suggested that in A-286 steel, a possibility exists for developing a strong
(111)C deformation texture, which according to Fig. 3 suggests superior
performance.
Eight coupons of A-286 (1.5 in. x 4 in. x 0.075 in.) processed by
different thermomechanical treatments, were supplied by Dr. Bill Hu of U.S.
Steel Corporation. These strips were first solution-treated at 1800°F and
then rolled (90%) at 18000F, 1500*F, 9000F and 80*F respectively. One batch
of four coupons were supplied in this as-rolled state. The other batch of
four underwent recrystallization at 20000F and quenched. The U.S. Steel
designations of these specimens are summarized in Table 6, and a description
of their pole figure (courtesy Bill Hu) follows.
P941-X7: Very weak, intensity maxima about 3
-X5: Very strong, Copper-type, intensity maxima 8.
-X2: Very strong, Copper-type but broadened, intensity maxima 8.
-X2: Strong, Brass-type, intensity maxima 6.
P941-X7R: Practically random.
-XSR: Mainly (111) <110> plus (001) <110>, intensity maxima about 5.
42C2589A/bw

OD Rockwell InternationalScience Center
SC5197.6FR
-X2R: Mainly (112) <111>, intensity maxima about 7.
-XBR: Mainly (110) <112> plus (110) <001> (in situ recrist.), intensity
maxima about 5.
(Copper-type, mainly (110) <112>, (112) <111>, plus (123) <412>; Brass-type,
mainly (110) <112> plus (110) <001>.)
Table 6
Thermomechanical Treatments* of A-286 Steel
Rolled Rolled and Recrystallized
Designation Rolling Designation Rolling RecrystallizationTemperature Temperature Temperature
P941-X7 1800°F P941-X7R 1800°F 2000°F
P941-X5 1500°F P941-X5R 1500°F 2000°F
P941-X2 900=F P951-X2R 900°F 20000F
P941-X8 80oF (CR) P941-X8R 80=F (CR) 2000=F
*All materials were first solution treated at 1800=F for 1 hour.
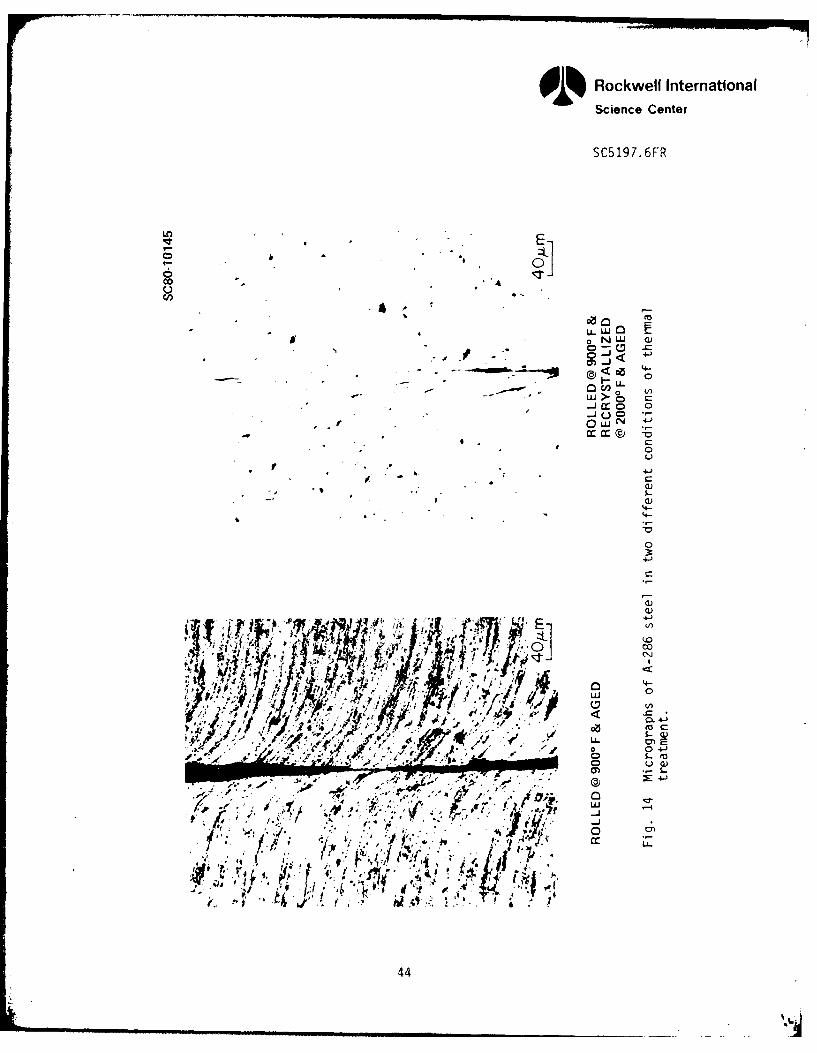
Microstructures of two of these steels are shown in Fig. 14. The
rolled structure is banded with fine precipitates observable. The recrystal-
lized structure shows equiaxed grain structure 50 Pm diameter on the average.
It is speculated that some amounts of grain growth also occurred during the
recrystallization treatment.
The tensile stress-strain curves in the recrystallized condition are
shown in Fig. 15. While these data are essentially independent of rolling
temperature, rolling at 9000 and 1500°F appear to provide slightly improved
strength. The tensile yielding is found to occur around 33 ksi in the
43C2589A/bw
I II II I II
Rockwell International0% Science Center
SC5197.6FR
00 A'
6C - U6~
-i cc0 0
6L N
0
0t .'
wU
C
44.-
'04s-fjcc
0
~ ~#.cc
44J. -

Rockwell InternationalScience Center
SC5197.6FR
SC80-9221140 1
120 ROLLING TEMP.: 1800F 15000 F 9000 F 800 F
1002
80u,
S60-
0I I I I I I0 0.05 0.10 0.15 0.20 0.25 0.30 0.35
TRUE STRAIN
Fig. 15 Tensile stress/strain data for A286 steel after rolling andrecrystallIi zati on.
45
ROLLE & RERYSTALIZE

R ockwell InternationalScience Center
SC5197.6FR
recrystallized state, similar to a mild steel. Work hardening is quite
pronounced and substantial elongations are possible (see Table 7).
Table 7
Tensile Properties of A-286 Steel
Condition I.D. Yield Stress Ultimate Tensile Uniform Total *
(ksi) Stress Elongation Elongation(ksi) (%) (%)
X7-HR 36 84.6 30 44
X5-HR 95 125 11 17
Rolled X2-HR 96 164 1.5 5
X8-HR 100 162 1.3 5
X7-R 30 79.3 32 38
X5-R 31.2 80.7 31.5 42
Recrystallized X2-R 31.2 80.7 31.5 42
X8-R 32 81.4 31 36
*Elongation measured over 1 in. gage length.
The rolled material (Fig. 16) on the other hand, exhibited increasing
strength with decreasing rolling temperature. Rolling at 1800'F generates
strength properties somewhat better (37 ksi) than the recrystallized material,
while 1500°F rolling causes significant improvement (approximately 95 ksi).
The lower rolling temperatures (900°F and 80°F) produce extremely high
strength (- 160 ksi), possibly due to high dislocation density. This is
speculated on the basis of the fact that the rolling at 80°F is no different
for such high strength material from that at 9000F. The ductility drops,
however, with decreasing rolling temperature and these are listed in Table 7.
46
C2589A/bw

Rockwell InternationalScience Center
SC5197 .6FR
SC80-9222180
.8rF
160 / 9000 F
140
120
'~-AVERAGE OF ROLLED &w RECRYSTALLIZED DATA
40 A-286 STEEL
00, ROLLED AT TEMP. INDICATED
06, 0.05 0.10 0.15 0.20 0.25 0.30 0.35TRUE STRAIN
Fig. 16 Tensile stress/strain data for rolled A-286 steel compared againstthat for recyrstallization material.
47

Oi% Rockwell InternationalScience Center
SC5197.6FR
The limited supply of the A-286 steel did not permit a detailed
investigation of its properties in various directions in the plate (particu-
larly after cropping off the shear cracked edges). In addition to the tensile
tests on the as-rolled and as-recrystallized materials described above,
rectangular shear test specimens (0.5 in. x 3 in.) were machined for studies
in both aged and as-received condition. Furthermore at least five small
pieces (a 5 in. x 0.5 in. or smaller) of the same material were stacked
together and bonded with epoxy to produce a 0.4 in. thick plate. Through-
thickness compression test specimens (0.25 in. diameter) were machined from
these five layer plates and aged at 1300*F for 8 hours for precipitation
hardening before testing. Half of the shear test specimens were also aged
under the same condition before testing.
All shear test data are plotted in Figs. 17(a) and (b) as a function
of rolling temperature. Shear yield strength values are indicated by dashed
curves while the maximum strength in shear is indicated by solid curves.
Figure 17(a) shows a large spread between the yield and maximum strength
values for the recrystallized material, as observed in the tensile data. The
shear yield strength values are roughly half of the corresponding tensile
values in both rolled and recrystallized conditions. The rolling temperature
effects on the rolled data is very similar to the tensile test results, an
increase in temperature bringing closer to the recrystallized values.
The two lowest rolling temperatures (80*F and 900*F) appear to be the
most promising from the standpoint of texture strengthening since they contain
strong "brass-type" textures or (110) and (112) textures (see Fig. 3). This
48C2 58 9A/bw

Rockwell InternationalScience Center
SCa197.6FR
I I I I
I 0
CC-I 44
P. cc I
1,-~. LAL
d)
0 40
SL44J-4-
(S)3nI VV:dW,I WOO IV H INHS bVHS 494
[.,
W)W
a AA 0
cc94
'?Rockwell International0 % Science Center
SC5197.6FR
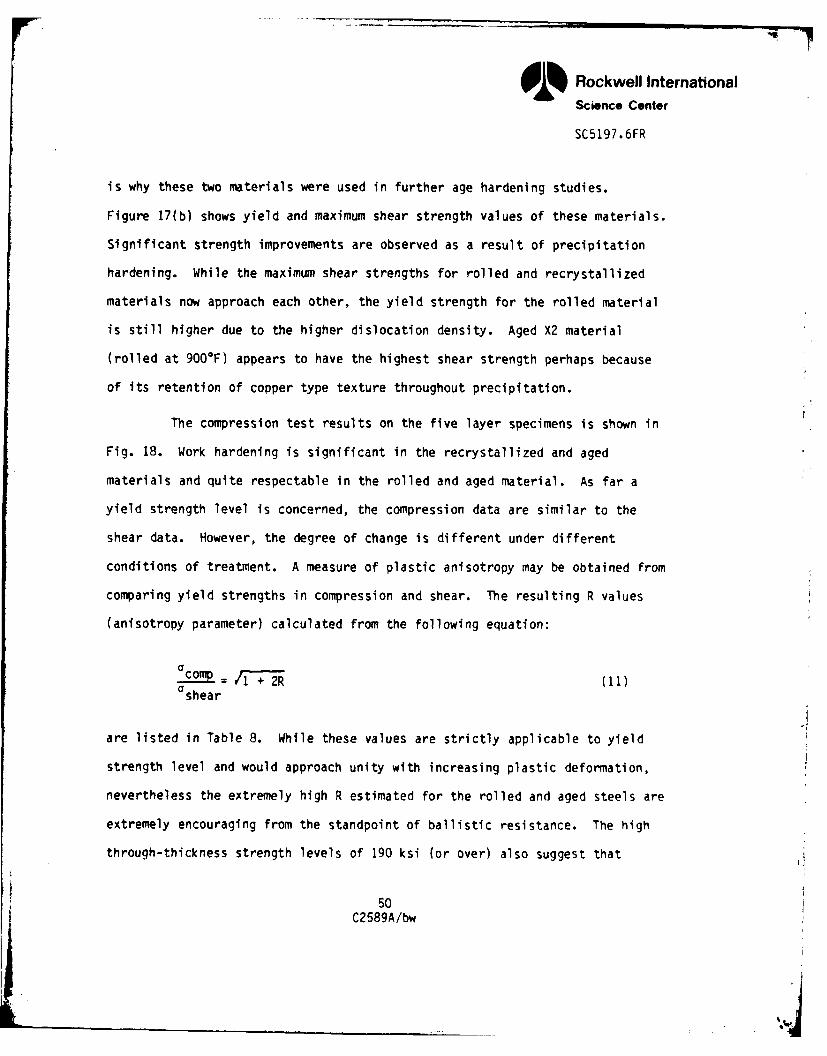
is why these two materials were used in further age hardening studies.
Figure 17(b) shows yield and maximum shear strength values of these materials.
Significant strength improvements are observed as a result of precipitation
hardening. While the maximum shear strengths for rolled and recrystallized
materials now approach each other, the yield strength for the rolled material
is still higher due to the higher dislocation density. Aged X2 material
(rolled at 900 0F) appears to have the highest shear strength perhaps because
of its retention of copper type texture throughout precipitation.
The compression test results on the five layer specimens is shown in
Fig. 18. Work hardening is significant in the recrystallized and aged
materials and quite respectable in the rolled and aged material. As far a
yield strength level is concerned, the compression data are similar to the
shear data. However, the degree of change is different under different
conditions of treatment. A measure of plastic anisotropy may be obtained from
comparing yield strengths in compression and shear. The resulting R values
(anisotropy parameter) calculated from the following equation:
cop=f _2R(10shear
are listed in Table 8. While these values are strictly applicable to yield
strength level and would approach unity with increasing plastic deformation,
nevertheless the extremely high R estimated for the rolled and aged steels are
extremely encouraging from the standpoint of ballistic resistance. The high
through-thickness strength levels of 190 ksi (or over) also suggest that
50C2 589A /bw

OiRockwell InternationalScience Center
SC5197.6FR
240 1 1 11 1SCRO-9224
200 -,
IO-
1404
1001

E~Rockwell InternationalScience Center
SC5197.6FR
this is a good possibility. However, these strength values are somewhat less
than those of 5% Ni Steel, and it is doubtful if further improvement of
ballistic properties over this material is likely. It is suggested, however,
that future studies should aim at the ballistic testing of this material.
Table 8
Strength Anisotropy of A-286 Steel
Condition Yield Strength (ksi) Yield Strength (ks) Estimated(Shear) (Compression) R
Rolled at 80*F (X8) 70 195 3.38+ Aged
Rolled at 900*F WX) 71.5 192 3.10+ Aged
X8 + Recrystallized 47.5 100 1.72+ Aged
X2 + Recrystallized 46 71 0.69+ Aged
4.4 Measurement of Young's Moduli
Prompted by the observed relationship between elastic modulus
anisotropy and the anisotropy of plastic properties, a study was undertaken to
measure Young's modulus of a number of test materials in a variety of
processing conditions.
Measurement of Young' s modul us was carried out on 5% Hi steel and
7039 aluminum armor materials, both in as-received as well as rolled condi-
tion. The modulus measurement was carried out by an ultrasonic pulse echo
52C2 589A /bw

Rockwell InternationalScience Center
SC5197. 6FR
technique with a 15 MHz transducer. The average time delay between successive
pulses was measured to obtain the velocity of longitudinal elastic wave.
Specimen density was determined separately from mass and volume measure-
ments. Young's Modulus, E, was calculated by using the equation:
E= Pc2 (1 - MR)( + v)E PL U1 - V)
*where p= density, cL = velocity of longitudinal wave, v Poisson's ratio.
The Poisson's ratio for steel was chosen to be 0.26 and for aluminum 0.33 from
* the handbook.
Young's modulus was measured from three orthogonal directions of
0.5 in. cube specimens of as-received materials. For the 1/4 in. rolled stel
and 0.16 in. rolled 7039 aluminum measurements were possible only in the
thickness direction. These measurements are tabulated below (Table 9).
A small increase in elastic modulus is recorded in going from I
38t max = 9.1. The work of Stickels and Mould1 has shown that such a
* small change in Young's Modulus can mean a significant increase in normal
plastic anisotropy (R). This, in turn, would be responsible for the high
* through-thickness compression resistance of the steel of Imax = 9.1. In the
case of 7039 aluminum, the elastic anisotropy is essentially nonexistent.
53C2 589A /bw

OT Rockwell International
Science Center
SC5197.6FR
Table 9
Young's Moduli
Material Test Young's TextureDirection Modulus Intensity
5% Ni Steel Rolling 30.56(0.5 in. thick) Transverse 31.09 3.8
Thickness 30.62
5% Ni Steel Rolling 30.62(0.5 in. thick) Transverse 31.25 9.1
Thickness 31.86
Rolled5% Ni Steel Thickness 31.69 11.0(1/4 in. thick)
7039 Al Rolling 10.79(1.5 in. thick) Transverse 10.72
Thickness 10.79
7039 Al Thickness 10.72(0.16 in. thick)
54C2589A/bw
Rockwell International
Science Center
SC5197.6FR
5.0 BALLISTIC LIMIT CALCULATION FOR FLAT-ENDED PROJECTILE IMPACT
Plate penetration by projectile impact is an extremely complex
problem for analysis, particularly when plastic work of deformation has to be
accounted for in addition to the propagation of elastic waves in the solid.
Consideration of certain aspects of these effects are observed in the
literature.17"20 The work of Recht and Ipson10 primarily considers momentum
transfer and plug acceleration for developing the conditions of plug ejection
by shear. Woodward and de Morton 18 have considered strain hardening
properties of plate material as well as plug acceleration and the ballistic
wave propagation in their velocity/stress relationships. However, heat
generation and strain-rate sensitivity of flow stress have not been taken into
account. Furthermore, the influence of plastic anisotropy (due to
crystallographic texture) of plates resulting from thermomechanical processing
effects have not been considered either.
The purpose of this work is to emphasize the internal plastic work
performed on the plate material whose strain hardening, strain-rate sensi-
tivity and plastic anisotropy properties are included in the calculation of
plastic work. Furthermore, the deformation work is not simply restricted to
shear plugging type action, but a combination of through-thickness compression
and shear on planes of velocity discontinuity (as in the upper bound ap-
proach). The heat generation is taken into account and in an approximate
manner the heat conduction away from the deforming zone has also been
incorporated in the calculation. The interest here is in the prediction of
55
C 2589A/bw
I.

Rockwell InternationalScience Center
SC5197.GFR
ballistic limit, and while it is realized that wave propagation effects become
increasingly important at extremely high projectile velocity, it is assumed
that this is not a significant factor in the perforation of at least up to
0.5 in. (12.7 mmn) thick steel plates as long as the work for plug acceleration
is taken into account. Furthermore, the deformation (mushrooming) effect of
the projectile is neglected In the analysis.
The analytical scheme followed here involves division of the plate
into a number50 of small elements in the through-thickness direction
(Fig. 19). Upon projectile impact, firm contact with the plate is assumed to
occur immnediately, as the plug accelerates to a velocity which is commnon to
the plug and the penetrator. This simple, kinetic energy balance is given by,
1/2 M~ v 2 = 1/2(M + M ) v2 (12)
where % p= projectile mass, M, - plug mass, v. = impact velocity, and v
commnon velocity after the energy transfer. (When plug dimensions are known,
this velocity can be determined). Attainment of this velocity is a
prerequisite for the plastic penetration process to begin at such a high rate
of impact.
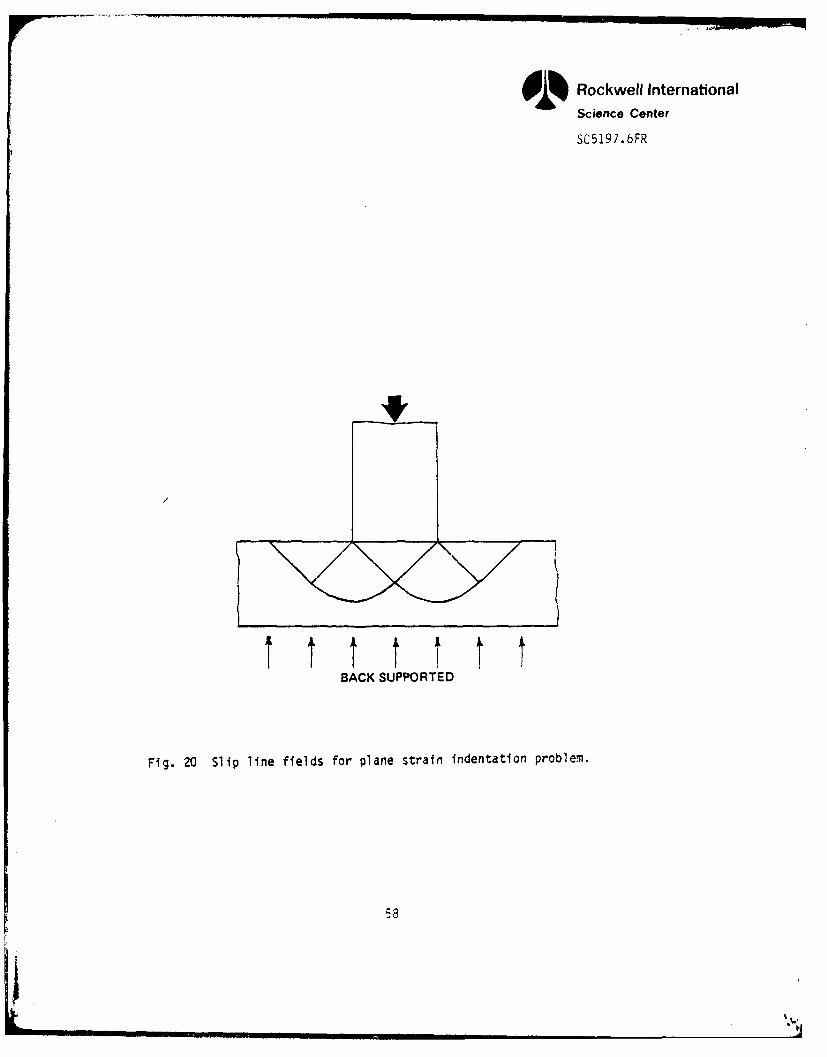
Plastic deformation is supposed to begin by through-thickness com-
pression of the elements underneath the penetrator. In the case of a plane
strain problem, slip line fields can be constructed for the penetrator entry
by extrusion of material upward (along the sides), as shown in Fig. 20. This
is generally the situation when the plate is entirely supported from the
56C 2589A/bw

Rockwell InternationalScience Center
SC5197.6FR
r-
PROJECTILE
VELOCITY = v
PLATE
Y431h
SHEAR VEL.
rN/2 (r+ y)/2VERTICAL VEL.
(r+y) i/2
t IRADIAL VEL.(r + Y) /2
Fig. 19 Schematic of the shear-based ballistic perforation process andvelocity hodograph (insert).
57
Rockwell InternationalScience Center
SC5197.6FR
BACK SUPPORTED
Fig. 20 Slip line fields for plane strain indentation problemn.
58

OD Rockwell InternationalScience Center
SC5197.6FR
back. In the case of an axisymmetric projectile with no back plane support
for the plate (Fig. 19), however, the planes of velocity discontinuity must
allow plate bending across a boundary of shear.
Thus, the boundary of the elements undergoing compression is defined
by a 450 shear cone emanating from the bottom end of the projectile at all
times during the perforation process. The compressive strain in each element
is assumed to be the same everywhere, varying from one element to the next.
The compressive action in each slab element pushes material outward, which
then suffers a shear displacement at the boundary. This causes a relative
upward displacement of the excess material with respect to the slab itself
(Fig. 19, inset).
In the case of very thick plates, upward extrusion of part of this
excess material might be significant, however, it is assumed here that the
relative displacement leads only to the downward motion of the slab by an
amount necessary to move the excess material above the shear plane.*
The plug, defined by the truncated shear cone, at the initial instant
of impact has a mass, Ml, given by
M r { + (r...h)_ hp (13)
*For plate thicknesses no more than twice the projectile diameter, no upwardextrusion on the top surface of the plate has been observed.21
59C2589A/bw

01% Rockwell InternationalScience Center
SC5197.6FR
where, r penetrator radius, h initial plate thickness and p = density of
plate material. When this value of M1 is substituted in Eq. (12), the conunon
velocity, v, to which the plug is accelerated is obtained. This also
constitutes a slowing of the projectile.
Plastic perforation process can now begin under kinetic energy
supplied by the remaining velocity of the projectile. If yo is the perforated
thickness at an instant when y is the distance of an element from the bottom
of the projectile, and if after a time At, these dimensions become yo and y',
respectively, then the volume of material leaving the element in question
(during this time increment) is
AV = iTh0 [(r + y)2 eE - (r + y'1)2 e-(e+AC)] (14)
where ho = initial element thickness, r projectile radius, E and e + A=
compressive strain in the element before and after the time increment, respec-
tively. This volume of material would add to a vertical cylinder of average
radius, r + (y + y')/ 2, and average wall thickness, ho e-c + e'(E+Ae)/
whose length increases by an amount, Ay, the vertical component of the
relative shear displacement, where
Ay N(Y + Y' ) - (yo + y) (15)
60
C2589A/bw
+ _. II

Rockwell InternationalScience Center
SC5197.6FR
Thus the volume gained in the cylinder is
AV = 2n (r +L-jL) ho & +2 AY (16)
which must equal to the expression in Eq. (14). Now, if v is the projectile
velocity during time increment At, y - Yo = vAt. This can be substituted in0
Eq. (14) and subsequently equating Eqs. (14) and (16), we obtain
vAt (r + y)2 _ (r + y')2 e-&E(rt + + (y - y') (17)
The perforation problem may be solved by assuming the process to be
quasistatic in small time increments, during each of which the projectile
velocity, v, is constant. Starting from the first element (y = y' = 0), the
resulting strain increments are calculated to statisfy Eq. (18). Once the
strain in a given element is known, the new position, y', for the next element
can be obtained by summing the preceding element thicknesses.
To determine the internal plastic work done during perforation, the
following stress-strain-strain-rate relationship is used:
a = Kcn + Lm (18)
where a = stress, c = strain, strain rate, K = strength constant, n =
strain hardening exponent and m = strain-rate sensitivity. This additive
constitutive law is applicable reasonably well to high strain-rate deformation
61C2589A/bw

Rockwell InternationalScience Center
SC5197.6FR
as evidenced by stress-strain curves at various strain-rates that are nearly
parallel to one another.22 This kind of data has been developed for mild
steel and high strength steel, and high hardness armor is not believed to
behave significantly differently. In other descriptions of constitutive law
the rate-sensitive part of the stress is given by M, log (t/ 0) where M, is
the rate sensitivity parameter and to is a reference strain rate at which the
second term is vanishingly small. However, it is not clear if this
description offers any greater accuracy over Eq. (18).
The computation of plastic work rate in each element requires summing
the work rate in compression with that in shear. The velocity hodograph
illustrated in Fig. 19 (inset) suggests that the shear velocity
is M'(r + y)/2. Since the truncated conical surface area for shear is
2 2n (r + y) h0 e" , and the elemental volume undergoing compression is
r(r + y)2 h0 e " , the plastic work increment in each element is:
Q = t • (volume) + T • (velocity) • (surface area)
= a (r-y) 2 ho e-E + T /2(r + y) 2'2n(r + y) h0 e- c
(19)
Assuming roughly that T = a/2, the plastic work increment rate can be written
as
p 2at n(r + y)2 h0 e-c (20)
62C2589A/bw
I ,III IIL

R ockwell InternationalScience Center
SC5197.6FR
In reality, since strain rate at the shear boundary is much greater than the
strain rate within the element, T > o/2, thus p in Eq. (20) is an under-
estimate. The total plastic work rate, W p, is obtained by suming these rates
for all elements.
The frictional work on the projectile bottom is neglected, however
that on the projectile cylindrical surface is calculated according to the
scheme shown in Fig. 21. Since normal pressure is nearly a at the bottom end,
the average frictional force, F, is (pa/2) 27rryo, which leads to a work
increment rate
Wf = Wulary 0v (21)
where u = coefficient of coulomb friction. A lower bound value of the total
work increment rate, W Wp + is obtained after substituting a from
Eq. (18).
Now if the projectile is assumed to have a velocity is v during a
small time increment, At, its kinetic energy at the end of At is
1 M v' 2 = 2 W At (22)M p = MpV
where v' velocity at the end of the time increment. The latter is thus
given by,
v, =1/v 2 - 2 (23)
p
63C2589A/bw

0D Rockwell International
Science Center
SC5197.6FR
PROJECTILE
PLATE
Fig. 21 Approximate pressure distribution and friction forces on the sidesurface of projectile.
64
;p..

Rockwell InternationalScience Center
SC5197.6FR
which progressively decreases with time. The perforation process is thus
simulated by allowing the projectile to move stepwise into the plate and
reestablishing the shear boundary locations as indicated in Fig. 19. The
overall deformation zone shrinks during this process thus leading to
progressive bulging on the back of the plate (see Fig. 19). After the
projectile has penetrated sufficiently, if shear fracture were to occur on
these boundaries, a plug with shear ledge will be ejected. (No back spalling
or shattering failure is simulated by this model).
The influence of plastic anisotropy of plates resulting from
oreferred crystallographic orientation is simply accounted for through the
normal anisotropy parameter, R, with the assumption that the plate is
isotropic in its plane.2 3 Under this assumption the through-thickness
compressive stress (at) in the terms of in-plane stress (a) is given by the
relationship:
at = -- 0 (24)
A continuum study of the texture effect is conductd by varying R and allowing
a in Eq. (9) be replaced by ot. The results of this as well as those of n and
m variations are discussed later.
Thermal Effects:
An approximate account of heat generation and dissipation during the
nerforation process has also been made. Short of a complete three-dimensional
65C2589A/bw
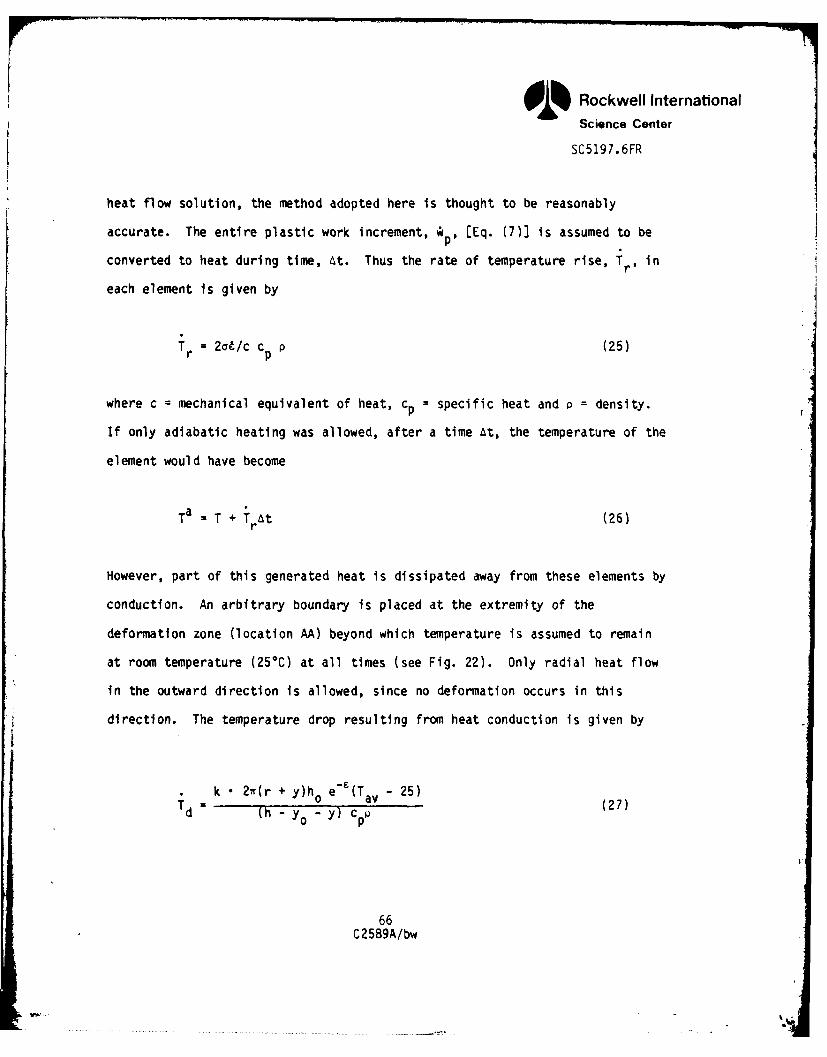
01% f Rockwell InternationalScience Center
SC5197.6FR
heat flow solution, the method adopted here is thought to be reasonably
accurate. The entire plastic work increment, %p, [Eq. (7)] is assumed to be
converted to heat during time, At. Thus the rate of temperature rise, T inr'n
each element is given by
Tr = 2o/c c p (25)
where c = mechanical equivalent of heat, cp = specific heat and p = density.
If only adiabatic heating was allowed, after a time At, the temperature of the
element would have become
Ta , T + T At (26)r
However, part of this generated heat is dissipated away from these elements by
conduction. An arbitrary boundary is placed at the extremity of the
deformation zone (location AA) beyond which temperature is assumed to remain
at room temperature (250C) at all times (see Fig. 22). Only radial heat flow
in the outward direction is allowed, since no deformation occurs in this
direction. The temperature drop resulting from heat conduction is given by
k • 2w(r + y)h0 e'F(Tav - 25)Td x (h - Yo - y) cpp (27)
66C2589A/bw
WWJ

OD ScenceCenter
SC5197 .6FR
AT~~ T-=250 C
HEAT GENERATED-hNCONDUCTION
A
Fig. 22 Schematic diagram illustrating the zone and direction of heatconduction.
67
Rockwell InternationalScience Center
SC5197.6FR
where k = conductivity, Tar = (Ta + T)/2 in centigrade units, h = initial
plate thickness and (h - yo " y) is the length of the conduction zones at each
element location. The net temperature rise (AT) is then computed from
Eqs. (25) and (27) as follows:
AT = (Tr " Td) At (28)
The influence of this heating effect on local material flow proper-
ties is also accounted for in an approximate manner. Literature data24 on
high strength and mild steels indicate a very gradual decrease in flow stress
with increase in temperature - nearly a 20% decrease at about 600 0C and then a
more rapid drop at higher temperatures. The temperature dependence of flow
properties is accounted for by allowing K and n in Eq. (18) to be temperature
dependent. These functions are approximately described by
KT a K exp {- 0.000558 (T-25)}
(29)
nT = n exp I" 0.000558 (T-25)
where KT and nT are the K and n values at T*C, K and n being their room
temperature values.
68C2589A/bw
Rockwell InternationalScience Center
SC5197. 6FR
Analyti cal Resul ts
The bulk of the calculations carried out here used values of material
properties that are quite representative of 5% Ni steel armor. These were
selected as K = 300 ksi, n - 0.05, L =6 ksi, m = 0.3 with a projectile mass
of 0.12 lb. Some calculations were also carried out with L = 2 ksi which
indicates a rather low rate sensitivity. Both plate thickness and projectile
diameter were chosen to be 0.5 1n. Figure 23 shows a plot of how projectile
velocity drops duri'ng the process of penetration. The initial rapid drop is
due to the need for plug acceleration. Law velocity projectiles cannot go
past this stage to cause any penetration. Providing initial velocity is suf-
ficiently high, the penetration progresses and subsequent decrease in velocity
occurs at an increasing rate. For a 0.5 in. thick plate, it has been assumed
that when perforation progresses to the extent of 0.4 in., shear fracture
causes plug ejection. This arbitrary fracture criterion is built into the
model.
Figure 24 shows the residual velocity of plug and projectile combina-
tion as a function of initial plug velocity for a few different anisotropy
parameters. The approach to ballistic limit (i.e., zero residual velocity) is
clearly marked by a rapid drop in residual velocity from a 450 linear be-
havior. This simulates observed18 behavior extremely well.2 Calculations at
and above ballistic limit have shown that melting temperature has been
achieved locally. Furthermore, the anisotropy influence on ballistic limit is
also seen.
69C2589A/bw
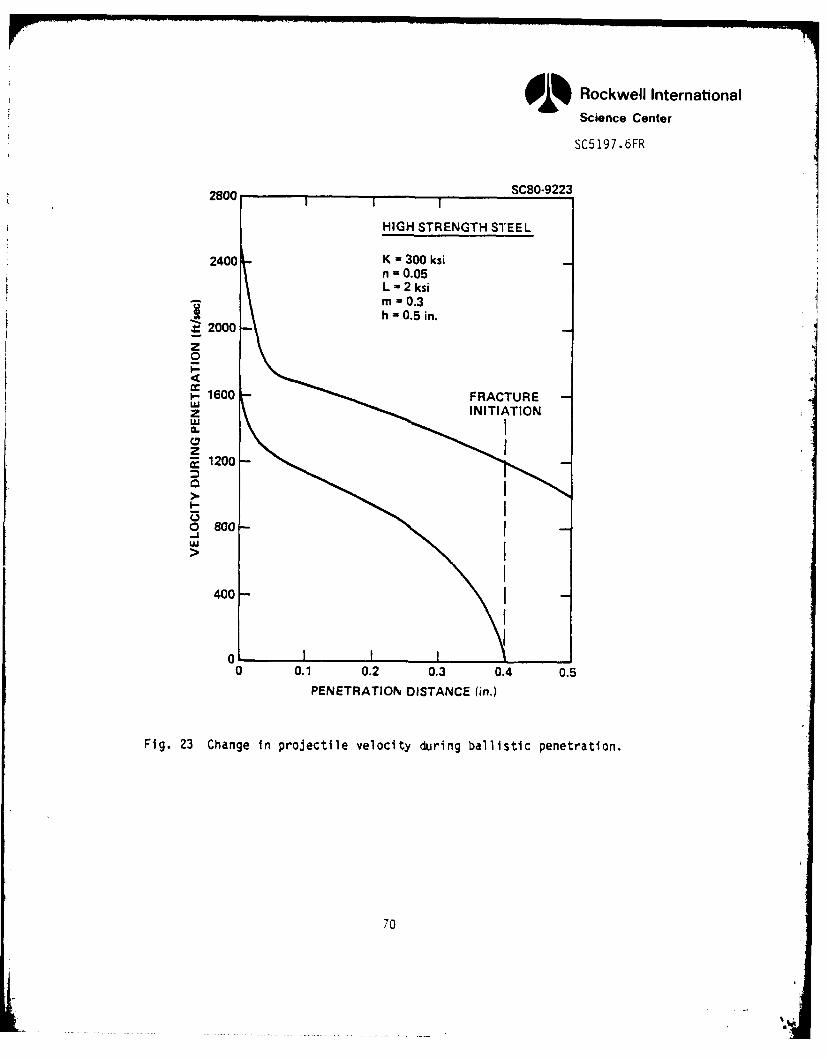
Rockwell InternationalScience Center
SC5197.6FR
2800 SC80-9223
HIGH STRENGTH STEEL
2400 K 300 ksin =0.05
Lu 2 ksim 0.3h 0.5 in.
S2000-z
,1600 FRACTURE
S1200-
0 ga
400-
0L0 0.1 0.2 0.3 0.4 0.5
PENETRATION DISTANCE (in.)
Fig. 23 Change in projectile velocity during ballistic penetration.
70

SineCenter
SC 519 7.6FR
0 C4 0
xo
N4
N
z CmI-<
00
= 0L
- C;
(ON4) IIO19Aivn31
71-

R ockwell InternationalScience Center
SC5197.6FR
The anisotropy effect and the effect of strain-rate sensitivity are
depicted in Fig. 25. There is a 15% rise in ballistic limit in going from R =
0.8 to 2.0. This agrees fairly closely with observed behavior on 5% Ni
steel. 3 The influence of strain-rate sensitivity is quite marked because the
process requires very high strain rates. Significant improvements are pos-
sible from selecting materials with high strain-rate sensitivity,O?, altering
microstructure to impart this beneficial property. The influence of strain
hardening exponent is shown in Fig. 26. This also acts to increase ballistic
limit, however, at the high level of hardness of these armor plates, the
effect of strain hardening exponent is somewhat weaker than that of rate
sensitivity.
72
C2589A/bw

01% Rockwell International
Science Center
SC5197.6FR
SC80-92202400 I 1 1
HIGH STRENGTH STEEL
K = 300 ksin =0.05 . L 6 ksi - 0
7 2200 - m= 0.3h = 0.5 in.
2000
C.
1800
1600 I I I I I0.8 1.0 1.2 1.4 1.6 1.8 2.0 2.2
R
Fig. 25 Improvement in ballistic limit as a function of plactic anisotropyparameter, R, and rate sensitivity constant, L.
73

Rockwell InternationalScience Center
SC5197.6FR
2200
Y.S. - 230 ksiL,m =0h = 0.5 in.
2000- r 0.25 in.
=.1
I-
-j 1800
-J
1600
140010 0.05 0.10 0.15
STRAIN HARDENING EXPONENT, n
Fig. 26 The effect of strain hardening exponent, n, on ballistic limit.
74

01 Rockwell InternationalScience Center
SC5197.6FR
6.0 SUMMARY AND CONCLUSIONS
Theoretical Taylor factor calculations carried out for a number of
f.c.c. rolling (as well as partially recrystallized) textures has indicated
that "brass-type" textures, (110) <112>, are potentially as strong in through-
thickness compression as the (111) b.c.c. rolling textures. Since through-
thickness strength has been shown to be a strong contributor to ballistic
perforation resistance, the development of a high degree of this texture is
viewed as quite important. The recrystallization texture, (100) <001>, on the
other hand, produces high shear strength but poor through-thickness strength,
and is not ideal for ballistic use. In this report, theoretical strength
calculations have been carried out not only from ideal textures, but detailed
spatial crystallite orientation distribution function has been incorporated in
the calculation of Taylor factors. For 7039 aluminum, an armor alloy, these
functions were calculated on the basis of their (111) and (200) pole figures,
and input into the Taylor factor analysis for a more exact assessment.
An analysis of the ballistic penetration problem has quantitatively
validated the importance of plastic anisotropy (due to crystallographic tex-
ture) and explained the results observed on 5% Ni steel. Furthermore, the
importance of strain hardening and strain-rate sensitivity properties on
ballistic limit are also established. Precipitation hardenable austenitic
steel, A-286 grade, also included in this study, has shown good promise as an
f.c.c. armor material. Some of the important conclusions are listed below:
75C2589A/bw
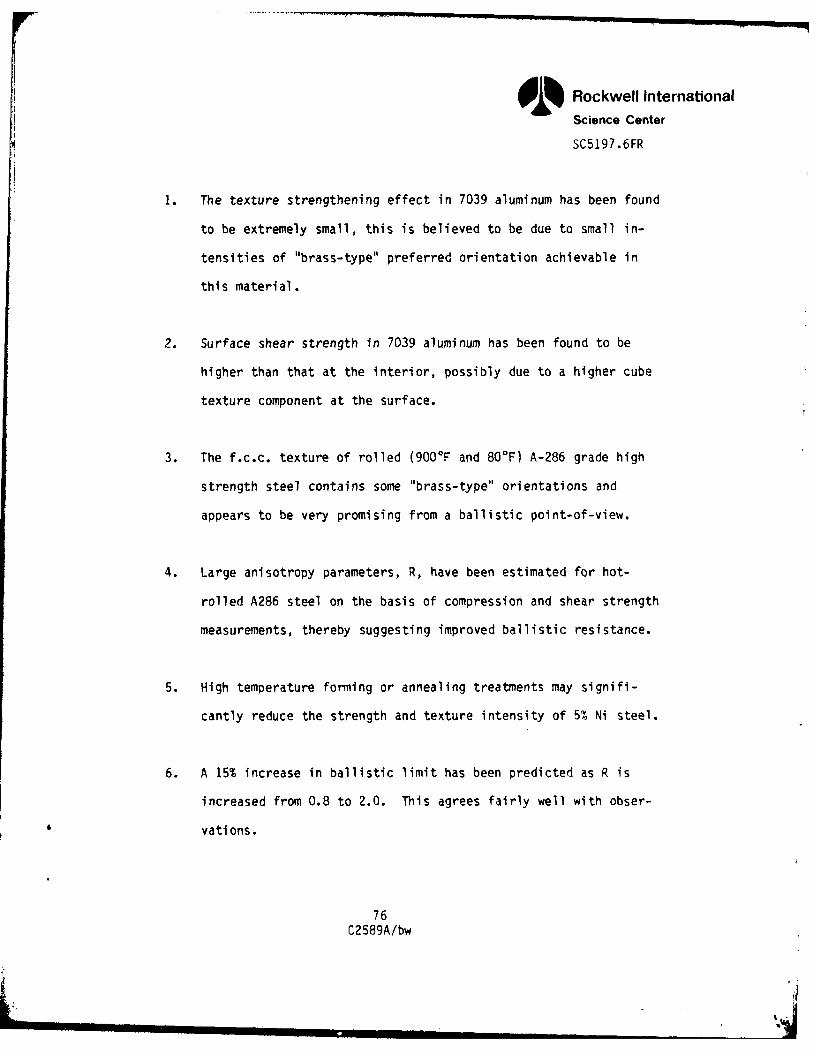
Rockwell InternationalScience Center
SC5197.6FR
i. The texture strengthening effect in 7039 aluminum has been found
to be extremely small, this is believed to be due to small in-
tensities of "brass-type" preferred orientation achievable in
this material.
2. Surface shear strength in 7039 aluminum has been found to be
higher than that at the interior, possibly due to a higher cube
texture component at the surface.
3. The f.c.c. texture of rolled (900F and 800F) A-286 grade high
strength steel contains some "brass-type" orientations and
appears to be very promising from a ballistic point-of-view.
4. Large anisotropy parameters, R, have been estimated for hot-
rolled A286 steel on the basis of compression and shear strength
measurements, thereby suggesting improved ballistic resistance.
5. High temperature forming or annealing treatments may signifi-
cantly reduce the strength and texture intensity of 5/ Ni steel.
6. A 15% increase in ballistic limit has been predicted as R is
increased from 0.8 to 2.0. This agrees fairly well with obser-
vations.
76C2589A/bw

01% Rockwell InternationalScience Center
SC5197.6FR
7. Both strain hardening and rate sensitivity enhance ballistic
limit. Strain-rate sensitivity has a very strong effect,
however, at the high hardness level of armor materials, strain
hardening exponents and their effects on ballistic limit are
smaller.
77C2589A/bw
L

1% Rockwell InternationalScience CenterSC5197.6FR
7.0 REFERENCES
1. A. K. Ghosh and N. E. Paton, AMMRC Report TR 78-40, September, 1978.
2. Hsun Hu, G. R. Speich and R. L. Miller, AMMRC Report CTR 76-22, July 1976.
3. A. Zarkades, AMMRC Report 79-52, September 1979.
4. G. I. Taylor, J. Inst. Metals, 62, 1938, p. 307; S. Timoshenko, 69thAnniversary Volume, p. 218, McM-fIan Co., N.Y., 1938.
5. J. F. W. Bishop and R. Hill, Phil. Mag., 42, p. 1298, 1951.
6. W. F. Hosford and W. A. Backofen, Fundamentals of Deformation Processing,W. A. Backofen et al., pp. 259-98, Syracuse Univ. Press, 1964.
7. G. Y. Chin and W. L. Mammel, Trans. Met. Soc., AIME, 239, 1967.
8. G. Y. Chin and B. C. Wonsiewicz, Met. Trans., 1, p. 551, 1970.
9. G. Y. Chin, W. F. Hosford and D. R. Mendorf, Proc. Roy. Soc., A309, p.433, 1969.
10. R. F. Recht and T. W. Ipson, Trans. ASME, P. 384, Sept. 1963.
11. R. J. Roe, J. Appl. Phys. 36, p. 2024 (1965); 37 p. 2069 (1966).
12. H. J. Bunge, Z. Metallke, 56, p. 872 (1965).
13. P. R. Morris and A. J. Heckler, Advances in X-ray Analysis, 11, p. 454,Plenum Press, New York (1968).
14. G. Wulf, Int. J. Mech. Sci., 20. p. 609, 1978.
15. T. A. C. Stock and K. R. L. Thompson, Met. Trans., 1, p. 219, 1970.
16. E. B. Kula and S. L. Lopata, Trans. AIME-TMS, 215, p. 980, 1959.
17. C. Stickels and P. R. Mould, Met. Trans., 1, p. 1303, 1970.
18. R. L. Woodward and M. E. deMorton, Int. J. Mech. Sci., 18, p. 119, 1976.
19. W. Goldsmith and S. A. Finnegan, Int. J. Mech. Sci., 13, p. 843, 1971.
20. R. L. Woodward, Int. J. Mech. Sci., 20, p. 599, 1978.
21. A. Zarkades and F. Larson, AIMRC, private communication.
78C2589A/bw

Rockwell InternationalScience Center
SC5197.6FR
22. A. K. Ghosh, J. Mat. Eng. Tech. Trans. ASME, 99, p. 264, 1977.
23. R. Hill, The Mathematical Theory of Plasticity, Oxford Univ. Press, 1967.
24. Mil Handbook, U.S. Dept. of Defense publication, Sept. 1971.
79
C2589A/bw
Rockwell InternationalScience Center
SC5197.6FR
q7 - 4. t.Ca -
L 0
.- U = =|, -v-u- .t - •-. .
SN *;z . .. -... @ii i I -,
i~. Fi p1 I.:--p41
-- . 3 - -
!T '-. i.a~s ! ° ; 2 . . . , .. 2j..
J- .-I
t i . I 1 I34
*.A . - - -
~ i~If ~.6 1 - 3
U-5 ;a I's Il . .
1 6-
z -
~ IIv
7 [-Z z ,7. ~ I YI7
I 2ii'~ 3 .-3 v
~ .K Ju- ~ I ~ ~3 3* - -

i Rockwell InternationalAf, Ce6(nter
DISTRIBUTION LIST
No. ofCopies To
1 Office of the Under Secretary of Defense for Research and Engineering,The Pentagon, Washington, D. C. 20301
12 Commander, Defense Technical Information Center, Cameron Station,Building 5, 5010 Duke Street, Alexandria, Virginia 22314
1 Metals and Ceramics Information Center, Battelle Columbus Laboratories,505 King Avenue, Columbus, Ohio 43201
Deputy Chief of Staff, Research, Development, and Acquisition,Headquarters, Department of the Army, Washington, D. C. 20310
1 ATTN: DAMA-ARZ
Commander, Army Research Office, P. 0. Box 12211, ResearchTriangle Park, North Carolina 27709
1 ATTN: Information Processing Office
Commander, U. S. Army Materiel Development and Readiness Command,5001 Eisenhower Avenue, Alexandria, Virginia 22333
1 ATTN: DRCLDC
Commander, U. S. Army Materiel Systems Analysis Activity,Aberdeen Proving Ground, Maryland 21005
1 ATTN: DRXSY-MP, H. Cohen
Commander, U. S. Army Electronics Research and Development Command,Fort Monmouth, New Jersey 07703
1 ATTN: DELSD-L1 DELSD-E
Commander, U. S. Army Missile Command, Redstone Arsenal, Alabama 358094 ATTN: DRSMI-TB, Redstone Scientific Inftrmation Center1 Technical Library
Commander, U. S. Army Armament Research and Development Command,Dover, New Jersey 07801
2 ATTN: Technical LibraryI DRDAR-SCM, J. D. Corrie1 DRDAR-LCA, Mr. Harry E. Pebly, Jr., PLASTEC, Director
Commander, U. S. Army Natick Research and Development Command,Natick, Massachusetts 01760
I ATTN: Technical Library
Commander, U. S. Army Satellite Communications Agency,Fort Monmouth, New Jersey 07703
1 ATTN: Technical Document Center
81

i Rockwell InternationalRS4W6e 6Inter
No. ofCopies To
Commander, U. S. Army Tank-Automotive Research and Development Command,Warren, Michigan 48090
2 ATTN: DRDTA-UL, Technical Library
Commander, White Sands Missile Range, New Mexico 880021 ATTN: STEWS-WS-VT
President, Airborne, Electronics and Special Warfare Board,Fort Bragg, North Carolina 28307
1 ATTN: Library
Director, U. S. Army Ballistic Research Laboratory, AberdeenProving Ground, Maryland 21005
1 ATTN: DRDAR-TSB-S (STINFO)
Commander, Dugway Proving Ground, Dugway, Utah 840221 ATTN: Technical Library, Technical Information Division
Commander, Harry Diamond Laboratories, 2800 Powder Mill Road,Adelphi, Maryland 20783
1 ATTN: Technical Information Office
Chief, Benet Weapons Laboratory, LCWSL, USA ARRADCOM, Watervliet,New York 12189
1 ATTN: DRDAR-LCB-TL
Commander, U. S. Army Foreign Science and Technology Center,220 7th Street, N. E., Charlottesville, Virginia 22901
1 A N: Military Tech, Mr. Marley
Commander, U. S. Army Aeromedical Research Unit, P. 0. Box 577,Fort Rucker, Alabama 36460
1 ATTN: Technical Library
Director, Eustis Directorate, U. S. Army Air Mobility Research andDevelopment Laboratory, Fort Eustis, Virginia 23604
1 ATTN: Mr. J. Robinson, DAVDL-E-MOS (AVRADCOM)
U. S. Army Aviation Training Library, Fort Rucker, Alabama 363601 ATTN: Building 5906-5907
Commander, U. S. Army Agency for Aviation Safety, Fort Rucker, Alabama 363621 ATTN: Library, Building 4905
Commander, USACDC Air Defense Agency, Fort Bliss, Texas 79916I ATTN: Technical Library
Commander, U. S. Army Engineer School, Fort Belvoir, Virginia 22060I ATTN: Library
82

9 Rockwell Internationaloi% s3996rnter
No. ofCopies To
Commander, U. S. Army Engineer Waterways Experiment Station,Vicksburg, Mississippi 39180
1 ATTN: Research Center Library
Commander, U. S. Army Environmental Hygiene Agency, Edgewood Arsenal,Maryland 21010
1 ATTN: Chief, Library Branch
Technical Director, Human Engineering Laboratories,Aberdeen Proving Ground, Maryland 21005
1 ATTN: Technical Reports Office
Commandant, U. S. Army Quartermaster School, Fort Lee, Virginia 238011 ATTN: Quartermaster School Library
Commander, U. S. Army Radio Propagation Agency, Fort Bragg,North Carolina 28307
1 ATTN: SCCR-2
Naval Research Laboratory, Washington, D. C. 203751 AMTN: Dr. J. M. Krafft - Code 58302 Dr. G. R. Yoder - Code 6384
Chief of Naval Research, Arlington, Virginia 222171 ATTN: Code 471
Air Force Materials Laboratory, Wright-Patterson Air Force Base, Ohio 454332 ATTN: AFML/MXE/E. Morrissey1 AFML/LC1 AFML/LLP/D. M. Forney, Jr.1 AFML/MBC/Mr. Stanley Schulman
National Aeronautics and Space Administration, Washington, D. C. 205461 ATTN: Mr. B. G. Achhammer1 Mr. G. C. Deutsch - Code RW
National Aeronautics and Space Administration, Marshall Space FlightCenter, Huntsville, Alabama 35812
1 ATTN: R. J. Schwinghammer, EHO1, Dir, M&P Lab1 Mr. W. A. Wilson, EH41, Bldg. 4612
1 Ship Research Committee, Maritime Transportation Research Board, NationalResearch Council, 2101 Constitution Ave., N. W., Washington, D. C. 20418
I Librarian, Materials Sciences Corporation, Blue Bell Campus, Merion TowleHouse, Blue Bell, Pennsylvania 19422
83

0 Rockwell InternationalScience CenterSC519766FIR
No. ofCopies To
1 The Charles Stark Draper Laboratory, 68 Albany Street,Cambridge, Massachusetts 02139
Wyman-Gordon Company, Worcester, Massachusetts 016011 ATTN: Technical Library
Lockheed-Georgia Company, 86 South Cobb Drive, Marietta, Georgia 300631 ATTN: Materials and Processes Engineering Dept. 71-11, Zone 54
General Dynamics, Convair Aerospace Division, P.O. Box 748,Fort Worth, Texas 76101
1 ATTN: Mfg. Engineering Technical Library
1 Mechanical Properties Data Center, Belfour Stulen Inc.,13917 W. Bay Shore Drive, Traverse City, Michigan 49684
1 Dr. Robert S. Shane, Shane Associates, Inc., 7821 Carrleigh Parkway,Springfield, Virginia 22152
Director, Army Materials and Mechanics Research Center,Watertown, Massachusetts 02172
2 ATTN: DRXMR-PL1 DRXMR-PR1 DRXMR-PD1 DPXMR-AP
10 DRXMR-EM, Mr. A. Zarkades
84
I III - I

ILME D