Embed Size (px)
Citation preview
FINANCIAL SUMMARY
FY2014
(April 1, 2013 through March 31, 2014)
English translation from the original Japanese-language document
TOYOTA MOTOR CORPORATION
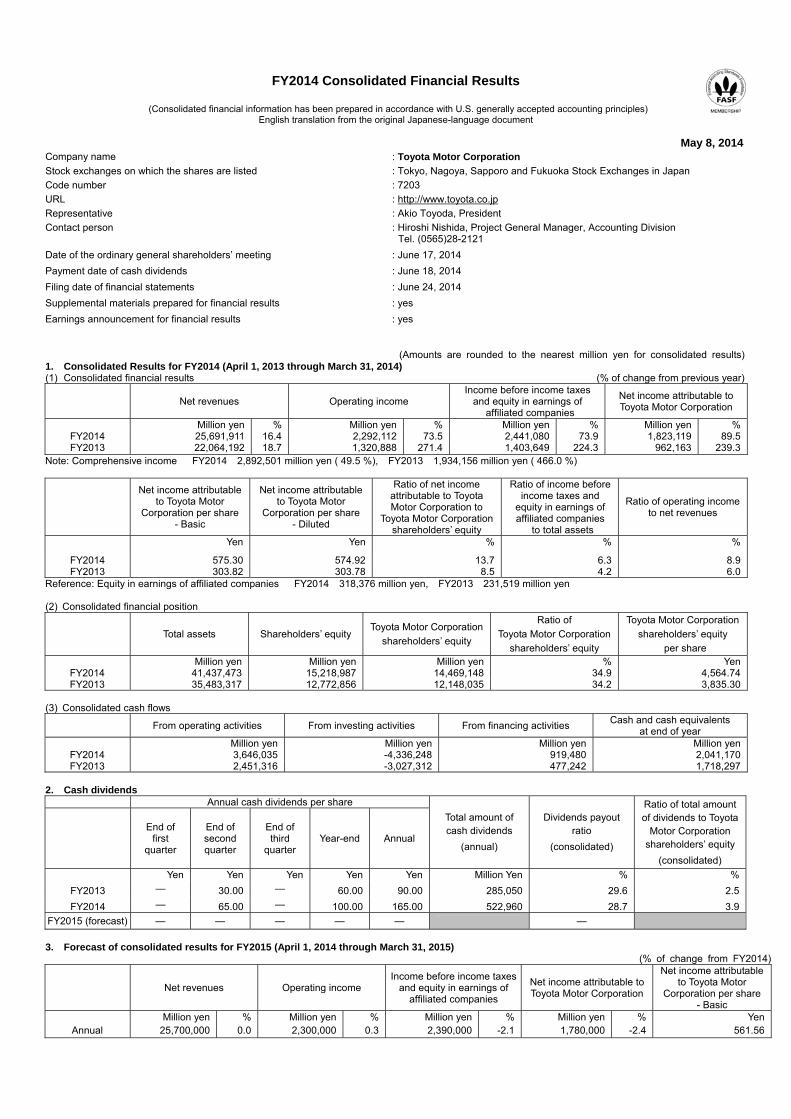
FY2014 Consolidated Financial Results
(Consolidated financial information has been prepared in accordance with U.S. generally accepted accounting principles)
English translation from the original Japanese-language document
May 8, 2014 Company name : Toyota Motor Corporation
Stock exchanges on which the shares are listed : Tokyo, Nagoya, Sapporo and Fukuoka Stock Exchanges in Japan
Code number : 7203
URL
Representative
: http://www.toyota.co.jp
: Akio Toyoda, President
Contact person : Hiroshi Nishida, Project General Manager, Accounting Division Tel. (0565)28-2121
Date of the ordinary general shareholders’ meeting : June 17, 2014
Payment date of cash dividends : June 18, 2014
Filing date of financial statements : June 24, 2014
Supplemental materials prepared for financial results : yes
Earnings announcement for financial results : yes
(Amounts are rounded to the nearest million yen for consolidated results) 1. Consolidated Results for FY2014 (April 1, 2013 through March 31, 2014) (1) Consolidated financial results (% of change from previous year)
Net revenues Operating income Income before income taxes
and equity in earnings of affiliated companies
Net income attributable to Toyota Motor Corporation
Million yen % Million yen % Million yen % Million yen %FY2014 25,691,911 16.4 2,292,112 73.5 2,441,080 73.9 1,823,119 89.5FY2013 22,064,192 18.7 1,320,888 271.4 1,403,649 224.3 962,163 239.3
Note: Comprehensive income FY2014 2,892,501 million yen ( 49.5 %), FY2013 1,934,156 million yen ( 466.0 %)
Net income attributableto Toyota Motor
Corporation per share- Basic
Net income attributableto Toyota Motor
Corporation per share - Diluted
Ratio of net income attributable to Toyota Motor Corporation to
Toyota Motor Corporation shareholders’ equity
Ratio of income before income taxes and
equity in earnings of affiliated companies
to total assets
Ratio of operating income to net revenues
Yen Yen % % %
FY2014 575.30 574.92 13.7 6.3 8.9FY2013 303.82 303.78 8.5 4.2 6.0
Reference: Equity in earnings of affiliated companies FY2014 318,376 million yen, FY2013 231,519 million yen (2) Consolidated financial position
Total assets Shareholders’ equity Toyota Motor Corporation
shareholders’ equity
Ratio of
Toyota Motor Corporation
shareholders’ equity
Toyota Motor Corporation
shareholders’ equity
per share Million yen Million yen Million yen % Yen
FY2014 41,437,473 15,218,987 14,469,148 34.9 4,564.74FY2013 35,483,317 12,772,856 12,148,035 34.2 3,835.30
(3) Consolidated cash flows
From operating activities From investing activities From financing activities Cash and cash equivalents
at end of year Million yen Million yen Million yen Million yen
FY2014 3,646,035 -4,336,248 919,480 2,041,170FY2013 2,451,316 -3,027,312 477,242 1,718,297
2. Cash dividends
Annual cash dividends per share
End of
first quarter
End of second quarter
End of third
quarter Year-end Annual
Total amount of cash dividends
(annual)
Dividends payout ratio
(consolidated)
Ratio of total amount of dividends to Toyota
Motor Corporation shareholders’ equity
(consolidated)
Yen Yen Yen Yen Yen Million Yen % %
FY2013 — 30.00 — 60.00 90.00 285,050 29.6 2.5
FY2014 — 65.00 — 100.00 165.00 522,960 28.7 3.9
FY2015 (forecast) — — — — — —
3. Forecast of consolidated results for FY2015 (April 1, 2014 through March 31, 2015) (% of change from FY2014)
Net revenues Operating income Income before income taxes
and equity in earnings of affiliated companies
Net income attributable to Toyota Motor Corporation
Net income attributable to Toyota Motor
Corporation per share- Basic
Million yen % Million yen % Million yen % Million yen % YenAnnual 25,700,000 0.0 2,300,000 0.3 2,390,000 -2.1 1,780,000 -2.4 561.56
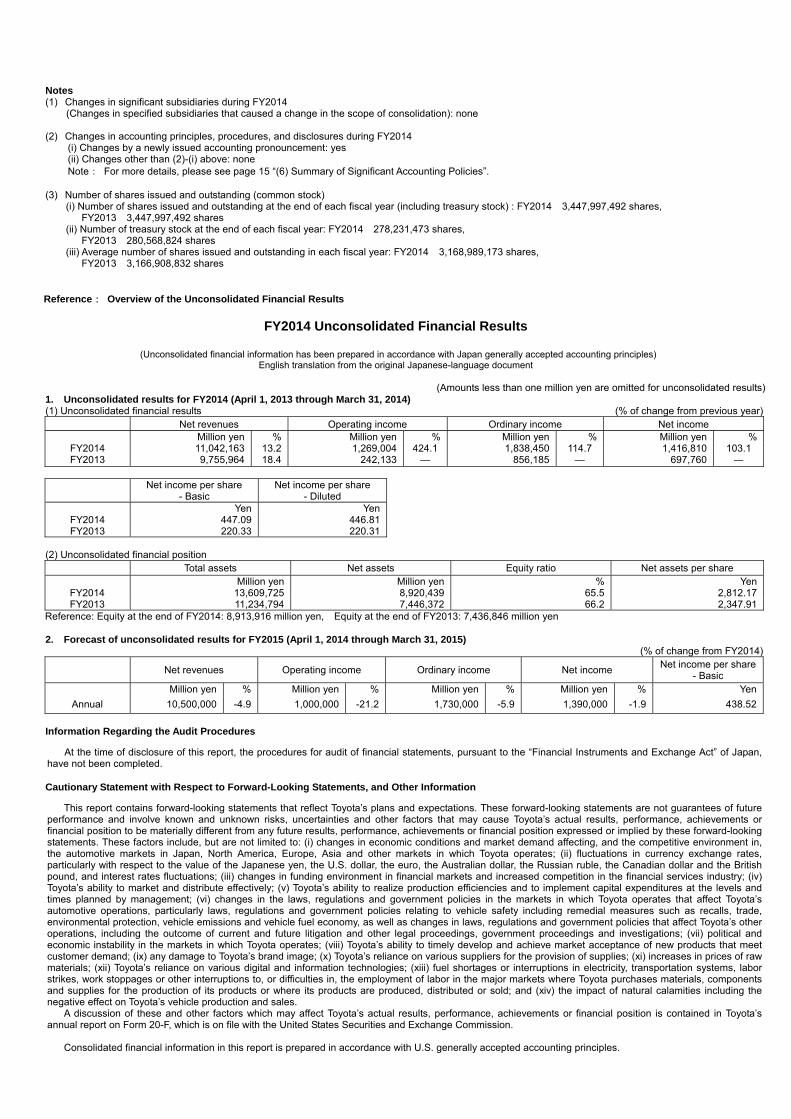
Notes (1) Changes in significant subsidiaries during FY2014
(Changes in specified subsidiaries that caused a change in the scope of consolidation): none
(2) Changes in accounting principles, procedures, and disclosures during FY2014 (i) Changes by a newly issued accounting pronouncement: yes (ii) Changes other than (2)-(i) above: none Note: For more details, please see page 15 “(6) Summary of Significant Accounting Policies”.
(3) Number of shares issued and outstanding (common stock) (i) Number of shares issued and outstanding at the end of each fiscal year (including treasury stock) : FY2014 3,447,997,492 shares,
FY2013 3,447,997,492 shares (ii) Number of treasury stock at the end of each fiscal year: FY2014 278,231,473 shares,
FY2013 280,568,824 shares (iii) Average number of shares issued and outstanding in each fiscal year: FY2014 3,168,989,173 shares,
FY2013 3,166,908,832 shares
Reference: Overview of the Unconsolidated Financial Results
FY2014 Unconsolidated Financial Results
(Unconsolidated financial information has been prepared in accordance with Japan generally accepted accounting principles) English translation from the original Japanese-language document
(Amounts less than one million yen are omitted for unconsolidated results)
1. Unconsolidated results for FY2014 (April 1, 2013 through March 31, 2014) (1) Unconsolidated financial results (% of change from previous year)
Net revenues Operating income Ordinary income Net income Million yen % Million yen % Million yen % Million yen %
FY2014 11,042,163 13.2 1,269,004 424.1 1,838,450 114.7 1,416,810 103.1 FY2013 9,755,964 18.4 242,133 — 856,185 — 697,760 ―
Net income per share
- Basic Net income per share
- Diluted Yen Yen
FY2014 447.09 446.81FY2013 220.33 220.31
(2) Unconsolidated financial position
Total assets Net assets Equity ratio Net assets per share Million yen Million yen % Yen
FY2014 13,609,725 8,920,439 65.5 2,812.17FY2013 11,234,794 7,446,372 66.2 2,347.91
Reference: Equity at the end of FY2014: 8,913,916 million yen, Equity at the end of FY2013: 7,436,846 million yen
2. Forecast of unconsolidated results for FY2015 (April 1, 2014 through March 31, 2015) (% of change from FY2014)
Net revenues Operating income Ordinary income Net income
Net income per share- Basic
Million yen % Million yen % Million yen % Million yen % Yen
Annual 10,500,000 -4.9 1,000,000 -21.2 1,730,000 -5.9 1,390,000 -1.9 438.52
Information Regarding the Audit Procedures
At the time of disclosure of this report, the procedures for audit of financial statements, pursuant to the “Financial Instruments and Exchange Act” of Japan,
have not been completed.
Cautionary Statement with Respect to Forward-Looking Statements, and Other Information This report contains forward-looking statements that reflect Toyota’s plans and expectations. These forward-looking statements are not guarantees of future
performance and involve known and unknown risks, uncertainties and other factors that may cause Toyota’s actual results, performance, achievements or financial position to be materially different from any future results, performance, achievements or financial position expressed or implied by these forward-looking statements. These factors include, but are not limited to: (i) changes in economic conditions and market demand affecting, and the competitive environment in, the automotive markets in Japan, North America, Europe, Asia and other markets in which Toyota operates; (ii) fluctuations in currency exchange rates, particularly with respect to the value of the Japanese yen, the U.S. dollar, the euro, the Australian dollar, the Russian ruble, the Canadian dollar and the British pound, and interest rates fluctuations; (iii) changes in funding environment in financial markets and increased competition in the financial services industry; (iv) Toyota’s ability to market and distribute effectively; (v) Toyota’s ability to realize production efficiencies and to implement capital expenditures at the levels and times planned by management; (vi) changes in the laws, regulations and government policies in the markets in which Toyota operates that affect Toyota’s automotive operations, particularly laws, regulations and government policies relating to vehicle safety including remedial measures such as recalls, trade, environmental protection, vehicle emissions and vehicle fuel economy, as well as changes in laws, regulations and government policies that affect Toyota’s other operations, including the outcome of current and future litigation and other legal proceedings, government proceedings and investigations; (vii) political and economic instability in the markets in which Toyota operates; (viii) Toyota’s ability to timely develop and achieve market acceptance of new products that meet customer demand; (ix) any damage to Toyota’s brand image; (x) Toyota’s reliance on various suppliers for the provision of supplies; (xi) increases in prices of raw materials; (xii) Toyota’s reliance on various digital and information technologies; (xiii) fuel shortages or interruptions in electricity, transportation systems, labor strikes, work stoppages or other interruptions to, or difficulties in, the employment of labor in the major markets where Toyota purchases materials, components and supplies for the production of its products or where its products are produced, distributed or sold; and (xiv) the impact of natural calamities including the negative effect on Toyota’s vehicle production and sales.
A discussion of these and other factors which may affect Toyota’s actual results, performance, achievements or financial position is contained in Toyota’s annual report on Form 20-F, which is on file with the United States Securities and Exchange Commission.
Consolidated financial information in this report is prepared in accordance with U.S. generally accepted accounting principles.
1
TABLE OF CONTENTS
1. Financial Results and Position ............................................................................................................... 2
(1) Consolidated Financial Results for FY2014 ..................................................................................... 2
(2) Consolidated Financial Position for FY2014..................................................................................... 4
(3) Basic Policy on the Distribution of Profits and the Distribution of Profits for FY2014 ....................... 4
(4) Forecast of Consolidated Financial Results for FY2015 .................................................................. 5
2. Management Policy.................................................................................................................................. 6
(1) Toyota’s Basic Management Policy .................................................................................................. 6
(2) Medium- and Long-term Management Strategy ............................................................................... 6
3. Consolidated Production and Sales....................................................................................................... 7
(1) Production ........................................................................................................................................ 7
(2) Sales (by destination) ....................................................................................................................... 7
4. Breakdown of Consolidated Net Revenues ........................................................................................... 8
5. Consolidated Financial Statements........................................................................................................ 9
(1) Consolidated Balance Sheets .......................................................................................................... 9
(2) Consolidated Statements of Income and
Consolidated Statements of Comprehensive Income .....................................................................11
(3) Consolidated Statements of Shareholders’ Equity ......................................................................... 13
(4) Consolidated Statements of Cash Flows........................................................................................ 14
(5) Going Concern Assumption............................................................................................................ 14
(6) Summary of Significant Accounting Policies................................................................................... 15
(7) Segment Information ...................................................................................................................... 16
(8) Significant Subsequent Events....................................................................................................... 23
6. Unconsolidated Financial Statements.................................................................................................. 24
(1) Balance Sheets .............................................................................................................................. 24
(2) Statements of Income..................................................................................................................... 26
(3) Changes in Net Assets ................................................................................................................... 27
(4) Going Concern Assumption............................................................................................................ 29
TOYOTA MOTOR CORPORATION FY2014 Financial Summary (Consolidated financial information has been prepared in accordance with U.S. generally accepted accounting principles)
2
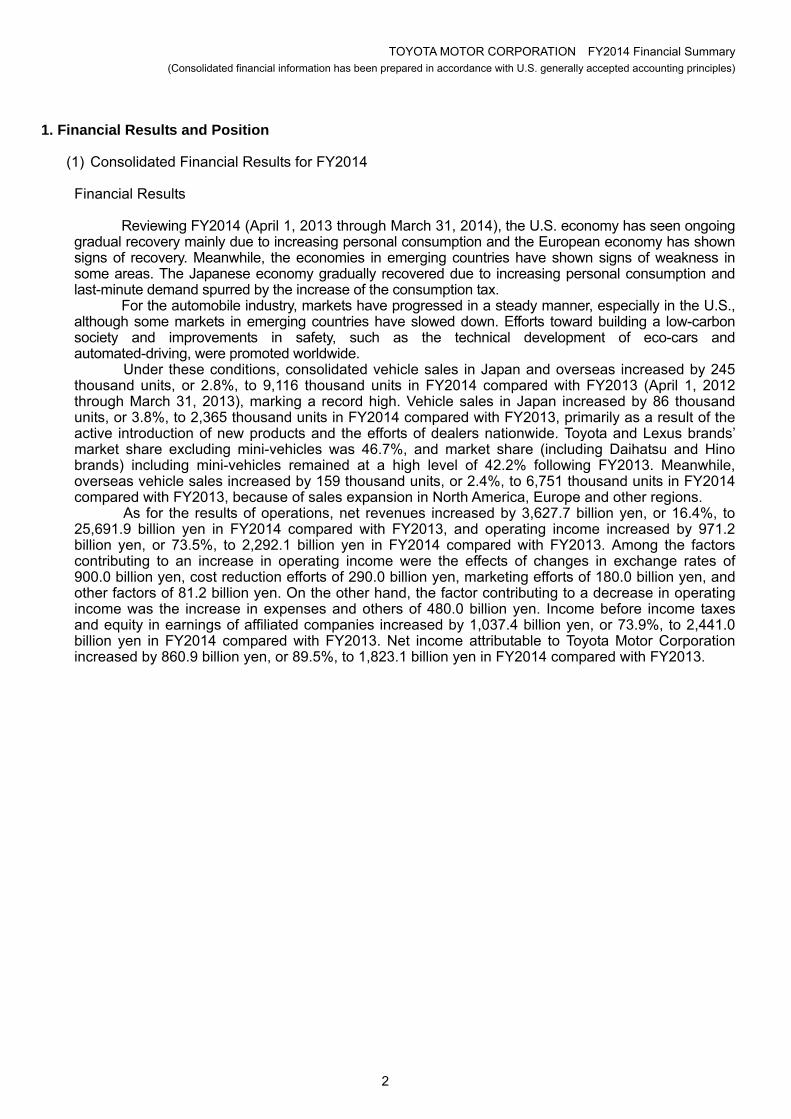
1. Financial Results and Position
(1) Consolidated Financial Results for FY2014 Financial Results
Reviewing FY2014 (April 1, 2013 through March 31, 2014), the U.S. economy has seen ongoing
gradual recovery mainly due to increasing personal consumption and the European economy has shown signs of recovery. Meanwhile, the economies in emerging countries have shown signs of weakness in some areas. The Japanese economy gradually recovered due to increasing personal consumption and last-minute demand spurred by the increase of the consumption tax.
For the automobile industry, markets have progressed in a steady manner, especially in the U.S., although some markets in emerging countries have slowed down. Efforts toward building a low-carbon society and improvements in safety, such as the technical development of eco-cars and automated-driving, were promoted worldwide.
Under these conditions, consolidated vehicle sales in Japan and overseas increased by 245 thousand units, or 2.8%, to 9,116 thousand units in FY2014 compared with FY2013 (April 1, 2012 through March 31, 2013), marking a record high. Vehicle sales in Japan increased by 86 thousand units, or 3.8%, to 2,365 thousand units in FY2014 compared with FY2013, primarily as a result of the active introduction of new products and the efforts of dealers nationwide. Toyota and Lexus brands’ market share excluding mini-vehicles was 46.7%, and market share (including Daihatsu and Hino brands) including mini-vehicles remained at a high level of 42.2% following FY2013. Meanwhile, overseas vehicle sales increased by 159 thousand units, or 2.4%, to 6,751 thousand units in FY2014 compared with FY2013, because of sales expansion in North America, Europe and other regions.
As for the results of operations, net revenues increased by 3,627.7 billion yen, or 16.4%, to 25,691.9 billion yen in FY2014 compared with FY2013, and operating income increased by 971.2 billion yen, or 73.5%, to 2,292.1 billion yen in FY2014 compared with FY2013. Among the factors contributing to an increase in operating income were the effects of changes in exchange rates of 900.0 billion yen, cost reduction efforts of 290.0 billion yen, marketing efforts of 180.0 billion yen, and other factors of 81.2 billion yen. On the other hand, the factor contributing to a decrease in operating income was the increase in expenses and others of 480.0 billion yen. Income before income taxes and equity in earnings of affiliated companies increased by 1,037.4 billion yen, or 73.9%, to 2,441.0 billion yen in FY2014 compared with FY2013. Net income attributable to Toyota Motor Corporation increased by 860.9 billion yen, or 89.5%, to 1,823.1 billion yen in FY2014 compared with FY2013.
TOYOTA MOTOR CORPORATION FY2014 Financial Summary (Consolidated financial information has been prepared in accordance with U.S. generally accepted accounting principles)
3
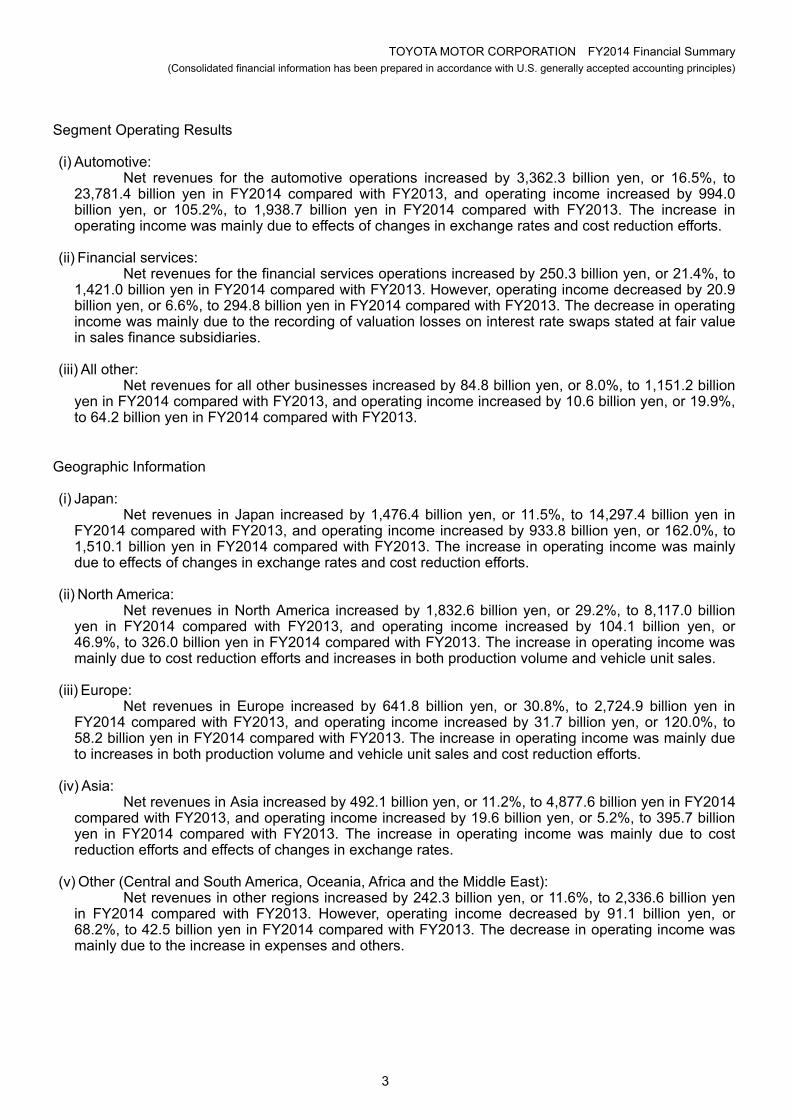
Segment Operating Results
(i) Automotive: Net revenues for the automotive operations increased by 3,362.3 billion yen, or 16.5%, to
23,781.4 billion yen in FY2014 compared with FY2013, and operating income increased by 994.0 billion yen, or 105.2%, to 1,938.7 billion yen in FY2014 compared with FY2013. The increase in operating income was mainly due to effects of changes in exchange rates and cost reduction efforts.
(ii) Financial services:
Net revenues for the financial services operations increased by 250.3 billion yen, or 21.4%, to 1,421.0 billion yen in FY2014 compared with FY2013. However, operating income decreased by 20.9 billion yen, or 6.6%, to 294.8 billion yen in FY2014 compared with FY2013. The decrease in operating income was mainly due to the recording of valuation losses on interest rate swaps stated at fair value in sales finance subsidiaries.
(iii) All other:
Net revenues for all other businesses increased by 84.8 billion yen, or 8.0%, to 1,151.2 billion yen in FY2014 compared with FY2013, and operating income increased by 10.6 billion yen, or 19.9%, to 64.2 billion yen in FY2014 compared with FY2013.
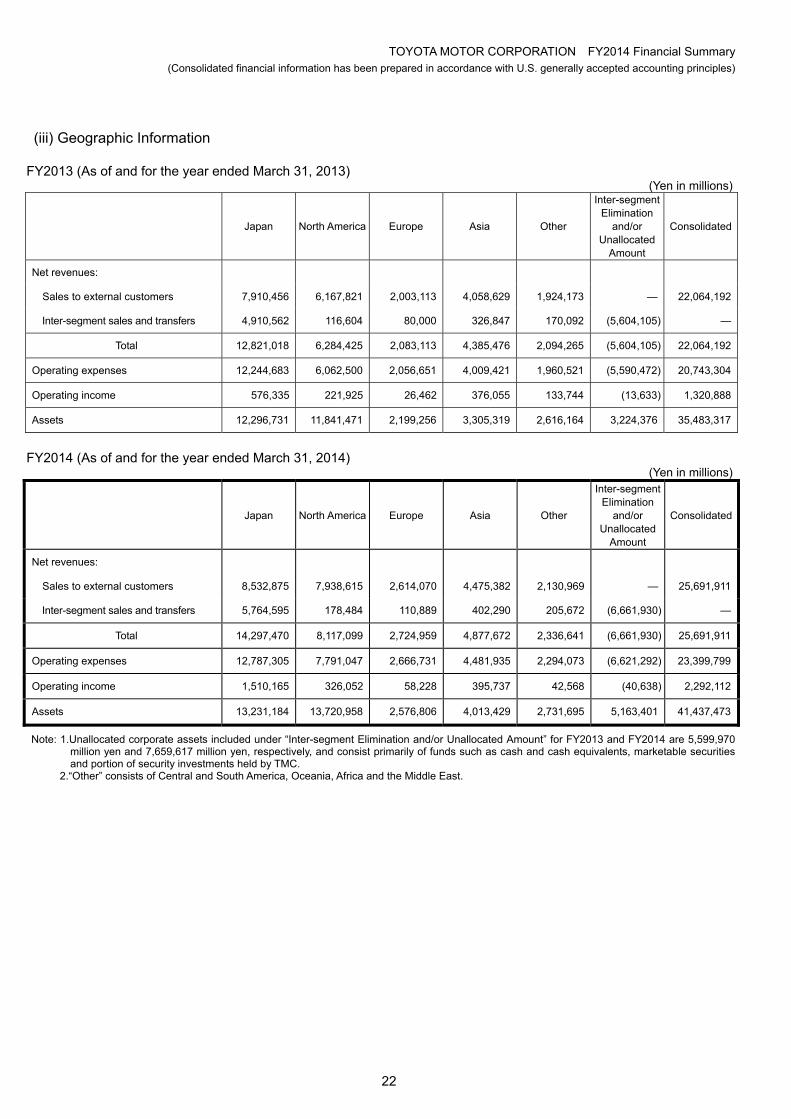
Geographic Information
(i) Japan: Net revenues in Japan increased by 1,476.4 billion yen, or 11.5%, to 14,297.4 billion yen in
FY2014 compared with FY2013, and operating income increased by 933.8 billion yen, or 162.0%, to 1,510.1 billion yen in FY2014 compared with FY2013. The increase in operating income was mainly due to effects of changes in exchange rates and cost reduction efforts.
(ii) North America:
Net revenues in North America increased by 1,832.6 billion yen, or 29.2%, to 8,117.0 billion yen in FY2014 compared with FY2013, and operating income increased by 104.1 billion yen, or 46.9%, to 326.0 billion yen in FY2014 compared with FY2013. The increase in operating income was mainly due to cost reduction efforts and increases in both production volume and vehicle unit sales.
(iii) Europe:
Net revenues in Europe increased by 641.8 billion yen, or 30.8%, to 2,724.9 billion yen in FY2014 compared with FY2013, and operating income increased by 31.7 billion yen, or 120.0%, to 58.2 billion yen in FY2014 compared with FY2013. The increase in operating income was mainly due to increases in both production volume and vehicle unit sales and cost reduction efforts.
(iv) Asia:
Net revenues in Asia increased by 492.1 billion yen, or 11.2%, to 4,877.6 billion yen in FY2014 compared with FY2013, and operating income increased by 19.6 billion yen, or 5.2%, to 395.7 billion yen in FY2014 compared with FY2013. The increase in operating income was mainly due to cost reduction efforts and effects of changes in exchange rates.
(v) Other (Central and South America, Oceania, Africa and the Middle East):
Net revenues in other regions increased by 242.3 billion yen, or 11.6%, to 2,336.6 billion yen in FY2014 compared with FY2013. However, operating income decreased by 91.1 billion yen, or 68.2%, to 42.5 billion yen in FY2014 compared with FY2013. The decrease in operating income was mainly due to the increase in expenses and others.
TOYOTA MOTOR CORPORATION FY2014 Financial Summary (Consolidated financial information has been prepared in accordance with U.S. generally accepted accounting principles)
4
(2) Consolidated Financial Position for FY2014
Cash flows from operating activities resulted in an increase in cash by 3,646.0 billion yen in FY2014. Net cash provided by operating activities increased by 1,194.7 billion yen from 2,451.3 billion yen in FY2013. Cash flows from investing activities resulted in a decrease in cash by 4,336.2 billion yen in FY2014. Net cash used in investing activities increased by 1,308.9 billion yen from 3,027.3 billion yen in FY2013. Cash flows from financing activities resulted in an increase in cash by 919.4 billion yen in FY2014. Net cash provided by financing activities increased by 442.2 billion yen from 477.2 billion yen in FY2013. After taking into account the effect of changes in exchange rates, cash and cash equivalents increased by 322.8 billion yen, or 18.8%, to 2,041.1 billion yen at the end of FY2014 compared with the end of FY2013.
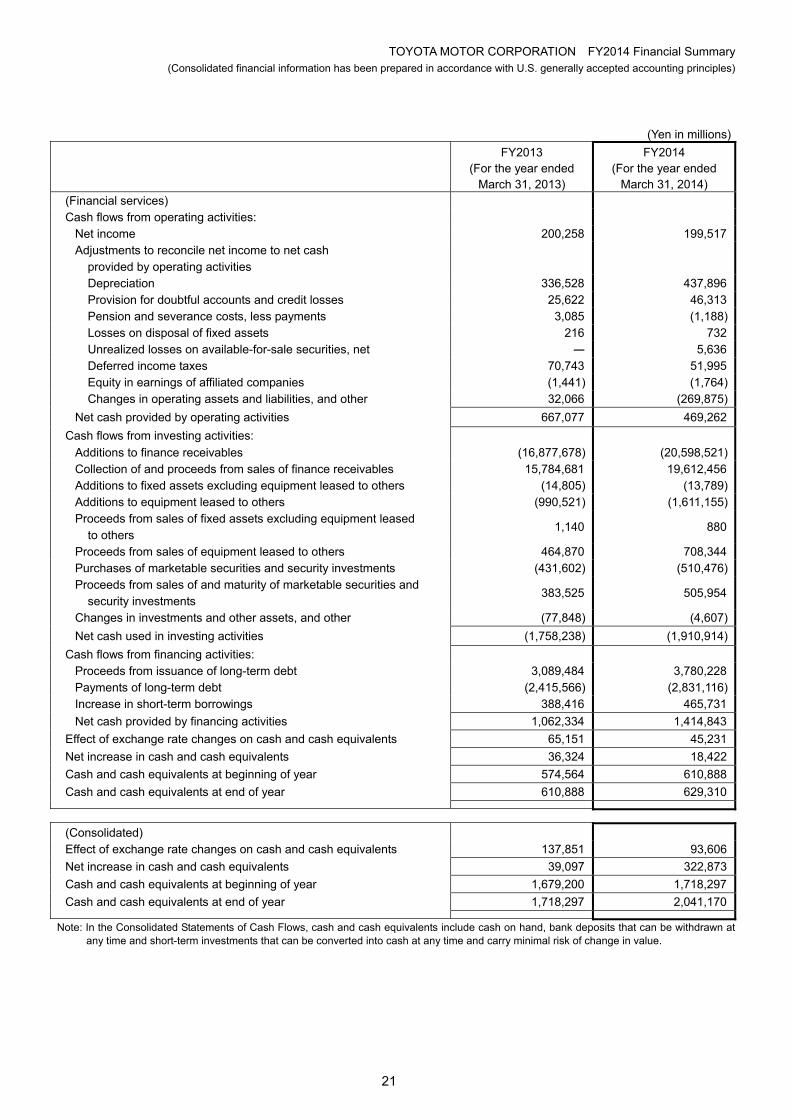
Regarding the consolidated cash flows by segment for FY2014, in non-financial services business, net cash provided by operating activities was 3,244.2 billion yen, net cash used in investing activities was 2,512.6 billion yen and net cash used in financing activities was 475.5 billion yen. Meanwhile, in the financial services business, net cash provided by operating activities was 469.2 billion yen, net cash used in investing activities was 1,910.9 billion yen and net cash provided by financing activities was 1,414.8 billion yen.
(3) Basic Policy on the Distribution of Profits and the Distribution of Profits for FY2014
Toyota Motor Corporation (“TMC”) deems the benefit of its shareholders as one of its priority management policies, and it is working to improve corporate structure towards the realization of sustainable growth in order to enhance its corporate value.
TMC will strive to continue to pay stable dividends with a consolidated dividend payout ratio of 30% while giving due consideration to factors such as business results for each term, investment plans and its cash reserves.
In order to successfully compete in this highly competitive industry, TMC plans to utilize its internal funds for the early commercialization of technologies for the next-generation environment and safety, giving priority to customer safety and sense of security.
Considering these factors, with respect to the dividends for FY2014, TMC plans to propose a year-end dividend of 100 yen per share, and an annual dividend of 165 yen per share, combined with the interim dividend of 65 yen per share.
TMC pays dividends twice a year – an interim dividend and a year-end dividend – and in order to secure an opportunity to directly seek shareholders’ opinions, TMC will treat payments of year-end dividends as a matter to be resolved at the 110th Ordinary General Shareholders’ Meeting, even though TMC’s articles of incorporation stipulate that retained earnings can be distributed as dividends pursuant to the resolution of the board of directors. In FY2014, TMC did not repurchase its own shares, excluding shares constituting less than one unit that were purchased by TMC upon request.
TOYOTA MOTOR CORPORATION FY2014 Financial Summary (Consolidated financial information has been prepared in accordance with U.S. generally accepted accounting principles)
5
(4) Forecast of Consolidated Financial Results for FY2015
As for our future business environment, the world economy is expected to benefit from ongoing
moderate recovery in the U.S. and a gradual move toward recovery in Europe, meanwhile, some emerging countries show signs of uncertainty. The Japanese economy is expected to remain on a recovery trend, backed by an improved environment for exports and the effects of various policy measures. Due attention should be paid, however, to downside risks mainly from the continuing uncertainty of overseas economies, especially in emerging countries, and the downturn in consumption following a surge in last-minute demand spurred by the consumption tax increase in Japan. The automotive market is expected to see expansion mainly in the U.S.; however, amid the change in market structure, as seen in the expansion and diversification of demand for eco-cars backed by rising environmental consciousness and rapid advances in information and communication technology, fierce competition exists on a global scale.
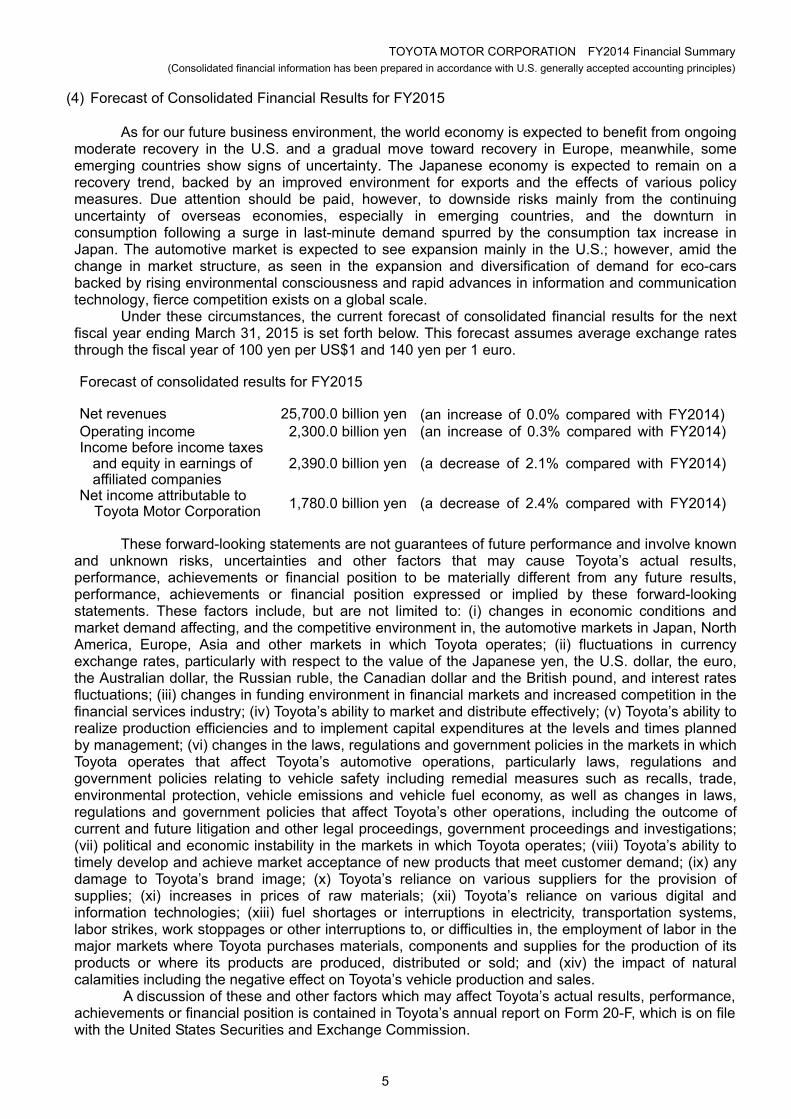
Under these circumstances, the current forecast of consolidated financial results for the next fiscal year ending March 31, 2015 is set forth below. This forecast assumes average exchange rates through the fiscal year of 100 yen per US$1 and 140 yen per 1 euro. Forecast of consolidated results for FY2015
Net revenues 25,700.0 billion yen (an increase of 0.0% compared with FY2014)Operating income 2,300.0 billion yen (an increase of 0.3% compared with FY2014)Income before income taxes
and equity in earnings of affiliated companies
2,390.0 billion yen (a decrease of 2.1% compared with FY2014)
Net income attributable to Toyota Motor Corporation 1,780.0 billion yen (a decrease of 2.4% compared with FY2014)
These forward-looking statements are not guarantees of future performance and involve known
and unknown risks, uncertainties and other factors that may cause Toyota’s actual results, performance, achievements or financial position to be materially different from any future results, performance, achievements or financial position expressed or implied by these forward-looking statements. These factors include, but are not limited to: (i) changes in economic conditions and market demand affecting, and the competitive environment in, the automotive markets in Japan, North America, Europe, Asia and other markets in which Toyota operates; (ii) fluctuations in currency exchange rates, particularly with respect to the value of the Japanese yen, the U.S. dollar, the euro, the Australian dollar, the Russian ruble, the Canadian dollar and the British pound, and interest rates fluctuations; (iii) changes in funding environment in financial markets and increased competition in the financial services industry; (iv) Toyota’s ability to market and distribute effectively; (v) Toyota’s ability to realize production efficiencies and to implement capital expenditures at the levels and times planned by management; (vi) changes in the laws, regulations and government policies in the markets in which Toyota operates that affect Toyota’s automotive operations, particularly laws, regulations and government policies relating to vehicle safety including remedial measures such as recalls, trade, environmental protection, vehicle emissions and vehicle fuel economy, as well as changes in laws, regulations and government policies that affect Toyota’s other operations, including the outcome of current and future litigation and other legal proceedings, government proceedings and investigations; (vii) political and economic instability in the markets in which Toyota operates; (viii) Toyota’s ability to timely develop and achieve market acceptance of new products that meet customer demand; (ix) any damage to Toyota’s brand image; (x) Toyota’s reliance on various suppliers for the provision of supplies; (xi) increases in prices of raw materials; (xii) Toyota’s reliance on various digital and information technologies; (xiii) fuel shortages or interruptions in electricity, transportation systems, labor strikes, work stoppages or other interruptions to, or difficulties in, the employment of labor in the major markets where Toyota purchases materials, components and supplies for the production of its products or where its products are produced, distributed or sold; and (xiv) the impact of natural calamities including the negative effect on Toyota’s vehicle production and sales.
A discussion of these and other factors which may affect Toyota’s actual results, performance, achievements or financial position is contained in Toyota’s annual report on Form 20-F, which is on file with the United States Securities and Exchange Commission.
TOYOTA MOTOR CORPORATION FY2014 Financial Summary (Consolidated financial information has been prepared in accordance with U.S. generally accepted accounting principles)
6
2. Management Policy
(1) Toyota’s Basic Management Policy
“Management Policy” has been omitted, as there were no significant changes from the matters disclosed in the “Financial Summary” for the fiscal year ended March 31, 2012 (released on May 9, 2012).
The aforementioned information is available on the following Web sites. Toyota Web site: http://www.toyota.co.jp Tokyo Stock Exchange Group, Inc. Web site (listed company information page): http://www.tse.or.jp/english/listing/index.html
(2) Medium- and Long-term Management Strategy Toyota group is progressing steadily toward the realization of the Toyota Global Vision by
strengthening competitiveness and realizing innovations in order to achieve sustainable growth. Toyota group as a whole will continue to make greater efforts to address the following:
First, we will further pursue the manufacture of “ever-better cars” based on the “Toyota New Global Architecture,” a new framework for fundamentally reconsidering work procedures, in order to launch attractive products globally in a timely and efficient manner. For the Toyota brand, we intend to provide customers with attractive products such as next-generation eco-cars in developed countries, and establish a sustainable business base by reinforcing product competitiveness through the development of vehicles matched to various markets in emerging countries. For the Lexus brand, we intend to establish a global premium brand from Japan that is unbound by preconceptions.
Second, we intend to implement innovative activities to lead the future. In the automotive business, we plan to work toward the creation of values such as new lifestyles, and to foray into new fields with a venture spirit in the area of new businesses.
Third, we intend to promote activities to solidify our foundations in order to strengthen our competitiveness. We intend to improve our base for manufacturing “ever-better cars” through quality improvement, as well as through cost-reduction activities toward building a robust business base that will be little affected by changes in foreign exchange rates or the number of units manufactured or sold, the further promotion of human resource development for the enhancement of our global competitiveness, and business innovations using IT.
Based on these efforts, Toyota will contribute to realize “enriching lives of communities” through providing “ever-better cars” that exceed customer expectations. This is expected to encourage more customers to purchase Toyota cars and thereby lead to the establishment of a stable business base. By perpetuating this positive cycle, we will aim to realize sustainable growth and enhance corporate value. In addition, through full observance of corporate ethics such as compliance with applicable laws and regulations, Toyota will fulfill its social responsibilities by carrying out its Corporate Social Responsibility (CSR).
TOYOTA MOTOR CORPORATION FY2014 Financial Summary (Consolidated financial information has been prepared in accordance with U.S. generally accepted accounting principles)
7
3. Consolidated Production and Sales
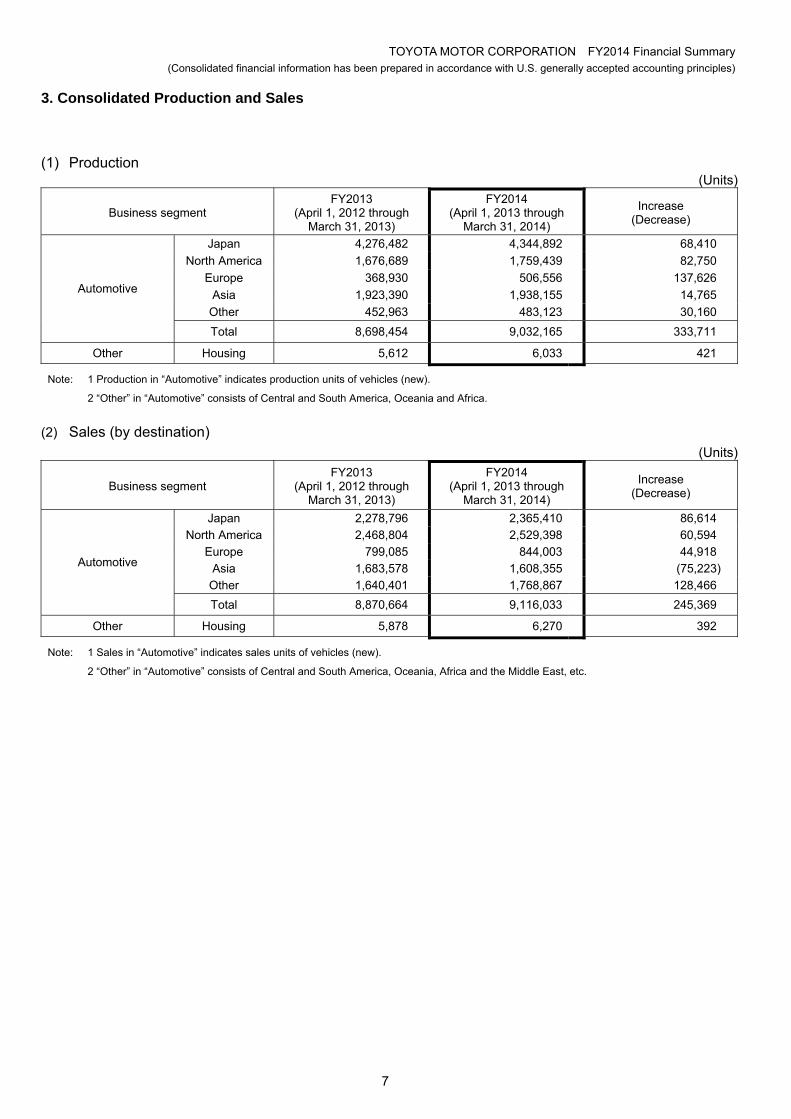
(1) Production (Units)
Business segment
FY2013 (April 1, 2012 through
March 31, 2013)
FY2014 (April 1, 2013 through
March 31, 2014)
Increase (Decrease)
Japan 4,276,482 4,344,892 68,410
North America 1,676,689 1,759,439 82,750
Europe 368,930 506,556 137,626
Asia 1,923,390 1,938,155 14,765
Other 452,963 483,123 30,160
Automotive
Total 8,698,454 9,032,165 333,711
Other Housing 5,612 6,033 421
Note: 1 Production in “Automotive” indicates production units of vehicles (new).
2 “Other” in “Automotive” consists of Central and South America, Oceania and Africa.
(2) Sales (by destination)
(Units)
Business segment
FY2013 (April 1, 2012 through
March 31, 2013)
FY2014 (April 1, 2013 through
March 31, 2014)
Increase (Decrease)
Japan 2,278,796 2,365,410 86,614
North America 2,468,804 2,529,398 60,594
Europe 799,085 844,003 44,918
Asia 1,683,578 1,608,355 (75,223)
Other 1,640,401 1,768,867 128,466
Automotive
Total 8,870,664 9,116,033 245,369
Other Housing 5,878 6,270 392
Note: 1 Sales in “Automotive” indicates sales units of vehicles (new).
2 “Other” in “Automotive” consists of Central and South America, Oceania, Africa and the Middle East, etc.
TOYOTA MOTOR CORPORATION FY2014 Financial Summary (Consolidated financial information has been prepared in accordance with U.S. generally accepted accounting principles)
8
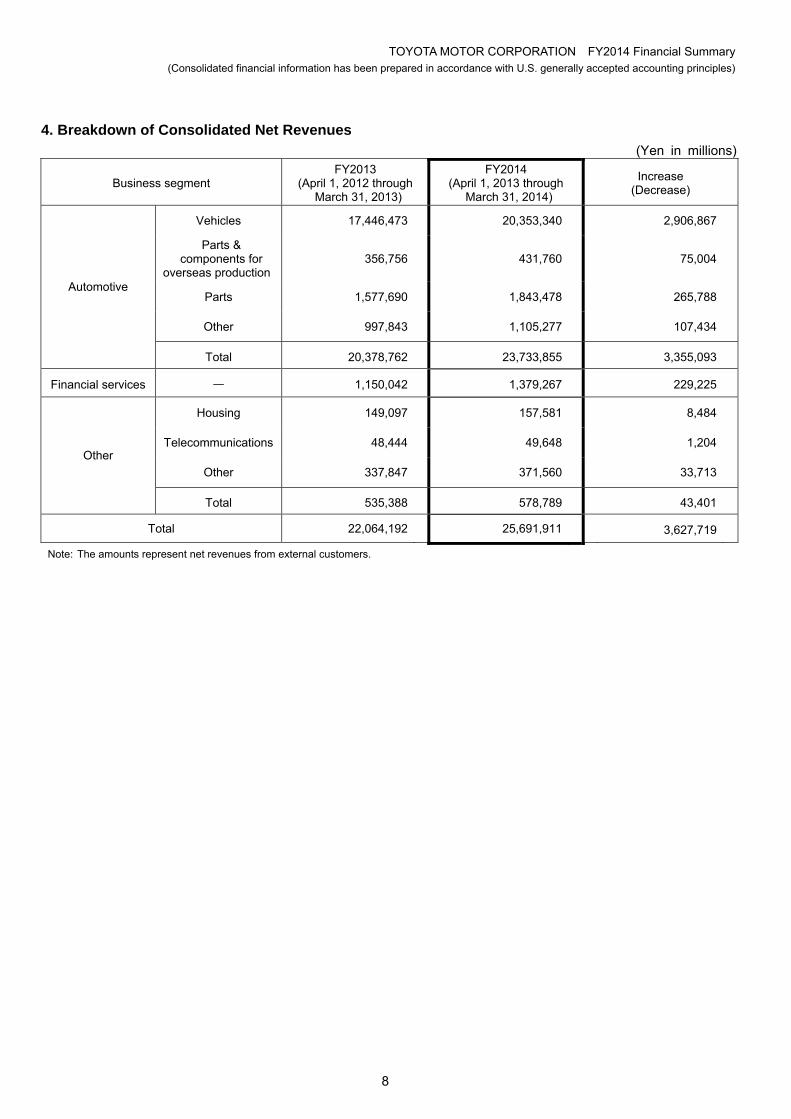
4. Breakdown of Consolidated Net Revenues
(Yen in millions)
Business segment FY2013
(April 1, 2012 through March 31, 2013)
FY2014 (April 1, 2013 through
March 31, 2014)
Increase (Decrease)
Vehicles 17,446,473 20,353,340 2,906,867
Parts & components for
overseas production 356,756 431,760 75,004
Parts 1,577,690 1,843,478 265,788
Other 997,843 1,105,277 107,434
Automotive
Total 20,378,762 23,733,855 3,355,093
Financial services — 1,150,042 1,379,267 229,225
Housing 149,097 157,581 8,484
Telecommunications 48,444 49,648 1,204
Other 337,847 371,560 33,713
Other
Total 535,388 578,789 43,401
Total 22,064,192 25,691,911 3,627,719
Note: The amounts represent net revenues from external customers.
TOYOTA MOTOR CORPORATION FY2014 Financial Summary (Consolidated financial information has been prepared in accordance with U.S. generally accepted accounting principles)
9
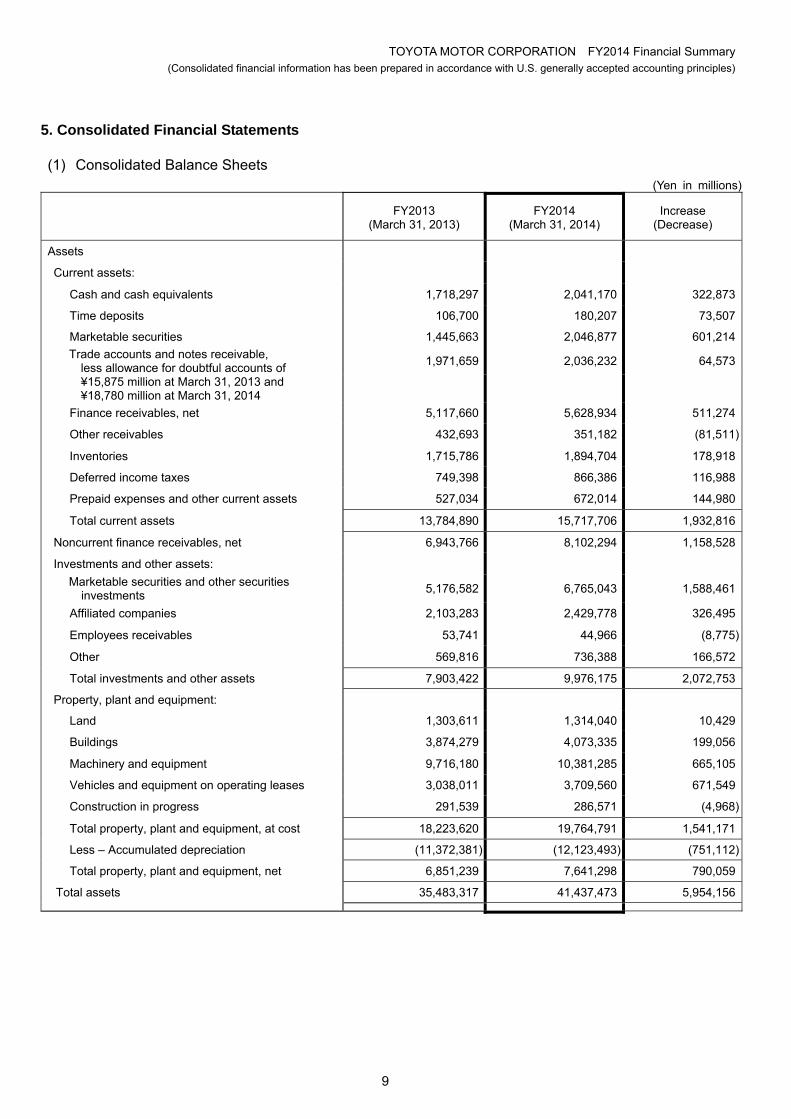
5. Consolidated Financial Statements
(1) Consolidated Balance Sheets (Yen in millions)
FY2013 (March 31, 2013)
FY2014 (March 31, 2014)
Increase (Decrease)
Assets
Current assets:
Cash and cash equivalents 1,718,297 2,041,170 322,873
Time deposits 106,700 180,207 73,507
Marketable securities 1,445,663 2,046,877 601,214
Trade accounts and notes receivable,
less allowance for doubtful accounts of 1,971,659 2,036,232 64,573
¥15,875 million at March 31, 2013 and ¥18,780 million at March 31, 2014
Finance receivables, net 5,117,660 5,628,934 511,274
Other receivables 432,693 351,182 (81,511)
Inventories 1,715,786 1,894,704 178,918
Deferred income taxes 749,398 866,386 116,988
Prepaid expenses and other current assets 527,034 672,014 144,980
Total current assets 13,784,890 15,717,706 1,932,816
Noncurrent finance receivables, net 6,943,766 8,102,294 1,158,528
Investments and other assets:
Marketable securities and other securities
investments 5,176,582 6,765,043 1,588,461
Affiliated companies 2,103,283 2,429,778 326,495
Employees receivables 53,741 44,966 (8,775)
Other 569,816 736,388 166,572
Total investments and other assets 7,903,422 9,976,175 2,072,753
Property, plant and equipment:
Land 1,303,611 1,314,040 10,429
Buildings 3,874,279 4,073,335 199,056
Machinery and equipment 9,716,180 10,381,285 665,105
Vehicles and equipment on operating leases 3,038,011 3,709,560 671,549
Construction in progress 291,539 286,571 (4,968)
Total property, plant and equipment, at cost 18,223,620 19,764,791 1,541,171
Less – Accumulated depreciation (11,372,381) (12,123,493) (751,112)
Total property, plant and equipment, net 6,851,239 7,641,298 790,059
Total assets 35,483,317 41,437,473 5,954,156
TOYOTA MOTOR CORPORATION FY2014 Financial Summary (Consolidated financial information has been prepared in accordance with U.S. generally accepted accounting principles)
10
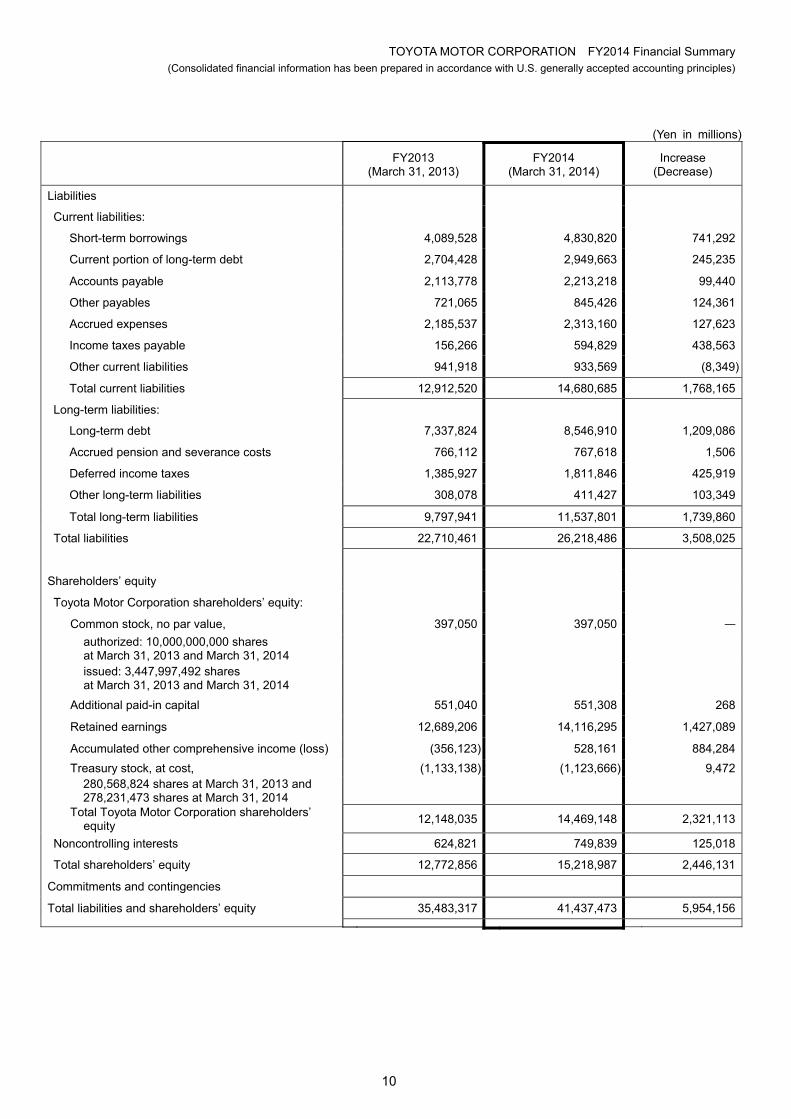
(Yen in millions)
FY2013 (March 31, 2013)
FY2014 (March 31, 2014)
Increase (Decrease)
Liabilities
Current liabilities:
Short-term borrowings 4,089,528 4,830,820 741,292
Current portion of long-term debt 2,704,428 2,949,663 245,235
Accounts payable 2,113,778 2,213,218 99,440
Other payables 721,065 845,426 124,361
Accrued expenses 2,185,537 2,313,160 127,623
Income taxes payable 156,266 594,829 438,563
Other current liabilities 941,918 933,569 (8,349)
Total current liabilities 12,912,520 14,680,685 1,768,165
Long-term liabilities:
Long-term debt 7,337,824 8,546,910 1,209,086
Accrued pension and severance costs 766,112 767,618 1,506
Deferred income taxes 1,385,927 1,811,846 425,919
Other long-term liabilities 308,078 411,427 103,349
Total long-term liabilities 9,797,941 11,537,801 1,739,860
Total liabilities 22,710,461 26,218,486 3,508,025
Shareholders’ equity
Toyota Motor Corporation shareholders’ equity:
Common stock, no par value, 397,050 397,050 —
authorized: 10,000,000,000 shares at March 31, 2013 and March 31, 2014
issued: 3,447,997,492 shares at March 31, 2013 and March 31, 2014
Additional paid-in capital 551,040 551,308 268
Retained earnings 12,689,206 14,116,295 1,427,089
Accumulated other comprehensive income (loss) (356,123) 528,161 884,284
Treasury stock, at cost, (1,133,138) (1,123,666) 9,472
280,568,824 shares at March 31, 2013 and 278,231,473 shares at March 31, 2014
Total Toyota Motor Corporation shareholders’
equity 12,148,035 14,469,148 2,321,113
Noncontrolling interests 624,821 749,839 125,018
Total shareholders’ equity 12,772,856 15,218,987 2,446,131
Commitments and contingencies
Total liabilities and shareholders’ equity 35,483,317 41,437,473 5,954,156
TOYOTA MOTOR CORPORATION FY2014 Financial Summary (Consolidated financial information has been prepared in accordance with U.S. generally accepted accounting principles)
11
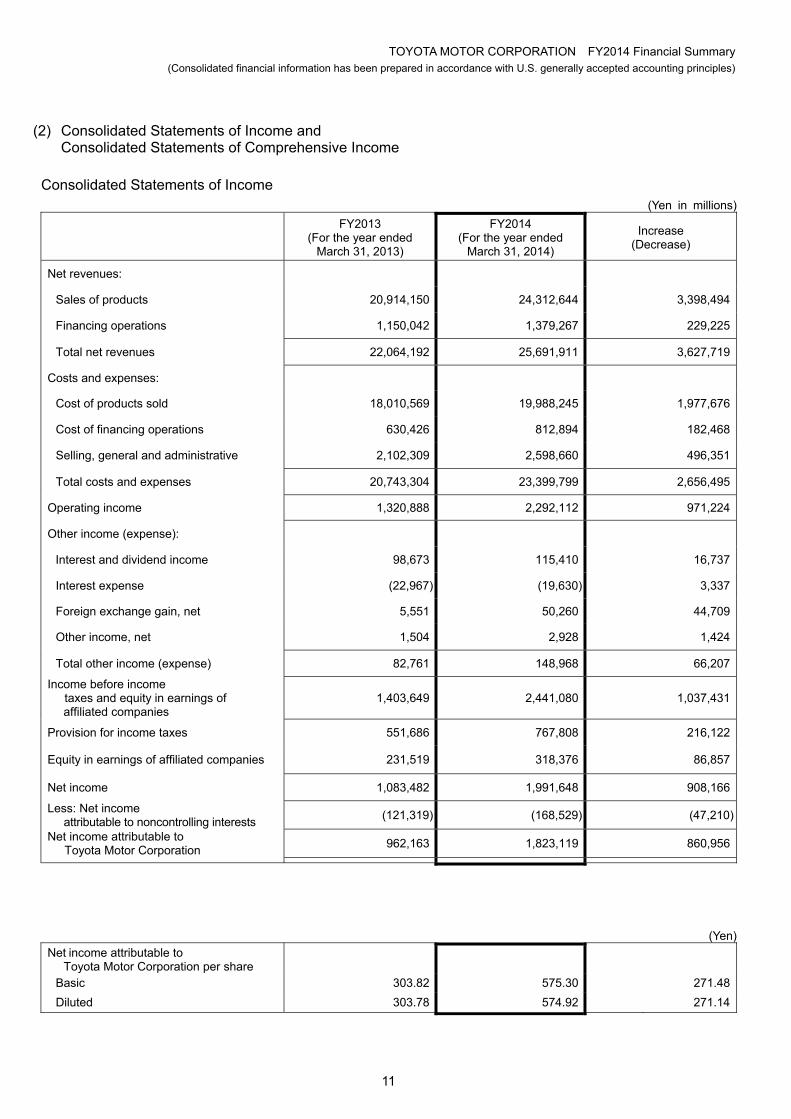
(2) Consolidated Statements of Income and Consolidated Statements of Comprehensive Income
Consolidated Statements of Income
(Yen in millions)
FY2013 (For the year ended
March 31, 2013)
FY2014 (For the year ended
March 31, 2014)
Increase (Decrease)
Net revenues:
Sales of products 20,914,150 24,312,644 3,398,494
Financing operations 1,150,042 1,379,267 229,225
Total net revenues 22,064,192 25,691,911 3,627,719
Costs and expenses:
Cost of products sold 18,010,569 19,988,245 1,977,676
Cost of financing operations 630,426 812,894 182,468
Selling, general and administrative 2,102,309 2,598,660 496,351
Total costs and expenses 20,743,304 23,399,799 2,656,495
Operating income 1,320,888 2,292,112 971,224
Other income (expense):
Interest and dividend income 98,673 115,410 16,737
Interest expense (22,967) (19,630) 3,337
Foreign exchange gain, net 5,551 50,260 44,709
Other income, net 1,504 2,928 1,424
Total other income (expense) 82,761 148,968 66,207
Income before income taxes and equity in earnings of affiliated companies
1,403,649 2,441,080 1,037,431
Provision for income taxes 551,686 767,808 216,122
Equity in earnings of affiliated companies 231,519 318,376 86,857
Net income 1,083,482 1,991,648 908,166
Less: Net income
attributable to noncontrolling interests (121,319) (168,529) (47,210)
Net income attributable to
Toyota Motor Corporation 962,163 1,823,119 860,956
(Yen)
Net income attributable to
Toyota Motor Corporation per share
Basic 303.82 575.30 271.48
Diluted 303.78 574.92 271.14
TOYOTA MOTOR CORPORATION FY2014 Financial Summary (Consolidated financial information has been prepared in accordance with U.S. generally accepted accounting principles)
12
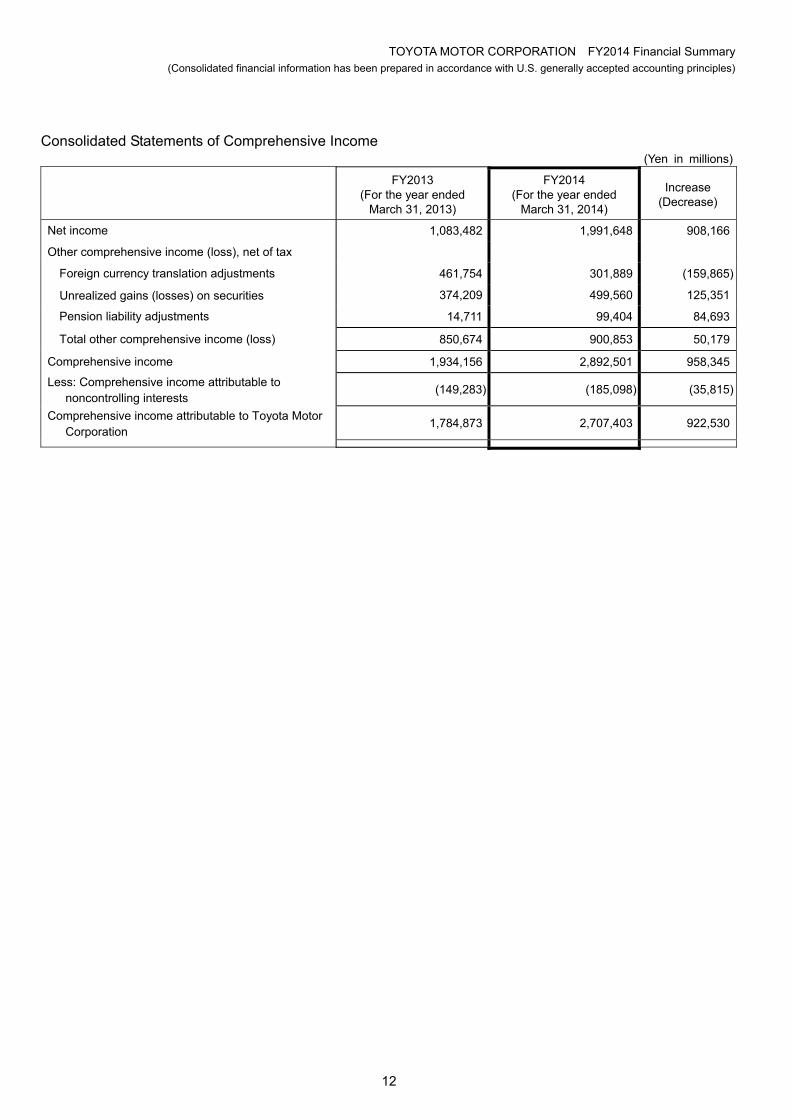
Consolidated Statements of Comprehensive Income (Yen in millions)
FY2013
(For the year ended March 31, 2013)
FY2014 (For the year ended
March 31, 2014)
Increase (Decrease)
Net income 1,083,482 1,991,648 908,166
Other comprehensive income (loss), net of tax Foreign currency translation adjustments 461,754 301,889 (159,865)
Unrealized gains (losses) on securities 374,209 499,560 125,351
Pension liability adjustments 14,711 99,404 84,693
Total other comprehensive income (loss) 850,674 900,853 50,179
Comprehensive income 1,934,156 2,892,501 958,345
Less: Comprehensive income attributable to noncontrolling interests
(149,283) (185,098) (35,815)
Comprehensive income attributable to Toyota Motor Corporation
1,784,873 2,707,403 922,530
TOYOTA MOTOR CORPORATION FY2014 Financial Summary (Consolidated financial information has been prepared in accordance with U.S. generally accepted accounting principles)
13
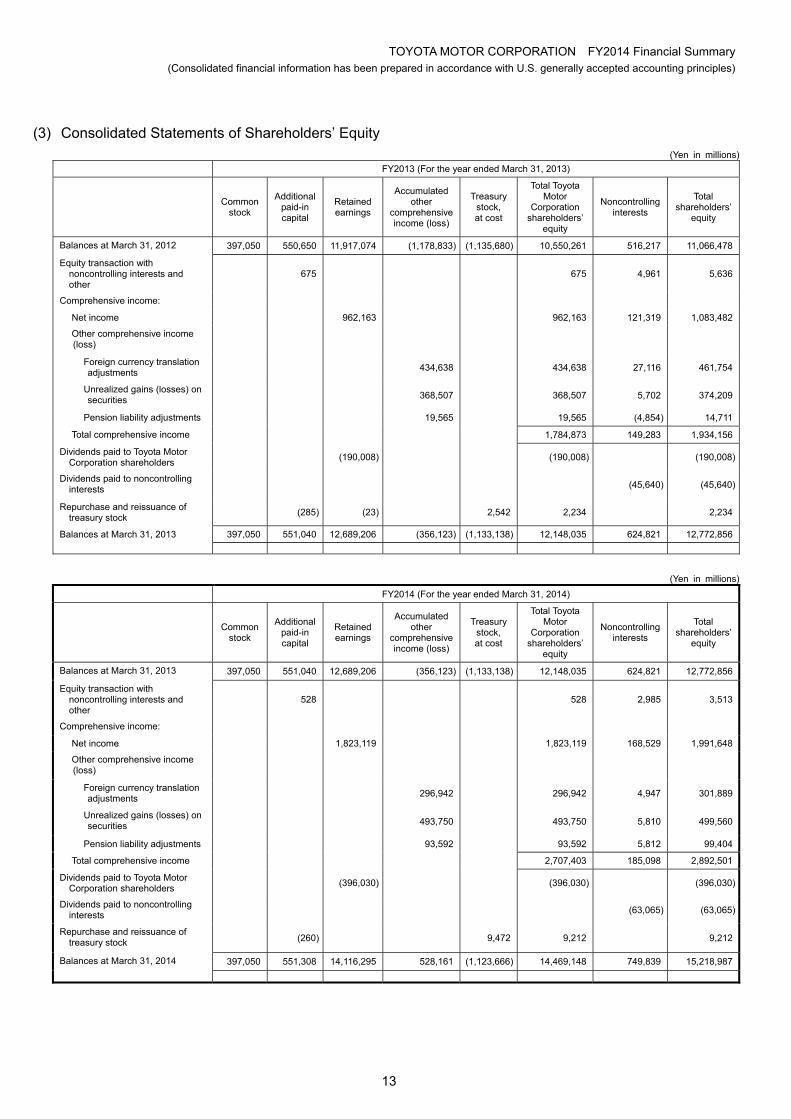
(3) Consolidated Statements of Shareholders’ Equity
(Yen in millions)
FY2013 (For the year ended March 31, 2013)
Common stock
Additional paid-in capital
Retained earnings
Accumulated other
comprehensive income (loss)
Treasury stock, at cost
Total Toyota Motor
Corporation shareholders’
equity
Noncontrolling interests
Total shareholders’
equity
Balances at March 31, 2012 397,050 550,650 11,917,074 (1,178,833) (1,135,680) 10,550,261 516,217 11,066,478
Equity transaction with noncontrolling interests and other
675 675 4,961 5,636
Comprehensive income:
Net income 962,163 962,163 121,319 1,083,482
Other comprehensive income (loss)
Foreign currency translation adjustments 434,638 434,638 27,116 461,754
Unrealized gains (losses) on securities 368,507 368,507 5,702 374,209
Pension liability adjustments 19,565 19,565 (4,854) 14,711
Total comprehensive income 1,784,873 149,283 1,934,156
Dividends paid to Toyota Motor Corporation shareholders
(190,008) (190,008) (190,008)
Dividends paid to noncontrolling interests (45,640) (45,640)
Repurchase and reissuance of treasury stock
(285) (23) 2,542 2,234 2,234
Balances at March 31, 2013 397,050 551,040 12,689,206 (356,123) (1,133,138) 12,148,035 624,821 12,772,856
(Yen in millions)
FY2014 (For the year ended March 31, 2014)
Common stock
Additional paid-in capital
Retained earnings
Accumulated other
comprehensive income (loss)
Treasury stock, at cost
Total Toyota Motor
Corporation shareholders’
equity
Noncontrolling interests
Total shareholders’
equity
Balances at March 31, 2013 397,050 551,040 12,689,206 (356,123) (1,133,138) 12,148,035 624,821 12,772,856
Equity transaction with noncontrolling interests and other
528 528 2,985 3,513
Comprehensive income:
Net income 1,823,119 1,823,119 168,529 1,991,648
Other comprehensive income (loss)
Foreign currency translation adjustments 296,942 296,942 4,947 301,889
Unrealized gains (losses) on securities 493,750 493,750 5,810 499,560
Pension liability adjustments 93,592 93,592 5,812 99,404
Total comprehensive income 2,707,403 185,098 2,892,501
Dividends paid to Toyota Motor Corporation shareholders
(396,030) (396,030) (396,030)
Dividends paid to noncontrolling interests (63,065) (63,065)
Repurchase and reissuance of treasury stock (260) 9,472 9,212 9,212
Balances at March 31, 2014 397,050 551,308 14,116,295 528,161 (1,123,666) 14,469,148 749,839 15,218,987
TOYOTA MOTOR CORPORATION FY2014 Financial Summary (Consolidated financial information has been prepared in accordance with U.S. generally accepted accounting principles)
14
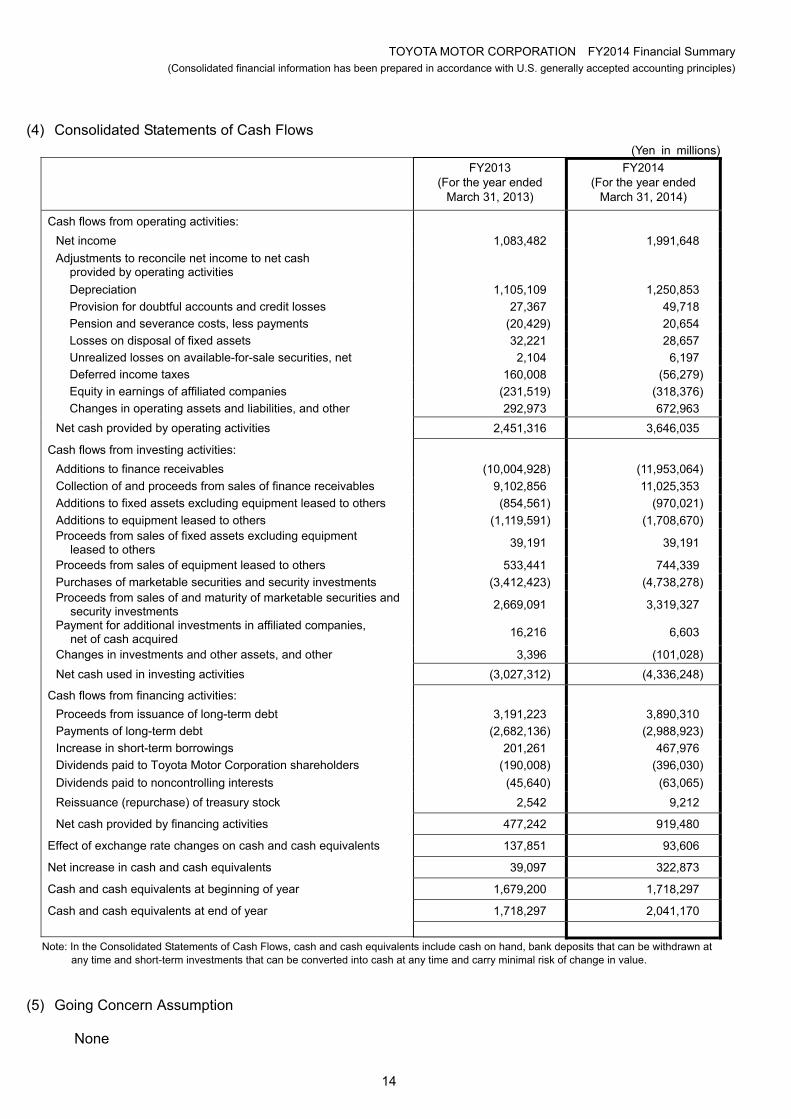
(4) Consolidated Statements of Cash Flows (Yen in millions)
FY2013 (For the year ended
March 31, 2013)
FY2014 (For the year ended
March 31, 2014)
Cash flows from operating activities:
Net income 1,083,482 1,991,648
Adjustments to reconcile net income to net cash provided by operating activities
Depreciation 1,105,109 1,250,853
Provision for doubtful accounts and credit losses 27,367 49,718
Pension and severance costs, less payments (20,429) 20,654
Losses on disposal of fixed assets 32,221 28,657
Unrealized losses on available-for-sale securities, net 2,104 6,197
Deferred income taxes 160,008 (56,279)
Equity in earnings of affiliated companies (231,519) (318,376)
Changes in operating assets and liabilities, and other 292,973 672,963
Net cash provided by operating activities 2,451,316 3,646,035
Cash flows from investing activities:
Additions to finance receivables (10,004,928) (11,953,064)
Collection of and proceeds from sales of finance receivables 9,102,856 11,025,353
Additions to fixed assets excluding equipment leased to others (854,561) (970,021)
Additions to equipment leased to others (1,119,591) (1,708,670) Proceeds from sales of fixed assets excluding equipment
leased to others 39,191 39,191
Proceeds from sales of equipment leased to others 533,441 744,339
Purchases of marketable securities and security investments (3,412,423) (4,738,278) Proceeds from sales of and maturity of marketable securities and
security investments 2,669,091 3,319,327
Payment for additional investments in affiliated companies, net of cash acquired
16,216 6,603
Changes in investments and other assets, and other 3,396 (101,028)
Net cash used in investing activities (3,027,312) (4,336,248)
Cash flows from financing activities:
Proceeds from issuance of long-term debt 3,191,223 3,890,310
Payments of long-term debt (2,682,136) (2,988,923)
Increase in short-term borrowings 201,261 467,976
Dividends paid to Toyota Motor Corporation shareholders (190,008) (396,030)
Dividends paid to noncontrolling interests (45,640) (63,065)
Reissuance (repurchase) of treasury stock 2,542 9,212
Net cash provided by financing activities 477,242 919,480
Effect of exchange rate changes on cash and cash equivalents 137,851 93,606
Net increase in cash and cash equivalents 39,097 322,873
Cash and cash equivalents at beginning of year 1,679,200 1,718,297
Cash and cash equivalents at end of year 1,718,297 2,041,170
Note: In the Consolidated Statements of Cash Flows, cash and cash equivalents include cash on hand, bank deposits that can be withdrawn at any time and short-term investments that can be converted into cash at any time and carry minimal risk of change in value.
(5) Going Concern Assumption
None
TOYOTA MOTOR CORPORATION FY2014 Financial Summary (Consolidated financial information has been prepared in accordance with U.S. generally accepted accounting principles)
15
(6) Summary of Significant Accounting Policies
“Summary of Significant Accounting Policies” has been omitted, as there were no significant changes from the most recent Securities Report (filed on June 24, 2013). Changes in accounting principles, procedures, and disclosures for consolidated financial statements by newly issued accounting pronouncements are set forth below.
In December 2011, the Financial Accounting Standards Board (“FASB”) issued updated
guidance of disclosures about offsetting assets and liabilities. This guidance requires additional disclosures about gross and net information for assets and liabilities including financial instruments eligible for offset in the balance sheets. The parent company and its consolidated subsidiaries (“Toyota”) adopted this guidance from the fiscal year ended March 31, 2014. The adoption of this guidance did not have a material impact on Toyota’s consolidated financial statements.
In February 2013, FASB issued updated guidance on the presentation of items reclassified out
of accumulated other comprehensive income. This guidance requires to present, either in a single note or parenthetically on the face of the financial statements, the effect of significant amounts reclassified out of each component of accumulated other comprehensive income based on its source. Toyota adopted this guidance from the fiscal year ended March 31, 2014. The adoption of this guidance did not have a material impact on Toyota’s consolidated financial statements.
In July 2013, FASB issued updated guidance which permits the Fed Funds Effective Swap
Rate (or Overnight Index Swap Rate) to be used as a benchmark interest rate for hedge accounting purposes. This guidance also removes the restriction on using different benchmark rates for similar hedges. Toyota adopted this guidance for qualifying new or redesignated hedging relationships entered into on or after July 17, 2013. The adoption of this guidance did not have a material impact on Toyota’s consolidated financial statements.
TOYOTA MOTOR CORPORATION FY2014 Financial Summary (Consolidated financial information has been prepared in accordance with U.S. generally accepted accounting principles)
16
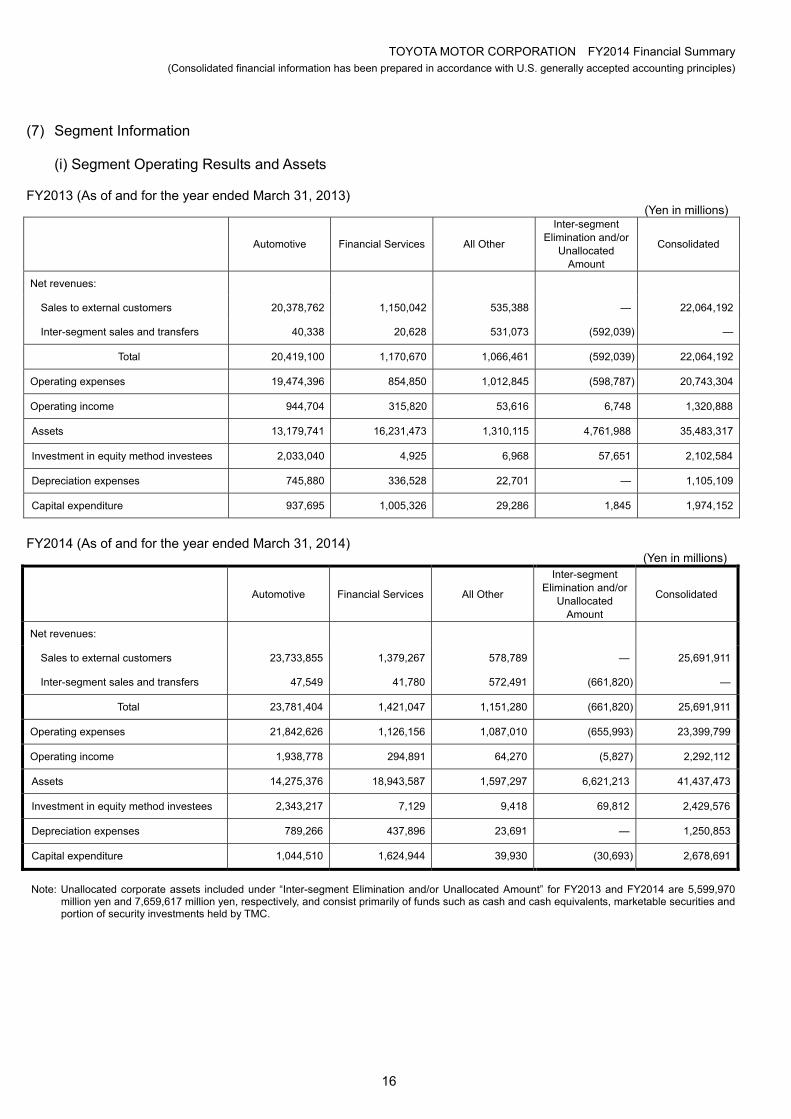
(7) Segment Information
(i) Segment Operating Results and Assets FY2013 (As of and for the year ended March 31, 2013) (Yen in millions)
Automotive Financial Services All Other
Inter-segment Elimination and/or
Unallocated Amount
Consolidated
Net revenues:
Sales to external customers 20,378,762 1,150,042 535,388 — 22,064,192
Inter-segment sales and transfers 40,338 20,628 531,073 (592,039) —
Total 20,419,100 1,170,670 1,066,461 (592,039) 22,064,192
Operating expenses 19,474,396 854,850 1,012,845 (598,787) 20,743,304
Operating income 944,704 315,820 53,616 6,748 1,320,888
Assets 13,179,741 16,231,473 1,310,115 4,761,988 35,483,317
Investment in equity method investees 2,033,040 4,925 6,968 57,651 2,102,584
Depreciation expenses 745,880 336,528 22,701 — 1,105,109
Capital expenditure 937,695 1,005,326 29,286 1,845 1,974,152 FY2014 (As of and for the year ended March 31, 2014) (Yen in millions)
Automotive Financial Services All Other
Inter-segment Elimination and/or
Unallocated Amount
Consolidated
Net revenues:
Sales to external customers 23,733,855 1,379,267 578,789 — 25,691,911
Inter-segment sales and transfers 47,549 41,780 572,491 (661,820) —
Total 23,781,404 1,421,047 1,151,280 (661,820) 25,691,911
Operating expenses 21,842,626 1,126,156 1,087,010 (655,993) 23,399,799
Operating income 1,938,778 294,891 64,270 (5,827) 2,292,112
Assets 14,275,376 18,943,587 1,597,297 6,621,213 41,437,473
Investment in equity method investees 2,343,217 7,129 9,418 69,812 2,429,576
Depreciation expenses 789,266 437,896 23,691 — 1,250,853
Capital expenditure 1,044,510 1,624,944 39,930 (30,693) 2,678,691
Note: Unallocated corporate assets included under “Inter-segment Elimination and/or Unallocated Amount” for FY2013 and FY2014 are 5,599,970
million yen and 7,659,617 million yen, respectively, and consist primarily of funds such as cash and cash equivalents, marketable securities and portion of security investments held by TMC.
TOYOTA MOTOR CORPORATION FY2014 Financial Summary (Consolidated financial information has been prepared in accordance with U.S. generally accepted accounting principles)
17
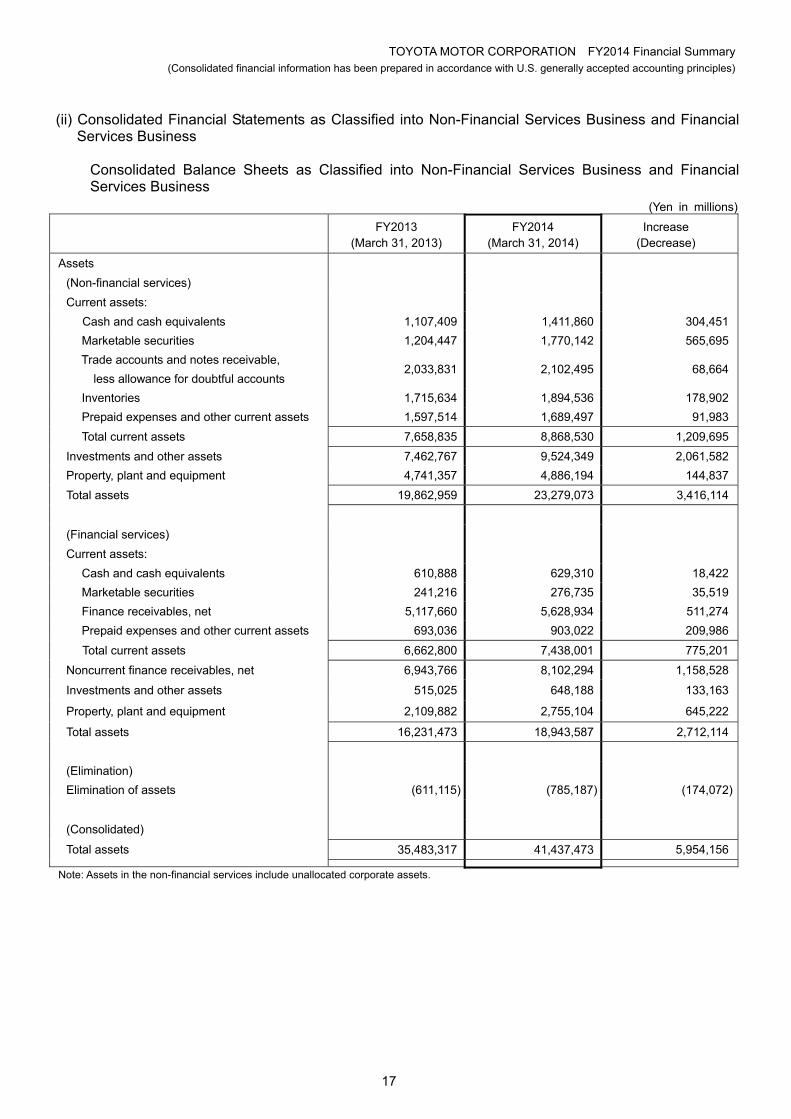
(ii) Consolidated Financial Statements as Classified into Non-Financial Services Business and Financial Services Business
Consolidated Balance Sheets as Classified into Non-Financial Services Business and Financial Services Business
(Yen in millions)
FY2013
(March 31, 2013) FY2014
(March 31, 2014) Increase
(Decrease)
Assets
(Non-financial services)
Current assets:
Cash and cash equivalents 1,107,409 1,411,860 304,451
Marketable securities 1,204,447 1,770,142 565,695
Trade accounts and notes receivable,
less allowance for doubtful accounts 2,033,831 2,102,495 68,664
Inventories 1,715,634 1,894,536 178,902
Prepaid expenses and other current assets 1,597,514 1,689,497 91,983
Total current assets 7,658,835 8,868,530 1,209,695
Investments and other assets 7,462,767 9,524,349 2,061,582
Property, plant and equipment 4,741,357 4,886,194 144,837
Total assets 19,862,959 23,279,073 3,416,114
(Financial services)
Current assets:
Cash and cash equivalents 610,888 629,310 18,422
Marketable securities 241,216 276,735 35,519
Finance receivables, net 5,117,660 5,628,934 511,274
Prepaid expenses and other current assets 693,036 903,022 209,986
Total current assets 6,662,800 7,438,001 775,201
Noncurrent finance receivables, net 6,943,766 8,102,294 1,158,528
Investments and other assets 515,025 648,188 133,163
Property, plant and equipment 2,109,882 2,755,104 645,222
Total assets 16,231,473 18,943,587 2,712,114
(Elimination)
Elimination of assets (611,115) (785,187) (174,072)
(Consolidated)
Total assets 35,483,317 41,437,473 5,954,156
Note: Assets in the non-financial services include unallocated corporate assets.

TOYOTA MOTOR CORPORATION FY2014 Financial Summary (Consolidated financial information has been prepared in accordance with U.S. generally accepted accounting principles)
18
(Yen in millions)
FY2013
(March 31, 2013) FY2014
(March 31, 2014) Increase
(Decrease)
Liabilities (Non-financial services) Current liabilities:
Short-term borrowings 576,685 587,809 11,124 Current portion of long-term debt 185,582 131,215 (54,367) Accounts payable 2,092,722 2,180,190 87,468 Accrued expenses 2,092,102 2,218,495 126,393 Income taxes payable 140,935 583,115 442,180 Other current liabilities 1,186,870 1,283,730 96,860
Total current liabilities 6,274,896 6,984,554 709,658
Long-term liabilities: Long-term debt 521,428 526,498 5,070 Accrued pension and severance costs 754,360 756,229 1,869 Other long-term liabilities 969,668 1,506,806 537,138
Total long-term liabilities 2,245,456 2,789,533 544,077
Total liabilities 8,520,352 9,774,087 1,253,735
(Financial services)
Current liabilities: Short-term borrowings 3,861,699 4,610,449 748,750 Current portion of long-term debt 2,538,249 2,834,445 296,196 Accounts payable 37,655 45,687 8,032 Accrued expenses 105,901 108,953 3,052 Income taxes payable 15,331 11,714 (3,617)
Other current liabilities 632,025 685,278 53,253
Total current liabilities 7,190,860 8,296,526 1,105,666
Long-term liabilities: Long-term debt 6,876,849 8,084,565 1,207,716 Accrued pension and severance costs 11,752 11,389 (363) Other long-term liabilities 724,337 840,218 115,881
Total long-term liabilities 7,612,938 8,936,172 1,323,234
Total liabilities 14,803,798 17,232,698 2,428,900
(Elimination) Elimination of liabilities (613,689) (788,299) (174,610)
(Consolidated) Total liabilities 22,710,461 26,218,486 3,508,025
Shareholders’ equity
(Consolidated) Total Toyota Motor Corporation shareholders’
equity 12,148,035 14,469,148 2,321,113
(Consolidated) Noncontrolling interests 624,821 749,839 125,018
(Consolidated) Total shareholders’ equity 12,772,856 15,218,987 2,446,131
(Consolidated) Total liabilities and shareholders’ equity
35,483,317 41,437,473 5,954,156
TOYOTA MOTOR CORPORATION FY2014 Financial Summary (Consolidated financial information has been prepared in accordance with U.S. generally accepted accounting principles)
19
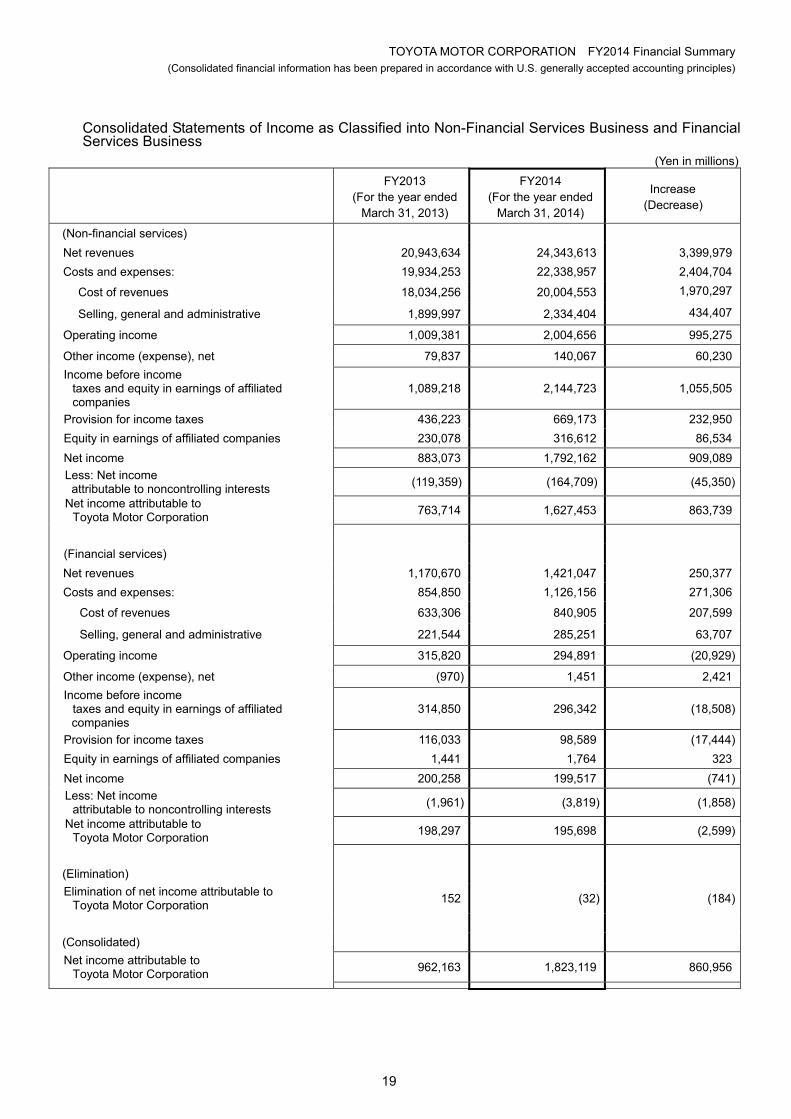
Consolidated Statements of Income as Classified into Non-Financial Services Business and Financial Services Business
(Yen in millions)
FY2013
(For the year ended March 31, 2013)
FY2014 (For the year ended
March 31, 2014)
Increase (Decrease)
(Non-financial services)
Net revenues 20,943,634 24,343,613 3,399,979
Costs and expenses: 19,934,253 22,338,957 2,404,704
Cost of revenues 18,034,256 20,004,553 1,970,297
Selling, general and administrative 1,899,997 2,334,404 434,407
Operating income 1,009,381 2,004,656 995,275
Other income (expense), net 79,837 140,067 60,230
Income before income taxes and equity in earnings of affiliated companies
1,089,218 2,144,723 1,055,505
Provision for income taxes 436,223 669,173 232,950
Equity in earnings of affiliated companies 230,078 316,612 86,534
Net income 883,073 1,792,162 909,089
Less: Net income attributable to noncontrolling interests
(119,359) (164,709) (45,350)
Net income attributable to Toyota Motor Corporation
763,714 1,627,453 863,739
(Financial services)
Net revenues 1,170,670 1,421,047 250,377
Costs and expenses: 854,850 1,126,156 271,306
Cost of revenues 633,306 840,905 207,599
Selling, general and administrative 221,544 285,251 63,707
Operating income 315,820 294,891 (20,929)
Other income (expense), net (970) 1,451 2,421
Income before income taxes and equity in earnings of affiliated companies
314,850 296,342 (18,508)
Provision for income taxes 116,033 98,589 (17,444)
Equity in earnings of affiliated companies 1,441 1,764 323
Net income 200,258 199,517 (741)
Less: Net income attributable to noncontrolling interests
(1,961) (3,819) (1,858)
Net income attributable to Toyota Motor Corporation
198,297 195,698 (2,599)
(Elimination)
Elimination of net income attributable to Toyota Motor Corporation
152 (32) (184)
(Consolidated)
Net income attributable to Toyota Motor Corporation
962,163 1,823,119 860,956
TOYOTA MOTOR CORPORATION FY2014 Financial Summary (Consolidated financial information has been prepared in accordance with U.S. generally accepted accounting principles)
20
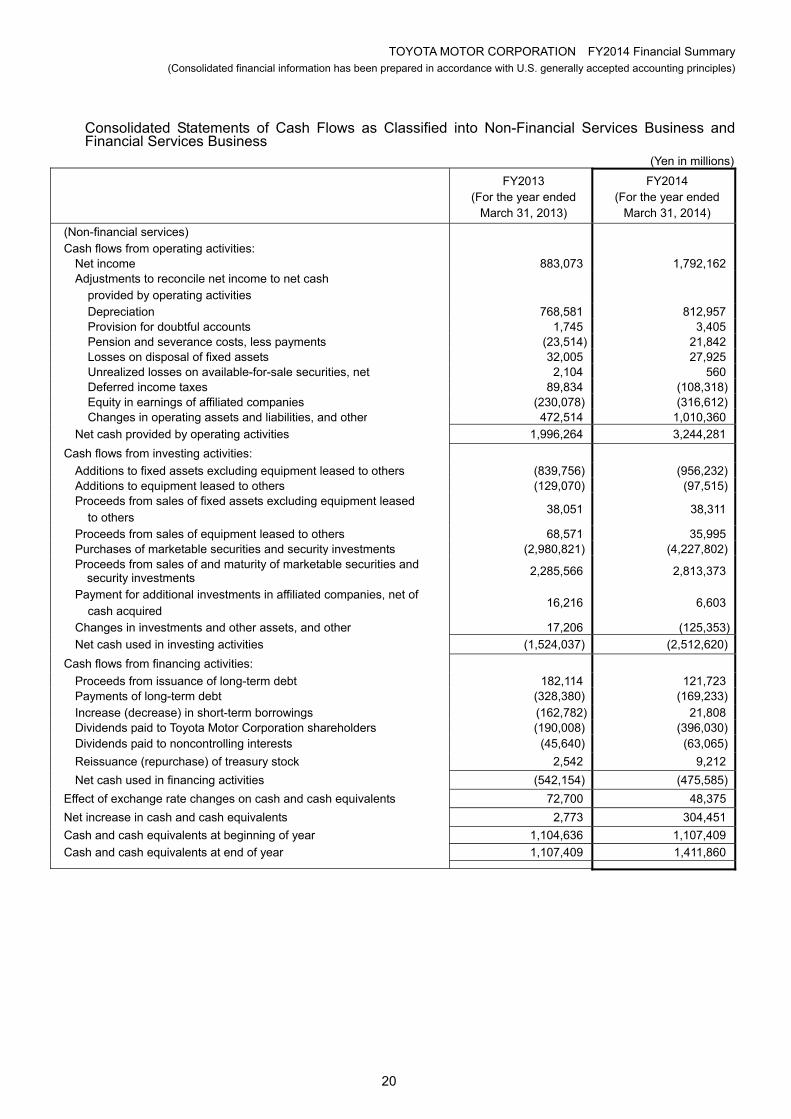
Consolidated Statements of Cash Flows as Classified into Non-Financial Services Business and Financial Services Business
(Yen in millions)
FY2013
(For the year ended March 31, 2013)
FY2014 (For the year ended
March 31, 2014)
(Non-financial services) Cash flows from operating activities:
Net income 883,073 1,792,162Adjustments to reconcile net income to net cash
provided by operating activities
Depreciation 768,581 812,957Provision for doubtful accounts 1,745 3,405Pension and severance costs, less payments (23,514) 21,842Losses on disposal of fixed assets 32,005 27,925Unrealized losses on available-for-sale securities, net 2,104 560Deferred income taxes 89,834 (108,318)Equity in earnings of affiliated companies (230,078) (316,612)Changes in operating assets and liabilities, and other 472,514 1,010,360
Net cash provided by operating activities 1,996,264 3,244,281
Cash flows from investing activities:
Additions to fixed assets excluding equipment leased to others (839,756) (956,232)Additions to equipment leased to others (129,070) (97,515)Proceeds from sales of fixed assets excluding equipment leased
to others 38,051 38,311
Proceeds from sales of equipment leased to others 68,571 35,995Purchases of marketable securities and security investments (2,980,821) (4,227,802)Proceeds from sales of and maturity of marketable securities and
security investments 2,285,566 2,813,373
Payment for additional investments in affiliated companies, net of cash acquired
16,216 6,603
Changes in investments and other assets, and other 17,206 (125,353)
Net cash used in investing activities (1,524,037) (2,512,620)
Cash flows from financing activities:
Proceeds from issuance of long-term debt 182,114 121,723Payments of long-term debt (328,380) (169,233)Increase (decrease) in short-term borrowings (162,782) 21,808Dividends paid to Toyota Motor Corporation shareholders (190,008) (396,030)Dividends paid to noncontrolling interests (45,640) (63,065)
Reissuance (repurchase) of treasury stock 2,542 9,212
Net cash used in financing activities (542,154) (475,585)
Effect of exchange rate changes on cash and cash equivalents 72,700 48,375
Net increase in cash and cash equivalents 2,773 304,451
Cash and cash equivalents at beginning of year 1,104,636 1,107,409
Cash and cash equivalents at end of year 1,107,409 1,411,860
TOYOTA MOTOR CORPORATION FY2014 Financial Summary (Consolidated financial information has been prepared in accordance with U.S. generally accepted accounting principles)
21
(Yen in millions) FY2013
(For the year ended March 31, 2013)
FY2014 (For the year ended
March 31, 2014) (Financial services) Cash flows from operating activities:
Net income 200,258 199,517Adjustments to reconcile net income to net cash
provided by operating activities
Depreciation 336,528 437,896Provision for doubtful accounts and credit losses 25,622 46,313Pension and severance costs, less payments 3,085 (1,188)Losses on disposal of fixed assets 216 732Unrealized losses on available-for-sale securities, net — 5,636Deferred income taxes 70,743 51,995Equity in earnings of affiliated companies (1,441) (1,764)Changes in operating assets and liabilities, and other 32,066 (269,875)
Net cash provided by operating activities 667,077 469,262
Cash flows from investing activities: Additions to finance receivables (16,877,678) (20,598,521)Collection of and proceeds from sales of finance receivables 15,784,681 19,612,456Additions to fixed assets excluding equipment leased to others (14,805) (13,789)Additions to equipment leased to others (990,521) (1,611,155)Proceeds from sales of fixed assets excluding equipment leased
to others 1,140 880
Proceeds from sales of equipment leased to others 464,870 708,344Purchases of marketable securities and security investments (431,602) (510,476)Proceeds from sales of and maturity of marketable securities and
security investments 383,525 505,954
Changes in investments and other assets, and other (77,848) (4,607)
Net cash used in investing activities (1,758,238) (1,910,914)
Cash flows from financing activities: Proceeds from issuance of long-term debt 3,089,484 3,780,228Payments of long-term debt (2,415,566) (2,831,116)Increase in short-term borrowings 388,416 465,731
Net cash provided by financing activities 1,062,334 1,414,843
Effect of exchange rate changes on cash and cash equivalents 65,151 45,231
Net increase in cash and cash equivalents 36,324 18,422
Cash and cash equivalents at beginning of year 574,564 610,888
Cash and cash equivalents at end of year 610,888 629,310
(Consolidated) Effect of exchange rate changes on cash and cash equivalents 137,851 93,606
Net increase in cash and cash equivalents 39,097 322,873
Cash and cash equivalents at beginning of year 1,679,200 1,718,297
Cash and cash equivalents at end of year 1,718,297 2,041,170
Note: In the Consolidated Statements of Cash Flows, cash and cash equivalents include cash on hand, bank deposits that can be withdrawn at any time and short-term investments that can be converted into cash at any time and carry minimal risk of change in value.
TOYOTA MOTOR CORPORATION FY2014 Financial Summary (Consolidated financial information has been prepared in accordance with U.S. generally accepted accounting principles)
22
(iii) Geographic Information FY2013 (As of and for the year ended March 31, 2013)
(Yen in millions)
Japan North America Europe Asia Other
Inter-segment Elimination
and/or Unallocated
Amount
Consolidated
Net revenues:
Sales to external customers 7,910,456 6,167,821 2,003,113 4,058,629 1,924,173 — 22,064,192
Inter-segment sales and transfers 4,910,562 116,604 80,000 326,847 170,092 (5,604,105) —
Total 12,821,018 6,284,425 2,083,113 4,385,476 2,094,265 (5,604,105) 22,064,192
Operating expenses 12,244,683 6,062,500 2,056,651 4,009,421 1,960,521 (5,590,472) 20,743,304
Operating income 576,335 221,925 26,462 376,055 133,744 (13,633) 1,320,888
Assets 12,296,731 11,841,471 2,199,256 3,305,319 2,616,164 3,224,376 35,483,317 FY2014 (As of and for the year ended March 31, 2014)
(Yen in millions)
Japan North America Europe Asia Other
Inter-segment Elimination
and/or Unallocated
Amount
Consolidated
Net revenues:
Sales to external customers 8,532,875 7,938,615 2,614,070 4,475,382 2,130,969 — 25,691,911
Inter-segment sales and transfers 5,764,595 178,484 110,889 402,290 205,672 (6,661,930) —
Total 14,297,470 8,117,099 2,724,959 4,877,672 2,336,641 (6,661,930) 25,691,911
Operating expenses 12,787,305 7,791,047 2,666,731 4,481,935 2,294,073 (6,621,292) 23,399,799
Operating income 1,510,165 326,052 58,228 395,737 42,568 (40,638) 2,292,112
Assets 13,231,184 13,720,958 2,576,806 4,013,429 2,731,695 5,163,401 41,437,473 Note: 1.Unallocated corporate assets included under “Inter-segment Elimination and/or Unallocated Amount” for FY2013 and FY2014 are 5,599,970
million yen and 7,659,617 million yen, respectively, and consist primarily of funds such as cash and cash equivalents, marketable securities and portion of security investments held by TMC.
2.“Other” consists of Central and South America, Oceania, Africa and the Middle East.
TOYOTA MOTOR CORPORATION FY2014 Financial Summary (Consolidated financial information has been prepared in accordance with U.S. generally accepted accounting principles)
23
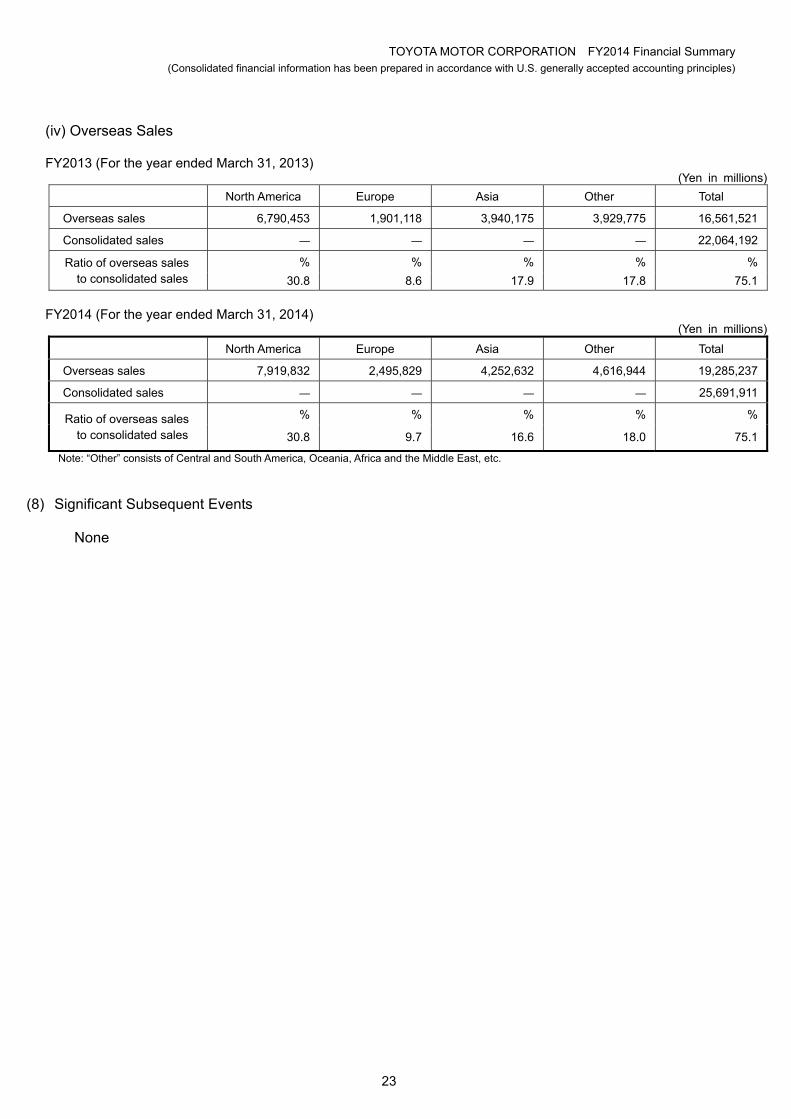
(iv) Overseas Sales
FY2013 (For the year ended March 31, 2013) (Yen in millions)
North America Europe Asia Other Total
Overseas sales 6,790,453 1,901,118 3,940,175 3,929,775 16,561,521
Consolidated sales — — — — 22,064,192
% % % % %Ratio of overseas sales to consolidated sales 30.8 8.6 17.9 17.8 75.1
FY2014 (For the year ended March 31, 2014)
(Yen in millions)
North America Europe Asia Other Total
Overseas sales 7,919,832 2,495,829 4,252,632 4,616,944 19,285,237
Consolidated sales — — — — 25,691,911
% % % % %Ratio of overseas sales to consolidated sales 30.8 9.7 16.6 18.0 75.1
Note: “Other” consists of Central and South America, Oceania, Africa and the Middle East, etc.
(8) Significant Subsequent Events
None
TOYOTA MOTOR CORPORATION FY2014 Financial Summary (Unconsolidated financial information has been prepared in accordance with Japan generally accepted accounting principles)
24
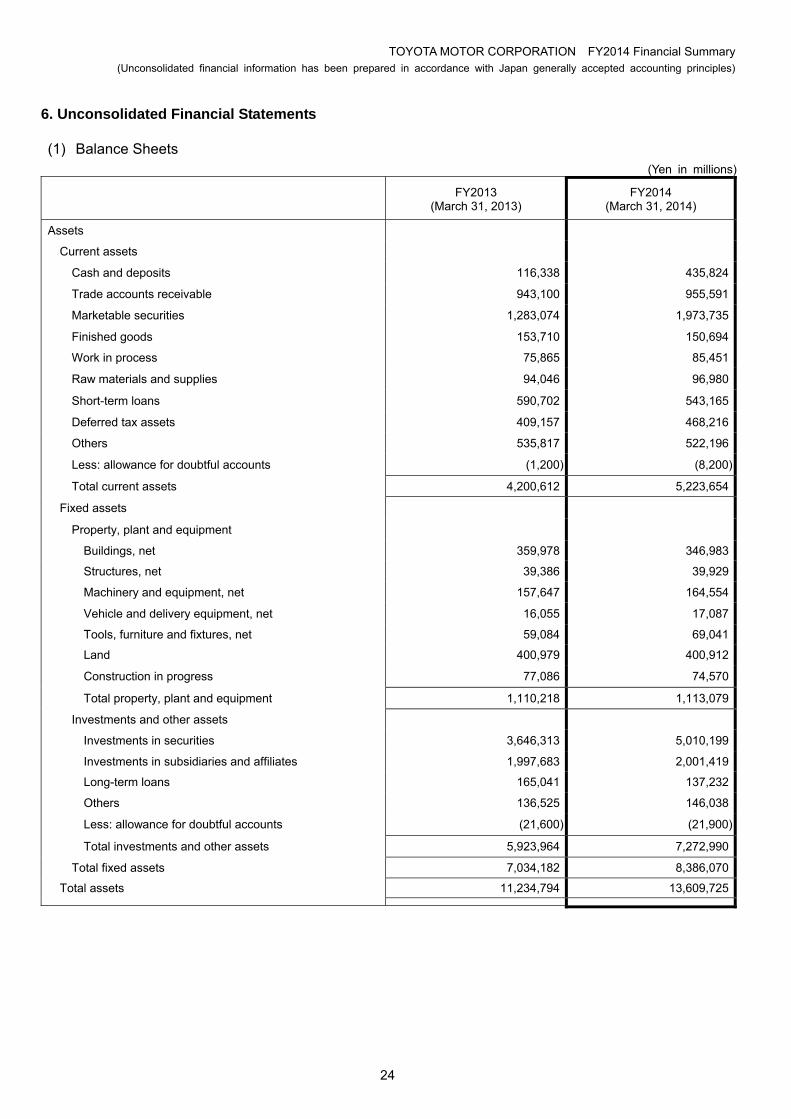
6. Unconsolidated Financial Statements (1) Balance Sheets (Yen in millions)
FY2013 (March 31, 2013)
FY2014 (March 31, 2014)
Assets
Current assets
Cash and deposits 116,338 435,824
Trade accounts receivable 943,100 955,591
Marketable securities 1,283,074 1,973,735
Finished goods 153,710 150,694
Work in process 75,865 85,451
Raw materials and supplies 94,046 96,980
Short-term loans 590,702 543,165
Deferred tax assets 409,157 468,216
Others 535,817 522,196
Less: allowance for doubtful accounts (1,200) (8,200)
Total current assets 4,200,612 5,223,654
Fixed assets
Property, plant and equipment
Buildings, net 359,978 346,983
Structures, net 39,386 39,929
Machinery and equipment, net 157,647 164,554
Vehicle and delivery equipment, net 16,055 17,087
Tools, furniture and fixtures, net 59,084 69,041
Land 400,979 400,912
Construction in progress 77,086 74,570
Total property, plant and equipment 1,110,218 1,113,079
Investments and other assets
Investments in securities 3,646,313 5,010,199
Investments in subsidiaries and affiliates 1,997,683 2,001,419
Long-term loans 165,041 137,232
Others 136,525 146,038
Less: allowance for doubtful accounts (21,600) (21,900)
Total investments and other assets 5,923,964 7,272,990
Total fixed assets 7,034,182 8,386,070
Total assets 11,234,794 13,609,725
TOYOTA MOTOR CORPORATION FY2014 Financial Summary (Unconsolidated financial information has been prepared in accordance with Japan generally accepted accounting principles)
25
(Yen in millions)
FY2013 (March 31, 2013)
FY2014 (March 31, 2014)
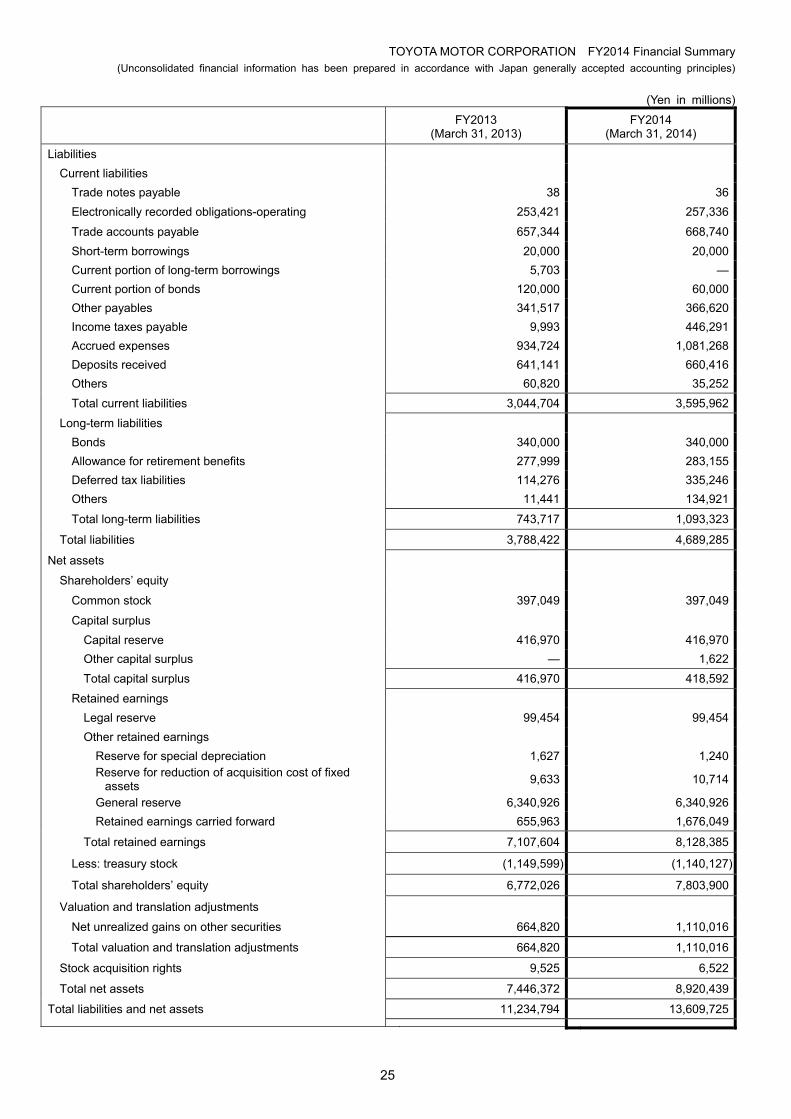
Liabilities
Current liabilities
Trade notes payable 38 36
Electronically recorded obligations-operating 253,421 257,336
Trade accounts payable 657,344 668,740
Short-term borrowings 20,000 20,000
Current portion of long-term borrowings 5,703 ―
Current portion of bonds 120,000 60,000
Other payables 341,517 366,620
Income taxes payable 9,993 446,291
Accrued expenses 934,724 1,081,268
Deposits received 641,141 660,416
Others 60,820 35,252
Total current liabilities 3,044,704 3,595,962
Long-term liabilities
Bonds 340,000 340,000
Allowance for retirement benefits 277,999 283,155
Deferred tax liabilities 114,276 335,246
Others 11,441 134,921
Total long-term liabilities 743,717 1,093,323
Total liabilities 3,788,422 4,689,285
Net assets
Shareholders’ equity
Common stock 397,049 397,049
Capital surplus
Capital reserve 416,970 416,970
Other capital surplus ― 1,622
Total capital surplus 416,970 418,592
Retained earnings
Legal reserve 99,454 99,454
Other retained earnings
Reserve for special depreciation 1,627 1,240
Reserve for reduction of acquisition cost of fixed
assets 9,633 10,714
General reserve 6,340,926 6,340,926
Retained earnings carried forward 655,963 1,676,049
Total retained earnings 7,107,604 8,128,385
Less: treasury stock (1,149,599) (1,140,127)
Total shareholders’ equity 6,772,026 7,803,900
Valuation and translation adjustments
Net unrealized gains on other securities 664,820 1,110,016
Total valuation and translation adjustments 664,820 1,110,016
Stock acquisition rights 9,525 6,522
Total net assets 7,446,372 8,920,439
Total liabilities and net assets 11,234,794 13,609,725
TOYOTA MOTOR CORPORATION FY2014 Financial Summary (Unconsolidated financial information has been prepared in accordance with Japan generally accepted accounting principles)
26
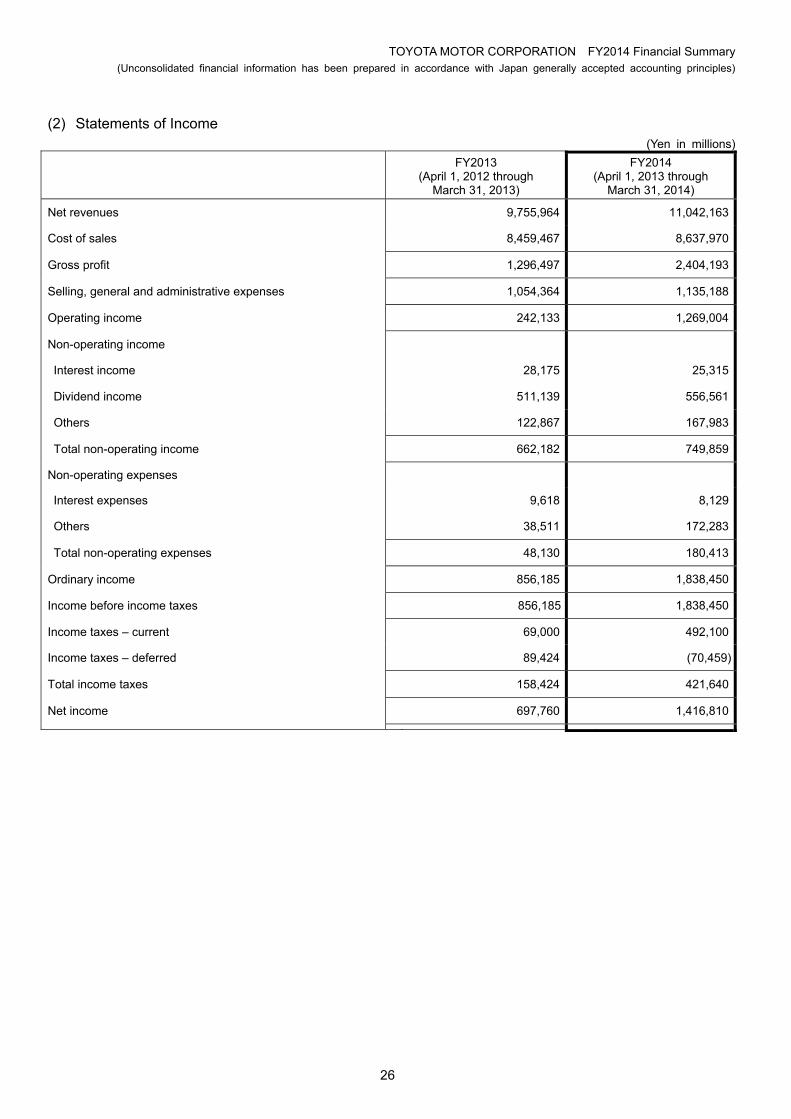
(2) Statements of Income
(Yen in millions)
FY2013 (April 1, 2012 through
March 31, 2013)
FY2014 (April 1, 2013 through
March 31, 2014)
Net revenues 9,755,964 11,042,163
Cost of sales 8,459,467 8,637,970
Gross profit 1,296,497 2,404,193
Selling, general and administrative expenses 1,054,364 1,135,188
Operating income 242,133 1,269,004
Non-operating income
Interest income 28,175 25,315
Dividend income 511,139 556,561
Others 122,867 167,983
Total non-operating income 662,182 749,859
Non-operating expenses
Interest expenses 9,618 8,129
Others 38,511 172,283
Total non-operating expenses 48,130 180,413
Ordinary income 856,185 1,838,450
Income before income taxes 856,185 1,838,450
Income taxes – current 69,000 492,100
Income taxes – deferred 89,424 (70,459)
Total income taxes 158,424 421,640
Net income 697,760 1,416,810
TOYOTA MOTOR CORPORATION FY2014 Financial Summary (Unconsolidated financial information has been prepared in accordance with Japan generally accepted accounting principles)
27
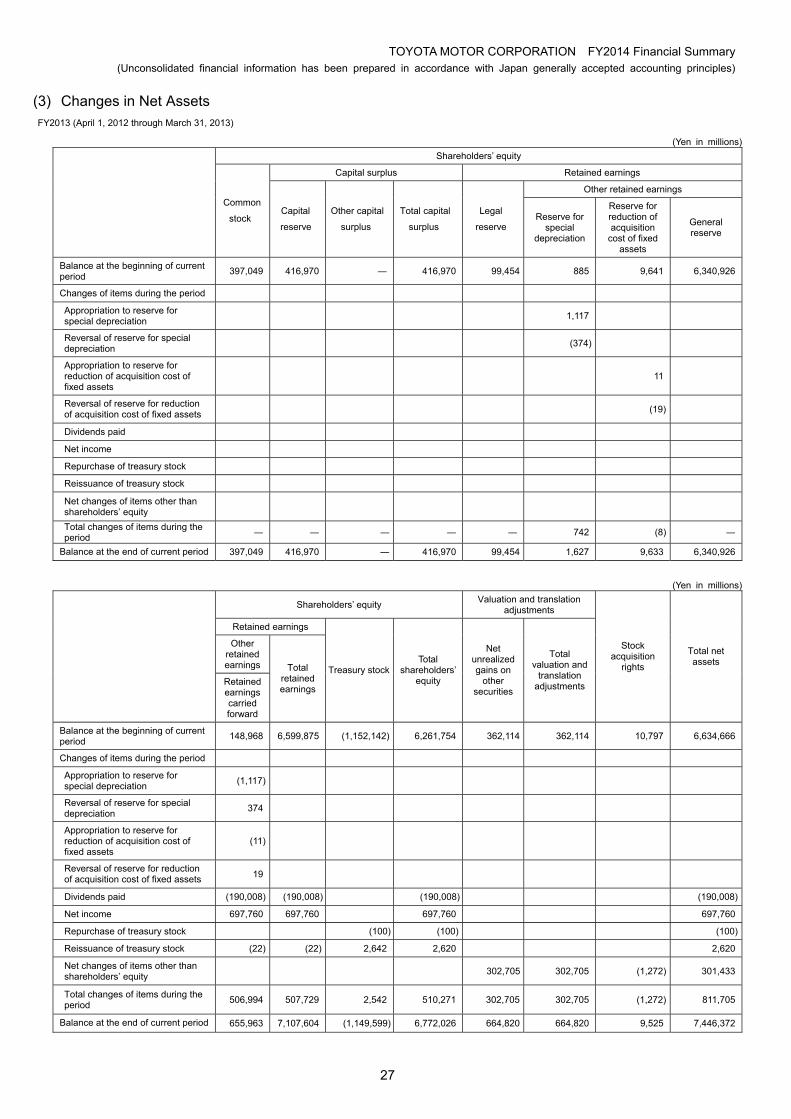
(3) Changes in Net Assets FY2013 (April 1, 2012 through March 31, 2013)
(Yen in millions)
Shareholders’ equity
Capital surplus Retained earnings
Other retained earnings
Common
stock Capital
reserve
Other capital
surplus
Total capital
surplus
Legal
reserve Reserve for
special depreciation
Reserve for reduction of acquisition
cost of fixed assets
General reserve
Balance at the beginning of current period
397,049 416,970 ― 416,970 99,454 885 9,641 6,340,926
Changes of items during the period
Appropriation to reserve for special depreciation
1,117
Reversal of reserve for special depreciation
(374)
Appropriation to reserve for reduction of acquisition cost of fixed assets
11
Reversal of reserve for reduction of acquisition cost of fixed assets (19)
Dividends paid
Net income
Repurchase of treasury stock
Reissuance of treasury stock
Net changes of items other than shareholders’ equity
Total changes of items during the period
― ― ― ― ― 742 (8) ―
Balance at the end of current period 397,049 416,970 ― 416,970 99,454 1,627 9,633 6,340,926
(Yen in millions)
Shareholders’ equity Valuation and translation
adjustments
Retained earnings
Other retained earnings
Retained earnings carried forward
Total retained earnings
Treasury stockTotal
shareholders’ equity
Net unrealized gains on
other securities
Total valuation and
translation adjustments
Stock acquisition
rights
Total net assets
Balance at the beginning of current period
148,968 6,599,875 (1,152,142) 6,261,754 362,114 362,114 10,797 6,634,666
Changes of items during the period
Appropriation to reserve for special depreciation
(1,117)
Reversal of reserve for special depreciation
374
Appropriation to reserve for reduction of acquisition cost of fixed assets
(11)
Reversal of reserve for reduction of acquisition cost of fixed assets 19
Dividends paid (190,008) (190,008) (190,008) (190,008)
Net income 697,760 697,760 697,760 697,760
Repurchase of treasury stock (100) (100) (100)
Reissuance of treasury stock (22) (22) 2,642 2,620 2,620
Net changes of items other than shareholders’ equity
302,705 302,705 (1,272) 301,433
Total changes of items during the period
506,994 507,729 2,542 510,271 302,705 302,705 (1,272) 811,705
Balance at the end of current period 655,963 7,107,604 (1,149,599) 6,772,026 664,820 664,820 9,525 7,446,372
TOYOTA MOTOR CORPORATION FY2014 Financial Summary (Unconsolidated financial information has been prepared in accordance with Japan generally accepted accounting principles)
28
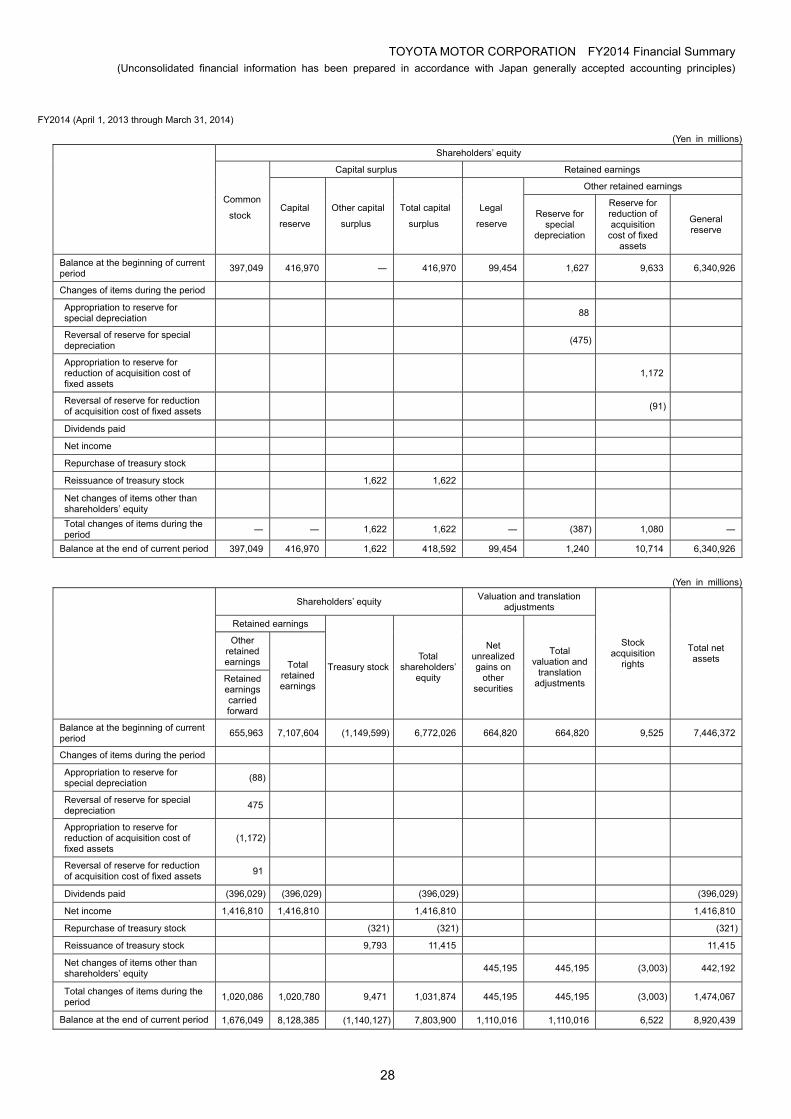
FY2014 (April 1, 2013 through March 31, 2014) (Yen in millions)
Shareholders’ equity
Capital surplus Retained earnings
Other retained earnings
Common
stock Capital
reserve
Other capital
surplus
Total capital
surplus
Legal
reserve Reserve for
special depreciation
Reserve for reduction of acquisition
cost of fixed assets
General reserve
Balance at the beginning of current period
397,049 416,970 ― 416,970 99,454 1,627 9,633 6,340,926
Changes of items during the period
Appropriation to reserve for special depreciation
88
Reversal of reserve for special depreciation
(475)
Appropriation to reserve for reduction of acquisition cost of fixed assets
1,172
Reversal of reserve for reduction of acquisition cost of fixed assets (91)
Dividends paid
Net income
Repurchase of treasury stock
Reissuance of treasury stock 1,622 1,622
Net changes of items other than shareholders’ equity
Total changes of items during the period
― ― 1,622 1,622 ― (387) 1,080 ―
Balance at the end of current period 397,049 416,970 1,622 418,592 99,454 1,240 10,714 6,340,926
(Yen in millions)
Shareholders’ equity Valuation and translation
adjustments
Retained earnings
Other retained earnings
Retained earnings carried forward
Total retained earnings
Treasury stockTotal
shareholders’ equity
Net unrealized gains on
other securities
Total valuation and
translation adjustments
Stock acquisition
rights
Total net assets
Balance at the beginning of current period
655,963 7,107,604 (1,149,599) 6,772,026 664,820 664,820 9,525 7,446,372
Changes of items during the period
Appropriation to reserve for special depreciation
(88)
Reversal of reserve for special depreciation
475
Appropriation to reserve for reduction of acquisition cost of fixed assets
(1,172)
Reversal of reserve for reduction of acquisition cost of fixed assets 91
Dividends paid (396,029) (396,029) (396,029) (396,029)
Net income 1,416,810 1,416,810 1,416,810 1,416,810
Repurchase of treasury stock (321) (321) (321)
Reissuance of treasury stock 9,793 11,415 11,415
Net changes of items other than shareholders’ equity
445,195 445,195 (3,003) 442,192
Total changes of items during the period
1,020,086 1,020,780 9,471 1,031,874 445,195 445,195 (3,003) 1,474,067
Balance at the end of current period 1,676,049 8,128,385 (1,140,127) 7,803,900 1,110,016 1,110,016 6,522 8,920,439
TOYOTA MOTOR CORPORATION FY2014 Financial Summary (Unconsolidated financial information has been prepared in accordance with Japan generally accepted accounting principles)
29
(4) Going Concern Assumption
None
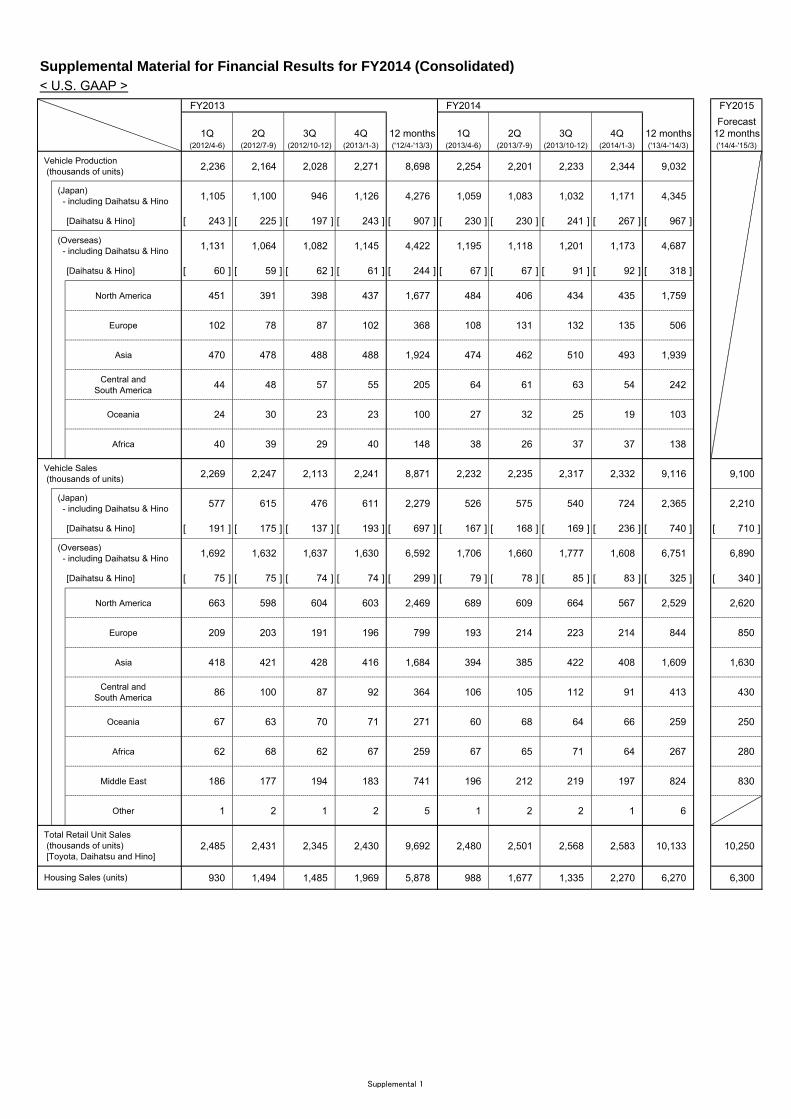
Supplemental Material for Financial Results for FY2014 (Consolidated)< U.S. GAAP >
FY2013 FY2014 FY2015
Forecast1Q 2Q 3Q 4Q 12 months 1Q 2Q 3Q 4Q 12 months 12 months
(2012/4-6) (2012/7-9) (2012/10-12) (2013/1-3) ('12/4-'13/3) (2013/4-6) (2013/7-9) (2013/10-12) (2014/1-3) ('13/4-'14/3) ('14/4-'15/3)
2,236 2,164 2,028 2,271 8,698 2,254 2,201 2,233 2,344 9,032
1,105 1,100 946 1,126 4,276 1,059 1,083 1,032 1,171 4,345
[Daihatsu & Hino] [ 243 ] [ 225 ] [ 197 ] [ 243 ] [ 907 ] [ 230 ] [ 230 ] [ 241 ] [ 267 ] [ 967 ]
1,131 1,064 1,082 1,145 4,422 1,195 1,118 1,201 1,173 4,687
[Daihatsu & Hino] [ 60 ] [ 59 ] [ 62 ] [ 61 ] [ 244 ] [ 67 ] [ 67 ] [ 91 ] [ 92 ] [ 318 ]
North America 451 391 398 437 1,677 484 406 434 435 1,759
Europe 102 78 87 102 368 108 131 132 135 506
Asia 470 478 488 488 1,924 474 462 510 493 1,939
Central andSouth America
44 48 57 55 205 64 61 63 54 242
Oceania 24 30 23 23 100 27 32 25 19 103
Africa 40 39 29 40 148 38 26 37 37 138
2,269 2,247 2,113 2,241 8,871 2,232 2,235 2,317 2,332 9,116 9,100
577 615 476 611 2,279 526 575 540 724 2,365 2,210
[Daihatsu & Hino] [ 191 ] [ 175 ] [ 137 ] [ 193 ] [ 697 ] [ 167 ] [ 168 ] [ 169 ] [ 236 ] [ 740 ] [ 710 ]
1,692 1,632 1,637 1,630 6,592 1,706 1,660 1,777 1,608 6,751 6,890
[Daihatsu & Hino] [ 75 ] [ 75 ] [ 74 ] [ 74 ] [ 299 ] [ 79 ] [ 78 ] [ 85 ] [ 83 ] [ 325 ] [ 340 ]
North America 663 598 604 603 2,469 689 609 664 567 2,529 2,620
Europe 209 203 191 196 799 193 214 223 214 844 850
Asia 418 421 428 416 1,684 394 385 422 408 1,609 1,630
Central andSouth America
86 100 87 92 364 106 105 112 91 413 430
Oceania 67 63 70 71 271 60 68 64 66 259 250
Africa 62 68 62 67 259 67 65 71 64 267 280
Middle East 186 177 194 183 741 196 212 219 197 824 830
Other 1 2 1 2 5 1 2 2 1 6
2,485 2,431 2,345 2,430 9,692 2,480 2,501 2,568 2,583 10,133 10,250
930 1,494 1,485 1,969 5,878 988 1,677 1,335 2,270 6,270 6,300
Vehicle Production (thousands of units)
(Japan) - including Daihatsu & Hino
(Overseas) - including Daihatsu & Hino
(Japan) - including Daihatsu & Hino
(Overseas) - including Daihatsu & Hino
Vehicle Sales (thousands of units)
Total Retail Unit Sales (thousands of units) [Toyota, Daihatsu and Hino]
Housing Sales (units)
Supplemental 1
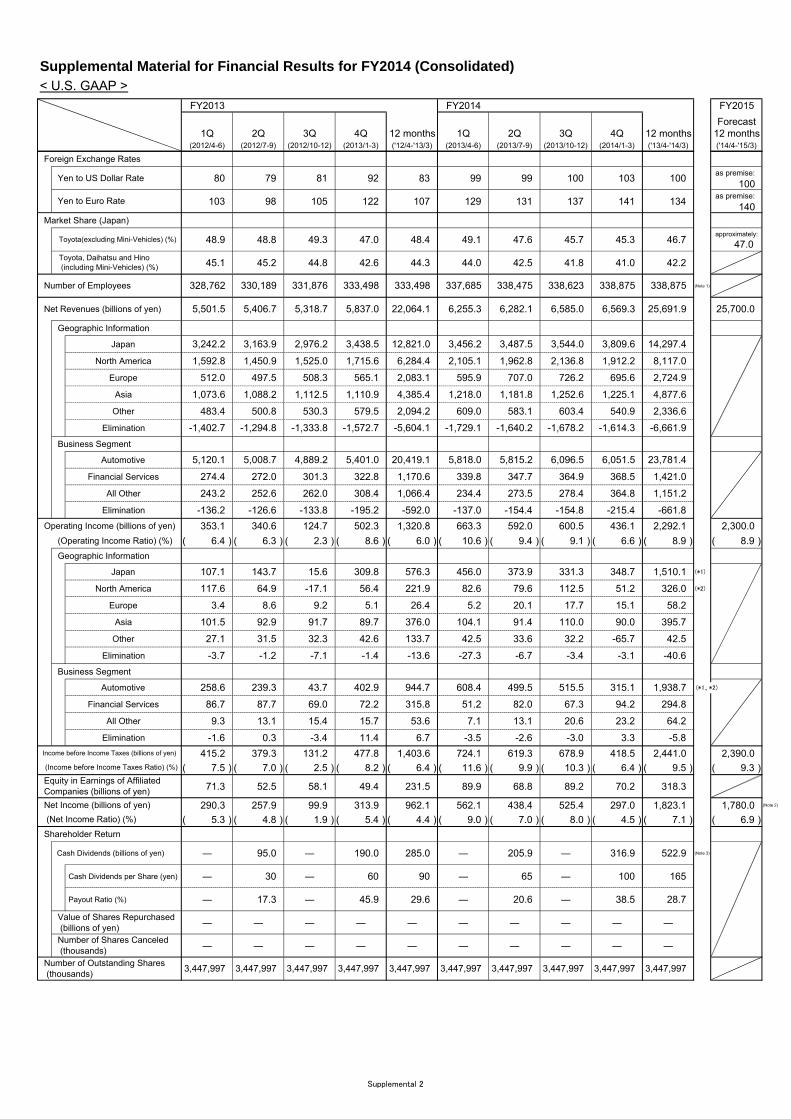
Supplemental Material for Financial Results for FY2014 (Consolidated)< U.S. GAAP >
FY2013 FY2014 FY2015
Forecast1Q 2Q 3Q 4Q 12 months 1Q 2Q 3Q 4Q 12 months 12 months
(2012/4-6) (2012/7-9) (2012/10-12) (2013/1-3) ('12/4-'13/3) (2013/4-6) (2013/7-9) (2013/10-12) (2014/1-3) ('13/4-'14/3) ('14/4-'15/3)
80 79 81 92 83 99 99 100 103 100
103 98 105 122 107 129 131 137 141 134
48.9 48.8 49.3 47.0 48.4 49.1 47.6 45.7 45.3 46.7
45.1 45.2 44.8 42.6 44.3 44.0 42.5 41.8 41.0 42.2
(Note 1)
Japan
North America 1,592.8 1,450.9 1,525.0 1,715.6 6,284.4 2,105.1 1,962.8 2,136.8 1,912.2 8,117.0
Europe 512.0 497.5 508.3 565.1 2,083.1 595.9 707.0 726.2 695.6 2,724.9
Asia 1,073.6 1,088.2 1,112.5 1,110.9 4,385.4 1,218.0 1,181.8 1,252.6 1,225.1 4,877.6
Other 483.4 500.8 530.3 579.5 2,094.2 609.0 583.1 603.4 540.9 2,336.6
Elimination
Business Segment
Automotive
Financial Services 274.4 272.0 301.3 322.8 1,170.6 339.8 347.7 364.9 368.5 1,421.0
All Other 243.2 252.6 262.0 308.4 1,066.4 234.4 273.5 278.4 364.8 1,151.2
Elimination -136.2 -126.6 -133.8 -195.2 -592.0 -137.0 -154.4 -154.8 -215.4 -661.8
353.1 340.6 124.7 502.3 1,320.8 663.3 592.0 600.5 436.1 2,292.1 2,300.0
( 6.4 ) ( 6.3 ) ( 2.3 ) ( 8.6 ) ( 6.0 ) ( 10.6 ) ( 9.4 ) ( 9.1 ) ( 6.6 ) ( 8.9 ) ( 8.9 )
Geographic Information
Japan 107.1 143.7 15.6 309.8 576.3 456.0 373.9 331.3 348.7 1,510.1 (*1)
North America 117.6 64.9 -17.1 56.4 221.9 82.6 79.6 112.5 51.2 326.0 (*2)
Europe 3.4 8.6 9.2 5.1 26.4 5.2 20.1 17.7 15.1 58.2
Asia 101.5 92.9 91.7 89.7 376.0 104.1 91.4 110.0 90.0 395.7
Other 27.1 31.5 32.3 42.6 133.7 42.5 33.6 32.2 -65.7 42.5
Elimination -3.7 -1.2 -7.1 -1.4 -13.6 -27.3 -6.7 -3.4 -3.1 -40.6
Business Segment
Automotive 258.6 239.3 43.7 402.9 944.7 608.4 499.5 515.5 315.1 1,938.7
Financial Services 86.7 87.7 69.0 72.2 315.8 51.2 82.0 67.3 94.2 294.8
All Other 9.3 13.1 15.4 15.7 53.6 7.1 13.1 20.6 23.2 64.2
Elimination -1.6 0.3 -3.4 11.4 6.7 -3.5 -2.6 -3.0 3.3 -5.8
415.2 379.3 131.2 477.8 1,403.6 724.1 619.3 678.9 418.5 2,441.0 2,390.0
( 7.5 ) ( 7.0 ) ( 2.5 ) ( 8.2 ) ( 6.4 ) ( 11.6 ) ( 9.9 ) ( 10.3 ) ( 6.4 ) ( 9.5 ) ( 9.3 )
71.3 52.5 58.1 49.4 231.5 89.9 68.8 89.2 70.2 318.3
290.3 257.9 99.9 313.9 962.1 562.1 438.4 525.4 297.0 1,823.1 1,780.0 (Note 2)
( 5.3 ) ( 4.8 ) ( 1.9 ) ( 5.4 ) ( 4.4 ) ( 9.0 ) ( 7.0 ) ( 8.0 ) ( 4.5 ) ( 7.1 ) ( 6.9 )
― 95.0 ― 190.0 285.0 ― 205.9 ― 316.9 522.9 (Note 3)
Cash Dividends per Share (yen) ― 30 ― 60 90 ― 65 ― 100 165
Payout Ratio (%) ― 17.3 ― 45.9 29.6 ― 20.6 ― 38.5 28.7
― ― ― ― ― ― ― ― ― ―
― ― ― ― ― ― ― ― ― ―
5,815.2
3,447,997
338,475
6,282.1
3,487.5
-1,640.2
3,447,997 3,447,997
3,809.6 14,297.4
-1,614.3 -6,661.9
338,875 338,875
6,569.3 25,691.9
-1,333.8
(Operating Income Ratio) (%)
Operating Income (billions of yen)
5,120.1
-1,402.7
Number of Shares Canceled (thousands)
Toyota, Daihatsu and Hino (including Mini-Vehicles) (%)
328,762
5,501.5
3,447,997
Equity in Earnings of Affiliated Companies (billions of yen)
Value of Shares Repurchased (billions of yen)
3,242.2
Number of Outstanding Shares (thousands)
331,876
approximately:
47.0
Foreign Exchange Rates
Market Share (Japan)
Yen to US Dollar Rate
Yen to Euro Rate
Toyota(excluding Mini-Vehicles) (%)
as premise:
140
as premise:
100
Geographic Information
Net Revenues (billions of yen)
Number of Employees
25,700.022,064.1
330,189
3,163.9
5,318.7 6,255.3
3,456.23,438.5 12,821.0
5,837.0
2,976.2
5,406.7
5,008.7 5,401.0 20,419.1 5,818.04,889.2 6,051.5 23,781.4
Income before Income Taxes (billions of yen)
(Income before Income Taxes Ratio) (%)
Net Income (billions of yen)
(Net Income Ratio) (%)
Shareholder Return
Cash Dividends (billions of yen)
-5,604.1 -1,729.1
3,447,9973,447,9973,447,997 3,447,997
333,498 333,498 337,685
-1,294.8
3,447,997
-1,572.7
338,623
6,585.0
3,544.0
-1,678.2
6,096.5
3,447,997
(*1、*2)
Supplemental 2
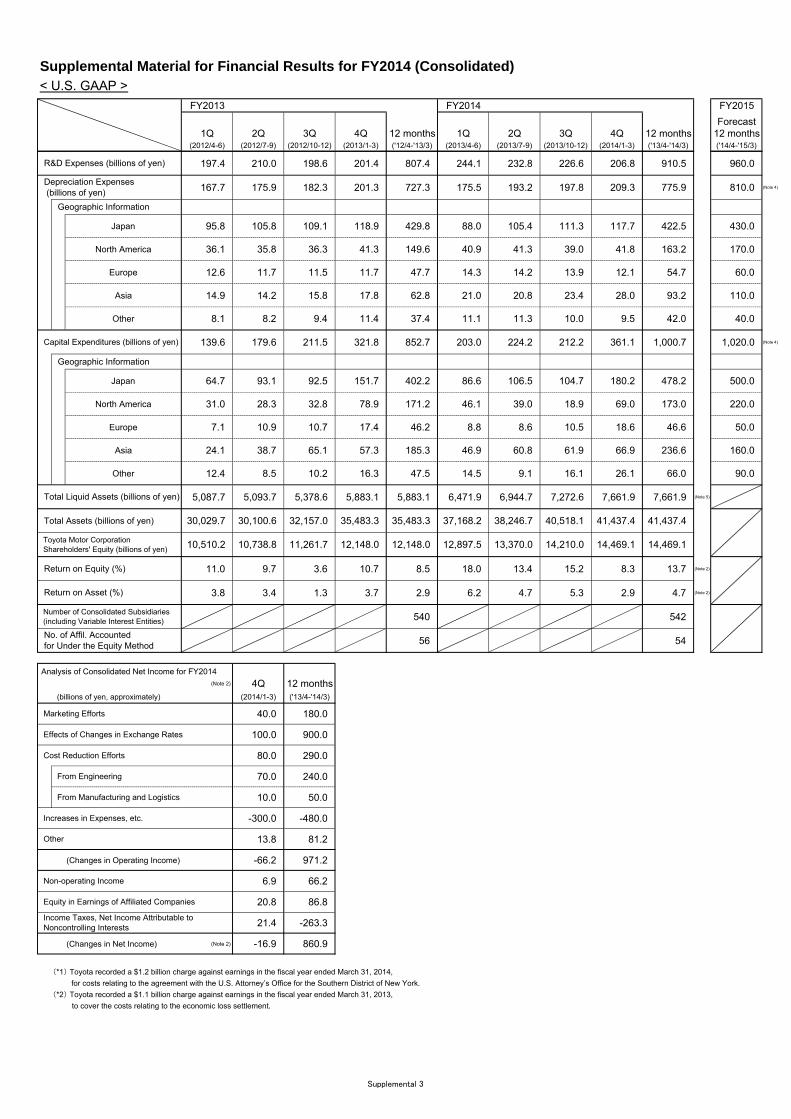
Supplemental Material for Financial Results for FY2014 (Consolidated)< U.S. GAAP >
FY2013 FY2014 FY2015
Forecast1Q 2Q 3Q 4Q 12 months 1Q 2Q 3Q 4Q 12 months 12 months
(2012/4-6) (2012/7-9) (2012/10-12) (2013/1-3) ('12/4-'13/3) (2013/4-6) (2013/7-9) (2013/10-12) (2014/1-3) ('13/4-'14/3) ('14/4-'15/3)
197.4 210.0 198.6 201.4 807.4 244.1 232.8 226.6 206.8 910.5 960.0
167.7 175.9 182.3 201.3 727.3 175.5 193.2 197.8 209.3 775.9 810.0 (Note 4)
Japan 95.8 105.8 109.1 118.9 429.8 88.0 105.4 111.3 117.7 422.5 430.0
North America 36.1 35.8 36.3 41.3 149.6 40.9 41.3 39.0 41.8 163.2 170.0
Europe 12.6 11.7 11.5 11.7 47.7 14.3 14.2 13.9 12.1 54.7 60.0
Asia 14.9 14.2 15.8 17.8 62.8 21.0 20.8 23.4 28.0 93.2 110.0
Other 8.1 8.2 9.4 11.4 37.4 11.1 11.3 10.0 9.5 42.0 40.0
139.6 179.6 211.5 321.8 852.7 203.0 224.2 212.2 361.1 1,000.7 1,020.0 (Note 4)
Japan 64.7 93.1 92.5 151.7 402.2 86.6 106.5 104.7 180.2 478.2 500.0
North America 31.0 28.3 32.8 78.9 171.2 46.1 39.0 18.9 69.0 173.0 220.0
Europe 7.1 10.9 10.7 17.4 46.2 8.8 8.6 10.5 18.6 46.6 50.0
Asia 24.1 38.7 65.1 57.3 185.3 46.9 60.8 61.9 66.9 236.6 160.0
Other 12.4 8.5 10.2 16.3 47.5 14.5 9.1 16.1 26.1 66.0 90.0
5,087.7 5,093.7 5,378.6 5,883.1 5,883.1 6,471.9 6,944.7 7,272.6 7,661.9 7,661.9 (Note 5)
11.0 9.7 3.6 10.7 8.5 18.0 13.4 15.2 8.3 13.7 (Note 2)
3.8 3.4 1.3 3.7 2.9 6.2 4.7 5.3 2.9 4.7 (Note 2)
540 542
56 54
(Note 2) 4Q 12 months (billions of yen, approximately) (2014/1-3) ('13/4-'14/3)
40.0 180.0
100.0 900.0
80.0 290.0
70.0 240.0
10.0 50.0
-300.0 -480.0
13.8 81.2
(Changes in Operating Income) -66.2 971.2
6.9 66.2
20.8 86.8
21.4 -263.3
(Changes in Net Income) (Note 2) -16.9 860.9
(*1) Toyota recorded a $1.2 billion charge against earnings in the fiscal year ended March 31, 2014,
for costs relating to the agreement with the U.S. Attorney’s Office for the Southern District of New York.
(*2) Toyota recorded a $1.1 billion charge against earnings in the fiscal year ended March 31, 2013,
to cover the costs relating to the economic loss settlement.
38,246.7
13,370.0 14,469.1 14,469.1
41,437.4 41,437.4
Marketing Efforts
Income Taxes, Net Income Attributable to Noncontrolling Interests
Cost Reduction Efforts
From Engineering
From Manufacturing and Logistics
Increases in Expenses, etc.
Other
Non-operating Income
Equity in Earnings of Affiliated Companies
Effects of Changes in Exchange Rates
Return on Equity (%)
Capital Expenditures (billions of yen)
Return on Asset (%)
Toyota Motor Corporation Shareholders' Equity (billions of yen)
Total Assets (billions of yen) 35,483.330,029.7
12,148.0
30,100.6 35,483.3
No. of Affil. Accounted for Under the Equity Method
Number of Consolidated Subsidiaries (including Variable Interest Entities)
Geographic Information
Total Liquid Assets (billions of yen)
R&D Expenses (billions of yen)
Depreciation Expenses (billions of yen)
Geographic Information
Analysis of Consolidated Net Income for FY2014
12,148.0
32,157.0
11,261.710,510.2 10,738.8 12,897.5
37,168.2 40,518.1
14,210.0
Supplemental 3
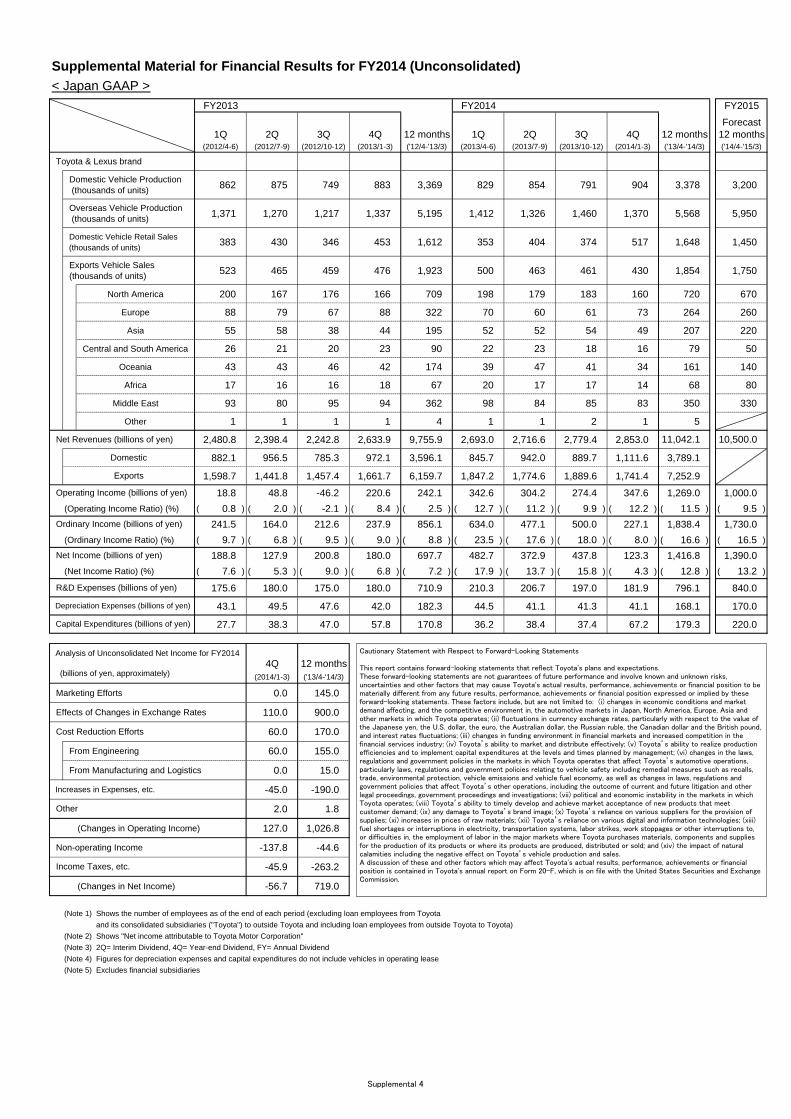
Supplemental Material for Financial Results for FY2014 (Unconsolidated)
< Japan GAAP >
FY2013 FY2014 FY2015
Forecast1Q 2Q 3Q 4Q 12 months 1Q 2Q 3Q 4Q 12 months 12 months
(2012/4-6) (2012/7-9) (2012/10-12) (2013/1-3) ('12/4-'13/3) (2013/4-6) (2013/7-9) (2013/10-12) (2014/1-3) ('13/4-'14/3) ('14/4-'15/3)
862 875 749 883 3,369 829 854 791 904 3,378 3,200
1,371 1,270 1,217 1,337 5,195 1,412 1,326 1,460 1,370 5,568 5,950
383 430 346 453 1,612 353 404 374 517 1,648 1,450
523 465 459 476 1,923 500 463 461 430 1,854 1,750
North America 200 167 176 166 709 198 179 183 160 720 670
Europe 88 79 67 88 322 70 60 61 73 264 260
Asia 55 58 38 44 195 52 52 54 49 207 220
Central and South America 26 21 20 23 90 22 23 18 16 79 50
Oceania 43 43 46 42 174 39 47 41 34 161 140
Africa 17 16 16 18 67 20 17 17 14 68 80
Middle East 93 80 95 94 362 98 84 85 83 350 330
Other 1 1 1 1 4 1 1 2 1 5
2,480.8 2,398.4 2,242.8 2,633.9 9,755.9 2,693.0 2,716.6 2,779.4 2,853.0
882.1 956.5 785.3 972.1 3,596.1 845.7 942.0 889.7 1,111.6 3,789.1
1,598.7 1,441.8 1,457.4 1,661.7 6,159.7 1,847.2 1,774.6 1,889.6 1,741.4 7,252.9
18.8 48.8 -46.2 220.6 242.1 342.6 304.2 274.4 347.6 1,269.0 1,000.0
(Operating Income Ratio) (%) ( 0.8 ) ( 2.0 ) ( -2.1 ) ( 8.4 ) ( 2.5 ) ( 12.7 ) ( 11.2 ) ( 9.9 ) ( 12.2 ) ( 11.5 ) ( 9.5 )
241.5 164.0 212.6 237.9 856.1 634.0 477.1 500.0 227.1 1,838.4 1,730.0
(Ordinary Income Ratio) (%) ( 9.7 ) ( 6.8 ) ( 9.5 ) ( 9.0 ) ( 8.8 ) ( 23.5 ) ( 17.6 ) ( 18.0 ) ( 8.0 ) ( 16.6 ) ( 16.5 )
188.8 127.9 200.8 180.0 697.7 482.7 372.9 437.8 123.3 1,416.8 1,390.0
(Net Income Ratio) (%) ( 7.6 ) ( 5.3 ) ( 9.0 ) ( 6.8 ) ( 7.2 ) ( 17.9 ) ( 13.7 ) ( 15.8 ) ( 4.3 ) ( 12.8 ) ( 13.2 )
175.6 180.0 175.0 180.0 710.9 210.3 206.7 197.0 181.9 796.1 840.0
43.1 49.5 47.6 42.0 182.3 44.5 41.1 41.3 41.1 168.1 170.0
27.7 38.3 47.0 57.8 170.8 36.2 38.4 37.4 67.2 179.3 220.0
4Q 12 months(2014/1-3) ('13/4-'14/3)
0.0 145.0
110.0 900.0
60.0 170.0
60.0 155.0
0.0 15.0
-45.0 -190.0
2.0 1.8
(Changes in Operating Income) 127.0 1,026.8
-137.8 -44.6
-45.9 -263.2
(Changes in Net Income) -56.7 719.0
(Note 1) Shows the number of employees as of the end of each period (excluding loan employees from Toyota
and its consolidated subsidiaries ("Toyota") to outside Toyota and including loan employees from outside Toyota to Toyota)
(Note 2) Shows "Net income attributable to Toyota Motor Corporation"
(Note 3) 2Q= Interim Dividend, 4Q= Year-end Dividend, FY= Annual Dividend
(Note 4) Figures for depreciation expenses and capital expenditures do not include vehicles in operating lease
(Note 5) Excludes financial subsidiaries
Analysis of Unconsolidated Net Income for FY2014
(billions of yen, approximately)
R&D Expenses (billions of yen)
Marketing Efforts
Income Taxes, etc.
From Engineering
From Manufacturing and Logistics
Increases in Expenses, etc.
Other
Effects of Changes in Exchange Rates
Cost Reduction Efforts
Non-operating Income
Domestic
Net Revenues (billions of yen)
Depreciation Expenses (billions of yen)
Capital Expenditures (billions of yen)
Exports
Operating Income (billions of yen)
Ordinary Income (billions of yen)
Net Income (billions of yen)
10,500.0
Toyota & Lexus brand
Domestic Vehicle Retail Sales (thousands of units)
Exports Vehicle Sales (thousands of units)
Domestic Vehicle Production (thousands of units)
Overseas Vehicle Production (thousands of units)
11,042.1
Cautionary Statement with Respect to Forward-Looking Statements
This report contains forward-looking statements that reflect Toyota's plans and expectations.These forward-looking statements are not guarantees of future performance and involve known and unknown risks,uncertainties and other factors that may cause Toyota's actual results, performance, achievements or financial position to bematerially different from any future results, performance, achievements or financial position expressed or implied by theseforward-looking statements. These factors include, but are not limited to: (i) changes in economic conditions and marketdemand affecting, and the competitive environment in, the automotive markets in Japan, North America, Europe, Asia andother markets in which Toyota operates; (ii) fluctuations in currency exchange rates, particularly with respect to the value ofthe Japanese yen, the U.S. dollar, the euro, the Australian dollar, the Russian ruble, the Canadian dollar and the British pound,and interest rates fluctuations; (iii) changes in funding environment in financial markets and increased competition in thefinancial services industry; (iv) Toyota’s ability to market and distribute effectively; (v) Toyota’s ability to realize productionefficiencies and to implement capital expenditures at the levels and times planned by management; (vi) changes in the laws,regulations and government policies in the markets in which Toyota operates that affect Toyota’s automotive operations,particularly laws, regulations and government policies relating to vehicle safety including remedial measures such as recalls,trade, environmental protection, vehicle emissions and vehicle fuel economy, as well as changes in laws, regulations andgovernment policies that affect Toyota’s other operations, including the outcome of current and future litigation and otherlegal proceedings, government proceedings and investigations; (vii) political and economic instability in the markets in whichToyota operates; (viii) Toyota’s ability to timely develop and achieve market acceptance of new products that meetcustomer demand; (ix) any damage to Toyota’s brand image; (x) Toyota’s reliance on various suppliers for the provision ofsupplies; (xi) increases in prices of raw materials; (xii) Toyota’s reliance on various digital and information technologies; (xiii)fuel shortages or interruptions in electricity, transportation systems, labor strikes, work stoppages or other interruptions to,or difficulties in, the employment of labor in the major markets where Toyota purchases materials, components and suppliesfor the production of its products or where its products are produced, distributed or sold; and (xiv) the impact of naturalcalamities including the negative effect on Toyota’s vehicle production and sales.A discussion of these and other factors which may affect Toyota's actual results, performance, achievements or financialposition is contained in Toyota's annual report on Form 20-F, which is on file with the United States Securities and ExchangeCommission.
Supplemental 4