Embed Size (px)
Citation preview

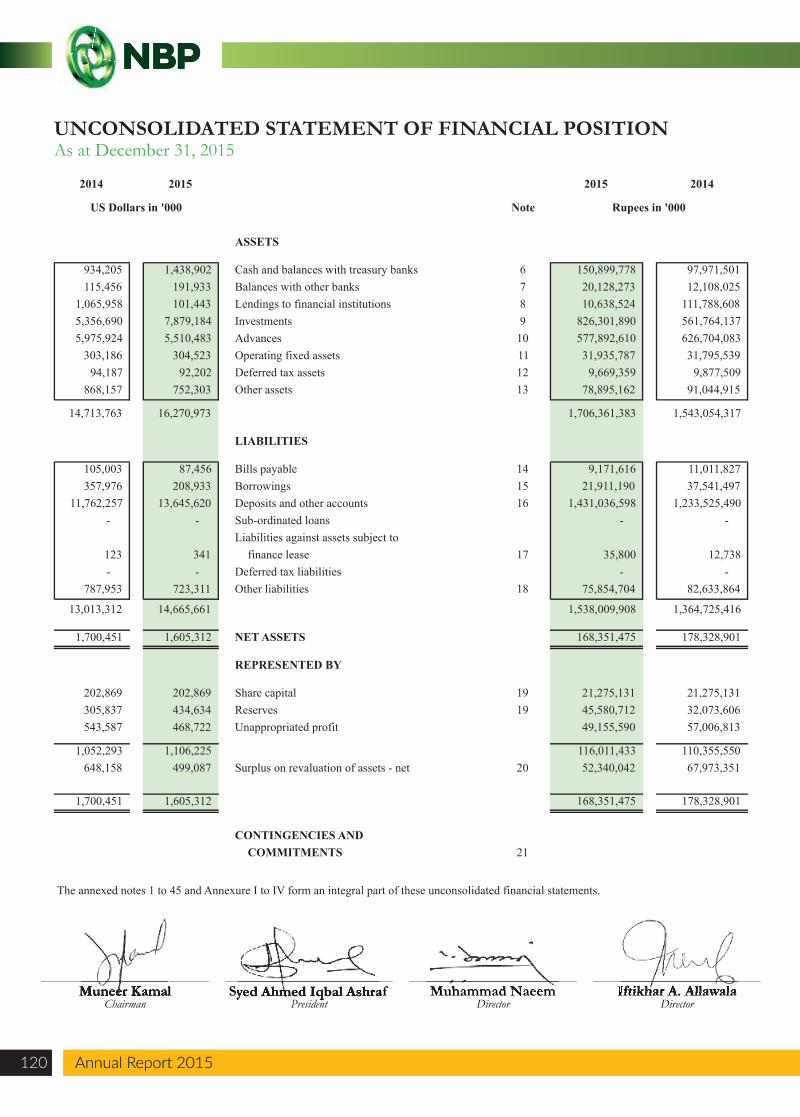
UNCONSOLIDATED STATEMENT OF FINANCIAL POSITIONAs at December 31, 2015
Annual Report 2015120 Annual Report 2015
Note
ASSETS
Cash and balances with treasury banks 6Balances with other banks 7Lendings to financial institutions 8Investments 9Advances 10Operating fixed assets 11Deferred tax assets 12Other assets 13
LIABILITIES
Bills payable 14Borrowings 15Deposits and other accounts 16Sub-ordinated loansLiabilities against assets subject to
finance lease 17Deferred tax liabilitiesOther liabilities 18
NET ASSETS
REPRESENTED BY
Share capital 19Reserves 19Unappropriated profit
Surplus on revaluation of assets - net 20
CONTINGENCIES ANDCOMMITMENTS 21
The annexed notes 1 to 45 and Annexure I to IV form an integral part of these unconsolidated financial statements.
934,205 1,438,902 115,456 191,933
1,065,958 101,443 5,356,690 7,879,184 5,975,924 5,510,483
303,186 304,523 94,187 92,202
868,157 752,303
14,713,763 16,270,973
105,003 87,456 357,976 208,933
11,762,257 13,645,620 - -
123 341 - -
787,953 723,311
13,013,312 14,665,661
1,700,451 1,605,312
202,869 202,869 305,837 434,634 543,587 468,722
1,052,293 1,106,225 648,158 499,087
1,700,451 1,605,312
150,899,778 97,971,501 20,128,273 12,108,025 10,638,524 111,788,608
826,301,890 561,764,137 577,892,610 626,704,083 31,935,787 31,795,539
9,669,359 9,877,509 78,895,162 91,044,915
1,706,361,383 1,543,054,317
9,171,616 11,011,827 21,911,190 37,541,497
1,431,036,598 1,233,525,490 - -
35,800 12,738 - -
75,854,704 82,633,864
1,538,009,908 1,364,725,416
168,351,475 178,328,901
21,275,131 21,275,131 45,580,712 32,073,606 49,155,590 57,006,813
116,011,433 110,355,550 52,340,042 67,973,351
168,351,475 178,328,901
US Dollars in '000 Rupees in '000
2014 2015 2015 2014
Muneer KamalChairman
Syed Ahmed Iqbal AshrafPresident
Muhammad NaeemDirector
Iftikhar A. AllawalaDirector
Iftikhar A. AllawalaMuhammad NaeemSyed Ahmed Iqbal AshrafMuneer Kamal
Annual Report 2015 121
National Bank of Pakistan
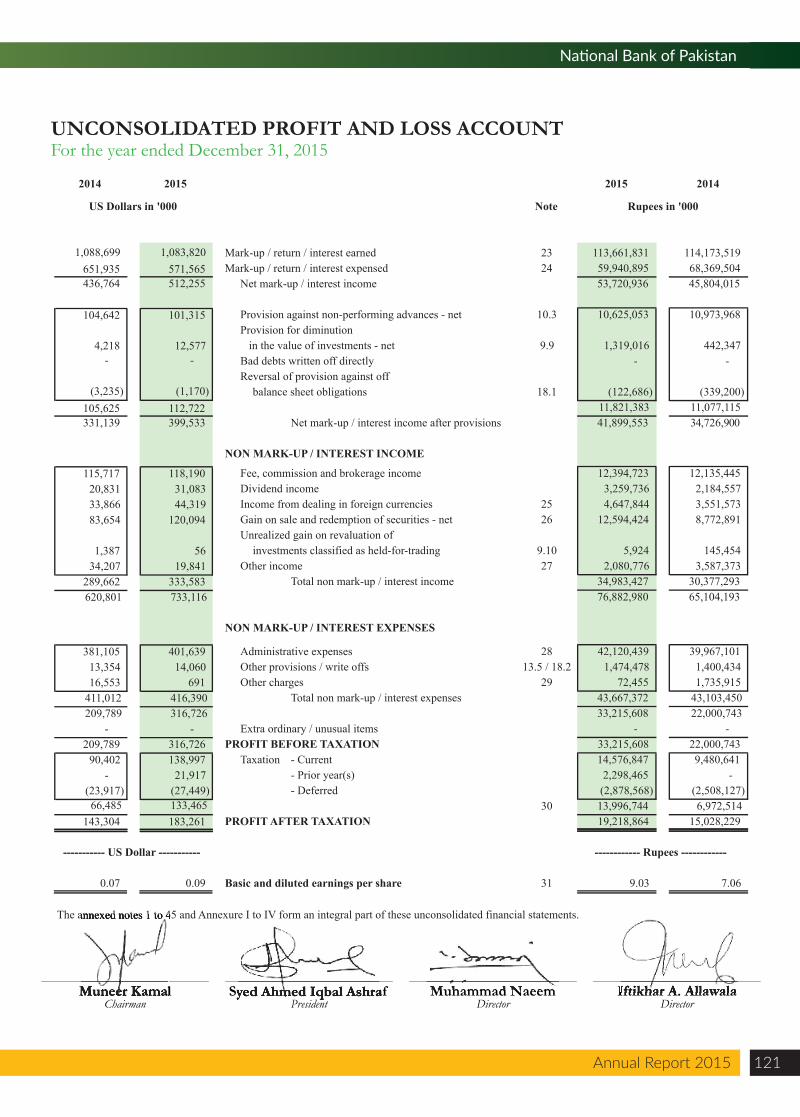
UNCONSOLIDATED PROFIT AND LOSS ACCOUNTFor the year ended December 31, 2015
US Dollars in '000 Note Rupees in '000
Mark-up / return / interest earned 23 113,661,831 114,173,519 Mark-up / return / interest expensed 24 59,940,895 68,369,504
Net mark-up / interest income 53,720,936 45,804,015
Provision against non-performing advances - net 10.3 10,625,053 10,973,968 Provision for diminution in the value of investments - net 9.9 1,319,016 442,347 Bad debts written off directly - - Reversal of provision against off
balance sheet obligations 18.1 (122,686) (339,200) 11,821,383 11,077,115
34,726,900
Net mark-up / interest income after provisions 41,899,553
NON MARK-UP / INTEREST INCOME
Fee, commission and brokerage income 12,394,723 12,135,445 Dividend income 3,259,736 2,184,557 Income from dealing in foreign currencies 25 4,647,844 3,551,573 Gain on sale and redemption of securities - net 26 12,594,424 8,772,891 Unrealized gain on revaluation of
investments classified as held-for-trading 9.10 5,924 145,454 Other income 27 2,080,776 3,587,373
Total non mark-up / interest income 34,983,427 30,377,293 76,882,980 65,104,193
NON MARK-UP / INTEREST EXPENSES
Administrative expenses 28 42,120,439 39,967,101 Other provisions / write offs 13.5 / 18.2 1,474,478 1,400,434 Other charges 29 72,455 1,735,915
Total non mark-up / interest expenses 43,667,372 43,103,450 33,215,608 22,000,743
Extra ordinary / unusual items - - PROFIT BEFORE TAXATION 33,215,608 22,000,743
Taxation - Current 14,576,847 9,480,641 - Prior year(s) 2,298,465 - - Deferred (2,878,568) (2,508,127)
30 13,996,744 6,972,514 PROFIT AFTER TAXATION 19,218,864 15,028,229
2014 2015 2015 2014
------------ Rupees ------------
0.07 0.09 Basic and diluted earnings per share 31 9.03 7.06
----------- US Dollar -----------
The annexed notes 1 to 45 and Annexure I to IV form an integral part of these unconsolidated financial statements.
1,088,699 1,083,820 651,935 571,565 436,764 512,255
104,642 101,315
4,218 12,577 - -
(3,235) (1,170) 105,625 112,722 331,139 399,533
- 115,717 118,190 20,831 31,083 33,866 44,319 83,654 120,094
1,387 56 34,207 19,841
289,662 333,583 620,801 733,116
381,105 401,639 13,354 14,060 16,553 691
411,012 416,390 209,789 316,726
- - 209,789 316,726
66,485 133,465 143,304 183,261
90,402 138,997 - 21,917
(23,917) (27,449)
Muneer KamalChairman
Syed Ahmed Iqbal AshrafPresident
Muhammad NaeemDirector
Iftikhar A. AllawalaDirector
Iftikhar A. AllawalaMuhammad NaeemSyed Ahmed Iqbal Ashraf
The annexed notes 1 to 45 and
Muneer Kamal
Annual Report 2015122 Annual Report 2015
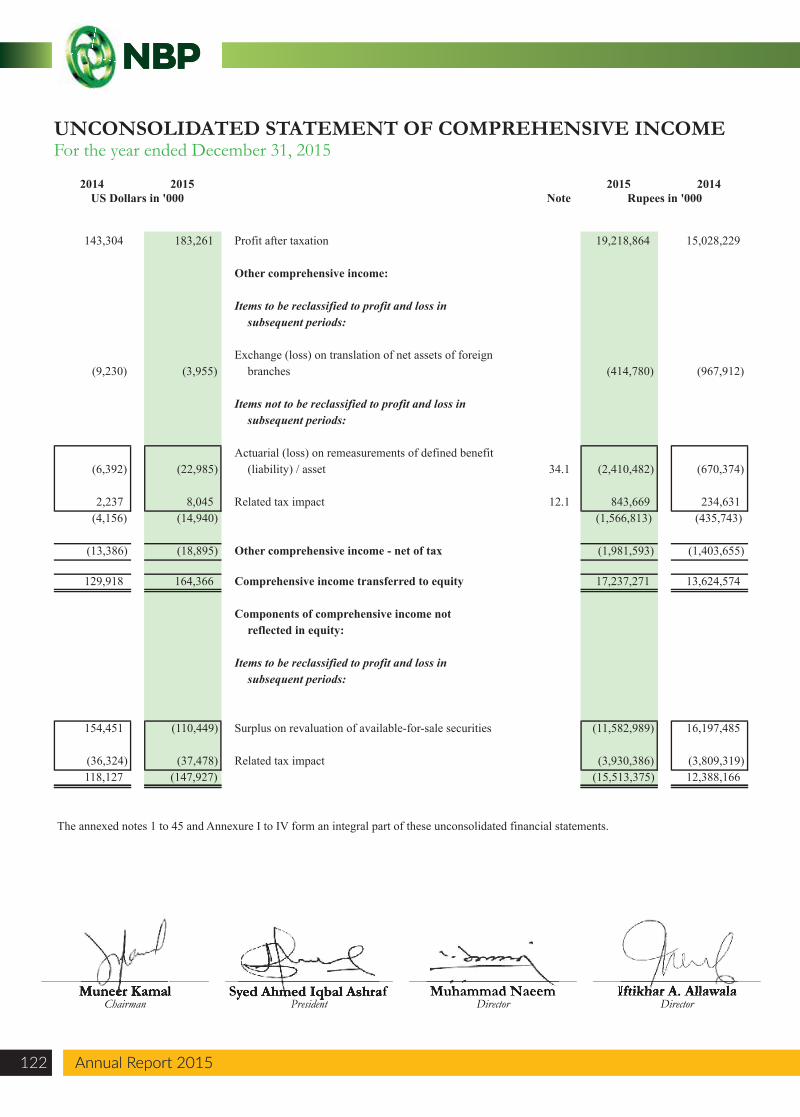
UNCONSOLIDATED STATEMENT OF COMPREHENSIVE INCOMEFor the year ended December 31, 2015
2014 2015 2015 2014US Dollars in '000 Note Rupees in '000
Profit after taxation 19,218,864 15,028,229
Other comprehensive income:
Items to be reclassified to profit and loss insubsequent periods:
Exchange (loss) on translation of net assets of foreignbranches (414,780) (967,912)
Items not to be reclassified to profit and loss insubsequent periods:
Actuarial (loss) on remeasurements of defined benefit(liability) / asset 34.1 (2,410,482) (670,374)
Related tax impact 12.1 843,669 234,631 (1,566,813) (435,743)
Other comprehensive income - net of tax (1,981,593) (1,403,655)
Comprehensive income transferred to equity 17,237,271 13,624,574
Components of comprehensive income notreflected in equity:
Items to be reclassified to profit and loss insubsequent periods:
Surplus on revaluation of available-for-sale securities (11,582,989) 16,197,485
Related tax impact (3,930,386) (3,809,319) (15,513,375) 12,388,166
The annexed notes 1 to 45 and Annexure I to IV form an integral part of these unconsolidated financial statements.
143,304 183,261
(9,230) (3,955)
(6,392) (22,985)
2,237 8,045 (4,156) (14,940)
(13,386) (18,895)
129,918 164,366
154,451 (110,449)
(36,324) (37,478) 118,127 (147,927)
Muneer KamalChairman
Syed Ahmed Iqbal AshrafPresident
Muhammad NaeemDirector
Iftikhar A. AllawalaDirector
Iftikhar A. AllawalaMuhammad NaeemSyed Ahmed Iqbal AshrafMuneer Kamal
Annual Report 2015 123
National Bank of Pakistan
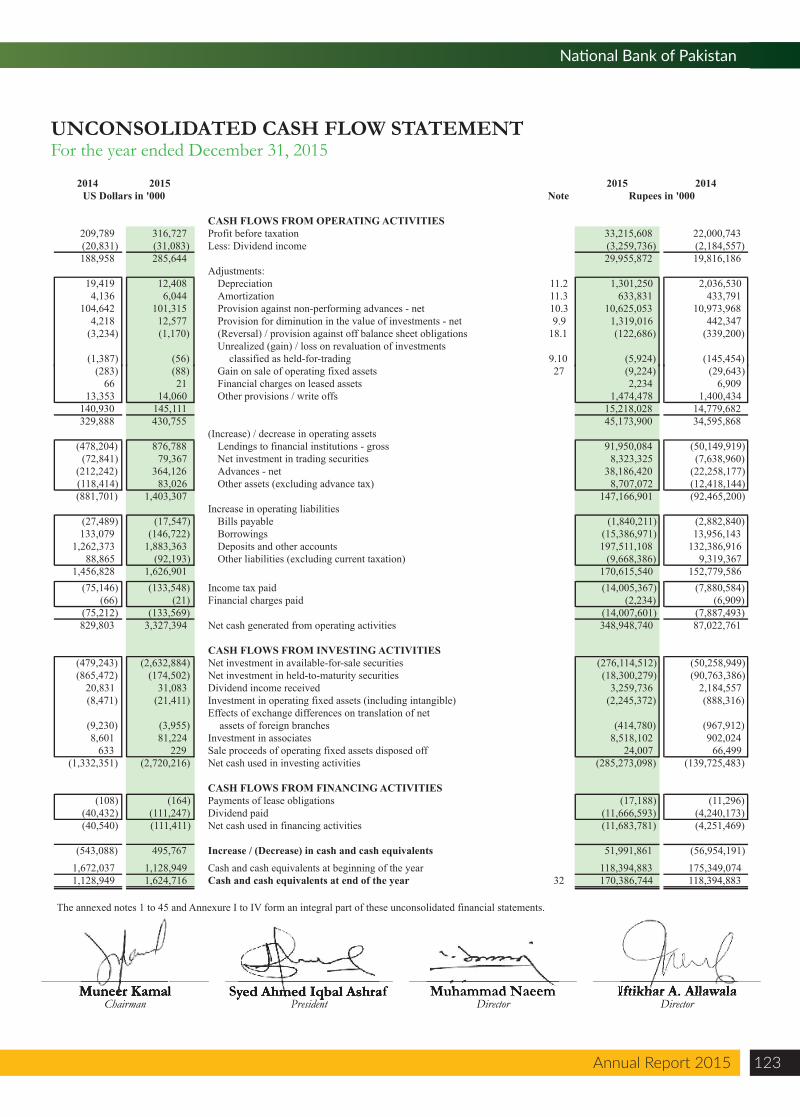
UNCONSOLIDATED CASH FLOW STATEMENTFor the year ended December 31, 2015
2014 2015 2015 2014US Dollars in '000 Note Rupees in '000
CASH FLOWS FROM OPERATING ACTIVITIESProfit before taxation 33,215,608 22,000,743 Less: Dividend income (3,259,736) (2,184,557)
29,955,872 19,816,186 Adjustments:
Depreciation 11.2 1,301,250 2,036,530 Amortization 11.3 633,831 433,791 Provision against non-performing advances - net 10.3 10,625,053 10,973,968 Provision for diminution in the value of investments - net 9.9 1,319,016 442,347 (Reversal) / provision against off balance sheet obligations 18.1 (122,686) (339,200) Unrealized (gain) / loss on revaluation of investments
classified as held-for-trading 9.10 (5,924) (145,454) Gain on sale of operating fixed assets 27 (9,224) (29,643) Financial charges on leased assets 2,234 6,909 Other provisions / write offs 1,474,478 1,400,434
15,218,028 14,779,682 45,173,900 34,595,868
(Increase) / decrease in operating assetsLendings to financial institutions - gross 91,950,084 (50,149,919) Net investment in trading securities 8,323,325 (7,638,960) Advances - net 38,186,420 (22,258,177) Other assets (excluding advance tax) 8,707,072 (12,418,144)
147,166,901 (92,465,200) Increase in operating liabilities
Bills payable (1,840,211) (2,882,840) Borrowings (15,386,971) 13,956,143 Deposits and other accounts 197,511,108 132,386,916 Other liabilities (excluding current taxation) (9,668,386) 9,319,367
170,615,540 152,779,586 Income tax paid (14,005,367) (7,880,584) Financial charges paid (2,234) (6,909)
(14,007,601) (7,887,493) Net cash generated from operating activities 348,948,740 87,022,761
CASH FLOWS FROM INVESTING ACTIVITIESNet investment in available-for-sale securities (276,114,512) (50,258,949) Net investment in held-to-maturity securities (18,300,279) (90,763,386) Dividend income received 3,259,736 2,184,557 Investment in operating fixed assets (including intangible) (2,245,372) (888,316) Effects of exchange differences on translation of net
assets of foreign branches (414,780) (967,912) Investment in associates 8,518,102 902,024 Sale proceeds of operating fixed assets disposed off 24,007 66,499 Net cash used in investing activities (285,273,098) (139,725,483)
CASH FLOWS FROM FINANCING ACTIVITIESPayments of lease obligations (17,188) (11,296) Dividend paid (11,666,593) (4,240,173) Net cash used in financing activities (11,683,781) (4,251,469)
Increase / (Decrease) in cash and cash equivalents 51,991,861 (56,954,191) Cash and cash equivalents at beginning of the year 118,394,883 175,349,074 Cash and cash equivalents at end of the year 32 170,386,744 118,394,883
The annexed notes 1 to 45 and Annexure I to IV form an integral part of these unconsolidated financial statements.
209,789 316,727 (20,831) (31,083) 188,958 285,644
19,419 12,408 4,136 6,044
104,642 101,315 4,218 12,577
(3,234) (1,170)
(1,387) (56) (283) (88)
66 21 13,353 14,060
140,930 145,111 329,888 430,755
(478,204) 876,788 (72,841) 79,367
(212,242) 364,126 (118,414) 83,026 (881,701) 1,403,307
(27,489) (17,547) 133,079 (146,722)
1,262,373 1,883,363 88,865 (92,193)
1,456,828 1,626,901 (75,146) (133,548)
(66) (21) (75,212) (133,569) 829,803 3,327,394
(479,243) (2,632,884) (865,472) (174,502)
20,831 31,083 (8,471) (21,411)
(9,230) (3,955) 8,601 81,224
633 229 (1,332,351) (2,720,216)
(108) (164) (40,432) (111,247) (40,540) (111,411)
(543,088) 495,767 1,672,037 1,128,949 1,128,949 1,624,716
Muneer KamalChairman
Syed Ahmed Iqbal AshrafPresident
Muhammad NaeemDirector
Iftikhar A. AllawalaDirector
Iftikhar A. AllawalaMuhammad NaeemSyed Ahmed Iqbal AshrafMuneer Kamal
Annual Report 2015124 Annual Report 2015
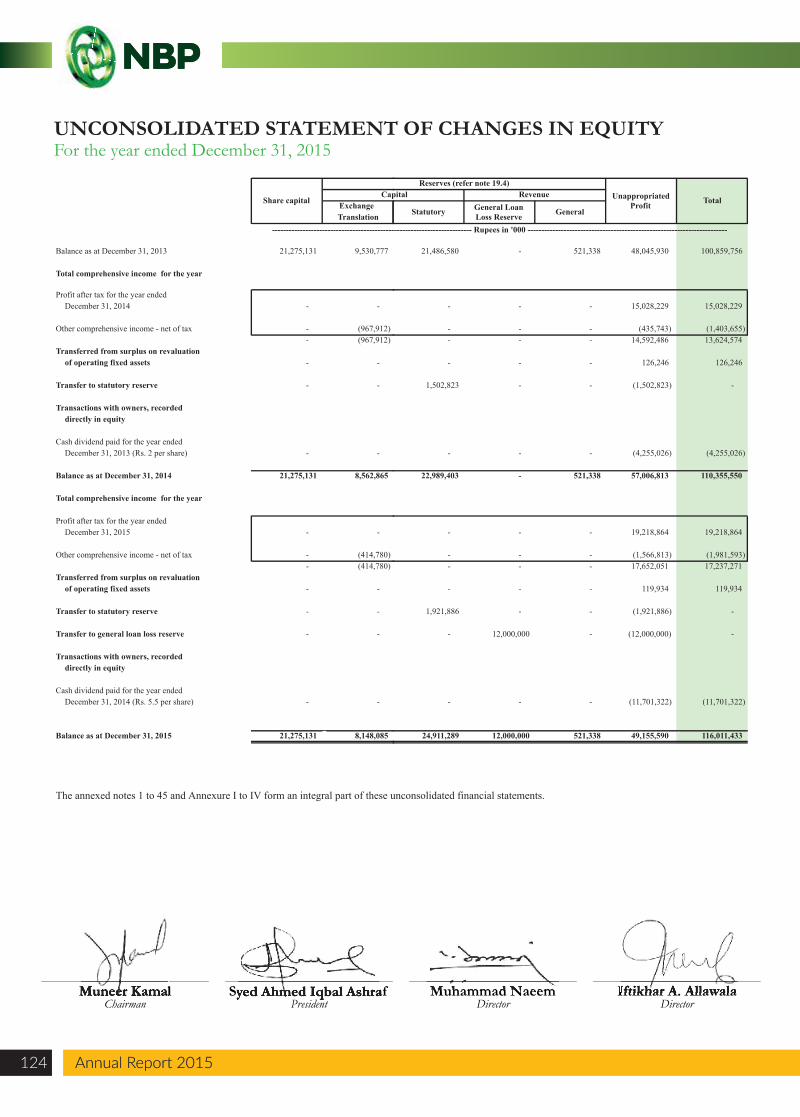
UNCONSOLIDATED STATEMENT OF CHANGES IN EQUITYFor the year ended December 31, 2015
Exchange Translation
------------------------------------------------------------------------ Rupees in '000 ------------------------------------------------------------------------
Share capital
Reserves (refer note 19.4) Capital Revenue
General
Reserves (refer note 19.4)Unappropriated
Profit Total Capital
Statutory General Loan Loss Reserve General
Balance as at December 31, 2013 21,275,131 9,530,777
Total comprehensive income for the year
Profit after tax for the year endedDecember 31, 2014 - -
Other comprehensive income - net of tax - (967,912) - (967,912)
Transferred from surplus on revaluation of operating fixed assets - -
Transfer to statutory reserve - -
Transactions with owners, recordeddirectly in equity
21,486,580 - 521,338 48,045,930 100,859,756
- - - 15,028,229 15,028,229
- - - (435,743) (1,403,655) - - - 14,592,486 13,624,574
- - - 126,246 126,246
1,502,823 - - (1,502,823) -
Cash dividend paid for the year ended December 31, 2013 (Rs. 2 per share) - - - - - (4,255,026) (4,255,026)
Balance as at December 31, 2014 21,275,131 8,562,865 22,989,403 - 521,338 57,006,813 110,355,550
Total comprehensive income for the year
Profit after tax for the year endedDecember 31, 2015 - -
Other comprehensive income - net of tax - (414,780) - (414,780)
Transferred from surplus on revaluation of operating fixed assets - -
Transfer to statutory reserve - -
Transfer to general loan loss reserve - -
Transactions with owners, recordeddirectly in equity
- - - 19,218,864 19,218,864
- - - (1,566,813) (1,981,593) - - - 17,652,051 17,237,271
- - - 119,934 119,934
1,921,886 - - (1,921,886) -
- 12,000,000 - (12,000,000) -
Cash dividend paid for the year ended December 31, 2014 (Rs. 5.5 per share) - -
Balance as at December 31, 2015 21,275,131 8,148,085
The annexed notes 1 to 45 and Annexure I to IV form an integral part of these unconsolidated financial statements.
- - - (11,701,322) (11,701,322)
24,911,289 12,000,000 521,338 49,155,590 116,011,433
Muneer KamalChairman
Syed Ahmed Iqbal AshrafPresident
Muhammad NaeemDirector
Iftikhar A. AllawalaDirector
Iftikhar A. AllawalaMuhammad NaeemSyed Ahmed Iqbal AshrafMuneer Kamal
Annual Report 2015 125
National Bank of Pakistan
NOTES TO THE UNCONSOLIDATED FINANCIAL STATEMENTSFor the year ended December 31, 2015
1. STATUS AND NATURE OF BUSINESS
2. BASIS OF PRESENTATION
2.1
2.2
2.3
3. STATEMENT OF COMPLIANCE
3.1
3.2
3.3 Application of new and revised International Financial Reporting Standards (IFRSs)
-
IFRS 10 ‘Consolidated Financial Statements', IFRS 11 ‘Joint Arrangements’, IFRS 12 ‘Disclosure of Interests in Other Entities’, IFRS 13'Fair Value Measurements'. These standards became applicable from January 1, 2015, as per the adoption status of IFRS in Pakistan.
Following new standards became effective during the year:
National Bank of Pakistan (the Bank) was incorporated in Pakistan under the National Bank of Pakistan Ordinance, 1949 and is listed onIt'sPakistan Stock Exchange Limited registered and head office is situated at I.I. Chundrigar Road, Karachi. The Bank is engaged in providing
commercial banking and related services in Pakistan and overseas. The Bank also handles treasury transactions for the Government of Pakistan(GoP) as an agent to the State Bank of Pakistan (SBP). The Bank operates 1,403 (2014: 1,354) branches in Pakistan and 21 (2014: 23) overseasbranches (including the Export Processing Zone branch, Karachi). The Bank also provides services as trustee to Long-Term Credit Fund (LTCF)and Endowment Fund for student loans scheme.
In accordance with the directives of the Federal Government of Pakistan regarding shifting of banking system to Islamic modes, the SBPhas issued various circulars from time to time. Permissible form of trade related mode of financing includes purchase of goods by the Bankfrom their customers and immediate resale to them at appropriate mark-up in price on deferred payment basis. The purchases and salesarising under these arrangements are not reflected in these financial statements as such but are restricted to the amount of facility actuallyutilized and the appropriate portion of mark-up thereon.
These are separate financial statements of the Bank in which the investments in subsidiaries, associates and joint ventures are stated at costand have not been accounted for on the basis of reported results and net assets of the investees which is done in the consolidated financialstatements.
The US Dollar amounts shown on the statement of financial position, profit and loss account, statement of comprehensive income and cashflow statement are stated as additional information solely for the convenience of readers. For the purpose of conversion to US Dollars, therate of Rs. 104.8715 to 1 US Dollar has been used for 2014 and 2015 as it was the prevalent rate as on December 31, 2015.
These unconsolidated financial statements have been prepared in accordance with approved accounting standards as applicable in Pakistan.Approved accounting standards comprise of such International Financial Reporting Standards (IFRSs) issued by the InternationalAccounting Standards Board and Islamic Financial Accounting Standards (IFASs) issued by the Institute of Chartered Accountants ofPakistan as are notified under the Companies Ordinance, 1984, the provisions of and directives issued under the Companies Ordinance,1984 and the Banking Companies Ordinance, 1962 and directives issued by the State Bank of Pakistan (SBP) and Securities and ExchangeCommission of Pakistan (SECP). Wherever the requirements of the Companies Ordinance, 1984, the Banking Companies Ordinance, 1962or directives issued by SBP or SECP differ with the requirements of IFRSs or IFASs, the requirements of the Companies Ordinance, 1984,the Banking Companies Ordinance, 1962 or the requirements of the said directives shall prevail.
SBP has deferred the applicability of International Accounting Standard (IAS) 39, 'Financial Instruments: Recognition and Measurement'and IAS 40, 'Investment Property' for Banking Companies through BSD Circular Letter No. 10 dated August 26, 2002. Further, accordingto the notification of SECP dated April 28, 2008, the IFRS - 7 "Financial Instruments: Disclosures" has not been made applicable forbanks. Accordingly, the requirements of these standards have not been considered in the preparation of these financial statements.However, investments have been classified and valued in accordance with the requirements of various circulars issued by the SBP.
Key financial figures of the Islamic banking branches of the Bank have been disclosed in note 42 of these financial statements.
IFRS 10 replaces the current guidance on consolidation in IAS 27 Consolidated and Separate Financial Statements. It introduces a single model of assessing control whereby an investor controls an investee when it has the power, exposure to variable returns and the ability to use its power to influence the returns of the investee. IFRS 10 also includes specific guidance on de facto control, protective rights and the determination of whether a decision maker is acting as principal or agent, all of which influence the assessment of control. The application of IFRS 10 did not result in any investee being in control of the Bank except for certain mutual funds in
Annual Report 2015126 Annual Report 2015
NOTES TO THE UNCONSOLIDATED FINANCIAL STATEMENTSFor the year ended December 31, 2015
-
-
-
3.4 New and revised approved accounting standards not yet effective
-
-
-
-
The following standards, amendments and interpretations of approved accounting standards will be effective for accounting periodsbeginning on or after January 01, 2016:
Amendments to IAS 38 Intangible Assets and IAS 16 Property, Plant and Equipment (effective for annual periods beginning on or after 1January 2016) introduce severe restrictions on the use of revenue-based amortization for intangible assets and explicitly state that revenue-based methods of depreciation cannot be used for property, plant and equipment. The rebuttable presumption that the use of revenue-basedamortization methods for intangible assets is inappropriate can be overcome only when revenue and the consumption of the economicbenefits of the intangible asset are ‘highly correlated’, or when the intangible asset is expressed as a measure of revenue. The amendmentsare not likely to have an impact on Bank’s financial statements.
Investment Entities: Applying the Consolidation Exception (Amendments to IFRS 10 – 'Consolidated Financial Statements' and IAS 28 –'Investments in Associates and Joint Ventures') [effective for annual periods beginning on or after 1 January 2016] clarifies (a) whichsubsidiaries of an investment entity are consolidated; (b) exemption to present consolidated financial statements is available to a parententity that is a subsidiary of an investment entity; and (c) how an entity that is not an investment entity should apply the equity method ofaccounting for its investment in an associate or joint venture that is an investment entity. The amendments are not likely to have an impacton Bank’s financial statements.
Amendment to IAS 27 ‘Separate Financial Statement’ (effective for annual periods beginning on or after 1 January 2016) allows entities touse the equity method to account for investments in subsidiaries, joint ventures and associates in their separate financial statements.Currently, SBP circulars for accounting for investments in subsidiaries, joint ventures and associate, require these investments to beaccounted for at cost.
Accounting for Acquisitions of Interests in Joint Operations – Amendments to IFRS 11 ‘Joint Arrangements’ (effective for annual periodsbeginning on or after 1 January 2016) clarify the accounting for the acquisition of an interest in a joint operation where the activities of theoperation constitute a business. They require an investor to apply the principles of business combination accounting when it acquires aninterest in a joint operation that constitutes a business. The amendments are not likely to have an impact on Bank’s financial statements.
IAS 19 'Employee Benefits' requires an entity to consider contributions from employees or third parties when accounting for definedbenefit plans. IAS 19 requires such contributions that are linked to service to be attributed to periods of service as a negative benefit. Theamendments clarify that, if the amount of the contributions is independent of the number of years of service, an entity is permitted torecognise such contributions as a reduction in the service cost in the period in which the service is rendered, instead of allocating thecontributions to the periods of service. The amendment became applicable for annual periods starting on or after July 1, 2014. Theapplication of this amendment did not have any impact on these financial statements.
In addition to the above standards and amendments, improvements to various accounting standards have also been issued by the IASB inDecember 2013 that became effective during the year. These improvements to the standards did not have any material impact on the thesefinancial statements.
previous year. However, SECP vide its notification dated January 28, 2016 has stated that the requirements of consolidation under section 237 of Companies Ordinance 1984 and IFRS 10 is not applicable in case investment by companies in mutual fund established under trust structure. Accordingly, the Bank has not consolidated the said funds in its financial statements.
IFRS 11 replaces IAS 31 Interests in Joint Ventures. It requires all joint ventures to be equity accounted thereby removing the option in IAS 31 for proportionate consolidation. It also removes the IAS 31 concept of jointly controlled assets. The application of IFRS 11 did not result in identification of any associate as a joint venture.
IFRS 12 prescribes additional disclosures around significant judgements and assumptions made in determining whether an entity controls another entity and has joint control or significant influence over another entity. The standard also requires disclosures on the nature and risks associated with interests in unconsolidated structured entities.
IFRS 13 Fair Value Measurement, consolidates the guidance on how to measure fair value, which was spread across various IFRS, into one comprehensive standard. It introduces the use of an exit price, as well as extensive disclosure requirements, particularly the inclusion of non-financial instruments into the fair value hierarchy. The application of IFRS 13 does not have an impact on the financial statements of the Bank except for certain new disclosures as presented in note 36.
Annual Report 2015 127
National Bank of Pakistan
NOTES TO THE UNCONSOLIDATED FINANCIAL STATEMENTSFor the year ended December 31, 2015
-
-
-
-
The amendments to IAS 1 Presentation of Financial Statements clarify the materiality requirements in IAS 1 and the requirements thatapply when additional subtotals are presented in the statement of financial position and the statement(s) of profit and loss and OCI.
Agriculture: Bearer Plants [Amendment to IAS 16 and IAS 41] (effective for annual periods beginning on or after 1 January 2016). Bearerplants are now in the scope of IAS 16 Property, Plant and Equipment for measurement and disclosure purposes. Therefore, a company canelect to measure bearer plants at cost. However, the produce growing on bearer plants will continue to be measured at fair value less coststo sell under IAS 41 Agriculture. A bearer plant is a plant that: is used in the supply of agricultural produce; is expected to bear produce formore than one period; and has a remote likelihood of being sold as agricultural produce. Before maturity, bearer plants are accounted for inthe same way as self-constructed items of property, plant and equipment during construction. The amendments are not likely to have animpact on Bank’s financial statements.
Annual Improvements 2012-2014 cycles (amendments are effective for annual periods beginning on or after 1 January 2016). The newcycle of improvements contain amendments to the following standards:
IFRS 5 ‘Non-current Assets Held for Sale and Discontinued Operations’. IFRS 5 is amended to clarify that if an entity changes themethod of disposal of an asset (or disposal group) i.e. reclassifies an asset from held for distribution to owners to held for sale or viceversa without any time lag, then such change in classification is considered as continuation of the original plan of disposal and if anentity determines that an asset (or disposal group) no longer meets the criteria to be classified as held for distribution, then it ceasesheld for distribution accounting in the same way as it would cease held for sale accounting.
-
-
Standard or interpretation
IFRS 9 – Financial Instruments: Classification and MeasurementIFRS 14 – Regulatory Deferral AccountsIFRS 15 – Revenue from Contracts with CustomersIFRS 16 – Leases
4. BASIS OF MEASUREMENT
5. SUMMARY OF SIGNIFICANT ACCOUNTING POLICIES
5.1 Cash and cash equivalents
The accounting policies adopted in the preparation of these unconsolidated financial statements are consistent with those of the previous financialyear, except for the changes in disclosure due to standards that became effective during the year as described in note 3.3.
These financial statements have been prepared under the historical cost convention except for revaluation of land and buildings which are statedat revalued amount and certain investments and derivative financial instruments that are carried at fair value.
Cash and cash equivalents include cash and balances with treasury banks and balances with other banks in current and deposit accountsand call money lendings, less call money borrowings and overdrawn nostro accounts.
January 01, 2018January 01, 2019
IAS 19 ‘Employee Benefits’. IAS 19 is amended to clarify that high quality corporate bonds or government bonds used in determining the discount rate should be issued in the same currency in which the benefits are to be paid.
IAS 34 ‘Interim Financial Reporting’. IAS 34 is amended to clarify that certain disclosures, if they are not included in the notes tointerim financial statements and disclosed elsewhere should be cross referred.
Further, following new standards have been issued by IASB which are yet to be notified by the SECP for the purpose of applicability inPakistan.
IASB Effective date (annual periods beginning
on or after)
January 01, 2018January 01, 2016
The above amendments are not likely to have an impact on Bank’s financial statements in the period of initial application.
Annual Report 2015128 Annual Report 2015
NOTES TO THE UNCONSOLIDATED FINANCIAL STATEMENTSFor the year ended December 31, 2015
5.2 Investments
-
-
-
-
5.3 Repurchase and resale agreements
Held-to-maturity – These are securities with fixed or determinable payments and fixed maturity thatare held with the intention and ability to hold to maturity. These are carried at amortised cost.
Available-for-sale – These are investments that do not fall under the held-for-trading or held-to-maturity categories. These are carried at market value except in case of unquoted securities wheremarket value is not available, which are carried at cost less provision for diminution in value, if any.Surplus / (deficit) on revaluation is taken to ‘surplus / (deficit) on revaluation of assets’ account shownbelow equity. Provision for diminution in value of investments in respect of unquoted shares iscalculated with reference to book value of the same. On derecognition or impairment in quotedavailable-for-sale investments, the cumulative gain or loss previously reported as 'surplus / (deficit) onrevaluation of assets' below equity is included in the profit and loss account for the period.
Held-for-trading – These are securities which are acquired with the intention to trade by takingadvantage of short-term market / interest rate movements and are to be sold within 90 days. These arecarried at market value, with the related unrealized gain / (loss) on revaluation being taken to profitand loss account.
Provision for diminution in value of investments in unquoted debt securities is calculated as per theSBP's Prudential Regulations.
Held-for-trading and quoted available-for-sale securities are marked to market with reference to ready quoteson Reuters page (PKRV/ PKISRV) or MUFAP or the Stock Exchanges, as the case may be.
Investments in subsidiaries, associates and joint venture companies are stated at cost. Provision is made forimpairment in value, if any.
Securities sold with a simultaneous commitment to repurchase at a specified future date (repos) continue tobe recognised in the statement of financial position and are measured in accordance with accounting policiesfor investment securities. The counterparty liability for amounts received under these agreements is includedin borrowings. The difference between sale and repurchase price is treated as mark-up / return / interestexpense and accrued over the life of the repo agreement using effective yield method.
Investments other than those categorised as held-for-trading are initially recognised at fair value which includes transactions costs associated with the investments. Investments classified as held-for-trading are initially recognised at fair value, and transaction costs are expensed in the profit and loss account.
All regular way purchases / sales of investments are recognised on the trade date, i.e., the date the Bank commits to purchase / sell the investments. Regular way purchases or sales of investments require delivery of securities within the time frame generally established by regulation or convention in the market place.
The Bank has classified its investment portfolio, except for investments in subsidiaries, associates and joint ventures, into ‘held-for-trading’, ‘held-to-maturity’ and ‘available-for-sale’ as follows:
Annual Report 2015 129
National Bank of Pakistan
NOTES TO THE UNCONSOLIDATED FINANCIAL STATEMENTSFor the year ended December 31, 2015
5.4 Derivative financial instruments
Securities purchased with a corresponding commitment to resell at a specified future date (reverse repos) arenot recognised in the statement of financial position, as the Bank does not obtain control over the securities.Amounts paid under these agreements are included in lendings to financial institutions. The differencebetween purchase and resale price is treated as mark-up / return / interest income and accrued over the life ofthe reverse repo agreement using effective yield method.
Derivative financial instruments are initially recognised at fair value on the dates on which the derivativecontracts are entered into and are subsequently re-measured at fair value using appropriate valuationtechniques. All derivative financial instruments are carried as assets when fair value is positive and liabilitieswhen fair value is negative. Any change in the fair value of derivative instruments is taken to the profit andloss account.
5.5 Financial instruments
5.6 Advances
5.7 Operating fixed assets and depreciation
Property and equipment
Owned assets
All financial assets and financial liabilities are recognized at the time when the Bank becomes a party to thecontractual provisions of the instrument. A financial asset is derecognised where (a) the rights to receive cashflows from the asset have expired; or (b) the Bank has transferred its rights to receive cash flows from theasset or has assumed an obligation to pay the received cash flows in full without material delay to a thirdparty under a 'pass-through' arrangement; and either (i) the Bank has transferred substantially all the risksand rewards of the asset, or (ii) the Bank has neither transferred nor retained substantially all the risk andrewards of the asset, but has transferred control of the asset. A financial liability is derecognised when theobligation under the liability is discharged or cancelled or expires. Any gain or loss on derecognition of thefinancial assets and financial liabilities is taken to income currently.
Advances are stated net of specific and general provisions. Provisions are made in accordance with therequirements of Prudential Regulations issued by the SBP and charged to the profit and loss account. Theseregulations prescribe an age based criteria (as supplemented by subjective evaluation of advances by thebanks) for classification of non-performing loans and advances and computing provision / allowance thereagainst. Such regulations also require the Bank to maintain general provision / allowance against consumerand SME advances at specified percentage of such portfolio. General provision for loan losses of overseasbranches is made as per the requirements of the respective central banks. Advances are written off wherethere are no realistic prospects of recovery.
Property and equipment except land and buildings are stated at cost less accumulated depreciation andimpairment losses, if any. Land is stated at revalued amount. Buildings are stated at revalued amount lessaccumulated depreciation and impairment, if any. Cost of operating fixed assets of foreign branches includeexchange differences arising on translation at year-end rates. Depreciation is charged to profit and lossaccount applying the straight line method except buildings, which are depreciated on diminishing balancemethod at the rates stated in note 11.2. Depreciation is charged from the month in which the assets arebrought into use and no depreciation is charged for the month the assets are deleted.
NOTES TO THE UNCONSOLIDATED FINANCIAL STATEMENTSFor the year ended December 31, 2015
Subsequent costs are included in the asset’s carrying amount or recognised as a separate asset, as appropriate,only when it is probable that future economic benefits associated with the item will flow to the Bank and thecost of the item can be measured reliably. The carrying amount of the replaced part is derecognised. All otherrepairs and maintenance are charged to the profit and loss account during the period in which they areincurred.
Assets are derecognised when disposed off or when no future economic benefits are expected from its use ordisposal. Gains and losses on disposal of property and equipment are included in profit and loss accountcurrently.
-
-
Leased assets (as lessee)
Ijarah (as lessor)
The assets' residual values and useful lives are reviewed, and adjusted if appropriate, at each statement offinancial position date.
The surplus arising on revaluation of fixed assets is credited to the “Surplus on Revaluation of Assetsaccount” shown below equity. The Bank has adopted the following accounting treatment of depreciation onrevalued assets, keeping in view the requirements of the Companies Ordinance, 1984 and SECP's SRO45(1)/2003 dated January 13, 2003:
depreciation on assets which are revalued is determined with reference to the value assigned to suchassets on revaluation and depreciation charge for the year is taken to the profit and loss account; and
an amount equal to incremental depreciation for the year net of deferred taxation is transferred from“Surplus on Revaluation of Fixed Assets account” to unappropriated profit through statement ofchanges in equity to record realization of surplus to the extent of the incremental depreciation chargefor the year.
Assets subject to finance lease are accounted for by recording the asset and the related liability. These arerecorded at lower of fair value and the present value of minimum lease payments at the inception of leaseand subsequently stated net of accumulated depreciation. Depreciation is charged on the basis similar to theowned assets. Financial charges are allocated over the period of lease term so as to provide a constantperiodic rate of financial charge on the outstanding liability.
Assets leased out under 'Ijarah' are stated at cost less accumulated depreciation and accumulated impairmentlosses, if any. Assets under Ijarah are depreciated over the period of lease term. However, in the event theasset is expected to be available for re-Ijarah, depreciation is charged over the economic life of the assetusing straight line basis.
Ijarah income is recognised on a straight line basis over the period of Ijarah contract.
Land and buildings' valuations are carried out by professionally qualified valuers with sufficient regularity toensure that their carrying amount does not differ materially from their fair value.
Annual Report 2015130 Annual Report 2015
Annual Report 2015 131
National Bank of Pakistan
NOTES TO THE UNCONSOLIDATED FINANCIAL STATEMENTSFor the year ended December 31, 2015
Intangible assets
Capital work-in-progress
Intangible assets are stated at cost less accumulated amortization and impairment losses, if any.Amortization is charged to income applying the straight-line method at the rates stated in note 11.3. Theestimated useful life and amortisation method are reviewed at the end of each annual reporting period, withthe effect of any changes in estimate being accounted for on a prospective basis.
Capital work-in-progress is stated at cost. These are transferred to specific assets as and when assets areavailable for use.
Impairment
5.8 Deposits and their cost
Deposits are recorded at the fair value of proceeds received.
5.9 Taxation
Current
Deferred
Provision of current taxation is based on taxable income for the year determined in accordance with theprevailing laws of taxation on income earned for local as well as foreign operations, as applicable to therespective jurisdictions. The charge for the current tax also includes adjustments wherever considerednecessary relating to prior years, arising from assessments framed during the year.
The carrying values of operating fixed assets are reviewed for impairment when events or changes incircumstances indicate that the carrying values may not be recoverable. If any such indication exists andwhere the carrying values exceed the estimated recoverable amounts, operating fixed assets are written downto their recoverable amounts.
The resulting impairment loss is taken to profit and loss account except for impairment loss on revaluedassets which is adjusted against the related revaluation surplus to the extent that the impairment loss does notexceed the surplus on revaluation of assets. Where impairment loss subsequently reverses, the carryingamount of the asset is increased to the revised recoverable amount but limited to the extent of the amountwhich would have been determined had there been no impairment. Reversal of impairment loss is recognizedas income.
Deposit costs are recognised as an expense in the period in which these are incurred using effective yieldmethod.
Deferred tax is provided on all temporary differences at the reporting date between the tax bases of assetsand liabilities and their carrying amounts for financial reporting purposes.
Deferred tax assets are recognised for all deductible temporary differences and unused tax losses, to theextent that it is probable that taxable profits will be available against which the deductible temporarydifferences and unused tax losses can be utilised. Deferred tax is not recognised on differences relating toinvestment in subsidiaries and branches to the extent the deductible temporary difference probably will notreverse in the foreseeable future.
The carrying amount of deferred tax assets are reviewed at each reporting date and reduced to the extent thatit is no longer probable that sufficient taxable profit or deductible temporary differences will be available toallow all or part of the deferred income tax asset to be utilised.
Deferred tax assets and liabilities are measured at the tax rates that are expected to apply to the period whenthe asset is realised or the liability is settled, based on tax rates (and tax laws) that have been enacted orsubstantively enacted at the reporting date.
5.10 Employee benefits
5.10.1 Defined benefit plans
5.10.2 Other employee benefits
Employees' compensated absences
5.11 Revenue recognition
Income on loans and advances and debt security investments are recognized on a time proportion basis thattakes into account effective yield on the asset. In case of advances and investments classified under thePrudential Regulations, interest / mark-up is recognized on receipt basis.
Interest / mark-up on rescheduled / restructured advances and investments is recognized in accordance withthe Prudential Regulations of SBP.
The Bank also makes provision in the financial statements for its liability towards compensatedabsences. This liability is estimated on the basis of actuarial advice under the Projected Unit Creditmethod.
Deferred tax relating to gain / loss recognized on surplus on revaluation of assets is charged / credited to suchaccount.
The Bank operates an approved funded pension scheme, an un-funded post retirement medicalbenefits scheme and an un-funded benevolent scheme for its eligible employees. The Bank alsooperates an un-funded gratuity scheme for its eligible contractual employees. An actuarial valuation ofall defined benefit schemes is conducted every year. The valuation uses the Projected Unit Creditmethod. Remeasurements of the net defined benefit liability / assets which comprise actuarial gainsand losses, return on plan assets (excluding interest) and the effect of asset ceiling (if any, excludinginterest) are recognized immediately in other comprehensive income. Past-service costs are recognizedimmediately in profit and loss account when the plan amendment occurs.
NOTES TO THE UNCONSOLIDATED FINANCIAL STATEMENTSFor the year ended December 31, 2015
Annual Report 2015132 Annual Report 2015
Annual Report 2015 133
National Bank of Pakistan
NOTES TO THE UNCONSOLIDATED FINANCIAL STATEMENTSFor the year ended December 31, 2015
Commission on letters of credit and guarantees is recognized on time proportion basis.
Premium or discount on debt securities classified as held-for-trading, available-for-sale and held-to-maturitysecurities is amortised using the effective interest method and taken to profit and loss account.
Gains and losses on disposal of investments and operating fixed assets are dealt with through the profit andloss account in the year in which they arise.
Fee, brokerage and commission income other than commission on letter of credit and guarantees andremuneration for trustee services are recognized upon performance of services.
Dividend income on equity investments and mutual funds is recognized when right to receive is established.
5.12 Foreign currencies translation
5.13 Provision for off balance sheet obligations
Profit and loss account balances of foreign branches are translated at average exchange rate prevailing duringthe year. Gains and losses on translation are included in the profit and loss account except gains / lossesarising on translation of net assets of foreign branches, which is credited to other comprehensive income.
Commitments for outstanding forward foreign exchange contracts are disclosed in these financial statementsat committed amounts. Contingent liabilities / commitments for letters of credit and letters of guaranteedenominated in foreign currencies are expressed in Rupee terms at the rates of exchange prevailing at thestatement of financial position date.
Provision for guarantees, claims and other off balance sheet obligations is made when the Bank has legal orconstructive obligation as a result of past events, it is probable that an outflow of resources will be requiredto settle the obligation and a reliable estimate of amount can be made. Charge to profit and loss account isstated net of expected recoveries.
Items included in the financial statements of the Bank's foreign branches are measured using the currency ofthe primary economic environment in which the Bank operates (the functional currency).
Foreign currency transactions are converted into Rupees applying the exchange rate at the date of therespective transactions. Monetary assets and liabilities in foreign currencies and assets / liabilities of foreignbranches are translated into Rupees at the rates of exchange prevailing at the statement of financial positiondate. Forward foreign exchange contracts are valued at the rates applicable to their respective maturities. Allgains or losses on dealing in foreign currencies are taken to profit and loss account currently.
The Bank's financial statements are presented in Pak Rupees (Rs.) which is the Bank's functional andpresentation currency.
5.14 Off setting
5.15 Fiduciary assets
5.16 Dividend and other appropriations
Assets held in a fiduciary capacity are not treated as assets of the Bank in the statement of financial position.
Dividend and appropriation to reserves, except appropriations which are required by the law, are recognisedin the Banks' financial statements in the year in which these are approved.
Financial assets and financial liabilities are only set off and the net amount is reported in the financialstatements when there is a legally enforceable right to set off and the Bank intends either to settle on a netbasis, or to realize the assets and to settle the liabilities simultaneously.
5.17 Earnings per share
5.18 Accounting estimates and judgments
a) Provision against non-performing loans and advances
The Bank reviews its loan portfolio to assess amount of non-performing loans and determine provisionrequired there against on a quarterly basis. While assessing this requirement various factors includingthe past dues, delinquency in the account, financial position of the borrower, value of collateral heldand requirements of Prudential Regulations are considered except for loans and advances whererelaxation has been allowed by SBP. General provision for loan losses of overseas branches is made asper the requirements of the respective central banks.
The amount of general provision against consumer and SME advances is determined in accordancewith the relevant Prudential Regulations and SBP directives.
The preparation of financial statements in conformity with Approved Accounting Standards requires the useof certain critical accounting estimates. It also requires management to exercise its judgment in the processof applying the Bank’s accounting polices. The estimates / judgments and associated assumptions used in thepreparation of the financial statements are based on historical experience and other factors, includingexpectations of future events that are believed to be reasonable under the circumstances. The key areas ofestimates and judgments in relation to these financial statements are as follows:
The Bank presents basic and diluted earnings per share (EPS) for its shareholders. Basic EPS is calculated bydividing the profit or loss attributable to ordinary shareholders of the Bank by the weighted average numberof ordinary shares outstanding during the year. Diluted EPS is determined by adjusting the profit or lossattributable to ordinary shareholders and the weighted average number of ordinary shares outstanding for theeffects of all dilutive potential ordinary shares, if any. There were no dilutive potential ordinary shares inissue at December 31, 2015.
NOTES TO THE UNCONSOLIDATED FINANCIAL STATEMENTSFor the year ended December 31, 2015
Annual Report 2015134 Annual Report 2015
Annual Report 2015 135
National Bank of Pakistan
NOTES TO THE UNCONSOLIDATED FINANCIAL STATEMENTSFor the year ended December 31, 2015
b) Fair value of derivatives
c) Impairment of available-for-sale investments
The Bank considers that available-for-sale equity investments and mutual funds are impaired whenthere has been a significant or prolonged decline in the fair value below its cost except for investmentswhere relaxation has been allowed by SBP. This determination of what is significant or prolongedrequires judgment. In addition, impairment may be appropriate when there is evidence of deteriorationin the financial health of the investee, industry and sector performance.
Further the Bank has developed internal criteria according to which a decline of 30% in the marketvalue of any scrip below its cost shall constitute as a significant decline and where market valueremains below the cost for a period of one year shall constitute as a prolonged decline.
The fair values of derivatives which are not quoted in active markets are determined by using valuationtechniques. The valuation techniques take into account the relevant interest and exchange rates overthe term of the contract.
d) Held-to-maturity investments
e) Income taxes
f) Operating fixed assets, revaluation, depreciation and amortization
g) Employees' benefit plans
f) Provision against contingencies
The Bank follows the guidance provided in the SBP circulars on classifying non-derivative financial assetswith fixed or determinable payments and fixed maturity as held-to-maturity. In making this judgment, theBank evaluates its intention and ability to hold such investments till maturity.
Provision against contingencies is determined based on the management judgement regarding theprobability of future out flows of resources emboying economic benefits to settle an obligation arising frompast events.
The liabilities for employees' benefits plans are determined using actuarial valuations. The actuarialvaluations involve assumptions about discount rates, expected rates of return on assets, future salaryincreases, future inflation rates and future pension increases as disclosed in note 34. Due to the long termnature of these plans, such estimates are subject to significant uncertainty.
The Bank also revalues its properties on a periodic basis. Such revaluations are carried out by independentvaluer and involves estimates / assumptions and various market factors and conditions.
In making estimates of the depreciation / amortization method, the management uses method which reflectsthe pattern in which economic benefits are expected to be consumed by the Bank. The method applied isreviewed at each financial year end and if there is a change in the expected pattern of consumption of thefuture economic benefits embodied in the assets, the method would be changed to reflect the change inpattern.
In making the estimates for current and deferred taxes, the management looks at the income tax law and thedecisions of appellate authorities on certain issues in the past. There are certain matters where the Bank’sview differs with the view taken by the income tax department and such amounts are shown as contingentliability.
2015 2014Note Rupees in '000
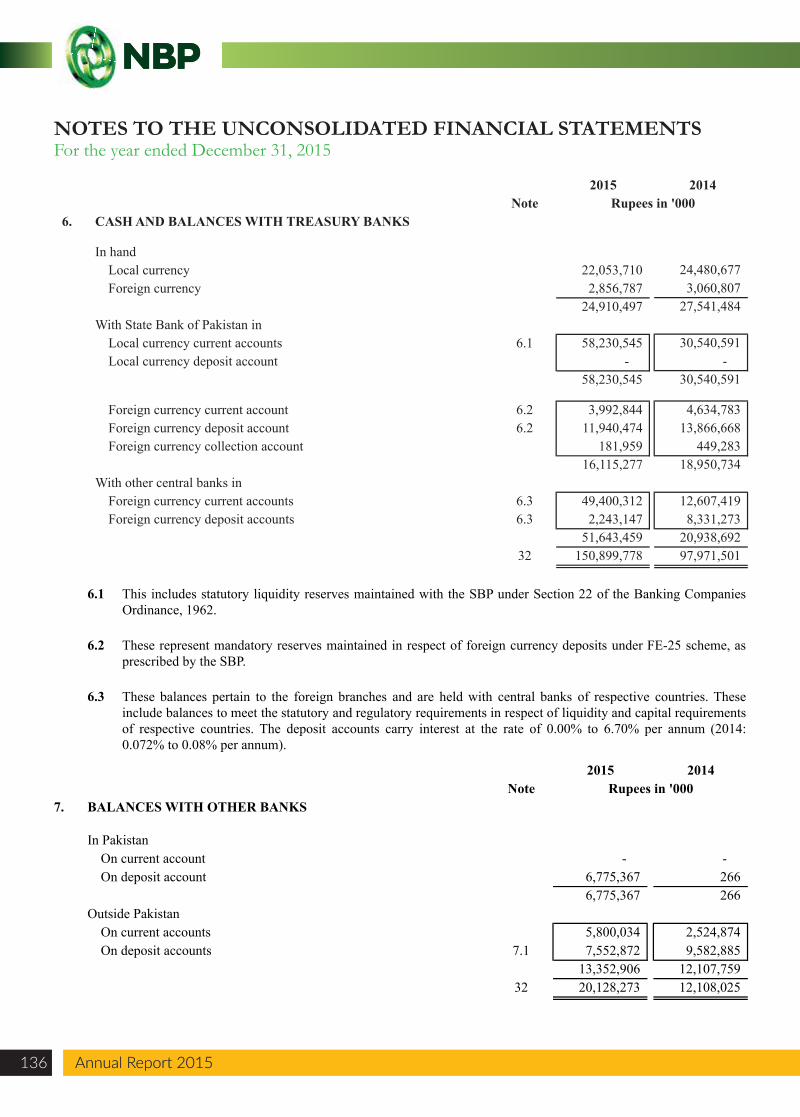
6. CASH AND BALANCES WITH TREASURY BANKS
In handLocal currency 22,053,710 Foreign currency 2,856,787
24,910,497 With State Bank of Pakistan in
Local currency current accounts 6.1 58,230,545 Local currency deposit account -
58,230,545
Foreign currency current account 6.2 3,992,844 Foreign currency deposit account 6.2 11,940,474 Foreign currency collection account 181,959
16,115,277 With other central banks in
Foreign currency current accounts 6.3 49,400,312 Foreign currency deposit accounts 6.3 2,243,147
51,643,459 32 150,899,778
24,480,677 3,060,807
27,541,484
30,540,591 -
30,540,591
4,634,783 13,866,668
449,283 18,950,734
12,607,419 8,331,273
20,938,692 97,971,501
6.1
6.2
6.3
2015Note Rupees in '000
7. BALANCES WITH OTHER BANKS
In PakistanOn current account - On deposit account 6,775,367
6,775,367 Outside Pakistan
On current accounts 5,800,034 On deposit accounts 7.1 7,552,872
13,352,906 32 20,128,273
This includes statutory liquidity reserves maintained with the SBP under Section 22 of the Banking CompaniesOrdinance, 1962.
These represent mandatory reserves maintained in respect of foreign currency deposits under FE-25 scheme, asprescribed by the SBP.
These balances pertain to the foreign branches and are held with central banks of respective countries. Theseinclude balances to meet the statutory and regulatory requirements in respect of liquidity and capital requirementsof respective countries. The deposit accounts carry interest at the rate of 0.00% to 6.70% per annum (2014:0.072% to 0.08% per annum).
- 266 266
2,524,874 9,582,885
12,107,759 12,108,025
2014
NOTES TO THE UNCONSOLIDATED FINANCIAL STATEMENTSFor the year ended December 31, 2015
Annual Report 2015136 Annual Report 2015
Annual Report 2015 137
National Bank of Pakistan
NOTES TO THE UNCONSOLIDATED FINANCIAL STATEMENTSFor the year ended December 31, 2015
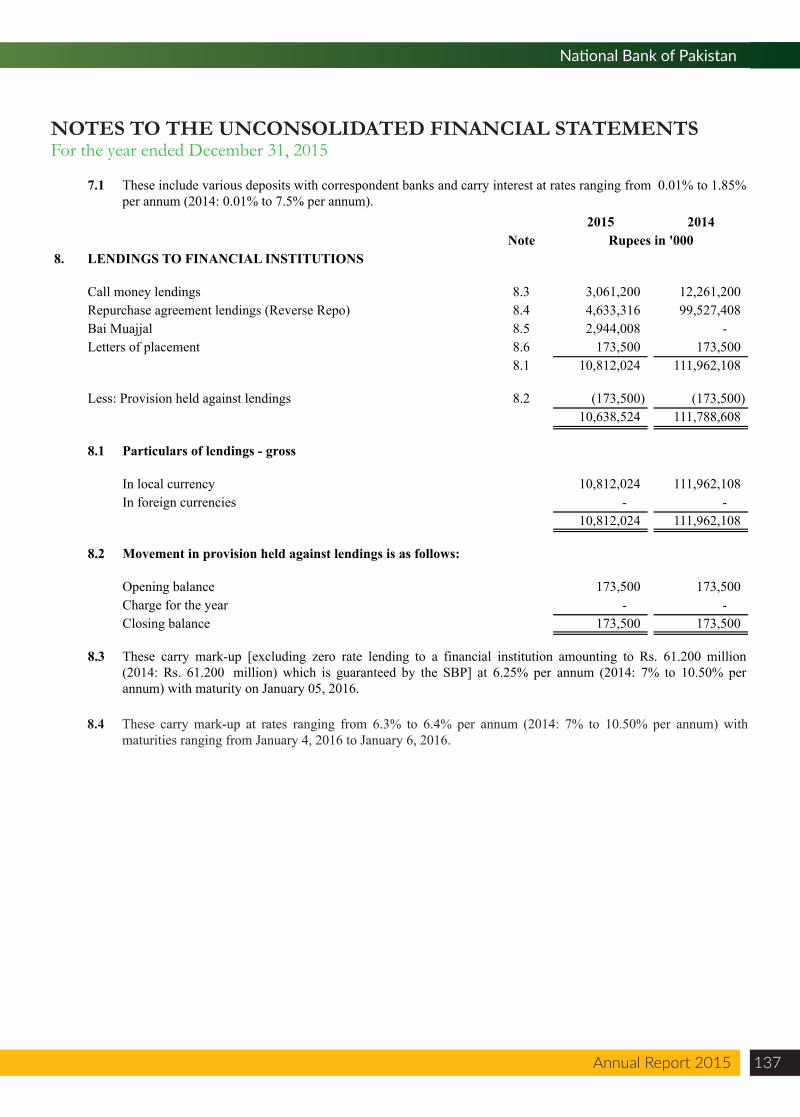
7.1
2015Note Rupees in '000
8. LENDINGS TO FINANCIAL INSTITUTIONS
Call money lendings 8.3 3,061,200 Repurchase agreement lendings (Reverse Repo) 8.4 4,633,316 Bai Muajjal 8.5 2,944,008 Letters of placement 8.6 173,500
8.1 10,812,024
Less: Provision held against lendings 8.2 (173,500) 10,638,524
8.1 Particulars of lendings - gross
In local currency 10,812,024 In foreign currencies -
10,812,024
8.2 Movement in provision held against lendings is as follows:
Opening balance 173,500 Charge for the year - Closing balance 173,500
8.3 These carry mark-up [excluding zero rate lending to a financial institution amounting to Rs. 61.200 million(2014: Rs. 61.200 million) which is guaranteed by the SBP] at 6.25% per annum (2014: 7% to 10.50% perannum) with maturity on January 05, 2016.
These include various deposits with correspondent banks and carry interest at rates ranging from 0.01% to 1.85%per annum (2014: 0.01% to 7.5% per annum).
2014
12,261,200 99,527,408
- 173,500
111,962,108
(173,500) 111,788,608
111,962,108 -
111,962,108
173,500 -
173,500
8.4 These carry mark-up at rates ranging from 6.3% to 6.4% per annum (2014: 7% to 10.50% per annum) withmaturities ranging from January 4, 2016 to January 6, 2016.
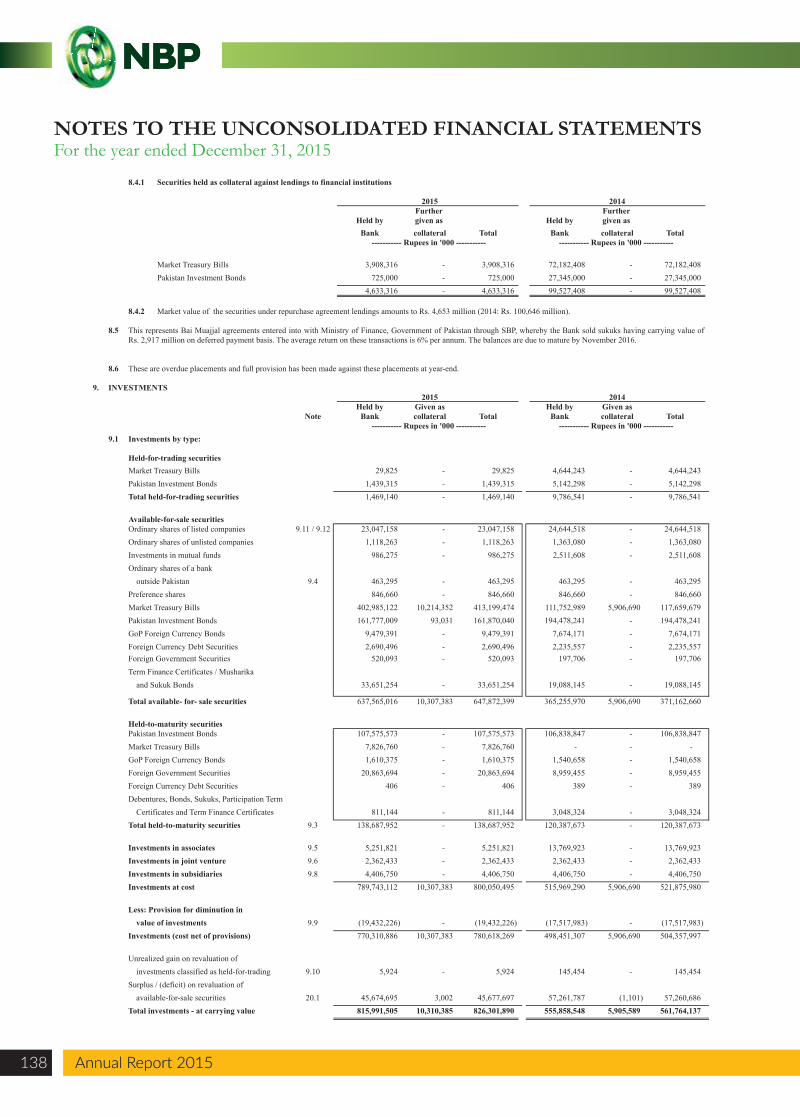
8.4.1 Securities held as collateral against lendings to financial institutions
2015 2014Further Further
Held by given as Held by given as Bank collateral Total Bank collateral Total
----------- Rupees in '000 ----------- ----------- Rupees in '000 -----------
Market Treasury Bills 3,908,316 - 3,908,316 72,182,408 - 72,182,408 Pakistan Investment Bonds 725,000 - 725,000 27,345,000 - 27,345,000
4,633,316 - 4,633,316 99,527,408 - 99,527,408
8.4.2 Market value of the securities under repurchase agreement lendings amounts to Rs. 4,653 million (2014: Rs. 100,646 million).
8.5
8.6
9. INVESTMENTS2015 2014
Held by Given as Held by Given asNote Bank collateral Total Bank collateral Total
----------- Rupees in '000 ----------- ----------- Rupees in '000 ----------- 9.1 Investments by type:
Held-for-trading securitiesMarket Treasury Bills 29,825 - 29,825 4,644,243 - 4,644,243 Pakistan Investment Bonds 1,439,315 - 1,439,315 5,142,298 - 5,142,298 Total held-for-trading securities 1,469,140 - 1,469,140 9,786,541 - 9,786,541
Available-for-sale securitiesOrdinary shares of listed companies 9.11 / 9.12 23,047,158 - 23,047,158 24,644,518 - 24,644,518 Ordinary shares of unlisted companies 1,118,263 - 1,118,263 1,363,080 - 1,363,080 Investments in mutual funds 986,275 - 986,275 2,511,608 - 2,511,608 Ordinary shares of a bank
outside Pakistan 9.4 463,295 - 463,295 463,295 - 463,295 Preference shares 846,660 - 846,660 846,660 - 846,660 Market Treasury Bills 402,985,122 10,214,352 413,199,474 111,752,989 5,906,690 117,659,679 Pakistan Investment Bonds 161,777,009 93,031 161,870,040 194,478,241 - 194,478,241 GoP Foreign Currency Bonds 9,479,391 - 9,479,391 7,674,171 - 7,674,171 Foreign Currency Debt Securities 2,690,496 - 2,690,496 2,235,557 - 2,235,557 Foreign Government Securities 520,093 - 520,093 197,706 - 197,706 Term Finance Certificates / Musharika
and Sukuk Bonds 33,651,254 - 33,651,254 19,088,145 - 19,088,145
Total available- for- sale securities 637,565,016 10,307,383 647,872,399 365,255,970 5,906,690 371,162,660
Held-to-maturity securitiesPakistan Investment Bonds 107,575,573 - 107,575,573 106,838,847 - 106,838,847 Market Treasury Bills 7,826,760 7,826,760 - - - GoP Foreign Currency Bonds 1,610,375 -
- 1,610,375 1,540,658 - 1,540,658
Foreign Government Securities 20,863,694 - 20,863,694 8,959,455 - 8,959,455 Foreign Currency Debt Securities 406 - 406 389 - 389 Debentures, Bonds, Sukuks, Participation Term
Certificates and Term Finance Certificates 811,144 - 811,144 3,048,324 - 3,048,324 Total held-to-maturity securities 9.3 138,687,952 - 138,687,952 120,387,673 - 120,387,673
Investments in associates 9.5 5,251,821 - 5,251,821 13,769,923 - 13,769,923 Investments in joint venture 9.6 2,362,433 - 2,362,433 2,362,433 - 2,362,433 Investments in subsidiaries 9.8 4,406,750 - 4,406,750 4,406,750 - 4,406,750 Investments at cost 789,743,112 10,307,383 800,050,495 515,969,290 5,906,690 521,875,980
Less: Provision for diminution in value of investments 9.9 (19,432,226) - (19,432,226) (17,517,983) - (17,517,983)
Investments (cost net of provisions) 770,310,886 10,307,383 780,618,269 498,451,307 5,906,690 504,357,997
Unrealized gain on revaluation of investments classified as held-for-trading 9.10 5,924 - 5,924 145,454 - 145,454
Surplus / (deficit) on revaluation of available-for-sale securities 20.1 45,674,695 3,002 45,677,697 57,261,787 (1,101) 57,260,686
Total investments - at carrying value 815,991,505 10,310,385 826,301,890 555,858,548 5,905,589 561,764,137
These are overdue placements and full provision has been made against these placements at year-end.
This represents Bai Muajjal agreements entered into with Ministry of Finance, Government of Pakistan through SBP, whereby the Bank sold sukuks having carrying value ofRs. 2,917 million on deferred payment basis. The average return on these transactions is 6% per annum. The balances are due to mature by November 2016.
NOTES TO THE UNCONSOLIDATED FINANCIAL STATEMENTSFor the year ended December 31, 2015
Annual Report 2015138 Annual Report 2015
Annual Report 2015 139
National Bank of Pakistan
NOTES TO THE UNCONSOLIDATED FINANCIAL STATEMENTSFor the year ended December 31, 2015
2015 2014Note Rupees in '000
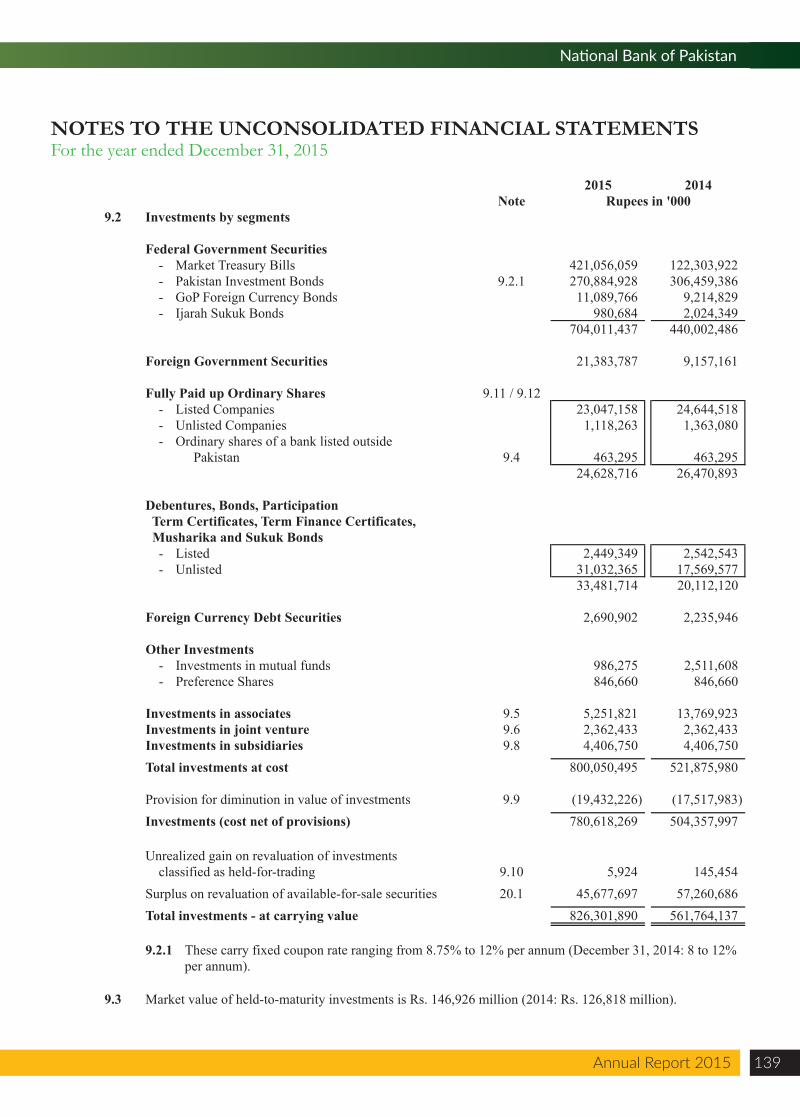
9.2 Investments by segments
Federal Government Securities- Market Treasury Bills 421,056,059 122,303,922 - Pakistan Investment Bonds 9.2.1 270,884,928 306,459,386 - GoP Foreign Currency Bonds 11,089,766 9,214,829 - Ijarah Sukuk Bonds 980,684 2,024,349
704,011,437 440,002,486
Foreign Government Securities 21,383,787 9,157,161
Fully Paid up Ordinary Shares 9.11 / 9.12- Listed Companies 23,047,158 24,644,518 - Unlisted Companies 1,118,263 1,363,080 - Ordinary shares of a bank listed outside
Pakistan 9.4 463,295 463,295 24,628,716 26,470,893
Debentures, Bonds, Participation Term Certificates, Term Finance Certificates, Musharika and Sukuk Bonds
- Listed 2,449,349 2,542,543 - Unlisted 31,032,365 17,569,577
33,481,714 20,112,120
Foreign Currency Debt Securities 2,690,902 2,235,946
Other Investments- Investments in mutual funds 986,275 2,511,608 - Preference Shares 846,660 846,660
Investments in associates 9.5 5,251,821 13,769,923 Investments in joint venture 9.6 2,362,433 2,362,433 Investments in subsidiaries 9.8 4,406,750 4,406,750 Total investments at cost 800,050,495 521,875,980
Provision for diminution in value of investments 9.9 (19,432,226) (17,517,983) Investments (cost net of provisions) 780,618,269 504,357,997
Unrealized gain on revaluation of investmentsclassified as held-for-trading 9.10 5,924 145,454
Surplus on revaluation of available-for-sale securities 20.1 45,677,697 57,260,686 Total investments - at carrying value 826,301,890 561,764,137
9.2.1
9.3 Market value of held-to-maturity investments is Rs. 146,926 million (2014: Rs. 126,818 million).
These carry fixed coupon rate ranging from 8.75% to 12% per annum (December 31, 2014: 8 to 12% per annum).
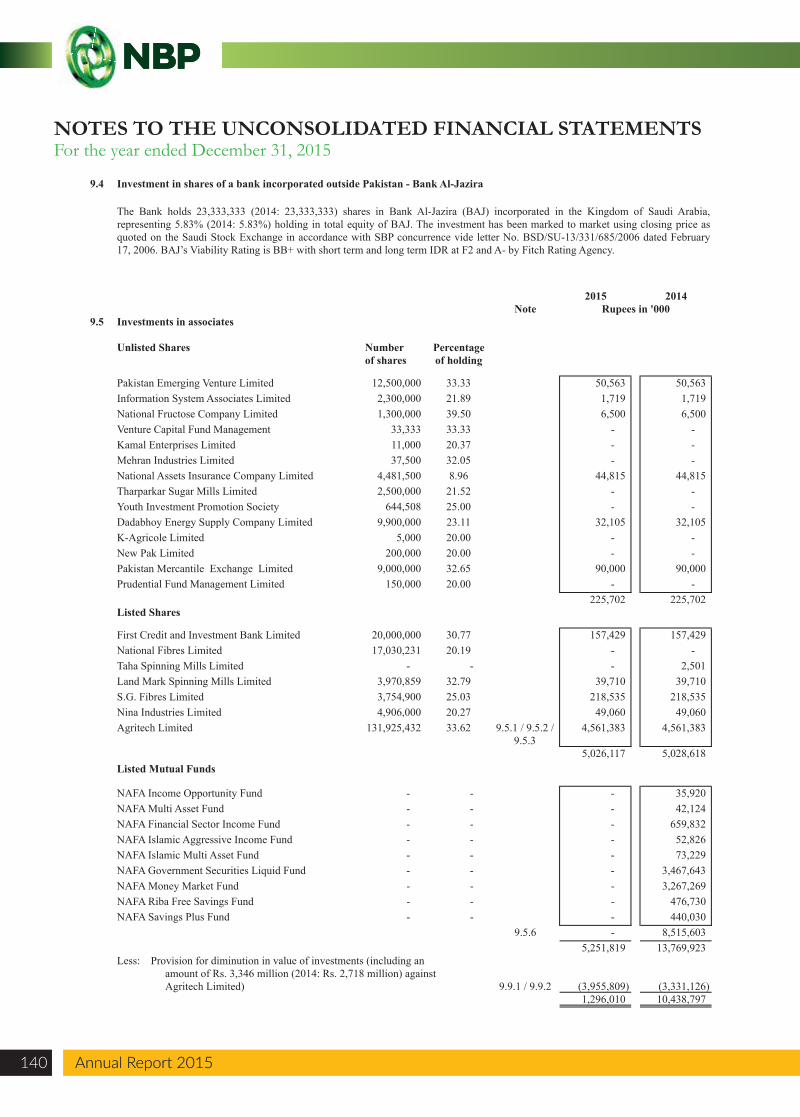
9.4 Investment in shares of a bank incorporated outside Pakistan - Bank Al-Jazira
2015 2014Note Rupees in '000
9.5 Investments in associates
Unlisted Shares Number Percentageof shares of holding
Pakistan Emerging Venture Limited 12,500,000 33.33 50,563 50,563 Information System Associates Limited 2,300,000 21.89 1,719 1,719 National Fructose Company Limited 1,300,000 39.50 6,500 6,500 Venture Capital Fund Management 33,333 33.33 - - Kamal Enterprises Limited 11,000 20.37 - - Mehran Industries Limited 37,500 32.05 - - National Assets Insurance Company Limited 4,481,500 8.96 44,815 44,815 Tharparkar Sugar Mills Limited 2,500,000 21.52 - - Youth Investment Promotion Society 644,508 25.00 - - Dadabhoy Energy Supply Company Limited 9,900,000 23.11 32,105 32,105 K-Agricole Limited 5,000 20.00 - - New Pak Limited 200,000 20.00 - - Pakistan Mercantile Exchange Limited 9,000,000 32.65 90,000 90,000 Prudential Fund Management Limited 150,000 20.00 - -
225,702 225,702 Listed Shares
First Credit and Investment Bank Limited 20,000,000 30.77 157,429 157,429 National Fibres Limited 17,030,231 20.19 - - Taha Spinning Mills Limited - - - 2,501 Land Mark Spinning Mills Limited 3,970,859 32.79 39,710 39,710 S.G. Fibres Limited 3,754,900 25.03 218,535 218,535 Nina Industries Limited 4,906,000 20.27 49,060 49,060 Agritech Limited 131,925,432 33.62 9.5.1 / 9.5.2 /
9.5.34,561,383 4,561,383
5,026,117 5,028,618 Listed Mutual Funds
NAFA Income Opportunity Fund - - - 35,920 NAFA Multi Asset Fund - - - 42,124 NAFA Financial Sector Income Fund - - - 659,832 NAFA Islamic Aggressive Income Fund - - - 52,826 NAFA Islamic Multi Asset Fund - - - 73,229 NAFA Government Securities Liquid Fund - - - 3,467,643 NAFA Money Market Fund - - - 3,267,269 NAFA Riba Free Savings Fund - - - 476,730 NAFA Savings Plus Fund - - - 440,030
9.5.6 - 8,515,603 5,251,819 13,769,923
Less: Provision for diminution in value of investments (including anamount of Rs. 3,346 million (2014: Rs. 2,718 million) against Agritech Limited) 9.9.1 / 9.9.2 (3,955,809) (3,331,126)
1,296,010 10,438,797
The Bank holds 23,333,333 (2014: 23,333,333) shares in Bank Al-Jazira (BAJ) incorporated in the Kingdom of Saudi Arabia,representing 5.83% (2014: 5.83%) holding in total equity of BAJ. The investment has been marked to market using closing price asquoted on the Saudi Stock Exchange in accordance with SBP concurrence vide letter No. BSD/SU-13/331/685/2006 dated February17, 2006. BAJ’s Viability Rating is BB+ with short term and long term IDR at F2 and A- by Fitch Rating Agency.
NOTES TO THE UNCONSOLIDATED FINANCIAL STATEMENTSFor the year ended December 31, 2015
Annual Report 2015140 Annual Report 2015
Annual Report 2015 141
National Bank of Pakistan
NOTES TO THE UNCONSOLIDATED FINANCIAL STATEMENTSFor the year ended December 31, 2015
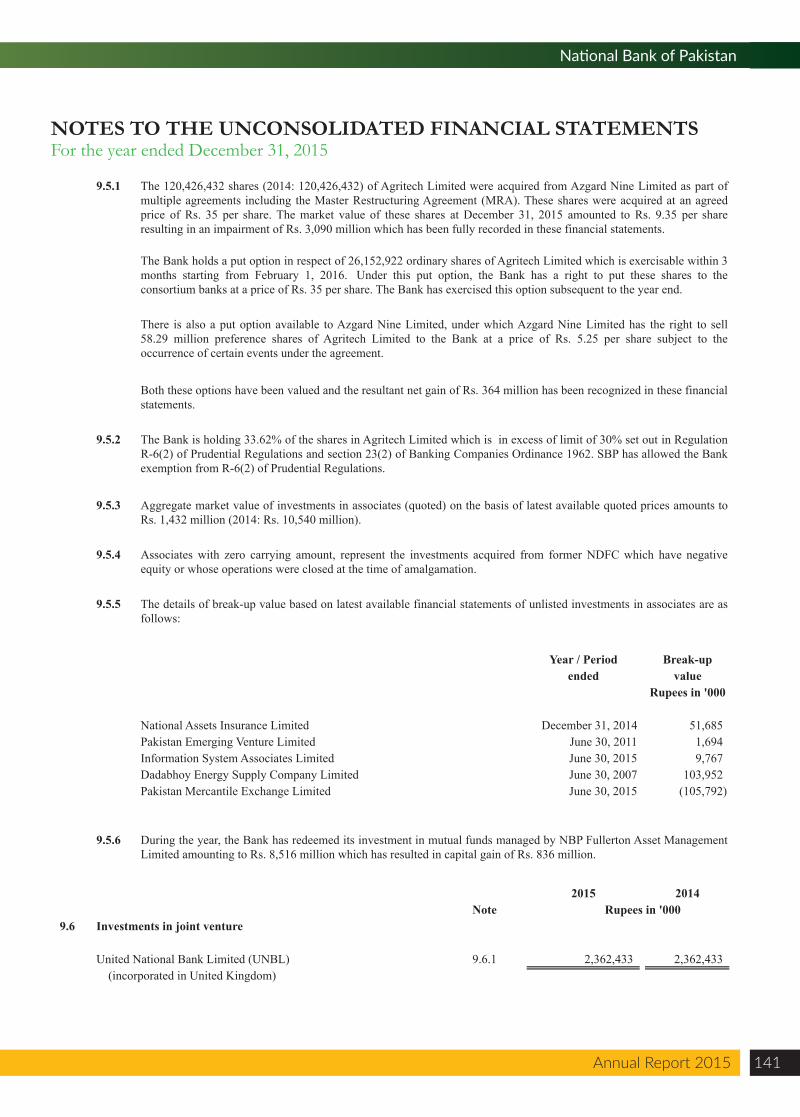
9.5.1
9.5.2
9.5.3
9.5.4
9.5.5
Year / Period Break-upended value
Rupees in '000
National Assets Insurance Limited December 31, 2014 51,685 Pakistan Emerging Venture Limited June 30, 2011 1,694 Information System Associates Limited June 30, 2015 9,767 Dadabhoy Energy Supply Company Limited June 30, 2007 103,952 Pakistan Mercantile Exchange Limited June 30, 2015 (105,792)
9.5.6
2015 2014Note Rupees in '000
9.6 Investments in joint venture
United National Bank Limited (UNBL) 9.6.1 2,362,433 2,362,433 (incorporated in United Kingdom)
The 120,426,432 shares (2014: 120,426,432) of Agritech Limited were acquired from Azgard Nine Limited as part ofmultiple agreements including the Master Restructuring Agreement (MRA). These shares were acquired at an agreedprice of Rs. 35 per share. The market value of these shares at December 31, 2015 amounted to Rs. 9.35 per shareresulting in an impairment of Rs. 3,090 million which has been fully recorded in these financial statements.
The details of break-up value based on latest available financial statements of unlisted investments in associates are asfollows:
The Bank is holding 33.62% of the shares in Agritech Limited which is in excess of limit of 30% set out in RegulationR-6(2) of Prudential Regulations and section 23(2) of Banking Companies Ordinance 1962. SBP has allowed the Bankexemption from R-6(2) of Prudential Regulations.
Aggregate market value of investments in associates (quoted) on the basis of latest available quoted prices amounts toRs. 1,432 million (2014: Rs. 10,540 million).
Associates with zero carrying amount, represent the investments acquired from former NDFC which have negativeequity or whose operations were closed at the time of amalgamation.
During the year, the Bank has redeemed its investment in mutual funds managed by NBP Fullerton Asset ManagementLimited amounting to Rs. 8,516 million which has resulted in capital gain of Rs. 836 million.
The Bank holds a put option in respect of 26,152,922 ordinary shares of Agritech Limited which is exercisable within 3months starting from February 1, 2016. Under this put option, the Bank has a right to put these shares to theconsortium banks at a price of Rs. 35 per share. The Bank has exercised this option subsequent to the year end.
There is also a put option available to Azgard Nine Limited, under which Azgard Nine Limited has the right to sell58.29 million preference shares of Agritech Limited to the Bank at a price of Rs. 5.25 per share subject to theoccurrence of certain events under the agreement.
Both these options have been valued and the resultant net gain of Rs. 364 million has been recognized in these financialstatements.
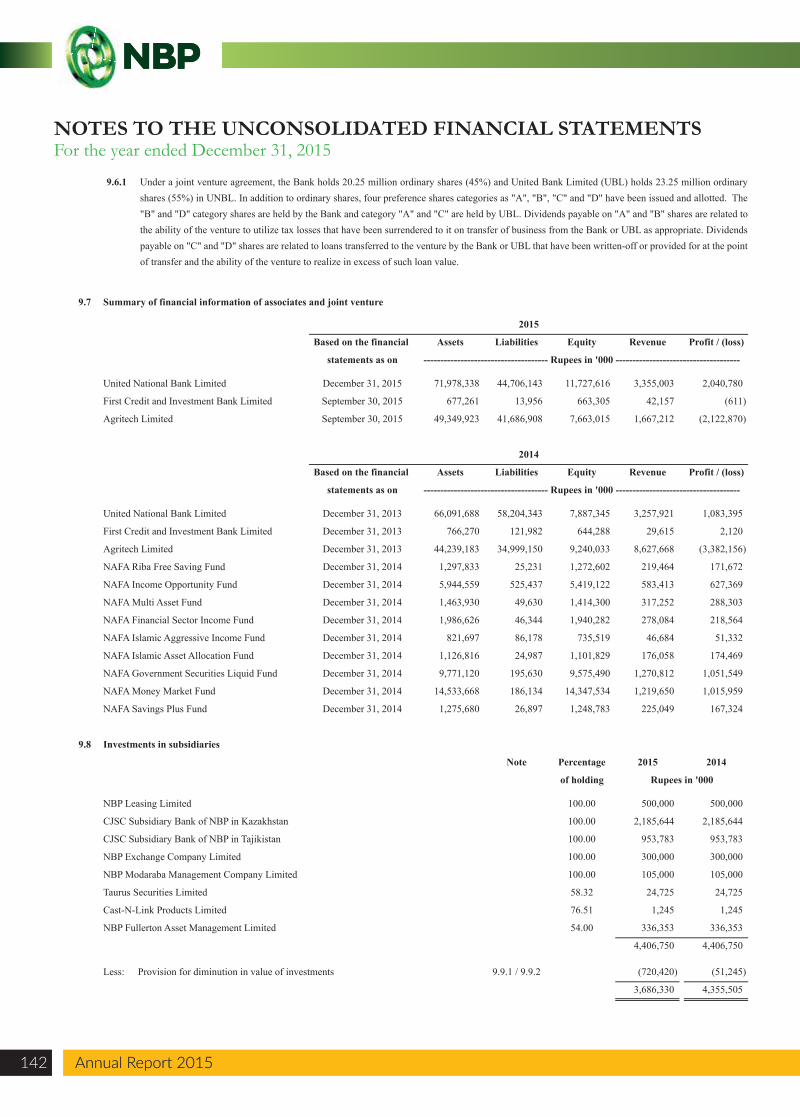
9.7 Summary of financial information of associates and joint venture
Assets Liabilities Equity Revenue Profit / (loss)
United National Bank Limited 71,978,338 44,706,143 11,727,616 3,355,003 2,040,780
First Credit and Investment Bank Limited 677,261 13,956 663,305 42,157 (611)
Agritech Limited 49,349,923 41,686,908 7,663,015 1,667,212 (2,122,870)
Assets Liabilities Equity Revenue Profit / (loss)
United National Bank Limited 66,091,688 58,204,343 7,887,345 3,257,921 1,083,395
First Credit and Investment Bank Limited 766,270 121,982 644,288 29,615 2,120
Agritech Limited 44,239,183 34,999,150 9,240,033 8,627,668 (3,382,156)
NAFA Riba Free Saving Fund 1,297,833 25,231 1,272,602 219,464 171,672
NAFA Income Opportunity Fund 5,944,559 525,437 5,419,122 583,413 627,369
NAFA Multi Asset Fund 1,463,930 49,630 1,414,300 317,252 288,303
NAFA Financial Sector Income Fund 1,986,626 46,344 1,940,282 278,084 218,564
NAFA Islamic Aggressive Income Fund 821,697 86,178 735,519 46,684 51,332
NAFA Islamic Asset Allocation Fund 1,126,816 24,987 1,101,829 176,058 174,469
NAFA Government Securities Liquid Fund 9,771,120 195,630 9,575,490 1,270,812 1,051,549
NAFA Money Market Fund 14,533,668 186,134 14,347,534 1,219,650 1,015,959
NAFA Savings Plus Fund 1,275,680 26,897 1,248,783 225,049 167,324
9.8 Investments in subsidiaries
Note Percentage 2015 2014
of holding Rupees in '000
NBP Leasing Limited 100.00 500,000 500,000
CJSC Subsidiary Bank of NBP in Kazakhstan 100.00 2,185,644 2,185,644
CJSC Subsidiary Bank of NBP in Tajikistan 100.00 953,783 953,783
NBP Exchange Company Limited 100.00 300,000 300,000
NBP Modaraba Management Company Limited 100.00 105,000 105,000
Taurus Securities Limited 58.32 24,725 24,725
Cast-N-Link Products Limited 76.51 1,245 1,245
NBP Fullerton Asset Management Limited 54.00 336,353 336,353
4,406,750 4,406,750
Less: Provision for diminution in value of investments 9.9.1 / 9.9.2 (720,420) (51,245)
3,686,330 4,355,505
2014
December 31, 2014
Based on the financial
statements as on
December 31, 2014
December 31, 2014
December 31, 2014
December 31, 2014
December 31, 2014
December 31, 2014
------------------------------------- Rupees in '000 -------------------------------------
December 31, 2013
December 31, 2013
December 31, 2013
December 31, 2014
December 31, 2014
2015
Based on the financial
statements as on ------------------------------------- Rupees in '000 -------------------------------------
December 31, 2015
September 30, 2015
September 30, 2015
9.6.1 Under a joint venture agreement, the Bank holds 20.25 million ordinary shares (45%) and United Bank Limited (UBL) holds 23.25 million ordinary shares (55%) in UNBL. In addition to ordinary shares, four preference shares categories as "A", "B", "C" and "D" have been issued and allotted. The "B" and "D" category shares are held by the Bank and category "A" and "C" are held by UBL. Dividends payable on "A" and "B" shares are related to the ability of the venture to utilize tax losses that have been surrendered to it on transfer of business from the Bank or UBL as appropriate. Dividends payable on "C" and "D" shares are related to loans transferred to the venture by the Bank or UBL that have been written-off or provided for at the point of transfer and the ability of the venture to realize in excess of such loan value.
NOTES TO THE UNCONSOLIDATED FINANCIAL STATEMENTSFor the year ended December 31, 2015
Annual Report 2015142 Annual Report 2015
Annual Report 2015 143
National Bank of Pakistan
NOTES TO THE UNCONSOLIDATED FINANCIAL STATEMENTSFor the year ended December 31, 2015
2015 2014Note Rupees in '000
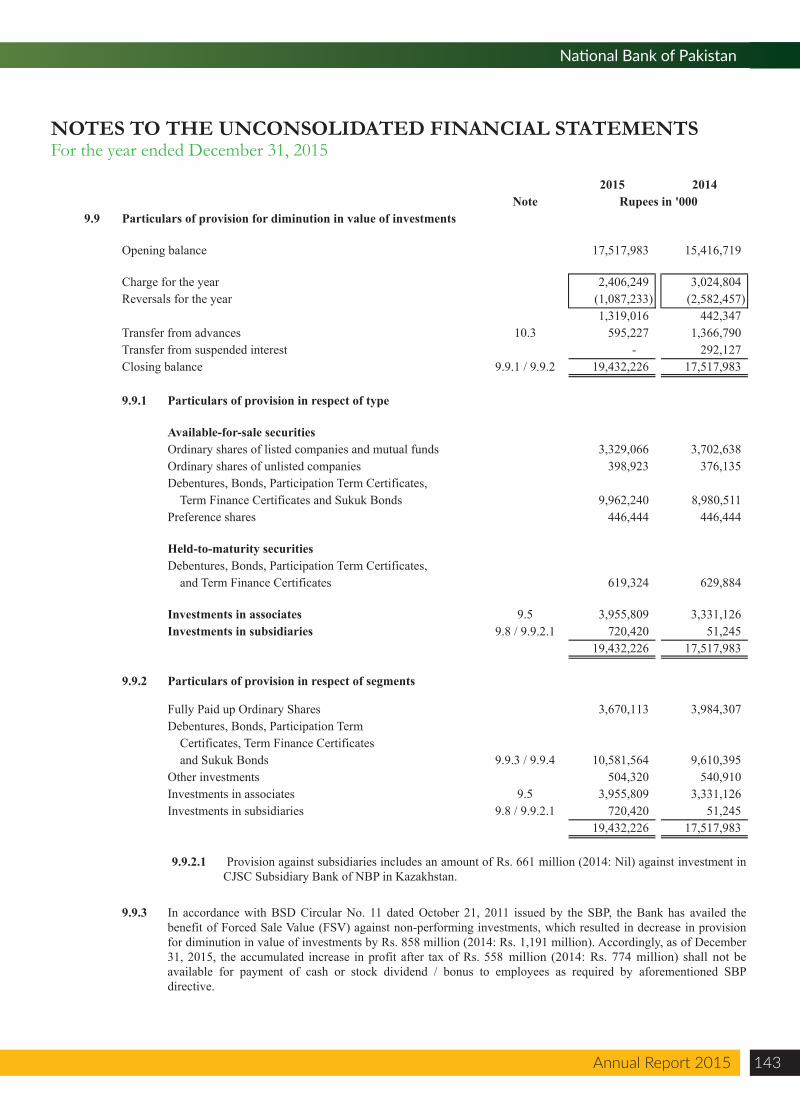
9.9 Particulars of provision for diminution in value of investments
Opening balance 17,517,983 15,416,719
Charge for the year 2,406,249 3,024,804 Reversals for the year (1,087,233) (2,582,457)
1,319,016 442,347 Transfer from advances 10.3 595,227 1,366,790 Transfer from suspended interest - 292,127 Closing balance 9.9.1 / 9.9.2 19,432,226 17,517,983
9.9.1 Particulars of provision in respect of type
Available-for-sale securitiesOrdinary shares of listed companies and mutual funds 3,329,066 3,702,638 Ordinary shares of unlisted companies 398,923 376,135 Debentures, Bonds, Participation Term Certificates,
Term Finance Certificates and Sukuk Bonds 9,962,240 8,980,511 Preference shares 446,444 446,444
Held-to-maturity securitiesDebentures, Bonds, Participation Term Certificates,
and Term Finance Certificates 619,324 629,884
Investments in associates 9.5 3,955,809 3,331,126 Investments in subsidiaries 9.8 / 9.9.2.1 720,420 51,245
19,432,226 17,517,983 -
9.9.2 Particulars of provision in respect of segments
Fully Paid up Ordinary Shares 3,670,113 3,984,307 Debentures, Bonds, Participation Term
Certificates, Term Finance Certificates and Sukuk Bonds 9.9.3 / 9.9.4 10,581,564 9,610,395
Other investments 504,320 540,910 Investments in associates 9.5 3,955,809 3,331,126 Investments in subsidiaries 9.8 / 9.9.2.1 720,420 51,245
19,432,226 17,517,983
9.9.2.1
9.9.3 In accordance with BSD Circular No. 11 dated October 21, 2011 issued by the SBP, the Bank has availed thebenefit of Forced Sale Value (FSV) against non-performing investments, which resulted in decrease in provisionfor diminution in value of investments by Rs. 858 million (2014: Rs. 1,191 million). Accordingly, as of December31, 2015, the accumulated increase in profit after tax of Rs. 558 million (2014: Rs. 774 million) shall not beavailable for payment of cash or stock dividend / bonus to employees as required by aforementioned SBPdirective.
Provision against subsidiaries includes an amount of Rs. 661 million (2014: Nil) against investment inCJSC Subsidiary Bank of NBP in Kazakhstan.
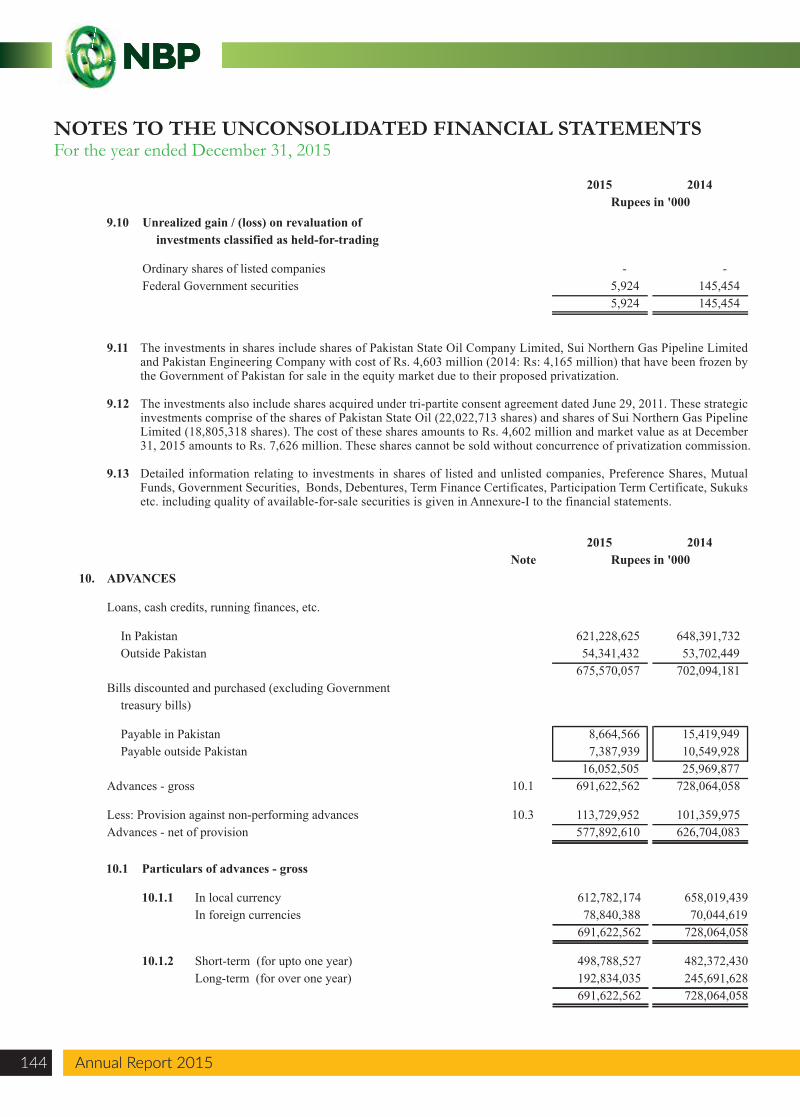
9.11 The investments in shares include shares of Pakistan State Oil Company Limited, Sui Northern Gas Pipeline Limited and Pakistan Engineering Company with cost of Rs. 4,603 million (2014: Rs: 4,165 million) that have been frozen by the Government of Pakistan for sale in the equity market due to their proposed privatization.
9.12 The investments also include shares acquired under tri-partite consent agreement dated June 29, 2011. These strategic investments comprise of the shares of Pakistan State Oil (22,022,713 shares) and shares of Sui Northern Gas Pipeline Limited (18,805,318 shares). The cost of these shares amounts to Rs. 4,602 million and market value as at December 31, 2015 amounts to Rs. 7,626 million. These shares cannot be sold without concurrence of privatization commission.
9.13 Detailed information relating to investments in shares of listed and unlisted companies, Preference Shares, Mutual Funds, Government Securities, Bonds, Debentures, Term Finance Certificates, Participation Term Certificate, Sukuks etc. including quality of available-for-sale securities is given in Annexure-I to the financial statements.
2015 2014Rupees in '000
9.10 Unrealized gain / (loss) on revaluation of investments classified as held-for-trading
Ordinary shares of listed companies - - Federal Government securities 5,924 145,454
5,924 145,454
2015 2014Note Rupees in '000
10. ADVANCES
Loans, cash credits, running finances, etc.
In Pakistan 621,228,625 648,391,732 Outside Pakistan 54,341,432 53,702,449
675,570,057 702,094,181 Bills discounted and purchased (excluding Government
treasury bills)
Payable in Pakistan 8,664,566 15,419,949 Payable outside Pakistan 7,387,939 10,549,928
16,052,505 25,969,877 Advances - gross 10.1 691,622,562 728,064,058
Less: Provision against non-performing advances 10.3 113,729,952 101,359,975 Advances - net of provision 577,892,610 626,704,083
10.1 Particulars of advances - gross
10.1.1 In local currency 612,782,174 658,019,439 In foreign currencies 78,840,388 70,044,619
691,622,562 728,064,058
10.1.2 Short-term (for upto one year) 498,788,527 482,372,430 Long-term (for over one year) 192,834,035 245,691,628
691,622,562 728,064,058
NOTES TO THE UNCONSOLIDATED FINANCIAL STATEMENTSFor the year ended December 31, 2015
Annual Report 2015144 Annual Report 2015
Annual Report 2015 145
National Bank of Pakistan
NOTES TO THE UNCONSOLIDATED FINANCIAL STATEMENTSFor the year ended December 31, 2015
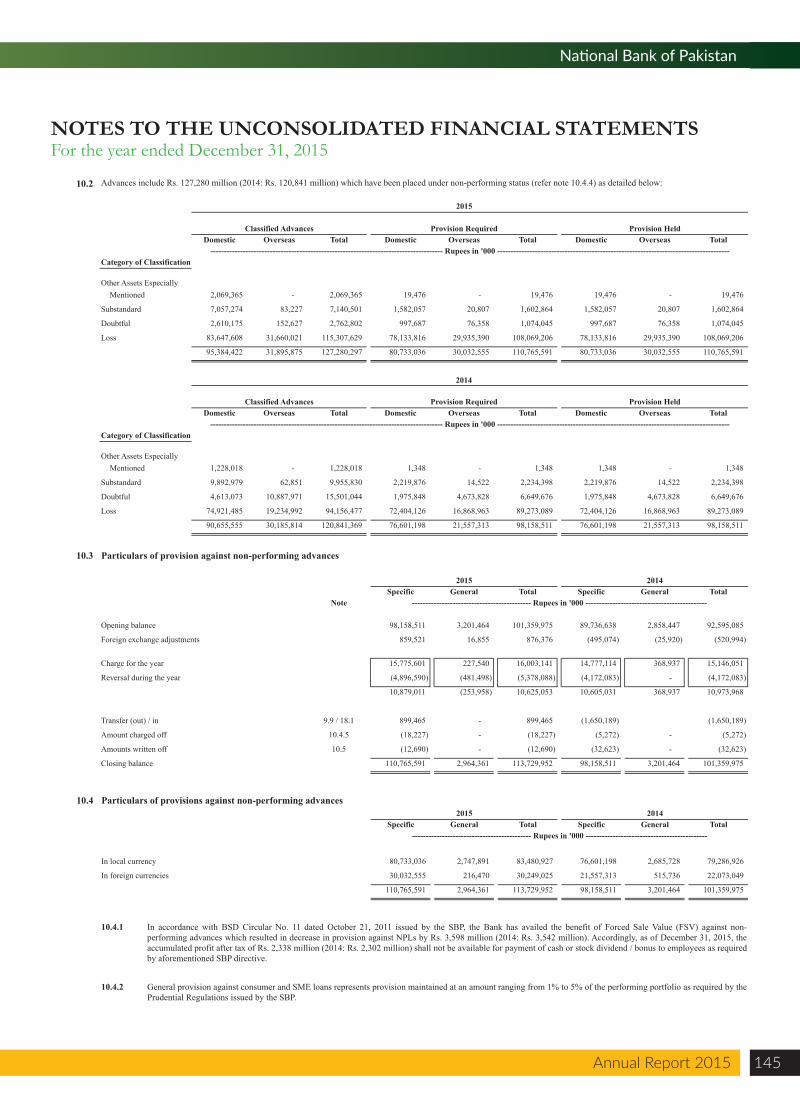
10.2 Advances include Rs. 127,280 million (2014: Rs. 120,841 million) which have been placed under non-performing status (refer note 10.4.4) as detailed below:
2015
Classified Advances Provision Required Provision HeldDomestic Overseas Total Domestic Overseas Total Domestic Overseas Total
Category of Classification
Other Assets Especially Mentioned 2,069,365 - 2,069,365 19,476 - 19,476 19,476 - 19,476
Substandard 7,057,274 83,227 7,140,501 1,582,057 20,807 1,602,864 1,582,057 20,807 1,602,864
Doubtful 2,610,175 152,627 2,762,802 997,687 76,358 1,074,045 997,687 76,358 1,074,045
Loss 83,647,608 31,660,021 115,307,629 78,133,816 29,935,390 108,069,206 78,133,816 29,935,390 108,069,206
95,384,422 31,895,875 127,280,297 80,733,036 30,032,555 110,765,591 80,733,036 30,032,555 110,765,591
2014
Classified Advances Provision Required Provision HeldDomestic Overseas Total Domestic Overseas Total Domestic Overseas Total
Category of Classification
Other Assets EspeciallyMentioned 1,228,018 - 1,228,018 1,348 - 1,348 1,348 - 1,348
Substandard 9,892,979 62,851 9,955,830 2,219,876 14,522 2,234,398 2,219,876 14,522 2,234,398
Doubtful 4,613,073 10,887,971 15,501,044 1,975,848 4,673,828 6,649,676 1,975,848 4,673,828 6,649,676
Loss 74,921,485 19,234,992 94,156,477 72,404,126 16,868,963 89,273,089 72,404,126 16,868,963 89,273,089
90,655,555 30,185,814 120,841,369 76,601,198 21,557,313 98,158,511 76,601,198 21,557,313 98,158,511
10.3 Particulars of provision against non-performing advances
2015 2014Specific General Total Specific General Total
Note
Opening balance 98,158,511 3,201,464 101,359,975 89,736,638 2,858,447 92,595,085
Foreign exchange adjustments 859,521 16,855 876,376 (495,074) (25,920) (520,994)
Charge for the year 15,775,601 227,540 16,003,141 14,777,114 368,937 15,146,051
Reversal during the year (4,896,590) (481,498) (5,378,088) (4,172,083) - (4,172,083)
10,879,011 (253,958) 10,625,053 10,605,031 368,937 10,973,968
Transfer (out) / in 9.9 / 18.1 899,465 - 899,465 (1,650,189) (1,650,189)
Amount charged off 10.4.5 (18,227) - (18,227) (5,272) - (5,272)
Amounts written off 10.5 (12,690) - (12,690) (32,623) - (32,623)
Closing balance 110,765,591 2,964,361 113,729,952 98,158,511 3,201,464 101,359,975
-------------------------------------------------------------------------------------- Rupees in '000 --------------------------------------------------------------------------------------
-------------------------------------------- Rupees in '000 ---------------------------------------------
-------------------------------------------------------------------------------------- Rupees in '000 --------------------------------------------------------------------------------------
10.4 Particulars of provisions against non-performing advances2015 2014
Specific General Total Specific General Total
In local currency 80,733,036 2,747,891 83,480,927 76,601,198 2,685,728 79,286,926
In foreign currencies 30,032,555 216,470 30,249,025 21,557,313 515,736 22,073,049
110,765,591 2,964,361 113,729,952 98,158,511 3,201,464 101,359,975
10.4.1
10.4.2
In accordance with BSD Circular No. 11 dated October 21, 2011 issued by the SBP, the Bank has availed the benefit of Forced Sale Value (FSV) against non-performing advances which resulted in decrease in provision against NPLs by Rs. 3,598 million (2014: Rs. 3,542 million). Accordingly, as of December 31, 2015, theaccumulated profit after tax of Rs. 2,338 million (2014: Rs. 2,302 million) shall not be available for payment of cash or stock dividend / bonus to employees as requiredby aforementioned SBP directive.
General provision against consumer and SME loans represents provision maintained at an amount ranging from 1% to 5% of the performing portfolio as required by thePrudential Regulations issued by the SBP.
-------------------------------------------- Rupees in '000 ---------------------------------------------
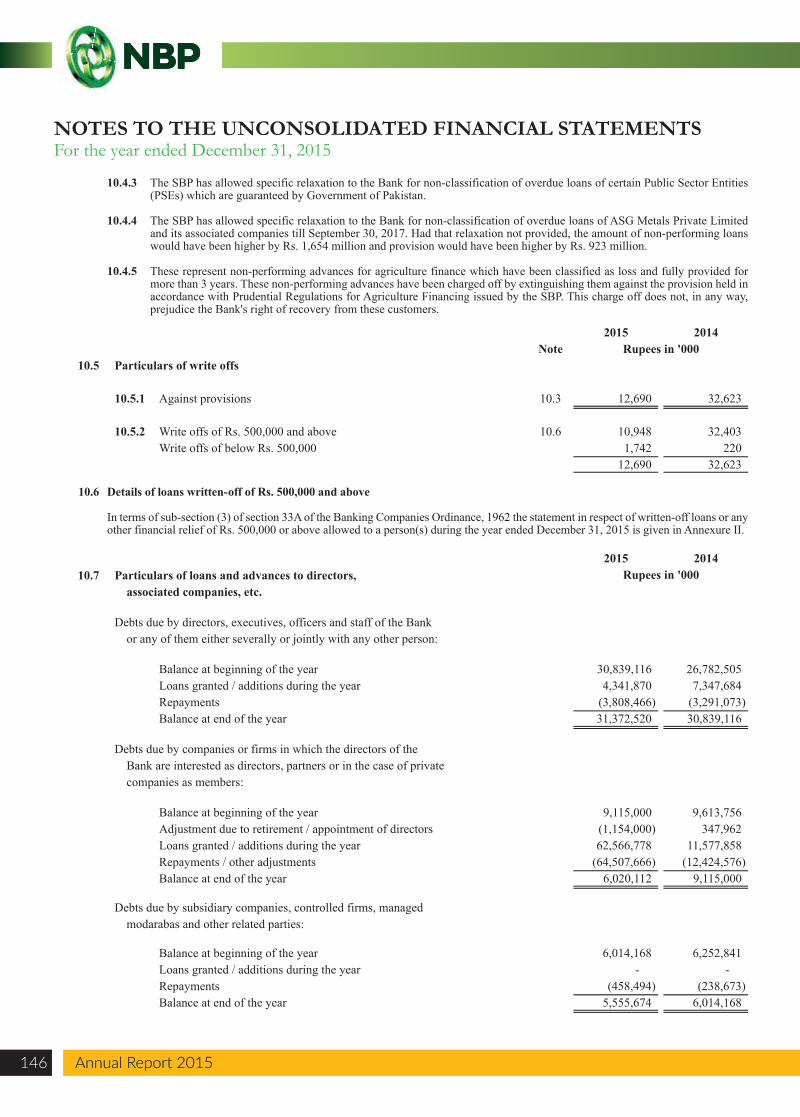
10.4.3 The SBP has allowed specific relaxation to the Bank for non-classification of overdue loans of certain Public Sector Entities (PSEs) which are guaranteed by Government of Pakistan.
10.4.4 The SBP has allowed specific relaxation to the Bank for non-classification of overdue loans of ASG Metals Private Limited and its associated companies till September 30, 2017. Had that relaxation not provided, the amount of non-performing loans would have been higher by Rs. 1,654 million and provision would have been higher by Rs. 923 million.
10.4.5 These represent non-performing advances for agriculture finance which have been classified as loss and fully provided for more than 3 years. These non-performing advances have been charged off by extinguishing them against the provision held in accordance with Prudential Regulations for Agriculture Financing issued by the SBP. This charge off does not, in any way, prejudice the Bank's right of recovery from these customers.
10.6 Details of loans written-off of Rs. 500,000 and above
In terms of sub-section (3) of section 33A of the Banking Companies Ordinance, 1962 the statement in respect of written-off loans or any other financial relief of Rs. 500,000 or above allowed to a person(s) during the year ended December 31, 2015 is given in Annexure II.
2015 2014Note Rupees in '000
10.5 Particulars of write offs
10.5.1 Against provisions 10.3 12,690 32,623
10.5.2 Write offs of Rs. 500,000 and above 10.6 10,948 32,403 Write offs of below Rs. 500,000 1,742 220
12,690 32,623
2015 2014Rupees in '00010.7 Particulars of loans and advances to directors,
associated companies, etc.
Debts due by directors, executives, officers and staff of the Bank or any of them either severally or jointly with any other person:
Balance at beginning of the year 30,839,116 26,782,505 Loans granted / additions during the year 4,341,870 7,347,684 Repayments (3,808,466) (3,291,073) Balance at end of the year 31,372,520 30,839,116
Debts due by companies or firms in which the directors of the Bank are interested as directors, partners or in the case of private companies as members:
Balance at beginning of the year 9,115,000 9,613,756 Adjustment due to retirement / appointment of directors (1,154,000) 347,962 Loans granted / additions during the year 62,566,778 11,577,858 Repayments / other adjustments (64,507,666) (12,424,576) Balance at end of the year 6,020,112 9,115,000
Debts due by subsidiary companies, controlled firms, managed modarabas and other related parties:
Balance at beginning of the year 6,014,168 6,252,841 Loans granted / additions during the year - - Repayments (458,494) (238,673) Balance at end of the year 5,555,674 6,014,168
NOTES TO THE UNCONSOLIDATED FINANCIAL STATEMENTSFor the year ended December 31, 2015
Annual Report 2015146 Annual Report 2015
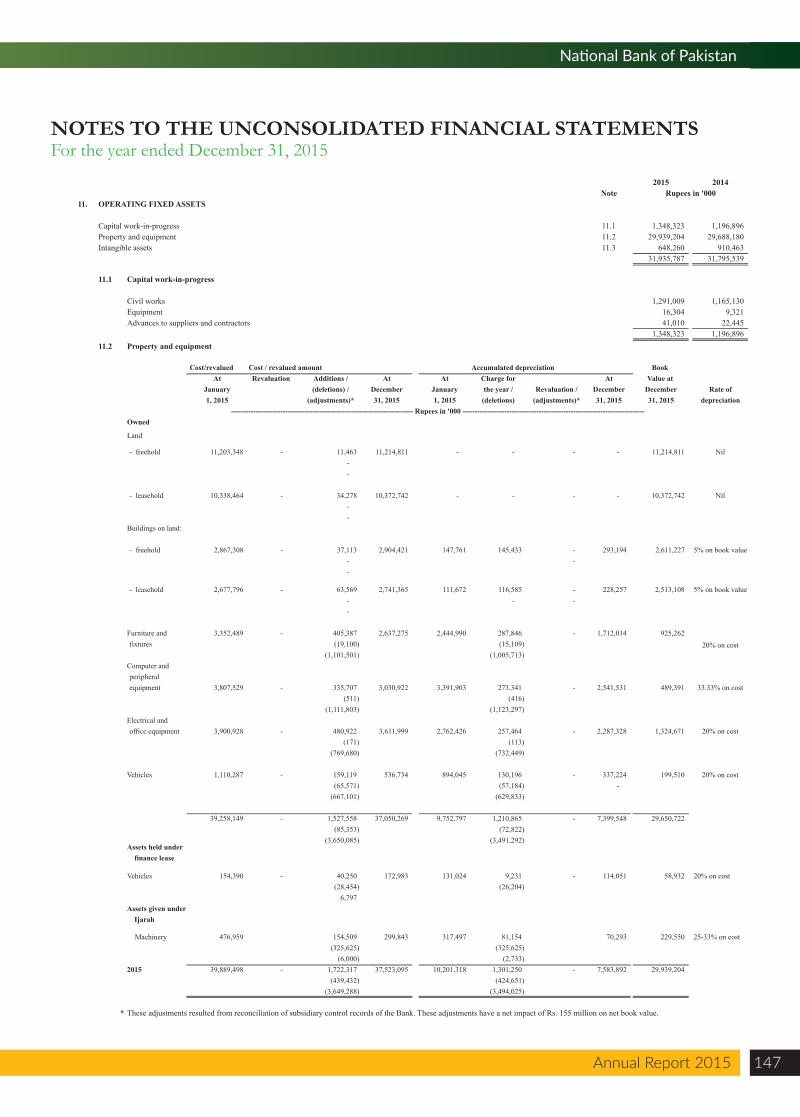
Annual Report 2015 147
National Bank of Pakistan
NOTES TO THE UNCONSOLIDATED FINANCIAL STATEMENTSFor the year ended December 31, 2015
2015 2014Note Rupees in '000
11. OPERATING FIXED ASSETS
Capital work-in-progress 11.1 1,348,323 1,196,896 Property and equipment 11.2 29,939,204 29,688,180 Intangible assets 11.3 648,260 910,463
31,935,787 31,795,539
11.1 Capital work-in-progress
Civil works 1,291,009 1,165,130 Equipment 16,304 9,321 Advances to suppliers and contractors 41,010 22,445
1,348,323 1,196,896 11.2 Property and equipment
Cost/revalued amount
Cost / revalued amount Accumulated depreciation Book At Revaluation Additions / At At Charge for At Value at
January (deletions) / December January the year / Revaluation / December December Rate of1, 2015 (adjustments)* 31, 2015 1, 2015 (deletions) (adjustments)* 31, 2015 31, 2015 depreciation
Owned
Land
- freehold 11,203,348 - 11,463 11,214,811 - - - - 11,214,811 Nil- -
- leasehold 10,338,464 - 34,278 10,372,742 - - - - 10,372,742 Nil- -
Buildings on land:
- freehold 2,867,308 - 37,113 2,904,421 147,761 145,433 - 293,194 2,611,227 5% on book value- - -
- leasehold 2,677,796 - 63,569 2,741,365 111,672 116,585 - 228,257 2,513,108 5% on book value- - - -
Furniture and 3,352,489 - 405,387 2,637,275 2,444,990 287,846 - 1,712,014 925,262 fixtures (19,100) (15,109)
(1,101,501) (1,005,713) Computer and peripheralequipment 3,807,529 - 335,707 3,030,922 3,391,903 273,341 - 2,541,531 489,391 33.33% on cost
(511) (416) (1,111,803) (1,123,297)
Electrical andoffice equipment 3,900,928 - 480,922 3,611,999 2,762,426 257,464 - 2,287,328 1,324,671 20% on cost
(171) (113) (769,680) (732,449)
Vehicles 1,110,287 - 159,119 536,734 894,045 130,196 - 337,224 199,510 20% on cost(65,571) (57,184) -
(667,101) (629,833)
39,258,149 - 1,527,558 37,050,269 9,752,797 1,210,865 - 7,399,548 29,650,722 (85,353) (72,822)
(3,650,085) (3,491,292) Assets held under finance lease
Vehicles 154,390 - 40,250 172,983 131,024 9,231 - 114,051 58,932 20% on cost(28,454) (26,204)
6,797 Assets given under Ijarah
Machinery 476,959 154,509 299,843 317,497 81,154 70,293 229,550 25-33% on cost(325,625) (325,625)
(6,000) (2,733) 2015 39,889,498 - 1,722,317 37,523,095 10,201,318 1,301,250 - 7,583,892 29,939,204
(439,432) (424,651) (3,649,288) (3,494,025)
* These adjustments resulted from reconciliation of subsidiary control records of the Bank. These adjustments have a net impact of Rs. 155 million on net book value.
-------------------------------------------------------------------------- Rupees in '000 --------------------------------------------------------------------------
20% on cost
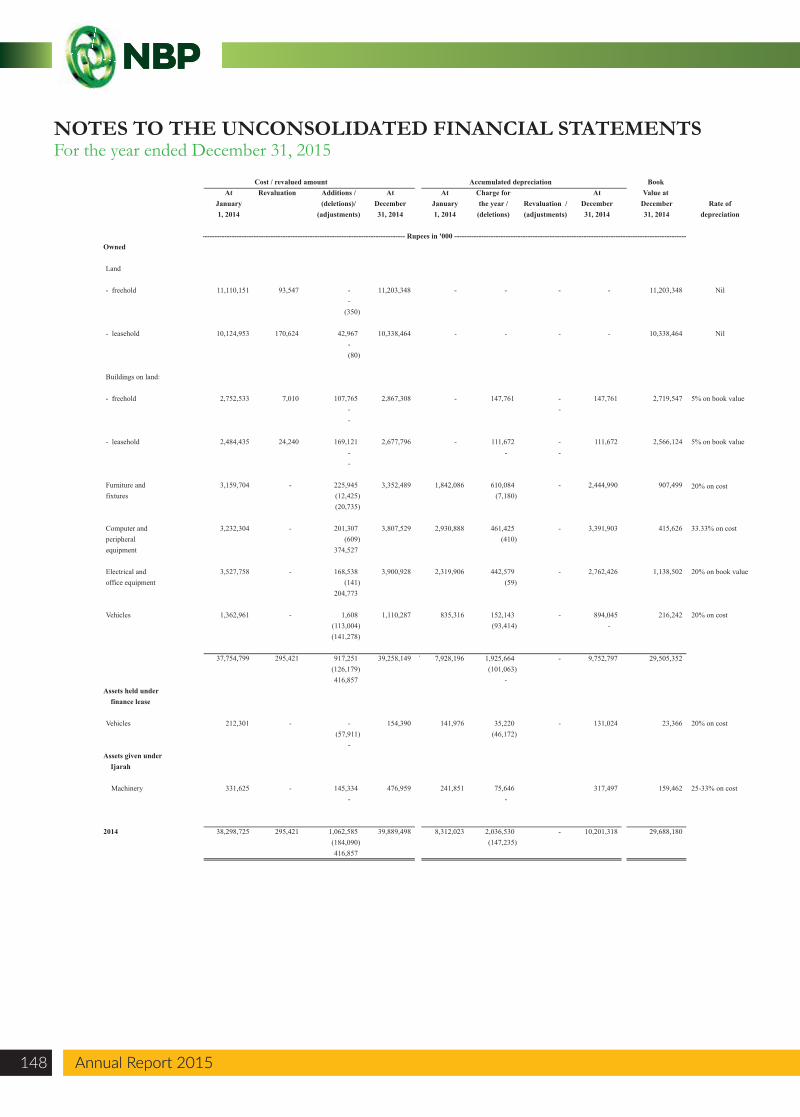
Cost / revalued amount Accumulated depreciation Book At Revaluation Additions / At At Charge for At Value at
January (deletions)/ December January the year / Revaluation / December December Rate of1, 2014 (adjustments) 31, 2014 1, 2014 (deletions) (adjustments) 31, 2014 31, 2014 depreciation
Owned
Land
- freehold 11,110,151 93,547 - 11,203,348 - - - - 11,203,348 Nil-
(350)
- leasehold 10,124,953 170,624 42,967 10,338,464 - - - - 10,338,464 Nil- (80)
Buildings on land:
- freehold 2,752,533 7,010 107,765 2,867,308 - 147,761 - 147,761 2,719,547 - - -
- leasehold 2,484,435 24,240 169,121 2,677,796 - 111,672 - 111,672 2,566,124 - - - -
Furniture and 3,159,704 - 225,945 3,352,489 1,842,086 610,084 - 2,444,990 907,499 20% on costfixtures (12,425) (7,180)
(20,735)
Computer and 3,232,304 - 201,307 3,807,529 2,930,888 461,425 - 3,391,903 415,626 33.33% on costperipheral (609) (410) equipment 374,527
Electrical and 3,527,758 - 168,538 3,900,928 2,319,906 442,579 - 2,762,426 1,138,502 20% on book valueoffice equipment (141) (59)
204,773
Vehicles 1,362,961 - 1,608 1,110,287 835,316 152,143 - 894,045 216,242 20% on cost(113,004) (93,414) - (141,278)
37,754,799 295,421 917,251 39,258,149 ` 7,928,196 1,925,664 - 9,752,797 29,505,352 (126,179) (101,063) 416,857 -
Assets held under finance lease
Vehicles 212,301 - - 154,390 141,976 35,220 - 131,024 23,366 20% on cost(57,911) (46,172)
- Assets given under Ijarah
Machinery 331,625 - 145,334 476,959 241,851 75,646 317,497 159,462 25-33% on cost- -
2014 38,298,725 295,421 1,062,585 39,889,498 8,312,023 2,036,530 - 10,201,318 29,688,180 (184,090) (147,235) 416,857
------------------------------------------------------------------------------------------------ Rupees in '000 ------------------------------------------------------------------------------------------------------------
5% on book value
5% on book value
NOTES TO THE UNCONSOLIDATED FINANCIAL STATEMENTSFor the year ended December 31, 2015
Annual Report 2015148 Annual Report 2015
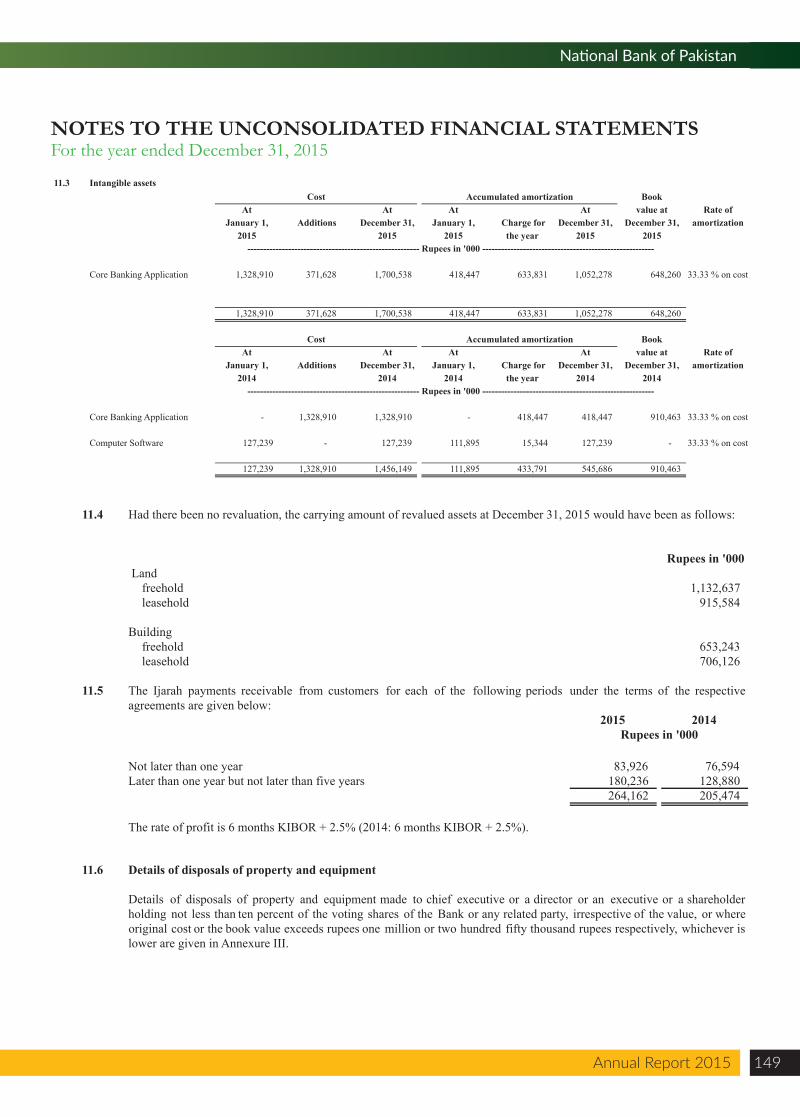
Annual Report 2015 149
National Bank of Pakistan
NOTES TO THE UNCONSOLIDATED FINANCIAL STATEMENTSFor the year ended December 31, 2015
11.3 Intangible assetsBook
At At At At value at Rate ofJanuary 1, December 31, January 1, Charge for December 31, December 31, amortization
2015 2015 2015 the year 2015 2015
Core Banking Application 1,328,910 371,628 1,700,538 418,447 633,831 1,052,278 648,260 33.33 % on cost
1,328,910 371,628 1,700,538 418,447 633,831 1,052,278 648,260
BookAt At At At value at Rate of
January 1, December 31, January 1, Charge for December 31, December 31, amortization2014 2014 2014 the year 2014 2014
Core Banking Application - 1,328,910 1,328,910 - 418,447 418,447 910,463 33.33 % on cost
Computer Software 127,239 - 127,239 111,895 15,344 127,239 - 33.33 % on cost
127,239 1,328,910 1,456,149 111,895 433,791 545,686 910,463
Cost Accumulated amortization
Additions
Additions
------------------------------------------------------- Rupees in '000 -------------------------------------------------------
------------------------------------------------------- Rupees in '000 -------------------------------------------------------
Cost Accumulated amortization
11.4
Rupees in '000 Land
freehold 1,132,637 leasehold 915,584
Buildingfreehold 653,243 leasehold 706,126
Had there been no revaluation, the carrying amount of revalued assets at December 31, 2015 would have been as follows:
11.5
2015 2014Rupees in '000
Not later than one year 83,926 76,594 Later than one year but not later than five years 180,236 128,880
264,162 205,474
11.6 Details of disposals of property and equipment
The rate of profit is 6 months KIBOR + 2.5% (2014: 6 months KIBOR + 2.5%).
The Ijarah payments receivable from customers for each of the following periods under the terms of the respectiveagreements are given below:
Details of disposals of property and equipment made to chief executive or a director or an executive or a shareholderholding not less than ten percent of the voting shares of the Bank or any related party, irrespective of the value, or whereoriginal cost or the book value exceeds rupees one million or two hundred fifty thousand rupees respectively, whichever islower are given in Annexure III.
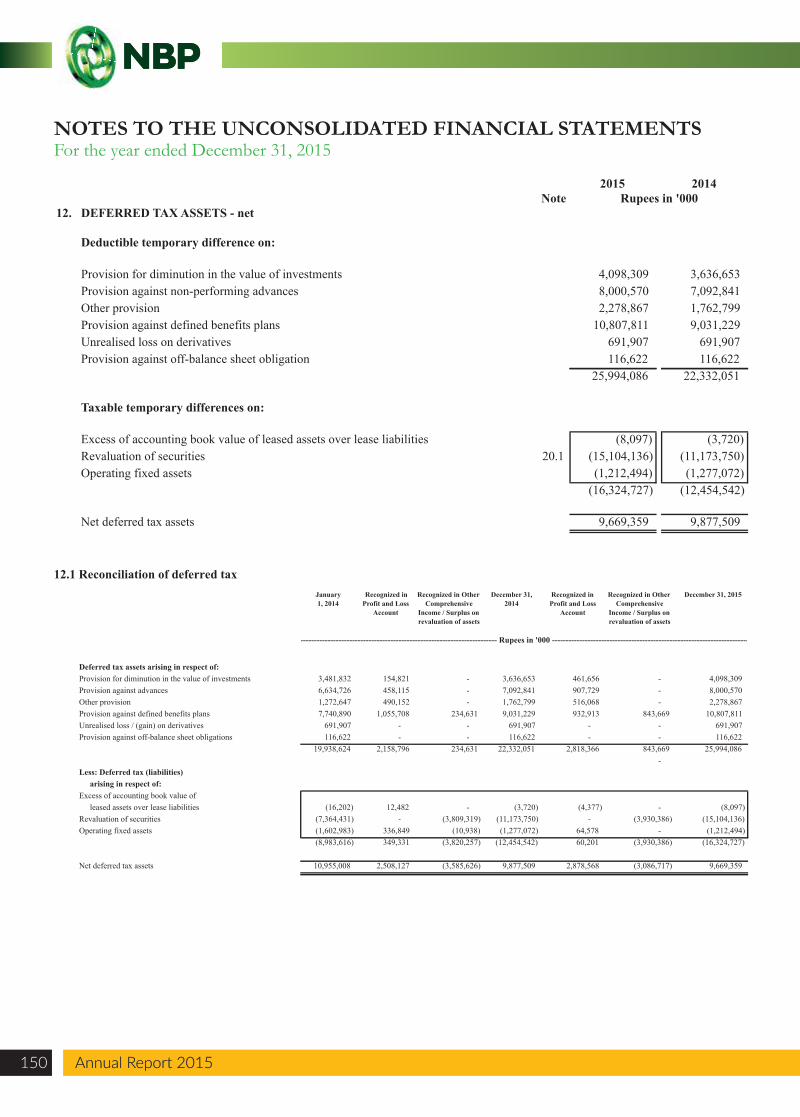
2015 2014Note Rupees in '000
12. DEFERRED TAX ASSETS - net
Deductible temporary difference on:
Provision for diminution in the value of investments 4,098,309 3,636,653 Provision against non-performing advances 8,000,570 7,092,841 Other provision 2,278,867 1,762,799 Provision against defined benefits plans 10,807,811 9,031,229 Unrealised loss on derivatives 691,907 691,907 Provision against off-balance sheet obligation 116,622 116,622
25,994,086 22,332,051
Taxable temporary differences on:
Excess of accounting book value of leased assets over lease liabilities (8,097) (3,720) Revaluation of securities 20.1 (15,104,136) (11,173,750) Operating fixed assets (1,212,494) (1,277,072)
(16,324,727) (12,454,542)
Net deferred tax assets 9,669,359 9,877,509
12.1 Reconciliation of deferred taxJanuary 1, 2014
Recognized in Profit and Loss
Account
Recognized in Other Comprehensive
Income / Surplus on revaluation of assets
December 31, 2014
Recognized in Profit and Loss
Account
Recognized in Other Comprehensive
Income / Surplus on revaluation of assets
December 31, 2015
Deferred tax assets arising in respect of:Provision for diminution in the value of investments 3,481,832 154,821 - 3,636,653 461,656 - 4,098,309 Provision against advances 6,634,726 458,115 - 7,092,841 907,729 - 8,000,570 Other provision 1,272,647 490,152 - 1,762,799 516,068 - 2,278,867 Provision against defined benefits plans 7,740,890 1,055,708 234,631 9,031,229 932,913 843,669 10,807,811 Unrealised loss / (gain) on derivatives 691,907 - - 691,907 - - 691,907 Provision against off-balance sheet obligations 116,622 - - 116,622 - - 116,622
19,938,624 2,158,796 234,631 22,332,051 2,818,366 843,669 25,994,086 -
Less: Deferred tax (liabilities)arising in respect of:
Excess of accounting book value ofleased assets over lease liabilities (16,202) 12,482 - (3,720) (4,377) - (8,097)
Revaluation of securities (7,364,431) - (3,809,319) (11,173,750) - (3,930,386) (15,104,136) Operating fixed assets (1,602,983) 336,849 (10,938) (1,277,072) 64,578 - (1,212,494)
(8,983,616) 349,331 (3,820,257) (12,454,542) 60,201 (3,930,386) (16,324,727)
Net deferred tax assets 10,955,008 2,508,127 (3,585,626) 9,877,509 2,878,568 (3,086,717) 9,669,359
------------------------------------------------------------------------ Rupees in '000 ------------------------------------------------------------------------
NOTES TO THE UNCONSOLIDATED FINANCIAL STATEMENTSFor the year ended December 31, 2015
Annual Report 2015150 Annual Report 2015
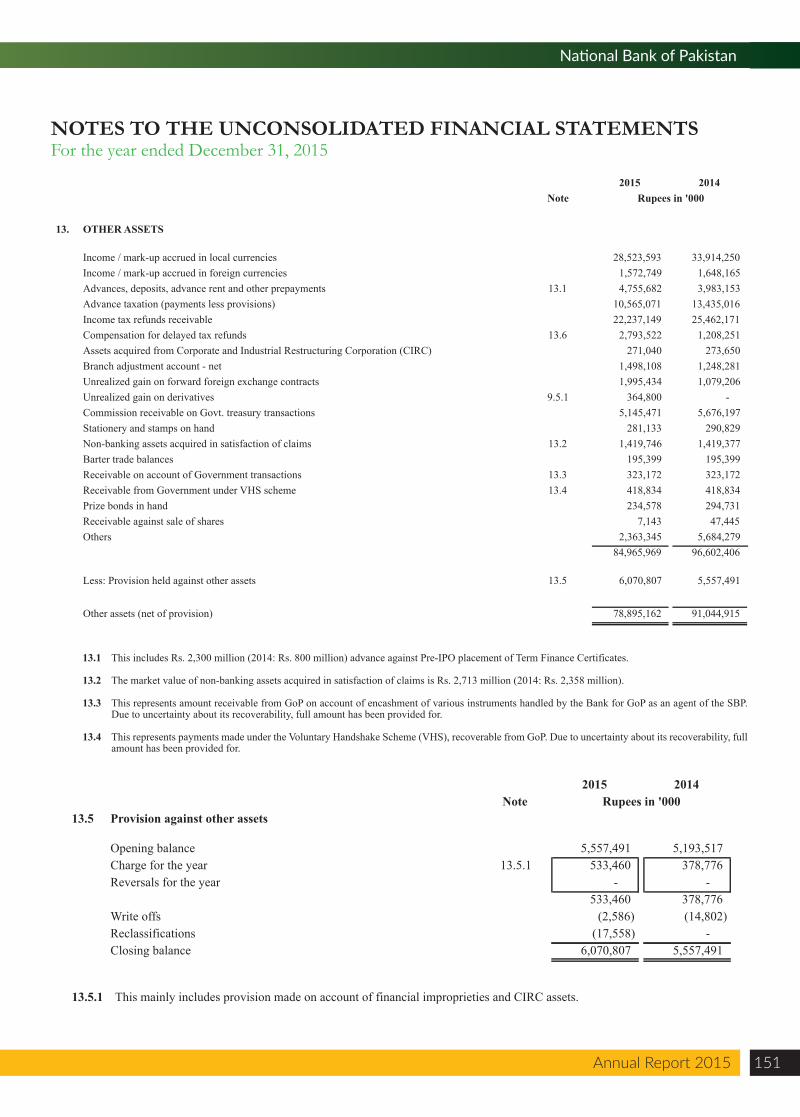
Annual Report 2015 151
National Bank of Pakistan
NOTES TO THE UNCONSOLIDATED FINANCIAL STATEMENTSFor the year ended December 31, 2015
2015 2014Note Rupees in '000
13. OTHER ASSETS
Income / mark-up accrued in local currencies 28,523,593 33,914,250 Income / mark-up accrued in foreign currencies 1,572,749 1,648,165 Advances, deposits, advance rent and other prepayments 13.1 4,755,682 3,983,153 Advance taxation (payments less provisions) 10,565,071 13,435,016 Income tax refunds receivable 22,237,149 25,462,171 Compensation for delayed tax refunds 13.6 2,793,522 1,208,251 Assets acquired from Corporate and Industrial Restructuring Corporation (CIRC) 271,040 273,650 Branch adjustment account - net 1,498,108 1,248,281 Unrealized gain on forward foreign exchange contracts 1,995,434 1,079,206 Unrealized gain on derivatives 9.5.1 364,800 - Commission receivable on Govt. treasury transactions 5,145,471 5,676,197 Stationery and stamps on hand 281,133 290,829 Non-banking assets acquired in satisfaction of claims 13.2 1,419,746 1,419,377 Barter trade balances 195,399 195,399 Receivable on account of Government transactions 13.3 323,172 323,172 Receivable from Government under VHS scheme 13.4 418,834 418,834 Prize bonds in hand 234,578 294,731 Receivable against sale of shares 7,143 47,445 Others 2,363,345 5,684,279
84,965,969 96,602,406
Less: Provision held against other assets 13.5 6,070,807 5,557,491
Other assets (net of provision) 78,895,162 91,044,915
13.1 This includes Rs. 2,300 million (2014: Rs. 800 million) advance against Pre-IPO placement of Term Finance Certificates.
13.2 The market value of non-banking assets acquired in satisfaction of claims is Rs. 2,713 million (2014: Rs. 2,358 million).
13.3 This represents amount receivable from GoP on account of encashment of various instruments handled by the Bank for GoP as an agent of the SBP. Due to uncertainty about its recoverability, full amount has been provided for.
13.4 This represents payments made under the Voluntary Handshake Scheme (VHS), recoverable from GoP. Due to uncertainty about its recoverability, full amount has been provided for.
2015 2014Note Rupees in '000
13.5 Provision against other assets
Opening balance 5,557,491 5,193,517 Charge for the year 13.5.1 533,460 378,776 Reversals for the year - -
533,460 378,776 Write offs (2,586) (14,802) Reclassifications (17,558) - Closing balance 6,070,807 5,557,491
13.5.1 This mainly includes provision made on account of financial improprieties and CIRC assets.
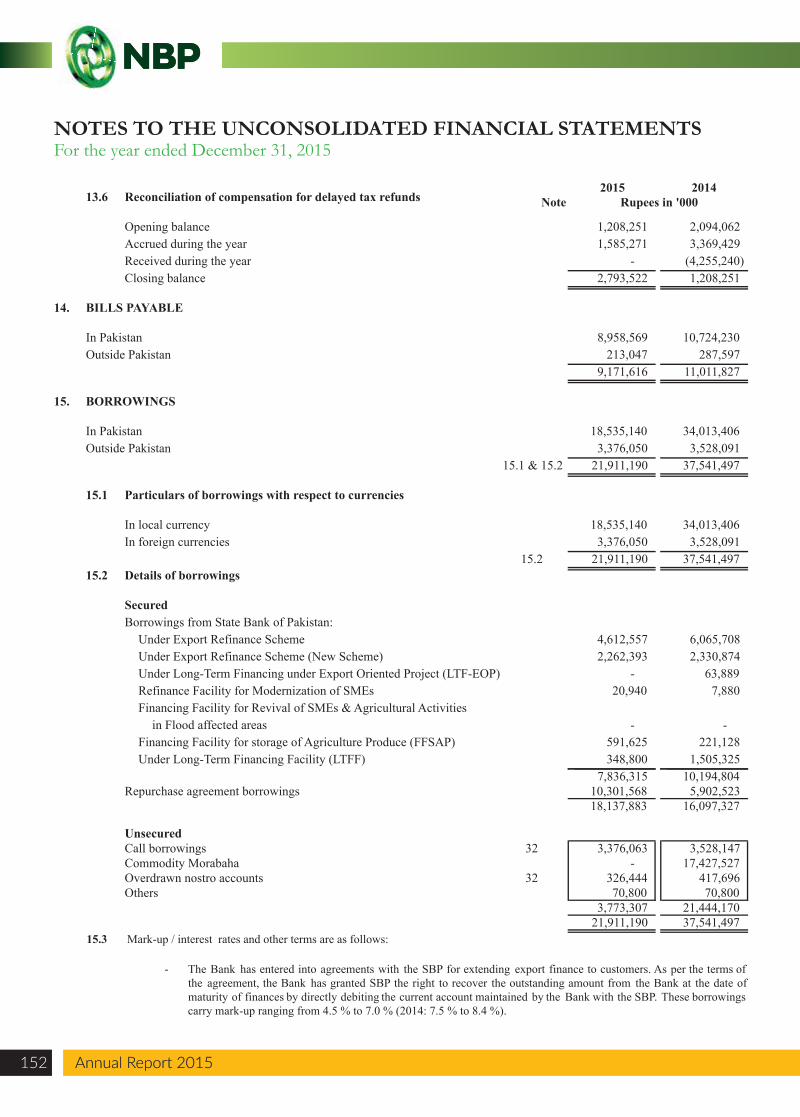
13.6 Reconciliation of compensation for delayed tax refunds
Opening balance 1,208,251 2,094,062 Accrued during the year 1,585,271 3,369,429 Received during the year - (4,255,240) Closing balance 2,793,522 1,208,251
14. BILLS PAYABLE
In Pakistan 8,958,569 10,724,230 Outside Pakistan 213,047 287,597
9,171,616 11,011,827
15. BORROWINGS
In Pakistan 18,535,140 34,013,406 Outside Pakistan 3,376,050 3,528,091
15.1 & 15.2 21,911,190 37,541,497
15.1 Particulars of borrowings with respect to currencies
In local currency 18,535,140 34,013,406 In foreign currencies 3,376,050 3,528,091
15.2 21,911,190 37,541,497 15.2 Details of borrowings
SecuredBorrowings from State Bank of Pakistan:
Under Export Refinance Scheme 4,612,557 6,065,708 Under Export Refinance Scheme (New Scheme) 2,262,393 2,330,874 Under Long-Term Financing under Export Oriented Project (LTF-EOP) - 63,889 Refinance Facility for Modernization of SMEs 20,940 7,880 Financing Facility for Revival of SMEs & Agricultural Activities
-
in Flood affected areas - Financing Facility for storage of Agriculture Produce (FFSAP) 591,625 221,128 Under Long-Term Financing Facility (LTFF) 348,800 1,505,325
7,836,315 10,194,804 Repurchase agreement borrowings 10,301,568 5,902,523
18,137,883 16,097,327
UnsecuredCall borrowings 32 3,376,063 3,528,147 Commodity Morabaha - 17,427,527 Overdrawn nostro accounts 32 326,444 417,696 Others 70,800 70,800
3,773,307 21,444,170 21,911,190 37,541,497
15.3 Mark-up / interest rates and other terms are as follows:
- The Bank has entered into agreements with the SBP for extending export finance to customers. As per the terms ofthe agreement, the Bank has granted SBP the right to recover the outstanding amount from the Bank at the date ofmaturity of finances by directly debiting the current account maintained by the Bank with the SBP. These borrowingscarry mark-up ranging from 4.5 % to 7.0 % (2014: 7.5 % to 8.4 %).
2015 2014Note Rupees in '000
NOTES TO THE UNCONSOLIDATED FINANCIAL STATEMENTSFor the year ended December 31, 2015
Annual Report 2015152 Annual Report 2015
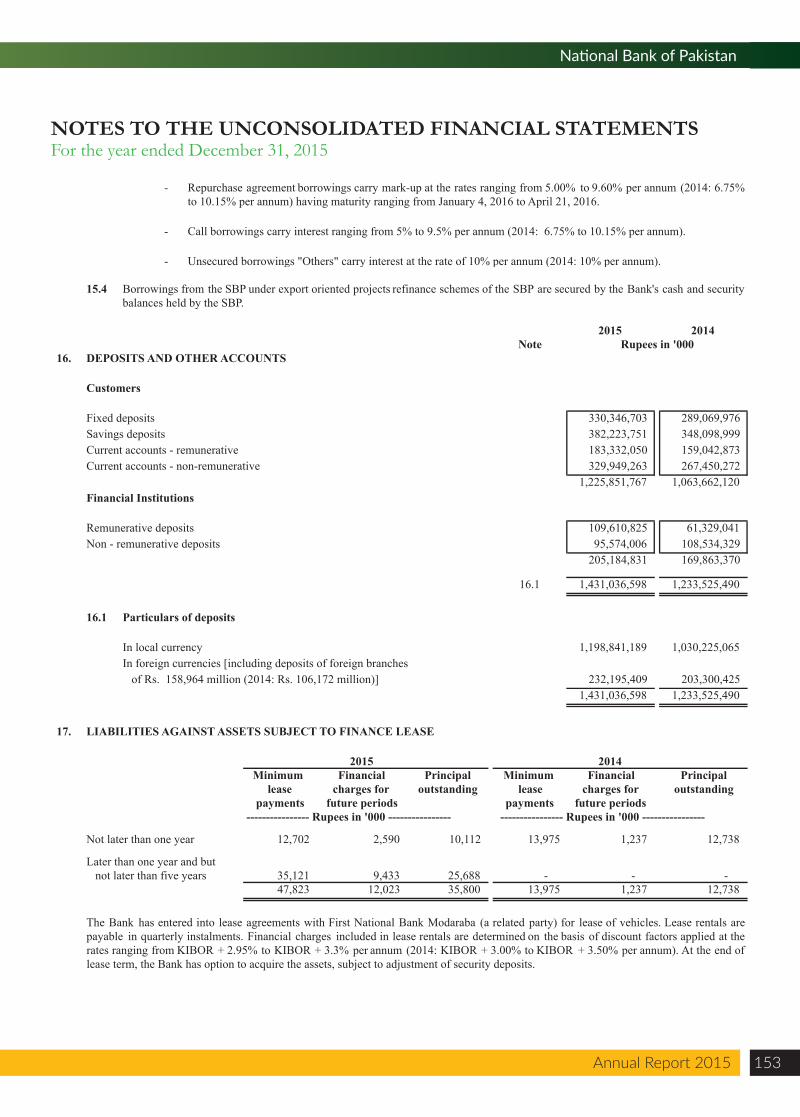
Annual Report 2015 153
National Bank of Pakistan
NOTES TO THE UNCONSOLIDATED FINANCIAL STATEMENTSFor the year ended December 31, 2015
-
- Call borrowings carry interest ranging from 5% to 9.5% per annum (2014: 6.75% to 10.15% per annum).
Repurchase agreement borrowings carry mark-up at the rates ranging from 5.00% to 9.60% per annum (2014: 6.75%to 10.15% per annum) having maturity ranging from January 4, 2016 to April 21, 2016.
-
15.4
2015 2014Note Rupees in '000
16. DEPOSITS AND OTHER ACCOUNTS
Customers
Fixed deposits 330,346,703 289,069,976 Savings deposits 382,223,751 348,098,999 Current accounts - remunerative 183,332,050 159,042,873 Current accounts - non-remunerative 329,949,263 267,450,272
1,225,851,767 1,063,662,120 Financial Institutions
Remunerative deposits 109,610,825 61,329,041 Non - remunerative deposits 95,574,006 108,534,329
205,184,831 169,863,370
16.1 1,431,036,598 1,233,525,490
16.1 Particulars of deposits
In local currency 1,198,841,189 1,030,225,065 In foreign currencies [including deposits of foreign branches of Rs. 158,964 million (2014: Rs. 106,172 million)] 232,195,409 203,300,425
1,431,036,598 1,233,525,490
17. LIABILITIES AGAINST ASSETS SUBJECT TO FINANCE LEASE
2015 2014Minimum Financial Principal Minimum Financial Principal
lease charges for outstanding lease charges for outstandingpayments future periods payments future periods
---------------- Rupees in '000 ---------------- ---------------- Rupees in '000 ----------------
Not later than one year 12,702 2,590 10,112 13,975 1,237 12,738
Later than one year and but not later than five years 35,121 9,433 25,688 - - -
47,823 12,023 35,800 13,975 1,237 12,738
The Bank has entered into lease agreements with First National Bank Modaraba (a related party) for lease of vehicles. Lease rentals arepayable in quarterly instalments. Financial charges included in lease rentals are determined on the basis of discount factors applied at therates ranging from KIBOR + 2.95% to KIBOR + 3.3% per annum (2014: KIBOR + 3.00% to KIBOR + 3.50% per annum). At the end oflease term, the Bank has option to acquire the assets, subject to adjustment of security deposits.
Borrowings from the SBP under export oriented projects refinance schemes of the SBP are secured by the Bank's cash and securitybalances held by the SBP.
Unsecured borrowings "Others" carry interest at the rate of 10% per annum (2014: 10% per annum).
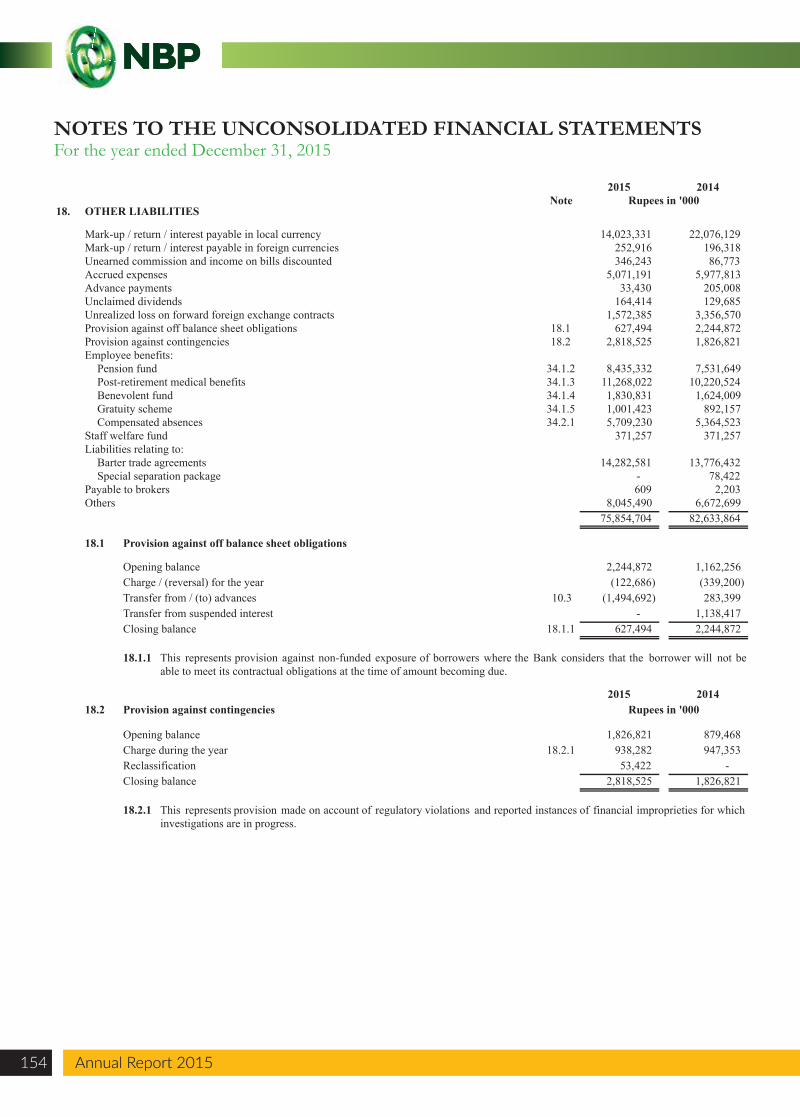
2015 2014Note Rupees in '000
18. OTHER LIABILITIES
Mark-up / return / interest payable in local currency 14,023,331 22,076,129 Mark-up / return / interest payable in foreign currencies 252,916 196,318 Unearned commission and income on bills discounted 346,243 86,773 Accrued expenses 5,071,191 5,977,813 Advance payments 33,430 205,008 Unclaimed dividends 164,414 129,685 Unrealized loss on forward foreign exchange contracts 1,572,385 3,356,570 Provision against off balance sheet obligations 18.1 627,494 2,244,872 Provision against contingencies 18.2 2,818,525 1,826,821 Employee benefits:
Pension fund 34.1.2 8,435,332 7,531,649 Post-retirement medical benefits 34.1.3 11,268,022 10,220,524 Benevolent fund 34.1.4 1,830,831 1,624,009 Gratuity scheme 34.1.5 1,001,423 892,157 Compensated absences 34.2.1 5,709,230 5,364,523
Staff welfare fund 371,257 371,257 Liabilities relating to:
Barter trade agreements 14,282,581 13,776,432 Special separation package - 78,422
Payable to brokers 609 2,203 Others 8,045,490 6,672,699
75,854,704 82,633,864
18.1 Provision against off balance sheet obligations
Opening balance 2,244,872 1,162,256 Charge / (reversal) for the year (122,686) (339,200) Transfer from / (to) advances 10.3 (1,494,692) 283,399 Transfer from suspended interest - 1,138,417 Closing balance 18.1.1 627,494 2,244,872
18.1.1
2015 201418.2 Provision against contingencies Rupees in '000
Opening balance 1,826,821 879,468
This represents provision against non-funded exposure of borrowers where the Bank considers that the borrower will not beable to meet its contractual obligations at the time of amount becoming due.
Charge during the year 18.2.1 938,282 947,353 Reclassification 53,422 - Closing balance 2,818,525 1,826,821
18.2.1 This represents provision made on account of regulatory violations and reported instances of financial improprieties for whichinvestigations are in progress.
NOTES TO THE UNCONSOLIDATED FINANCIAL STATEMENTSFor the year ended December 31, 2015
Annual Report 2015154 Annual Report 2015
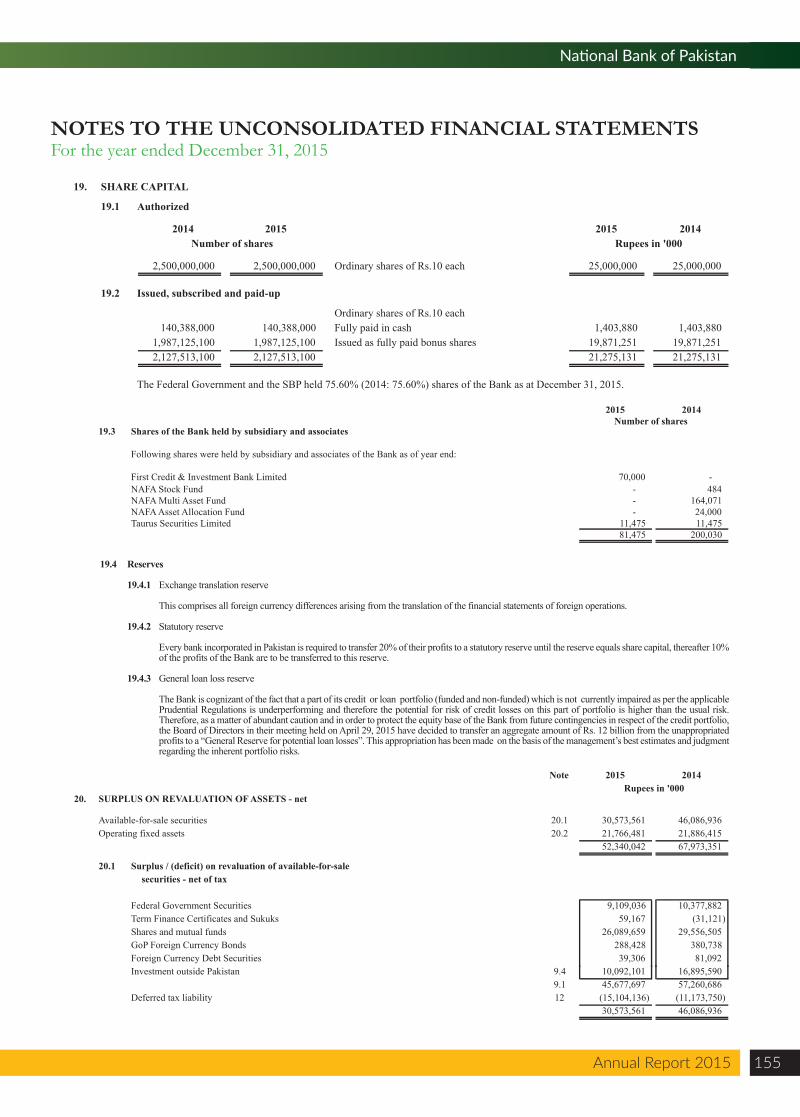
Annual Report 2015 155
National Bank of Pakistan
NOTES TO THE UNCONSOLIDATED FINANCIAL STATEMENTSFor the year ended December 31, 2015
19. SHARE CAPITAL
19.1 Authorized
2014 2015 2015 2014Rupees in '000
2,500,000,000 Ordinary shares of Rs.10 each 25,000,000 25,000,000
19.2 Issued, subscribed and paid-up
Ordinary shares of Rs.10 each140,388,000 Fully paid in cash 1,403,880 1,403,880
1,987,125,100 Issued as fully paid bonus shares 19,871,251 19,871,251 2,127,513,100 21,275,131 21,275,131
1,987,125,100 2,127,513,100
The Federal Government and the SBP held 75.60% (2014: 75.60%) shares of the Bank as at December 31, 2015.
140,388,000
Number of shares
2,500,000,000
2015 2014
19.3 Shares of the Bank held by subsidiary and associates
Following shares were held by subsidiary and associates of the Bank as of year end:
First Credit & Investment Bank Limited 70,000 - NAFA Stock Fund - 484 NAFA Multi Asset Fund - 164,071 NAFA Asset Allocation Fund - 24,000 Taurus Securities Limited 11,475 11,475
81,475 200,030
Note 2015 2014Rupees in '000
20. SURPLUS ON REVALUATION OF ASSETS - net
Available-for-sale securities 20.1 30,573,561 46,086,936 Operating fixed assets 20.2 21,766,481 21,886,415
52,340,042 67,973,351
20.1 Surplus / (deficit) on revaluation of available-for-salesecurities - net of tax
Federal Government Securities 9,109,036 10,377,882 Term Finance Certificates and Sukuks 59,167 (31,121) Shares and mutual funds 26,089,659 29,556,505 GoP Foreign Currency Bonds 288,428 380,738 Foreign Currency Debt Securities 39,306 81,092
Number of shares
Investment outside Pakistan 9.4 10,092,101 16,895,590 9.1 45,677,697 57,260,686
Deferred tax liability 12 (15,104,136) (11,173,750) 30,573,561 46,086,936
19.4 Reserves 19.4.1 Exchange translation reserve
This comprises all foreign currency differences arising from the translation of the financial statements of foreign operations.
19.4.2 Statutory reserve
Every bank incorporated in Pakistan is required to transfer 20% of their profits to a statutory reserve until the reserve equals share capital, thereafter 10% of the profits of the Bank are to be transferred to this reserve.
19.4.3 General loan loss reserve
The Bank is cognizant of the fact that a part of its credit or loan portfolio (funded and non-funded) which is not currently impaired as per the applicable Prudential Regulations is underperforming and therefore the potential for risk of credit losses on this part of portfolio is higher than the usual risk. Therefore, as a matter of abundant caution and in order to protect the equity base of the Bank from future contingencies in respect of the credit portfolio, the Board of Directors in their meeting held on April 29, 2015 have decided to transfer an aggregate amount of Rs. 12 billion from the unappropriated profits to a “General Reserve for potential loan losses”. This appropriation has been made on the basis of the management’s best estimates and judgment regarding the inherent portfolio risks.
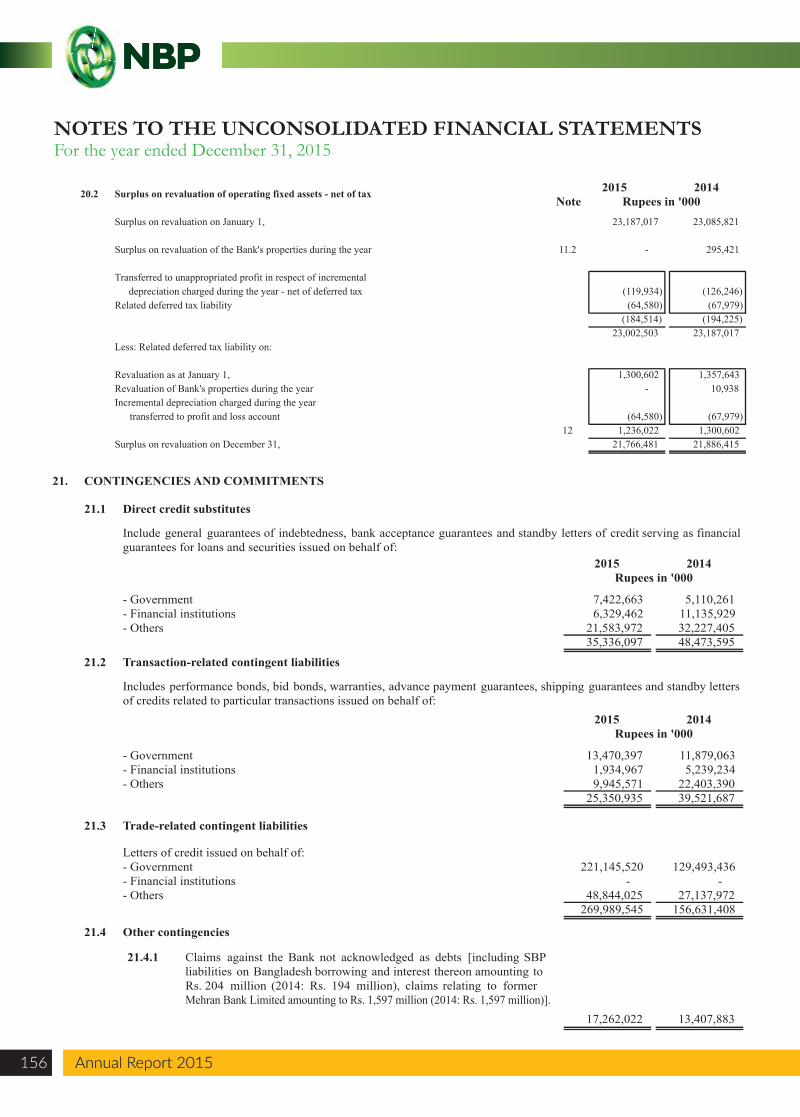
20.2 Surplus on revaluation of operating fixed assets - net of tax
Surplus on revaluation on January 1, 23,187,017 23,085,821
Surplus on revaluation of the Bank's properties during the year 11.2 - 295,421
Transferred to unappropriated profit in respect of incremental depreciation charged during the year - net of deferred tax (119,934) (126,246)
Related deferred tax liability (64,580) (67,979) (184,514) (194,225)
23,002,503 23,187,017 Less: Related deferred tax liability on:
Revaluation as at January 1, 1,300,602 1,357,643 Revaluation of Bank's properties during the year - 10,938 Incremental depreciation charged during the year
transferred to profit and loss account (64,580) (67,979) 12 1,236,022 1,300,602
Surplus on revaluation on December 31, 21,766,481 21,886,415
21. CONTINGENCIES AND COMMITMENTS
21.1 Direct credit substitutes
2015 2014
- Government 7,422,663 5,110,261 - Financial institutions 6,329,462 11,135,929 - Others 21,583,972 32,227,405
35,336,097 48,473,595
21.2 Transaction-related contingent liabilities
2015 2014
- Government 13,470,397 11,879,063 - Financial institutions 1,934,967 5,239,234 - Others 9,945,571 22,403,390
25,350,935 39,521,687
21.3 Trade-related contingent liabilities
Letters of credit issued on behalf of:- Government 221,145,520 129,493,436 - Financial institutions - - - Others 48,844,025 27,137,972
269,989,545 156,631,408
21.4 Other contingencies
21.4.1
17,262,022 13,407,883
Include general guarantees of indebtedness, bank acceptance guarantees and standby letters of credit serving as financialguarantees for loans and securities issued on behalf of:
Rupees in '000
Rupees in '000
2015 2014Rupees in '000
Includes performance bonds, bid bonds, warranties, advance payment guarantees, shipping guarantees and standby lettersof credits related to particular transactions issued on behalf of:
Claims against the Bank not acknowledged as debts [including SBPliabilities on Bangladesh borrowing and interest thereon amounting toRs. 204 million (2014: Rs. 194 million), claims relating to formerMehran Bank Limited amounting to Rs. 1,597 million (2014: Rs. 1,597 million)].
Note
NOTES TO THE UNCONSOLIDATED FINANCIAL STATEMENTSFor the year ended December 31, 2015
Annual Report 2015156 Annual Report 2015
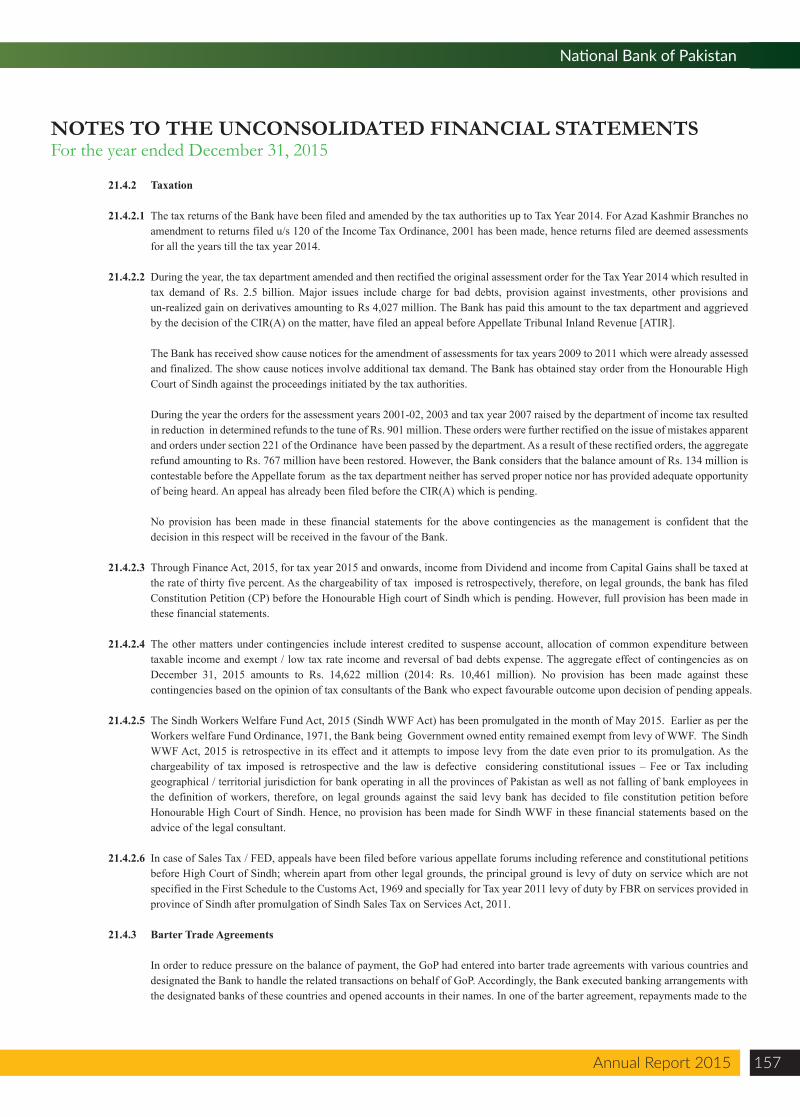
Annual Report 2015 157
National Bank of Pakistan
NOTES TO THE UNCONSOLIDATED FINANCIAL STATEMENTSFor the year ended December 31, 2015
21.4.2 Taxation
21.4.2.1 The tax returns of the Bank have been filed and amended by the tax authorities up to Tax Year 2014. For Azad Kashmir Branches no amendment to returns filed u/s 120 of the Income Tax Ordinance, 2001 has been made, hence returns filed are deemed assessments for all the years till the tax year 2014.
21.4.2.2 During the year, the tax department amended and then rectified the original assessment order for the Tax Year 2014 which resulted in tax demand of Rs. 2.5 billion. Major issues include charge for bad debts, provision against investments, other provisions and un-realized gain on derivatives amounting to Rs 4,027 million. The Bank has paid this amount to the tax department and aggrieved by the decision of the CIR(A) on the matter, have filed an appeal before Appellate Tribunal Inland Revenue [ATIR].
The Bank has received show cause notices for the amendment of assessments for tax years 2009 to 2011 which were already assessed and finalized. The show cause notices involve additional tax demand. The Bank has obtained stay order from the Honourable High Court of Sindh against the proceedings initiated by the tax authorities.
During the year the orders for the assessment years 2001-02, 2003 and tax year 2007 raised by the department of income tax resulted in reduction in determined refunds to the tune of Rs. 901 million. These orders were further rectified on the issue of mistakes apparent and orders under section 221 of the Ordinance have been passed by the department. As a result of these rectified orders, the aggregate refund amounting to Rs. 767 million have been restored. However, the Bank considers that the balance amount of Rs. 134 million is contestable before the Appellate forum as the tax department neither has served proper notice nor has provided adequate opportunity of being heard. An appeal has already been filed before the CIR(A) which is pending.
No provision has been made in these financial statements for the above contingencies as the management is confident that the decision in this respect will be received in the favour of the Bank.
21.4.2.3 Through Finance Act, 2015, for tax year 2015 and onwards, income from Dividend and income from Capital Gains shall be taxed at the rate of thirty five percent. As the chargeability of tax imposed is retrospectively, therefore, on legal grounds, the bank has filed Constitution Petition (CP) before the Honourable High court of Sindh which is pending. However, full provision has been made in these financial statements.
21.4.2.4 The other matters under contingencies include interest credited to suspense account, allocation of common expenditure between taxable income and exempt / low tax rate income and reversal of bad debts expense. The aggregate effect of contingencies as on December 31, 2015 amounts to Rs. 14,622 million (2014: Rs. 10,461 million). No provision has been made against these contingencies based on the opinion of tax consultants of the Bank who expect favourable outcome upon decision of pending appeals.
21.4.2.5 The Sindh Workers Welfare Fund Act, 2015 (Sindh WWF Act) has been promulgated in the month of May 2015. Earlier as per the Workers welfare Fund Ordinance, 1971, the Bank being Government owned entity remained exempt from levy of WWF. The Sindh WWF Act, 2015 is retrospective in its effect and it attempts to impose levy from the date even prior to its promulgation. As the chargeability of tax imposed is retrospective and the law is defective considering constitutional issues – Fee or Tax including geographical / territorial jurisdiction for bank operating in all the provinces of Pakistan as well as not falling of bank employees in the definition of workers, therefore, on legal grounds against the said levy bank has decided to file constitution petition before Honourable High Court of Sindh. Hence, no provision has been made for Sindh WWF in these financial statements based on the advice of the legal consultant.
21.4.2.6 In case of Sales Tax / FED, appeals have been filed before various appellate forums including reference and constitutional petitions before High Court of Sindh; wherein apart from other legal grounds, the principal ground is levy of duty on service which are not specified in the First Schedule to the Customs Act, 1969 and specially for Tax year 2011 levy of duty by FBR on services provided in province of Sindh after promulgation of Sindh Sales Tax on Services Act, 2011.
21.4.3 Barter Trade Agreements
In order to reduce pressure on the balance of payment, the GoP had entered into barter trade agreements with various countries and designated the Bank to handle the related transactions on behalf of GoP. Accordingly, the Bank executed banking arrangements with the designated banks of these countries and opened accounts in their names. In one of the barter agreement, repayments made to the
Bank by the GoP could not be utilized due to non-finalization of Letter of Exchange for its utilization after 1994 at Government level, which was required under the relevant barter agreement. The concerned bank is now demanding payment of interest on the balances in its accounts with the Bank. Since these balances are maintained in current accounts and there is also no clause for payment of any interest in the relevant banking arrangement, therefore the Bank has strongly refused such claims.
21.4.4 Contingencies in respect of employees benefits and related matters
The following are the details of the contingencies arising out of the various legal cases pending adjudication in respect of employees’ benefits and related matters. The Bank considers that the financial impact of such matters is impracticable to determine with sufficient reliability.
21.4.4.1 Pensionary benefits to retired employees
Till 1977 the Bank was paying pension to its retired employees as per Board’s decisions and on its own rules and regulation with various increases from time to time. In 1977 the Government through Banking Council notified that henceforward pension would be paid to the bank employees by giving all the increases given by the Federal Government to its employees from time to time. Consequent upon this direction, the bank issued a Circular 228 (c) on 26-12-1977 which was made applicable from 01-05-1977. Under this arrangement pension was calculated at 70% of average emoluments on completion 30 years qualifying service. In para 10 of the circular of 26-12-1977 it was stated that the rates of pension and gratuity had been fixed by Pay Commission for the Banks and Financial Institution on the same lines as obtaining on the side of the Federal Government. Under the provision of IRO 1969 the Pay Commission was to remain valid for three years. In the meanwhile Bank’s Nationalization Act was substantially amended in 1997, Pakistan Banking Council was dissolved, Bank's Board was empowered to determined personnel policies and the President of the Bank could determine the remuneration and benefits of the employees in accordance with policies determined by the Board. In 1999 the Board of Directors of the bank approved the revised pay structure for the bank employees w.e.f 01-01-1999. Basic salary was increased by 110 % to 140% and formula for revised monthly gross pension was determined as : basic pay x number of year x 1.10%. However the amount of gross pension on the basis of existing basic pay and exiting formula was protected. Even after 1999 the bank gave various increases of pension right upto 2012. The Peshawar High Court, Peshawar, in terms of order dated June 03, 2014, dismissed the Petitions while observing that the Petitions were hit by laches and that the Petitioners cannot claim the benefits to the similarly placed employees of other institutions who are governed through different Statute and Service Rules. The said order has been assailed by the Petitioners before the honourable Supreme Court of Pakistan where the matter is pending adjudication. During December 2015, the Lahore High Court accepted the writ petition of the retired employees and directed the bank to give increases in pension in line with the increases given by the Federal Government to its employees. The Bank has filed ICA to question the validity of the said judgment. Keeping in view the merits of the case, the Bank is confident about the favourable outcome of this matter.
21.4.4.2 Encashment of unavailed leave
Some of the employees of the Bank filed writ petitions before Lahore High Court after their retirement, in September 2012, praying the Court for issuance of directions to the bank for encashing their entire un-availed leave balance frozen in terms of Bank's Circular 37/1999 and 57/ 1999.
The Bank revised rules of leave encashment w.e.f January 1, 1999. As per revised rules, leave balances accumulated under old rules were marked as “Frozen Leave” to differentiate it with subsequent leaves to be accumulated. There was no bar on employee to avail these leaves, which would lapse on retirement.
The Lahore High Court dismissed the petitions of the subject ex-employees in April 2014 while observing that claim of the petitioners was hit by laches as the Petitions were filed in the year 2012 and that all the petitioners filed the petitions after having availed all retirement benefits when all outstanding dues were paid at the time of retirement at which point no claim for any amount was made. The Petitioners have filed Inter Court appeals against the aforesaid judgment which are pending adjudication. These nine petitions have not yet been fixed for hearing and are still pending.
21.4.4.3 Post retirement medical facilities
On 14 March 1995 on the instruction of Pakistan Banking Council the Bank issued Circular 19/95. In terms of the said Circular the Bank was to provide relief to the retired employees regarding increase of medical ceiling on the increase of salary, it was decided that the Bank would re-determine the monetary ceiling of retired officers/executives after every revision of pay scale on the basis of
NOTES TO THE UNCONSOLIDATED FINANCIAL STATEMENTSFor the year ended December 31, 2015
Annual Report 2015158 Annual Report 2015
Annual Report 2015 159
National Bank of Pakistan
NOTES TO THE UNCONSOLIDATED FINANCIAL STATEMENTSFor the year ended December 31, 2015
notional re-fixation in revised scale on point to point basis. In 2003 two retired employees moved to Federal Service Tribunal for increase of post-retirement medical ceiling in the light of the said Circular of 14 March, 1995. The Bank contested the case but a representative of Establishment Division stated before the FST that Bank had adopted the said Circular and the two appeals were accepted by the FST. The Bank’s appeals before the Supreme Court failed and even review petitions were dismissed.
Later on in September, 2011 Ch. Muhammad Qasim and 5 others who had obtained separation from service under GHS/ VHS filed writ petition for availing similar relief of post-retirement medical ceiling and cited the judgment of FST and Supreme Court as precedent. The Bank contested the writ petition by pointing out that the petitioners had opted for GHS AND VHS for obtaining separation from service on payment of huge amount of compensation for such separation as contemplated under the said Schemes.
With regard to medical ceiling for such optees, it was contended by the Bank before the Court that option was given to such employees either to accept the present medical ceiling for 10 years in lump sum or to continue with the present payment as if they had retired on attaining the age of superannuation. The petitioners had opted for continuing with the present ceiling as prevalent at the time of the separation scheme floated by the Bank therefore, that their cases were on a different footing. It was also urged by the Bank that in view of judgment of Apex Court in Naseem Arif Abbasi case, the writ petitioners, after having signed a disclaimer at the time receipt of benefits under GHS, were not entitled to any further payment. The high court did not consider the defence pleas and awarded the medical ceilings at par with normal retirees. The Bank has filed an ICA before the Division bench which is still pending.
21.4.4.4 Restoration of Commuted Pension
After passage of certain period for which pension of a retired employee is commuted, the Bank restores the commuted portion of the pension. Some of the retired employees have filed writ petitions before Lahore High Court while praying the court for restoration of 50% pension after applying all the increments granted during the last 15 years i.e. double the pension they are already withdrawing.
In one of the writ petition filed, the Honourable Lahore High Court without issuing notices to the Bank disposed of the same vide order dated January 13, 2015 observing that the Petitioner was also entitled to be treated at par with the pensioners whose cases had already been decided in a case titled as “Additional Accountant General Pakistan Revenue, Lahore vs. A.A.Zuberi” which had attained finality up to the level of Supreme Court of Pakistan.
The judgment referred in the case was decided by a Divisional Bench of Lahore High Court in which restoration of pension after period of commutation was directed to be paid at the rate prevailing at the time of restoration and not the rate of pension prevailing at the time of commutation. High Court in the above mentioned case came to the conclusion that an employee was given restored pension at the rate prevailing 15 years ago and that such an action on the part of the employer would be a violation of Article 9 of the Constitution and would also be contrary to the test of economic justice. In the above-mentioned case, the Bank has filed an Intra Court Appeal as the matter was decided without summoning the Bank. The Bank is of the view that A.A. Zubari’s judgment pertains to Civil servants and the Bank employees are not civil servants The issue of petitions have not been fixed for hearing and are still pending.
21.4.4.5 Regularizing of temporary hires/outsourced workers
A practice was prevalent in the Bank to hire temporary Godown keepers for keeping watch over the pledged stocks of the borrowers. Letters of appointment to be issued by the Bank to such temporary employees for period of less than 90 days and after short break they would be rehired again for similar short period. In 2001-2002 the temporary godown staff filed appeals before the FST for regularization of their service. The Bank pointed out that such employees were not on the pay roll of the Bank and their temporary employment did not entitle them for regular absorption in the Bank. On 01-08-2003 the Bank issued circular No. 10/2003 whereby a formula was evolved that if such temporary employee had completed three years’ service as on the date of the circular with breaks of not more than 15 days, they would be eligible for the absorption on regular bases. This very criterion was adopted by the Tribunal and an order was passed accordingly. The Bank had obtained the permission from Government to absorb 1500 godwon staff in the Bank. All who fulfilled the criteria were absorbed as the Honourable Supreme Court in 2005 SCMR 100 had upheld the tribunal’s judgment.
However under a policy decision the Bank decided to outsource some of its noncore jobs and in this behalf entered into contracts with various service provider agencies for hiring such people. The persons employed by the such contractors are working in the Bank as employees of the said contractors, and received their salaries from said contractors and are also under the administrative control of
the said contractors. Some of such employees filed writ petitions before the Peshawar High Court, Abbottabad and Mingora benches. Some of the writ petition were accepted, the Bank has filed appeals in the Supreme Court by taking the plea that there is no relationship of employer and employees between the parties. There is likelihood of the Bank’s appeal being accepted by the Supreme Court. If the Bank does not succeed, it may have to absorb such employees.
21.4.4.6 Golden Handshake (GHS)
The Bank had introduced the Golden Shake Hand Schemes in 1997. The cut-off date was prescribed in the scheme but some of the employees who had opted for separation under the scheme were not relieved on the said date and continued to perform duties thereafter, cases were filed in various high courts for additional payment beyond the cut-off date and also for increase the salaries announced by the Bank after cut of date of scheme but the Apex court held that after having received the payments and signed disclaimer no further payment could be claimed by such optees under the Scheme. Most of the cases have been disposed on the basis Naseem Arif Abbasi case Reported as 2011 SCMR 446.
22. DERIVATIVE INSTRUMENTS
The Bank has been involved forward foreign exchange contracts. The Bank is also party to put options on ordinary and preference shares of Agritech Limited as disclosed in note 9.5.1. The un-realized gain and loss on such contracts are disclosed in notes 13 and 18.
Operational procedures and controls have been established to facilitate complete, accurate and timely processing of transactions. These controls include appropriate segregation of duties, regular reconciliation of accounts, and the valuation of assets and positions. The Bank has established operating controls and reporting requirements that are specifically designed to control risk of aggregate positions, assure compliance with accounting and regulatory standards and provide accurate management information regarding these activities.
21.52015 2014
Rupees in '000Commitments in respect of forward exchange contracts
Purchase 273,199,134 233,021,148 Sale 183,645,395 120,265,758
21.6
21.7
Commitments for the acquisition of operating fixed assets 1,999,488 1,798,160
Other commitments
Professional services to be received 81,095 99,450
2015 2014Rupees in '00023. MARK-UP / RETURN / INTEREST EARNED
On loans and advances to: Customers 68,153,455 Financial institutions 141,308
68,294,763
56,378,88868,209
56,447,097 On investments in:
Held-for-trading securities 402,136 304,718 Available-for-sale securities 38,925,217 33,250,636 Held-to-maturity securities 16,340,078 9,923,230
55,667,431 43,478,584 On deposits with financial institutions 465,426 259,609 On securities purchased under resale agreements 1,081,877 2,140,563
113,661,831 114,173,519
NOTES TO THE UNCONSOLIDATED FINANCIAL STATEMENTSFor the year ended December 31, 2015
Annual Report 2015160 Annual Report 2015
Annual Report 2015 161
National Bank of Pakistan
NOTES TO THE UNCONSOLIDATED FINANCIAL STATEMENTSFor the year ended December 31, 2015
24. MARK-UP / RETURN / INTEREST EXPENSED
Deposits 53,294,048 63,692,896 Securities sold under repurchase agreements 5,551,365 2,249,704 Short-term borrowings 1,095,482 2,426,904
59,940,895 68,369,504
25. INCOME FROM DEALING IN FOREIGN CURRENCIES
2015 2014Note Rupees in '000
2015 2014Rupees in '000
26. GAIN ON SALE AND REDEMPTION OF SECURITIES - net
Federal government securities:Market Treasury Bills 189,081 24,088 Pakistan Investment Bonds 6,633,083 823,211 GoP Ijarah Sukuks 2,370 35,182
6,824,534 882,481
This includes Rs. 6,614 million (2014: Rs. 7,270 million) on account of interest on Cross Currency Swap transactionscharged by Foreign Exchange department to Treasury Department.
National Investment Trust (NIT) units - 1,052,380 Shares and mutual funds 4,904,874 6,084,720 Foreign Government / debt securities 24,734 13,996 Associates - mutual funds 840,282 739,314
12,594,424 8,772,891
27. OTHER INCOME
Rent on property / lockers 33,766 75,566 Gain on sale of property and equipment 9,224 29,643 Compensation for delayed tax refunds 13.6 1,585,271 3,369,429 Postal, SWIFT and other charges recovered 56,874 91,551 Net un-realized gain on derivatives - put option in respect
of Agritech Limited (an associate) 9.5.1 364,800 - Others 30,841 21,184
2,080,776 3,587,373
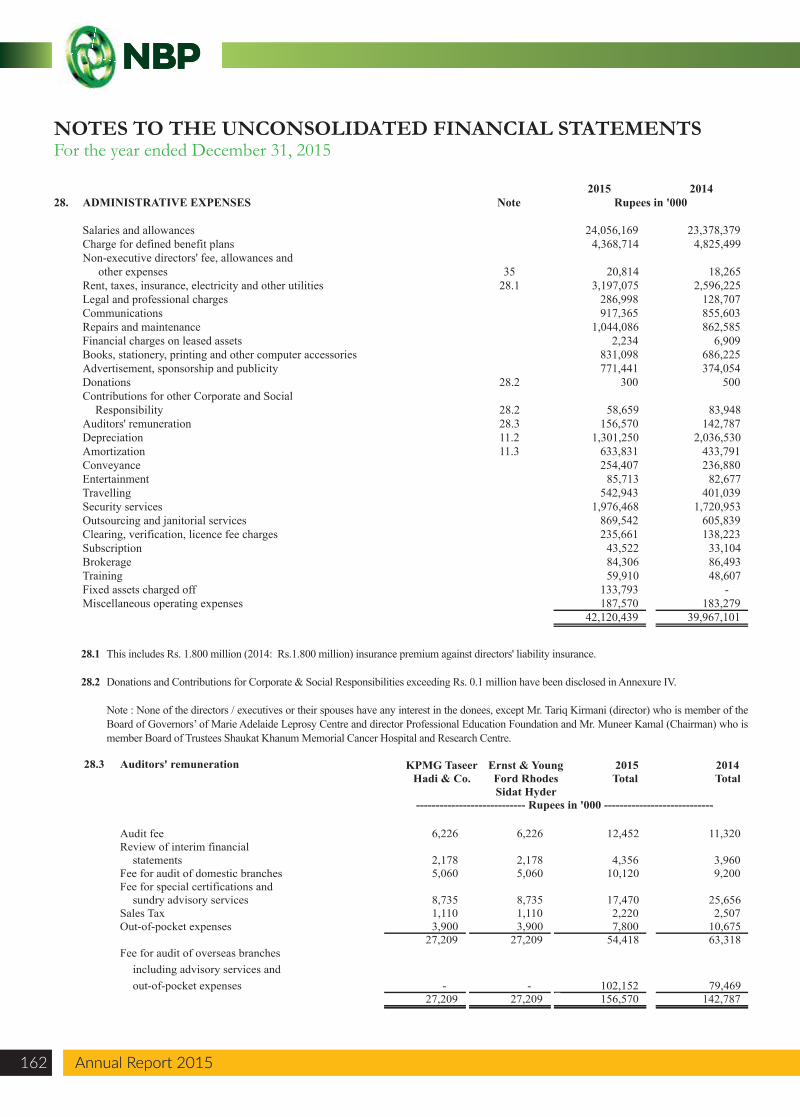
28.1 This includes Rs. 1.800 million (2014: Rs.1.800 million) insurance premium against directors' liability insurance.
28.2 Donations and Contributions for Corporate & Social Responsibilities exceeding Rs. 0.1 million have been disclosed in Annexure IV.
Note : None of the directors / executives or their spouses have any interest in the donees, except Mr. Tariq Kirmani (director) who is member of the Board of Governors’ of Marie Adelaide Leprosy Centre and director Professional Education Foundation and Mr. Muneer Kamal (Chairman) who is member Board of Trustees Shaukat Khanum Memorial Cancer Hospital and Research Centre.
2015 201428. ADMINISTRATIVE EXPENSES Note Rupees in '000
Salaries and allowances 24,056,169 23,378,379 Charge for defined benefit plans 4,368,714 4,825,499 Non-executive directors' fee, allowances and
other expenses 35 20,814 18,265 Rent, taxes, insurance, electricity and other utilities 28.1 3,197,075 2,596,225 Legal and professional charges 286,998 128,707 Communications 917,365 855,603 Repairs and maintenance 1,044,086 862,585 Financial charges on leased assets 2,234 6,909 Books, stationery, printing and other computer accessories 831,098 686,225 Advertisement, sponsorship and publicity 771,441 374,054 Donations 28.2 300 500 Contributions for other Corporate and Social
Responsibility 28.2 58,659 83,948 Auditors' remuneration 28.3 156,570 142,787 Depreciation 11.2 1,301,250 2,036,530 Amortization 11.3 633,831 433,791 Conveyance 254,407 236,880 Entertainment 85,713 82,677 Travelling 542,943 401,039 Security services 1,976,468 1,720,953 Outsourcing and janitorial services 869,542 605,839 Clearing, verification, licence fee charges 235,661 138,223 Subscription 43,522 33,104 Brokerage 84,306 86,493 Training 59,910 48,607 Fixed assets charged off 133,793 - Miscellaneous operating expenses 187,570 183,279
42,120,439 39,967,101
28.3 Auditors' remuneration KPMG Taseer Hadi & Co.
Ernst & Young Ford Rhodes Sidat Hyder
2015 Total
2014 Total
Audit fee 6,226 6,226 12,452 11,320 Review of interim financial
statements 2,178 2,178 4,356 3,960 Fee for audit of domestic branches 5,060 5,060 10,120 9,200 Fee for special certifications and
sundry advisory services 8,735 8,735 17,470 25,656 Sales Tax 1,110 1,110 2,220 2,507 Out-of-pocket expenses 3,900 3,900 7,800 10,675
27,209 27,209 54,418 63,318 Fee for audit of overseas branches
including advisory services and out-of-pocket expenses - - 102,152 79,469
27,209 27,209 156,570 142,787
---------------------------- Rupees in '000 ----------------------------
NOTES TO THE UNCONSOLIDATED FINANCIAL STATEMENTSFor the year ended December 31, 2015
Annual Report 2015162 Annual Report 2015
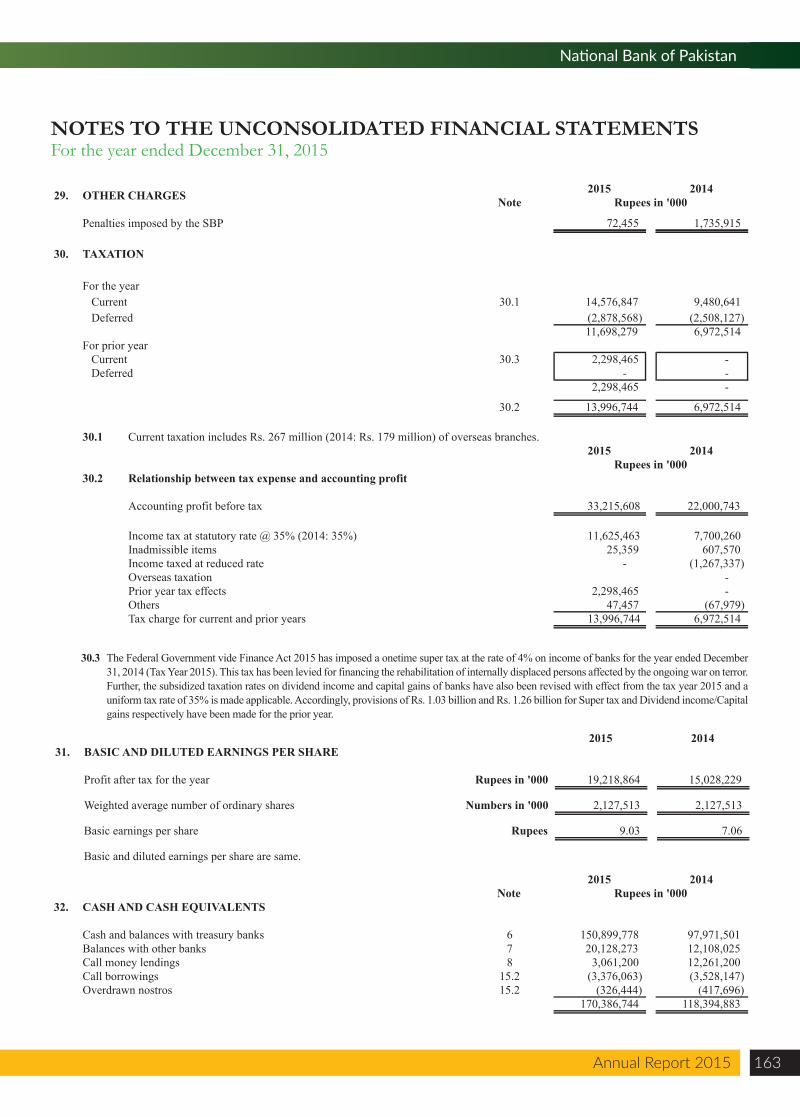
Annual Report 2015 163
National Bank of Pakistan
NOTES TO THE UNCONSOLIDATED FINANCIAL STATEMENTSFor the year ended December 31, 2015
30.3 The Federal Government vide Finance Act 2015 has imposed a onetime super tax at the rate of 4% on income of banks for the year ended December 31, 2014 (Tax Year 2015). This tax has been levied for financing the rehabilitation of internally displaced persons affected by the ongoing war on terror. Further, the subsidized taxation rates on dividend income and capital gains of banks have also been revised with effect from the tax year 2015 and a uniform tax rate of 35% is made applicable. Accordingly, provisions of Rs. 1.03 billion and Rs. 1.26 billion for Super tax and Dividend income/Capital gains respectively have been made for the prior year.
29. OTHER CHARGES
Penalties imposed by the SBP 72,455 1,735,915
30. TAXATION
For the year Current 30.1 14,576,847 9,480,641 Deferred (2,878,568) (2,508,127)
11,698,279 6,972,514 For prior year Current 30.3 2,298,465 - Deferred - -
2,298,465 -
30.2 13,996,744 6,972,514
30.12015 2014
Rupees in '00030.2 Relationship between tax expense and accounting profit
Accounting profit before tax 33,215,608 22,000,743
Income tax at statutory rate @ 35% (2014: 35%) 11,625,463 7,700,260
Current taxation includes Rs. 267 million (2014: Rs. 179 million) of overseas branches.
Inadmissible items 25,359 607,570 Income taxed at reduced rate - (1,267,337) Overseas taxation - Prior year tax effects 2,298,465 - Others 47,457 (67,979) Tax charge for current and prior years 13,996,744 6,972,514
2015 2014Rupees in '000Note
2015 201431. BASIC AND DILUTED EARNINGS PER SHARE
Profit after tax for the year Rupees in '000 19,218,864 15,028,229
Weighted average number of ordinary shares Numbers in '000 2,127,513 2,127,513
Basic earnings per share Rupees 9.03 7.06
Basic and diluted earnings per share are same.
2015 2014Note Rupees in '000
32. CASH AND CASH EQUIVALENTS
Cash and balances with treasury banks 6 150,899,778 97,971,501 Balances with other banks 7 20,128,273 12,108,025 Call money lendings 8 3,061,200 12,261,200 Call borrowings 15.2 (3,376,063) (3,528,147) Overdrawn nostros 15.2 (326,444) (417,696)
170,386,744 118,394,883
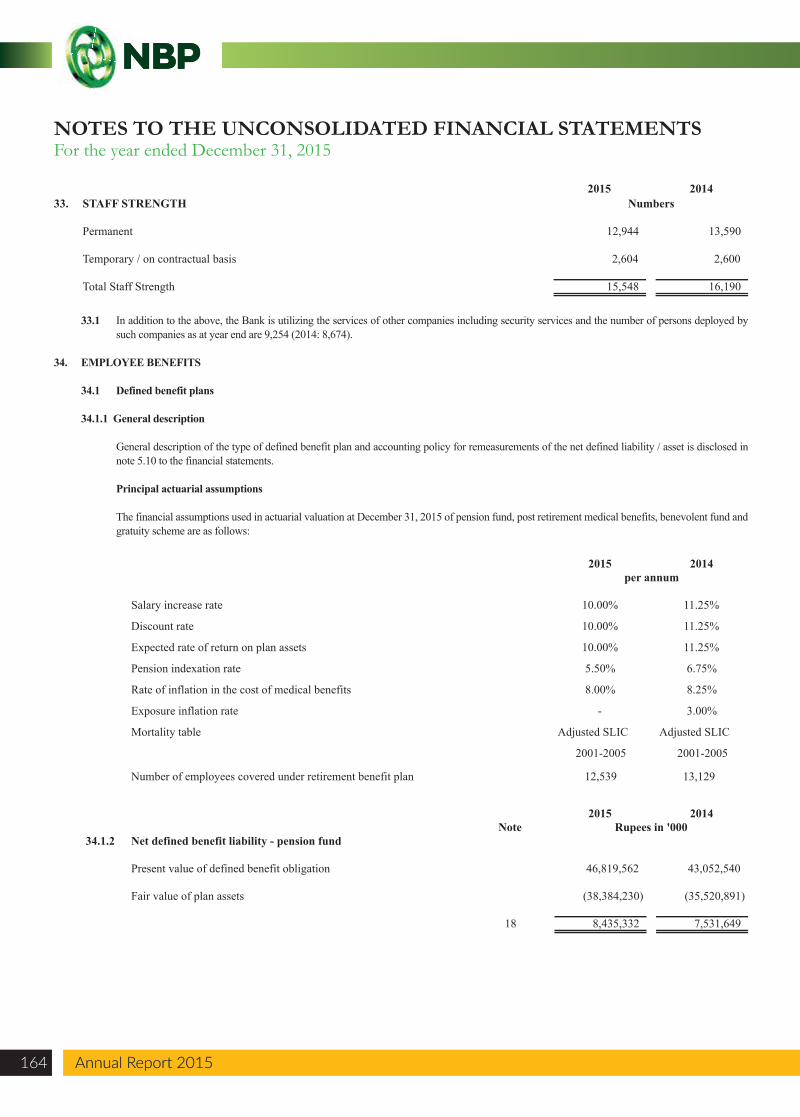
33.1 In addition to the above, the Bank is utilizing the services of other companies including security services and the number of persons deployed by such companies as at year end are 9,254 (2014: 8,674).
34. EMPLOYEE BENEFITS
34.1 Defined benefit plans
34.1.1 General description
General description of the type of defined benefit plan and accounting policy for remeasurements of the net defined liability / asset is disclosed in note 5.10 to the financial statements.
Principal actuarial assumptions
The financial assumptions used in actuarial valuation at December 31, 2015 of pension fund, post retirement medical benefits, benevolent fund and gratuity scheme are as follows:
2015 201433. STAFF STRENGTH Numbers
Permanent 12,944 13,590
Temporary / on contractual basis 2,604 2,600
Total Staff Strength 15,548 16,190
2015 2014per annum
Salary increase rate 10.00% 11.25%
Discount rate 10.00% 11.25%
Expected rate of return on plan assets 10.00% 11.25%
Pension indexation rate 5.50% 6.75%
Rate of inflation in the cost of medical benefits 8.00% 8.25%
Exposure inflation rate - 3.00%
Mortality table Adjusted SLIC Adjusted SLIC
2001-2005 2001-2005
Number of employees covered under retirement benefit plan 12,539 13,129
2015 2014Note Rupees in '000
34.1.2 Net defined benefit liability - pension fund
Present value of defined benefit obligation 46,819,562 43,052,540
Fair value of plan assets (38,384,230) (35,520,891)
18 8,435,332 7,531,649
NOTES TO THE UNCONSOLIDATED FINANCIAL STATEMENTSFor the year ended December 31, 2015
Annual Report 2015164 Annual Report 2015
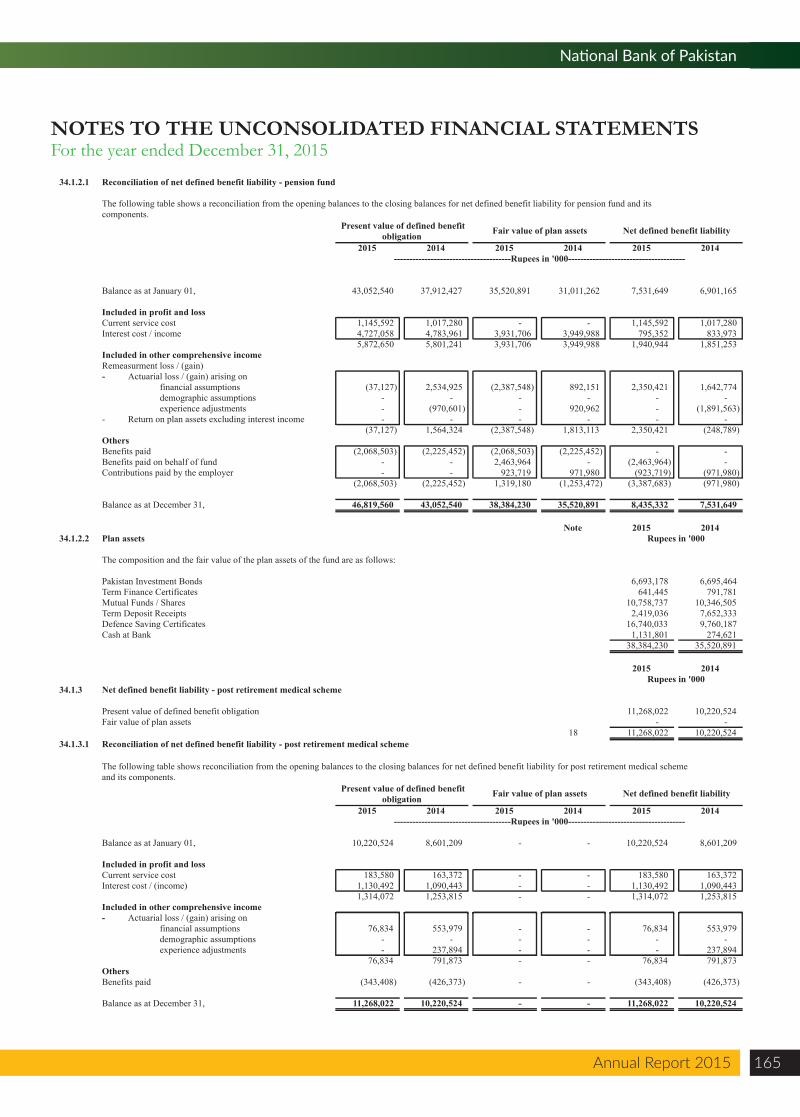
Annual Report 2015 165
National Bank of Pakistan
NOTES TO THE UNCONSOLIDATED FINANCIAL STATEMENTSFor the year ended December 31, 2015
34.1.2.1 Reconciliation of net defined benefit liability - pension fund
The following table shows a reconciliation from the opening balances to the closing balances for net defined benefit liability for pension fund and itscomponents.
2015 2014 2015 2014 2015 2014
Balance as at January 01, 43,052,540 37,912,427 35,520,891 31,011,262 7,531,649 6,901,165
Included in profit and lossCurrent service cost 1,145,592 1,017,280 - - 1,145,592 1,017,280 Interest cost / income 4,727,058 4,783,961 3,931,706 3,949,988 795,352 833,973
5,872,650 5,801,241 3,931,706 3,949,988 1,940,944 1,851,253 Included in other comprehensive incomeRemeasurment loss / (gain)- Actuarial loss / (gain) arising on
financial assumptions (37,127) 2,534,925 (2,387,548) 892,151 2,350,421 1,642,774 demographic assumptions - - - - - experience adjustments (970,601) - 920,962 - (1,891,563)
- Return on plan assets excluding interest income ---
- - -
-
- - (37,127) 1,564,324 (2,387,548) 1,813,113 2,350,421 (248,789)
OthersBenefits paid (2,068,503) (2,225,452) (2,068,503) (2,225,452) - - Benefits paid on behalf of fund - - 2,463,964 (2,463,964) - Contributions paid by the employer - - 923,719 971,980 (923,719) (971,980)
(2,068,503) (2,225,452) 1,319,180 (1,253,472) (3,387,683) (971,980)
Balance as at December 31, 46,819,560 43,052,540 38,384,230 35,520,891 8,435,332 7,531,649
Note 2015 201434.1.2.2 Plan assets Rupees in '000
The composition and the fair value of the plan assets of the fund are as follows:
Pakistan Investment Bonds 6,693,178 6,695,464 Term Finance Certificates 641,445 791,781 Mutual Funds / Shares 10,758,737 10,346,505 Term Deposit Receipts 2,419,036 7,652,333 Defence Saving Certificates 16,740,033 9,760,187 Cash at Bank 1,131,801 274,621
38,384,230 35,520,891
2015 2014
34.1.3 Net defined benefit liability - post retirement medical scheme
Present value of defined benefit obligation 11,268,022 10,220,524 Fair value of plan assets - -
18 11,268,022 10,220,524 34.1.3.1 Reconciliation of net defined benefit liability - post retirement medical scheme
The following table shows reconciliation from the opening balances to the closing balances for net defined benefit liability for post retirement medical schemeand its components.
2015 2014 2015 2014 2015 2014
Balance as at January 01, 10,220,524 8,601,209 - - 10,220,524 8,601,209
Included in profit and lossCurrent service cost 183,580 163,372 - - 183,580 163,372 Interest cost / (income) 1,130,492 1,090,443 - - 1,130,492 1,090,443
1,314,072 1,253,815 - - 1,314,072 1,253,815 Included in other comprehensive income
--------------------------------------Rupees in '000--------------------------------------
Present value of defined benefit obligation Fair value of plan assets Net defined benefit liability
--------------------------------------Rupees in '000--------------------------------------
Present value of defined benefit obligation Fair value of plan assets Net defined benefit liability
Rupees in '000
- Actuarial loss / (gain) arising onfinancial assumptions 76,834 553,979 - - 76,834 553,979 demographic assumptions - - - - - - experience adjustments - 237,894 - - - 237,894
76,834 791,873 - - 76,834 791,873 OthersBenefits paid (343,408) (426,373) - - (343,408) (426,373)
Balance as at December 31, 11,268,022 10,220,524 - - 11,268,022 10,220,524
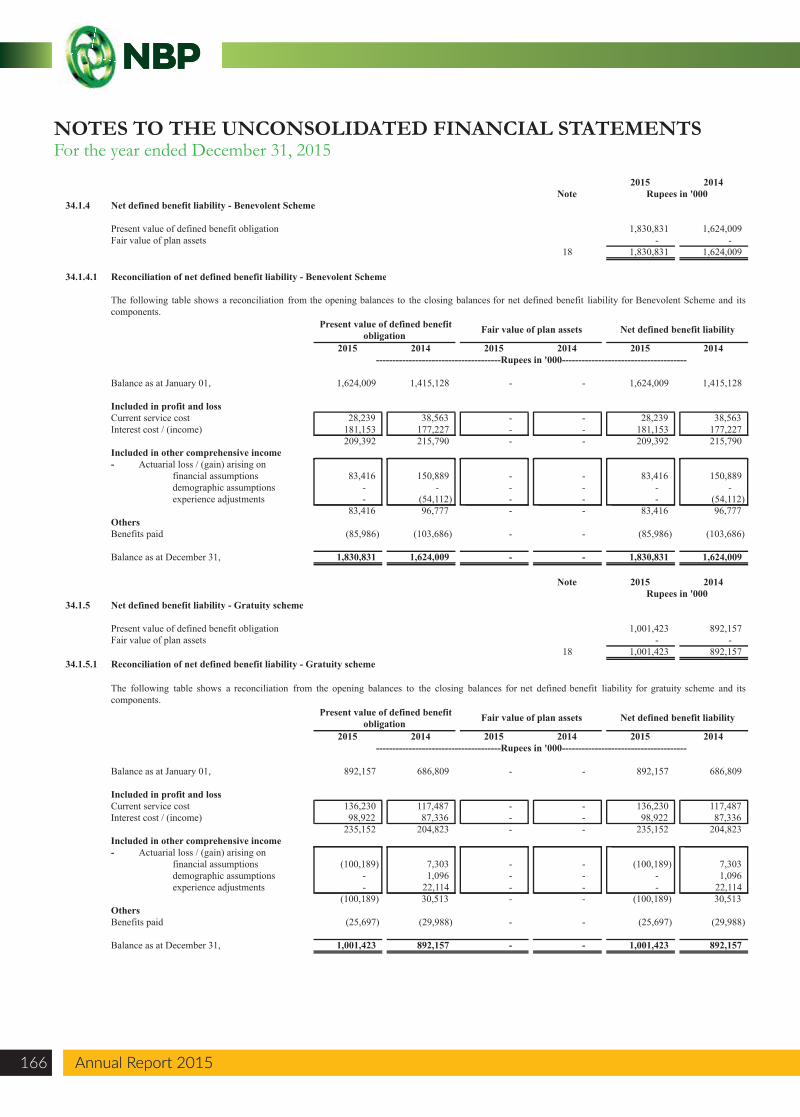
2015 2014Note
34.1.4 Net defined benefit liability - Benevolent Scheme
Present value of defined benefit obligation 1,830,831 1,624,009 Fair value of plan assets - -
18 1,830,831 1,624,009
34.1.4.1 Reconciliation of net defined benefit liability - Benevolent Scheme
2015 2014 2015 2014 2015 2014
Balance as at January 01, 1,624,009 1,415,128 - - 1,624,009 1,415,128
Included in profit and lossCurrent service cost 28,239 38,563 28,239 38,563 Interest cost / (income) 181,153 177,227 - -
- - 181,153 177,227
Rupees in '000
Present value of defined benefit obligation Fair value of plan assets Net defined benefit liability
--------------------------------------Rupees in '000--------------------------------------
The following table shows a reconciliation from the opening balances to the closing balances for net defined benefit liability for Benevolent Scheme and itscomponents.
209,392 215,790 - - 209,392 215,790 Included in other comprehensive income- Actuarial loss / (gain) arising on
financial assumptions 83,416 150,889 - - 83,416 150,889 demographic assumptions - - - - - - experience adjustments - (54,112) - - - (54,112)
83,416 96,777 - - 83,416 96,777 OthersBenefits paid (85,986) (103,686) - - (85,986) (103,686)
Balance as at December 31, 1,830,831 1,624,009 - - 1,830,831 1,624,009
Note 2015 2014
34.1.5 Net defined benefit liability - Gratuity scheme
Present value of defined benefit obligation 1,001,423 892,157 Fair value of plan assets - -
18 1,001,423 892,157 34.1.5.1 Reconciliation of net defined benefit liability - Gratuity scheme
2015 2014 2015 2014 2015 2014
Balance as at January 01, 892,157 686,809 - - 892,157 686,809
Included in profit and lossCurrent service cost 136,230 117,487 - - 136,230 117,487 Interest cost / (income) 98,922 87,336 - - 98,922 87,336
235,152 204,823 - - 235,152 204,823 Included in other comprehensive income
The following table shows a reconciliation from the opening balances to the closing balances for net defined benefit liability for gratuity scheme and itscomponents.
--------------------------------------Rupees in '000--------------------------------------
Present value of defined benefit obligation Fair value of plan assets Net defined benefit liability
Rupees in '000
- Actuarial loss / (gain) arising on financial assumptions (100,189) 7,303 - - (100,189) 7,303 demographic assumptions - 1,096 - - - 1,096 experience adjustments - 22,114 - - - 22,114
(100,189) 30,513 - - (100,189) 30,513 OthersBenefits paid (25,697) (29,988) - - (25,697) (29,988)
Balance as at December 31, 1,001,423 892,157 - - 1,001,423 892,157
NOTES TO THE UNCONSOLIDATED FINANCIAL STATEMENTSFor the year ended December 31, 2015
Annual Report 2015166 Annual Report 2015
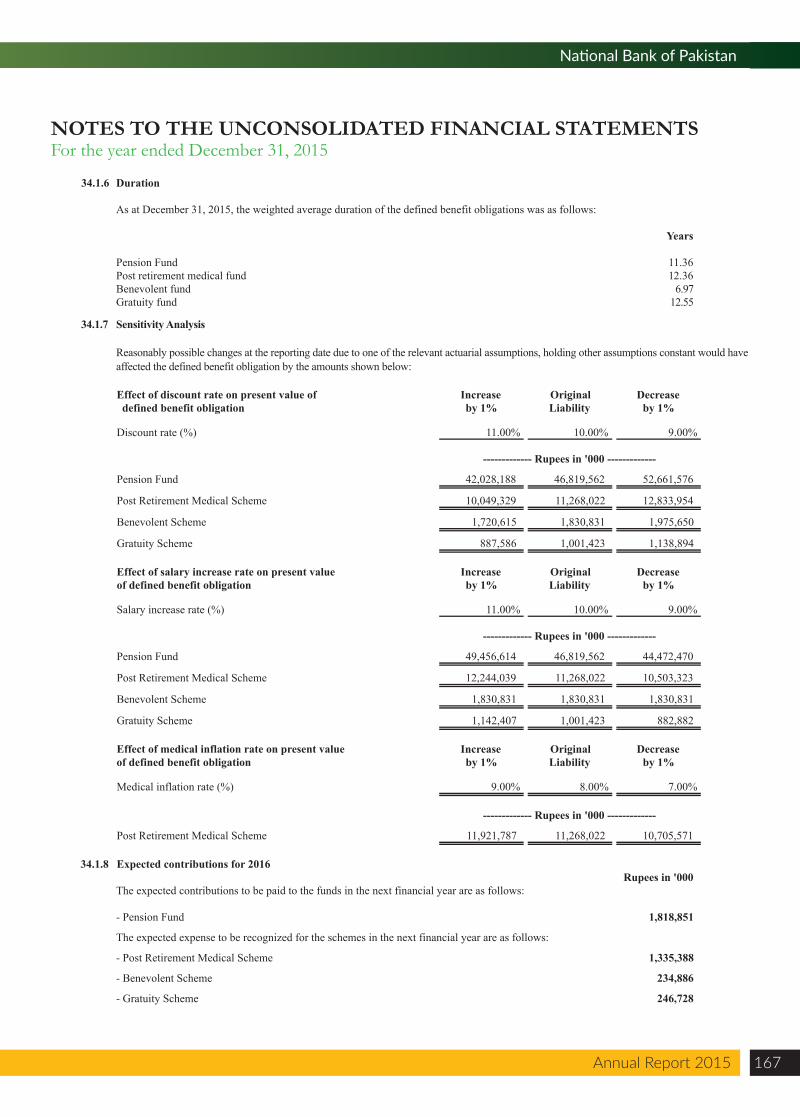
Annual Report 2015 167
National Bank of Pakistan
NOTES TO THE UNCONSOLIDATED FINANCIAL STATEMENTSFor the year ended December 31, 2015
34.1.6 Duration
As at December 31, 2015, the weighted average duration of the defined benefit obligations was as follows:
Years
Pension Fund 11.36 Post retirement medical fund 12.36 Benevolent fund 6.97 Gratuity fund 12.55
Increaseby 1%
Original Liability
Decreaseby 1%
Discount rate (%) 11.00% 10.00% 9.00%
------------- Rupees in '000 -------------
Pension Fund 42,028,188 46,819,562 52,661,576
Post Retirement Medical Scheme 10,049,329 11,268,022 12,833,954
Benevolent Scheme 1,720,615 1,830,831 1,975,650
Gratuity Scheme 887,586 1,001,423 1,138,894
Increaseby 1%
Original Liability
Decreaseby 1%
Salary increase rate (%) 11.00% 10.00% 9.00%
------------- Rupees in '000 -------------
Pension Fund 49,456,614 46,819,562 44,472,470
Post Retirement Medical Scheme 12,244,039 11,268,022 10,503,323
Benevolent Scheme 1,830,831 1,830,831 1,830,831
Gratuity Scheme 1,142,407 1,001,423 882,882
Increaseby 1%
Original Liability
Decreaseby 1%
Medical inflation rate (%) 9.00% 8.00% 7.00%
------------- Rupees in '000 -------------
Post Retirement Medical Scheme 11,921,787 11,268,022 10,705,571
34.1.8 Expected contributions for 2016Rupees in '000
The expected contributions to be paid to the funds in the next financial year are as follows:
- Pension Fund 1,818,851
The expected expense to be recognized for the schemes in the next financial year are as follows:
- Post Retirement Medical Scheme 1,335,388
- Benevolent Scheme 234,886
- Gratuity Scheme 246,728
Effect of discount rate on present value of defined benefit obligation
Effect of salary increase rate on present value of defined benefit obligation
Effect of medical inflation rate on present value of defined benefit obligation
34.1.7 Sensitivity Analysis
Reasonably possible changes at the reporting date due to one of the relevant actuarial assumptions, holding other assumptions constant would have affected the defined benefit obligation by the amounts shown below:
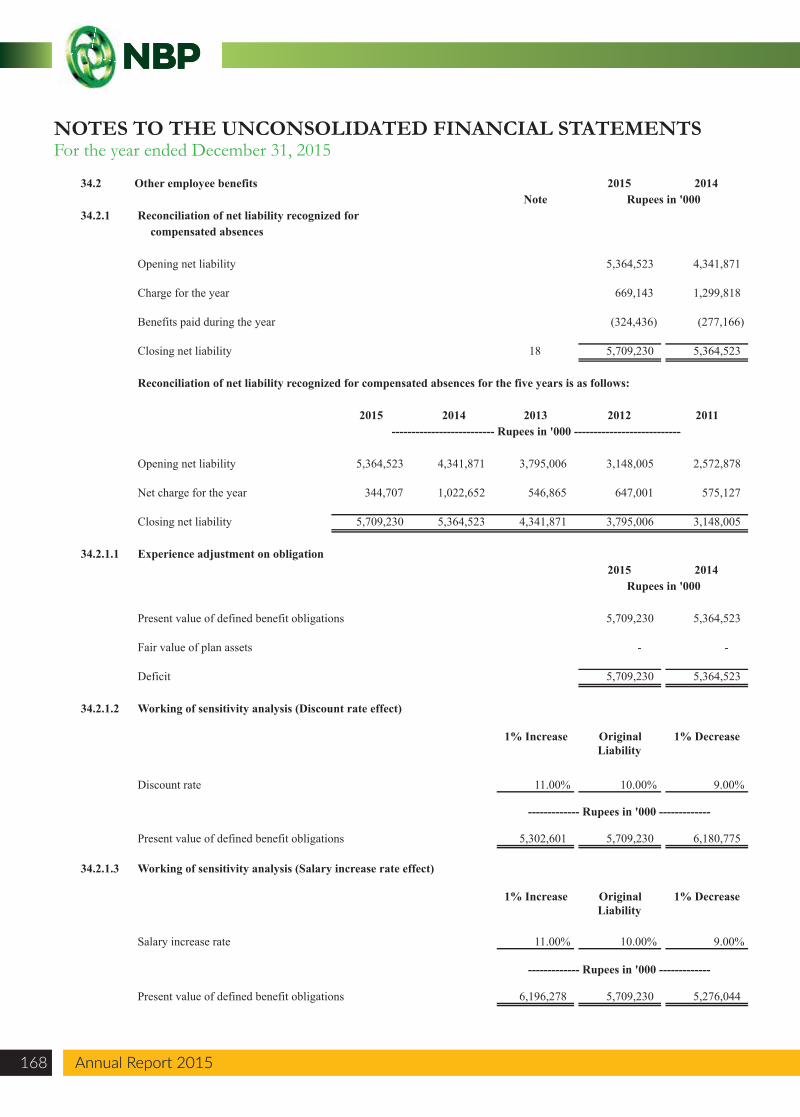
NOTES TO THE UNCONSOLIDATED FINANCIAL STATEMENTSFor the year ended December 31, 2015
Annual Report 2015168 Annual Report 2015
34.2 Other employee benefits 2015 2014Note Rupees in '000
34.2.1 Reconciliation of net liability recognized forcompensated absences
Opening net liability 5,364,523 4,341,871
Charge for the year 669,143 1,299,818
Benefits paid during the year (324,436) (277,166)
Closing net liability 18 5,709,230 5,364,523
Reconciliation of net liability recognized for compensated absences for the five years is as follows:
2015 2014 2013 2012 2011-------------------------- Rupees in '000 ---------------------------
Opening net liability 5,364,523 4,341,871 3,795,006 3,148,005 2,572,878
Net charge for the year 344,707 1,022,652 546,865 647,001 575,127
Closing net liability 5,709,230 5,364,523 4,341,871 3,795,006 3,148,005
34.2.1.1 Experience adjustment on obligation2015 2014
Rupees in '000
Present value of defined benefit obligations 5,709,230 5,364,523
Fair value of plan assets - -
Deficit 5,709,230 5,364,523
34.2.1.2 Working of sensitivity analysis (Discount rate effect)
1% Increase Original Liability
1% Decrease
Discount rate 11.00% 10.00% 9.00%
------------- Rupees in '000 -------------
Present value of defined benefit obligations 5,302,601 5,709,230 6,180,775
34.2.1.3 Working of sensitivity analysis (Salary increase rate effect)
1% Increase Original Liability
1% Decrease
Salary increase rate 11.00% 10.00% 9.00%
------------- Rupees in '000 -------------
Present value of defined benefit obligations 6,196,278 5,709,230 5,276,044
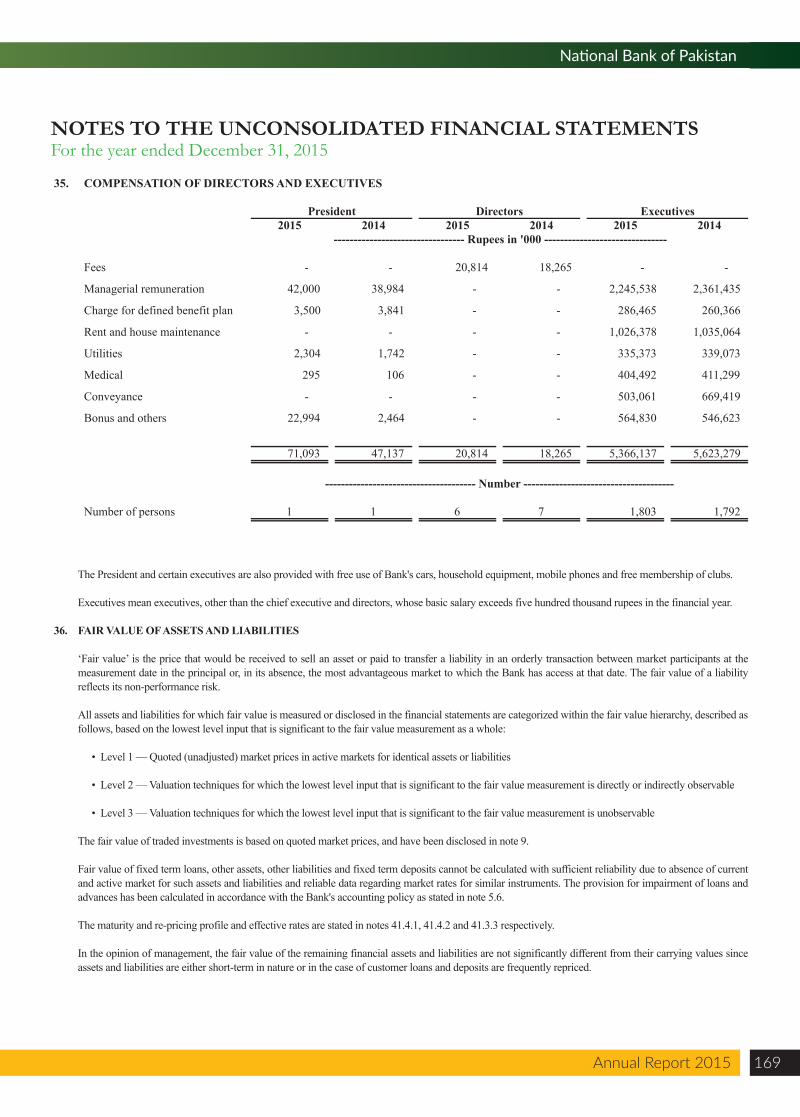
Annual Report 2015 169
National Bank of Pakistan
NOTES TO THE UNCONSOLIDATED FINANCIAL STATEMENTSFor the year ended December 31, 2015
The President and certain executives are also provided with free use of Bank's cars, household equipment, mobile phones and free membership of clubs.
Executives mean executives, other than the chief executive and directors, whose basic salary exceeds five hundred thousand rupees in the financial year.
36. FAIR VALUE OF ASSETS AND LIABILITIES
‘Fair value’ is the price that would be received to sell an asset or paid to transfer a liability in an orderly transaction between market participants at the measurement date in the principal or, in its absence, the most advantageous market to which the Bank has access at that date. The fair value of a liability reflects its non-performance risk.
All assets and liabilities for which fair value is measured or disclosed in the financial statements are categorized within the fair value hierarchy, described as follows, based on the lowest level input that is significant to the fair value measurement as a whole:
• Level 1 — Quoted (unadjusted) market prices in active markets for identical assets or liabilities
• Level 2 — Valuation techniques for which the lowest level input that is significant to the fair value measurement is directly or indirectly observable
• Level 3 — Valuation techniques for which the lowest level input that is significant to the fair value measurement is unobservable
The fair value of traded investments is based on quoted market prices, and have been disclosed in note 9.
Fair value of fixed term loans, other assets, other liabilities and fixed term deposits cannot be calculated with sufficient reliability due to absence of current and active market for such assets and liabilities and reliable data regarding market rates for similar instruments. The provision for impairment of loans and advances has been calculated in accordance with the Bank's accounting policy as stated in note 5.6.
The maturity and re-pricing profile and effective rates are stated in notes 41.4.1, 41.4.2 and 41.3.3 respectively.
In the opinion of management, the fair value of the remaining financial assets and liabilities are not significantly different from their carrying values since assets and liabilities are either short-term in nature or in the case of customer loans and deposits are frequently repriced.
35. COMPENSATION OF DIRECTORS AND EXECUTIVES
2015 2014 2015 2014 2015 2014
Fees - - 20,814 18,265 - -
Managerial remuneration 42,000 38,984 - - 2,245,538 2,361,435
Charge for defined benefit plan 3,500 3,841 - - 286,465 260,366
Rent and house maintenance - - - - 1,026,378 1,035,064
Utilities 2,304 1,742 - - 335,373 339,073
Medical 295 106 - - 404,492 411,299
Conveyance - - - - 503,061 669,419
Executives
--------------------------------- Rupees in '000 -------------------------------
President Directors
Bonus and others 22,994 2,464 - - 564,830 546,623
71,093 47,137 20,814 18,265 5,366,137 5,623,279
Number of persons 1 1 6 7 1,803 1,792
-------------------------------------- Number --------------------------------------
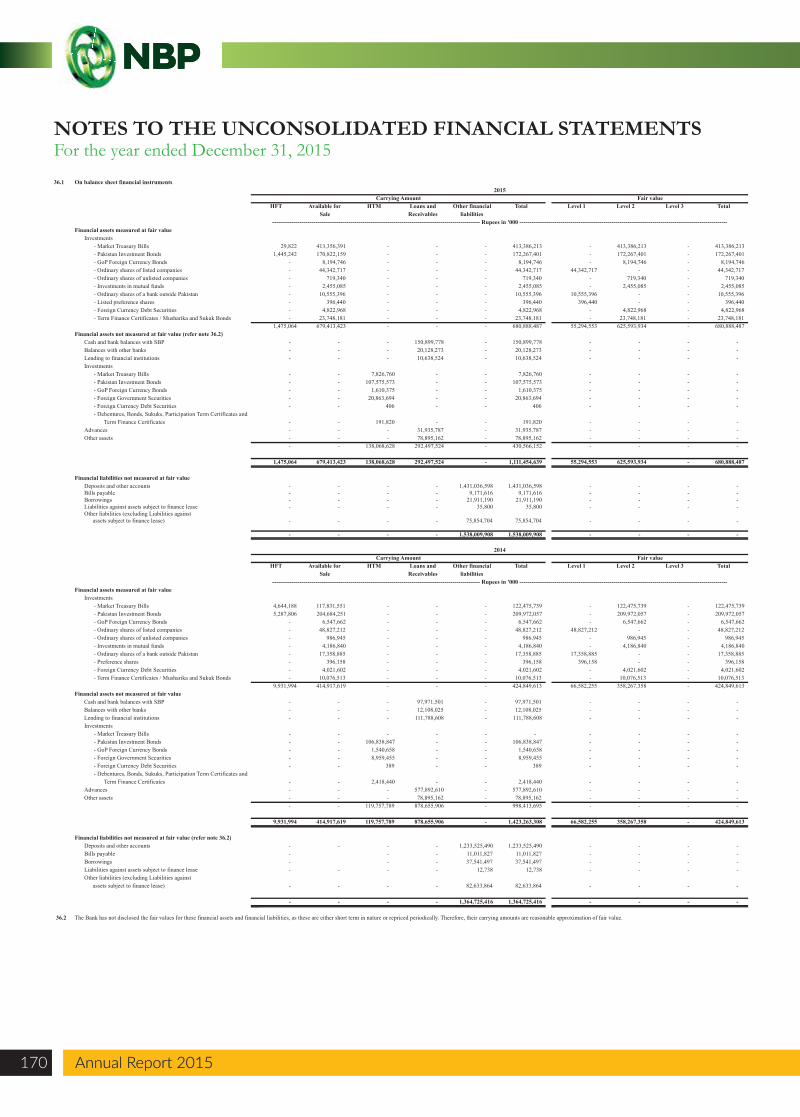
36.1 On balance sheet financial instruments
HFT Available for HTM Loans and Other financial Total Level 1 Level 2 Level 3 TotalSale Receivables liabilities
Financial assets measured at fair valueInvestments
- Market Treasury Bills 29,822 413,356,391 - - - 413,386,213 - 413,386,213 - 413,386,213 - Pakistan Investment Bonds 1,445,242 170,822,159 - - - 172,267,401 - 172,267,401 - 172,267,401 - GoP Foreign Currency Bonds - 8,194,746 - - - 8,194,746 - 8,194,746 - 8,194,746 - Ordinary shares of listed companies - 44,342,717 - - - 44,342,717 44,342,717 - - 44,342,717 - Ordinary shares of unlisted companies - 719,340 - - - 719,340 - 719,340 - 719,340 - Investments in mutual funds - 2,455,085 - - - 2,455,085 - 2,455,085 - 2,455,085 - Ordinary shares of a bank outside Pakistan - 10,555,396 - - - 10,555,396 10,555,396 - - 10,555,396 - Listed preference shares - 396,440 - - - 396,440 396,440 - - 396,440 - Foreign Currency Debt Securities - 4,822,968 - - - 4,822,968 - 4,822,968 - 4,822,968 - Term Finance Certificates / Musharika and Sukuk Bonds - 23,748,181 - - - 23,748,181 - 23,748,181 - 23,748,181
1,475,064 679,413,423 - - - 680,888,487 55,294,553 625,593,934 - 680,888,487 Financial assets not measured at fair value (refer note 36.2)
Cash and bank balances with SBP - - - 150,899,778 - 150,899,778 - - - - Balances with other banks - - - 20,128,273 - 20,128,273 - - - - Lending to financial institutions - - - 10,638,524 - 10,638,524 - - - - Investments
- Market Treasury Bills - - 7,826,760 - - 7,826,760 - - - - - Pakistan Investment Bonds - - 107,575,573 - - 107,575,573 - - - - - GoP Foreign Currency Bonds - - 1,610,375 - - 1,610,375 - - - - - Foreign Government Securities - - 20,863,694 - - 20,863,694 - - - - - Foreign Currency Debt Securities - - 406 - - 406 - - - - - Debentures, Bonds, Sukuks, Participation Term Certificates and Term Finance Certificates - - 191,820 - - 191,820 - - - -
Advances - - - 31,935,787 - 31,935,787 - - - - Other assets - - - 78,895,162 - 78,895,162 - - - -
- - 138,068,628 292,497,524 - 430,566,152 - - - -
1,475,064 679,413,423 138,068,628 292,497,524 - 1,111,454,639 55,294,553 625,593,934 - 680,888,487
Financial liabilities not measured at fair valueDeposits and other accounts - - - - 1,431,036,598 1,431,036,598 - - - - Bills payable - - - - 9,171,616 9,171,616 - - - - Borrowings - - - - 21,911,190 21,911,190 - - - - Liabilities against assets subject to finance lease - - - - 35,800 35,800 - - - - Other liabilities (excluding Liabilities against
assets subject to finance lease) - - - - 75,854,704 75,854,704 - - - -
- - - - 1,538,009,908 1,538,009,908 - - - -
HFT Available for HTM Loans and Other financial Total Level 1 Level 2 Level 3 TotalSale Receivables liabilities
Financial assets measured at fair valueInvestments
- Market Treasury Bills 4,644,188 117,831,551 - - - 122,475,739 - 122,475,739 - 122,475,739 - Pakistan Investment Bonds 5,287,806 204,684,251 - - - 209,972,057 - 209,972,057 - 209,972,057 - GoP Foreign Currency Bonds - 6,547,662 - - - 6,547,662 - 6,547,662 - 6,547,662 - Ordinary shares of listed companies - 48,827,212 - - - 48,827,212 48,827,212 - - 48,827,212 - Ordinary shares of unlisted companies - 986,945 - - - 986,945 - 986,945 - 986,945 - Investments in mutual funds - 4,186,840 - - - 4,186,840 - 4,186,840 - 4,186,840 - Ordinary shares of a bank outside Pakistan - 17,358,885 - - - 17,358,885 17,358,885 - - 17,358,885 - Preference shares - 396,158 - - - 396,158 396,158 - - 396,158 - Foreign Currency Debt Securities - 4,021,602 - - - 4,021,602 - 4,021,602 - 4,021,602 - Term Finance Certificates / Musharika and Sukuk Bonds - 10,076,513 - - - 10,076,513 - 10,076,513 - 10,076,513
9,931,994 414,917,619 - - - 424,849,613 66,582,255 358,267,358 - 424,849,613 Financial assets not measured at fair value
Cash and bank balances with SBP - - - 97,971,501 - 97,971,501 - - - - Balances with other banks - - - 12,108,025 - 12,108,025 - - - - Lending to financial institutions - - - 111,788,608 - 111,788,608 - - - - Investments
- Market Treasury Bills - - - - - - - - - - - Pakistan Investment Bonds - - 106,838,847 - - 106,838,847 - - - - - GoP Foreign Currency Bonds - - 1,540,658 - - 1,540,658 - - - - - Foreign Government Securities - - 8,959,455 - - 8,959,455 - - - - - Foreign Currency Debt Securities - - 389 - - 389 - - - - - Debentures, Bonds, Sukuks, Participation Term Certificates and Term Finance Certificates - - 2,418,440 - - 2,418,440 - - - -
Advances - - - 577,892,610 - 577,892,610 - - - - Other assets - - - 78,895,162 - 78,895,162 - - - -
- - 119,757,789 878,655,906 - 998,413,695 - - - -
9,931,994 414,917,619 119,757,789 878,655,906 - 1,423,263,308 66,582,255 358,267,358 - 424,849,613
Financial liabilities not measured at fair value (refer note 36.2)Deposits and other accounts - - - - 1,233,525,490 1,233,525,490 - - - - Bills payable - - - 11,011,827 11,011,827 - - - - Borrowings - - - 37,541,497 37,541,497 - - - - Liabilities against assets subject to finance lease - - - - 12,738 12,738 - - - - Other liabilities (excluding Liabilities against
assets subject to finance lease) - - - - 82,633,864 82,633,864 - - - -
- - - - 1,364,725,416 1,364,725,416 - - - -
36.2 The Bank has not disclosed the fair values for these financial assets and financial liabilities, as these are either short term in nature or repriced periodically. Therefore, their carrying amounts are reasonable approximation of fair value.
---------------------------------------------------------------------------------------------------------- Rupees in '000 ----------------------------------------------------------------------------------------------------------
2015 Carrying Amount Fair value
---------------------------------------------------------------------------------------------------------- Rupees in '000 ----------------------------------------------------------------------------------------------------------
2014 Carrying Amount Fair value
NOTES TO THE UNCONSOLIDATED FINANCIAL STATEMENTSFor the year ended December 31, 2015
Annual Report 2015170 Annual Report 2015
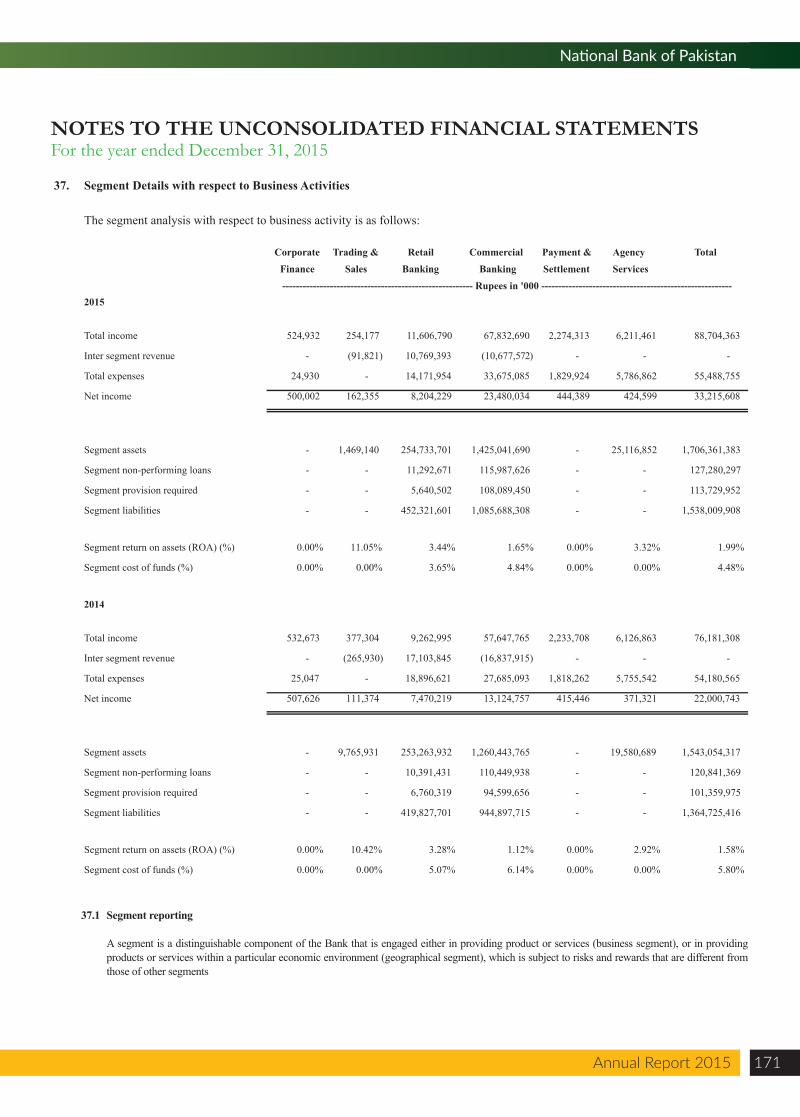
Annual Report 2015 171
National Bank of Pakistan
NOTES TO THE UNCONSOLIDATED FINANCIAL STATEMENTSFor the year ended December 31, 2015
37.1 Segment reporting
A segment is a distinguishable component of the Bank that is engaged either in providing product or services (business segment), or in providing products or services within a particular economic environment (geographical segment), which is subject to risks and rewards that are different from those of other segments
37. Segment Details with respect to Business Activities
The segment analysis with respect to business activity is as follows:
Corporate Trading & Retail Commercial Payment & Agency Finance Sales Banking Banking Settlement Services
2015
Total income 524,932 254,177 11,606,790 67,832,690 2,274,313 6,211,461 88,704,363
Inter segment revenue - (91,821) 10,769,393 (10,677,572) - - -
Total expenses 24,930 - 14,171,954 33,675,085 1,829,924 5,786,862 55,488,755
Net income 500,002 162,355 8,204,229 23,480,034 444,389 424,599 33,215,608
Segment assets - 1,469,140 254,733,701 1,425,041,690 - 25,116,852 1,706,361,383
Segment non-performing loans - - 11,292,671 115,987,626 - - 127,280,297
Segment provision required - - 5,640,502 108,089,450 - - 113,729,952
Segment liabilities - - 452,321,601 1,085,688,308 - - 1,538,009,908
Segment return on assets (ROA) (%) 0.00% 11.05% 3.44% 1.65% 0.00% 3.32% 1.99%
Segment cost of funds (%) 0.00% 0.00% 3.65% 4.84% 0.00% 0.00% 4.48%
2014
Total income 532,673 377,304 9,262,995 57,647,765 2,233,708 6,126,863 76,181,308
Inter segment revenue - (265,930) 17,103,845 (16,837,915) - - -
Total expenses 25,047 - 18,896,621 27,685,093 1,818,262 5,755,542 54,180,565
Net income 507,626 111,374 7,470,219 13,124,757 415,446 371,321 22,000,743
Segment assets - 9,765,931 253,263,932 1,260,443,765 - 19,580,689 1,543,054,317
Segment non-performing loans - - 10,391,431 110,449,938 - - 120,841,369
Segment provision required - - 6,760,319 94,599,656 - - 101,359,975
Segment liabilities - - 419,827,701 944,897,715 - - 1,364,725,416
Segment return on assets (ROA) (%) 0.00% 10.42% 3.28% 1.12% 0.00% 2.92% 1.58%
Segment cost of funds (%) 0.00% 0.00% 5.07% 6.14% 0.00% 0.00% 5.80%
Total
-------------------------------------------------------- Rupees in '000 --------------------------------------------------------
37.1.1 Business segments
Corporate finance
Corporate banking includes, services provided in connection with mergers and acquisition, underwriting, privatization, securitization, research, debts (government, high yield), equity, syndication, IPO and secondary private placements.
Trading and sales
It includes fixed income, equity, foreign exchanges, commodities, credit, funding, own position securities, lending and repos, brokerage debt and prime brokerage.
Retail banking
It includes retail lending and deposits, banking services, trust and estates, private lending and deposits, trust and estates investment advice, merchant / commercial and private labels and retail.
Commercial banking
Commercial banking includes project finance, real estate, export finance, trade finance, factoring, lending, guarantees, bills of exchange and deposits.
Payment and settlement
It includes payments and collections, funds transfer, clearing and settlement.
Agency services
It includes escrow, depository receipts, securities lending (customers), corporate actions, issuer and paying agents.
38. TRUST ACTIVITIES
38.1 Long-Term Credit Fund (LTCF)
Consequent upon the NDFC's amalgamation, the Bank manages on behalf of the GoP, LTCF established from the proceeds of loans disbursed by various international funding agencies for financing private sector energy development projects. Fund assets are accounted for separately from those of the Bank and amounted to Rs. 54,516 million on December 31, 2015 (2014: Rs. 57,088 million).
38.2 Endowment Fund
Students Loan Scheme was launched by Government of Pakistan with collaboration with the major commercial banks with a view to extend financial help by way of mark-up free loan to the meritorious students without sufficient resources for pursuing scientific technical and professional education within Pakistan.
The Scheme is being administered by a high powered committee headed by the Deputy Governor, State Bank of Pakistan and the President’s of NBP, HBL, UBL, MCB, ABL and the Deputy Secretary, Ministry of Finance as member and Senior Director of SMEFD (Infra Housing & SME Finance Department) as a secretary of the Committee. The State Bank of Pakistan has assigned National Bank of Pakistan to operate the scheme.
The Committee in its meeting held on August 7, 2001 approved creation of Endowment Fund initially at an amount of Rs. 500 million, Rs.396 million were transferred from the old Qarz-e-Hasna Fund, Rs. 50 million contributed by Government of Pakistan and Rs. 54 million were contributed by participating banks (HBL, NBP and UBL 25% each, MCB 17.5% and ABL 7.5%).
The amount of the endowment fund in investments stands at Rs. 667 million as at December 31, 2015 (2014 Rs. 548 million).
NOTES TO THE UNCONSOLIDATED FINANCIAL STATEMENTSFor the year ended December 31, 2015
Annual Report 2015172 Annual Report 2015
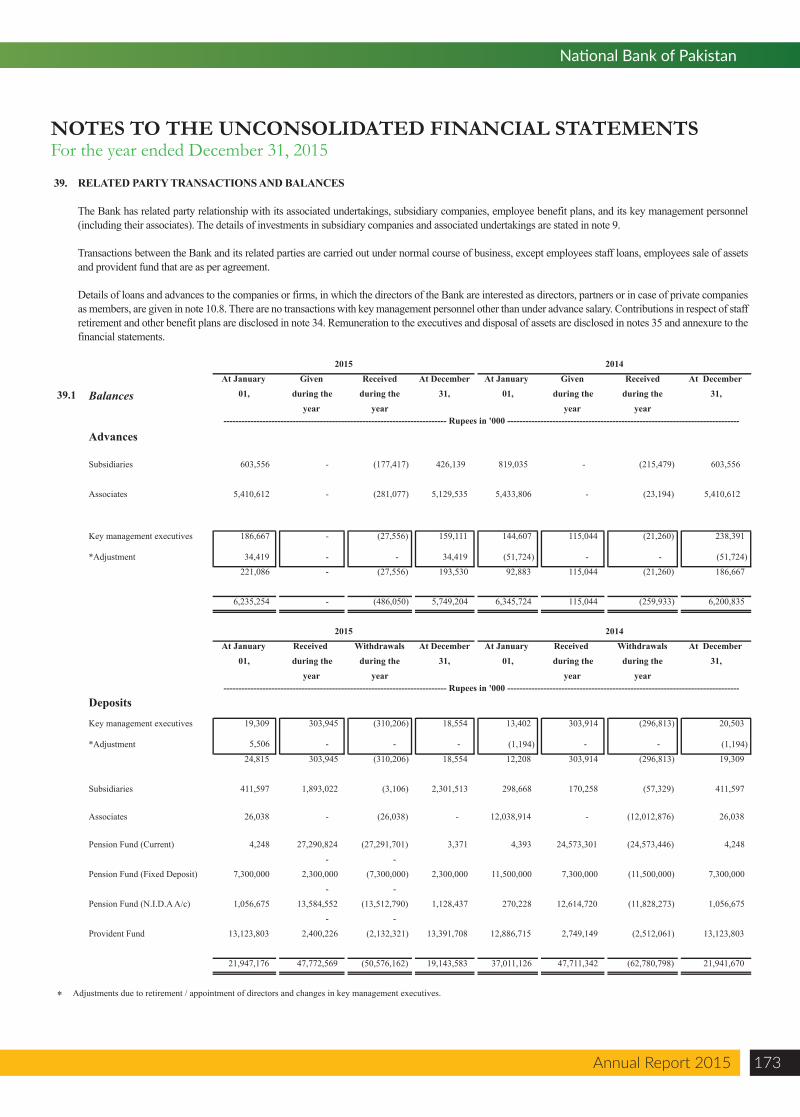
Annual Report 2015 173
National Bank of Pakistan
NOTES TO THE UNCONSOLIDATED FINANCIAL STATEMENTSFor the year ended December 31, 2015
39. RELATED PARTY TRANSACTIONS AND BALANCES
The Bank has related party relationship with its associated undertakings, subsidiary companies, employee benefit plans, and its key management personnel (including their associates). The details of investments in subsidiary companies and associated undertakings are stated in note 9.
Transactions between the Bank and its related parties are carried out under normal course of business, except employees staff loans, employees sale of assets and provident fund that are as per agreement.
Details of loans and advances to the companies or firms, in which the directors of the Bank are interested as directors, partners or in case of private companies as members, are given in note 10.8. There are no transactions with key management personnel other than under advance salary. Contributions in respect of staff retirement and other benefit plans are disclosed in note 34. Remuneration to the executives and disposal of assets are disclosed in notes 35 and annexure to the financial statements.
At January Given Received At December At January Given Received At December
39.1 Balances 01, during the during the 31, 01, during the during the 31,year year year year
Advances
Subsidiaries 603,556 - (177,417) 426,139 819,035 - (215,479) 603,556
Associates 5,410,612 - (281,077) 5,129,535 5,433,806 - (23,194) 5,410,612
Key management executives 186,667 -
- - - -
(27,556) 159,111 144,607 115,044 (21,260) 238,391
*Adjustment 34,419 34,419 (51,724) (51,724)
221,086 - (27,556) 193,530 92,883 115,044 (21,260) 186,667
6,235,254 - (486,050) 5,749,204 6,345,724 115,044 (259,933) 6,200,835
At January Received Withdrawals At December At January Received Withdrawals At December 01, during the during the 31, 01, during the during the 31,
year year year year
Deposits
Key management executives 19,309 303,945 (310,206) 18,554 13,402 303,914 (296,813) 20,503
*Adjustment 5,506 (1,194) (1,194)
24,815 303,945 (310,206) 18,554 12,208 303,914 (296,813) 19,309
Subsidiaries 411,597 1,893,022 (3,106) 2,301,513 298,668 170,258 (57,329) 411,597
Associates 26,038 -
- - - - -
(26,038) - 12,038,914 - (12,012,876) 26,038
Pension Fund (Current) 4,248 27,290,824 (27,291,701) 3,371 4,393 24,573,301 (24,573,446) 4,248
- -
Pension Fund (Fixed Deposit) 7,300,000 2,300,000 (7,300,000) 2,300,000 11,500,000 7,300,000 (11,500,000) 7,300,000
- -
Pension Fund (N.I.D.A A/c) 1,056,675 13,584,552 (13,512,790) 1,128,437 270,228 12,614,720 (11,828,273) 1,056,675
- -
Provident Fund 13,123,803 2,400,226 (2,132,321) 13,391,708 12,886,715 2,749,149 (2,512,061) 13,123,803
21,947,176 47,772,569 (50,576,162) 19,143,583 37,011,126 47,711,342 (62,780,798) 21,941,670
Adjustments due to retirement / appointment of directors and changes in key management executives.
-------------------------------------------------------------------------- Rupees in '000 -----------------------------------------------------------------------------
2015 2014
-------------------------------------------------------------------------- Rupees in '000 -----------------------------------------------------------------------------
2015 2014
*
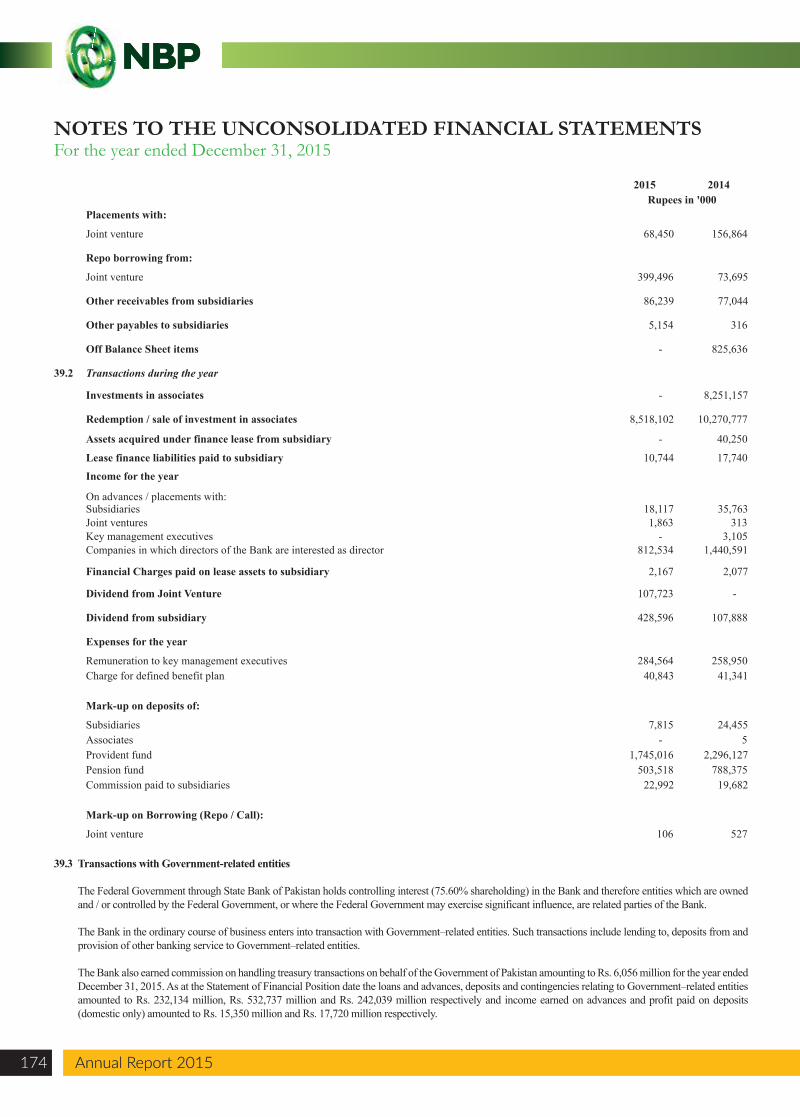
39.3 Transactions with Government-related entities
The Federal Government through State Bank of Pakistan holds controlling interest (75.60% shareholding) in the Bank and therefore entities which are owned and / or controlled by the Federal Government, or where the Federal Government may exercise significant influence, are related parties of the Bank.
The Bank in the ordinary course of business enters into transaction with Government–related entities. Such transactions include lending to, deposits from and provision of other banking service to Government–related entities.
The Bank also earned commission on handling treasury transactions on behalf of the Government of Pakistan amounting to Rs. 6,056 million for the year ended December 31, 2015. As at the Statement of Financial Position date the loans and advances, deposits and contingencies relating to Government–related entities amounted to Rs. 232,134 million, Rs. 532,737 million and Rs. 242,039 million respectively and income earned on advances and profit paid on deposits (domestic only) amounted to Rs. 15,350 million and Rs. 17,720 million respectively.
2015 2014Rupees in '000
Placements with:
Joint venture 68,450 156,864
Repo borrowing from:
Joint venture 399,496 73,695
Other receivables from subsidiaries 86,239 77,044
Other payables to subsidiaries 5,154
316
Off Balance Sheet items -
825,636
39.2 Transactions during the year
Investments in associates - 8,251,157
Redemption / sale of investment in associates 8,518,102 10,270,777
Assets acquired under finance lease from subsidiary - 40,250
Lease finance liabilities paid to subsidiary 10,744 17,740
Income for the year
On advances / placements with:Subsidiaries 18,117 35,763 Joint ventures 1,863 313 Key management executives - 3,105 Companies in which directors of the Bank are interested as director 812,534 1,440,591
Financial Charges paid on lease assets to subsidiary 2,167 2,077
Dividend from Joint Venture 107,723 -
Dividend from subsidiary 428,596 107,888
Expenses for the year
Remuneration to key management executives 284,564 258,950 Charge for defined benefit plan 40,843 41,341
Mark-up on deposits of:
Subsidiaries 7,815 24,455 Associates - 5 Provident fund 1,745,016 2,296,127 Pension fund 503,518 788,375 Commission paid to subsidiaries 22,992 19,682
Mark-up on Borrowing (Repo / Call):
Joint venture 106 527
NOTES TO THE UNCONSOLIDATED FINANCIAL STATEMENTSFor the year ended December 31, 2015
Annual Report 2015174 Annual Report 2015
Annual Report 2015 175
National Bank of Pakistan
NOTES TO THE UNCONSOLIDATED FINANCIAL STATEMENTSFor the year ended December 31, 2015
40. CAPITAL ASSESSMENT AND ADEQUACY
40.1 Statutory minimum capital requirement and management of capital
The Bank's objectives when managing capital, which is a broader concept than the 'equity' on the face of the statement of financial position, are: - to comply with the capital requirements set by the regulators of the banking markets where the Bank operates;
- to safeguard the Bank's ability to continue as a going concern so that it can continue to provide returns for shareholders and benefits for other stakeholders; and
- to maintain a strong capital base to support the development of its business.
The SBP has issued instructions for Basel-III Implementation vide BPRD Circular No. 06 of 2013 dated August 15, 2013. These instructions are effective from December 31, 2013 in a phased manner with full implementation intended by December 31, 2019.
Basel-III instructions comprises of the following three capital standards:
i. Minimum Capital Requirement (MCR):
The MCR standard sets the nominal amount of capital banks/ DFIs are required to hold. Currently the MCR for banks and DFIs is Rs. 10 billion as prescribed by SBP.
ii. Capital Adequacy Ratio:
The Capital Adequacy Ratio (CAR) assesses the capital requirement based on the risks faced by the banks/ DFIs. The banks/ DFIs are required to comply with the minimum requirements as specified by the SBP on standalone as well as consolidated basis. Currently the required CAR for banks is 10.25%.
iii. Leverage Ratio:
Tier-1 Leverage Ratio of 3% is being introduced in response to the recently published Basel III Accord as the third capital standard. Bank level disclosure of the leverage ratio and its components has started from December 31, 2015. The bank has a leverage ratio of 4.45% in the year December 31, 2015 (2014:5.32%) and Tier-1 capital of Rs 91,751 Million (2014: Rs 95,840 Million).
The major changes under the Basel III reform package pertains to numerator of the Capital Adequacy Ratio (CAR) i.e., eligible capital. The SBP's regulatory capital as managed by the Bank is analysed into following tiers:
1. Tier 1 Capital (going-concern capital)
• Common Equity Tier 1 • Additional Tier 1
2. Tier 2 Capital (gone-concern capital)
- Tier I capital, which comprises highest quality capital element and include fully paid up capital, balance in share premium account, reserve for issue of bonus shares, general reserves and un-appropriate profits (net of accumulated losses, if any).
- Tier II capital, which includes general reserve for loan losses, revaluation reserve, exchange translation reserve and subordinated debt.
- Tier III capital, has been eliminated in Basel III Capital requirements. Also the Basel III capital rules requires bank to make certain deductions from the capital before arriving at the Capital Adequacy Ratio (CAR). These deductions are to be done in phased manner starting from 2014, with full deductions in 2018.
Risk weighted assets are measured according to the nature and reflect an estimate of credit, market and other risks associated with each asset and counterparty, taking into account any eligible collateral or guarantees. A similar treatment is adopted for off balance sheet exposures, with some adjustments to reflect more contingent nature of potential losses.
The Bank's policy is to maintain strong capital base so as to maintain, investor, creditor and market confidence and to sustain future development of the business. The adequacy of the Bank's capital is monitored using, among other measures, the rules and ratios established by the SBP. The ratios compare the amount of eligible capital with the total of risk-weighted assets. The Bank monitors and reports its capital ratio under the SBP rules, which ultimately determines the regulatory capital, required to be maintained by Banks and DFIs.
The paid-up capital of the Bank for the year ended December 31, 2015 stood at Rs. 21,275 million (2014 : Rs. 21,275 million) and is in compliance with the SBP requirement for the said year. In addition the Bank has maintained minimum Capital Adequacy Ratio (CAR) of 17.59.% (2014: 17.39%).
There have been no material changes in the Bank's management of capital during the year.
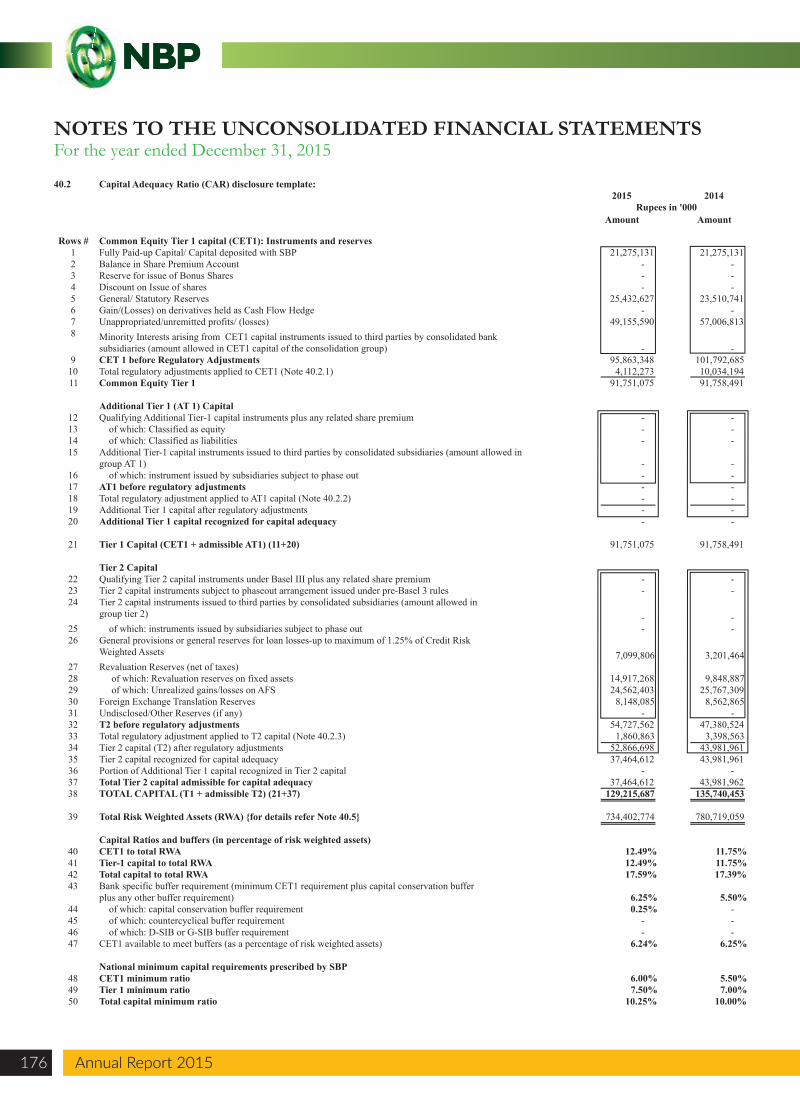
40.2 Capital Adequacy Ratio (CAR) disclosure template:2015 2014
Amount Amount
Rows # Common Equity Tier 1 capital (CET1): Instruments and reserves1 Fully Paid-up Capital/ Capital deposited with SBP 21,275,131 21,275,131 2 Balance in Share Premium Account - - 3 Reserve for issue of Bonus Shares - - 4 Discount on Issue of shares - - 5 General/ Statutory Reserves 25,432,627 23,510,741 6 Gain/(Losses) on derivatives held as Cash Flow Hedge - - 7 Unappropriated/unremitted profits/ (losses) 49,155,590 57,006,813 8 Minority Interests arising from CET1 capital instruments issued to third parties by consolidated bank
subsidiaries (amount allowed in CET1 capital of the consolidation group) - - 9 CET 1 before Regulatory Adjustments 95,863,348 101,792,685
10 Total regulatory adjustments applied to CET1 (Note 40.2.1) 4,112,273 10,034,194 11 Common Equity Tier 1 91,751,075 91,758,491
Additional Tier 1 (AT 1) Capital12 Qualifying Additional Tier-1 capital instruments plus any related share premium - - 13 of which: Classified as equity - - 14 of which: Classified as liabilities - - 15 Additional Tier-1 capital instruments issued to third parties by consolidated subsidiaries (amount allowed in
group AT 1) - - 16 of which: instrument issued by subsidiaries subject to phase out - - 17 AT1 before regulatory adjustments - - 18 Total regulatory adjustment applied to AT1 capital (Note 40.2.2) -
- -
19 Additional Tier 1 capital after regulatory adjustments - 20 Additional Tier 1 capital recognized for capital adequacy - -
21 Tier 1 Capital (CET1 + admissible AT1) (11+20) 91,751,075 91,758,491
Tier 2 Capital22 Qualifying Tier 2 capital instruments under Basel III plus any related share premium - - 23 Tier 2 capital instruments subject to phaseout arrangement issued under pre-Basel 3 rules - - 24 Tier 2 capital instruments issued to third parties by consolidated subsidiaries (amount allowed in
group tier 2) - - 25 of which: instruments issued by subsidiaries subject to phase out - - 26 General provisions or general reserves for loan losses-up to maximum of 1.25% of Credit Risk
Weighted Assets 7,099,806 3,201,464 27 Revaluation Reserves (net of taxes)28 of which: Revaluation reserves on fixed assets 14,917,268 9,848,887 29 of which: Unrealized gains/losses on AFS 24,562,403 25,767,309 30 Foreign Exchange Translation Reserves 8,148,085 8,562,865 31 Undisclosed/Other Reserves (if any) - - 32 T2 before regulatory adjustments 54,727,562 47,380,524 33 Total regulatory adjustment applied to T2 capital (Note 40.2.3) 1,860,863 3,398,563 34 Tier 2 capital (T2) after regulatory adjustments 52,866,698 43,981,961 35 Tier 2 capital recognized for capital adequacy 37,464,612 43,981,961 36 Portion of Additional Tier 1 capital recognized in Tier 2 capital - - 37 Total Tier 2 capital admissible for capital adequacy 37,464,612 43,981,962 38 TOTAL CAPITAL (T1 + admissible T2) (21+37) 129,215,687 135,740,453
39 Total Risk Weighted Assets (RWA) {for details refer Note 40.5} 734,402,774 780,719,059
Capital Ratios and buffers (in percentage of risk weighted assets)40 CET1 to total RWA 12.49% 11.75%41 Tier-1 capital to total RWA 12.49% 11.75%42 Total capital to total RWA 17.59% 17.39%43 Bank specific buffer requirement (minimum CET1 requirement plus capital conservation buffer
plus any other buffer requirement) 6.25% 5.50%44 of which: capital conservation buffer requirement 0.25% - 45 of which: countercyclical buffer requirement - - 46 of which: D-SIB or G-SIB buffer requirement - - 47 CET1 available to meet buffers (as a percentage of risk weighted assets) 6.24% 6.25%
National minimum capital requirements prescribed by SBP48 CET1 minimum ratio 6.00% 5.50%49 Tier 1 minimum ratio 7.50% 7.00%50 Total capital minimum ratio 10.25% 10.00%
Rupees in '000
NOTES TO THE UNCONSOLIDATED FINANCIAL STATEMENTSFor the year ended December 31, 2015
Annual Report 2015176 Annual Report 2015
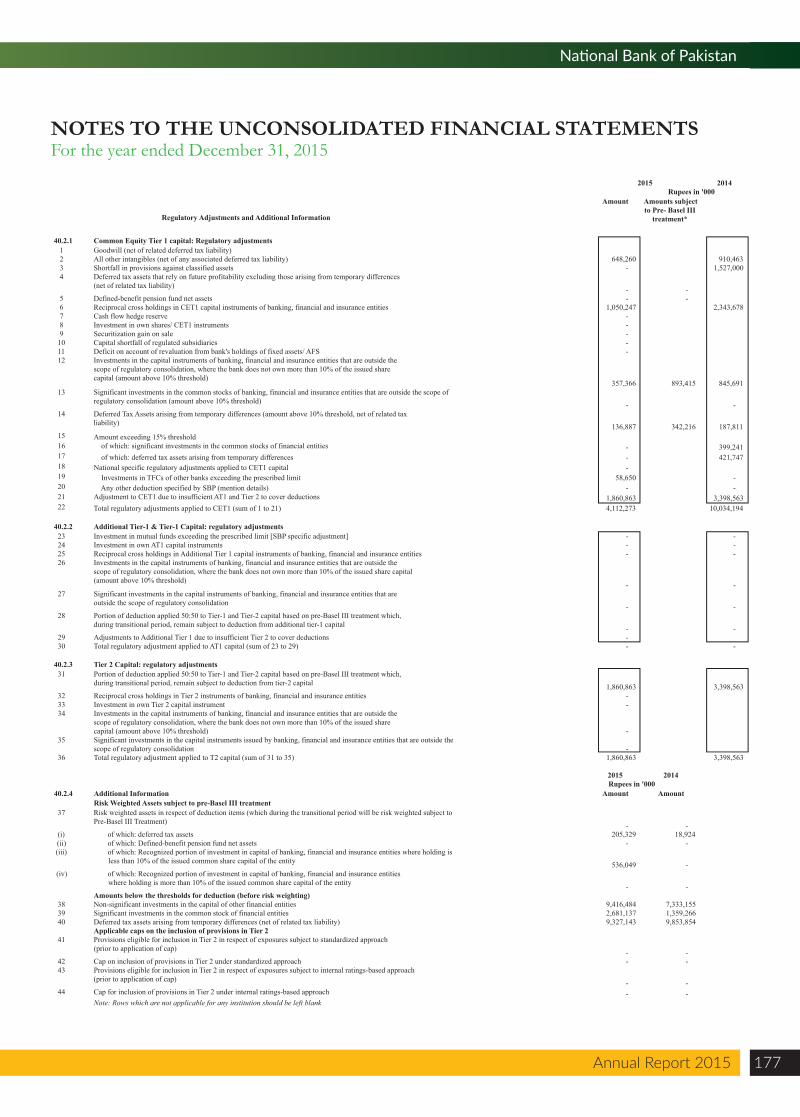
Annual Report 2015 177
National Bank of Pakistan
NOTES TO THE UNCONSOLIDATED FINANCIAL STATEMENTSFor the year ended December 31, 2015
2014
Amount Amounts subject to Pre- Basel III
treatment*
40.2.1 Common Equity Tier 1 capital: Regulatory adjustments1 Goodwill (net of related deferred tax liability)2 All other intangibles (net of any associated deferred tax liability) 648,260 910,463 3 Shortfall in provisions against classified assets - 1,527,000 4 Deferred tax assets that rely on future profitability excluding those arising from temporary differences
(net of related tax liability) - - 5 Defined-benefit pension fund net assets - - 6 Reciprocal cross holdings in CET1 capital instruments of banking, financial and insurance entities 1,050,247 2,343,678 7 Cash flow hedge reserve - 8 Investment in own shares/ CET1 instruments - 9 Securitization gain on sale -
10 Capital shortfall of regulated subsidiaries - 11 Deficit on account of revaluation from bank's holdings of fixed assets/ AFS - 12 Investments in the capital instruments of banking, financial and insurance entities that are outside the
scope of regulatory consolidation, where the bank does not own more than 10% of the issued share capital (amount above 10% threshold)
357,366 893,415 845,691 13 Significant investments in the common stocks of banking, financial and insurance entities that are outside the scope of
regulatory consolidation (amount above 10% threshold) - - 14 Deferred Tax Assets arising from temporary differences (amount above 10% threshold, net of related tax
liability) 136,887 342,216 187,811 15 Amount exceeding 15% threshold 16 of which: significant investments in the common stocks of financial entities - 399,241 17 of which: deferred tax assets arising from temporary differences - 421,747 18 National specific regulatory adjustments applied to CET1 capital - 19 Investments in TFCs of other banks exceeding the prescribed limit 58,650 - 20 Any other deduction specified by SBP (mention details) - - 21 Adjustment to CET1 due to insufficient AT1 and Tier 2 to cover deductions 1,860,863 3,398,563 22 Total regulatory adjustments applied to CET1 (sum of 1 to 21) 4,112,273 10,034,194
40.2.2 Additional Tier-1 & Tier-1 Capital: regulatory adjustments23 Investment in mutual funds exceeding the prescribed limit [SBP specific adjustment] - - 24 Investment in own AT1 capital instruments - - 25 Reciprocal cross holdings in Additional Tier 1 capital instruments of banking, financial and insurance entities - - 26 Investments in the capital instruments of banking, financial and insurance entities that are outside the
scope of regulatory consolidation, where the bank does not own more than 10% of the issued share capital (amount above 10% threshold) - -
27 Significant investments in the capital instruments of banking, financial and insurance entities that are outside the scope of regulatory consolidation - -
28 Portion of deduction applied 50:50 to Tier-1 and Tier-2 capital based on pre-Basel III treatment which, during transitional period, remain subject to deduction from additional tier-1 capital - -
29 Adjustments to Additional Tier 1 due to insufficient Tier 2 to cover deductions - 30 Total regulatory adjustment applied to AT1 capital (sum of 23 to 29) - -
40.2.3 Tier 2 Capital: regulatory adjustments31 Portion of deduction applied 50:50 to Tier-1 and Tier-2 capital based on pre-Basel III treatment which,
during transitional period, remain subject to deduction from tier-2 capital 1,860,863 3,398,56332 Reciprocal cross holdings in Tier 2 instruments of banking, financial and insurance entities - 33 Investment in own Tier 2 capital instrument - 34 Investments in the capital instruments of banking, financial and insurance entities that are outside the
scope of regulatory consolidation, where the bank does not own more than 10% of the issued share capital (amount above 10% threshold) -
35 Significant investments in the capital instruments issued by banking, financial and insurance entities that are outside the scope of regulatory consolidation -
36 Total regulatory adjustment applied to T2 capital (sum of 31 to 35) 1,860,863 3,398,563
2015 2014 Rupees in '000
40.2.4 Additional Information Amount Amount Risk Weighted Assets subject to pre-Basel III treatment
37 Risk weighted assets in respect of deduction items (which during the transitional period will be risk weighted subject to Pre-Basel III Treatment) - -
(i) of which: deferred tax assets 205,329 18,924 (ii) of which: Defined-benefit pension fund net assets - - (iii) of which: Recognized portion of investment in capital of banking, financial and insurance entities where holding is
less than 10% of the issued common share capital of the entity 536,049 - (iv) of which: Recognized portion of investment in capital of banking, financial and insurance entities
where holding is more than 10% of the issued common share capital of the entity - - Amounts below the thresholds for deduction (before risk weighting)
38 Non-significant investments in the capital of other financial entities 9,416,484 7,333,155 39 Significant investments in the common stock of financial entities 2,681,137 1,359,266 40 Deferred tax assets arising from temporary differences (net of related tax liability) 9,327,143 9,853,854
Applicable caps on the inclusion of provisions in Tier 241 Provisions eligible for inclusion in Tier 2 in respect of exposures subject to standardized approach
(prior to application of cap) - - 42 Cap on inclusion of provisions in Tier 2 under standardized approach - - 43 Provisions eligible for inclusion in Tier 2 in respect of exposures subject to internal ratings-based approach
(prior to application of cap) - - 44 Cap for inclusion of provisions in Tier 2 under internal ratings-based approach - -
2015Rupees in '000
Regulatory Adjustments and Additional Information
Note: Rows which are not applicable for any institution should be left blank
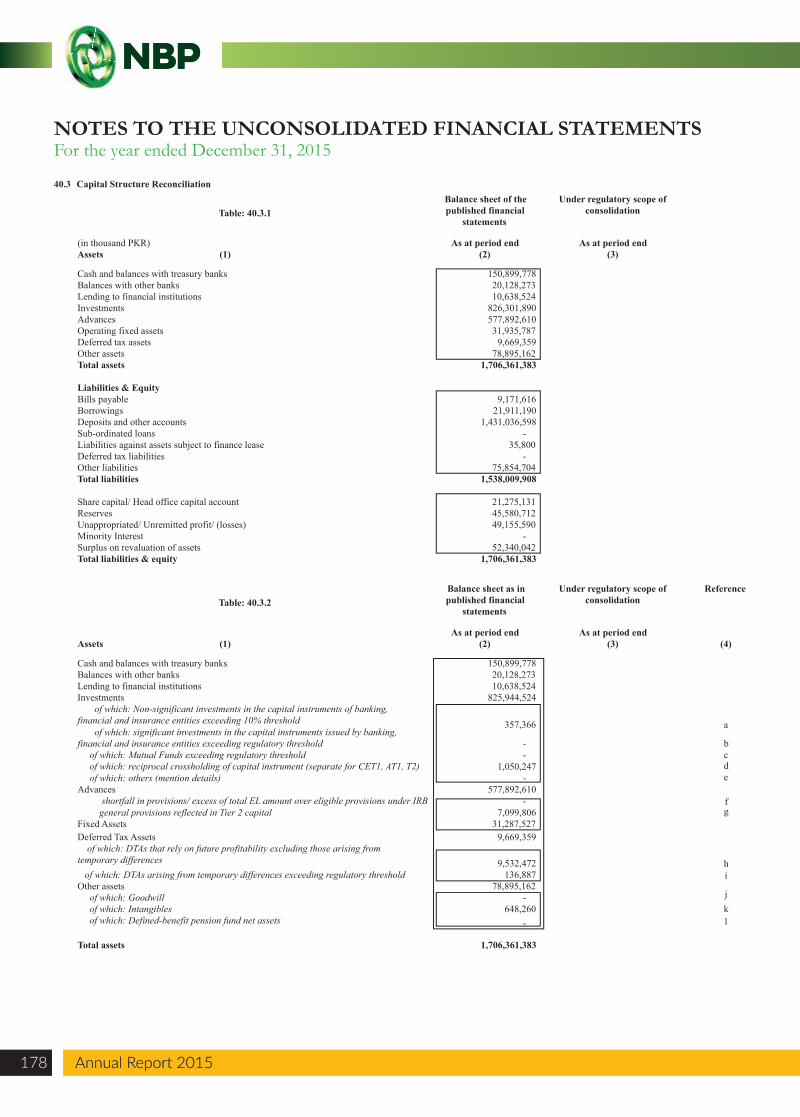
NOTES TO THE UNCONSOLIDATED FINANCIAL STATEMENTSFor the year ended December 31, 2015
Annual Report 2015178 Annual Report 2015
40.3 Capital Structure Reconciliation
Table: 40.3.1 Balance sheet of the published financial
statements
Under regulatory scope of consolidation
(in thousand PKR) As at period end As at period endAssets (1) (2) (3)
Cash and balances with treasury banks 150,899,778 Balances with other banks 20,128,273 Lending to financial institutions 10,638,524 Investments 826,301,890 Advances 577,892,610 Operating fixed assets 31,935,787 Deferred tax assets 9,669,359 Other assets 78,895,162 Total assets 1,706,361,383
Liabilities & EquityBills payable 9,171,616 Borrowings 21,911,190 Deposits and other accounts 1,431,036,598 Sub-ordinated loans - Liabilities against assets subject to finance lease 35,800 Deferred tax liabilities - Other liabilities 75,854,704 Total liabilities 1,538,009,908
Share capital/ Head office capital account 21,275,131 Reserves 45,580,712 Unappropriated/ Unremitted profit/ (losses) 49,155,590 Minority Interest - Surplus on revaluation of assets 52,340,042 Total liabilities & equity 1,706,361,383
Table: 40.3.2 Balance sheet as in published financial
statements
Under regulatory scope of consolidation
Reference
As at period end As at period endAssets (1) (2) (3) (4)
Cash and balances with treasury banks 150,899,778 Balances with other banks 20,128,273 Lending to financial institutions 10,638,524 Investments 825,944,524 of which: Non-significant investments in the capital instruments of banking, financial and insurance entities exceeding 10% threshold 357,366 a of which: significant investments in the capital instruments issued by banking, financial and insurance entities exceeding regulatory threshold - b of which: Mutual Funds exceeding regulatory threshold - c of which: reciprocal crossholding of capital instrument (separate for CET1, AT1, T2) 1,050,247 d of which: others (mention details) - eAdvances 577,892,610 shortfall in provisions/ excess of total EL amount over eligible provisions under IRB - f general provisions reflected in Tier 2 capital 7,099,806 gFixed Assets 31,287,527 Deferred Tax Assets 9,669,359 of which: DTAs that rely on future profitability excluding those arising from temporary differences 9,532,472 h of which: DTAs arising from temporary differences exceeding regulatory threshold 136,887 iOther assets 78,895,162 of which: Goodwill - j of which: Intangibles 648,260 k of which: Defined-benefit pension fund net assets - l
Total assets 1,706,361,383
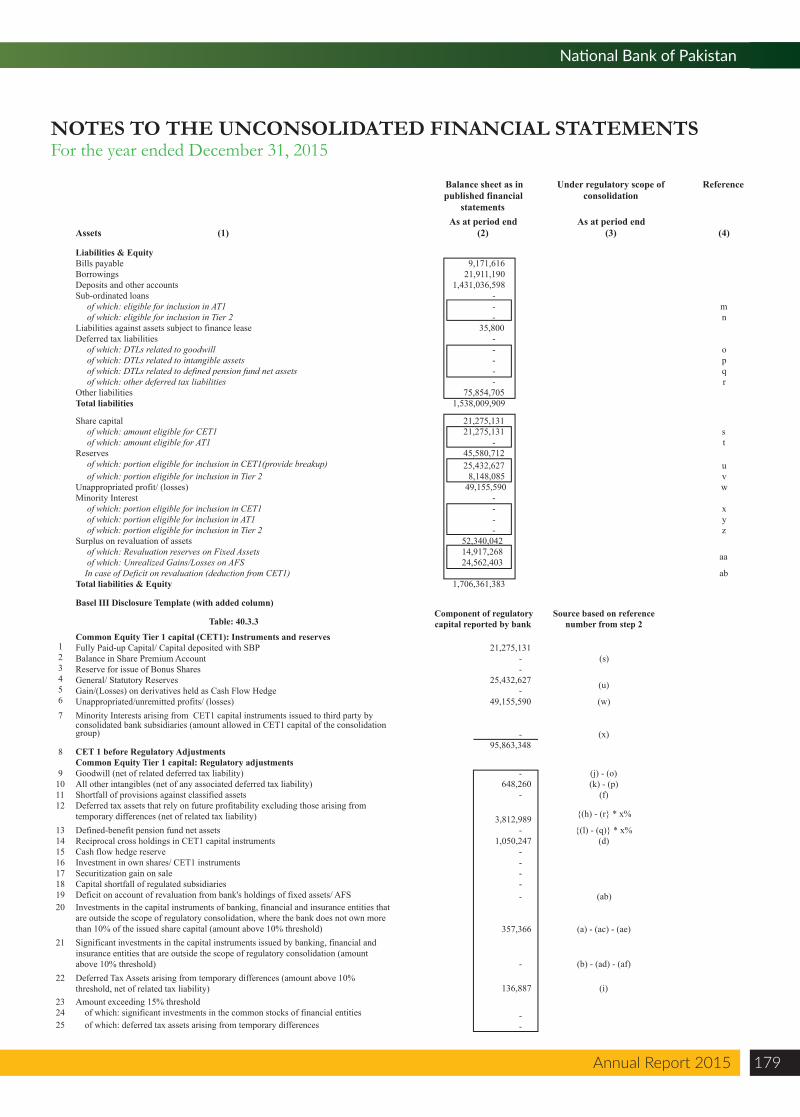
Annual Report 2015 179
National Bank of Pakistan
NOTES TO THE UNCONSOLIDATED FINANCIAL STATEMENTSFor the year ended December 31, 2015
Liabilities & EquityBills payable 9,171,616 Borrowings 21,911,190 Deposits and other accounts 1,431,036,598 Sub-ordinated loans - of which: eligible for inclusion in AT1 - m of which: eligible for inclusion in Tier 2 - nLiabilities against assets subject to finance lease 35,800 Deferred tax liabilities - of which: DTLs related to goodwill - o of which: DTLs related to intangible assets - p of which: DTLs related to defined pension fund net assets - q of which: other deferred tax liabilities - rOther liabilities 75,854,705 Total liabilities 1,538,009,909
Share capital 21,275,131 of which: amount eligible for CET1 21,275,131 s of which: amount eligible for AT1 - tReserves 45,580,712 of which: portion eligible for inclusion in CET1(provide breakup) 25,432,627 u of which: portion eligible for inclusion in Tier 2 8,148,085 vUnappropriated profit/ (losses) 49,155,590 wMinority Interest - of which: portion eligible for inclusion in CET1 - x of which: portion eligible for inclusion in AT1 - y of which: portion eligible for inclusion in Tier 2 - zSurplus on revaluation of assets 52,340,042 of which: Revaluation reserves on Fixed Assets 14,917,268 of which: Unrealized Gains/Losses on AFS 24,562,403 In case of Deficit on revaluation (deduction from CET1) abTotal liabilities & Equity 1,706,361,383
Table: 40.3.3 Component of regulatory capital reported by bank
Source based on reference number from step 2
Common Equity Tier 1 capital (CET1): Instruments and reserves1 Fully Paid-up Capital/ Capital deposited with SBP 21,275,131 2 Balance in Share Premium Account - 3 Reserve for issue of Bonus Shares - 4 General/ Statutory Reserves 25,432,627 5 Gain/(Losses) on derivatives held as Cash Flow Hedge - 6 Unappropriated/unremitted profits/ (losses) 49,155,590 (w)7 Minority Interests arising from CET1 capital instruments issued to third party by
consolidated bank subsidiaries (amount allowed in CET1 capital of the consolidation group) - (x)
8 CET 1 before Regulatory Adjustments95,863,348
Common Equity Tier 1 capital: Regulatory adjustments9 Goodwill (net of related deferred tax liability) - (j) - (o)
10 All other intangibles (net of any associated deferred tax liability) 648,260 (k) - (p)11 Shortfall of provisions against classified assets - (f)12 Deferred tax assets that rely on future profitability excluding those arising from
temporary differences (net of related tax liability) 3,812,989 {(h) - (r} * x%
13 Defined-benefit pension fund net assets - {(l) - (q)} * x%14 Reciprocal cross holdings in CET1 capital instruments 1,050,247 (d)15 Cash flow hedge reserve - 16 Investment in own shares/ CET1 instruments - 17 Securitization gain on sale - 18 Capital shortfall of regulated subsidiaries - 19 Deficit on account of revaluation from bank's holdings of fixed assets/ AFS - (ab)20 Investments in the capital instruments of banking, financial and insurance entities that
are outside the scope of regulatory consolidation, where the bank does not own more than 10% of the issued share capital (amount above 10% threshold) 357,366
(a) - (ac) - (ae)21 Significant investments in the capital instruments issued by banking, financial and
insurance entities that are outside the scope of regulatory consolidation (amount above 10% threshold) - (b) - (ad) - (af)
22 Deferred Tax Assets arising from temporary differences (amount above 10% threshold, net of related tax liability) 136,887 (i)
23 Amount exceeding 15% threshold 24 of which: significant investments in the common stocks of financial entities - 25 of which: deferred tax assets arising from temporary differences -
aa
Basel III Disclosure Template (with added column)
(s)
(u)
Balance sheet as in published financial
statements
Under regulatory scope of consolidation
Reference
As at period end As at period endAssets (1) (2) (3) (4)
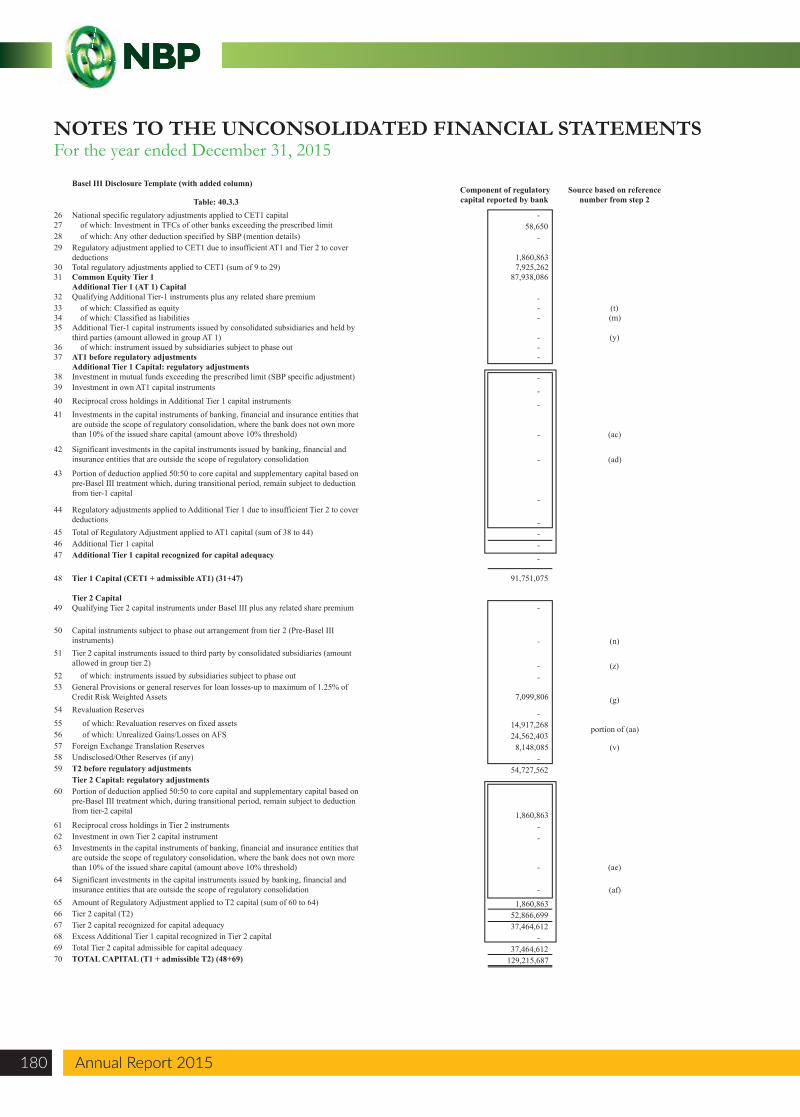
Table: 40.3.3 Component of regulatory capital reported by bank
Source based on reference number from step 2
26 National specific regulatory adjustments applied to CET1 capital - 27 of which: Investment in TFCs of other banks exceeding the prescribed limit 58,650 28 of which: Any other deduction specified by SBP (mention details) - 29 Regulatory adjustment applied to CET1 due to insufficient AT1 and Tier 2 to cover
deductions 1,860,863 30 Total regulatory adjustments applied to CET1 (sum of 9 to 29) 7,925,262 31 Common Equity Tier 1 87,938,086
Additional Tier 1 (AT 1) Capital32 Qualifying Additional Tier-1 instruments plus any related share premium - 33 of which: Classified as equity - (t)34 of which: Classified as liabilities - (m)35 Additional Tier-1 capital instruments issued by consolidated subsidiaries and held by
third parties (amount allowed in group AT 1) - (y)36 of which: instrument issued by subsidiaries subject to phase out - 37 AT1 before regulatory adjustments -
Additional Tier 1 Capital: regulatory adjustments38 Investment in mutual funds exceeding the prescribed limit (SBP specific adjustment) - 39 Investment in own AT1 capital instruments - 40 Reciprocal cross holdings in Additional Tier 1 capital instruments - 41 Investments in the capital instruments of banking, financial and insurance entities that
are outside the scope of regulatory consolidation, where the bank does not own more than 10% of the issued share capital (amount above 10% threshold) - (ac)
42 Significant investments in the capital instruments issued by banking, financial and insurance entities that are outside the scope of regulatory consolidation - (ad)
43 Portion of deduction applied 50:50 to core capital and supplementary capital based on pre-Basel III treatment which, during transitional period, remain subject to deduction from tier-1 capital
- 44 Regulatory adjustments applied to Additional Tier 1 due to insufficient Tier 2 to cover
deductions - 45 Total of Regulatory Adjustment applied to AT1 capital (sum of 38 to 44) - 46 Additional Tier 1 capital - 47 Additional Tier 1 capital recognized for capital adequacy -
48 Tier 1 Capital (CET1 + admissible AT1) (31+47) 91,751,075
Tier 2 Capital49 Qualifying Tier 2 capital instruments under Basel III plus any related share premium -
50 Capital instruments subject to phase out arrangement from tier 2 (Pre-Basel III
instruments) - 51 Tier 2 capital instruments issued to third party by consolidated subsidiaries (amount
allowed in group tier 2) - (z)52 of which: instruments issued by subsidiaries subject to phase out - 53 General Provisions or general reserves for loan losses-up to maximum of 1.25% of
Credit Risk Weighted Assets 7,099,806 (g)54 Revaluation Reserves - 55 of which: Revaluation reserves on fixed assets 14,917,268 56 of which: Unrealized Gains/Losses on AFS 24,562,403 57 Foreign Exchange Translation Reserves 8,148,085 (v)58 Undisclosed/Other Reserves (if any) - 59 T2 before regulatory adjustments 54,727,562
Tier 2 Capital: regulatory adjustments60 Portion of deduction applied 50:50 to core capital and supplementary capital based on
pre-Basel III treatment which, during transitional period, remain subject to deduction from tier-2 capital 1,860,863
61 Reciprocal cross holdings in Tier 2 instruments - 62 Investment in own Tier 2 capital instrument - 63 Investments in the capital instruments of banking, financial and insurance entities that
are outside the scope of regulatory consolidation, where the bank does not own more than 10% of the issued share capital (amount above 10% threshold) - (ae)
64 Significant investments in the capital instruments issued by banking, financial and insurance entities that are outside the scope of regulatory consolidation - (af)
65 Amount of Regulatory Adjustment applied to T2 capital (sum of 60 to 64) 1,860,863 66 Tier 2 capital (T2) 52,866,699 67 Tier 2 capital recognized for capital adequacy 37,464,612 68 Excess Additional Tier 1 capital recognized in Tier 2 capital - 69 Total Tier 2 capital admissible for capital adequacy 37,464,612 70 TOTAL CAPITAL (T1 + admissible T2) (48+69) 129,215,687
(n)
portion of (aa)
Basel III Disclosure Template (with added column)
NOTES TO THE UNCONSOLIDATED FINANCIAL STATEMENTSFor the year ended December 31, 2015
Annual Report 2015180 Annual Report 2015
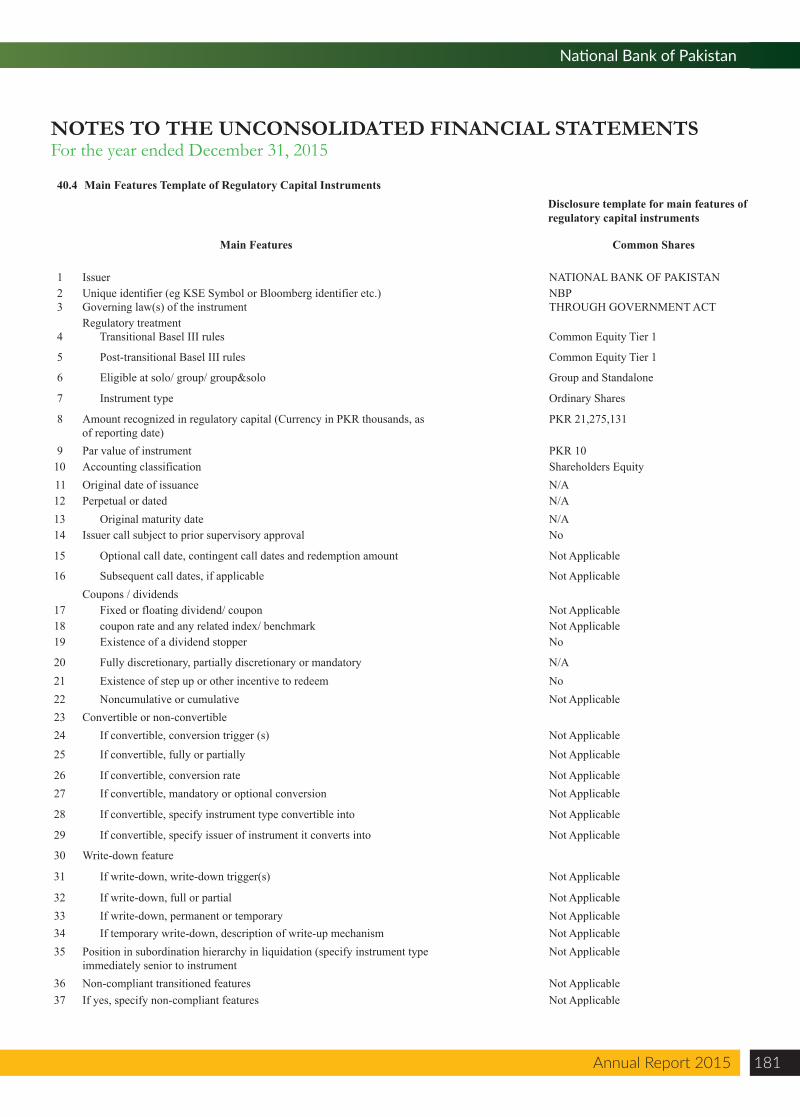
Annual Report 2015 181
National Bank of Pakistan
NOTES TO THE UNCONSOLIDATED FINANCIAL STATEMENTSFor the year ended December 31, 2015
Main Features Common Shares
1 Issuer NATIONAL BANK OF PAKISTAN2 Unique identifier (eg KSE Symbol or Bloomberg identifier etc.) NBP3 Governing law(s) of the instrument THROUGH GOVERNMENT ACT
Regulatory treatment4 Transitional Basel III rules Common Equity Tier 1
5 Post-transitional Basel III rules Common Equity Tier 1
6 Eligible at solo/ group/ group&solo Group and Standalone
7 Instrument type Ordinary Shares
8 Amount recognized in regulatory capital (Currency in PKR thousands, as of reporting date)
PKR 21,275,131
9 Par value of instrument PKR 1010 Accounting classification Shareholders Equity11 Original date of issuance N/A12 Perpetual or dated N/A13 Original maturity date N/A14 Issuer call subject to prior supervisory approval No
15 Optional call date, contingent call dates and redemption amount Not Applicable
16 Subsequent call dates, if applicable Not ApplicableCoupons / dividends
17 Fixed or floating dividend/ coupon Not Applicable18 coupon rate and any related index/ benchmark Not Applicable19 Existence of a dividend stopper No
20 Fully discretionary, partially discretionary or mandatory N/A21 Existence of step up or other incentive to redeem No22 Noncumulative or cumulative Not Applicable23 Convertible or non-convertible24 If convertible, conversion trigger (s) Not Applicable
25 If convertible, fully or partially Not Applicable
26 If convertible, conversion rate Not Applicable27 If convertible, mandatory or optional conversion Not Applicable
28 If convertible, specify instrument type convertible into Not Applicable
29 If convertible, specify issuer of instrument it converts into Not Applicable
30 Write-down feature
31 If write-down, write-down trigger(s) Not Applicable
32 If write-down, full or partial Not Applicable33 If write-down, permanent or temporary Not Applicable34 If temporary write-down, description of write-up mechanism Not Applicable35 Position in subordination hierarchy in liquidation (specify instrument type
immediately senior to instrumentNot Applicable
36 Non-compliant transitioned features Not Applicable37 If yes, specify non-compliant features Not Applicable
40.4 Main Features Template of Regulatory Capital InstrumentsDisclosure template for main features ofregulatory capital instruments
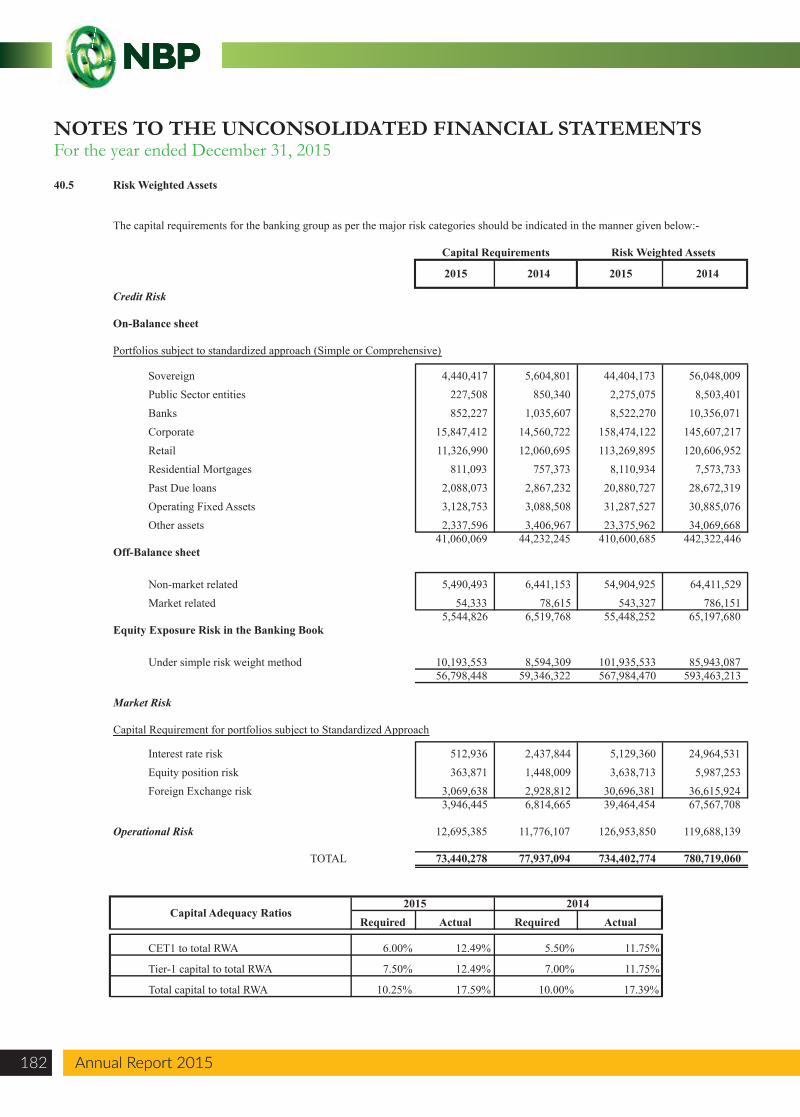
40.5 Risk Weighted Assets
2015 2014 2015 2014
Credit Risk
On-Balance sheet
Portfolios subject to standardized approach (Simple or Comprehensive)
Sovereign 4,440,417 5,604,801 44,404,173 56,048,009 Public Sector entities 227,508 850,340 2,275,075 8,503,401 Banks 852,227 1,035,607 8,522,270 10,356,071 Corporate 15,847,412 14,560,722 158,474,122 145,607,217 Retail 11,326,990 12,060,695 113,269,895 120,606,952 Residential Mortgages 811,093 757,373 8,110,934 7,573,733 Past Due loans 2,088,073 2,867,232 20,880,727 28,672,319 Operating Fixed Assets 3,128,753 3,088,508 31,287,527 30,885,076 Other assets 2,337,596 3,406,967 23,375,962 34,069,668
41,060,069 44,232,245 410,600,685 442,322,446 Off-Balance sheet
Non-market related 5,490,493 6,441,153 54,904,925 64,411,529 Market related 54,333 78,615 543,327 786,151
5,544,826 6,519,768 55,448,252 65,197,680 Equity Exposure Risk in the Banking Book
Under simple risk weight method 10,193,553 8,594,309 101,935,533 85,943,087 56,798,448 59,346,322 567,984,470 593,463,213
Market Risk
Capital Requirement for portfolios subject to Standardized Approach
Interest rate risk 512,936 2,437,844 5,129,360 24,964,531 Equity position risk 363,871 1,448,009 3,638,713 5,987,253 Foreign Exchange risk 3,069,638 2,928,812 30,696,381 36,615,924
3,946,445 6,814,665 39,464,454 67,567,708
Operational Risk 12,695,385 11,776,107 126,953,850 119,688,139
TOTAL 73,440,278 77,937,094 734,402,774 780,719,060
Required Actual Required Actual
CET1 to total RWA 6.00% 12.49% 5.50% 11.75%
Tier-1 capital to total RWA 7.50% 12.49% 7.00% 11.75%
Total capital to total RWA 10.25% 17.59% 10.00% 17.39%
The capital requirements for the banking group as per the major risk categories should be indicated in the manner given below:-
Capital Requirements Risk Weighted Assets
Capital Adequacy Ratios2015 2014
NOTES TO THE UNCONSOLIDATED FINANCIAL STATEMENTSFor the year ended December 31, 2015
Annual Report 2015182 Annual Report 2015
Annual Report 2015 183
National Bank of Pakistan
NOTES TO THE UNCONSOLIDATED FINANCIAL STATEMENTSFor the year ended December 31, 2015
41. RISK MANAGEMENT
Importance of risk management has increased over the time especially after the global meltdown. In Pakistani banking industry, Risk Management gained its importance when SBP released its circular for Basel II framework in 2006. Now SBP has been actively releasing various guidelines for implementation of Basel III to strengthen internal risk management environment of local Banks.
The Bank, being the country’s leading Bank, has always been determined to attain best practices in Risk Management standards. The purpose of our risk management framework is to provide the solid grounds where Bank can safely perform its business activities and ultimately achieve its goals. Further, it is continuously evolving framework, to incorporate the instructions issued by SBP along with the needs of the volatile local and global markets.
Since the implementation of Basel II framework, the overall Risk Management of the Bank has gone through several significant improvements and changes, which have further highlighted the Risk Management Framework.
It is important to mention that the Bank has also recently undertaken a comprehensive BPR and COSO exercise aimed at overall business process improvement, advanced risk management and strengthening of the overall control environment.
41.1 Overall Structure and broad initiatives
The Risk Management Group of the Bank is dedicated to support Bank’s growth objectives which are consistent with its risk tolerance level. For effective implementation of the risk management framework, the Group works independently and is liable for formulating and appraising of risk policies and also analyzes various risks associated with the activities of the Bank. The specialized functions of Risk Management Group are Credit Risk, Market Risk & Liquidity Risk and Operational Risk as outlined by its Board approved “Risk Management Charter.” Organizational structure for the group has been implemented with clear segregation of responsibilities and focused Wings constituted with relevant heads and staff to discharge respective responsibilities.
An Executive Risk Management Committee (ERMC) also exists within the Bank comprising of relevant Group Chiefs/ Divisional Heads. Both BRC and the ERMC are provided periodic updates via MIS and periodic progress reports by RMG to ensure that the Board and senior management remain aware of the various risk management initiatives and provide oversight and guidance.
Bank’s Risk Management Policy ensures the following:
- Setting Risk Management objectives of the Bank which includes establishing most appropriate course of action under uncertainty by identifying, assessing, understanding, acting on and communicating risk issues.
- Implementation of Risk Management Process at Strategic, Macro and Micro Level.
- Integrated Risk Management i.e. quantifying various risks by using different measurement methodologies, and aggregating all the risks to keep the total risk within the capital.
- Alignment of Risk management approach with the regulatory requirements and the Bank’s Risk Management Policy.
The structure of RMG with dedicated Wings for specific responsibilities has been implemented as follows:
41.1.1 Credit Risk Architecture
Credit Risk Architecture Wing in RMG was formed as per the Risk Management Charter with a view to further architecturally improve credit risk environment in Bank and introduce proactive measures to mitigate credit risk for all asset classes.
During the year the Wing has performed several functions successfully, which include building the process for development of credit risk models for compliance with the Basel framework and best practices in Risk Management, stress testing on the credit portfolio as per the guidelines issued by SBP and enhancement in Credit Risk Tolerance Limits / Concentration Policy. Moreover, Overseas Risk Management Framework was developed with coordinated efforts, consolidated consumer portfolio analytics was initiated and a dedicated function was set-up for Credit Portfolio Management Review.
41.1.2 Basel II / Risk Automation
This Wing is responsible for managing and facilitating Basel II project in close coordination with the Basel II consultants and with the active support and involvement of other functions within the Bank. The Wing is also responsible to perform project management and support services in relation to evaluation, selection and implementation of suitable risk management applications, as required by the Bank.
A comprehensive diagnostic exercise was conducted on a Bank-wide basis and the relevant areas for improvement were identified. This exercise encompassed all possible aspects that impacted the Bank’s Risk Management environment including the assessment of its existing risk management structure, policies and procedures, overall system architecture from a risk perspective and data availability and quality required for comprehensive risk management.
Based on the areas identified during the diagnostic exercise, detailed remediation plans have been developed proposing various structured initiatives that the Bank needs to undertake. These remediation plans contain the initiatives, action steps and related guidelines for enhancement in policies and procedures. The Bank has achieved about 75% of Basel II project implementation.
41.1.3 E-CIB and Data Management
E-CIB & Data Management Wing manages collection & consolidation of borrower's information in two separate databases on monthly / quarterly basis for e-CIB reporting and various risk related analysis for credit portfolio management/MIS respectively and reviews the quality and integrity of credit and advances related data. Such data is utilized by various groups, divisions and field functionaries.
The Wing is responsible for handling e-CIB related matters and performing periodic review and generate reports of advances data, highlighting inconsistencies and errors and issuing instructions to the relevant data entry points for rectification. The Wing has taken several initiatives for data accuracy and identification of data discrepancies which improved the quality of data significantly than the previous years and carried out additional data collection exercises for Basel-II Models requirements. A web-based application has also been developed and under testing to replace existing templates. The new data requirements for Basel-II Models have also been provided to PMO for mapping/incorporating with CBA.
41.1.4 Operational Risk Management
Operational Risk Management Wing has been developed to help align the Bank with the sound practices of operational risk set by the Basel Committee and provide guidance for setting Operational Risk Strategy of the Bank, selection and adoption of risk and loss measurement tools, reporting & communication and establishment of operational risk management process.
For further strengthening the operational risk in the Bank, Operational Risk Management Wing has achieved the following milestones.
41.1.4.1 Implementation of Operational Risk Management tools - Risk & Control Self Assessment (RCSA)
For identification and assessment of operational risk across the Bank, the Bank has adopted risk assessment methodology known as Risk & Control Self Assessment.
41.1.4.2 Mapping of Bank's activities into Basel Defined Business Lines
One of the qualifying criteria of the SBP, for allowing the banks to move towards next level approaches (The Standarised Approach (TSA)/ Alternative Standarised Approach (ASA)) in order to get benefit of the capital, is mapping of Bank’s activities into Basel defined business lines. RMG is working on segregating these activities into Basel defined business lines. These business lines include Corporate Finance, Trading and Sales, Retail Banking, Commercial Banking, Payment and Settlement, Agency Services, Asset Management, Retail Brokerage etc.
41.1.4.3 Monitoring of ORM Tolerance limit and updation
Bank has identified the limits for various operational risk categories and now Bank would monitor its operational losses against those defined limits and apprise the Senior Management / Board.
41.1.4.4 Training to field functionaries on Operational Risk Management & its tools
Training is also being imparted to the field functionaries on Operational Risk Management and its various tool such as Risk & Control Self Assessment (RCSA), Key Risk Indicators (KRIs), Operational Loss Data Collection Mechanism etc.
41.1.4.5 Key Risk Indicators & Its Reporting
Key Risk Indicators (KRIs) act as early warning signals by providing the capability to indicate changes in an organization's risk profile. Currently, the Bank has initiated KRI exercise on pilot run basis whereby the relevant stakeholders report their specific KRI reports to RMG and on the basis of data received from relevant stakeholders, RMG has developed the KRI thresholds which shall be used for variance reporting.
NOTES TO THE UNCONSOLIDATED FINANCIAL STATEMENTSFor the year ended December 31, 2015
Annual Report 2015184 Annual Report 2015
Annual Report 2015 185
National Bank of Pakistan
NOTES TO THE UNCONSOLIDATED FINANCIAL STATEMENTSFor the year ended December 31, 2015
41.1.5 Market & Liquidity Risk Management
The Wing ensures that the Market and Liquidity Risks are identified, measured, monitored and controlled with the support and involvement of respective Business and Support Groups / Divisions, and in accordance with the regulatory requirements and internal policies. Broadly, it is responsible for formulation / proposition of Market Risk Management (MRM) Framework (which includes Asset Liability Management (ALM) Policy & Procedures, Investment Policy of the Bank, Interest Rate Risk Management (IRRM) Policy, VaR & Back Testing Policy etc.), Treasury & Equity Investment portfolio monitoring, assessment / development of Market and Liquidity Risk limits, MIS for Liquidity & Interest Rate Risk monitoring, review of various policies and procedure manuals from Market & liquidity Risk perspective, provision of necessary support in Market Risk Capital Calculation , Coordinating and working with other wings for ICAAP, Stress Testing and other Market and Liquidity Risk functionalities. Further detailed disclosures are given in note 41.3.
41.1.6 BPR & COSO Implementation Project
The Business Process Review and COSO Implementation Project commenced from March 17, 2014 to effectively implement BPR & COSO, in order to achieve CBA optimization by streamlining the operating model (including best practice centralization), improving regulatory compliance as well as improving the platform for customer service and product/ service deployment. Furthermore, enhance MIS reporting and decision making and improve TATs resulting from process and organizational efficiencies.
The Project Management Office – BPR & COSO Implementation ensures smooth coordination amongst various stakeholders i.e. Consultants, IT vendors and the BPR & COSO Project Implementation Team. Further, PMO assists the BPR & COSO Steering Committee by providing project updates and escalating all relevant issues for appropriate resolution/ disposition in timely manner. In order to infuse the Project’s awareness amongst field functionaries, PMO conducted various training sessions to prepare Master Trainers at all four staff colleges, circulated three bi-monthly Bank-wide Bulletin on BPR & COSO implementation and presented a study paper in NBP News line Magazine.
41.1.7 Credit Administration
Credit Administration Wing (CAD) ensures proper credit discipline in the Bank by adopting sound and prudent bank lending practices.
In line with the best international practices, the Wing is responsible for preparation of finance documents, supervision of registration of charge with relevant authorities, safe keeping of the security documents and shadow credit files, disbursements of finances as per sanction followed by credit maintenance during the currency of loans. It also monitors the performances of vendors including Mucaddam companies, Bank’s Legal Advisors, etc.
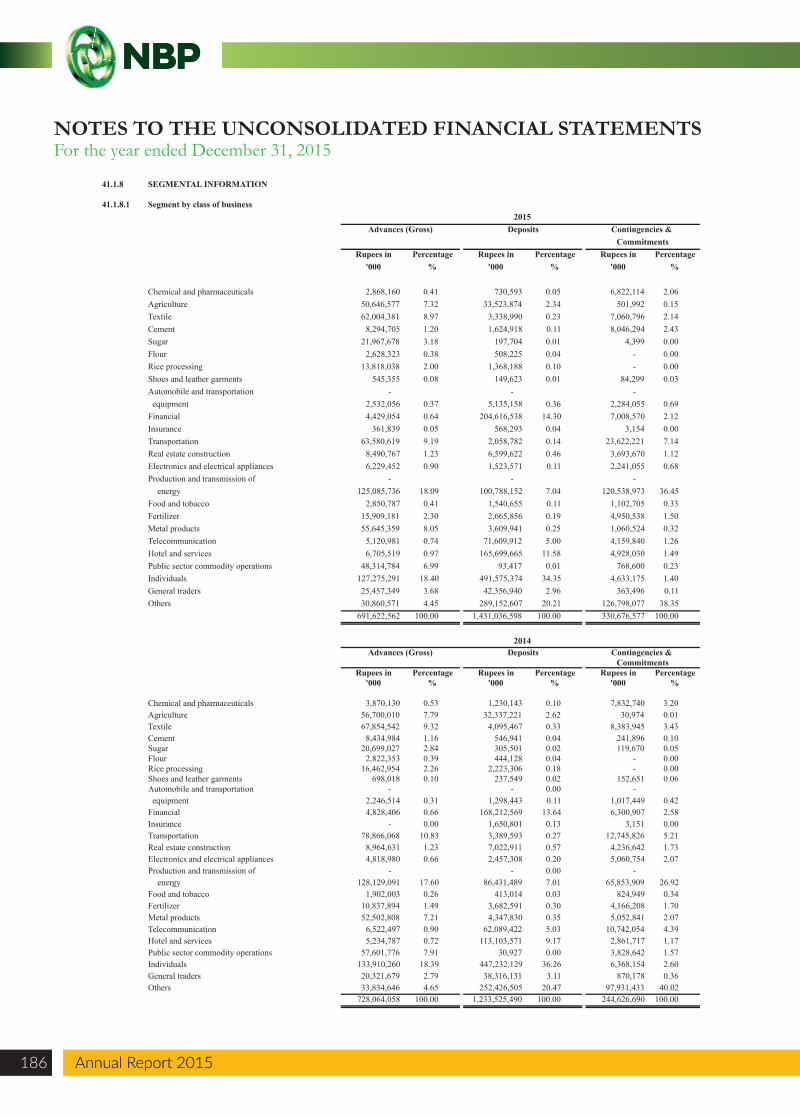
41.1.8 SEGMENTAL INFORMATION
41.1.8.1 Segment by class of business
Rupees in Percentage Rupees in Percentage Rupees in Percentage'000 % '000 % '000 %
Chemical and pharmaceuticals 2,868,160 0.41 730,593 0.05 6,822,114 2.06Agriculture 50,646,577 7.32 33,523,874 2.34 501,992 0.15Textile 62,004,381 8.97 3,338,990 0.23 7,060,796 2.14Cement 8,294,705 1.20 1,624,918 0.11 8,046,294 2.43Sugar 21,967,678 3.18 197,704 0.01 4,399 0.00Flour 2,628,323 0.38 508,225 0.04 - 0.00Rice processing 13,818,038 2.00 1,368,188 0.10 - 0.00Shoes and leather garments 545,355 0.08 149,623 0.01 84,299 0.03Automobile and transportation - - - equipment 2,532,056 0.37 5,135,158 0.36 2,284,055 0.69Financial 4,429,054 0.64 204,616,538 14.30 7,008,570 2.12Insurance 361,839 0.05 568,293 0.04 3,154 0.00Transportation 63,580,619 9.19 2,058,782 0.14 23,622,221 7.14Real estate construction 8,490,767 1.23 6,599,622 0.46 3,693,670 1.12Electronics and electrical appliances 6,229,452 0.90 1,523,571 0.11 2,241,055 0.68Production and transmission of - - -
energy 125,085,736 18.09 100,788,152 7.04 120,538,973 36.45Food and tobacco 2,850,787 0.41 1,540,655 0.11 1,102,705 0.33Fertilizer 15,909,181 2.30 2,665,856 0.19 4,950,538 1.50Metal products 55,645,359 8.05 3,609,941 0.25 1,060,524 0.32Telecommunication 5,120,981 0.74 71,609,912 5.00 4,159,840 1.26Hotel and services 6,705,519 0.97 165,699,665 11.58 4,928,030 1.49Public sector commodity operations 48,314,784 6.99 93,417 0.01 768,600 0.23Individuals 127,275,291 18.40 491,575,374 34.35 4,633,175 1.40General traders 25,457,349 3.68 42,356,940 2.96 363,496 0.11Others 30,860,571 4.45 * 289,152,607 20.21 * 126,798,077 38.35
691,622,562 100.00 * 1,431,036,598 100.00 * 330,676,577 100.00- - -
Rupees in Percentage Rupees in Percentage Rupees in Percentage'000 % '000 % '000 %
Chemical and pharmaceuticals 3,870,130 0.53 1,230,143 0.10 7,832,740 3.20Agriculture 56,700,010 7.79 32,337,221 2.62 30,974 0.01Textile 67,854,542 9.32 4,095,467 0.33 8,383,945 3.43Cement 8,434,984 1.16 546,941 0.04 241,896 0.10Sugar 20,699,027 2.84 305,501 0.02 119,670 0.05Flour 2,822,353 0.39 444,128 0.04 - 0.00Rice processing 16,462,954 2.26 2,223,306 0.18 - 0.00Shoes and leather garments 698,018 0.10 237,549 0.02 152,651 0.06Automobile and transportation - - 0.00 - equipment 2,246,514 0.31 1,298,443 0.11 1,017,449 0.42Financial 4,828,406 0.66 168,212,569 13.64 6,300,907 2.58Insurance - 0.00 1,650,801 0.13 3,151 0.00Transportation 78,866,068 10.83 3,389,593 0.27 12,745,826 5.21Real estate construction 8,964,631 1.23 7,022,911 0.57 4,236,642 1.73Electronics and electrical appliances 4,818,980 0.66 2,457,308 0.20 5,060,754 2.07Production and transmission of - - 0.00 -
energy 128,129,091 17.60 86,431,489 7.01 65,853,909 26.92Food and tobacco 1,902,003 0.26 413,014 0.03 824,949 0.34Fertilizer 10,837,894 1.49 3,682,591 0.30 4,166,208 1.70Metal products 52,502,808 7.21 4,347,830 0.35 5,052,841 2.07Telecommunication 6,522,497 0.90 62,089,422 5.03 10,742,054 4.39Hotel and services 5,234,787 0.72 113,103,571 9.17 2,861,717 1.17Public sector commodity operations 57,601,776 7.91 30,927 0.00 3,828,642 1.57Individuals 133,910,260 18.39 447,232,129 36.26 6,368,154 2.60General traders 20,321,679 2.79 38,316,131 3.11 870,178 0.36Others 33,834,646 4.65 * 252,426,505 20.47 * 97,931,433 40.02
728,064,058 100.00 * 1,233,525,490 100.00 * 244,626,690 100.00
Contingencies & Commitments
Deposits2014
Advances (Gross)
2015Advances (Gross) Deposits Contingencies &
Commitments
NOTES TO THE UNCONSOLIDATED FINANCIAL STATEMENTSFor the year ended December 31, 2015
Annual Report 2015186 Annual Report 2015
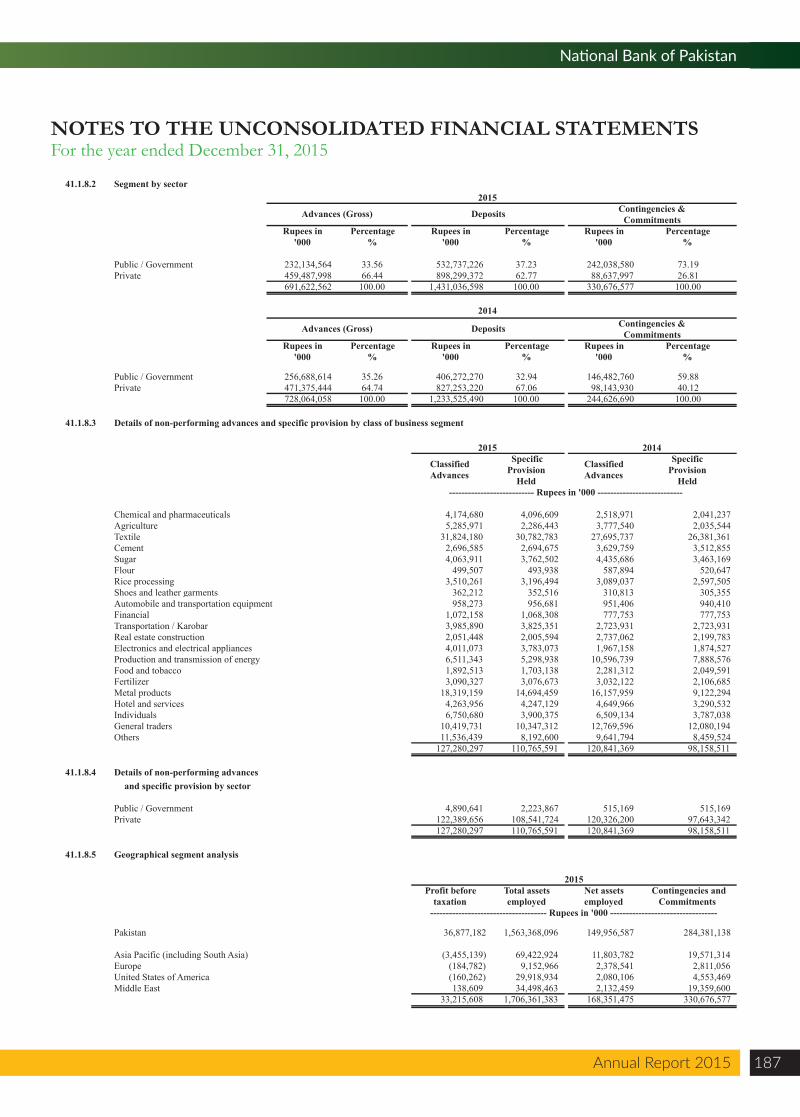
Annual Report 2015 187
National Bank of Pakistan
NOTES TO THE UNCONSOLIDATED FINANCIAL STATEMENTSFor the year ended December 31, 2015
41.1.8.2 Segment by sector
Rupees in Percentage Rupees in Percentage Rupees in Percentage'000 % '000 % '000 %
Public / Government 232,134,564 33.56 532,737,226 37.23 242,038,580 73.19Private 459,487,998 66.44 898,299,372 62.77 88,637,997 26.81
691,622,562 100.00 1,431,036,598 100.00 330,676,577 100.00- - -
Rupees in Percentage Rupees in Percentage Rupees in Percentage'000 % '000 % '000 %
Public / Government 256,688,614 35.26 406,272,270 32.94 146,482,760 59.88Private 471,375,444 64.74 827,253,220 67.06 98,143,930 40.12
728,064,058 100.00 1,233,525,490 100.00 244,626,690 100.00- - -
41.1.8.3 Details of non-performing advances and specific provision by class of business segment
--------------------------- Rupees in '000 ---------------------------
Chemical and pharmaceuticals 4,174,680 4,096,609 2,518,971 2,041,237 Agriculture 5,285,971 2,286,443 3,777,540 2,035,544 Textile 31,824,180 30,782,783 27,695,737 26,381,361 Cement 2,696,585 2,694,675 3,629,759 3,512,855 Sugar 4,063,911 3,762,502 4,435,686 3,463,169 Flour 499,507 493,938 587,894 520,647 Rice processing 3,510,261 3,196,494 3,089,037 2,597,505 Shoes and leather garments 362,212 352,516 310,813 305,355 Automobile and transportation equipment 958,273 956,681 951,406 940,410 Financial 1,072,158 1,068,308 777,753 777,753 Transportation / Karobar 3,985,890 3,825,351 2,723,931 2,723,931 Real estate construction 2,051,448 2,005,594 2,737,062 2,199,783 Electronics and electrical appliances 4,011,073 3,783,073 1,967,158 1,874,527 Production and transmission of energy 6,511,343 5,298,938 10,596,739 7,888,576 Food and tobacco 1,892,513 1,703,138 2,281,312 2,049,591 Fertilizer 3,090,327 3,076,673 3,032,122 2,106,685 Metal products 18,319,159 14,694,459 16,157,959 9,122,294 Hotel and services 4,263,956 4,247,129 4,649,966 3,290,532 Individuals 6,750,680 3,900,375 6,509,134 3,787,038 General traders 10,419,731 10,347,312 12,769,596 12,080,194 Others 11,536,439 8,192,600 9,641,794 8,459,524
127,280,297 110,765,591 120,841,369 98,158,511
41.1.8.4 Details of non-performing advances and specific provision by sector
Public / Government 4,890,641 2,223,867 515,169 515,169 Private 122,389,656 108,541,724 120,326,200 97,643,342
127,280,297 110,765,591 120,841,369 98,158,511
41.1.8.5 Geographical segment analysis
Profit before Total assets Net assetstaxation employed employed
Pakistan 36,877,182 1,563,368,096 149,956,587 284,381,138
Asia Pacific (including South Asia) (3,455,139) 69,422,924 11,803,782 19,571,314 Europe (184,782) 9,152,966 2,378,541 2,811,056 United States of America (160,262) 29,918,934 2,080,106 4,553,469 Middle East 138,609 34,498,463 2,132,459 19,359,600
33,215,608 1,706,361,383 168,351,475 330,676,577
2015Contingencies &Deposits
Deposits
2014Contingencies &
Commitments
CommitmentsAdvances (Gross)
Advances (Gross)
------------------------------------- Rupees in '000 ----------------------------------
2015
2015 2014
Contingencies and Commitments
Classified Advances
Specific Provision
Held
Classified Advances
Specific Provision
Held
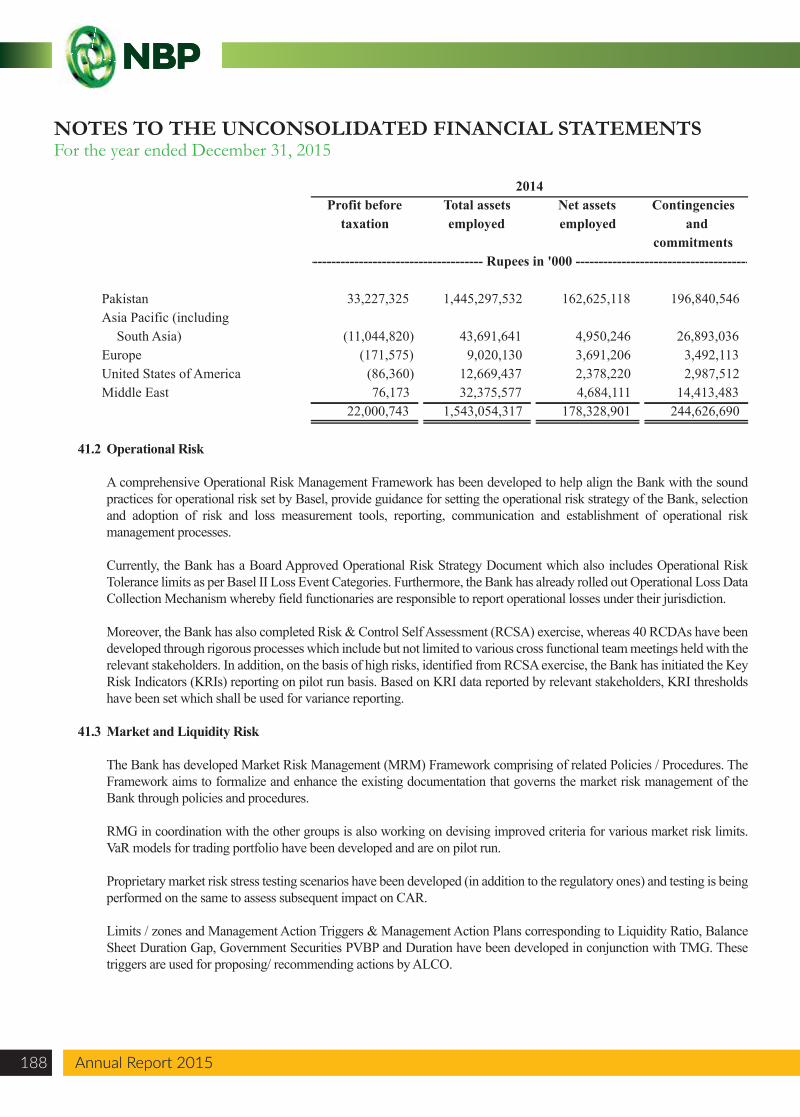
NOTES TO THE UNCONSOLIDATED FINANCIAL STATEMENTSFor the year ended December 31, 2015
Annual Report 2015188 Annual Report 2015
41.2 Operational Risk
A comprehensive Operational Risk Management Framework has been developed to help align the Bank with the sound practices for operational risk set by Basel, provide guidance for setting the operational risk strategy of the Bank, selection and adoption of risk and loss measurement tools, reporting, communication and establishment of operational risk management processes.
Currently, the Bank has a Board Approved Operational Risk Strategy Document which also includes Operational Risk Tolerance limits as per Basel II Loss Event Categories. Furthermore, the Bank has already rolled out Operational Loss Data Collection Mechanism whereby field functionaries are responsible to report operational losses under their jurisdiction.
Moreover, the Bank has also completed Risk & Control Self Assessment (RCSA) exercise, whereas 40 RCDAs have been developed through rigorous processes which include but not limited to various cross functional team meetings held with the relevant stakeholders. In addition, on the basis of high risks, identified from RCSA exercise, the Bank has initiated the Key Risk Indicators (KRIs) reporting on pilot run basis. Based on KRI data reported by relevant stakeholders, KRI thresholds have been set which shall be used for variance reporting.
41.3 Market and Liquidity Risk
The Bank has developed Market Risk Management (MRM) Framework comprising of related Policies / Procedures. The Framework aims to formalize and enhance the existing documentation that governs the market risk management of the Bank through policies and procedures.
RMG in coordination with the other groups is also working on devising improved criteria for various market risk limits. VaR models for trading portfolio have been developed and are on pilot run.
Proprietary market risk stress testing scenarios have been developed (in addition to the regulatory ones) and testing is being performed on the same to assess subsequent impact on CAR.
Limits / zones and Management Action Triggers & Management Action Plans corresponding to Liquidity Ratio, Balance Sheet Duration Gap, Government Securities PVBP and Duration have been developed in conjunction with TMG. These triggers are used for proposing/ recommending actions by ALCO.
Profit before Total assets Net assetstaxation employed employed and
Pakistan 33,227,325 1,445,297,532 162,625,118 196,840,546 Asia Pacific (including
South Asia) (11,044,820) 43,691,641 4,950,246 26,893,036 Europe (171,575) 9,020,130 3,691,206 3,492,113 United States of America (86,360) 12,669,437 2,378,220 2,987,512 Middle East 76,173 32,375,577 4,684,111 14,413,483
2014
----------------------------------------- Rupees in '000 -----------------------------------------
Contingencies
commitments
22,000,743 1,543,054,317 178,328,901 244,626,690
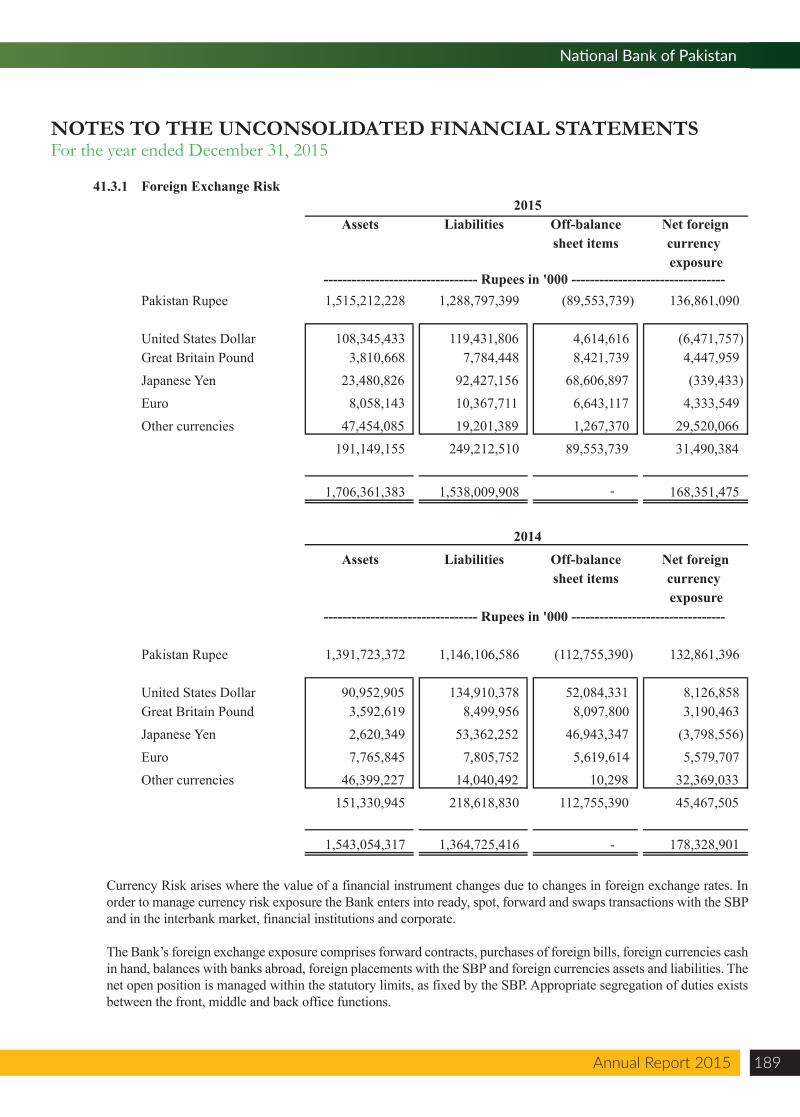
Annual Report 2015 189
National Bank of Pakistan
NOTES TO THE UNCONSOLIDATED FINANCIAL STATEMENTSFor the year ended December 31, 2015
Currency Risk arises where the value of a financial instrument changes due to changes in foreign exchange rates. In order to manage currency risk exposure the Bank enters into ready, spot, forward and swaps transactions with the SBP and in the interbank market, financial institutions and corporate.
The Bank’s foreign exchange exposure comprises forward contracts, purchases of foreign bills, foreign currencies cash in hand, balances with banks abroad, foreign placements with the SBP and foreign currencies assets and liabilities. The net open position is managed within the statutory limits, as fixed by the SBP. Appropriate segregation of duties exists between the front, middle and back office functions.
41.3.1 Foreign Exchange Risk
Assets Liabilities Off-balance Net foreignsheet items currency
exposure
Pakistan Rupee 1,515,212,228 1,288,797,399 (89,553,739) 136,861,090
United States Dollar 108,345,433 119,431,806 4,614,616 (6,471,757) Great Britain Pound 3,810,668 7,784,448 8,421,739 4,447,959 Japanese Yen 23,480,826 92,427,156 68,606,897 (339,433) Euro 8,058,143 10,367,711 6,643,117 4,333,549 Other currencies 47,454,085 19,201,389 1,267,370 29,520,066
191,149,155 249,212,510 89,553,739 31,490,384
1,706,361,383 1,538,009,908 - 168,351,475
Assets Liabilities Off-balance Net foreignsheet items currency
exposure
Pakistan Rupee 1,391,723,372 1,146,106,586 (112,755,390) 132,861,396
United States Dollar 90,952,905 134,910,378 52,084,331 8,126,858 Great Britain Pound 3,592,619 8,499,956 8,097,800 3,190,463 Japanese Yen 2,620,349 53,362,252 46,943,347 (3,798,556) Euro 7,765,845 7,805,752 5,619,614 5,579,707 Other currencies 46,399,227 14,040,492 10,298 32,369,033
151,330,945 218,618,830 112,755,390 45,467,505
1,543,054,317 1,364,725,416 - 178,328,901
2015
2014
--------------------------------- Rupees in '000 ---------------------------------
--------------------------------- Rupees in '000 ---------------------------------
41.3.2 Equity Position Risk
Investments in equity are generally regarded as riskier relative to fixed income securities owing to the inherent volatility of stock market prices. The risks from various factors include, but are not limited to:
Changes in business cycle affecting the business of the company in which the investment is made. Change in business circumstances (i.e. fundamentals) of the company, its business sector, industry and / or economy in general;
Mismanagement of the investee company, their products / services any third party liability or occurrence of other events such as strikes, fraud, etc. in the company in which investment is made;
Fluctuation in the shares' prices resulting from their dependence on market sentiment, speculative activity, supply and demand of shares and liquidity in the market;
Possibility of defaults by participant or failure of the stock exchanges, the depositories, the settlement or the clearing system on discharging their fiduciary responsibilities; and
Any government or court order restraining payment of dividend by a company to its shareholders.
The Bank mitigates the aforesaid risks as follows:
Compliance with the SBP regulations for equity exposure / investments and compliance with the SECP Corporate Governance Rules by the investee company prudent investing practices (focus on dividend payout history);
Through diversification and capping maximum exposure through internal limits. Additionally, continuous follow up of these sectors and companies through self monitoring and fundamentals research conducted internally and from reputable brokerage houses;
Investments are made as per the guidelines on liquidity and growth as per investment policy manual or guidelines set by Senior Management and the Board of Directors; and
The Bank follows a delivery versus payment settlement system thereby minimizing risk in relation to settlement risk.
41.3.3 Mismatch of Interest Rate Sensitive Assets and Liabilities
Interest rate risk is the risk that the value of a financial instrument will fluctuate due to changes in the market mark-up / interest rates. The Bank is exposed to interest / mark-up rate risk as a result of mismatches or gaps in the amount of interest / mark-up based assets and liabilities that mature or re-price in a given period. The Bank manages this risk by matching / re-pricing of assets and liabilities. The Assets and Liabilities Committee (ALCO) / Executive Risk Management Committee (ERMC) of the Bank monitors and manages the interest rate risk with the objective of limiting the potential adverse effects on the profitability of the Bank.
Management of interest rate risk is one of the critical components of market risk management in banks. The Bank's net interest income or net interest margin is also dependent on the movement of interest rates and mismatches in the cash flows or re-pricing dates. Interest rate risk management includes establishing and monitoring various risk mitigating / quantifying limits such as PVBP, duration, balance sheet DGAP and other money market and interest rate sensitivity limits.
As part of the risk reporting, an interest rate sensitivity statement is prepared on a quarterly basis. This statement classifies the interest rate-sensitive assets and liabilities into various maturity groups enabling the management to monitor the impact of interest rate movements on the Statement of Financial Position.
NOTES TO THE UNCONSOLIDATED FINANCIAL STATEMENTSFor the year ended December 31, 2015
Annual Report 2015190 Annual Report 2015
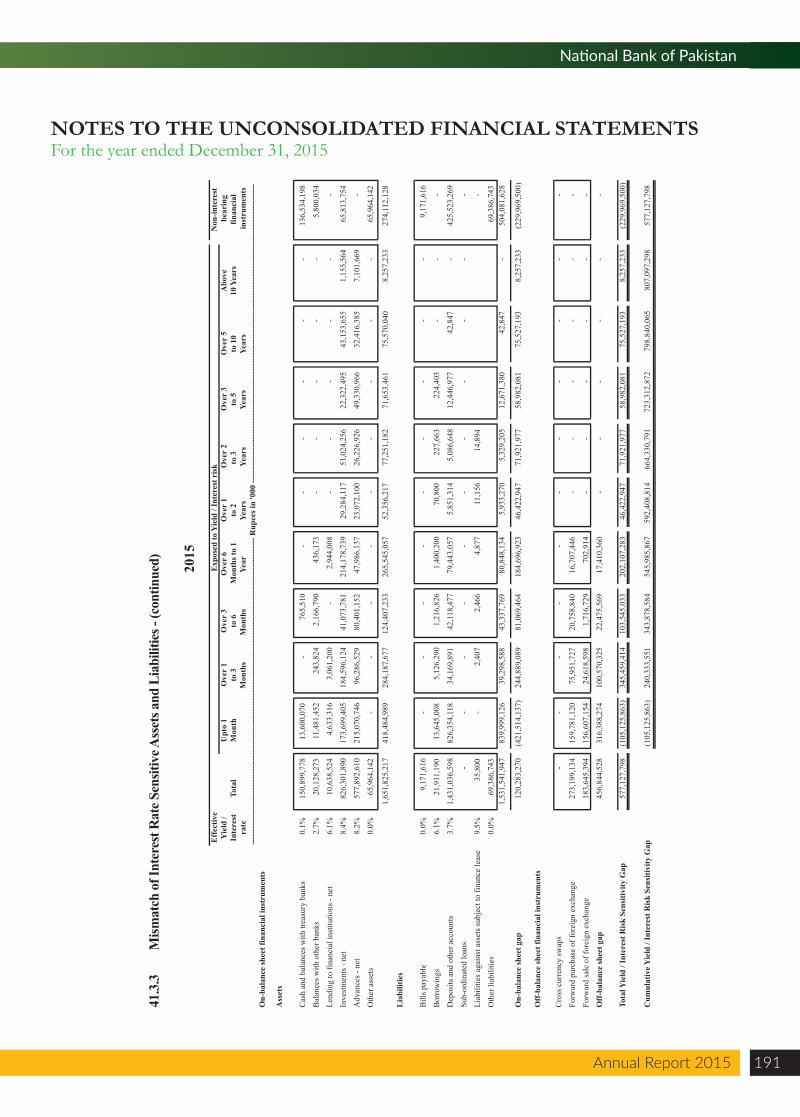
Annual Report 2015 191
National Bank of Pakistan
NOTES TO THE UNCONSOLIDATED FINANCIAL STATEMENTSFor the year ended December 31, 2015
2015
Eff
ectiv
eN
on-in
tere
st
Yie
ld /
Upt
o 1
Ove
r 1
Ove
r 3
Ove
r 6
Ove
r 1
Ove
r 2
Ove
r 3
Ove
r 5
Abo
vebe
arin
gIn
tere
stTo
tal
Mon
thto
3to
6 M
onth
s to
1to
2to
3
to 5
to 1
010
Yea
rsfin
anci
al
rate
Mon
ths
Mon
ths
Year
Year
sYe
ars
Year
sYe
ars
inst
rum
ents
On-
bala
nce
shee
t fin
anci
al in
stru
men
ts
Ass
ets
Cas
h an
d ba
lanc
es w
ith tr
easu
ry b
anks
0.1%
150,
899,
778
13
,600
,070
-
76
5,51
0
-
-
-
-
-
-
136,
534,
198
Bal
ance
s with
oth
er b
anks
2.7%
20,1
28,2
73
11,4
81,4
52
24
3,82
4
2,16
6,79
0
43
6,17
3
-
-
-
-
-
5,
800,
034
Lend
ing
to fi
nanc
ial i
nstit
utio
ns -
net
6.1%
10,6
38,5
24
4,63
3,31
6
3,
061,
200
-
2,
944,
008
-
-
-
-
-
-
Inve
stm
ents
- ne
t8.
4%82
6,30
1,89
0
173,
699,
405
18
4,59
6,12
4
41,0
73,7
81
21
4,17
8,73
9
29,2
84,1
17
51
,024
,256
22,3
22,4
95
43
,153
,655
1,
155,
564
65
,813
,754
Adv
ance
s - n
et8.
2%57
7,89
2,61
0
215,
070,
746
96
,286
,529
80,4
01,1
52
47
,986
,137
23,0
72,1
00
26
,226
,926
49,3
30,9
66
32
,416
,385
7,
101,
669
-
Oth
er a
sset
s 0.
0%65
,964
,142
-
-
-
-
-
-
-
-
-
65,9
64,1
42
1,
651,
825,
217
41
8,48
4,98
9
284,
187,
677
12
4,40
7,23
3
265,
545,
057
52
,356
,217
77,2
51,1
82
71
,653
,461
75,5
70,0
40
8,25
7,23
3
274,
112,
128
Lia
bilit
ies
Bill
s pay
able
0.0%
9,17
1,61
6
-
-
-
-
-
-
-
-
-
9,
171,
616
Bor
row
ings
6.
1%21
,911
,190
13
,645
,008
5,12
6,29
0
1,
216,
826
1,40
0,20
0
70
,800
227,
663
22
4,40
3
-
-
-
Dep
osits
and
oth
er a
ccou
nts
3.7%
1,43
1,03
6,59
8
826,
354,
118
34
,169
,891
42,1
18,4
77
79
,443
,057
5,85
1,31
4
5,
086,
648
12,4
46,9
77
42
,847
-
42
5,52
3,26
9
Sub-
ordi
nate
d lo
ans
-
-
-
-
-
-
-
-
-
-
-
Liab
ilitie
s aga
inst
ass
ets s
ubje
ct to
fina
nce
leas
e9.
5%35
,800
-
2,40
7
2,
466
4,87
7
11
,156
14,8
94
-
Oth
er li
abili
ties
0.0%
69,3
86,7
43
69,3
86,7
43
1,
531,
541,
947
83
9,99
9,12
6
39,2
98,5
88
43
,337
,769
80,8
48,1
34
5,
933,
270
5,32
9,20
5
12
,671
,380
42,8
47
-
504,
081,
628
On-
bala
nce
shee
t gap
12
0,28
3,27
0
(4
21,5
14,1
37)
24
4,88
9,08
9
81,0
69,4
64
18
4,69
6,92
3
46,4
22,9
47
71
,921
,977
58,9
82,0
81
75
,527
,193
8,
257,
233
(2
29,9
69,5
00)
Off
-bal
ance
shee
t fin
anci
al in
stru
men
ts
Cro
ss c
urre
ncy
swap
s-
-
-
-
-
-
-
-
-
-
-
Forw
ard
purc
hase
of f
orei
gn e
xcha
nge
273,
199,
134
159,
781,
120
75
,951
,727
20,7
58,8
40
16
,707
,446
-
-
-
-
-
-
Forw
ard
sale
of f
orei
gn e
xcha
nge
183,
645,
394
156,
607,
154
24
,618
,598
1,71
6,72
9
70
2,91
4
-
-
-
-
-
-
Off
-bal
ance
shee
t gap
456,
844,
528
316,
388,
274
10
0,57
0,32
5
22,4
75,5
69
17
,410
,360
-
-
-
-
-
-
Tota
l Yie
ld /
Inte
rest
Ris
k Se
nsiti
vity
Gap
577,
127,
798
(105
,125
,863
)
345,
459,
414
10
3,54
5,03
3
202,
107,
283
46
,422
,947
71,9
21,9
77
58
,982
,081
75,5
27,1
93
8,25
7,23
3
(229
,969
,500
)
Cum
ulat
ive Y
ield
/ In
tere
st R
isk
Sens
itivi
ty G
ap(1
05,1
25,8
63)
24
0,33
3,55
1
343,
878,
584
54
5,98
5,86
7
592,
408,
814
66
4,33
0,79
1
723,
312,
872
79
8,84
0,06
5
807,
097,
298
577,
127,
798
----
----
----
----
----
----
----
----
----
----
----
----
----
----
----
----
----
----
----
----
----
----
----
----
----
----
----
----
- Rup
ees i
n '0
00 --
----
----
----
----
----
----
----
----
----
----
----
----
----
----
----
----
----
----
----
----
----
----
----
----
----
----
----
Exp
osed
to Y
ield
/ In
tere
st r
isk
41.3
.3
Mism
atch
of I
nter
est R
ate S
ensit
ive A
sset
s and
Lia
bilit
ies -
(con
tinue
d)
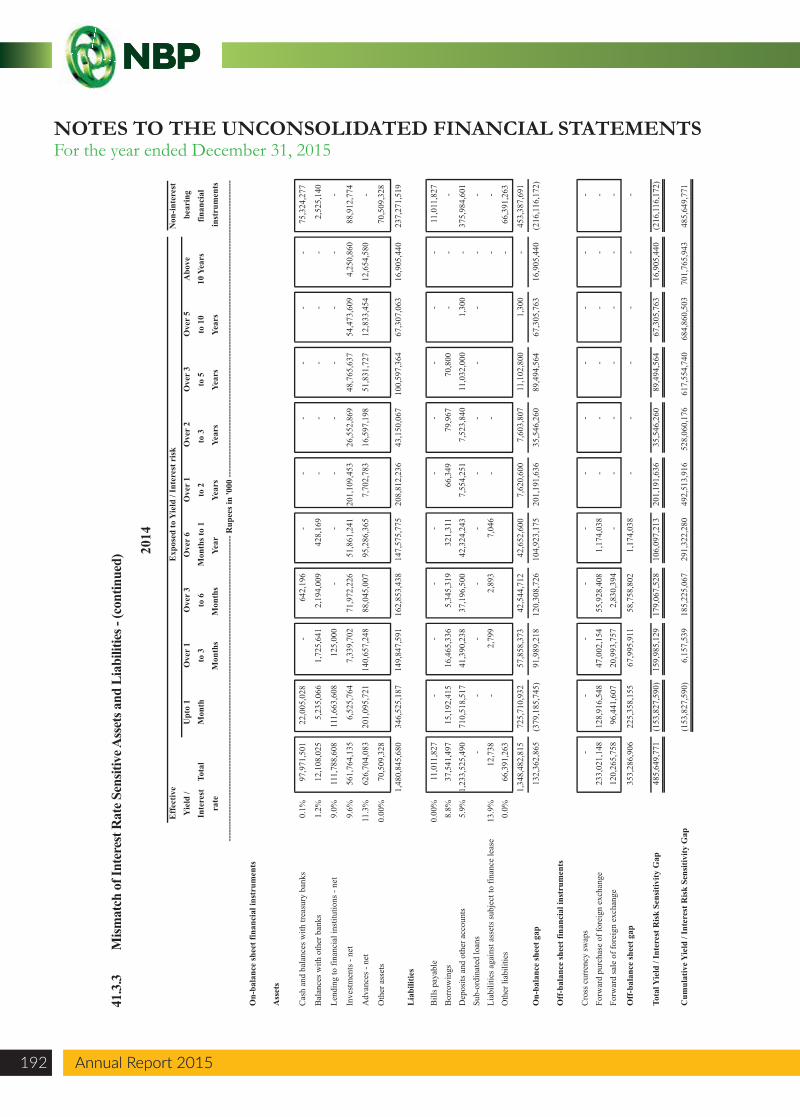
2014
Eff
ectiv
eN
on-in
tere
st
Yie
ld /
Upt
o 1
Ove
r 1
Ove
r 3
Ove
r 6
Ove
r 1
Ove
r 2
Ove
r 3
Ove
r 5
Abo
vebe
arin
gIn
tere
stTo
tal
Mon
thto
3to
6 M
onth
s to
1to
2to
3
to 5
to 1
010
Yea
rsfin
anci
al
rate
Mon
ths
Mon
ths
Year
Year
sYe
ars
Year
sYe
ars
inst
rum
ents
On-
bala
nce
shee
t fin
anci
al in
stru
men
ts
Ass
ets
Cas
h an
d ba
lanc
es w
ith tr
easu
ry b
anks
0.1%
97,9
71,5
01
22,0
05,0
28
-
642,
196
-
-
-
-
-
-
75
,324
,277
Bal
ance
s with
oth
er b
anks
1.2%
12,1
08,0
25
5,23
5,06
6
1,
725,
641
2,19
4,00
9
42
8,16
9
-
-
-
-
-
2,52
5,14
0
Lend
ing
to fi
nanc
ial i
nstit
utio
ns -
net
9.0%
111,
788,
608
11
1,66
3,60
8
12
5,00
0
-
-
-
-
-
-
-
-
Inve
stm
ents
- ne
t9.
6%56
1,76
4,13
5
6,52
5,76
4
7,
339,
702
71,9
72,2
26
51,8
61,2
41
201,
109,
453
26,5
52,8
69
48,7
65,6
37
54,4
73,6
09
4,25
0,86
0
88
,912
,774
Adv
ance
s - n
et11
.3%
626,
704,
083
20
1,09
5,72
1
14
0,65
7,24
8
88
,045
,007
95
,286
,365
7,
702,
783
16,5
97,1
98
51,8
31,7
27
12,8
33,4
54
12,6
54,5
80
-
Oth
er a
sset
s 0.
00%
70,5
09,3
28
70
,509
,328
1,48
0,84
5,68
0
34
6,52
5,18
7
14
9,84
7,59
1
16
2,85
3,43
8
14
7,57
5,77
5
20
8,81
2,23
6
43
,150
,067
10
0,59
7,36
4
67
,307
,063
16
,905
,440
23
7,27
1,51
9
Lia
bilit
ies
Bill
s pay
able
0.00
%11
,011
,827
-
-
-
-
-
-
-
-
-
11,0
11,8
27
Bor
row
ings
8.
8%37
,541
,497
15,1
92,4
15
16,4
65,3
36
5,34
5,31
9
32
1,31
1
66,3
49
79,9
67
70,8
00
-
-
-
Dep
osits
and
oth
er a
ccou
nts
5.9%
1,23
3,52
5,49
0
71
0,51
8,51
7
41
,390
,238
37
,196
,500
42
,324
,243
7,
554,
251
7,52
3,84
0
11
,032
,000
1,
300
-
375,
984,
601
Su
b-or
dina
ted
loan
s-
-
-
-
-
-
-
-
-
-
-
Liab
ilitie
s aga
inst
ass
ets s
ubje
ct to
fina
nce
leas
e13
.9%
12,7
38
-
2,
799
2,89
3
7,
046
-
-
-
-
Oth
er li
abili
ties
0.0%
66,3
91,2
63
-
66
,391
,263
1,
348,
482,
815
725,
710,
932
57,8
58,3
73
42,5
44,7
12
42,6
52,6
00
7,62
0,60
0
7,
603,
807
11,1
02,8
00
1,30
0
-
45
3,38
7,69
1
On-
bala
nce
shee
t gap
13
2,36
2,86
5
(379
,185
,745
)
91
,989
,218
12
0,30
8,72
6
10
4,92
3,17
5
20
1,19
1,63
6
35
,546
,260
89
,494
,564
67
,305
,763
16
,905
,440
(2
16,1
16,1
72)
Off
-bal
ance
shee
t fin
anci
al in
stru
men
ts
Cro
ss c
urre
ncy
swap
s-
-
-
-
-
-
-
-
-
-
-
Forw
ard
purc
hase
of f
orei
gn e
xcha
nge
233,
021,
148
12
8,91
6,54
8
47
,002
,154
55
,928
,408
1,
174,
038
-
-
-
-
-
-
Forw
ard
sale
of f
orei
gn e
xcha
nge
120,
265,
758
96
,441
,607
20
,993
,757
2,
830,
394
-
-
-
-
-
-
-
Off
-bal
ance
shee
t gap
353,
286,
906
22
5,35
8,15
5
67
,995
,911
58
,758
,802
1,
174,
038
-
-
-
-
-
-
Tota
l Yie
ld /
Inte
rest
Ris
k Se
nsiti
vity
Gap
485,
649,
771
(1
53,8
27,5
90)
159,
985,
129
179,
067,
528
106,
097,
213
201,
191,
636
35,5
46,2
60
89,4
94,5
64
67,3
05,7
63
16,9
05,4
40
(216
,116
,172
)
Cum
ulat
ive Y
ield
/ In
tere
st R
isk
Sens
itivi
ty G
ap(1
53,8
27,5
90)
6,15
7,53
9
18
5,22
5,06
7
29
1,32
2,28
0
49
2,51
3,91
6
52
8,06
0,17
6
61
7,55
4,74
0
68
4,86
0,50
3
70
1,76
5,94
3
48
5,64
9,77
1
Exp
osed
to Y
ield
/ In
tere
st r
isk
----
----
----
----
----
----
----
----
----
----
----
----
----
----
----
----
----
----
----
----
----
----
----
----
----
----
-- R
upee
s in
'000
----
----
----
----
----
----
----
----
----
----
----
----
----
----
----
----
----
----
----
----
----
----
----
----
----
---
41.3
.3
Mism
atch
of I
nter
est R
ate S
ensit
ive A
sset
s and
Lia
bilit
ies -
(con
tinue
d)NOTES TO THE UNCONSOLIDATED FINANCIAL STATEMENTSFor the year ended December 31, 2015
Annual Report 2015192 Annual Report 2015
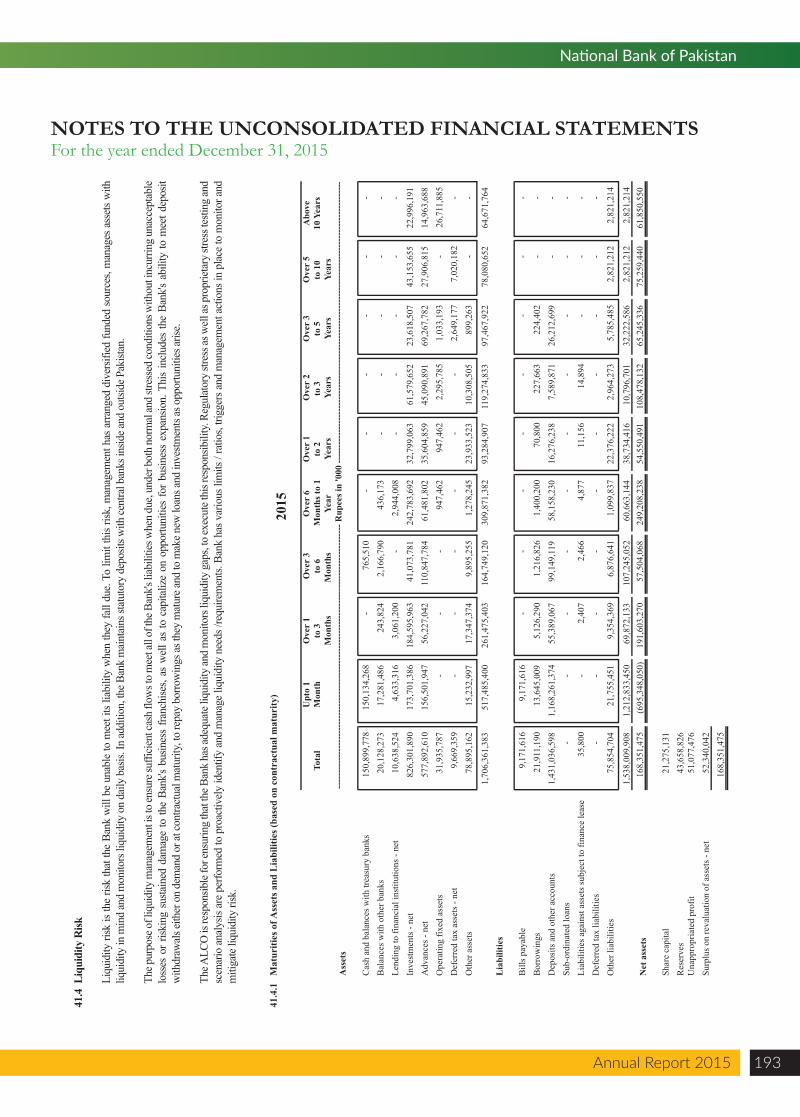
Annual Report 2015 193
National Bank of Pakistan
NOTES TO THE UNCONSOLIDATED FINANCIAL STATEMENTSFor the year ended December 31, 2015
41.4
Liq
uidi
ty R
isk
Li
quid
ity ri
sk is
the
risk
that
the
Bank
will
be
unab
le to
mee
t its
liabi
lity
whe
n th
ey fa
ll du
e. To
lim
it th
is ris
k, m
anag
emen
t has
arra
nged
div
ersif
ied
fund
ed so
urce
s, m
anag
es a
sset
s with
liq
uidi
ty in
min
d an
d m
onito
rs li
quid
ity o
n da
ily b
asis.
In ad
ditio
n, th
e Ban
k m
aint
ains
stat
utor
y de
posit
s with
cent
ral b
anks
insid
e and
out
side P
akist
an.
Th
e pur
pose
of l
iqui
dity
man
agem
ent i
s to
ensu
re su
ffici
ent c
ash
flow
s to
mee
t all
of th
e Ban
k's li
abili
ties w
hen
due,
unde
r bot
h no
rmal
and
stres
sed
cond
ition
s with
out i
ncur
ring
unac
cept
able
lo
sses
or r
iskin
g su
stain
ed d
amag
e to
the
Bank
's bu
sines
s fra
nchi
ses,
as w
ell a
s to
cap
italiz
e on
opp
ortu
nitie
s fo
r bus
ines
s ex
pans
ion.
Thi
s in
clud
es th
e Ba
nk's
abili
ty to
mee
t dep
osit
with
draw
als e
ither
on
dem
and
or at
cont
ract
ual m
atur
ity, t
o re
pay
borro
win
gs as
they
mat
ure a
nd to
mak
e new
loan
s and
inve
stmen
ts as
opp
ortu
nitie
s aris
e.
Th
e ALC
O is
resp
onsib
le fo
r ens
urin
g th
at th
e Ban
k ha
s ade
quat
e liq
uidi
ty an
d m
onito
rs li
quid
ity g
aps,
to ex
ecut
e thi
s res
pons
ibili
ty. R
egul
ator
y str
ess a
s wel
l as p
ropr
ieta
ry st
ress
testi
ng an
d sc
enar
io a
naly
sis a
re p
erfo
rmed
to p
roac
tivel
y id
entif
y an
d m
anag
e liq
uidi
ty n
eeds
/req
uire
men
ts. B
ank
has v
ario
us li
mits
/ ra
tios,
trigg
ers a
nd m
anag
emen
t act
ions
in p
lace
to m
onito
r and
m
itiga
te li
quid
ity ri
sk.
41.4
.1M
atur
ities
of A
sset
s and
Lia
bilit
ies (
base
d on
con
trac
tual
mat
urity
)20
15
Upt
o 1
Ove
r 1
Ove
r 3
Ove
r 6
Ove
r 1
Ove
r 2
Ove
r 3
Ove
r 5
Abo
veTo
tal
Mon
thto
3to
6 M
onth
s to
1to
2to
3
to 5
to 1
010
Yea
rsM
onth
sM
onth
s Ye
arYe
ars
Year
sYe
ars
Year
sA
sset
s
Cas
h an
d ba
lanc
es w
ith tr
easu
ry b
anks
150,
899,
778
150,
134,
268
-
76
5,51
0
-
-
-
-
-
-
B
alan
ces w
ith o
ther
ban
ks20
,128
,273
17
,281
,486
24
3,82
4
2,
166,
790
43
6,17
3
-
-
-
-
-
Lend
ing
to fi
nanc
ial i
nstit
utio
ns -
net
10,6
38,5
24
4,63
3,31
6
3,
061,
200
-
2,94
4,00
8
-
-
-
-
-
In
vest
men
ts -
net
826,
301,
890
173,
701,
386
18
4,59
5,96
3
41
,073
,781
242,
783,
692
32
,799
,063
61,5
79,6
52
23
,618
,507
43,1
53,6
55
22
,996
,191
Adv
ance
s - n
et57
7,89
2,61
0
15
6,50
1,94
7
56,2
27,0
42
110,
847,
784
61
,481
,802
35,6
04,8
59
45
,090
,891
69,2
67,7
82
27
,906
,815
14,9
63,6
88
O
pera
ting
fixed
ass
ets
31,9
35,7
87
-
-
-
94
7,46
2
947,
462
2,29
5,78
5
1,
033,
193
-
26,7
11,8
85
D
efer
red
tax
asse
ts -
net
9,66
9,35
9
-
-
-
-
-
-
2,
649,
177
7,02
0,18
2
-
Oth
er a
sset
s78
,895
,162
15
,232
,997
17
,347
,374
9,
895,
255
1,
278,
245
23,9
33,5
23
10
,308
,505
899,
263
-
-
1,70
6,36
1,38
3
517,
485,
400
26
1,47
5,40
3
16
4,74
9,12
0
309,
871,
382
93
,284
,907
119,
274,
833
97
,467
,922
78,0
80,6
52
64
,671
,764
Lia
bilit
ies
Bill
s pay
able
9,17
1,61
6
9,
171,
616
-
-
-
-
-
-
-
-
B
orro
win
gs21
,911
,190
13
,645
,009
5,
126,
290
1,
216,
826
1,
400,
200
70,8
00
22
7,66
3
224,
402
-
-
Dep
osits
and
oth
er a
ccou
nts
1,43
1,03
6,59
8
1,16
8,26
1,37
4
55
,389
,067
99
,149
,119
58,1
58,2
30
16
,276
,238
7,58
9,87
1
26
,212
,699
-
-
Su
b-or
dina
ted
loan
s-
-
-
-
-
-
-
-
-
-
Liab
ilitie
s aga
inst
ass
ets s
ubje
ct to
fina
nce
leas
e35
,800
-
2,
407
2,
466
4,
877
11,1
56
14
,894
-
-
-
D
efer
red
tax
liabi
litie
s-
-
-
-
-
-
-
-
-
-
Oth
er li
abili
ties
75,8
54,7
04
21,7
55,4
51
9,35
4,36
9
6,87
6,64
1
1,09
9,83
7
22
,376
,222
2,96
4,27
3
5,
785,
485
2,82
1,21
2
2,
821,
214
1,
538,
009,
908
1,
212,
833,
450
69,8
72,1
33
107,
245,
052
60
,663
,144
38,7
34,4
16
10
,796
,701
32,2
22,5
86
2,
821,
212
2,82
1,21
4
Net
ass
ets
168,
351,
475
(695
,348
,050
)
19
1,60
3,27
0
57
,504
,068
249,
208,
238
54
,550
,491
108,
478,
132
65
,245
,336
75,2
59,4
40
61
,850
,550
Shar
e ca
pita
l21
,275
,131
R
eser
ves
43,6
58,8
26
Una
ppro
pria
ted
prof
it51
,077
,476
Su
rplu
s on
reva
luat
ion
of a
sset
s - n
et52
,340
,042
168,
351,
475
----
----
----
----
----
----
----
----
----
----
----
----
----
----
----
----
----
----
----
----
----
----
----
----
--- R
upee
s in
'000
----
----
----
----
----
----
----
----
----
----
----
----
----
----
----
----
----
----
----
----
----
----
----
----
----
----
-
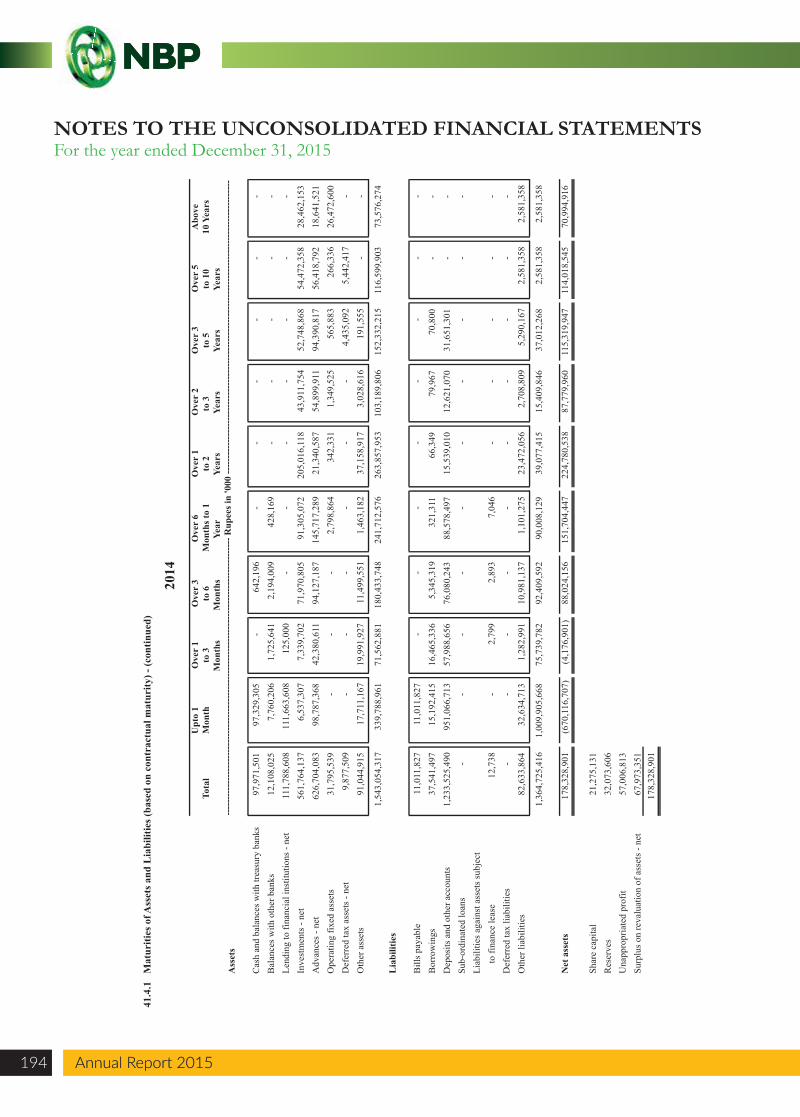
41.4
.1M
atur
ities
of A
sset
s and
Lia
bilit
ies (
base
d on
con
trac
tual
mat
urity
) - (c
ontin
ued)
2014
Upt
o 1
Ove
r 1
Ove
r 3
Ove
r 6
Ove
r 1
Ove
r 2
Ove
r 3
Ove
r 5
Abo
veTo
tal
Mon
thto
3to
6 M
onth
s to
1to
2to
3
to 5
to 1
010
Yea
rsM
onth
sM
onth
s Ye
arYe
ars
Year
sYe
ars
Year
sA
sset
s
Cas
h an
d ba
lanc
es w
ith tr
easu
ry b
anks
97,9
71,5
01
97,3
29,3
05
-
64
2,19
6
-
-
-
-
-
-
Bal
ance
s with
oth
er b
anks
12,1
08,0
25
7,76
0,20
6
1,
725,
641
2,19
4,00
9
42
8,16
9
-
-
-
-
-
Le
ndin
g to
fina
ncia
l ins
titut
ions
- ne
t11
1,78
8,60
8
11
1,66
3,60
8
12
5,00
0
-
-
-
-
-
-
-
In
vest
men
ts -
net
561,
764,
137
6,53
7,30
7
7,
339,
702
71,9
70,8
05
91
,305
,072
205,
016,
118
43
,911
,754
52,7
48,8
68
54
,472
,358
28,4
62,1
53
A
dvan
ces -
net
626,
704,
083
98,7
87,3
68
42,3
80,6
11
94
,127
,187
145,
717,
289
21
,340
,587
54,8
99,9
11
94
,390
,817
56,4
18,7
92
18
,641
,521
Ope
ratin
g fix
ed a
sset
s31
,795
,539
-
-
-
2,
798,
864
342,
331
1,
349,
525
565,
883
26
6,33
6
26,4
72,6
00
D
efer
red
tax
asse
ts -
net
9,87
7,50
9
-
-
-
-
-
-
4,
435,
092
5,44
2,41
7
-
Oth
er a
sset
s 91
,044
,915
17
,711
,167
19
,991
,927
11,4
99,5
51
1,
463,
182
37,1
58,9
17
3,
028,
616
191,
555
-
-
1,54
3,05
4,31
7
33
9,78
8,96
1
71
,562
,881
180,
433,
748
24
1,71
2,57
6
263,
857,
953
10
3,18
9,80
6
152,
332,
215
11
6,59
9,90
3
73,5
76,2
74
L
iabi
litie
s
Bill
s pay
able
11,0
11,8
27
11,0
11,8
27
-
-
-
-
-
-
-
-
Bor
row
ings
37,5
41,4
97
15,1
92,4
15
16,4
65,3
36
5,
345,
319
321,
311
66
,349
79,9
67
70
,800
-
-
Dep
osits
and
oth
er a
ccou
nts
1,23
3,52
5,49
0
95
1,06
6,71
3
57
,988
,656
76,0
80,2
43
88
,578
,497
15,5
39,0
10
12
,621
,070
31,6
51,3
01
-
-
Su
b-or
dina
ted
loan
s-
-
-
-
-
-
-
-
-
-
Li
abili
ties a
gain
st a
sset
s sub
ject
to
fina
nce
leas
e12
,738
-
2,
799
2,89
3
7,
046
-
-
-
-
-
D
efer
red
tax
liabi
litie
s-
-
-
-
-
-
-
-
-
-
O
ther
liab
ilitie
s82
,633
,864
32
,634
,713
1,
282,
991
10,9
81,1
37
1,
101,
275
23,4
72,0
56
2,
708,
809
5,29
0,16
7
2,
581,
358
2,58
1,35
8
1,
364,
725,
416
1,00
9,90
5,66
8
75,7
39,7
82
92
,409
,592
90,0
08,1
29
39
,077
,415
15,4
09,8
46
37
,012
,268
2,58
1,35
8
2,
581,
358
Net
ass
ets
178,
328,
901
(670
,116
,707
)
(4
,176
,901
)
88
,024
,156
151,
704,
447
22
4,78
0,53
8
87,7
79,9
60
11
5,31
9,94
7
114,
018,
545
70
,994
,916
Shar
e ca
pita
l21
,275
,131
R
eser
ves
32,0
73,6
06
Una
ppro
pria
ted
prof
it57
,006
,813
Su
rplu
s on
reva
luat
ion
of a
sset
s - n
et67
,973
,351
178,
328,
901
----
----
----
----
----
----
----
----
----
----
----
----
----
----
----
----
----
----
----
----
----
----
----
----
--- R
upee
s in
'000
----
----
----
----
----
----
----
----
----
----
----
----
----
----
----
----
----
----
----
----
----
----
----
----
----
----
-
NOTES TO THE UNCONSOLIDATED FINANCIAL STATEMENTSFor the year ended December 31, 2015
Annual Report 2015194 Annual Report 2015
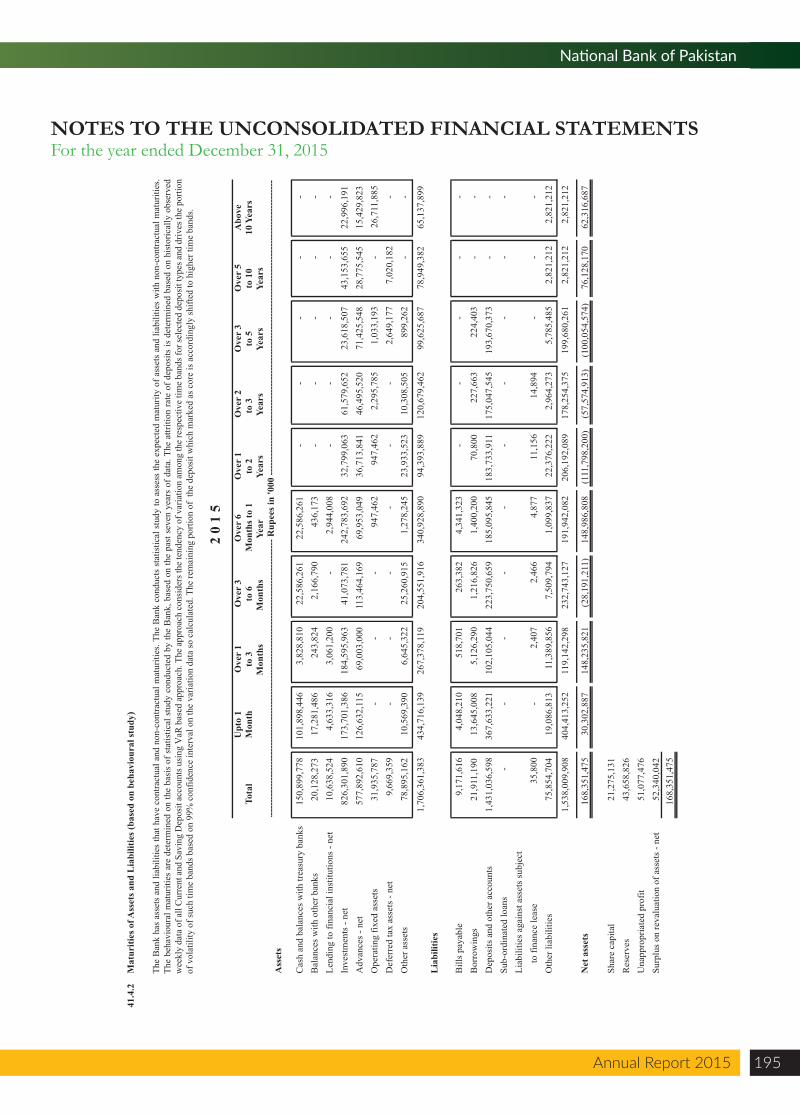
Annual Report 2015 195
National Bank of Pakistan
NOTES TO THE UNCONSOLIDATED FINANCIAL STATEMENTSFor the year ended December 31, 2015
41.4
.2M
atur
ities
of A
sset
s and
Lia
bilit
ies (
base
d on
beh
avio
ural
stud
y)
2 0
1 5
Upt
o 1
Ove
r 1
Ove
r 3
Ove
r 6
Ove
r 1
Ove
r 2
Ove
r 3
Ove
r 5
Abo
veTo
tal
Mon
thto
3to
6 M
onth
s to
1to
2to
3
to 5
to 1
010
Yea
rsM
onth
sM
onth
s Ye
arYe
ars
Year
sYe
ars
Year
s
Ass
ets
Cas
h an
d ba
lanc
es w
ith tr
easu
ry b
anks
150,
899,
778
101,
898,
446
3,
828,
810
22,5
86,2
61
22
,586
,261
-
-
-
-
-
B
alan
ces w
ith o
ther
ban
ks20
,128
,273
17
,281
,486
243,
824
2,
166,
790
436,
173
-
-
-
-
-
Lend
ing
to fi
nanc
ial i
nstit
utio
ns -
net
10,6
38,5
24
4,63
3,31
6
3,
061,
200
-
2,
944,
008
-
-
-
-
-
In
vest
men
ts -
net
826,
301,
890
173,
701,
386
18
4,59
5,96
3
41,0
73,7
81
24
2,78
3,69
2
32,7
99,0
63
61
,579
,652
23,6
18,5
07
43
,153
,655
22,9
96,1
91
A
dvan
ces -
net
577,
892,
610
126,
632,
115
69
,003
,000
113,
464,
169
69
,953
,049
36,7
13,8
41
46
,495
,520
71,4
25,5
48
28
,775
,545
15,4
29,8
23
O
pera
ting
fixed
ass
ets
31,9
35,7
87
-
-
-
94
7,46
2
947,
462
2,
295,
785
1,03
3,19
3
-
26,7
11,8
85
D
efer
red
tax
asse
ts -
net
9,66
9,35
9
-
-
-
-
-
-
2,64
9,17
7
7,
020,
182
-
O
ther
ass
ets
78,8
95,1
62
10,5
69,3
90
6,
645,
322
25,2
60,9
15
1,
278,
245
23,9
33,5
23
10
,308
,505
899,
262
-
-
1,70
6,36
1,38
3
434,
716,
139
26
7,37
8,11
9
204,
551,
916
34
0,92
8,89
0
94,3
93,8
89
12
0,67
9,46
2
99,6
25,6
87
78
,949
,382
65,1
37,8
99
L
iabi
litie
s
Bill
s pay
able
9,17
1,61
6
4,04
8,21
0
51
8,70
1
263,
382
4,
341,
323
-
-
-
-
-
B
orro
win
gs21
,911
,190
13
,645
,008
5,12
6,29
0
1,
216,
826
1,40
0,20
0
70
,800
227,
663
22
4,40
3
-
-
Dep
osits
and
oth
er a
ccou
nts
1,43
1,03
6,59
8
367,
633,
221
10
2,10
5,04
4
223,
750,
659
18
5,09
5,84
5
183,
733,
911
17
5,04
7,54
5
193,
670,
373
-
-
Su
b-or
dina
ted
loan
s-
-
-
-
-
-
-
-
-
-
Liab
ilitie
s aga
inst
ass
ets s
ubje
ct
to fi
nanc
e le
ase
35,8
00
-
2,
407
2,46
6
4,
877
11,1
56
14
,894
-
-
-
O
ther
liab
ilitie
s75
,854
,704
19
,086
,813
11,3
89,8
56
7,
509,
794
1,09
9,83
7
22
,376
,222
2,96
4,27
3
5,
785,
485
2,82
1,21
2
2,
821,
212
1,53
8,00
9,90
8
404,
413,
252
11
9,14
2,29
8
232,
743,
127
19
1,94
2,08
2
206,
192,
089
17
8,25
4,37
5
199,
680,
261
2,
821,
212
2,82
1,21
2
Net
ass
ets
168,
351,
475
30,3
02,8
87
14
8,23
5,82
1
(28,
191,
211)
14
8,98
6,80
8
(111
,798
,200
)
(57,
574,
913)
(1
00,0
54,5
74)
76
,128
,170
62,3
16,6
87
Shar
e ca
pita
l21
,275
,131
R
eser
ves
43,6
58,8
26
Una
ppro
pria
ted
prof
it51
,077
,476
Su
rplu
s on
reva
luat
ion
of a
sset
s - n
et52
,340
,042
168,
351,
475
----
----
----
----
----
----
----
----
----
----
----
----
----
----
----
----
----
----
----
----
----
----
----
----
--- R
upee
s in
'000
----
----
----
----
----
----
----
----
----
----
----
----
----
----
----
----
----
----
----
----
----
----
----
----
----
----
-
The
Ban
k ha
s as
sets
and
liab
ilitie
s th
at h
ave
cont
ract
ual a
nd n
on-c
ontra
ctua
l mat
uriti
es. T
he B
ank
cond
ucts
sta
tistic
al s
tudy
to a
sses
s th
e ex
pect
ed m
atur
ity o
f ass
ets
and
liabi
litie
s w
ith n
on-c
ontra
ctua
l mat
uriti
es.
The
beha
viou
ral m
atur
ities
are
det
erm
ined
on
the
basi
s of
sta
tistic
al s
tudy
con
duct
ed b
y th
e B
ank,
bas
ed o
n th
e pa
st s
even
yea
rs o
f dat
a. T
he a
ttriti
on ra
te o
f dep
osits
is d
eter
min
ed b
ased
on
hist
oric
ally
obs
erve
d w
eekl
y da
ta o
f all
Cur
rent
and
Sav
ing
Dep
osit
acco
unts
usi
ng V
aR b
ased
app
roac
h. T
he a
ppro
ach
cons
ider
s the
tend
ency
of v
aria
tion
amon
g th
e re
spec
tive
time
band
s for
sele
cted
dep
osit
type
s and
driv
es th
e po
rtion
of
vol
atili
ty o
f suc
h tim
e ba
nds b
ased
on
99%
con
fiden
ce in
terv
al o
n th
e va
riatio
n da
ta so
cal
cula
ted.
The
rem
aini
ng p
ortio
n of
the
dep
osit
whi
ch m
arke
d as
cor
e is
acc
ordi
ngly
shift
ed to
hig
her t
ime
band
s.
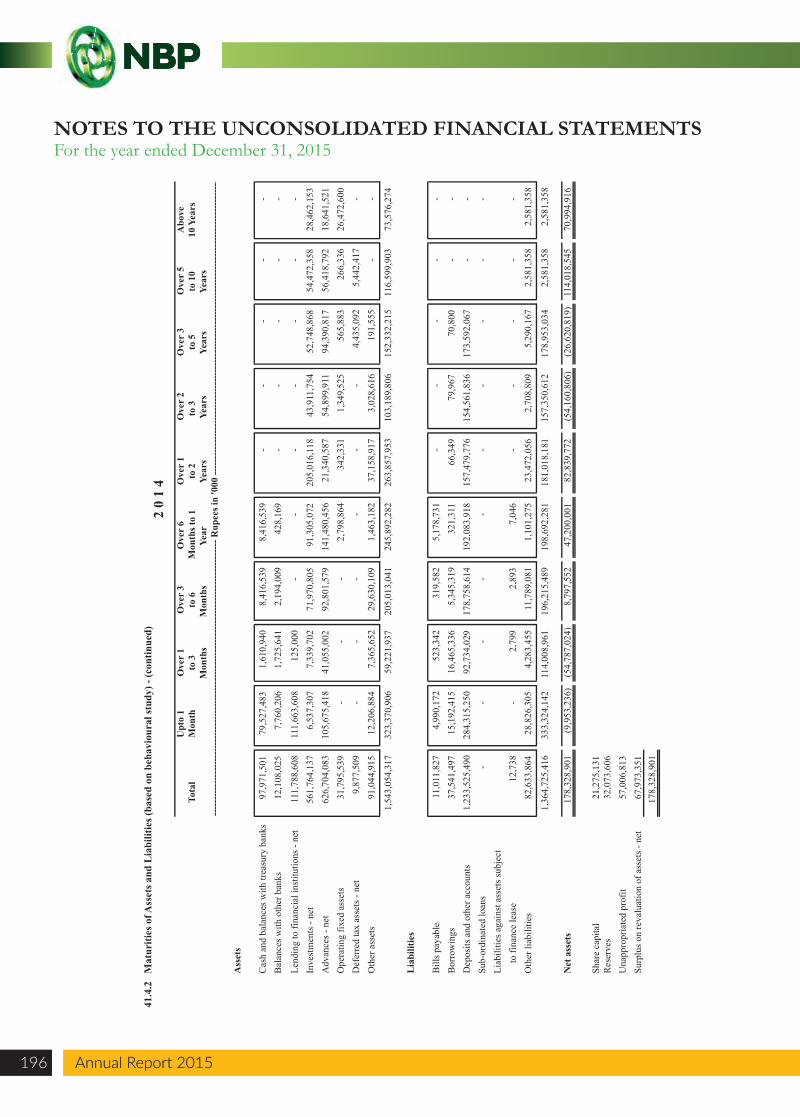
41.4
.2M
atur
ities
of A
sset
s and
Lia
bilit
ies (
base
d on
beh
avio
ural
stud
y) -
(con
tinue
d)2
0 1
4U
pto
1O
ver
1O
ver
3O
ver
6O
ver
1O
ver
2O
ver
3O
ver
5A
bove
Tota
lM
onth
to 3
to 6
Mon
ths t
o 1
to 2
to 3
to
5to
10
10 Y
ears
Mon
ths
Mon
ths
Year
Year
sYe
ars
Year
sYe
ars
Ass
ets
Cas
h an
d ba
lanc
es w
ith tr
easu
ry b
anks
97,9
71,5
01
79,5
27,4
83
1,
610,
940
8,41
6,53
9
8,
416,
539
-
-
-
-
-
B
alan
ces w
ith o
ther
ban
ks12
,108
,025
7,
760,
206
1,72
5,64
1
2,
194,
009
428,
169
-
-
-
-
-
Lend
ing
to fi
nanc
ial i
nstit
utio
ns -
net
111,
788,
608
11
1,66
3,60
8
125,
000
-
-
-
-
-
-
-
Inve
stm
ents
- ne
t56
1,76
4,13
7
6,53
7,30
7
7,
339,
702
71,9
70,8
05
91
,305
,072
205,
016,
118
43
,911
,754
52,7
48,8
68
54
,472
,358
28,4
62,1
53
A
dvan
ces -
net
626,
704,
083
10
5,67
5,41
8
41,0
55,0
02
92
,801
,579
141,
480,
456
21
,340
,587
54,8
99,9
11
94
,390
,817
56,4
18,7
92
18
,641
,521
Ope
ratin
g fix
ed a
sset
s31
,795
,539
-
-
-
2,79
8,86
4
34
2,33
1
1,34
9,52
5
56
5,88
3
266,
336
26
,472
,600
Def
erre
d ta
x as
sets
- ne
t9,
877,
509
-
-
-
-
-
-
4,
435,
092
5,44
2,41
7
-
Oth
er a
sset
s 91
,044
,915
12
,206
,884
7,36
5,65
2
29
,630
,109
1,46
3,18
2
37
,158
,917
3,02
8,61
6
19
1,55
5
-
-
1,54
3,05
4,31
732
3,37
0,90
6
59,2
21,9
37
20
5,01
3,04
1
245,
892,
282
26
3,85
7,95
3
103,
189,
806
15
2,33
2,21
5
116,
599,
903
73
,576
,274
Lia
bilit
ies
Bill
s pay
able
11,0
11,8
27
4,99
0,17
2
52
3,34
2
319,
582
5,
178,
731
-
-
-
-
-
B
orro
win
gs37
,541
,497
15
,192
,415
16,4
65,3
36
5,
345,
319
321,
311
66
,349
79,9
67
70
,800
-
-
Dep
osits
and
oth
er a
ccou
nts
1,23
3,52
5,49
028
4,31
5,25
0
92,7
34,0
29
17
8,75
8,61
4
192,
083,
918
15
7,47
9,77
6
154,
561,
836
17
3,59
2,06
7
-
-
Sub-
ordi
nate
d lo
ans
- -
-
-
-
-
-
-
-
-
Liab
ilitie
s aga
inst
ass
ets s
ubje
ct
to fi
nanc
e le
ase
12,7
38
-
2,
799
2,89
3
7,
046
-
-
-
-
-
O
ther
liab
ilitie
s82
,633
,864
28
,826
,305
4,28
3,45
5
11
,789
,081
1,10
1,27
5
23
,472
,056
2,70
8,80
9
5,
290,
167
2,58
1,35
8
2,
581,
358
1,36
4,72
5,41
633
3,32
4,14
2
114,
008,
961
19
6,21
5,48
9
198,
692,
281
18
1,01
8,18
1
157,
350,
612
17
8,95
3,03
4
2,58
1,35
8
2,
581,
358
Net
ass
ets
178,
328,
901
(9
,953
,236
)
(5
4,78
7,02
4)
8,79
7,55
2
47
,200
,001
82,8
39,7
72
(5
4,16
0,80
6)
(26,
620,
819)
11
4,01
8,54
5
70,9
94,9
16
Shar
e ca
pita
l21
,275
,131
R
eser
ves
32,0
73,6
06
Una
ppro
pria
ted
prof
it57
,006
,813
Su
rplu
s on
reva
luat
ion
of a
sset
s - n
et67
,973
,351
178,
328,
901
----
----
----
----
----
----
----
----
----
----
----
----
----
----
----
----
----
----
----
----
----
----
----
----
--- R
upee
s in
'000
----
----
----
----
----
----
----
----
----
----
----
----
----
----
----
----
----
----
----
----
----
----
----
----
----
----
-NOTES TO THE UNCONSOLIDATED FINANCIAL STATEMENTSFor the year ended December 31, 2015
Annual Report 2015196 Annual Report 2015
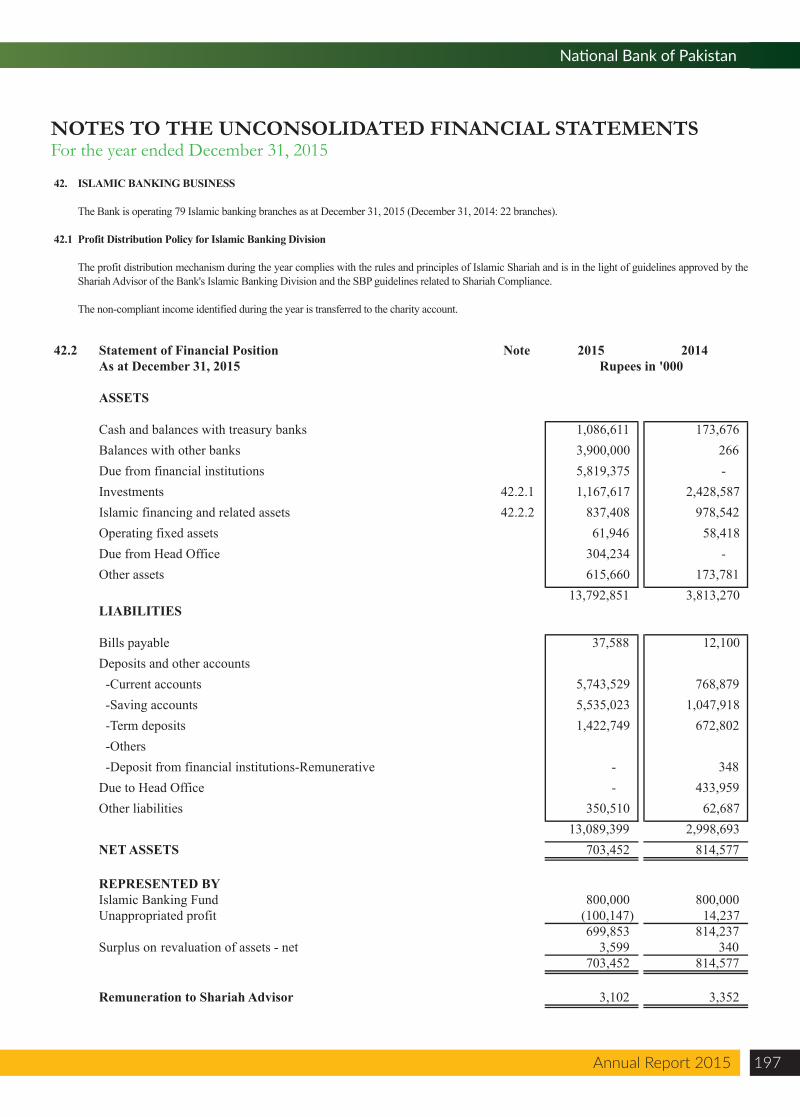
Annual Report 2015 197
National Bank of Pakistan
NOTES TO THE UNCONSOLIDATED FINANCIAL STATEMENTSFor the year ended December 31, 2015
42. ISLAMIC BANKING BUSINESS
The Bank is operating 79 Islamic banking branches as at December 31, 2015 (December 31, 2014: 22 branches).
42.1 Profit Distribution Policy for Islamic Banking Division
The profit distribution mechanism during the year complies with the rules and principles of Islamic Shariah and is in the light of guidelines approved by the Shariah Advisor of the Bank's Islamic Banking Division and the SBP guidelines related to Shariah Compliance.
The non-compliant income identified during the year is transferred to the charity account.
42.2 Statement of Financial Position Note 2015 2014As at December 31, 2015 Rupees in '000
ASSETS
Cash and balances with treasury banks 1,086,611 173,676 Balances with other banks 3,900,000 266 Due from financial institutions 5,819,375 - Investments 42.2.1 1,167,617 2,428,587 Islamic financing and related assets 42.2.2 837,408 978,542 Operating fixed assets 61,946 58,418 Due from Head Office 304,234 - Other assets 615,660 173,781
13,792,851 3,813,270 LIABILITIES
Bills payable 37,588 12,100 Deposits and other accounts -Current accounts 5,743,529 768,879 -Saving accounts 5,535,023 1,047,918 -Term deposits 1,422,749 672,802 -Others -Deposit from financial institutions-Remunerative - 348 Due to Head Office - 433,959 Other liabilities 350,510 62,687
13,089,399 2,998,693 NET ASSETS 703,452 814,577
REPRESENTED BYIslamic Banking Fund 800,000 800,000 Unappropriated profit (100,147) 14,237
699,853 814,237 Surplus on revaluation of assets - net 3,599 340
703,452 814,577
Remuneration to Shariah Advisor 3,102 3,352
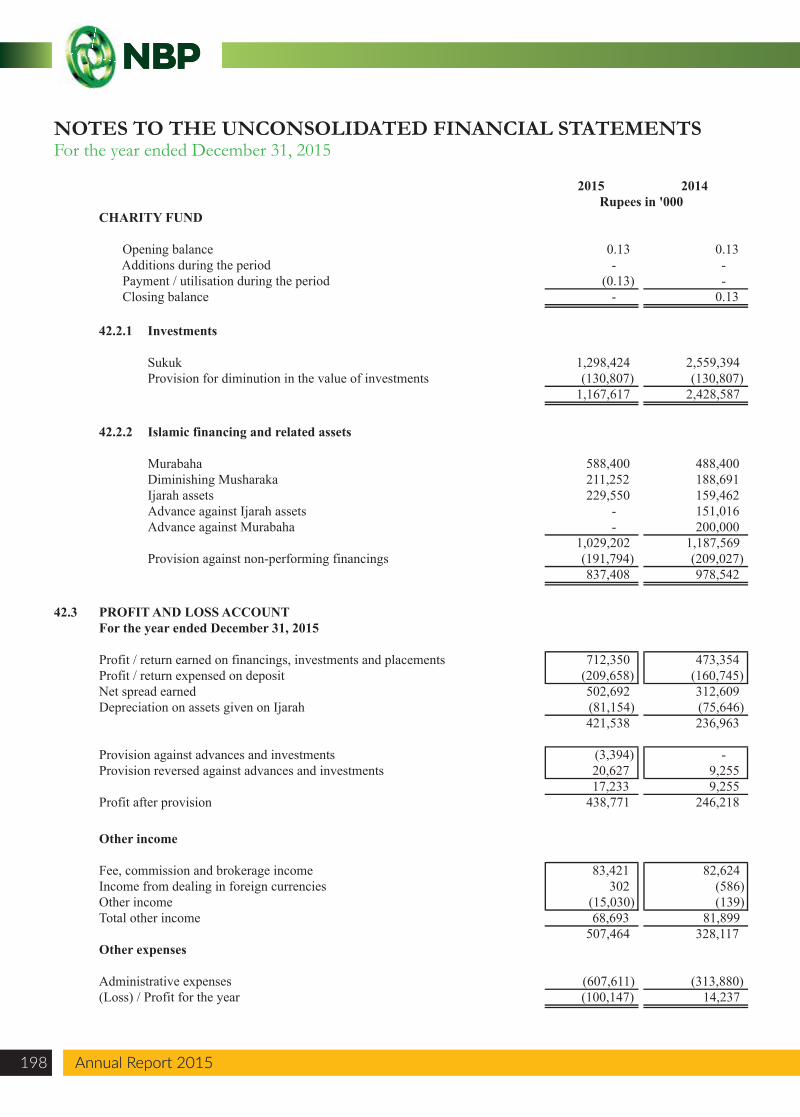
2015 2014Rupees in '000
CHARITY FUND
Opening balance 0.13 0.13 Additions during the period - - Payment / utilisation during the period (0.13) - Closing balance - 0.13
42.2.1 Investments
Sukuk 1,298,424 2,559,394 Provision for diminution in the value of investments (130,807) (130,807)
1,167,617 2,428,587
42.2.2 Islamic financing and related assets
Murabaha 588,400 488,400 Diminishing Musharaka 211,252 188,691 Ijarah assets 229,550 159,462 Advance against Ijarah assets - 151,016 Advance against Murabaha - 200,000
1,029,202 1,187,569 Provision against non-performing financings (191,794) (209,027)
837,408 978,542
42.3 PROFIT AND LOSS ACCOUNTFor the year ended December 31, 2015
Profit / return earned on financings, investments and placements 712,350 473,354 Profit / return expensed on deposit (209,658) (160,745) Net spread earned 502,692 312,609 Depreciation on assets given on Ijarah (81,154) (75,646)
421,538 236,963
Provision against advances and investments (3,394) - Provision reversed against advances and investments 20,627 9,255
17,233 9,255 Profit after provision 438,771 246,218
Other income
Fee, commission and brokerage income 83,421 82,624 Income from dealing in foreign currencies 302 (586) Other income (15,030) (139) Total other income 68,693 81,899
507,464 328,117 Other expenses
Administrative expenses (607,611) (313,880) (Loss) / Profit for the year (100,147) 14,237
NOTES TO THE UNCONSOLIDATED FINANCIAL STATEMENTSFor the year ended December 31, 2015
Annual Report 2015198 Annual Report 2015
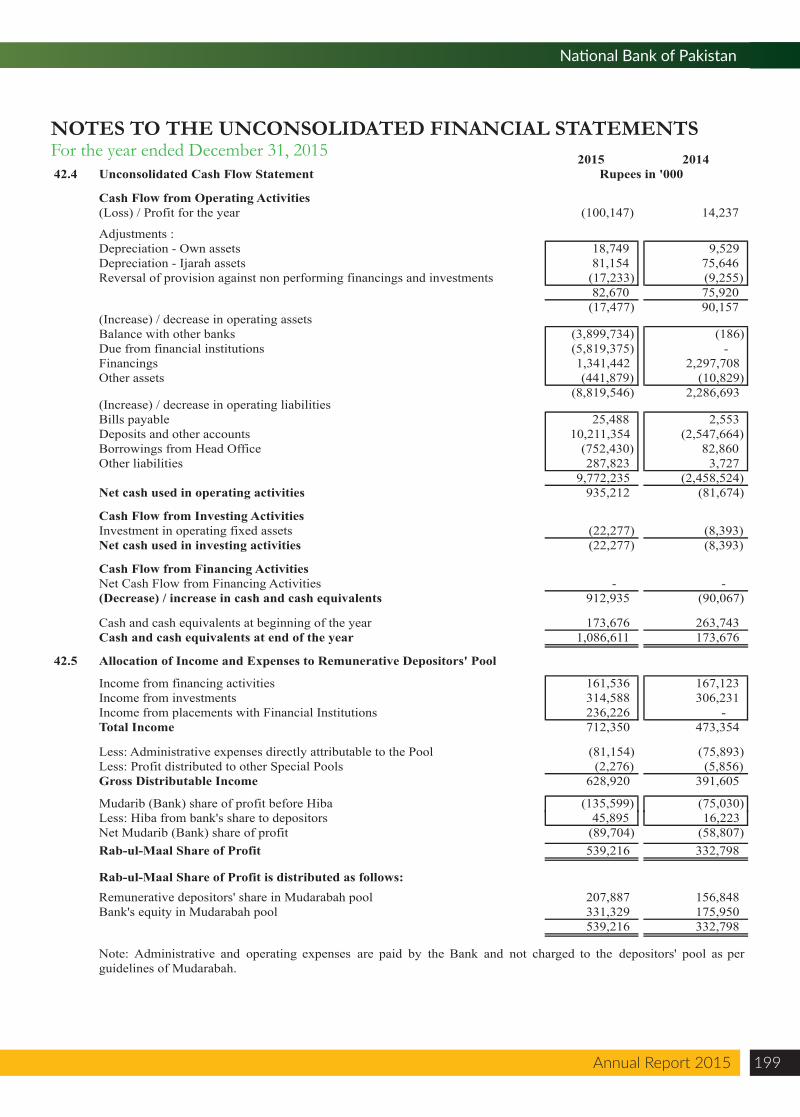
Annual Report 2015 199
National Bank of Pakistan
NOTES TO THE UNCONSOLIDATED FINANCIAL STATEMENTSFor the year ended December 31, 2015 2015 201442.4 Unconsolidated Cash Flow Statement Rupees in '000
Cash Flow from Operating Activities(Loss) / Profit for the year (100,147) 14,237
Adjustments :Depreciation - Own assets 18,749 9,529Depreciation - Ijarah assets 81,154 75,646Reversal of provision against non performing financings and investments (17,233) (9,255)
82,670 75,920(17,477) 90,157
(Increase) / decrease in operating assetsBalance with other banks (3,899,734) (186)Due from financial institutions (5,819,375) Financings 1,341,442 2,297,708Other assets (441,879) (10,829)
(8,819,546) 2,286,693(Increase) / decrease in operating liabilitiesBills payable 25,488 2,553 Deposits and other accounts 10,211,354 (2,547,664)Borrowings from Head Office (752,430) 82,860Other liabilities 287,823 3,727
9,772,235 (2,458,524)Net cash used in operating activities 935,212 (81,674)
Cash Flow from Investing ActivitiesInvestment in operating fixed assets (22,277) (8,393)Net cash used in investing activities (22,277) (8,393)
Cash Flow from Financing ActivitiesNet Cash Flow from Financing Activities - -
-
(Decrease) / increase in cash and cash equivalents 912,935 (90,067)
Cash and cash equivalents at beginning of the year 173,676 263,743Cash and cash equivalents at end of the year 1,086,611 173,676
42.5 Allocation of Income and Expenses to Remunerative Depositors' Pool
Income from financing activities 161,536 167,123 Income from investments 314,588 306,231 Income from placements with Financial Institutions 236,226 - Total Income 712,350 473,354
Less: Administrative expenses directly attributable to the Pool (81,154) (75,893) Less: Profit distributed to other Special Pools (2,276) (5,856) Gross Distributable Income 628,920 391,605
Mudarib (Bank) share of profit before Hiba (135,599) (75,030) Less: Hiba from bank's share to depositors 45,895 16,223 Net Mudarib (Bank) share of profit (89,704) (58,807) Rab-ul-Maal Share of Profit 539,216 332,798
Rab-ul-Maal Share of Profit is distributed as follows:Remunerative depositors' share in Mudarabah pool 207,887 156,848 Bank's equity in Mudarabah pool 331,329 175,950
539,216 332,798
Note: Administrative and operating expenses are paid by the Bank and not charged to the depositors' pool as perguidelines of Mudarabah.
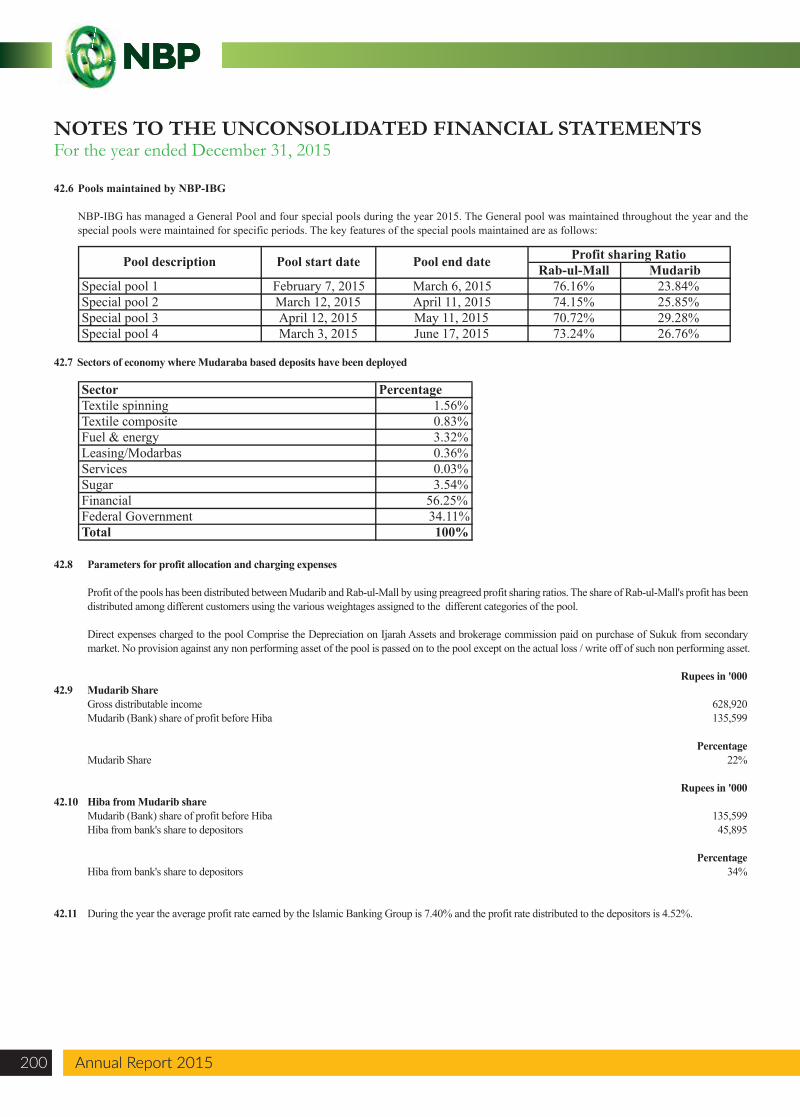
42.6 Pools maintained by NBP-IBG
NBP-IBG has managed a General Pool and four special pools during the year 2015. The General pool was maintained throughout the year and the special pools were maintained for specific periods. The key features of the special pools maintained are as follows:
42.8 Parameters for profit allocation and charging expenses
Profit of the pools has been distributed between Mudarib and Rab-ul-Mall by using preagreed profit sharing ratios. The share of Rab-ul-Mall's profit has been distributed among different customers using the various weightages assigned to the different categories of the pool.
Direct expenses charged to the pool Comprise the Depreciation on Ijarah Assets and brokerage commission paid on purchase of Sukuk from secondary market. No provision against any non performing asset of the pool is passed on to the pool except on the actual loss / write off of such non performing asset.
Rupees in '00042.9 Mudarib Share Gross distributable income 628,920 Mudarib (Bank) share of profit before Hiba 135,599
Percentage Mudarib Share 22%
Rupees in '00042.10 Hiba from Mudarib share Mudarib (Bank) share of profit before Hiba 135,599 Hiba from bank's share to depositors 45,895
Percentage Hiba from bank's share to depositors 34%
42.11 During the year the average profit rate earned by the Islamic Banking Group is 7.40% and the profit rate distributed to the depositors is 4.52%.
Federal Government 34.11%Total 100%
Rab-ul-MallSpecial pool 1 February 7, 2015 76.16% 23.84%Special pool 2 March 12, 2015 74.15% 25.85%Special pool 3 April 12, 2015 70.72% 29.28%Special pool 4 March 3, 2015 73.24% 26.76%
42.7 Sectors of economy where Mudaraba based deposits have been deployed
Sector PercentageTextile spinning 1.56%Textile composite 0.83%Fuel & energy 3.32%Leasing/Modarbas 0.36%Services 0.03%Sugar 3.54%Financial 56.25%
Profit sharing Ratio
June 17, 2015
March 6, 2015Mudarib
April 11, 2015May 11, 2015
Pool end datePool start datePool description
NOTES TO THE UNCONSOLIDATED FINANCIAL STATEMENTSFor the year ended December 31, 2015
Annual Report 2015200 Annual Report 2015
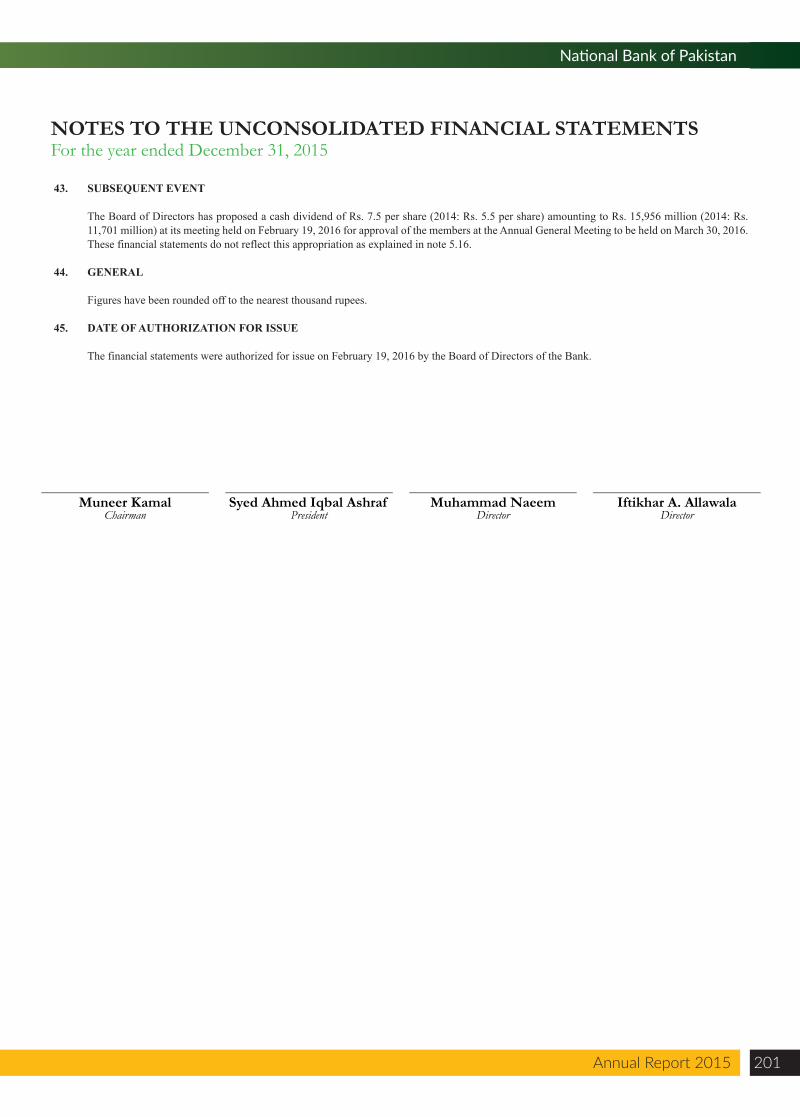
Annual Report 2015 201
National Bank of Pakistan
NOTES TO THE UNCONSOLIDATED FINANCIAL STATEMENTSFor the year ended December 31, 2015
43. SUBSEQUENT EVENT
The Board of Directors has proposed a cash dividend of Rs. 7.5 per share (2014: Rs. 5.5 per share) amounting to Rs. 15,956 million (2014: Rs. 11,701 million) at its meeting held on February 19, 2016 for approval of the members at the Annual General Meeting to be held on March 30, 2016. These financial statements do not reflect this appropriation as explained in note 5.16.
44. GENERAL
Figures have been rounded off to the nearest thousand rupees.
45. DATE OF AUTHORIZATION FOR ISSUE
The financial statements were authorized for issue on February 19, 2016 by the Board of Directors of the Bank.
Muneer KamalChairman
Syed Ahmed Iqbal AshrafPresident
Muhammad NaeemDirector
Iftikhar A. AllawalaDirector
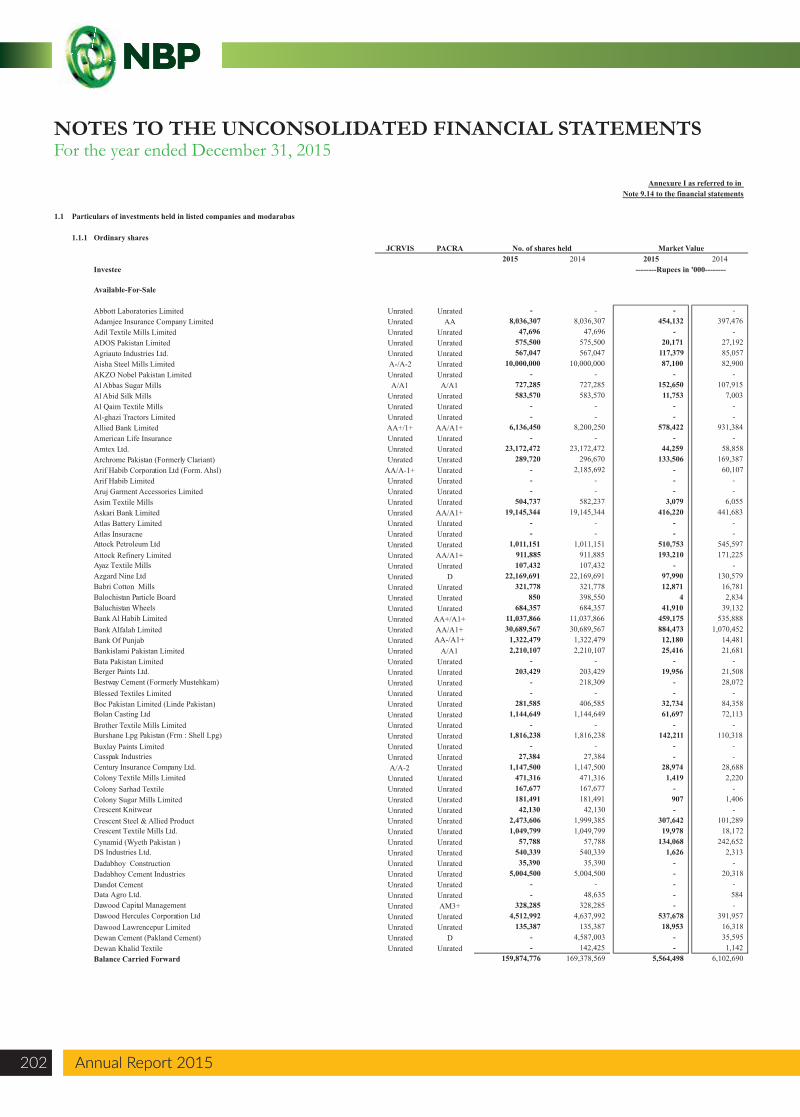
Annexure I as referred to in Note 9.14 to the financial statements
1.1 Particulars of investments held in listed companies and modarabas
1.1.1 Ordinary sharesJCRVIS PACRA
2015 2014 2015 2014Investee
Available-For-Sale
Abbott Laboratories Limited Unrated Unrated - - - - Adamjee Insurance Company Limited Unrated AA 8,036,307 8,036,307 454,132 397,476 Adil Textile Mills Limited Unrated Unrated 47,696 47,696 - - ADOS Pakistan Limited Unrated Unrated 575,500 575,500 20,171 27,192 Agriauto Industries Ltd. Unrated Unrated 567,047 567,047 117,379 85,057 Aisha Steel Mills Limited A-/A-2 Unrated 10,000,000 10,000,000 87,100 82,900 AKZO Nobel Pakistan Limited Unrated Unrated - - - - Al Abbas Sugar Mills A/A1 A/A1 727,285 727,285 152,650 107,915 Al Abid Silk Mills Unrated Unrated 583,570 583,570 11,753 7,003 Al Qaim Textile Mills Unrated Unrated - - - - Al-ghazi Tractors Limited Unrated Unrated - - - - Allied Bank Limited AA+/1+ AA/A1+ 6,136,450 8,200,250 578,422 931,384 American Life Insurance Unrated Unrated - - - - Amtex Ltd. Unrated Unrated 23,172,472 23,172,472 44,259 58,858 Archrome Pakistan (Formerly Clariant) Unrated Unrated 289,720 296,670 133,506 169,387 Arif Habib Corporation Ltd (Form. Ahsl) AA/A-1+ Unrated - 2,185,692 - 60,107 Arif Habib Limited Unrated Unrated - - - - Aruj Garment Accessories Limited Unrated Unrated - - - - Asim Textile Mills Unrated Unrated 504,737 582,237 3,079 6,055 Askari Bank Limited Unrated AA/A1+ 19,145,344 19,145,344 416,220 441,683 Atlas Battery Limited Unrated Unrated - - - - Atlas Insuracne Unrated Unrated - - - - Attock Petroleum Ltd Unrated Unrated 1,011,151 1,011,151 510,753 545,597 Attock Refinery Limited Unrated AA/A1+ 911,885 911,885 193,210 171,225 Ayaz Textile Mills Unrated Unrated 107,432 107,432 - - Azgard Nine Ltd Unrated D 22,169,691 22,169,691 97,990 130,579 Babri Cotton Mills Unrated Unrated 321,778 321,778 12,871 16,781 Balochistan Particle Board Unrated Unrated 850 398,550 4 2,834 Baluchistan Wheels Unrated Unrated 684,357 684,357 41,910 39,132 Bank Al Habib Limited Unrated AA+/A1+ 11,037,866 11,037,866 459,175 535,888 Bank Alfalah Limited Unrated AA/A1+ 30,689,567 30,689,567 884,473 1,070,452 Bank Of Punjab Unrated AA-/A1+ 1,322,479 1,322,479 12,180 14,481 Bankislami Pakistan Limited Unrated A/A1 2,210,107 2,210,107 25,416 21,681 Bata Pakistan Limited Unrated Unrated - - - - Berger Paints Ltd. Unrated Unrated 203,429 203,429 19,956 21,508 Bestway Cement (Formerly Mustehkam) Unrated Unrated - 218,309 - 28,072 Blessed Textiles Limited Unrated Unrated - - - - Boc Pakistan Limited (Linde Pakistan) Unrated Unrated 281,585 406,585 32,734 84,358 Bolan Casting Ltd Unrated Unrated 1,144,649 1,144,649 61,697 72,113 Brother Textile Mills Limited Unrated Unrated - - - - Burshane Lpg Pakistan (Frm : Shell Lpg) Unrated Unrated 1,816,238 1,816,238 142,211 110,318 Buxlay Paints Limited Unrated Unrated - - - - Casspak Industries Unrated Unrated 27,384 27,384 - - Century Insurance Company Ltd. A/A-2 Unrated 1,147,500 1,147,500 28,974 28,688 Colony Textile Mills Limited Unrated Unrated 471,316 471,316 1,419 2,220 Colony Sarhad Textile Unrated Unrated 167,677 167,677 - - Colony Sugar Mills Limited Unrated Unrated 181,491 181,491 907 1,406 Crescent Knitwear Unrated Unrated 42,130 42,130 - - Crescent Steel & Allied Product Unrated Unrated 2,473,606 1,999,385 307,642 101,289 Crescent Textile Mills Ltd. Unrated Unrated 1,049,799 1,049,799 19,978 18,172 Cynamid (Wyeth Pakistan ) Unrated Unrated 57,788 57,788 134,068 242,652 DS Industries Ltd. Unrated Unrated 540,339 540,339 1,626 2,313 Dadabhoy Construction Unrated Unrated 35,390 35,390 - - Dadabhoy Cement Industries Unrated Unrated 5,004,500 5,004,500 - 20,318 Dandot Cement Unrated Unrated - - - - Data Agro Ltd. Unrated Unrated - 48,635 - 584 Dawood Capital Management Unrated AM3+ 328,285 328,285 - - Dawood Hercules Corporation Ltd Unrated Unrated 4,512,992 4,637,992 537,678 391,957 Dawood Lawrencepur Limited Unrated Unrated 135,387 135,387 18,953 16,318 Dewan Cement (Pakland Cement) Unrated D - 4,587,003 - 35,595 Dewan Khalid Textile Unrated Unrated - 142,425 - 1,142 Balance Carried Forward 159,874,776 169,378,569 5,564,498 6,102,690
No. of shares held Market Value
--------Rupees in '000--------
NOTES TO THE UNCONSOLIDATED FINANCIAL STATEMENTSFor the year ended December 31, 2015
Annual Report 2015202 Annual Report 2015
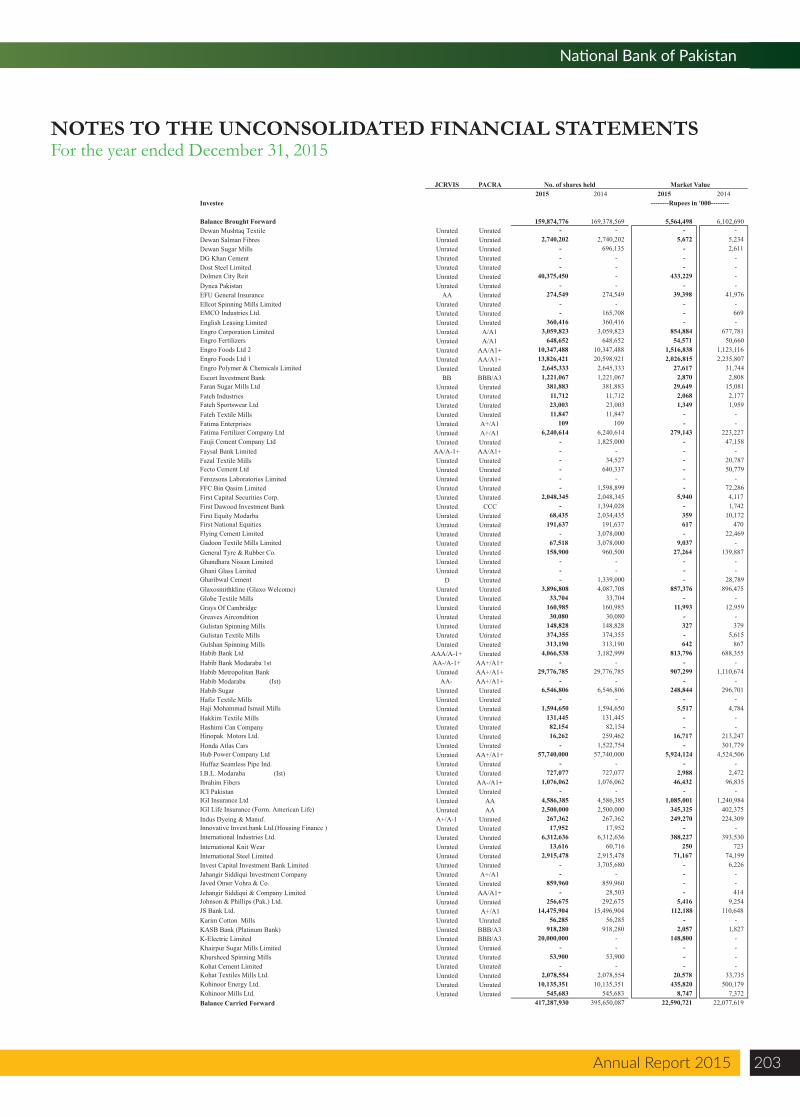
Annual Report 2015 203
National Bank of Pakistan
NOTES TO THE UNCONSOLIDATED FINANCIAL STATEMENTSFor the year ended December 31, 2015
JCRVIS PACRA2015 2014 2015 2014
Investee
Balance Brought Forward 159,874,776 169,378,569 5,564,498 6,102,690 Dewan Mushtaq Textile Unrated Unrated - - - - Dewan Salman Fibres Unrated Unrated 2,740,202 2,740,202 5,672 5,234 Dewan Sugar Mills Unrated Unrated - 696,135 - 2,611 DG Khan Cement Unrated Unrated - - - - Dost Steel Limited Unrated Unrated - - - - Dolmen City Reit Unrated Unrated 40,375,450 - 433,229 - Dynea Pakistan Unrated Unrated - - - - EFU General Insurance AA Unrated 274,549 274,549 39,398 41,976 Ellcot Spinning Mills Limited Unrated Unrated - - - - EMCO Industries Ltd. Unrated Unrated - 165,708 - 669 English Leasing Limited Unrated Unrated 360,416 360,416 - - Engro Corporation Limited Unrated A/A1 3,059,823 3,059,823 854,884 677,781 Engro Fertilizers Unrated A/A1 648,652 648,652 54,571 50,660 Engro Foods Ltd 2 Unrated AA/A1+ 10,347,488 10,347,488 1,516,838 1,123,116 Engro Foods Ltd 1 Unrated AA/A1+ 13,826,421 20,598,921 2,026,815 2,235,807 Engro Polymer & Chemicals Limited Unrated Unrated 2,645,333 2,645,333 27,617 31,744 Escort Investment Bank BB BBB/A3 1,221,067 1,221,067 2,870 2,808 Faran Sugar Mills Ltd Unrated Unrated 381,883 381,883 29,649 15,081 Fateh Industries Unrated Unrated 11,712 11,712 2,068 2,177 Fateh Sportswear Ltd Unrated Unrated 23,003 23,003 1,349 1,959 Fateh Textile Mills Unrated Unrated 11,847 11,847 - - Fatima Enterprises Unrated A+/A1 109 109 - - Fatima Fertilizer Company Ltd Unrated A+/A1 6,240,614 6,240,614 279,143 223,227 Fauji Cement Company Ltd Unrated Unrated - 1,825,000 - 47,158 Faysal Bank Limited AA/A-1+ AA/A1+ - - - - Fazal Textile Mills Unrated Unrated - 34,527 - 20,787 Fecto Cement Ltd Unrated Unrated - 640,337 - 50,779 Ferozsons Laboratories Limited Unrated Unrated - - - - FFC Bin Qasim Limited Unrated Unrated - 1,598,899 - 72,286 First Capital Securities Corp. Unrated Unrated 2,048,345 2,048,345 5,940 4,117 First Dawood Investment Bank Unrated CCC - 1,394,028 - 1,742 First Equity Modarba Unrated Unrated 68,435 2,034,435 359 10,172 First National Equities Unrated Unrated 191,637 191,637 617 470 Flying Cement Limited Unrated Unrated - 3,078,000 - 22,469 Gadoon Textile Mills Limited Unrated Unrated 67,518 3,078,000 9,037 - General Tyre & Rubber Co. Unrated Unrated 158,900 960,500 27,264 139,887 Ghandhara Nissan Limited Unrated Unrated - - - - Ghani Glass Limited Unrated Unrated - - - - Gharibwal Cement D Unrated - 1,339,000 - 28,789 Glaxosmithkline (Glaxo Welcome) Unrated Unrated 3,896,808 4,087,708 857,376 896,475 Globe Textile Mills Unrated Unrated 33,704 33,704 - - Grays Of Cambridge Unrated Unrated 160,985 160,985 11,993 12,959 Greaves Aircondition Unrated Unrated 30,080 30,080 - - Gulistan Spinning Mills Unrated Unrated 148,828 148,828 327 379 Gulistan Textile Mills Unrated Unrated 374,355 374,355 - 5,615 Gulshan Spinning Mills Unrated Unrated 313,190 313,190 642 867 Habib Bank Ltd AAA/A-1+ Unrated 4,066,538 3,182,999 813,796 688,355 Habib Bank Modaraba 1st AA-/A-1+ AA+/A1+ - - - - Habib Metropolitan Bank Unrated AA+/A1+ 29,776,785 29,776,785 907,299 1,110,674 Habib Modaraba (Ist) AA- AA+/A1+ - - - - Habib Sugar Unrated Unrated 6,546,806 6,546,806 248,844 296,701 Hafiz Textile Mills Unrated Unrated - - - - Haji Mohammad Ismail Mills Unrated Unrated 1,594,650 1,594,650 5,517 4,784 Hakkim Textile Mills Unrated Unrated 131,445 131,445 - - Hashimi Can Company Unrated Unrated 82,154 82,154 - - Hinopak Motors Ltd. Unrated Unrated 16,262 259,462 16,717 213,247 Honda Atlas Cars Unrated Unrated - 1,522,754 - 301,779 Hub Power Company Ltd Unrated AA+/A1+ 57,740,000 57,740,000 5,924,124 4,524,506 Huffaz Seamless Pipe Ind. Unrated Unrated - - - - I.B.L. Modaraba (Ist) Unrated Unrated 727,077 727,077 2,988 2,472 Ibrahim Fibers Unrated AA-/A1+ 1,076,062 1,076,062 46,432 96,835 ICI Pakistan Unrated Unrated - - - - IGI Insurance Ltd Unrated AA 4,586,385 4,586,385 1,085,001 1,240,984 IGI Life Insurance (Form. American Life) Unrated AA 2,500,000 2,500,000 345,325 402,375 Indus Dyeing & Manuf. A+/A-1 Unrated 267,362 267,362 249,270 224,309 Innovative Invest.bank Ltd.(Housing Finance ) Unrated Unrated 17,952 17,952 - - International Industries Ltd. Unrated Unrated 6,312,636 6,312,636 388,227 393,530 International Knit Wear Unrated Unrated 13,616 60,716 250 723 International Steel Limited Unrated Unrated 2,915,478 2,915,478 71,167 74,199 Invest Capital Investment Bank Limited Unrated Unrated - 3,705,680 - 6,226 Jahangir Siddiqui Investment Company Unrated A+/A1 - - - - Javed Omer Vohra & Co. Unrated Unrated 859,960 859,960 - - Jehangir Siddiqui & Company Limited Unrated AA/A1+ - 28,503 - 414 Johnson & Phillips (Pak.) Ltd. Unrated Unrated 256,675 292,675 5,416 9,254 JS Bank Ltd. Unrated A+/A1 14,475,904 15,496,904 112,188 110,648 Karim Cotton Mills Unrated Unrated 56,285 56,285 - - KASB Bank (Platinum Bank) Unrated BBB/A3 918,280 918,280 2,057 1,827 K-Electric Limited Unrated BBB/A3 20,000,000 - 148,800 - Khairpur Sugar Mills Limited Unrated Unrated - - - - Khursheed Spinning Mills Unrated Unrated 53,900 53,900 - - Kohat Cement Limited Unrated Unrated - - - - Kohat Textiles Mills Ltd. Unrated Unrated 2,078,554 2,078,554 20,578 33,735 Kohinoor Energy Ltd. Unrated Unrated 10,135,351 10,135,351 435,820 500,179 Kohinoor Mills Ltd. Unrated Unrated 545,683 545,683 8,747 7,372 Balance Carried Forward 417,287,930 395,650,087 22,590,721 22,077,619
No. of shares held Market Value
--------Rupees in '000--------
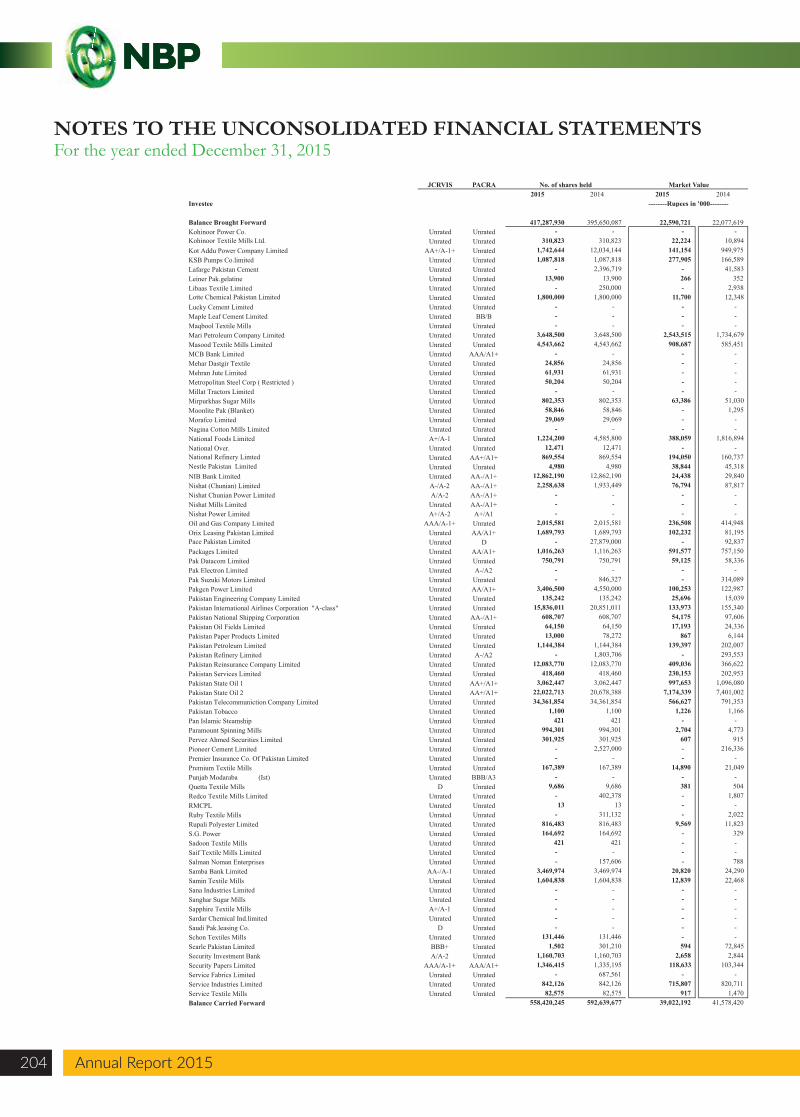
JCRVIS PACRA2015 2014 2015 2014
Investee
Balance Brought Forward 417,287,930 395,650,087 22,590,721 22,077,619 Kohinoor Power Co. Unrated Unrated - - - - Kohinoor Textile Mills Ltd. Unrated Unrated 310,823 310,823 22,224 10,894 Kot Addu Power Company Limited AA+/A-1+ Unrated 1,742,644 12,034,144 141,154 949,975 KSB Pumps Co.limited Unrated Unrated 1,087,818 1,087,818 277,905 166,589 Lafarge Pakistan Cement Unrated Unrated - 2,396,719 - 41,583 Leiner Pak.gelatine Unrated Unrated 13,900 13,900 266 352 Libaas Textile Limited Unrated Unrated - 250,000 - 2,938 Lotte Chemical Pakistan Limited Unrated Unrated 1,800,000 1,800,000 11,700 12,348 Lucky Cement Limited Unrated Unrated - - - - Maple Leaf Cement Limited Unrated BB/B - - - - Maqbool Textile Mills Unrated Unrated - - - - Mari Petroleum Company Limited Unrated Unrated 3,648,500 3,648,500 2,543,515 1,734,679 Masood Textile Mills Limited Unrated Unrated 4,543,662 4,543,662 908,687 585,451 MCB Bank Limited Unrated AAA/A1+ - - - - Mehar Dastgir Textile Unrated Unrated 24,856 24,856 - - Mehran Jute Limited Unrated Unrated 61,931 61,931 - - Metropolitan Steel Corp ( Restricted ) Unrated Unrated 50,204 50,204 - - Millat Tractors Limited Unrated Unrated - - - - Mirpurkhas Sugar Mills Unrated Unrated 802,353 802,353 63,386 51,030 Moonlite Pak (Blanket) Unrated Unrated 58,846 58,846 - 1,295 Morafco Limited Unrated Unrated 29,069 29,069 - - Nagina Cotton Mills Limited Unrated Unrated - - - - National Foods Limited A+/A-1 Unrated 1,224,200 4,585,800 388,059 1,816,894 National Over. Unrated Unrated 12,471 12,471 - - National Refinery Limted Unrated AA+/A1+ 869,554 869,554 194,050 160,737 Nestle Pakistan Limited Unrated Unrated 4,980 4,980 38,844 45,318 NIB Bank Limited Unrated AA-/A1+ 12,862,190 12,862,190 24,438 29,840 Nishat (Chunian) Limited A-/A-2 AA-/A1+ 2,258,638 1,933,449 76,794 87,817 Nishat Chunian Power Limited A/A-2 AA-/A1+ - - - - Nishat Mills Limited Unrated AA-/A1+ - - - - Nishat Power Limited A+/A-2 A+/A1 - - - - Oil and Gas Company Limited AAA/A-1+ Unrated 2,015,581 2,015,581 236,508 414,948 Orix Leasing Pakistan Limited Unrated AA/A1+ 1,689,793 1,689,793 102,232 81,195 Pace Pakistan Limited Unrated D - 27,879,000 - 92,837 Packages Limited Unrated AA/A1+ 1,016,263 1,116,263 591,577 757,150 Pak Datacom Limited Unrated Unrated 750,791 750,791 59,125 58,336 Pak Electron Limited Unrated A-/A2 - - - - Pak Suzuki Motors Limited Unrated Unrated - 846,327 - 314,089 Pakgen Power Limited Unrated AA/A1+ 3,406,500 4,550,000 100,253 122,987 Pakistan Engineering Company Limited Unrated Unrated 135,242 135,242 25,696 15,039 Pakistan International Airlines Corporation "A-class" Unrated Unrated 15,836,011 20,851,011 133,973 155,340 Pakistan National Shipping Corporation Unrated AA-/A1+ 608,707 608,707 54,175 97,606 Pakistan Oil Fields Limited Unrated Unrated 64,150 64,150 17,193 24,336 Pakistan Paper Products Limited Unrated Unrated 13,000 78,272 867 6,144 Pakistan Petroleum Limited Unrated Unrated 1,144,384 1,144,384 139,397 202,007 Pakistan Refinery Limited Unrated A-/A2 - 1,803,706 - 293,553 Pakistan Reinsurance Company Limited Unrated Unrated 12,083,770 12,083,770 409,036 366,622 Pakistan Services Limited Unrated Unrated 418,460 418,460 230,153 202,953 Pakistan State Oil 1 Unrated AA+/A1+ 3,062,447 3,062,447 997,653 1,096,080 Pakistan State Oil 2 Unrated AA+/A1+ 22,022,713 20,678,388 7,174,339 7,401,002 Pakistan Telecommuniction Company Limited Unrated Unrated 34,361,854 34,361,854 566,627 791,353 Pakistan Tobacco Unrated Unrated 1,100 1,100 1,226 1,166 Pan Islamic Steamship Unrated Unrated 421 421 - - Paramount Spinning Mills Unrated Unrated 994,301 994,301 2,704 4,773 Pervez Ahmed Securities Limited Unrated Unrated 301,925 301,925 607 915 Pioneer Cement Limited Unrated Unrated - 2,527,000 - 216,336 Premier Insurance Co. Of Pakistan Limited Unrated Unrated - - - - Premium Textile Mills Unrated Unrated 167,389 167,389 14,890 21,049 Punjab Modaraba (Ist) Unrated BBB/A3 - - - - Quetta Textile Mills D Unrated 9,686 9,686 381 504 Redco Textile Mills Limited Unrated Unrated - 402,378 - 1,807 RMCPL Unrated Unrated 13 13 - - Ruby Textile Mills Unrated Unrated - 311,132 - 2,022 Rupali Polyester Limited Unrated Unrated 816,483 816,483 9,569 11,823 S.G. Power Unrated Unrated 164,692 164,692 - 329 Sadoon Textile Mills Unrated Unrated 421 421 - - Saif Textile Mills Limited Unrated Unrated - - - - Salman Noman Enterprises Unrated Unrated - 157,606 - 788 Samba Bank Limited AA-/A-1 Unrated 3,469,974 3,469,974 20,820 24,290 Samin Textile Mills Unrated Unrated 1,604,838 1,604,838 12,839 22,468 Sana Industries Limited Unrated Unrated - - - - Sanghar Sugar Mills Unrated Unrated - - - - Sapphire Textile Mills A+/A-1 Unrated - - - - Sardar Chemical Ind.limited Unrated Unrated - - - - Saudi Pak.leasing Co. D Unrated - - - - Schon Textiles Mills Unrated Unrated 131,446 131,446 - - Searle Pakistan Limited BBB+ Unrated 1,502 301,210 594 72,845 Security Investment Bank A/A-2 Unrated 1,160,703 1,160,703 2,658 2,844 Security Papers Limited AAA/A-1+ AAA/A1+ 1,346,415 1,335,195 118,633 103,344 Service Fabrics Limited Unrated Unrated - 687,561 - - Service Industries Limited Unrated Unrated 842,126 842,126 715,807 820,711 Service Textile Mills Unrated Unrated 82,575 82,575 917 1,470 Balance Carried Forward 558,420,245 592,639,677 39,022,192 41,578,420
No. of shares held Market Value
--------Rupees in '000--------
NOTES TO THE UNCONSOLIDATED FINANCIAL STATEMENTSFor the year ended December 31, 2015
Annual Report 2015204 Annual Report 2015
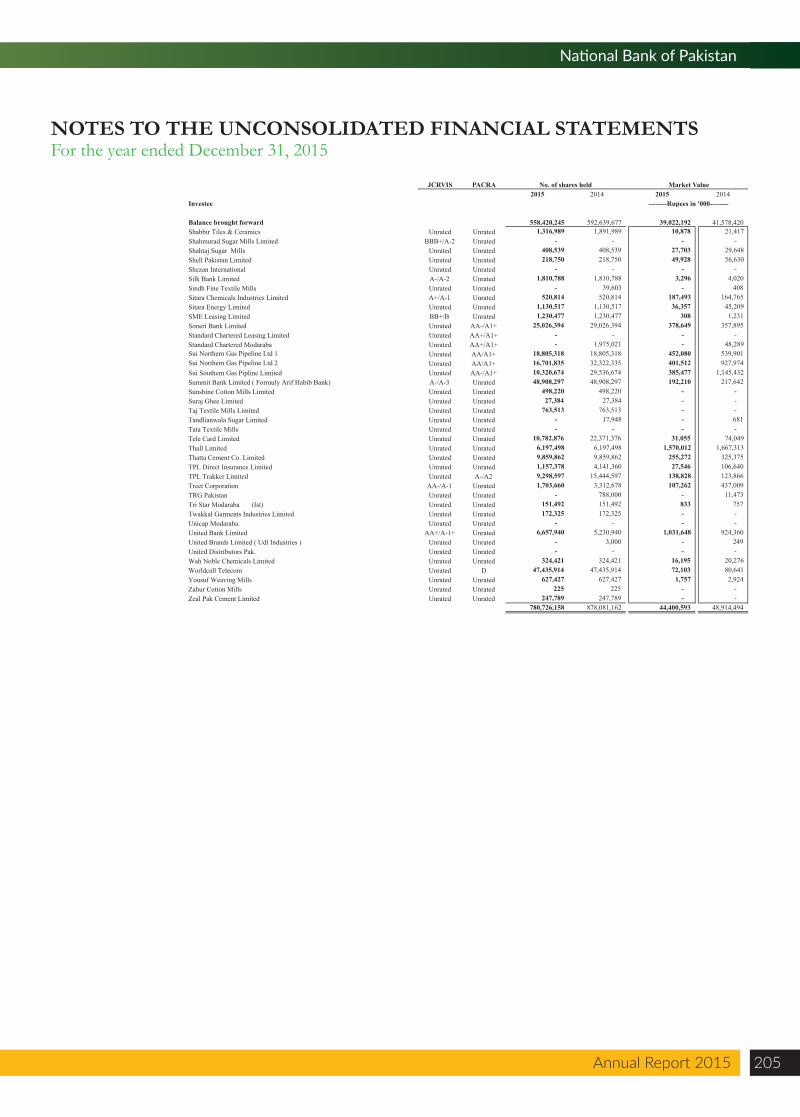
Annual Report 2015 205
National Bank of Pakistan
NOTES TO THE UNCONSOLIDATED FINANCIAL STATEMENTSFor the year ended December 31, 2015
JCRVIS PACRA2015 2014 2015 2014
Investee
Balance brought forward 558,420,245 592,639,677 39,022,192 41,578,420 Shabbir Tiles & Ceramics Unrated Unrated 1,316,989 1,891,989 10,878 21,417 Shahmurad Sugar Mills Limited BBB+/A-2 Unrated - - - - Shahtaj Sugar Mills Unrated Unrated 408,539 408,539 27,703 29,648 Shell Pakistan Limited Unrated Unrated 218,750 218,750 49,928 56,630 Shezan International Unrated Unrated - - - - Silk Bank Limited A-/A-2 Unrated 1,810,788 1,810,788 3,296 4,020 Sindh Fine Textile Mills Unrated Unrated - 39,603 - 408 Sitara Chemicals Industries Limited A+/A-1 Unrated 520,814 520,814 187,493 164,765 Sitara Energy Limited Unrated Unrated 1,130,517 1,130,517 36,357 45,209 SME Leasing Limited BB+/B Unrated 1,230,477 1,230,477 308 1,231 Soneri Bank Limited Unrated AA-/A1+ 25,026,394 29,026,394 378,649 357,895 Standard Chartered Leasing Limited Unrated AA+/A1+ - - - - Standard Chartered Modaraba Unrated AA+/A1+ - 1,975,021 - 48,289 Sui Northern Gas Pipeline Ltd 1 Unrated AA/A1+ 18,805,318 18,805,318 452,080 539,901 Sui Northern Gas Pipeline Ltd 2 Unrated AA/A1+ 16,701,835 32,322,335 401,512 927,974 Sui Southern Gas Pipline Limited Unrated AA-/A1+ 10,320,674 29,536,674 385,477 1,145,432 Summit Bank Limited ( Formuly Arif Habib Bank) A-/A-3 Unrated 48,908,297 48,908,297 192,210 217,642 Sunshine Cotton Mills Limited Unrated Unrated 498,220 498,220 - - Suraj Ghee Limited Unrated Unrated 27,384 27,384 - - Taj Textile Mills Limited Unrated Unrated 763,513 763,513 - - Tandlianwala Sugar Limited Unrated Unrated - 17,948 - 681 Tata Textile Mills Unrated Unrated - - - - Tele Card Limited Unrated Unrated 10,782,876 22,371,376 31,055 74,049 Thall Limited Unrated Unrated 6,197,498 6,197,498 1,570,012 1,667,313 Thatta Cement Co. Limited Unrated Unrated 9,859,862 9,859,862 255,272 325,375 TPL Direct Insurance Limited Unrated Unrated 1,157,378 4,141,360 27,546 106,640 TPL Trakker Limited Unrated A-/A2 9,298,597 15,444,597 138,828 123,866 Treet Corporation AA-/A-1 Unrated 1,703,660 3,312,678 107,262 437,009 TRG Pakistan Unrated Unrated - 788,000 - 11,473 Tri Star Modaraba (Ist) Unrated Unrated 151,492 151,492 833 757 Twakkal Garments Industries Limited Unrated Unrated 172,325 172,325 - - Unicap Modaraba. Unrated Unrated - - - - United Bank Limited AA+/A-1+ Unrated 6,657,940 5,230,940 1,031,648 924,360 United Brands Limited ( Udl Industries ) Unrated Unrated - 3,000 - 249 United Distributors Pak. Unrated Unrated - - - - Wah Noble Chemicals Limited Unrated Unrated 324,421 324,421 16,195 20,276 Worldcall Telecom Unrated D 47,435,914 47,435,914 72,103 80,641 Yousuf Weaving Mills Unrated Unrated 627,427 627,427 1,757 2,924 Zahur Cotton Mills Unrated Unrated 225 225 - - Zeal Pak Cement Limited Unrated Unrated 247,789 247,789 - -
780,726,158 878,081,162 44,400,593 48,914,494
--------Rupees in '000--------
No. of shares held Market Value
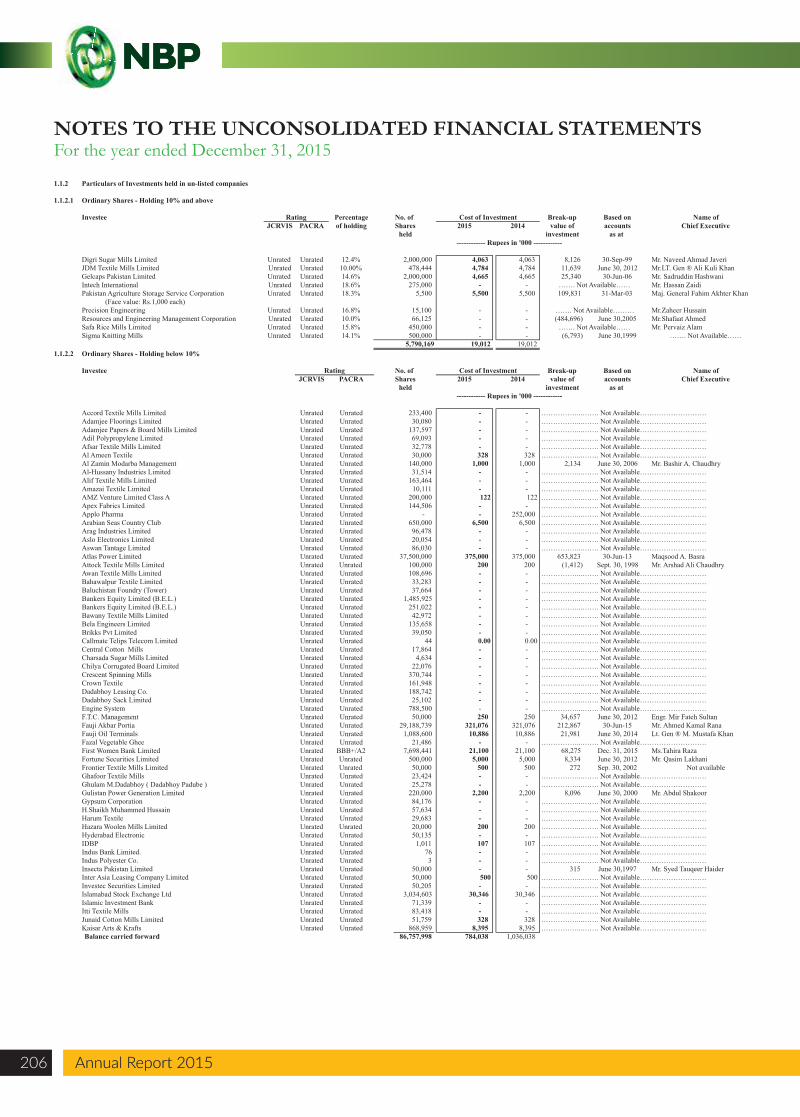
1.1.2 Particulars of Investments held in un-listed companies
1.1.2.1 Ordinary Shares - Holding 10% and above
Investee Percentage No. of Break-up Based on Name ofJCRVIS PACRA of holding Shares 2015 2014 value of accounts Chief Executive
held investment as at
Digri Sugar Mills Limited Unrated Unrated 12.4% 2,000,000 4,063 4,063 8,126 30-Sep-99 Mr. Naveed Ahmad JaveriJDM Textile Mills Limited Unrated Unrated 10.00% 478,444 4,784 4,784 11,639 June 30, 2012 Mr.LT. Gen ® Ali Kuli KhanGelcaps Pakistan Limited Unrated Unrated 14.6% 2,000,000 4,665 4,665 25,340 30-Jun-06 Mr. Sadruddin HashwaniIntech International Unrated Unrated 18.6% 275,000 - - Mr. Hassan ZaidiPakistan Agriculture Storage Service Corporation Unrated Unrated 18.3% 5,500 5,500 5,500 109,831 31-Mar-03 Maj. General Fahim Akhter Khan
(Face value: Rs.1,000 each)Precision Engineering Unrated Unrated 16.8% 15,100 - - Mr.Zaheer HussainResources and Engineering Management Corporation Unrated Unrated 10.0% 66,125 - - (484,696) June 30,2005 Mr.Shafaat AhmedSafa Rice Mills Limited Unrated Unrated 15.8% 450,000 - - Mr. Pervaiz AlamSigma Knitting Mills Unrated Unrated 14.1% 500,000 - - (6,793) June 30,1999 ……. Not Available……
5,790,169 19,012 19,012 1.1.2.2 Ordinary Shares - Holding below 10%
Investee No. of Break-up Based on Name ofJCRVIS PACRA Shares 2015 2014 value of accounts Chief Executive
held investment as at
Accord Textile Mills Limited Unrated Unrated 233,400 - - ……………...……. Not Available……………………….Adamjee Floorings Limited Unrated Unrated 30,080 - - ……………...……. Not Available……………………….Adamjee Papers & Board Mills Limited Unrated Unrated 137,597 - - ……………...……. Not Available……………………….Adil Polypropylene Limited Unrated Unrated 69,093 - - ……………...……. Not Available……………………….Afsar Textile Mills Limited Unrated Unrated 32,778 - - ……………...……. Not Available……………………….Al Ameen Textile Unrated Unrated 30,000 328 328 ……………...……. Not Available……………………….Al Zamin Modarba Management Unrated Unrated 140,000 1,000 1,000 2,134 June 30, 2006 Mr. Bashir A. ChaudhryAl-Hussany Industries Limited Unrated Unrated 31,514 - - ……………...……. Not Available……………………….Alif Textile Mills Limited Unrated Unrated 163,464 - - ……………...……. Not Available……………………….Amazai Textile Limited Unrated Unrated 10,111 - - ……………...……. Not Available……………………….AMZ Venture Limited Class A Unrated Unrated 200,000 122 122 ……………...……. Not Available……………………….Apex Fabrics Limited Unrated Unrated 144,506 - - ……………...……. Not Available……………………….Applo Pharma Unrated Unrated - - 252,000 ……………...……. Not Available……………………….Arabian Seas Country Club Unrated Unrated 650,000 6,500 6,500 ……………...……. Not Available……………………….Arag Industries Limited Unrated Unrated 96,478 - - ……………...……. Not Available……………………….Aslo Electronics Limited Unrated Unrated 20,054 - - ……………...……. Not Available……………………….Aswan Tantage Limited Unrated Unrated 86,030 - - ……………...……. Not Available……………………….Atlas Power Limited Unrated Unrated 37,500,000 375,000 375,000 653,823 30-Jun-13 Maqsood A. BasraAttock Textile Mills Limited Unrated Unrated 100,000 200 200 (1,412) Sept. 30, 1998 Mr. Arshad Ali ChaudhryAwan Textile Mills Limited Unrated Unrated 108,696 - - ……………...……. Not Available……………………….Bahawalpur Textile Limited Unrated Unrated 33,283 - - ……………...……. Not Available……………………….Baluchistan Foundry (Tower) Unrated Unrated 37,664 - - ……………...……. Not Available……………………….Bankers Equity Limited (B.E.L.) Unrated Unrated 1,485,925 - - ……………...……. Not Available……………………….Bankers Equity Limited (B.E.L.) Unrated Unrated 251,022 - - ……………...……. Not Available……………………….Bawany Textile Mills Limited Unrated Unrated 42,972 - - ……………...……. Not Available……………………….Bela Engineers Limited Unrated Unrated 135,658 - - ……………...……. Not Available……………………….Brikks Pvt Limited Unrated Unrated 39,050 - - ……………...……. Not Available……………………….Callmate Telips Telecom Limited Unrated Unrated 44 0.00 0.00 ……………...……. Not Available……………………….Central Cotton Mills Unrated Unrated 17,864 - - ……………...……. Not Available……………………….Charsada Sugar Mills Limited Unrated Unrated 4,634 - - ……………...……. Not Available……………………….Chilya Corrugated Board Limited Unrated Unrated 22,076 - - ……………...……. Not Available……………………….Crescent Spinning Mills Unrated Unrated 370,744 - - ……………...……. Not Available……………………….Crown Textile Unrated Unrated 161,948 - - ……………...……. Not Available……………………….Dadabhoy Leasing Co. Unrated Unrated 188,742 - - ……………...……. Not Available……………………….Dadabhoy Sack Limited Unrated Unrated 25,102 - - ……………...……. Not Available……………………….Engine System Unrated Unrated 788,500 - - ……………...……. Not Available……………………….F.T.C. Management Unrated Unrated 50,000 250 250 34,657 June 30, 2012 Engr. Mir Fateh SultanFauji Akbar Portia Unrated Unrated 29,188,739 321,076 321,076 212,867 30-Jun-15 Mr. Ahmed Kamal RanaFauji Oil Terminals Unrated Unrated 1,088,600 10,886 10,886 21,981 June 30, 2014 Lt. Gen ® M. Mustafa KhanFazal Vegetable Ghee Unrated Unrated 21,486 - - ……………...……. Not Available……………………….First Women Bank Limited Unrated BBB+/A2 7,698,441 21,100 21,100 68,275 Dec. 31, 2015 Ms.Tahira RazaFortune Securities Limited Unrated Unrated 500,000 5,000 5,000 8,334 June 30, 2012 Mr. Qasim LakhaniFrontier Textile Mills Limited Unrated Unrated 50,000 500 500 272 Sep. 30, 2002 Not availableGhafoor Textile Mills Unrated Unrated 23,424 - - ……………...……. Not Available……………………….Ghulam M.Dadabhoy ( Dadabhoy Padube ) Unrated Unrated 25,278 - - ……………...……. Not Available……………………….Gulistan Power Generation Limited Unrated Unrated 220,000 2,200 2,200 8,096 June 30, 2000 Mr. Abdul ShakoorGypsum Corporation Unrated Unrated 84,176 - - ……………...……. Not Available……………………….H.Shaikh Muhammed Hussain Unrated Unrated 57,634 - - ……………...……. Not Available……………………….Harum Textile Unrated Unrated 29,683 - - ……………...……. Not Available……………………….Hazara Woolen Mills Limited Unrated Unrated 20,000 200 200 ……………...……. Not Available……………………….Hyderabad Electronic Unrated Unrated 50,135 - - ……………...……. Not Available……………………….IDBP Unrated Unrated 1,011 107 107 ……………...……. Not Available……………………….Indus Bank Limited. Unrated Unrated 76 - - ……………...……. Not Available……………………….Indus Polyester Co. Unrated Unrated 3 - - ……………...……. Not Available……………………….Insecta Pakistan Limited Unrated Unrated 50,000 - - 315 June 30,1997 Mr. Syed Tauqeer HaiderInter Asia Leasing Company Limited Unrated Unrated 50,000 500 500 ……………...……. Not Available……………………….Investec Securities Limited Unrated Unrated 50,205 - - ……………...……. Not Available……………………….Islamabad Stock Exchange Ltd Unrated Unrated 3,034,603 30,346 30,346 ……………...……. Not Available……………………….Islamic Investment Bank Unrated Unrated 71,339 - - ……………...……. Not Available……………………….Itti Textile Mills Unrated Unrated 83,418 - - ……………...……. Not Available……………………….Junaid Cotton Mills Limited Unrated Unrated 51,759 328 328 ……………...……. Not Available……………………….Kaisar Arts & Krafts Unrated Unrated 868,959 8,395 8,395 ……………...……. Not Available……………………….Balance carried forward 86,757,998 784,038 1,036,038
Rating Cost of Investment
------------ Rupees in '000 ------------
Rating Cost of Investment
------------ Rupees in '000 ------------
……. Not Available……
……. Not Available………
……. Not Available……
NOTES TO THE UNCONSOLIDATED FINANCIAL STATEMENTSFor the year ended December 31, 2015
Annual Report 2015206 Annual Report 2015
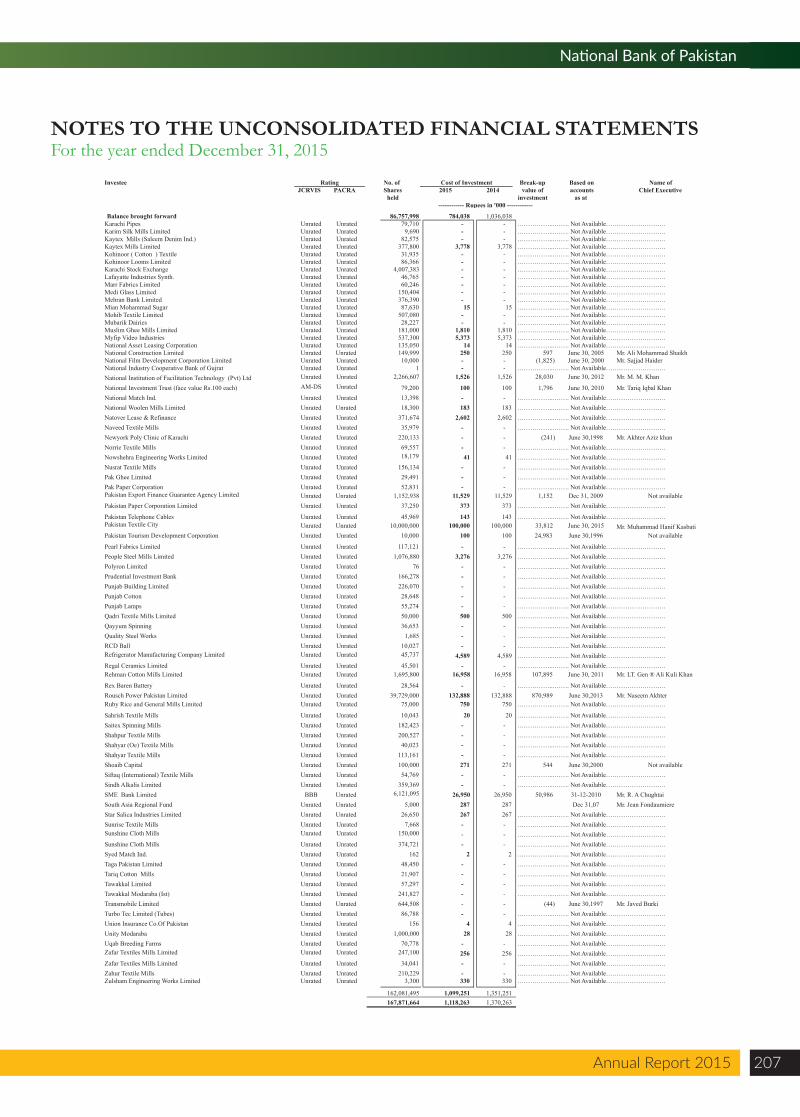
Annual Report 2015 207
National Bank of Pakistan
NOTES TO THE UNCONSOLIDATED FINANCIAL STATEMENTSFor the year ended December 31, 2015
Balance brought forward 86,757,998 784,038 1,036,038 Karachi Pipes Unrated Unrated 79,710 - - ……………...……. Not Available……………………….Karim Silk Mills Limited Unrated Unrated 9,690 - - ……………...……. Not Available……………………….Kaytex Mills (Saleem Denim Ind.) Unrated Unrated 82,575 - - ……………...……. Not Available……………………….Kaytex Mills Limited Unrated Unrated 377,800 3,778 3,778 ……………...……. Not Available……………………….Kohinoor ( Cotton ) Textile Unrated Unrated 31,935 - - ……………...……. Not Available……………………….Kohinoor Looms Limited Unrated Unrated 86,366 - - ……………...……. Not Available……………………….Karachi Stock Exchange Unrated Unrated 4,007,383 - - ……………...……. Not Available……………………….Lafayatte Industries Synth. Unrated Unrated 46,765 - - ……………...……. Not Available……………………….Marr Fabrics Limited Unrated Unrated 60,246 - - ……………...……. Not Available……………………….Medi Glass Limited Unrated Unrated 150,404 - - ……………...……. Not Available……………………….Mehran Bank Limited Unrated Unrated 376,390 - - ……………...……. Not Available……………………….Mian Mohammad Sugar Unrated Unrated 87,630 15 15 ……………...……. Not Available……………………….Mohib Textile Limited Unrated Unrated 507,080 - - ……………...……. Not Available……………………….Mubarik Dairies Unrated Unrated 28,227 - - ……………...……. Not Available……………………….Muslim Ghee Mills Limited Unrated Unrated 181,000 1,810 1,810 ……………...……. Not Available……………………….Myfip Video Industries Unrated Unrated 537,300 5,373 5,373 ……………...……. Not Available……………………….National Asset Leasing Corporation Unrated Unrated 135,050 14 14 ……………...……. Not Available……………………….National Construction Limited Unrated Unrated 149,999 250 250 597 June 30, 2005 Mr. Ali Mohammad ShaikhNational Film Development Corporation Limited Unrated Unrated 10,000 - - (1,825) June 30, 2000 Mr. Sajjad HaiderNational Industry Cooperative Bank of Gujrat Unrated Unrated 1 - - ……………...……. Not Available……………………….National Institution of Facilitation Technology (Pvt) Ltd Unrated Unrated 2,266,607 1,526 1,526 28,030 June 30, 2012 Mr. M. M. Khan
National Investment Trust (face value Rs.100 each) AM-DS Unrated 79,200 100 100 1,796 June 30, 2010 Mr. Tariq Iqbal KhanNational Match Ind. Unrated Unrated 13,398 - - ……………...……. Not Available……………………….National Woolen Mills Limited Unrated Unrated 18,300 183 183 ……………...……. Not Available……………………….Natover Lease & Refinance Unrated Unrated 371,674 2,602 2,602 ……………...……. Not Available……………………….Naveed Textile Mills Unrated Unrated 35,979 - - ……………...……. Not Available……………………….Newyork Poly Clinic of Karachi Unrated Unrated 220,133 - - (241) June 30,1998 Mr. Akhter Aziz khanNorrie Textile Mills Unrated Unrated 69,557 - - ……………...……. Not Available……………………….Nowshehra Engineering Works Limited Unrated Unrated 18,179 41 41 ……………...……. Not Available……………………….Nusrat Textile Mills Unrated Unrated 156,134 - - ……………...……. Not Available……………………….Pak Ghee Limited Unrated Unrated 29,491 - - ……………...……. Not Available……………………….Pak Paper Corporation Unrated Unrated 52,831 - - ……………...……. Not Available……………………….Pakistan Export Finance Guarantee Agency Limited Unrated Unrated 1,152,938 11,529 11,529 1,152 Dec 31, 2009 Not availablePakistan Paper Corporation Limited Unrated Unrated 37,250 373 373 ……………...……. Not Available……………………….
Pakistan Telephone Cables Unrated Unrated 45,969 143 143 ……………...……. Not Available……………………….Pakistan Textile City Unrated Unrated 10,000,000 100,000 100,000 33,812 June 30, 2015 Mr. Muhammad Hanif Kasbati Pakistan Tourism Development Corporation Unrated Unrated 10,000 100 100 24,983 June 30,1996 Not available
Pearl Fabrics Limited Unrated Unrated 117,121 - - ……………...……. Not Available……………………….People Steel Mills Limited Unrated Unrated 1,076,880 3,276 3,276 ……………...……. Not Available……………………….Polyron Limited Unrated Unrated 76 - - ……………...……. Not Available……………………….Prudential Investment Bank Unrated Unrated 166,278 - - ……………...……. Not Available……………………….Punjab Building Limited Unrated Unrated 226,070 - - ……………...……. Not Available……………………….Punjab Cotton Unrated Unrated 28,648 - - ……………...……. Not Available……………………….Punjab Lamps Unrated Unrated 55,274 - - ……………...……. Not Available……………………….Qadri Textile Mills Limited Unrated Unrated 50,000 500 500 ……………...……. Not Available……………………….Qayyum Spinning Unrated Unrated 36,653 - - ……………...……. Not Available……………………….Quality Steel Works Unrated Unrated 1,685 - - ……………...……. Not Available……………………….RCD Ball Unrated Unrated 10,027 - - ……………...……. Not Available……………………….Refrigerator Manufacturing Company Limited Unrated Unrated 45,737 4,589 4,589 ……………...……. Not Available……………………….Regal Ceramics Limited Unrated Unrated 45,501 - - ……………...……. Not Available……………………….Rehman Cotton Mills Limited Unrated Unrated 1,695,800 16,958 16,958 107,895 June 30, 2011 Mr. LT. Gen ® Ali Kuli Khan
Rex Baren Battery Unrated Unrated 28,564 - - ……………...……. Not Available……………………….Rousch Power Pakistan Limited Unrated Unrated 39,729,000 132,888 132,888 870,989 June 30,2013 Mr. Naseem AkhterRuby Rice and General Mills Limited Unrated Unrated 75,000 750 750 ……………...……. Not Available……………………….
Sahrish Textile Mills Unrated Unrated 10,043 20 20 ……………...……. Not Available……………………….Saitex Spinning Mills Unrated Unrated 182,423 - - ……………...……. Not Available……………………….Shahpur Textile Mills Unrated Unrated 200,527 - - ……………...……. Not Available……………………….Shahyar (Oe) Textile Mills Unrated Unrated 40,023 - - ……………...……. Not Available……………………….Shahyar Textile Mills Unrated Unrated 113,161 - - ……………...……. Not Available……………………….Shoaib Capital Unrated Unrated 100,000 271 271 544 June 30,2000 Not availableSiftaq (International) Textile Mills Unrated Unrated 54,769 - - ……………...……. Not Available……………………….Sindh Alkalis Limited Unrated Unrated 359,369 - - ……………...……. Not Available……………………….SME Bank Limited BBB Unrated 6,121,095 26,950 26,950 50,986 31-12-2010 Mr. R. A ChughtaiSouth Asia Regional Fund Unrated Unrated 5,000 287 287 Dec 31,07 Mr. Jean FondaumiereStar Salica Industries Limited Unrated Unrated 26,650 267 267 ……………...……. Not Available……………………….Sunrise Textile Mills Unrated Unrated 7,668 - - ……………...……. Not Available……………………….Sunshine Cloth Mills Unrated Unrated 150,000 - - ……………...……. Not Available……………………….Sunshine Cloth Mills Unrated Unrated 374,721 - - ……………...……. Not Available……………………….Syed Match Ind. Unrated Unrated 162 2 2 ……………...……. Not Available……………………….Taga Pakistan Limited Unrated Unrated 48,450 - - ……………...……. Not Available……………………….Tariq Cotton Mills Unrated Unrated 21,907 - - ……………...……. Not Available……………………….Tawakkal Limited Unrated Unrated 57,297 - - ……………...……. Not Available……………………….Tawakkal Modaraba (Ist) Unrated Unrated 241,827 - - ……………...……. Not Available……………………….Transmobile Limited Unrated Unrated 644,508 - - (44) June 30,1997 Mr. Javed BurkiTurbo Tec Limited (Tubes) Unrated Unrated 86,788 - - ……………...……. Not Available……………………….Union Insurance Co.Of Pakistan Unrated Unrated 156 4 4 ……………...……. Not Available……………………….Unity Modaraba Unrated Unrated 1,000,000 28 28 ……………...……. Not Available……………………….Uqab Breeding Farms Unrated Unrated 70,778 - - ……………...……. Not Available……………………….Zafar Textiles Mills Limited Unrated Unrated 247,100 256 256 ……………...……. Not Available……………………….Zafar Textiles Mills Limited Unrated Unrated 34,041 - - ……………...……. Not Available……………………….Zahur Textile Mills Unrated Unrated 210,229 - - ……………...……. Not Available……………………….Zulsham Engineering Works Limited Unrated Unrated 3,300 330 330 ……………...……. Not Available……………………….
162,081,495 1,099,251 1,351,251 167,871,664 1,118,263 1,370,263
Investee No. of Break-up Based on Name ofJCRVIS PACRA Shares 2015 2014 value of accounts Chief Executive
held investment as at
Rating Cost of Investment
------------ Rupees in '000 ------------
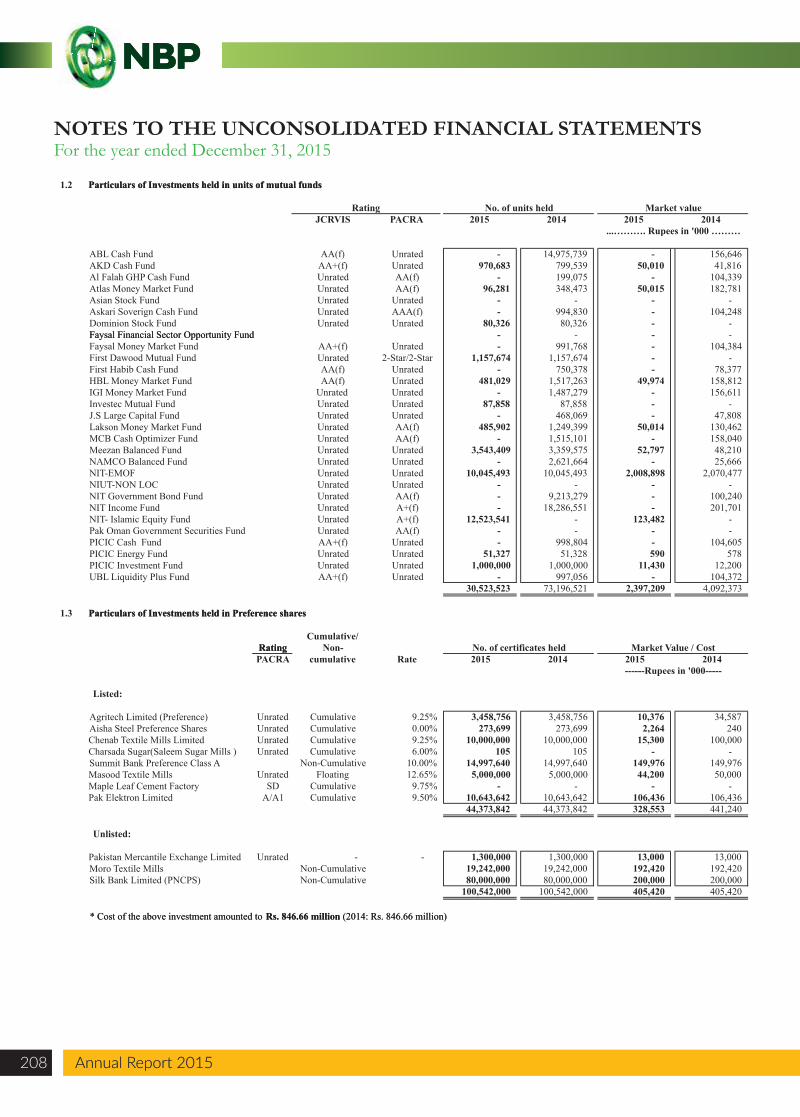
1.2 Particulars of Investments held in units of mutual funds
ABL Cash FundAKD Cash FundAl Falah GHP Cash FundAtlas Money Market FundAsian Stock FundAskari Soverign Cash FundDominion Stock FundFaysal Financial Sector Opportunity FundFaysal Money Market FundFirst Dawood Mutual FundFirst Habib Cash FundHBL Money Market FundIGI Money Market FundInvestec Mutual FundJ.S Large Capital FundLakson Money Market FundMCB Cash Optimizer FundMeezan Balanced FundNAMCO Balanced FundNIT-EMOFNIUT-NON LOCNIT Government Bond FundNIT Income FundNIT- Islamic Equity FundPak Oman Government Securities FundPICIC Cash FundPICIC Energy FundPICIC Investment FundUBL Liquidity Plus Fund
1.3 Particulars of Investments held in Preference shares
Listed:
Agritech Limited (Preference)Aisha Steel Preference SharesChenab Textile Mills Limited Charsada Sugar(Saleem Sugar Mills )Summit Bank Preference Class AMasood Textile Mills Maple Leaf Cement FactoryPak Elektron Limited
Unlisted:
Pakistan Mercantile Exchange LimitedMoro Textile MillsSilk Bank Limited (PNCPS)
* Cost of the above investment amounted to Rs. 846.66 million (2014: Rs. 846.66 million)
Rating
Particulars of Investments held in units of mutual funds
JCRVIS PACRA 2015 2014 2015 2014
AA(f) Unrated - 14,975,739 - 156,646 AA+(f) Unrated 970,683 799,539 50,010 41,816 Unrated AA(f) - 199,075 - 104,339 Unrated AA(f) 96,281 348,473 50,015 182,781 Unrated Unrated - - - - Unrated AAA(f) - 994,830 - 104,248 Unrated Unrated 80,326 80,326 - -
Faysal Financial Sector Opportunity Fund - - - - AA+(f) Unrated - 991,768 - 104,384 Unrated 2-Star/2-Star 1,157,674 1,157,674 - - AA(f) Unrated - 750,378 - 78,377 AA(f) Unrated 481,029 1,517,263 49,974 158,812
Unrated Unrated - 1,487,279 - 156,611 Unrated Unrated 87,858 87,858 - - Unrated Unrated - 468,069 - 47,808 Unrated AA(f) 485,902 1,249,399 50,014 130,462 Unrated AA(f) - 1,515,101 - 158,040 Unrated Unrated 3,543,409 3,359,575 52,797 48,210 Unrated Unrated - 2,621,664 - 25,666 Unrated Unrated 10,045,493 10,045,493 2,008,898 2,070,477 Unrated Unrated - - - - Unrated AA(f) - 9,213,279 - 100,240 Unrated A+(f) - 18,286,551 - 201,701 Unrated A+(f) 12,523,541 - 123,482 - Unrated AA(f) - - - - AA+(f) Unrated - 998,804 - 104,605 Unrated Unrated 51,327 51,328 590 578 Unrated Unrated 1,000,000 1,000,000 11,430 12,200 AA+(f) Unrated - 997,056 - 104,372
30,523,523 73,196,521 2,397,209 4,092,373
Particulars of Investments held in Preference shares
Cumulative/Non-
PACRA cumulative Rate 2015 2014 2015 2014
Unrated Cumulative 9.25% 3,458,756 3,458,756 10,376 34,587 Unrated Cumulative 0.00% 273,699 273,699 2,264 240 Unrated Cumulative 9.25% 10,000,000 10,000,000 15,300 100,000 Unrated Cumulative 6.00% 105 105 - -
Non-Cumulative 10.00% 14,997,640 14,997,640 149,976 149,976 Unrated Floating 12.65% 5,000,000 5,000,000 44,200 50,000
SD Cumulative 9.75% - - - - A/A1 Cumulative 9.50% 10,643,642 10,643,642 106,436 106,436
44,373,842 44,373,842 328,553 441,240
Unrated - - 1,300,000 1,300,000 13,000 13,000 Non-Cumulative 19,242,000 19,242,000 192,420 192,420 Non-Cumulative 80,000,000 80,000,000 200,000 200,000
100,542,000 100,542,000 405,420 405,420
* Cost of the above investment amounted to Rs. 846.66 million (2014: Rs. 846.66 million)
Rating No. of units held Market value
...………. Rupees in '000 ………
Rating No. of certificates held Market Value / Cost
------Rupees in '000-----
NOTES TO THE UNCONSOLIDATED FINANCIAL STATEMENTSFor the year ended December 31, 2015
Annual Report 2015208 Annual Report 2015
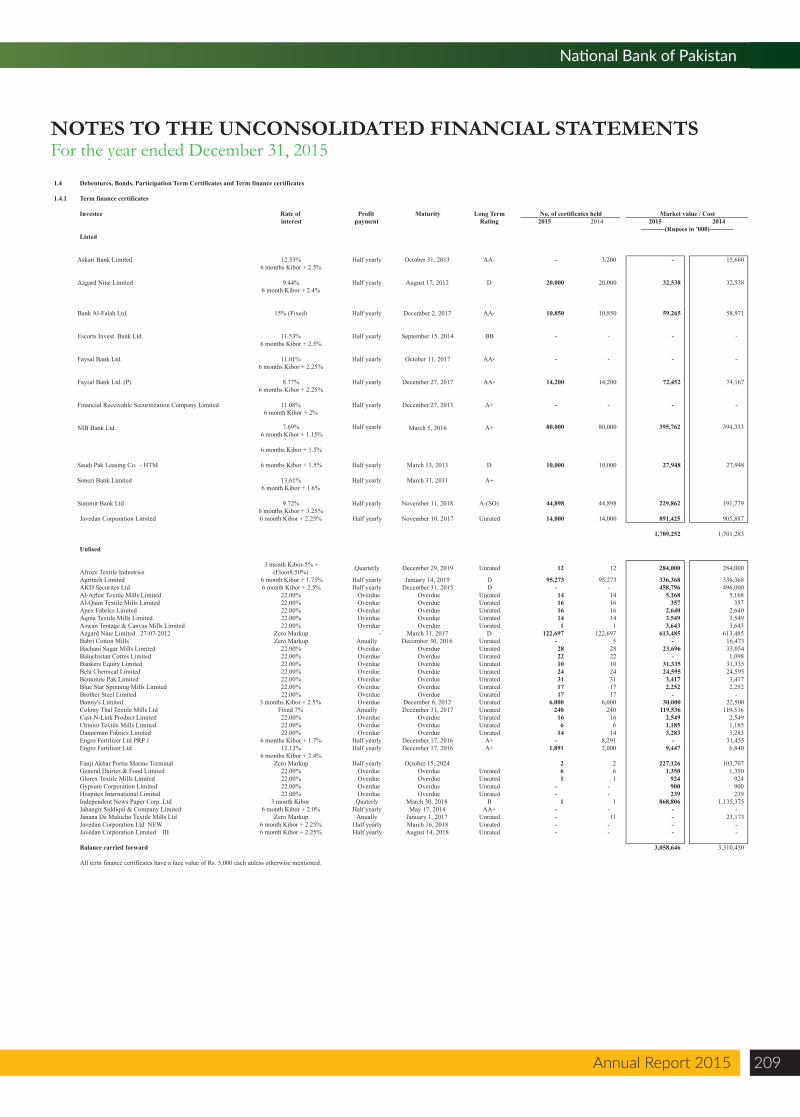
Annual Report 2015 209
National Bank of Pakistan
NOTES TO THE UNCONSOLIDATED FINANCIAL STATEMENTSFor the year ended December 31, 2015
1.4 Debentures, Bonds, Participation Term Certificates and Term finance certificates
1.4.1 Term finance certificates
Investee Rate of Profit interest payment
Listed
Askari Bank Limited 12.53% Half yearly6 months Kibor + 2.5%
Azgard Nine Limited 9.44% Half yearly6 month Kibor + 2.4%
Bank Al-Falah Ltd. 15% (Fixed) Half yearly
Escorts Invest. Bank Ltd. 11.53% Half yearly6 months Kibor + 2.5%
Faysal Bank Ltd. 11.01% Half yearly6 months Kibor + 2.25%
Faysal Bank Ltd. (P) 8.77% Half yearly6 months Kibor + 2.25%
Financial Receivable Securitization Company Limited 11.08% Half yearly6 month Kibor + 2%
NIB Bank Ltd. 7.69% Half yearly 6 month Kibor + 1.15%
6 months Kibor + 1.5%
Saudi Pak Leasing Co. - HTM 6 months Kibor + 1.5% Half yearly
Soneri Bank Limited 13.61% Half yearly6 month Kibor + 1.6%
Summit Bank Ltd 9.72% Half yearly6 months Kibor + 3.25%
Javedan Corporation Limited 6 month Kibor + 2.25% Half yearly
Unlised
Afroze Textile Industries 3 month Kibor-5% +
(Floor8.50%) Quarterly
Agritech Limited 6 month Kibor + 1.75% Half yearlyAKD Securites Ltd 6 month Kibor + 2.5% Half yearlyAl-Azhar Textile Mills Limited 22.00% Overdue Al-Qaim Textile Mills Limited 22.00% Overdue Apex Fabrics Limited 22.00% Overdue Aqma Textile Mills Limited 22.00% Overdue Aswan Tentage & Canvas Mills Limited 22.00% Overdue Azgard Nine Limited 27-07-2012 Zero Markup - Babri Cotton Mills Zero Markup Anually Bachani Sugar Mills Limited 22.00% Overdue Baluchistan Cotres Limited 22.00% Overdue Bankers Equity Limited 22.00% Overdue Bela Chemical Limited 22.00% Overdue Bentonite Pak Limited 22.00% Overdue Blue Star Spinning Mills Limited 22.00% Overdue Brother Steel Limited 22.00% Overdue Bunny's Limited 3 months Kibor + 2.5% Overdue Colony Thal Textile Mills Ltd Fixed 7% Anually Cast-N-Link Product Limited 22.00% Overdue Chiniot Textile Mills Limited 22.00% Overdue Danneman Fabrics Limited 22.00% Overdue Engro Fertilizer Ltd PRP 1 6 months Kibor + 1.7% Half yearlyEngro Fertilizer Ltd 12.12% Half yearly
6 months Kibor + 2.4%Fauji Akbar Portia Marine Terminal Zero Markup Half yearlyGeneral Dairies & Food Limited 22.00% Overdue Glorex Textile Mills Limited 22.00% Overdue Gypsum Corporation Limited 22.00% Overdue Hospitex International Limited 22.00% Overdue Independent News Paper Corp. Ltd 3 month Kibor Quaterly Jahangir Siddiqui & Company Limited 6 month Kibor + 2.0% Half yearlyJanana De Malucho Textile Mills Ltd Zero Markup Anually Javedan Corporation Ltd NEW 6 month Kibor + 2.25% Half yearly Javedan Corporation Limited III 6 month Kibor + 2.25% Half yearly
Balance carried forward
All term finance certificates have a face value of Rs. 5,000 each unless otherwise mentioned.
Maturity Long TermRating 2015 2014 2015 2014
October 31, 2013 AA- - 3,200 - 15,660
August 17, 2012 D 20,000 20,000 32,538 32,538
December 2, 2017 AA- 10,850 10,850 59,265 58,971
September 15, 2014 BB - - - -
October 11, 2017 AA- - - - -
December 27, 2017 AA- 14,200 14,200 72,452 74,167
December 27, 2013 A+ - - - -
March 5, 2016 A+ 80,000 80,000 395,762 394,333
March 13, 2013 D 10,000 10,000 27,948 27,948
March 31, 2011 A+
November 11, 2018 A-(SO) 44,898 44,898 229,862 191,779
November 10, 2017 Unrated 14,000 14,000 891,425 905,887
1,709,252 1,701,283
December 29, 2019 Unrated 12 12 284,000 284,000
January 14, 2019 D 95,273 95,273 336,368 336,368 December 31, 2015 D - - 458,796 496,000
Overdue Unrated 14 14 5,168 5,168 Overdue Unrated 16 16 357 357 Overdue Unrated 16 16 2,640 2,640 Overdue Unrated 14 14 3,549 3,549 Overdue Unrated 1 1 3,643 3,643
March 31, 2017 D 122,697 122,697 613,485 613,485 December 30, 2016 Unrated - 5 - 16,473
Overdue Unrated 28 28 23,696 33,054 Overdue Unrated 22 22 - 1,098 Overdue Unrated 10 10 31,335 31,335 Overdue Unrated 24 24 24,595 24,595 Overdue Unrated 31 31 3,417 3,417 Overdue Unrated 17 17 2,252 2,252 Overdue Unrated 17 17 - -
December 6, 2012 Unrated 6,000 6,000 30,000 22,500 December 31, 2017 Unrated 240 240 119,536 119,536
Overdue Unrated 16 16 2,549 2,549 Overdue Unrated 6 6 1,185 1,185 Overdue Unrated 14 14 3,283 3,283
December 17, 2016 A+ - 8,291 - 31,455 December 17, 2016 A+ 1,891 2,000 9,447 6,840
October 15, 2024 2 2 227,126 103,707 Overdue Unrated 6 6 1,350 1,350 Overdue Unrated 1 1 924 924 Overdue Unrated - - 900 900 Overdue Unrated - - 239 239
March 30, 2018 B 1 1 868,806 1,135,375 May 17, 2014 AA+ - - - -
January 1, 2017 Unrated - 11 - 23,173 March 16, 2018 Unrated - - - - August 14, 2018 Unrated - - - -
3,058,646 3,310,450
No. of certificates held Market value / Cost
-----------(Rupees in '000)-----------
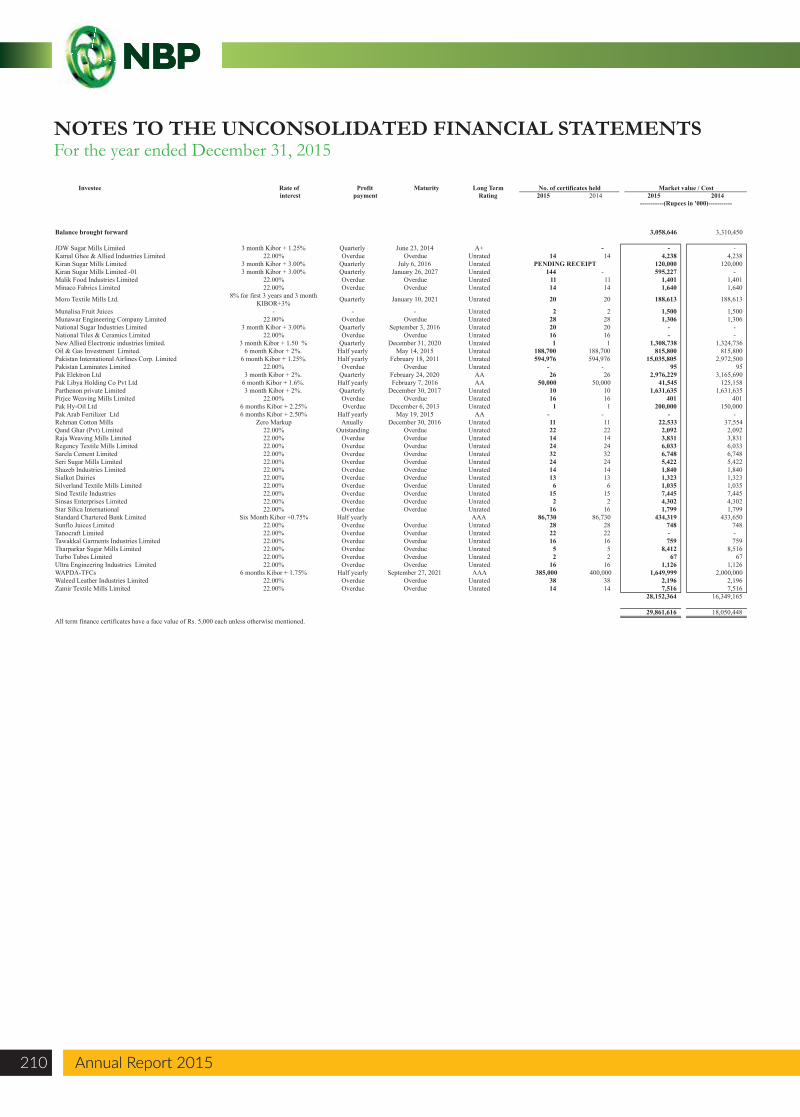
NOTES TO THE UNCONSOLIDATED FINANCIAL STATEMENTSFor the year ended December 31, 2015
Annual Report 2015210 Annual Report 2015
Balance brought forward
JDW Sugar Mills Limited 3 month Kibor + 1.25% QuarterlyKamal Ghee & Allied Industries Limited 22.00% Overdue Kiran Sugar Mills Limited 3 month Kibor + 3.00% Quarterly Kiran Sugar Mills Limited -01 3 month Kibor + 3.00% Quarterly Malik Food Industries Limited 22.00% Overdue Minaco Fabrics Limited 22.00% Overdue
Moro Textile Mills Ltd. 8% for first 3 years and 3 month KIBOR+3% Quarterly
Munalisa Fruit Juices - - Munawar Engineering Company Limited 22.00% Overdue National Sugar Industries Limited 3 month Kibor + 3.00% Quarterly National Tiles & Ceramics Limited 22.00% Overdue New Allied Electronic industries limited. 3 month Kibor + 1.50 % Quarterly Oil & Gas Investment Limited. 6 month Kibor + 2%. Half yearly Pakistan International Airlines Corp. Limited 6 month Kibor + 1.25%. Half yearly Pakistan Laminates Limited 22.00% Overdue Pak Elektron Ltd 3 month Kibor + 2%. Quarterly Pak Libya Holding Co Pvt Ltd 6 month Kibor + 1.6%. Half yearly Parthenon private Limited 3 month Kibor + 2%. Quarterly Pirjee Weaving Mills Limited 22.00% Overdue Pak Hy-Oil Ltd 6 months Kibor + 2.25% Overdue Pak Arab Fertilizer Ltd 6 months Kibor + 2.50% Half yearly Rehman Cotton Mills Zero Markup Anually Qand Ghar (Pvt) Limited 22.00% Outstanding Raja Weaving Mills Limited 22.00% Overdue Regency Textile Mills Limited 22.00% Overdue Sarela Cement Limited 22.00% Overdue Seri Sugar Mills Limited 22.00% Overdue Shazeb Industries Limited 22.00% Overdue Sialkot Dairies 22.00% Overdue Silverland Textile Mills Limited 22.00% Overdue Sind Textile Industries 22.00% Overdue Sinsas Enterprises Limited 22.00% Overdue Star Silica International 22.00% Overdue Standard Chartered Bank Limited Six Month Kibor +0.75% Half yearlySunflo Juices Limited 22.00% Overdue Tanocraft Limited 22.00% Overdue Tawakkal Garments Industries Limited 22.00% Overdue Tharparkar Sugar Mills Limited 22.00% Overdue Turbo Tubes Limited 22.00% Overdue Ultra Engineering Industries Limited 22.00% Overdue WAPDA-TFCs 6 months Kibor + 1.75% Half yearly Waleed Leather Industries Limited 22.00% Overdue Zamir Textile Mills Limited 22.00% Overdue
All term finance certificates have a face value of Rs. 5,000 each unless otherwise mentioned.
3,058,646 3,310,450
June 23, 2014 A+ - - - Overdue Unrated 14 14 4,238 4,238
July 6, 2016 Unrated 120,000 120,000 January 26, 2027 Unrated 144 - 595,227 -
Overdue Unrated 11 11 1,401 1,401 Overdue Unrated 14 14 1,640 1,640
January 10, 2021 Unrated 20 20 188,613 188,613
- Unrated 2 2 1,500 1,500 Overdue Unrated 28 28 1,306 1,306
September 3, 2016 Unrated 20 20 - - Overdue Unrated 16 16 - -
December 31, 2020 Unrated 1 1 1,308,738 1,324,736 May 14, 2015 Unrated 188,700 188,700 815,800 815,800
February 18, 2011 Unrated 594,976 594,976 15,035,805 2,972,500 Overdue Unrated - - 95 95
February 24, 2020 AA 26 26 2,976,229 3,165,690 February 7, 2016 AA 50,000 50,000 41,545 125,158
December 30, 2017 Unrated 10 10 1,631,635 1,631,635 Overdue Unrated 16 16 401 401
December 6, 2013 Unrated 1 1 200,000 150,000 May 19, 2015 AA - - - -
December 30, 2016 Unrated 11 11 22,533 37,554 Overdue Unrated 22 22 2,092 2,092 Overdue Unrated 14 14 3,831 3,831 Overdue Unrated 24 24 6,033 6,033 Overdue Unrated 32 32 6,748 6,748 Overdue Unrated 24 24 5,422 5,422 Overdue Unrated 14 14 1,840 1,840 Overdue Unrated 13 13 1,323 1,323 Overdue Unrated 6 6 1,035 1,035 Overdue Unrated 15 15 7,445 7,445 Overdue Unrated 2 2 4,302 4,302 Overdue Unrated 16 16 1,799 1,799
AAA 86,730 86,730 434,319 433,650 Overdue Unrated 28 28 748 748 Overdue Unrated 22 22 - - Overdue Unrated 16 16 759 759 Overdue Unrated 5 5 8,412 8,516 Overdue Unrated 2 2 67 67 Overdue Unrated 16 16 1,126 1,126
September 27, 2021 AAA 385,000 400,000 1,649,999 2,000,000 Overdue Unrated 38 38 2,196 2,196 Overdue Unrated 14 14 7,516 7,516
28,152,364 16,349,165
29,861,616 18,050,448
PENDING RECEIPT
Investee Rate of Profit interest payment
Maturity Long TermRating 2015 2014 2015 2014
No. of certificates held Market value / Cost
-----------(Rupees in '000)-----------
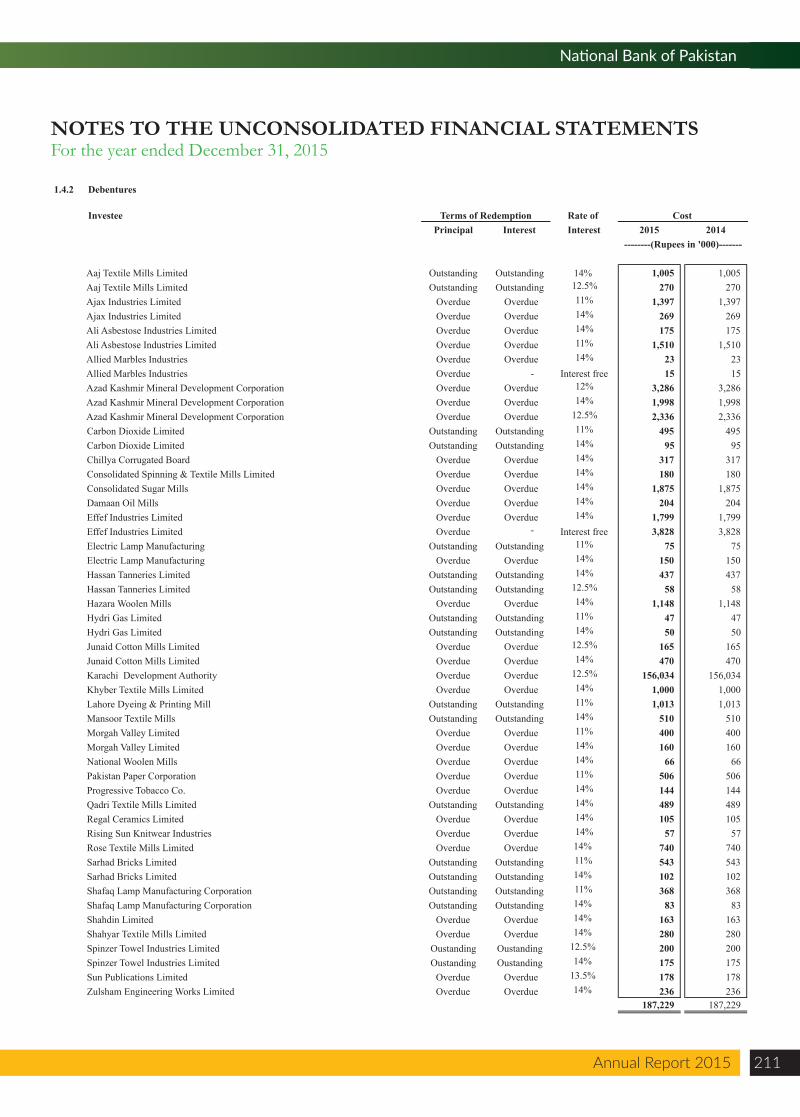
Annual Report 2015 211
National Bank of Pakistan
NOTES TO THE UNCONSOLIDATED FINANCIAL STATEMENTSFor the year ended December 31, 2015
1.4.2 Debentures
Investee Rate of Principal Interest Interest
Outstanding Outstanding 14% Outstanding Outstanding 12.5%
Overdue Overdue 11% Overdue Overdue 14% Overdue Overdue 14% Overdue Overdue 11% Overdue Overdue 14% Overdue - Interest free Overdue Overdue 12% Overdue Overdue 14% Overdue Overdue 12.5%
Outstanding Outstanding 11% Outstanding Outstanding 14%
Overdue Overdue 14% Overdue Overdue 14% Overdue Overdue 14% Overdue Overdue 14% Overdue Overdue 14% Overdue - Interest free
Outstanding Outstanding 11% Overdue Overdue 14%
Outstanding Outstanding 14% Outstanding Outstanding 12.5%
Overdue Overdue 14% Outstanding Outstanding 11% Outstanding Outstanding 14%
Overdue Overdue 12.5% Overdue Overdue 14% Overdue Overdue 12.5% Overdue Overdue 14%
Outstanding Outstanding 11% Outstanding Outstanding 14%
Overdue Overdue 11% Overdue Overdue 14% Overdue Overdue 14% Overdue Overdue 11% Overdue Overdue 14%
Outstanding Outstanding 14% Overdue Overdue 14% Overdue Overdue 14% Overdue Overdue 14%
Outstanding Outstanding 11% Outstanding Outstanding 14% Outstanding Outstanding 11% Outstanding Outstanding 14%
Overdue Overdue 14% Overdue Overdue 14%
Oustanding Oustanding 12.5% Oustanding Oustanding 14%
Overdue Overdue 13.5% Overdue Overdue 14%
Ali Asbestose Industries Limited
Terms of Redemption
Aaj Textile Mills Limited Aaj Textile Mills Limited Ajax Industries Limited Ajax Industries Limited Ali Asbestose Industries Limited
Effef Industries Limited
Allied Marbles Industries Allied Marbles Industries Azad Kashmir Mineral Development Corporation Azad Kashmir Mineral Development Corporation Azad Kashmir Mineral Development Corporation Carbon Dioxide Limited Carbon Dioxide Limited Chillya Corrugated Board Consolidated Spinning & Textile Mills Limited Consolidated Sugar Mills Damaan Oil Mills
Khyber Textile Mills Limited
Effef Industries Limited Electric Lamp Manufacturing Electric Lamp Manufacturing Hassan Tanneries Limited Hassan Tanneries Limited Hazara Woolen Mills Hydri Gas Limited Hydri Gas Limited Junaid Cotton Mills Limited Junaid Cotton Mills Limited Karachi Development Authority
Sarhad Bricks Limited
Lahore Dyeing & Printing Mill Mansoor Textile Mills Morgah Valley Limited Morgah Valley Limited National Woolen Mills Pakistan Paper Corporation Progressive Tobacco Co. Qadri Textile Mills Limited Regal Ceramics Limited Rising Sun Knitwear Industries Rose Textile Mills Limited
Spinzer Towel Industries Limited Sun Publications Limited Zulsham Engineering Works Limited
Sarhad Bricks Limited Shafaq Lamp Manufacturing Corporation Shafaq Lamp Manufacturing Corporation Shahdin Limited Shahyar Textile Mills Limited Spinzer Towel Industries Limited
2015 2014
1,005 1,005 270 270
1,397 1,397 269 269 175 175
1,510 1,510 23 23 15 15
3,286 3,286 1,998 1,998 2,336 2,336
495 495 95 95
317 317 180 180
1,875 1,875 204 204
1,799 1,799 3,828 3,828
75 75 150 150 437 437
58 58 1,148 1,148
47 47 50 50
165 165 470 470
156,034 156,034 1,000 1,000 1,013 1,013
510 510 400 400 160 160
66 66 506 506 144 144 489 489 105 105
57 57 740 740 543 543 102 102 368 368
83 83 163 163 280 280 200 200 175 175 178 178 236 236
187,229 187,229
Cost
--------(Rupees in '000)-------
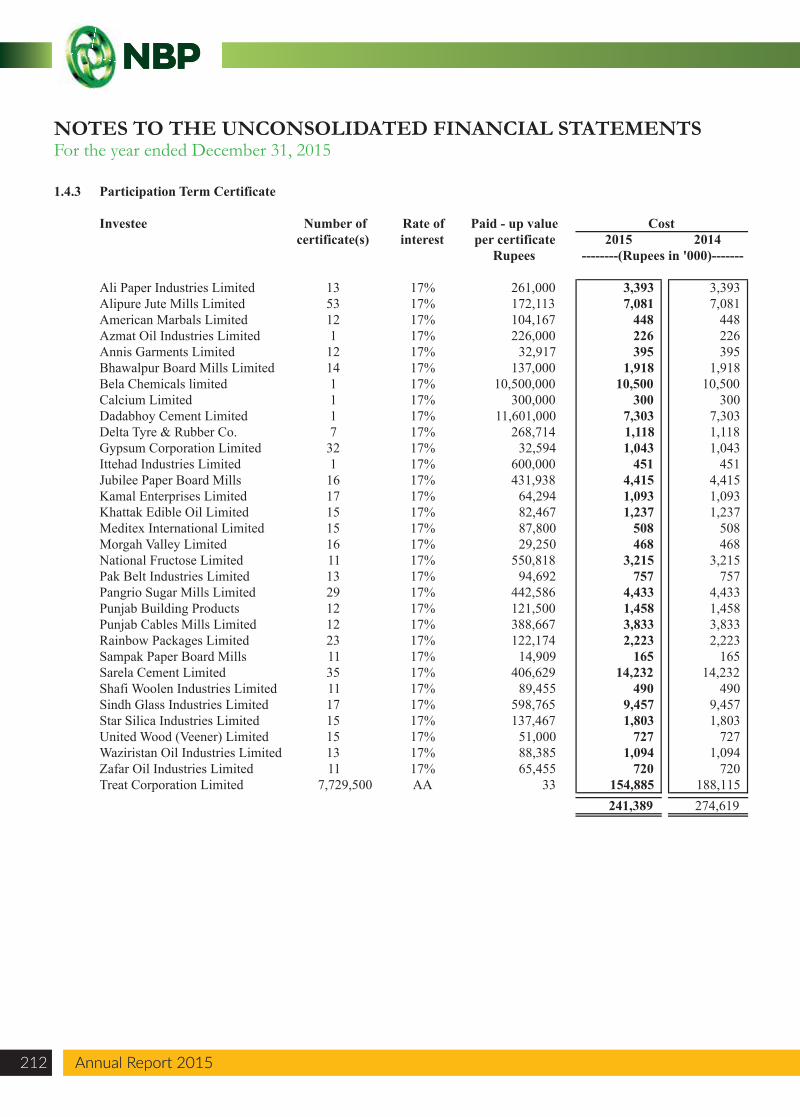
1.4.3 Participation Term Certificate
Investee
Ali Paper Industries LimitedAlipure Jute Mills LimitedAmerican Marbals LimitedAzmat Oil Industries LimitedAnnis Garments LimitedBhawalpur Board Mills LimitedBela Chemicals limitedCalcium LimitedDadabhoy Cement LimitedDelta Tyre & Rubber Co.Gypsum Corporation LimitedIttehad Industries LimitedJubilee Paper Board MillsKamal Enterprises LimitedKhattak Edible Oil LimitedMeditex International LimitedMorgah Valley LimitedNational Fructose LimitedPak Belt Industries LimitedPangrio Sugar Mills LimitedPunjab Building Products Punjab Cables Mills LimitedRainbow Packages LimitedSampak Paper Board MillsSarela Cement LimitedShafi Woolen Industries LimitedSindh Glass Industries LimitedStar Silica Industries LimitedUnited Wood (Veener) LimitedWaziristan Oil Industries LimitedZafar Oil Industries LimitedTreat Corporation Limited
Paid - up valueper certificate 2015 2014
Rupees
13 17% 261,000 3,393 3,393 53 17% 172,113 7,081 7,081 12 17% 104,167 448 448 1 17% 226,000 226 226
12 17% 32,917 395 395 14 17% 137,000 1,918 1,918 1 17% 10,500,000 10,500 10,500 1 17% 300,000 300 300 1 17% 11,601,000 7,303 7,303 7 17% 268,714 1,118 1,118
32 17% 32,594 1,043 1,043 1 17% 600,000 451 451
16 17% 431,938 4,415 4,415 17 17% 64,294 1,093 1,093 15 17% 82,467 1,237 1,237 15 17% 87,800 508 508 16 17% 29,250 468 468 11 17% 550,818 3,215 3,215 13 17% 94,692 757 757 29 17% 442,586 4,433 4,433 12 17% 121,500 1,458 1,458 12 17% 388,667 3,833 3,833 23 17% 122,174 2,223 2,223 11 17% 14,909 165 165 35 17% 406,629 14,232 14,232 11 17% 89,455 490 490 17 17% 598,765 9,457 9,457 15 17% 137,467 1,803 1,803 15 17% 51,000 727 727 13 17% 88,385 1,094 1,094 11 17% 65,455 720 720
7,729,500 AA 33 154,885 188,115 241,389 274,619
Number of certificate(s)
Rate of interest
Cost
--------(Rupees in '000)-------
NOTES TO THE UNCONSOLIDATED FINANCIAL STATEMENTSFor the year ended December 31, 2015
Annual Report 2015212 Annual Report 2015
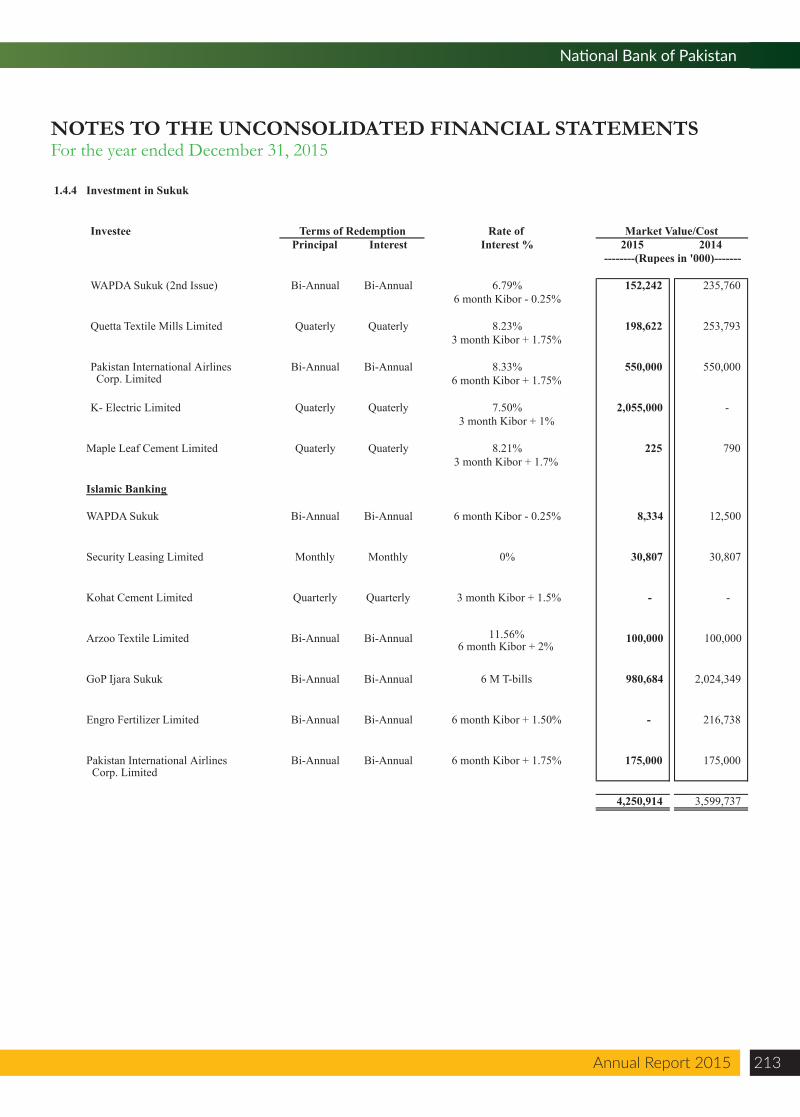
Annual Report 2015 213
National Bank of Pakistan
NOTES TO THE UNCONSOLIDATED FINANCIAL STATEMENTSFor the year ended December 31, 2015
1.4.4 Investment in Sukuk
InvesteePrincipal Interest 2015 2014
WAPDA Sukuk (2nd Issue) Bi-Annual Bi-Annual 152,242 235,760
Quetta Textile Mills Limited Quaterly Quaterly 198,622 253,793
Pakistan International Airlines Corp. Limited
Bi-Annual Bi-Annual 550,000 550,000
K- Electric Limited Quaterly Quaterly 2,055,000 -
Maple Leaf Cement Limited Quaterly Quaterly 225 790
Islamic Banking
WAPDA Sukuk Bi-Annual Bi-Annual 8,334 12,500
Security Leasing Limited Monthly Monthly 30,807 30,807
Kohat Cement Limited Quarterly Quarterly - -
Arzoo Textile Limited Bi-Annual Bi-Annual 100,000 100,000
GoP Ijara Sukuk Bi-Annual Bi-Annual 980,684 2,024,349
Engro Fertilizer Limited Bi-Annual Bi-Annual - 216,738
Pakistan International Airlines Corp. Limited
Bi-Annual Bi-Annual 175,000 175,000
4,250,914 3,599,737
Terms of Redemption Rate of Market Value/CostInterest %
--------(Rupees in '000)-------
6.79%6 month Kibor - 0.25%
8.23%3 month Kibor + 1.75%
8.33%6 month Kibor + 1.75%
7.50%3 month Kibor + 1%
8.21%3 month Kibor + 1.7%
6 month Kibor + 2%
6 month Kibor - 0.25%
0%
3 month Kibor + 1.5%
6 month Kibor + 1.75%
11.56%
6 M T-bills
6 month Kibor + 1.50%
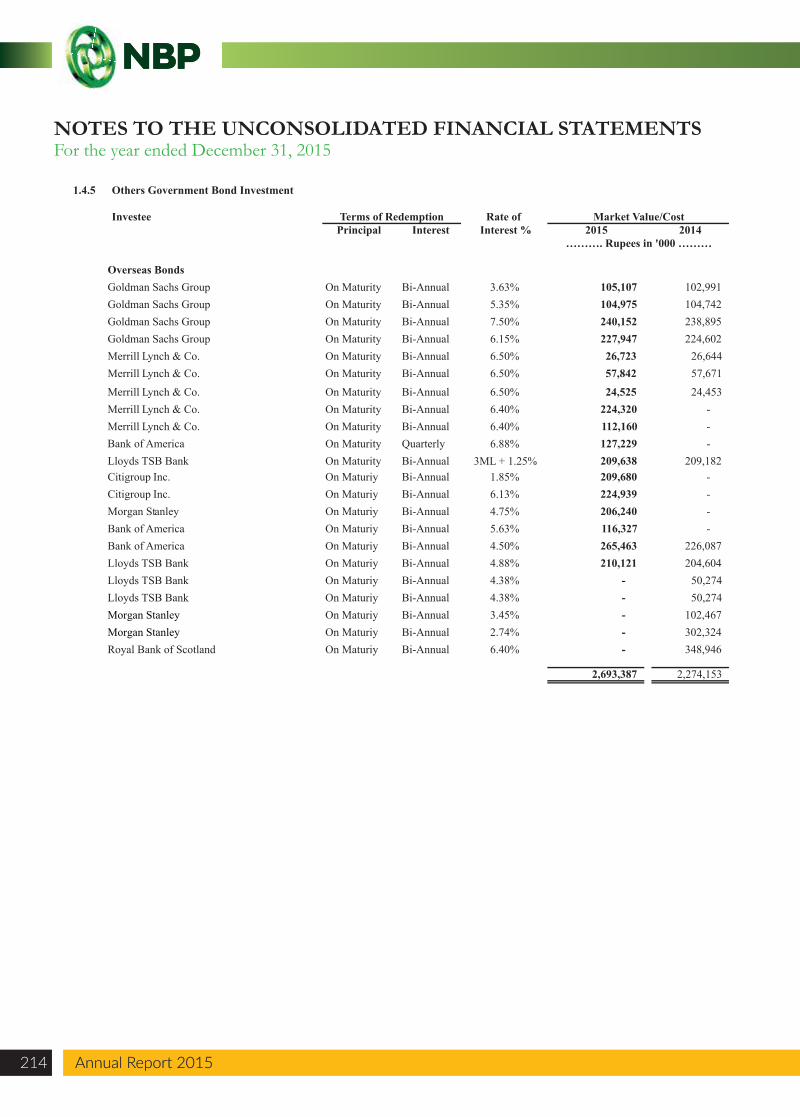
NOTES TO THE UNCONSOLIDATED FINANCIAL STATEMENTSFor the year ended December 31, 2015
Annual Report 2015214 Annual Report 2015
1.4.5 Others Government Bond Investment
InvesteePrincipal Interest 2015 2014
Overseas BondsGoldman Sachs Group On Maturity Bi-Annual 105,107 102,991 Goldman Sachs Group On Maturity Bi-Annual 104,975 104,742 Goldman Sachs Group On Maturity Bi-Annual 240,152 238,895 Goldman Sachs Group On Maturity Bi-Annual 227,947 224,602 Merrill Lynch & Co. On Maturity Bi-Annual 26,723 26,644 Merrill Lynch & Co. On Maturity Bi-Annual 57,842 57,671
Merrill Lynch & Co. On Maturity Bi-Annual 24,525 24,453 Merrill Lynch & Co. On Maturity Bi-Annual 224,320 - Merrill Lynch & Co. On Maturity Bi-Annual 112,160 - Bank of America On Maturity Quarterly 127,229 - Lloyds TSB Bank On Maturity Bi-Annual 209,638 209,182 Citigroup Inc. On Maturiy Bi-Annual 209,680 - Citigroup Inc. On Maturiy Bi-Annual 224,939 - Morgan Stanley On Maturiy Bi-Annual 206,240 - Bank of America On Maturiy Bi-Annual 116,327 - Bank of America On Maturiy Bi-Annual 265,463 226,087 Lloyds TSB Bank On Maturiy Bi-Annual 210,121 204,604 Lloyds TSB Bank On Maturiy Bi-Annual - 50,274 Lloyds TSB Bank On Maturiy Bi-Annual - 50,274 Morgan Stanley On Maturiy Bi-Annual - 102,467 Morgan Stanley On Maturiy Bi-Annual - 302,324 Royal Bank of Scotland On Maturiy Bi-Annual - 348,946
2,693,387 2,274,153
6.40%
4.50%4.88%4.38%4.38%3.45%2.74%
5.35%7.50%6.15%6.50%6.50%
6.50%
1.85%6.13%4.75%5.63%
3.63%
6.40%6.40%6.88%
3ML + 1.25%
Terms of Redemption Rate of Market Value/CostInterest %
………. Rupees in '000 ………
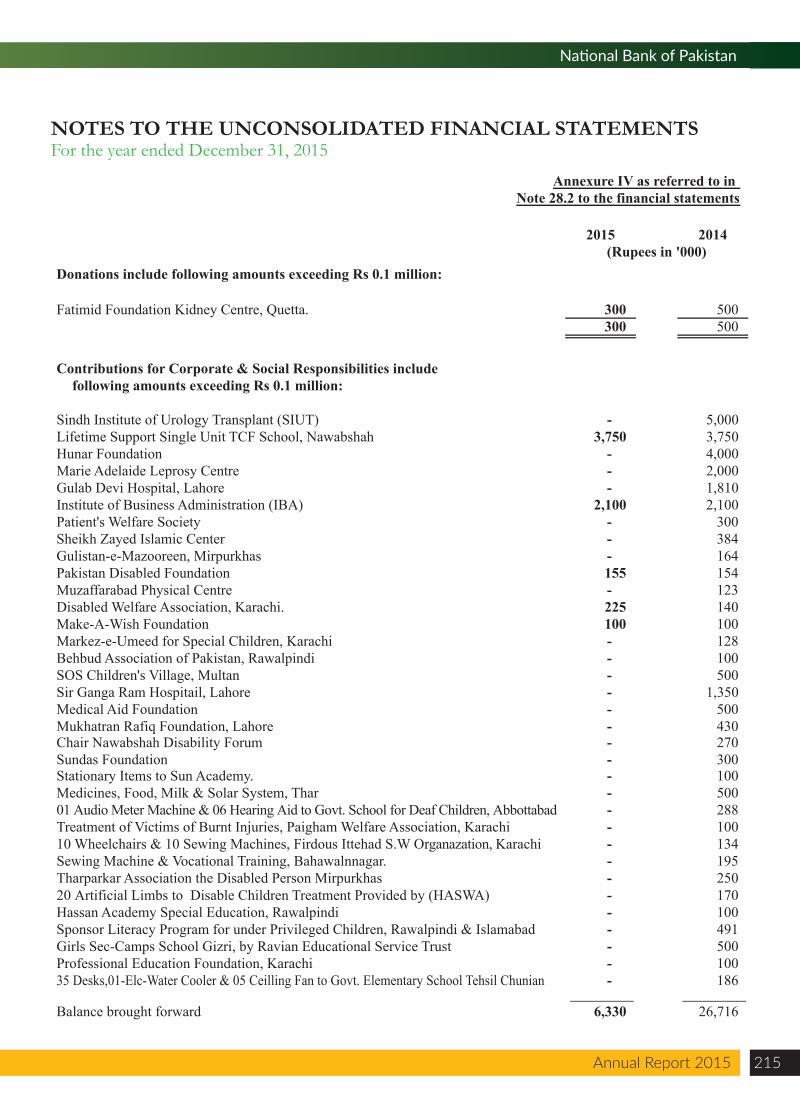
Annual Report 2015 215
National Bank of Pakistan
NOTES TO THE UNCONSOLIDATED FINANCIAL STATEMENTSFor the year ended December 31, 2015
Annexure IV as referred to in Note 28.2 to the financial statements
2015 2014(Rupees in '000)
Donations include following amounts exceeding Rs 0.1 million:
Fatimid Foundation Kidney Centre, Quetta. 300 500 300 500
Contributions for Corporate & Social Responsibilities include following amounts exceeding Rs 0.1 million:
Sindh Institute of Urology Transplant (SIUT) - 5,000 Lifetime Support Single Unit TCF School, Nawabshah 3,750 3,750 Hunar Foundation - 4,000 Marie Adelaide Leprosy Centre - 2,000 Gulab Devi Hospital, Lahore - 1,810 Institute of Business Administration (IBA) 2,100 2,100 Patient's Welfare Society - 300 Sheikh Zayed Islamic Center - 384 Gulistan-e-Mazooreen, Mirpurkhas - 164 Pakistan Disabled Foundation 155 154 Muzaffarabad Physical Centre - 123 Disabled Welfare Association, Karachi. 225 140 Make-A-Wish Foundation 100 100 Markez-e-Umeed for Special Children, Karachi - 128 Behbud Association of Pakistan, Rawalpindi - 100 SOS Children's Village, Multan - 500 Sir Ganga Ram Hospitail, Lahore - 1,350 Medical Aid Foundation - 500 Mukhatran Rafiq Foundation, Lahore - 430 Chair Nawabshah Disability Forum - 270 Sundas Foundation - 300 Stationary Items to Sun Academy. - 100 Medicines, Food, Milk & Solar System, Thar - 500 01 Audio Meter Machine & 06 Hearing Aid to Govt. School for Deaf Children, Abbottabad - 288 Treatment of Victims of Burnt Injuries, Paigham Welfare Association, Karachi - 100 10 Wheelchairs & 10 Sewing Machines, Firdous Ittehad S.W Organazation, Karachi - 134 Sewing Machine & Vocational Training, Bahawalnnagar. - 195 Tharparkar Association the Disabled Person Mirpurkhas - 250 20 Artificial Limbs to Disable Children Treatment Provided by (HASWA) - 170 Hassan Academy Special Education, Rawalpindi - 100 Sponsor Literacy Program for under Privileged Children, Rawalpindi & Islamabad - 491 Girls Sec-Camps School Gizri, by Ravian Educational Service Trust - 500 Professional Education Foundation, Karachi - 100 35 Desks,01-Elc-Water Cooler & 05 Ceilling Fan to Govt. Elementary School Tehsil Chunian - 186
Balance brought forward 6,330 26,716
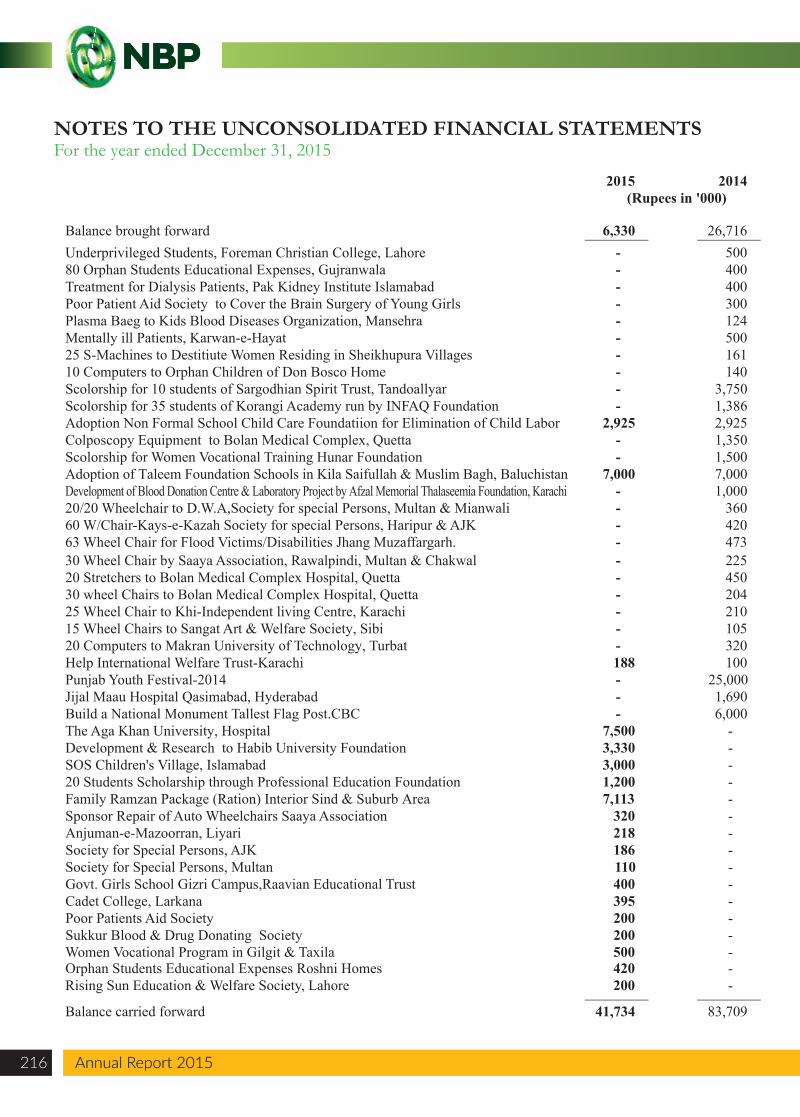
Underprivileged Students, Foreman Christian College, Lahore - 500 80 Orphan Students Educational Expenses, Gujranwala - 400 Treatment for Dialysis Patients, Pak Kidney Institute Islamabad - 400 Poor Patient Aid Society to Cover the Brain Surgery of Young Girls - 300 Plasma Baeg to Kids Blood Diseases Organization, Mansehra - 124 Mentally ill Patients, Karwan-e-Hayat - 500 25 S-Machines to Destitiute Women Residing in Sheikhupura Villages - 161 10 Computers to Orphan Children of Don Bosco Home - 140 Scolorship for 10 students of Sargodhian Spirit Trust, Tandoallyar - 3,750 Scolorship for 35 students of Korangi Academy run by INFAQ Foundation - 1,386 Adoption Non Formal School Child Care Foundatiion for Elimination of Child Labor 2,925 2,925 Colposcopy Equipment to Bolan Medical Complex, Quetta - 1,350 Scolorship for Women Vocational Training Hunar Foundation - 1,500 Adoption of Taleem Foundation Schools in Kila Saifullah & Muslim Bagh, Baluchistan 7,000 7,000 Development of Blood Donation Centre & Laboratory Project by Afzal Memorial Thalaseemia Foundation, Karachi - 1,000 20/20 Wheelchair to D.W.A,Society for special Persons, Multan & Mianwali - 360 60 W/Chair-Kays-e-Kazah Society for special Persons, Haripur & AJK - 420 63 Wheel Chair for Flood Victims/Disabilities Jhang Muzaffargarh. - 473 30 Wheel Chair by Saaya Association, Rawalpindi, Multan & Chakwal - 225 20 Stretchers to Bolan Medical Complex Hospital, Quetta - 450 30 wheel Chairs to Bolan Medical Complex Hospital, Quetta - 204 25 Wheel Chair to Khi-Independent living Centre, Karachi - 210 15 Wheel Chairs to Sangat Art & Welfare Society, Sibi - 105 20 Computers to Makran University of Technology, Turbat - 320 Help International Welfare Trust-Karachi 188 100 Punjab Youth Festival-2014 - 25,000 Jijal Maau Hospital Qasimabad, Hyderabad - 1,690 Build a National Monument Tallest Flag Post.CBC - 6,000 The Aga Khan University, Hospital 7,500 - Development & Research to Habib University Foundation 3,330 - SOS Children's Village, Islamabad 3,000 - 20 Students Scholarship through Professional Education Foundation 1,200 - Family Ramzan Package (Ration) Interior Sind & Suburb Area 7,113 - Sponsor Repair of Auto Wheelchairs Saaya Association 320 - Anjuman-e-Mazoorran, Liyari 218 - Society for Special Persons, AJK 186 - Society for Special Persons, Multan 110 - Govt. Girls School Gizri Campus,Raavian Educational Trust 400 - Cadet College, Larkana 395 - Poor Patients Aid Society 200 - Sukkur Blood & Drug Donating Society 200 - Women Vocational Program in Gilgit & Taxila 500 -
Balance brought forward 6,330 26,716
2015 2014(Rupees in '000)
Balance carried forward 41,734 83,709
Orphan Students Educational Expenses Roshni Homes 420 - Rising Sun Education & Welfare Society, Lahore 200 -
NOTES TO THE UNCONSOLIDATED FINANCIAL STATEMENTSFor the year ended December 31, 2015
Annual Report 2015216 Annual Report 2015
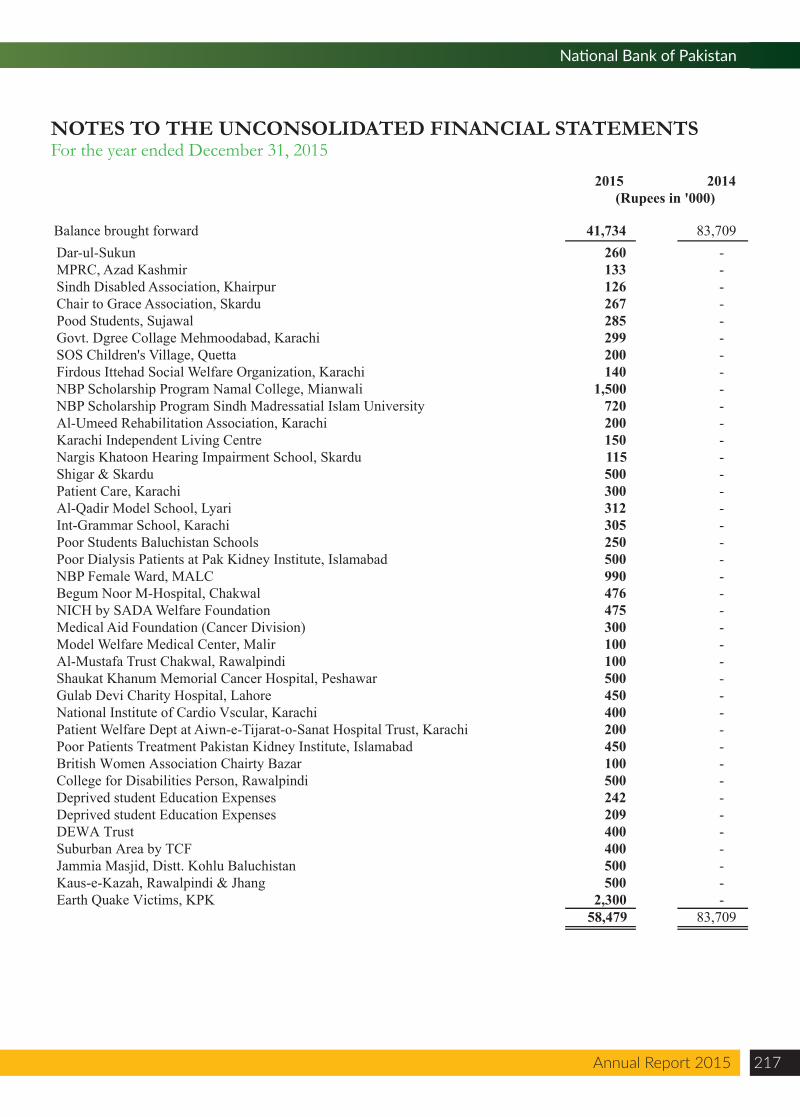
Annual Report 2015 217
National Bank of Pakistan
NOTES TO THE UNCONSOLIDATED FINANCIAL STATEMENTSFor the year ended December 31, 2015
Dar-ul-Sukun 260 - MPRC, Azad Kashmir 133 - Sindh Disabled Association, Khairpur 126 - Chair to Grace Association, Skardu 267 - Pood Students, Sujawal 285 - Govt. Dgree Collage Mehmoodabad, Karachi 299 - SOS Children's Village, Quetta 200 - Firdous Ittehad Social Welfare Organization, Karachi 140 - NBP Scholarship Program Namal College, Mianwali 1,500 - NBP Scholarship Program Sindh Madressatial Islam University 720 - Al-Umeed Rehabilitation Association, Karachi 200 - Karachi Independent Living Centre 150 - Nargis Khatoon Hearing Impairment School, Skardu 115 - Shigar & Skardu 500 - Patient Care, Karachi 300 - Al-Qadir Model School, Lyari 312 - Int-Grammar School, Karachi 305 - Poor Students Baluchistan Schools 250 - Poor Dialysis Patients at Pak Kidney Institute, Islamabad 500 - NBP Female Ward, MALC 990 - Begum Noor M-Hospital, Chakwal. 476 - NICH by SADA Welfare Foundation 475 - Medical Aid Foundation (Cancer Division) 300 - Model Welfare Medical Center, Malir 100 - Al-Mustafa Trust Chakwal, Rawalpindi 100 - Shaukat Khanum Memorial Cancer Hospital, Peshawar 500 - Gulab Devi Charity Hospital, Lahore 450 - National Institute of Cardio Vscular, Karachi 400 - Patient Welfare Dept at Aiwn-e-Tijarat-o-Sanat Hospital Trust, Karachi 200 - Poor Patients Treatment Pakistan Kidney Institute, Islamabad 450 - British Women Association Chairty Bazar 100 - College for Disabilities Person, Rawalpindi 500 - Deprived student Education Expenses 242 - Deprived student Education Expenses 209 - DEWA Trust 400 - Suburban Area by TCF 400 - Jammia Masjid, Distt. Kohlu Baluchistan 500 - Kaus-e-Kazah, Rawalpindi & Jhang 500 - Earth Quake Victims, KPK 2,300
58,479 83,709 -
Balance brought forward 41,734 83,709
2015 2014(Rupees in '000)
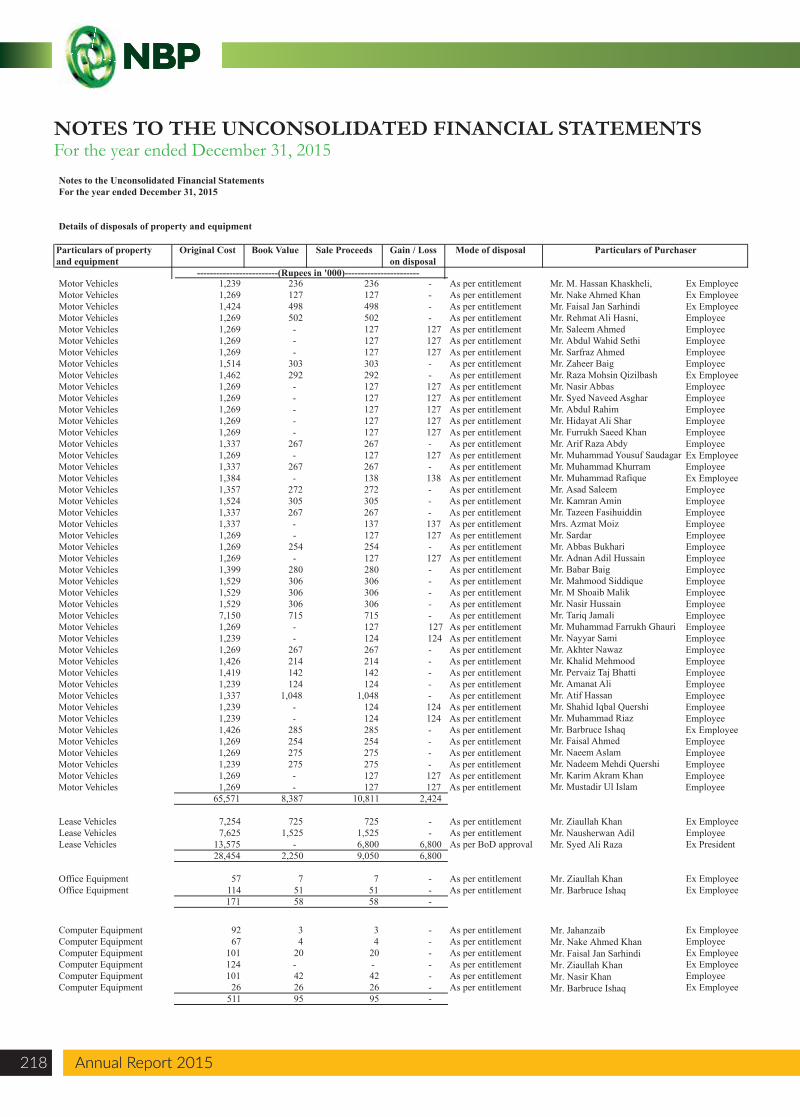
Notes to the Unconsolidated Financial Statements For the year ended December 31, 2015
Details of disposals of property and equipment
Particulars of property and equipment
Original Cost Book Value Sale Proceeds Gain / Loss on disposal
Mode of disposal Particulars of Purchaser
Motor Vehicles 1,239 236 236 - As per entitlement Ex EmployeeMotor Vehicles 1,269 127 127 - As per entitlement Ex EmployeeMotor Vehicles 1,424 498 498 - As per entitlement Ex EmployeeMotor Vehicles 1,269 502 502 - As per entitlement EmployeeMotor Vehicles 1,269 - 127 127 As per entitlement EmployeeMotor Vehicles 1,269 - 127 127 As per entitlement EmployeeMotor Vehicles 1,269 - 127 127 As per entitlement EmployeeMotor Vehicles 1,514 303 303 - As per entitlement EmployeeMotor Vehicles 1,462 292 292 - As per entitlement Ex EmployeeMotor Vehicles 1,269 - 127 127 As per entitlement EmployeeMotor Vehicles 1,269 - 127 127 As per entitlement EmployeeMotor Vehicles 1,269 - 127 127 As per entitlement EmployeeMotor Vehicles 1,269 - 127 127 As per entitlement EmployeeMotor Vehicles 1,269 - 127 127 As per entitlement EmployeeMotor Vehicles 1,337 267 267 - As per entitlement EmployeeMotor Vehicles 1,269 - 127 127 As per entitlement Ex EmployeeMotor Vehicles 1,337 267 267 - As per entitlement EmployeeMotor Vehicles 1,384 - 138 138 As per entitlement Ex EmployeeMotor Vehicles 1,357 272 272 - As per entitlement EmployeeMotor Vehicles 1,524 305 305 - As per entitlement EmployeeMotor Vehicles 1,337 267 267 - As per entitlement EmployeeMotor Vehicles 1,337 - 137 137 As per entitlement EmployeeMotor Vehicles 1,269 - 127 127 As per entitlement EmployeeMotor Vehicles 1,269 254 254 - As per entitlement EmployeeMotor Vehicles 1,269 - 127 127 As per entitlement EmployeeMotor Vehicles 1,399 280 280 - As per entitlement EmployeeMotor Vehicles 1,529 306 306 - As per entitlement EmployeeMotor Vehicles 1,529 306 306 - As per entitlement EmployeeMotor Vehicles 1,529 306 306 - As per entitlement EmployeeMotor Vehicles 7,150 715 715 - As per entitlement EmployeeMotor Vehicles 1,269 - 127 127 As per entitlement EmployeeMotor Vehicles 1,239 - 124 124 As per entitlement EmployeeMotor Vehicles 1,269 267 267 - As per entitlement EmployeeMotor Vehicles 1,426 214 214 - As per entitlement EmployeeMotor Vehicles 1,419 142 142 - As per entitlement EmployeeMotor Vehicles 1,239 124 124 - As per entitlement EmployeeMotor Vehicles 1,337 1,048 1,048 As per entitlement EmployeeMotor Vehicles 1,239 - 124 124
- As per entitlement Employee
Motor Vehicles 1,239 - 124 124 As per entitlement EmployeeMotor Vehicles 1,426 285 285 - As per entitlement Ex EmployeeMotor Vehicles 1,269 254 254 - As per entitlement EmployeeMotor Vehicles 1,269 275 275 - As per entitlement EmployeeMotor Vehicles 1,239 275 275 - As per entitlement EmployeeMotor Vehicles 1,269 - 127 127 As per entitlement EmployeeMotor Vehicles 1,269 - 127 127 As per entitlement Employee
65,571 8,387 10,811 2,424
Lease Vehicles 7,254 725 725 - As per entitlement Ex Employee
Ex PresidentLease Vehicles 7,625 1,525 1,525 - As per entitlement EmployeeLease Vehicles 13,575 - 6,800 6,800 As per BoD approval
28,454 2,250 9,050 6,800
Office Equipment 57 7 7 - As per entitlement Ex EmployeeOffice Equipment 114 51 51 - As per entitlement Ex Employee
171 58 58 -
-------------------------(Rupees in '000)-----------------------
Computer Equipment 92 3 3 - As per entitlement Ex EmployeeComputer Equipment 67 4 4 - As per entitlement EmployeeComputer Equipment 101 20 20 - As per entitlement Ex EmployeeComputer Equipment 124 - - - As per entitlement Ex EmployeeComputer Equipment 101 42 42 - As per entitlement EmployeeComputer Equipment 26 26 26 - As per entitlement Ex Employee
511 95 95 -
Mr. M. Hassan Khaskheli,Mr. Nake Ahmed KhanMr. Faisal Jan SarhindiMr. Rehmat Ali Hasni, Mr. Saleem AhmedMr. Abdul Wahid SethiMr. Sarfraz AhmedMr. Zaheer BaigMr. Raza Mohsin QizilbashMr. Nasir AbbasMr. Syed Naveed AsgharMr. Abdul RahimMr. Hidayat Ali SharMr. Furrukh Saeed KhanMr. Arif Raza AbdyMr. Muhammad Yousuf SaudagarMr. Muhammad KhurramMr. Muhammad RafiqueMr. Asad SaleemMr. Kamran AminMr. Tazeen FasihuiddinMrs. Azmat MoizMr. SardarMr. Abbas BukhariMr. Adnan Adil HussainMr. Babar BaigMr. Mahmood SiddiqueMr. M Shoaib MalikMr. Nasir HussainMr. Tariq JamaliMr. Muhammad Farrukh GhauriMr. Nayyar SamiMr. Akhter NawazMr. Khalid MehmoodMr. Pervaiz Taj BhattiMr. Amanat AliMr. Atif HassanMr. Shahid Iqbal QuershiMr. Muhammad RiazMr. Barbruce IshaqMr. Faisal AhmedMr. Naeem AslamMr. Nadeem Mehdi QuershiMr. Karim Akram KhanMr. Mustadir Ul Islam
Mr. Ziaullah KhanMr. Nausherwan AdilMr. Syed Ali Raza
Mr. Ziaullah KhanMr. Barbruce Ishaq
Mr. JahanzaibMr. Nake Ahmed KhanMr. Faisal Jan SarhindiMr. Ziaullah KhanMr. Nasir KhanMr. Barbruce Ishaq
NOTES TO THE UNCONSOLIDATED FINANCIAL STATEMENTSFor the year ended December 31, 2015
Annual Report 2015218 Annual Report 2015
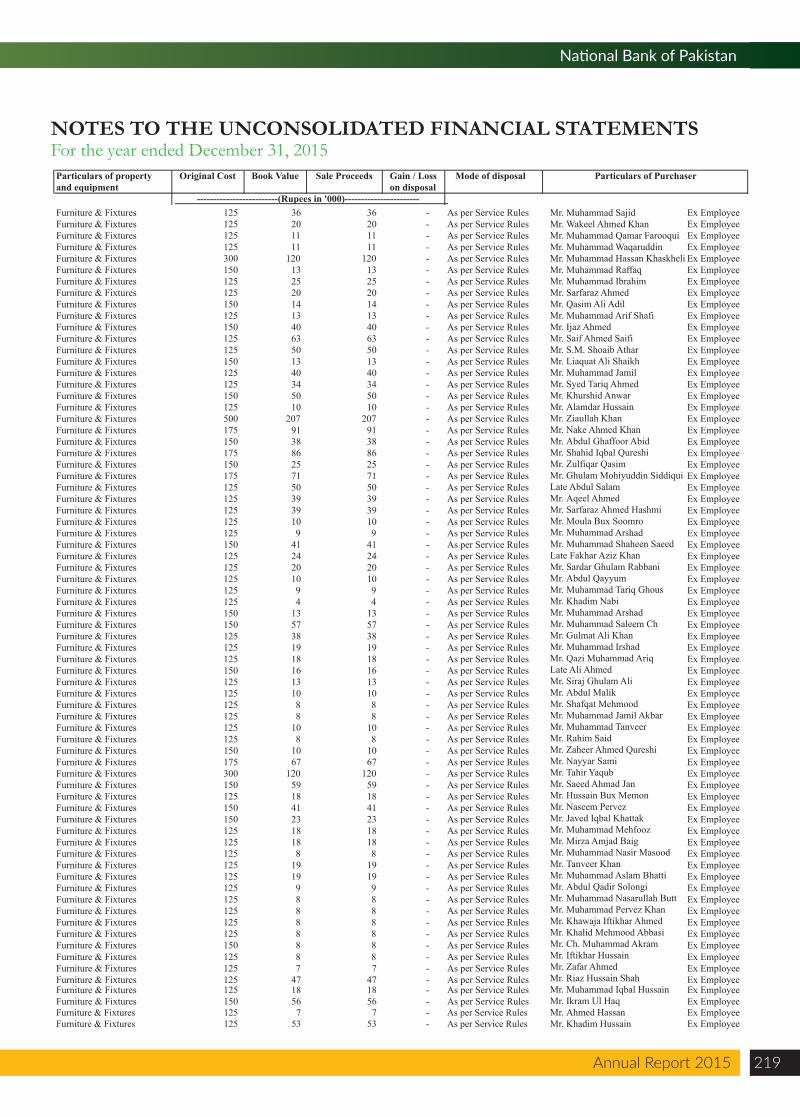
Annual Report 2015 219
National Bank of Pakistan
NOTES TO THE UNCONSOLIDATED FINANCIAL STATEMENTSFor the year ended December 31, 2015
Particulars of property and equipment
Original Cost Book Value Sale Proceeds Gain / Loss on disposal
Mode of disposal Particulars of Purchaser
-------------------------(Rupees in '000)-----------------------Furniture & Fixtures 125 36 36 - As per Service Rules Ex EmployeeFurniture & Fixtures 125 20 20 - As per Service Rules Ex EmployeeFurniture & Fixtures 125 11 11 - As per Service Rules Ex EmployeeFurniture & Fixtures 125 11 11 - As per Service Rules Ex EmployeeFurniture & Fixtures 300 120 120 - As per Service Rules Ex EmployeeFurniture & Fixtures 150 13 13 - As per Service Rules Ex EmployeeFurniture & Fixtures 125 25 25 - As per Service Rules Ex EmployeeFurniture & Fixtures 125 20 20 - As per Service Rules Ex EmployeeFurniture & Fixtures 150 14 14 - As per Service Rules Ex EmployeeFurniture & Fixtures 125 13 13 - As per Service Rules Ex EmployeeFurniture & Fixtures 150 40 40 - As per Service Rules Ex EmployeeFurniture & Fixtures 125 63 63 - As per Service Rules Ex EmployeeFurniture & Fixtures 125 50 50 - As per Service Rules Ex EmployeeFurniture & Fixtures 150 13 13 - As per Service Rules Ex EmployeeFurniture & Fixtures 125 40 40 - As per Service Rules Ex EmployeeFurniture & Fixtures 125 34 34 - As per Service Rules Ex EmployeeFurniture & Fixtures 150 50 50 - As per Service Rules Ex EmployeeFurniture & Fixtures 125 10 10 - As per Service Rules Ex EmployeeFurniture & Fixtures 500 207 207 - As per Service Rules Ex EmployeeFurniture & Fixtures 175 91 91 - As per Service Rules Ex EmployeeFurniture & Fixtures 150 38 38 - As per Service Rules Ex EmployeeFurniture & Fixtures 175 86 86 - As per Service Rules Ex EmployeeFurniture & Fixtures 150 25 25 - As per Service Rules Ex EmployeeFurniture & Fixtures 175 71 71 - As per Service Rules Ex EmployeeFurniture & Fixtures 125 50 50 - As per Service Rules Ex EmployeeFurniture & Fixtures 125 39 39 - As per Service Rules Ex EmployeeFurniture & Fixtures 125 39 39 - As per Service Rules Ex EmployeeFurniture & Fixtures 125 10 10 - As per Service Rules Ex EmployeeFurniture & Fixtures 125 9 9 - As per Service Rules Ex EmployeeFurniture & Fixtures 150 41 41 - As per Service Rules Ex EmployeeFurniture & Fixtures 125 24 24 - As per Service Rules Ex EmployeeFurniture & Fixtures 125 20 20 - As per Service Rules Ex EmployeeFurniture & Fixtures 125 10 10 - As per Service Rules Ex EmployeeFurniture & Fixtures 125 9 9 - As per Service Rules Ex EmployeeFurniture & Fixtures 125 4 4 - As per Service Rules Ex EmployeeFurniture & Fixtures 150 13 13 - As per Service Rules Ex EmployeeFurniture & Fixtures 150 57 57 - As per Service Rules Ex EmployeeFurniture & Fixtures 125 38 38 - As per Service Rules Ex EmployeeFurniture & Fixtures 125 19 19 - As per Service Rules Ex EmployeeFurniture & Fixtures 125 18 18 - As per Service Rules Ex EmployeeFurniture & Fixtures 150 16 16 - As per Service Rules Ex EmployeeFurniture & Fixtures 125 13 13 - As per Service Rules Ex EmployeeFurniture & Fixtures 125 10 10 - As per Service Rules Ex EmployeeFurniture & Fixtures 125 8 8 - As per Service Rules Ex EmployeeFurniture & Fixtures 125 8 8 - As per Service Rules Ex EmployeeFurniture & Fixtures 125 10 10 - As per Service Rules Ex EmployeeFurniture & Fixtures 125 8 8 - As per Service Rules Ex EmployeeFurniture & Fixtures 150 10 10 - As per Service Rules Ex EmployeeFurniture & Fixtures 175 67 67 - As per Service Rules Ex EmployeeFurniture & Fixtures 300 120 120 - As per Service Rules Ex EmployeeFurniture & Fixtures 150 59 59 - As per Service Rules Ex EmployeeFurniture & Fixtures 125 18 18 - As per Service Rules Ex EmployeeFurniture & Fixtures 150 41 41 - As per Service Rules Ex EmployeeFurniture & Fixtures 150 23 23 - As per Service Rules Ex EmployeeFurniture & Fixtures 125 18 18 - As per Service Rules Ex EmployeeFurniture & Fixtures 125 18 18 - As per Service Rules Ex EmployeeFurniture & Fixtures 125 8 8 - As per Service Rules Ex EmployeeFurniture & Fixtures 125 19 19 - As per Service Rules Ex EmployeeFurniture & Fixtures 125 19 19 - As per Service Rules Ex EmployeeFurniture & Fixtures 125 9 9 - As per Service Rules Ex EmployeeFurniture & Fixtures 125 8 8 - As per Service Rules Ex EmployeeFurniture & Fixtures 125 8 8 - As per Service Rules Ex EmployeeFurniture & Fixtures 125 8 8 - As per Service Rules Ex EmployeeFurniture & Fixtures 125 8 8 - As per Service Rules Ex EmployeeFurniture & Fixtures 150 8 8 - As per Service Rules Ex EmployeeFurniture & Fixtures 125 8 8 - As per Service Rules Ex EmployeeFurniture & Fixtures 125 7 7 - As per Service Rules Ex EmployeeFurniture & Fixtures 125 47 47 - As per Service Rules Ex EmployeeFurniture & Fixtures 125 18 18 - As per Service Rules Ex EmployeeFurniture & Fixtures 150 56 56 - As per Service Rules Ex EmployeeFurniture & Fixtures 125 7 7 - As per Service Rules Ex EmployeeFurniture & Fixtures 125 53 53 - As per Service Rules Ex Employee
Mr. Muhammad SajidMr. Wakeel Ahmed KhanMr. Muhammad Qamar FarooquiMr. Muhammad WaqaruddinMr. Muhammad Hassan KhaskheliMr. Muhammad RaffaqMr. Muhammad IbrahimMr. Sarfaraz AhmedMr. Qasim Ali AdilMr. Muhammad Arif ShafiMr. Ijaz AhmedMr. Saif Ahmed SaifiMr. S.M. Shoaib AtharMr. Liaquat Ali ShaikhMr. Muhammad JamilMr. Syed Tariq AhmedMr. Khurshid AnwarMr. Alamdar HussainMr. Ziaullah KhanMr. Nake Ahmed KhanMr. Abdul Ghaffoor AbidMr. Shahid Iqbal QureshiMr. Zulfiqar QasimMr. Ghulam Mohiyuddin SiddiquiLate Abdul SalamMr. Aqeel AhmedMr. Sarfaraz Ahmed HashmiMr. Moula Bux SoomroMr. Muhammad ArshadMr. Muhammad Shaheen SaeedLate Fakhar Aziz KhanMr. Sardar Ghulam RabbaniMr. Abdul QayyumMr. Muhammad Tariq GhousMr. Khadim NabiMr. Muhammad ArshadMr. Muhammad Saleem ChMr. Gulmat Ali KhanMr. Muhammad IrshadMr. Qazi Muhammad AriqLate Ali AhmedMr. Siraj Ghulam AliMr. Abdul MalikMr. Shafqat MehmoodMr. Muhammad Jamil AkbarMr. Muhammad TanveerMr. Rahim SaidMr. Zaheer Ahmed QureshiMr. Nayyar SamiMr. Tahir YaqubMr. Saeed Ahmad JanMr. Hussain Bux MemonMr. Naseem PervezMr. Javed Iqbal KhattakMr. Muhammad MehfoozMr. Mirza Amjad BaigMr. Muhammad Nasir MasoodMr. Tanveer KhanMr. Muhammad Aslam BhattiMr. Abdul Qadir SolongiMr. Muhammad Nasarullah ButtMr. Muhammad Pervez KhanMr. Khawaja Iftikhar AhmedMr. Khalid Mehmood AbbasiMr. Ch. Muhammad AkramMr. Iftikhar HussainMr. Zafar AhmedMr. Riaz Hussain ShahMr. Muhammad Iqbal HussainMr. Ikram Ul HaqMr. Ahmed HassanMr. Khadim Hussain
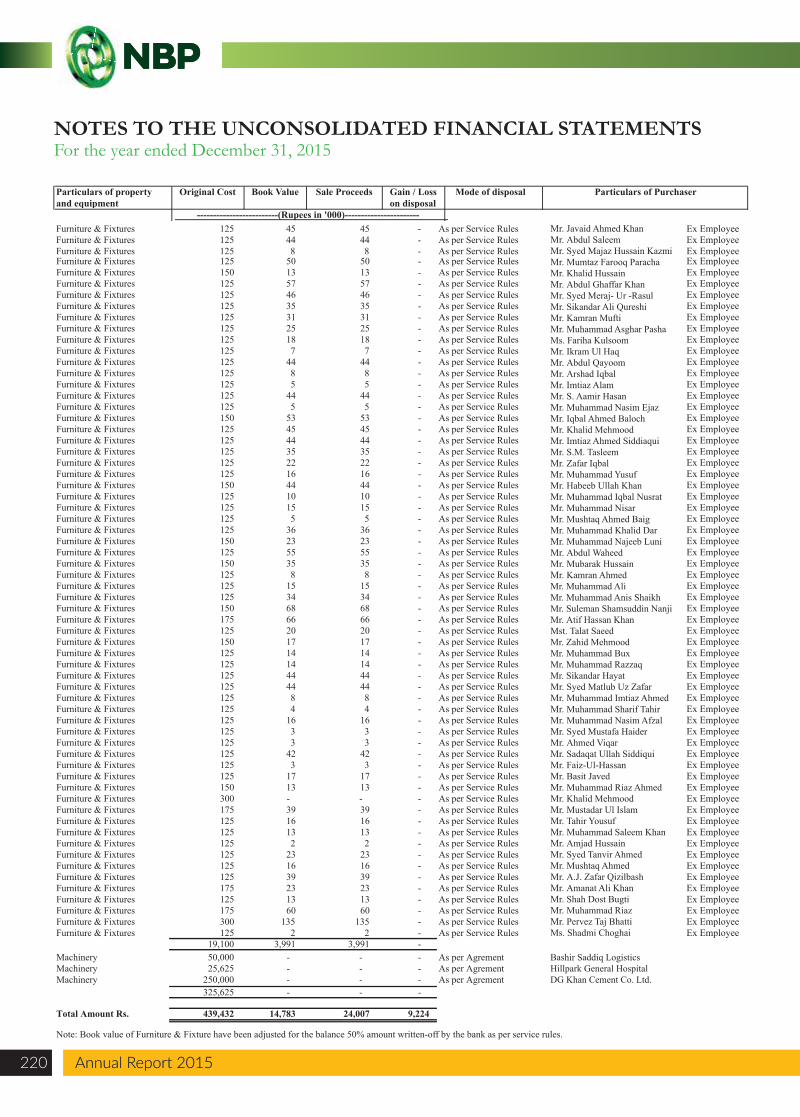
NOTES TO THE UNCONSOLIDATED FINANCIAL STATEMENTSFor the year ended December 31, 2015
Annual Report 2015220 Annual Report 2015
Particulars of property and equipment
Original Cost Book Value Sale Proceeds Gain / Loss on disposal
Mode of disposal Particulars of Purchaser
-------------------------(Rupees in '000)-----------------------Furniture & Fixtures 125 45 45 - As per Service Rules Ex EmployeeFurniture & Fixtures 125 44 44 - As per Service Rules Ex EmployeeFurniture & Fixtures 125 8 8 - As per Service Rules Ex EmployeeFurniture & Fixtures 125 50 50 - As per Service Rules Ex EmployeeFurniture & Fixtures 150 13 13 - As per Service Rules Ex EmployeeFurniture & Fixtures 125 57 57 - As per Service Rules Ex EmployeeFurniture & Fixtures 125 46 46 - As per Service Rules Ex EmployeeFurniture & Fixtures 125 35 35 - As per Service Rules Ex EmployeeFurniture & Fixtures 125 31 31 - As per Service Rules Ex EmployeeFurniture & Fixtures 125 25 25 - As per Service Rules Ex EmployeeFurniture & Fixtures 125 18 18 - As per Service Rules Ex EmployeeFurniture & Fixtures 125 7 7 - As per Service Rules Ex EmployeeFurniture & Fixtures 125 44 44 - As per Service Rules Ex EmployeeFurniture & Fixtures 125 8 8 - As per Service Rules Ex EmployeeFurniture & Fixtures 125 5 5 - As per Service Rules Ex EmployeeFurniture & Fixtures 125 44 44 - As per Service Rules Ex EmployeeFurniture & Fixtures 125 5 5 - As per Service Rules Ex EmployeeFurniture & Fixtures 150 53 53 - As per Service Rules Ex EmployeeFurniture & Fixtures 125 45 45 - As per Service Rules Ex EmployeeFurniture & Fixtures 125 44 44 - As per Service Rules Ex EmployeeFurniture & Fixtures 125 35 35 - As per Service Rules Ex EmployeeFurniture & Fixtures 125 22 22 - As per Service Rules Ex EmployeeFurniture & Fixtures 125 16 16 - As per Service Rules Ex EmployeeFurniture & Fixtures 150 44 44 - As per Service Rules Ex EmployeeFurniture & Fixtures 125 10 10 - As per Service Rules Ex EmployeeFurniture & Fixtures 125 15 15 - As per Service Rules Ex EmployeeFurniture & Fixtures 125 5 5 - As per Service Rules Ex EmployeeFurniture & Fixtures 125 36 36 - As per Service Rules Ex EmployeeFurniture & Fixtures 150 23 23 - As per Service Rules Ex EmployeeFurniture & Fixtures 125 55 55 - As per Service Rules Ex EmployeeFurniture & Fixtures 150 35 35 - As per Service Rules Ex EmployeeFurniture & Fixtures 125 8 8 - As per Service Rules Ex EmployeeFurniture & Fixtures 125 15 15 - As per Service Rules Ex EmployeeFurniture & Fixtures 125 34 34 - As per Service Rules Ex EmployeeFurniture & Fixtures 150 68 68 - As per Service Rules Ex EmployeeFurniture & Fixtures 175 66 66 - As per Service Rules Ex EmployeeFurniture & Fixtures 125 20 20 - As per Service Rules Ex EmployeeFurniture & Fixtures 150 17 17 - As per Service Rules Ex EmployeeFurniture & Fixtures 125 14 14 - As per Service Rules Ex EmployeeFurniture & Fixtures 125 14 14 - As per Service Rules Ex EmployeeFurniture & Fixtures 125 44 44 - As per Service Rules Ex EmployeeFurniture & Fixtures 125 44 44 - As per Service Rules Ex EmployeeFurniture & Fixtures 125 8 8 - As per Service Rules Ex EmployeeFurniture & Fixtures 125 4 4 - As per Service Rules Ex EmployeeFurniture & Fixtures 125 16 16 - As per Service Rules Ex EmployeeFurniture & Fixtures 125 3 3 - As per Service Rules Ex EmployeeFurniture & Fixtures 125 3 3 - As per Service Rules Ex EmployeeFurniture & Fixtures 125 42 42 - As per Service Rules Ex EmployeeFurniture & Fixtures 125 3 3 - As per Service Rules Ex EmployeeFurniture & Fixtures 125 17 17 - As per Service Rules Ex EmployeeFurniture & Fixtures 150 13 13 - As per Service Rules Ex EmployeeFurniture & Fixtures 300 - - - As per Service Rules Ex EmployeeFurniture & Fixtures 175 39 39 - As per Service Rules Ex EmployeeFurniture & Fixtures 125 16 16 - As per Service Rules Ex EmployeeFurniture & Fixtures 125 13 13 - As per Service Rules Ex EmployeeFurniture & Fixtures 125 2 2 - As per Service Rules Ex EmployeeFurniture & Fixtures 125 23 23 - As per Service Rules Ex EmployeeFurniture & Fixtures 125 16 16 - As per Service Rules Ex EmployeeFurniture & Fixtures 125 39 39 - As per Service Rules Ex EmployeeFurniture & Fixtures 175 23 23 - As per Service Rules Ex EmployeeFurniture & Fixtures 125 13 13 - As per Service Rules Ex EmployeeFurniture & Fixtures 175 60 60 - As per Service Rules Ex EmployeeFurniture & Fixtures 300 135 135 - As per Service Rules Ex EmployeeFurniture & Fixtures 125 2 2 - As per Service Rules Ex Employee
Machinery 50,000 - As per Agrement Bashir Saddiq LogisticsMachinery 25,625 - As per Agrement Hillpark General HospitalMachinery
Total Amount Rs.
250,000 -
- - -
- - - As per Agrement DG Khan Cement Co. Ltd.
19,100 3,991 3,991
439,432 14,783 24,007 9,224
325,625 - - -
-
Note: Book value of Furniture & Fixture have been adjusted for the balance 50% amount written-off by the bank as per service rules.
Mr. Javaid Ahmed KhanMr. Abdul SaleemMr. Syed Majaz Hussain KazmiMr. Mumtaz Farooq ParachaMr. Khalid HussainMr. Abdul Ghaffar KhanMr. Syed Meraj- Ur -RasulMr. Sikandar Ali QureshiMr. Kamran MuftiMr. Muhammad Asghar PashaMs. Fariha KulsoomMr. Ikram Ul HaqMr. Abdul QayoomMr. Arshad IqbalMr. Imtiaz AlamMr. S. Aamir HasanMr. Muhammad Nasim EjazMr. Iqbal Ahmed BalochMr. Khalid MehmoodMr. Imtiaz Ahmed SiddiaquiMr. S.M. TasleemMr. Zafar IqbalMr. Muhammad YusufMr. Habeeb Ullah KhanMr. Muhammad Iqbal NusratMr. Muhammad NisarMr. Mushtaq Ahmed BaigMr. Muhammad Khalid DarMr. Muhammad Najeeb LuniMr. Abdul WaheedMr. Mubarak HussainMr. Kamran AhmedMr. Muhammad AliMr. Muhammad Anis ShaikhMr. Suleman Shamsuddin NanjiMr. Atif Hassan KhanMst. Talat SaeedMr. Zahid MehmoodMr. Muhammad BuxMr. Muhammad RazzaqMr. Sikandar HayatMr. Syed Matlub Uz ZafarMr. Muhammad Imtiaz AhmedMr. Muhammad Sharif TahirMr. Muhammad Nasim AfzalMr. Syed Mustafa HaiderMr. Ahmed ViqarMr. Sadaqat Ullah SiddiquiMr. Faiz-Ul-HassanMr. Basit JavedMr. Muhammad Riaz AhmedMr. Khalid MehmoodMr. Mustadar Ul IslamMr. Tahir YousufMr. Muhammad Saleem KhanMr. Amjad HussainMr. Syed Tanvir AhmedMr. Mushtaq AhmedMr. A.J. Zafar QizilbashMr. Amanat Ali KhanMr. Shah Dost BugtiMr. Muhammad RiazMr. Pervez Taj BhattiMs. Shadmi Choghai
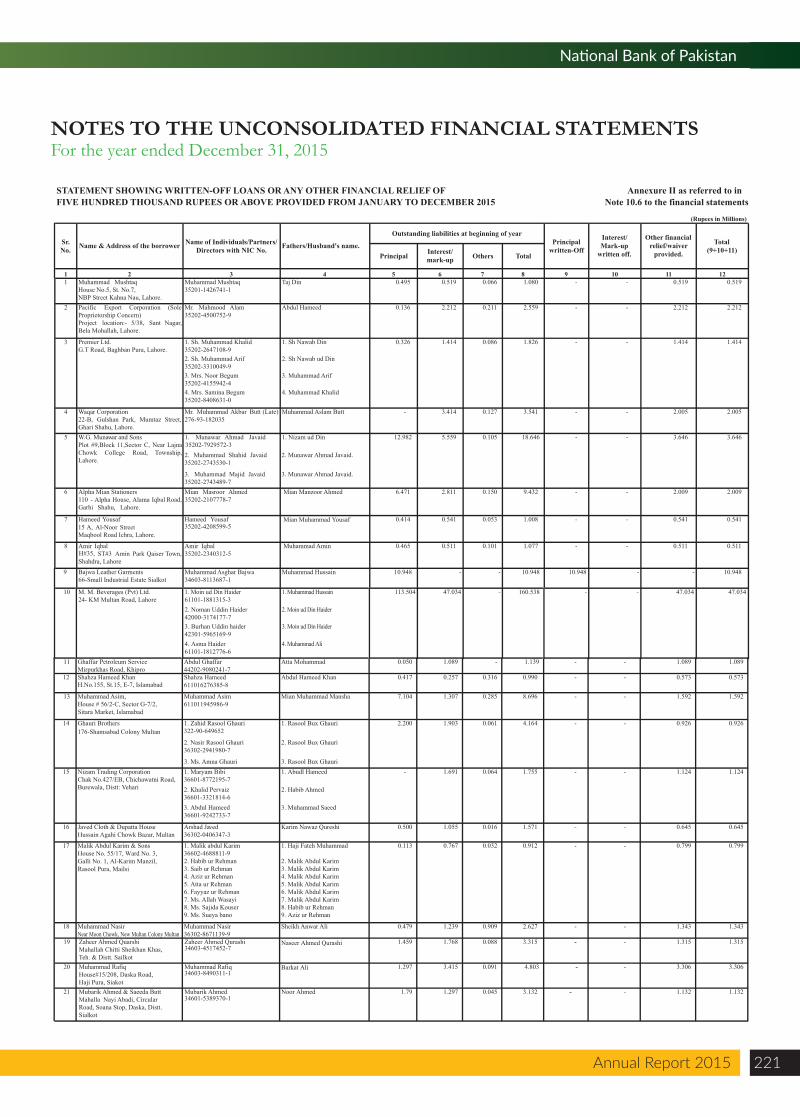
Annual Report 2015 221
National Bank of Pakistan
NOTES TO THE UNCONSOLIDATED FINANCIAL STATEMENTSFor the year ended December 31, 2015
STATEMENT SHOWING WRITTEN-OFF LOANS OR ANY OTHER FINANCIAL RELIEF OF Annexure II as referred to inFIVE HUNDRED THOUSAND RUPEES OR ABOVE PROVIDED FROM JANUARY TO DECEMBER 2015 Note 10.6 to the financial statements
(Rupees in Millions)
Principal Interest/mark-up Others Total
1 2 3 4 5 6 7 8 9 10 11 121 Muhammad Mushtaq
House No.5, St. No.7,NBP Street Kahna Nau, Lahore.
Muhammad Mushtaq 35201-1426741-1
Taj Din 0.495 0.519 0.066 1.080 - - 0.519 0.519
2 Pacific Export Corporation (SoleProprietorship Concern) Project location:- 5/38, Sant Nagar,Bela Mohallah, Lahore.
Mr. Mahmood Alam35202-4500752-9
Abdul Hameed 0.136 2.212 0.211 2.559 - - 2.212 2.212
3 Premier Ltd.G.T Road, Baghban Pura, Lahore.
1. Sh. Muhammad Khalid 35202-2647108-92. Sh. Muhammad Arif 35202-3310049-93. Mrs. Noor Begum35202-4155942-44. Mrs. Samina Begum35202-8408631-0
1. Sh Nawab Din
2. Sh Nawab ud Din
3. Muhammad Arif
4. Muhammad Khalid
0.326 1.414 0.086 1.826 - - 1.414 1.414
4 Waqar Corporation22-B, Gulshan Park, Mumtaz Street,Ghari Shahu, Lahore.
Mr. Muhammad Akbar Butt (Late)276-93-182035
Muhammad Aslam Butt - 3.414 0.127 3.541 - - 2.005 2.005
5 W.G. Munawar and Sons Plot #9,Block 11,Sector C, Near LajnaChowk College Road, Township,Lahore.
1. Munawar Ahmad Javaid 35202-7929572-32. Muhammad Shahid Javaid35202-2743530-1
3. Muhammad Majid Javaid35202-2743489-7
1. Nizam ud Din
3. Munawar Ahmad Javaid.
2. Munawar Ahmad Javaid.
12.982 5.559 0.105 18.646 - - 3.646 3.646
6 Alpha Mian Stationers110 - Alpha House, Alama Iqbal Road,Garhi Shahu, Lahore.
Mian Masroor Ahmed35202-2107778-7
Mian Manzoor Ahmed 6.471 2.811 0.150 9.432 - - 2.009 2.009
7 Hameed Yousaf15 A, Al-Noor StreetMaqbool Road Ichra, Lahore.
Hameed Yousaf35202-4208599-5
0.414 0.541 0.053 1.008 - - 0.541 0.541
8 Amir IqbalH#35, ST#3 Amin Park Qaiser Town,Shahdra, Lahore
Amir Iqbal35202-2340312-5
Muhammad Amin 0.465 0.511 0.101 1.077 - - 0.511 0.511
9 Bajwa Leather Garments 66-Small Industrial Estate Sialkot
Muhammad Asghar Bajwa 34603-8113687-1
Muhammad Hussain 10.948 - - 10.948 10.948 - - 10.948
10 M. M. Beverages (Pvt) Ltd.24- KM Multan Road, Lahore
1. Moin ud Din Haider61101-1881315-32. Noman Uddin Haider42000-3174177-73. Burhan Uddin haider42301-5965169-94. Asma Haider61101-1812776-6
1. Muhammad Hussain
2. Moin ud Din Haider
3. Moin ud Din Haider
4. Muhammad Ali
113.504 47.034 - 160.538 - - 47.034 47.034
Other financial relief/waiver
provided.
Total(9+10+11)
Sr. No. Name & Address of the borrower Name of Individuals/Partners/
Directors with NIC No. Fathers/Husband's name.
Outstanding liabilities at beginning of year Principal
written-Off
Interest/Mark-up
written off.
Mian Muhammad Yousaf
11 Ghaffar Petroleum Service Abdul Ghaffar44202-9080241-7
Atta Mohammad 0.050 1.089 - 1.139 - - 1.089 1.089
12 Shahza Hameed KhanH.No.155, St.15, E-7, Islamabad
Abdul Hameed Khan 0.417 0.257 0.316 0.990 - - 0.573 0.573
13 Muhammad Asim, House # 56/2-C, Sector G-7/2,Sitara Market, Islamabad
7.104 1.307 0.285 8.696 - - 1.592 1.592
14 Ghauri Brothers176-Shamsabad Colony Multan
1. Zahid Rasool Ghauri322-90-649652
2. Nasir Rasool Ghauri36302-2941980-7
3. Ms. Amna Ghauri
1. Rasool Bux Ghauri
2. Rasool Bux Ghauri
3. Rasool Bux Ghauri
2.200 1.903 0.061 4.164 - - 0.926 0.926
15 Nizam Trading CorporationChak No.427/EB, Chichawatni Road, Burewala, Distt: Vehari
1. Maryam Bibi36601-8772195-72. Khalid Pervaiz36601-3321814-63. Abdul Hameed36601-9242733-7
1. Abudl Hameed
2. Habib Ahmed
3. Muhammad Saeed
- 1.691 0.064 1.755 - - 1.124 1.124
16 Javed Cloth & Dupatta HouseHussain Agahi Chowk Bazar, Multan
Arshad Javed36302-0406347-3
Karim Nawaz Qureshi 0.500 1.055 0.016 1.571 - - 0.645 0.645
17 Malik Abdul Karim & SonsHouse No. 55/17, Ward No. 3,Galli No. 1, Al-Karim Manzil,Rasool Pura, Mailsi
1. Malik abdul Karim 36602-4688811-92. Habib ur Rehman3. Saib ur Rehman4. Aziz ur Rehman5. Atta ur Rehman6. Fayyaz ur Rehman7. Ms. Allah Wasayi8. Ms. Sajida Kouser9. Ms. Sueya bano
1. Haji Fateh Muhammad
2. Malik Abdul Karim3. Malik Abdul Karim4. Malik Abdul Karim5. Malik Abdul Karim6. Malik Abdul Karim7. Malik Abdul Karim8. Habib ur Rehman9. Aziz ur Rehman
0.113 0.767 0.032 0.912 - - 0.799 0.799
18 Muhammad NasirNear Moon Chowk, New Multan Colony Multan
Muhammad Nasir36302-8671139-9
Sheikh Anwar Ali 0.479 1.239 0.909 2.627 - - 1.343 1.343
19 Zaheer Ahmed QuarshiMahallah Chitti Sheikhan Khas, Teh. & Distt. Sailkot
Zaheer Ahmed Qurashi34603-4517452-7
1.459 1.768 0.088 3.315 - - 1.315 1.315
20 Muhammad RafiqHouse#15/208, Daska Road, Haji Pura, Siakot
Muhammad Rafiq34603-8490311-1
1.297 3.415 0.091 4.803
- - 3.306 3.306
21 Mubarik Ahmed & Saeeda Butt Mahalla Nayi Abadi, Circular Road, Soana Stop, Daska, Distt. Sialkot
Mubarik Ahmed 1.79 1.297 0.045 3.132 - - 1.132 1.132
Mirpurkhas Road, KhiproShahza Hameed 611016276385-8
Muhammad Asim611011945986-9
Mian Muhammad Mansha
Noor Ahmed34601-5389370-1
Naseer Ahmed Qurashi
Barkat Ali
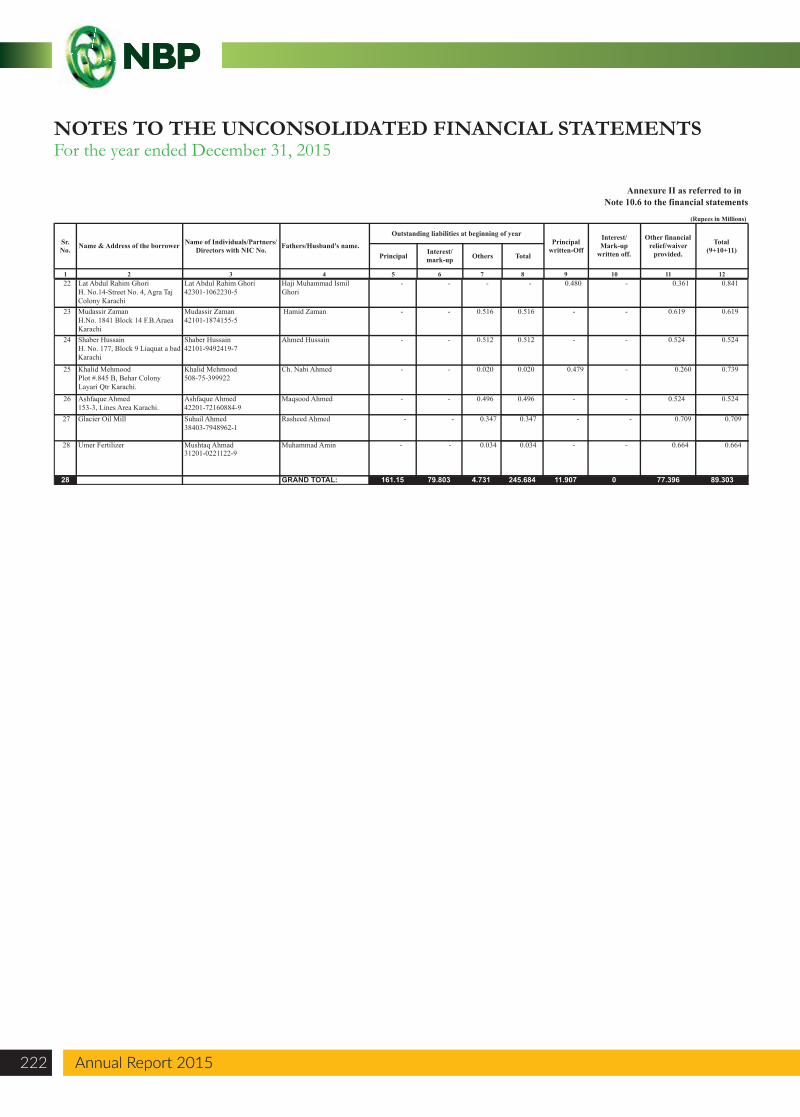
Annexure II as referred to inNote 10.6 to the financial statements
(Rupees in Millions)
Principal Interest/mark-up Others Total
1 2 3 4 5 6 7 8 9 10 11 12
Other financial relief/waiver
provided.
Total(9+10+11)
Sr. No. Name & Address of the borrower Name of Individuals/Partners/
Directors with NIC No. Fathers/Husband's name.
Outstanding liabilities at beginning of year Principal
written-Off
Interest/Mark-up
written off.
22 Lat Abdul Rahim Ghori H. No.14-Street No. 4, Agra Taj Colony Karachi
Lat Abdul Rahim Ghori 42301-1062230-5
Haji Muhammad Ismil Ghori
- - - - 0.480 - 0.361 0.841
23 Mudassir Zaman H.No. 1841 Block 14 F.B.Araea Karachi
Mudassir Zaman 42101-1874155-5
Hamid Zaman - - 0.516 0.516 - - 0.619 0.619
24 Shaber Hussain H. No. 177, Block 9 Liaquat a bad Karachi
Shaber Hussain42101-9492419-7
Ahmed Hussain - - 0.512 0.512 - - 0.524 0.524
25 Khalid MehmoodPlot #.845 B, Behar Colony Layari Qtr Karachi.
Khalid Mehmood 508-75-399922
Ch. Nabi Ahmed - - 0.020 0.020 0.479 - 0.260 0.739
26 Ashfaque Ahmed153-3, Lines Area Karachi.
Ashfaque Ahmed42201-72160884-9
Maqsood Ahmed - - 0.496 0.496 - - 0.524 0.524
27 Glacier Oil Mill Suhail Ahmed38403-7948962-1
Rasheed Ahmed 0.347 0.347 ---- 0.709 0.709
28 Umer Fertilizer Mushtaq Ahmad 31201-0221122-9
Muhammad Amin 0.034 0.034 - - - - 0.664 0.664
28 GRAND TOTAL: 161.15 79.803 4.731 245.684 11.907 0 77.396 89.303
NOTES TO THE UNCONSOLIDATED FINANCIAL STATEMENTSFor the year ended December 31, 2015
Annual Report 2015222 Annual Report 2015
Annual Report 2015 223
National Bank of Pakistan
NOTES TO THE UNCONSOLIDATED FINANCIAL STATEMENTSFor the year ended December 31, 2015
This page left intentionally blank