Embed Size (px)
Citation preview
Angola A. Definitions and sources of data Foreign direct investment (FDI) is defined in Angola as the utilization of transferred capital, technology, and transferable assets by non-residents on national territory with the aim of setting up a wholly or partly foreign owned business (Foreign Investment Law, Law 15 of Sept. 23, 1994). The Banco Nacional de Angola collects FDI data in Angola for the purpose of compiling the balance-of-payments statistics. The International Monetary Fund also reports FDI data in Angola in its balance-of-payments statistics. In 1994, Angola replaced its FDI regulation with a new and more liberal investment code. The new Code permitted FDI in various forms within most industries. Priority is given to the export-promoting or import-reducing investments. Foreign investors are allowed to transfer profits and to repatriate capital. Investors may enjoy certain incentives including exemptions from or the reduction of income tax and custom duties. Also in the same year, the Government of Angola shortened investment application procedures. In 1989, the Foreign Investment Office (FIO) was established in the Ministry of Economic Planning with a view to promoting and supervising FDI as well as to providing guidance to potential foreign investors. Since then, foreign investment projects became subject to the approval of the Ministry of Economic Planning and the Council of Ministers. In the process of evaluation, these authorities take into consideration the assessment of the FIO. Angola has large potential for FDI. It has large reserves of oil, gas and diamonds, considerable hydroelectric potential, varied agricultural land, adequate rainfall and well-stocked marine resources. Angola is the world's fourth largest diamond producer. The economy is now dominated by the capital-intensive oil sector which produces a large portion of the gross domestic product. Oil exploration has boomed even as the economy was being devastated by war. Massive investment is expected into the oil sector, particularly the deepwater extractions, in the future. Other minerals such as iron ore and gold were identified in surveys, but exploitation were checked by wars. In recent years, Angola introduced some changes to improve the poor state of its infrastructure. Angola Telecom has introduced a mobile phone network in Luanda and is gradually extending this to some of the larger towns. Licence was also granted to private cellular telephone companies for a joint venture that included Portugal Telecom, Sonangol and local investors. The authorities have equally concentrated on large new hydro-electric projects. Construction of the Capanda Dam on the Kwanza River resumed and the first turbine started in 2002. The country recently increased its effort to recapture international status and trade by joining regional integration schemes and other trade and investment enhancing initiatives. At the end of 2005, Angola was a full and eligible member of key groupings including the African Union, New Partnership for Africa's Development, the Common Market for the Eastern and Southern Africa, Southern Africa Development Community. Angola qualifies for the special and preferential schemes available to the least developed countries and is an eligible member of the United States' market access initiative for Africa – the African Growth and Opportunity Act, European Union's (EU) Everything But Arms and the new Cotonou Agreement for the renegotiation of the trade partnership agreement between African, Caribbean and Pacific countries with the EU. The Southern African Development Community, particularly, is promoting the establishment of a regional electricity grid, thus alleviating the infrastructure problems and placing Angola as a potential leader in FDI inflows in Southern Africa. Angola is a member of the World Trade Organization.
Posting date: November 2006
B. Statistics on FDI and the operations of TNCs
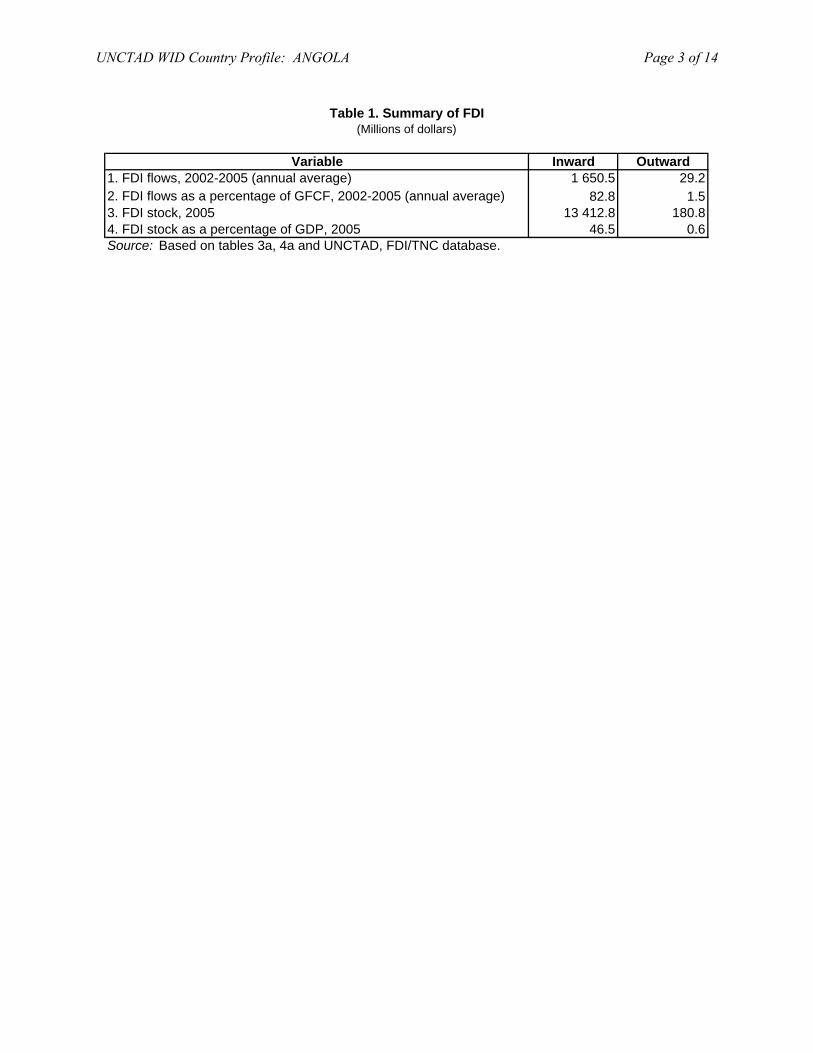
Table 1. Summary of FDI(Millions of dollars)
Variable Inward Outward1. FDI flows, 2002-2005 (annual average) 1 650.5 29.22. FDI flows as a percentage of GFCF, 2002-2005 (annual average) 82.8 1.53. FDI stock, 2005 13 412.8 180.84. FDI stock as a percentage of GDP, 2005 46.5 0.6Source: Based on tables 3a, 4a and UNCTAD, FDI/TNC database.
UNCTAD WID Country Profile: ANGOLA Page 3 of 14

Table 3a. FDI flows, by type of investment, 1980-2005(Millions of dollars)
Inward investment Outward investment
Year
1980 .. .. .. 37.4 .. .. .. ..1981 .. .. .. 49.1 .. .. .. ..1982 .. .. .. 115.8 .. .. .. ..1983 .. .. .. 104.3 .. .. .. ..1984 .. .. .. 67.1 .. .. .. ..1985 .. .. 278.0 278.0 .. .. .. ..1986 .. .. 234.0 234.0 .. .. .. ..1987 .. .. 119.0 119.0 .. .. .. ..1988 .. .. 131.0 131.0 .. .. .. ..1989 .. .. 200.0 200.0 .. .. .. 0.91990 .. .. -334.8 -334.5 0.9 .. .. 0.91991 302.0 26.4 336.1 664.1 .. .. .. 0.51992 .. .. 288.0 288.0 .. .. .. 0.21993 - 100.0 202.1 302.1 .. .. .. 2.01994 .. .. 170.3 170.1 .. .. .. -2.01995 .. .. 472.4 472.0 .. .. .. ..1996 .. .. 180.6 180.6 .. .. .. ..1997 .. .. 411.7 411.7 .. .. .. 0.91998 .. .. 1 114.0 1 113.9 .. .. .. 2.01999 0.1 - 2 471.4 2 471.4 .. .. .. 24.62000 - - 878.6 878.5 .. .. .. 20.02001 - - 2 145.5 2 145.5 .. .. .. 15.02002 - 583.1 1 089.0 1 672.1 .. .. 28.7 28.72003 - 679.6 2 825.1 3 504.7 .. .. 23.6 23.62004 -748.0 1 052.9 1 139.4 1 449.2 .. .. .. 35.22005 - 1 878.4 -1 902 .3 -23.9 .. .. .. 29.2
Note : FDI inflows: OECD for 1980-1984, IMF for 1985-1989 and Bank of Angola for 1990-2005. FDI outflows: IMF for 1990, World Bank for 1991, proxy for 1992-1994, 1997-1999, estimate for 2000-2001 and 2005 andBank of Angola for 2002-2004. Proxy is based on investments reported by the following economies: 1992France, 1993-1994 and 1998 United States, 1997 and 1999 France and the United States.
Source : UNCTAD, FDI/TNC database.
Equity Reinvested earnings
Intra-company
loansTotal Equity Reinvested
earnings
Intra-company
loansTotal
UNCTAD WID Country Profile: ANGOLA Page 4 of 14
Year
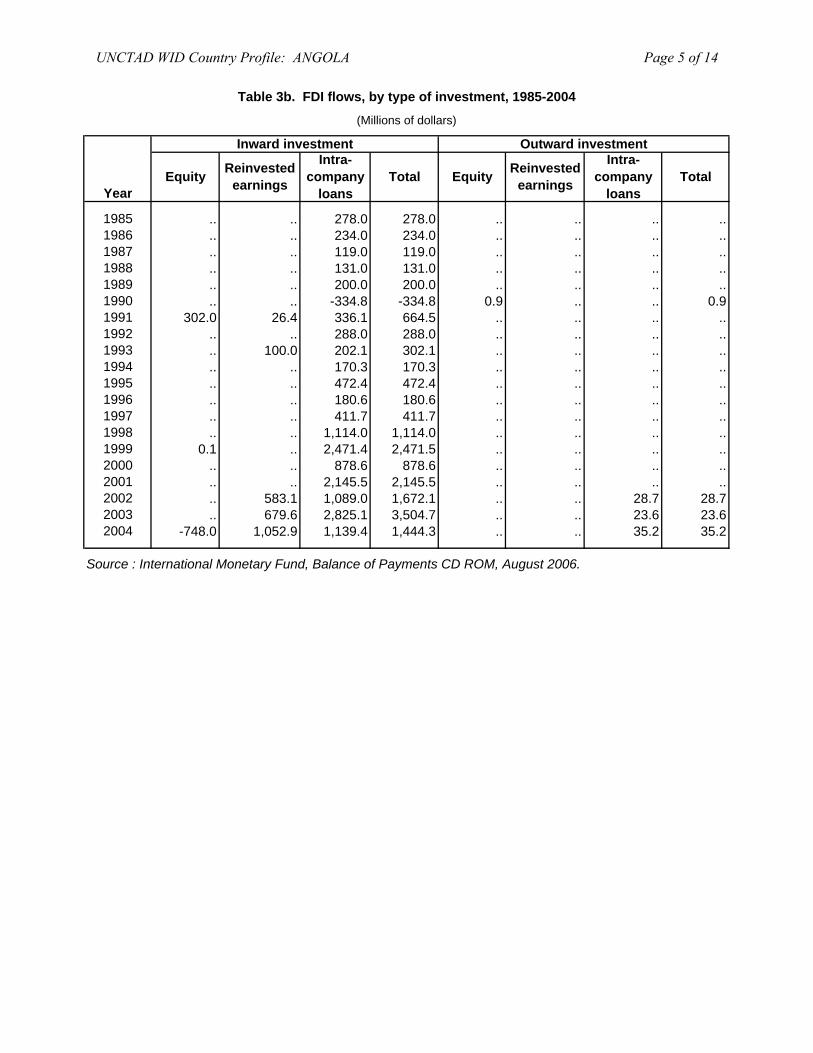
1985 .. .. 278.0 278.0 .. .. .. ..1986 .. .. 234.0 234.0 .. .. .. ..1987 .. .. 119.0 119.0 .. .. .. ..1988 .. .. 131.0 131.0 .. .. .. ..1989 .. .. 200.0 200.0 .. .. .. ..1990 .. .. -334.8 -334.8 0.9 .. .. 0.91991 302.0 26.4 336.1 664.5 .. .. .. ..1992 .. .. 288.0 288.0 .. .. .. ..1993 .. 100.0 202.1 302.1 .. .. .. ..1994 .. .. 170.3 170.3 .. .. .. ..1995 .. .. 472.4 472.4 .. .. .. ..1996 .. .. 180.6 180.6 .. .. .. ..1997 .. .. 411.7 411.7 .. .. .. ..1998 .. .. 1,114.0 1,114.0 .. .. .. ..1999 0.1 .. 2,471.4 2,471.5 .. .. .. ..2000 .. .. 878.6 878.6 .. .. .. ..2001 .. .. 2,145.5 2,145.5 .. .. .. ..2002 .. 583.1 1,089.0 1,672.1 .. .. 28.7 28.72003 .. 679.6 2,825.1 3,504.7 .. .. 23.6 23.62004 -748.0 1,052.9 1,139.4 1,444.3 .. .. 35.2 35.2
Source : International Monetary Fund, Balance of Payments CD ROM, August 2006.
Equity Reinvested earnings
Intra-company
loansTotalEquity Reinvested
earnings
Intra-company
loansTotal
Table 3b. FDI flows, by type of investment, 1985-2004
(Millions of dollars)
Inward investment Outward investment
UNCTAD WID Country Profile: ANGOLA Page 5 of 14
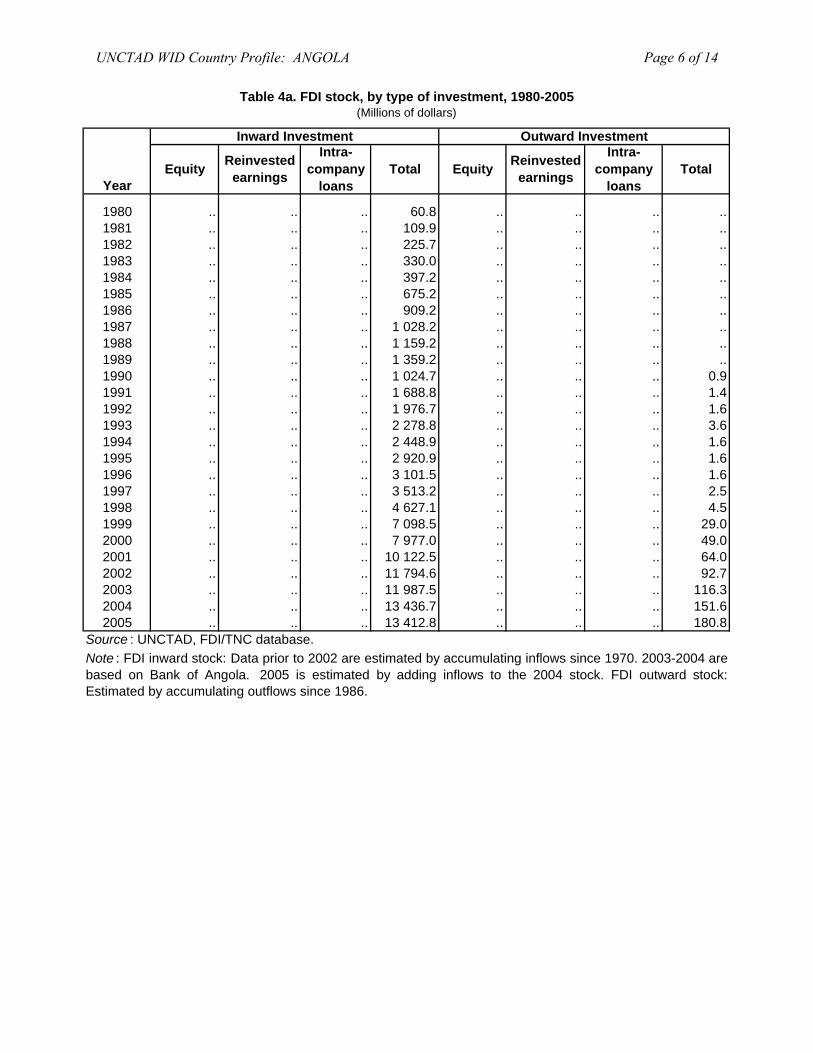
Table 4a. FDI stock, by type of investment, 1980-2005(Millions of dollars)
Inward Investment Outward Investment
Year
1980 .. .. .. 60.8 .. .. .. ..1981 .. .. .. 109.9 .. .. .. ..1982 .. .. .. 225.7 .. .. .. ..1983 .. .. .. 330.0 .. .. .. ..1984 .. .. .. 397.2 .. .. .. ..1985 .. .. .. 675.2 .. .. .. ..1986 .. .. .. 909.2 .. .. .. ..1987 .. .. .. 1 028.2 .. .. .. ..1988 .. .. .. 1 159.2 .. .. .. ..1989 .. .. .. 1 359.2 .. .. .. ..1990 .. .. .. 1 024.7 .. .. .. 0.91991 .. .. .. 1 688.8 .. .. .. 1.41992 .. .. .. 1 976.7 .. .. .. 1.61993 .. .. .. 2 278.8 .. .. .. 3.61994 .. .. .. 2 448.9 .. .. .. 1.61995 .. .. .. 2 920.9 .. .. .. 1.61996 .. .. .. 3 101.5 .. .. .. 1.61997 .. .. .. 3 513.2 .. .. .. 2.51998 .. .. .. 4 627.1 .. .. .. 4.51999 .. .. .. 7 098.5 .. .. .. 29.02000 .. .. .. 7 977.0 .. .. .. 49.02001 .. .. .. 10 122.5 .. .. .. 64.02002 .. .. .. 11 794.6 .. .. .. 92.72003 .. .. .. 11 987.5 .. .. .. 116.32004 .. .. .. 13 436.7 .. .. .. 151.62005 .. .. .. 13 412.8 .. .. .. 180.8
Note : FDI inward stock: Data prior to 2002 are estimated by accumulating inflows since 1970. 2003-2004 arebased on Bank of Angola. 2005 is estimated by adding inflows to the 2004 stock. FDI outward stock:Estimated by accumulating outflows since 1986.
Source : UNCTAD, FDI/TNC database.
Equity Reinvested earnings
Intra-company
loansTotal Equity Reinvested
earnings
Intra-company
loansTotal
UNCTAD WID Country Profile: ANGOLA Page 6 of 14

Economy 1990 1991 1992 1993 1994 1995 1996 1997 1998 1999 2000 2001 2002 2003 2004Belgium / Luxembourg 27.9 -14.7 -14.7 15.3 -0.1 -2.9 -0.9 -1.2 -0.1 .. .. .. .. .. ..France -141.0 313.2 .. -46.4 2.5 85.1 27.4 -114.8 .. 251.4 50.7 38.5 .. .. ..Germany .. -1.2 .. .. .. .. 23.4 30.5 12.2 .. .. 2.7 -2.8 .. 2.5Malaysia .. .. .. .. .. .. .. .. .. .. .. 1.2 0.2 .. ..Netherlands 1.2 .. .. .. -6.1 .. .. 18.1 28.9 42.6 .. .. .. .. ..Portugal .. .. .. .. 1.5 .. -5.0 32.1 42.1 96.2 102.4 45.7 -80.0 29.7 -3.2United States .. .. .. .. .. .. -65.0 203.0 273.0 443.0 79.0 342.0 -263.0 -36.0 20.0Source : UNCTAD, FDI/TNC database.Note: Data are based on information reported by the economies listed above.
Economy 1990 1991 1992 1993 1994 1995 1996 1997 1998 1999 2000 2001 2002 2003 2004Belgium / Luxembourg 0.1 .. 0.1 .. 0.1 1.3 0.3 0.2 0.1 .. .. .. .. .. ..Brazil .. .. .. .. .. .. .. .. .. .. .. 0.5 2.9 0.6 0.5France 0.4 0.2 0.2 .. .. .. -12.7 1.9 .. 25.6 -18.4 -36.7 7.5 -3.4 ..Portugal .. .. .. .. .. .. 1.3 3.1 0.7 0.2 1.0 1.6 1.1 5.8 3.9United States .. .. .. 2.0 -2.0 -1.0 -1.0 -1.0 2.0 -1.0 -4.0 -3.0 6.0 1.0 ..Source : UNCTAD, FDI/TNC database.Note: Data are based on information reported by the economies listed above.
Economy 1990 1991 1992 1993 1994 1995 1996 1997 1998 1999 2000 2001 2002 2003 2004Brazil .. .. .. .. .. .. .. .. .. .. .. 274.1 29.6 24.8 ..France .. .. .. .. .. .. .. .. 118.5 .. .. .. .. .. ..Malaysia .. .. .. .. .. .. .. .. .. .. .. 1.2 1.4 .. ..Portugal .. .. .. .. .. .. 169.5 148.3 176.5 165.1 208.8 198.4 143.6 160.0 ..United Kingdom 23.1 16.8 1.5 .. .. .. .. .. .. .. .. .. .. .. ..United States .. .. .. .. .. 659 594 798 1 116 1 535 585 1 220 1 110 1 067 1 094Source : UNCTAD, FDI/TNC database.Note: Data are based on information reported by the economies listed above.
Economy 1990 1991 1992 1993 1994 1995 1996 1997 1998 1999 2000 2001 2002 2003 2004Brazil 0.1 0.1 0.1 .. .. .. .. .. .. .. 0.3 .. .. .. ..Portugal .. .. .. .. .. .. 6.6 7.1 29.1 25.8 24.7 24.8 31.2 44.1 ..United States .. .. .. 2.0 .. -1.0 -2.0 -3.0 .. -1.0 -5.0 -9.0 -3.0 -2.0 ..Source : UNCTAD, FDI/TNC database.Note: Data are based on information reported by the economies listed above.
Table 12. FDI stock in the host economy, by geographical origin, 1990-2004
(Millions of dollars)
Table 15. FDI stock abroad, by geographical destination, 1990-2004
(Millions of dollars)
Table 6. FDI flows in the host economy, by geographical origin, 1990-2004
(Millions of dollars)
Table 9. FDI flows abroad, by geographical destination, 1990-2004
(Millions of dollars)
UNCTAD WID Country Profile: ANGOLA Page 7 of 14
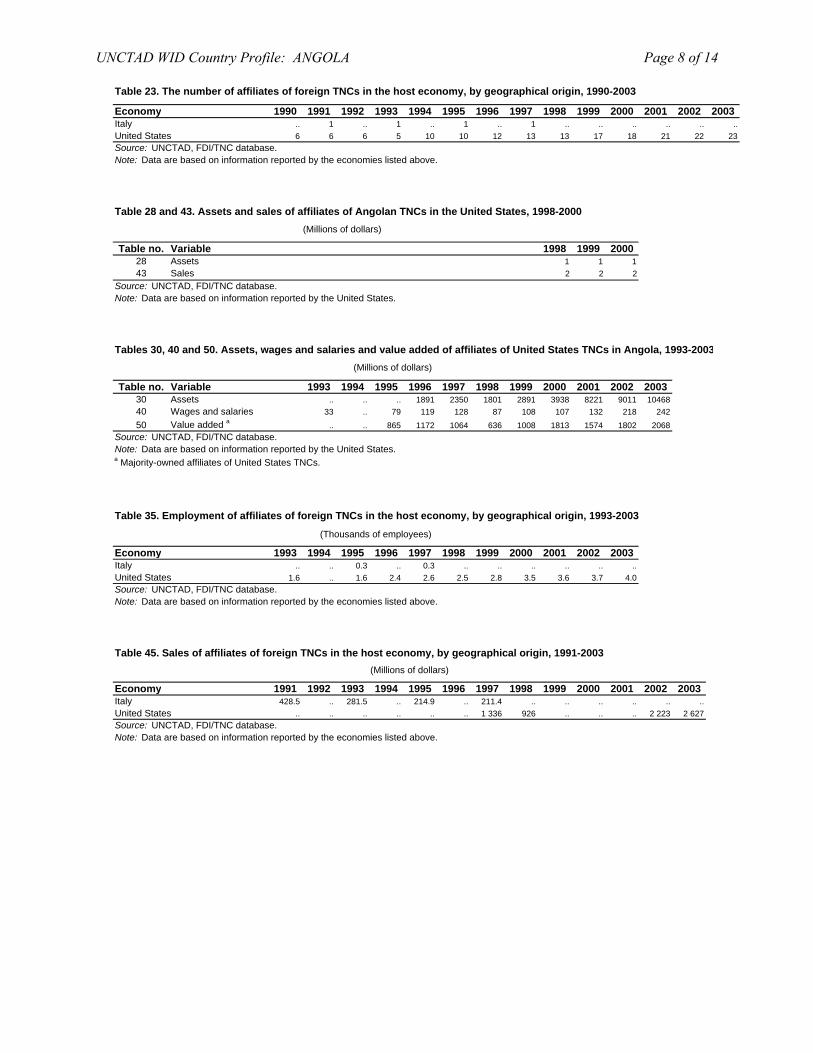
Economy 1990 1991 1992 1993 1994 1995 1996 1997 1998 1999 2000 2001 2002 2003Italy .. 1 .. 1 .. 1 .. 1 .. .. .. .. .. ..United States 6 6 6 5 10 10 12 13 13 17 18 21 22 23Source: UNCTAD, FDI/TNC database.Note: Data are based on information reported by the economies listed above.
Table 28 and 43. Assets and sales of affiliates of Angolan TNCs in the United States, 1998-2000
Table no. Variable 1998 1999 200028 Assets 1 1 143 Sales 2 2 2
Source: UNCTAD, FDI/TNC database.Note: Data are based on information reported by the United States.
Tables 30, 40 and 50. Assets, wages and salaries and value added of affiliates of United States TNCs in Angola, 1993-2003
Table no. Variable 1993 1994 1995 1996 1997 1998 1999 2000 2001 2002 200330 Assets .. .. .. 1891 2350 1801 2891 3938 8221 9011 1046840 Wages and salaries 33 .. 79 119 128 87 108 107 132 218 24250 Value added a .. .. 865 1172 1064 636 1008 1813 1574 1802 2068
Source: UNCTAD, FDI/TNC database.Note: Data are based on information reported by the United States.a Majority-owned affiliates of United States TNCs.
Table 35. Employment of affiliates of foreign TNCs in the host economy, by geographical origin, 1993-2003
Economy 1993 1994 1995 1996 1997 1998 1999 2000 2001 2002 2003Italy .. .. 0.3 .. 0.3 .. .. .. .. .. ..United States 1.6 .. 1.6 2.4 2.6 2.5 2.8 3.5 3.6 3.7 4.0Source: UNCTAD, FDI/TNC database.Note: Data are based on information reported by the economies listed above.
Economy 1991 1992 1993 1994 1995 1996 1997 1998 1999 2000 2001 2002 2003Italy 428.5 .. 281.5 .. 214.9 .. 211.4 .. .. .. .. .. ..United States .. .. .. .. .. .. 1 336 926 .. .. .. 2 223 2 627Source: UNCTAD, FDI/TNC database.Note: Data are based on information reported by the economies listed above.
(Millions of dollars)
(Millions of dollars)
(Thousands of employees)
Table 45. Sales of affiliates of foreign TNCs in the host economy, by geographical origin, 1991-2003
Table 23. The number of affiliates of foreign TNCs in the host economy, by geographical origin, 1990-2003
(Millions of dollars)
UNCTAD WID Country Profile: ANGOLA Page 8 of 14
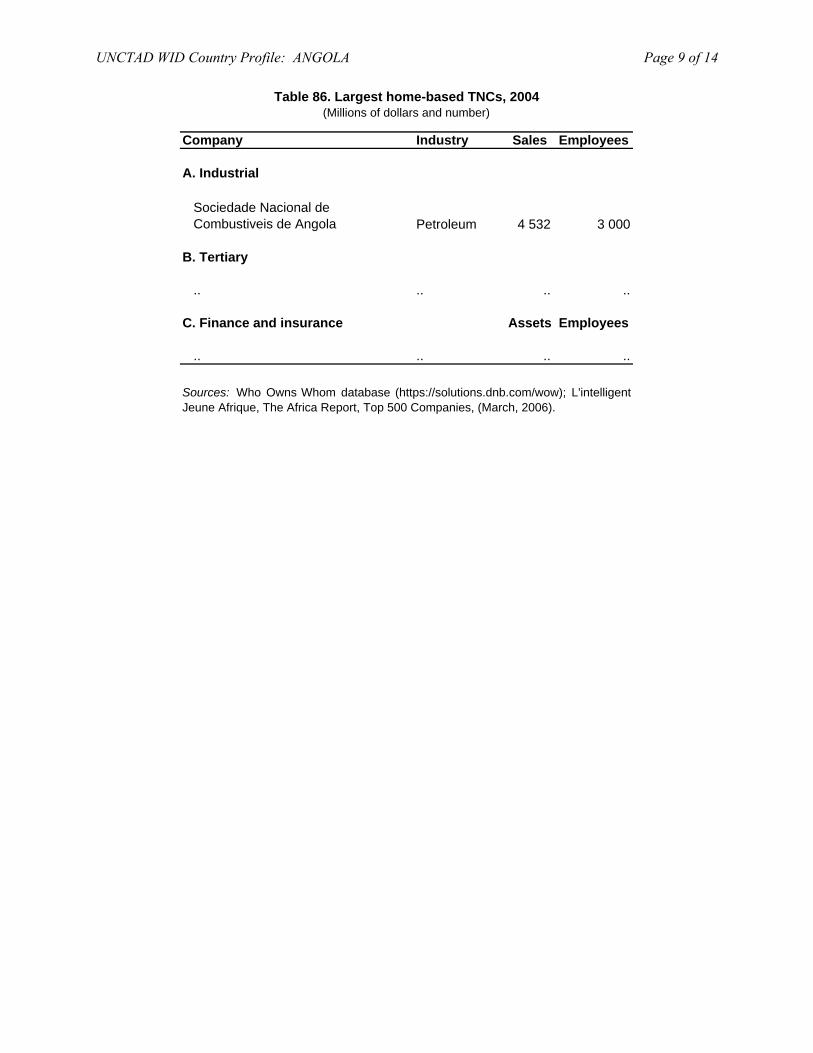
Table 86. Largest home-based TNCs, 2004(Millions of dollars and number)
Company Industry Sales Employees
A. Industrial
Sociedade Nacional de Combustiveis de Angola Petroleum 4 532 3 000
B. Tertiary
.. .. .. ..
C. Finance and insurance Assets Employees
.. .. .. ..
Sources: Who Owns Whom database (https://solutions.dnb.com/wow); L'intelligentJeune Afrique, The Africa Report, Top 500 Companies, (March, 2006).
UNCTAD WID Country Profile: ANGOLA Page 9 of 14
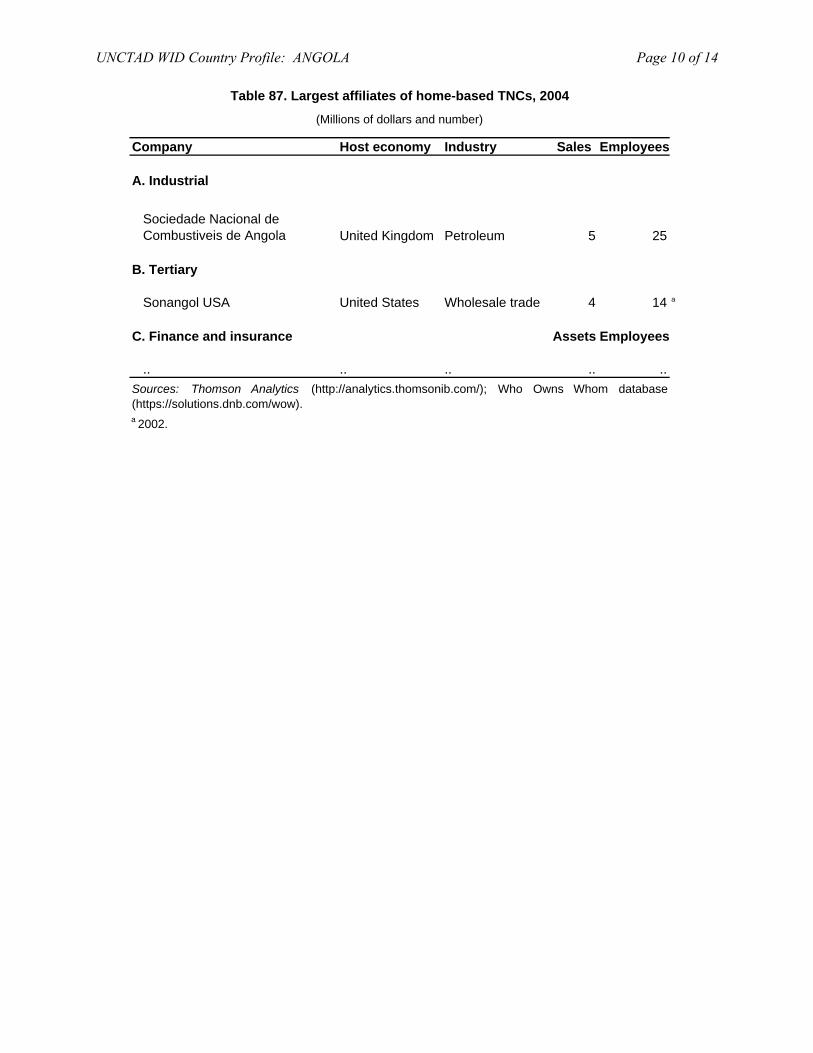
Table 87. Largest affiliates of home-based TNCs, 2004
(Millions of dollars and number)
Company Host economy Industry Sales Employees
A. Industrial
Sociedade Nacional de Combustiveis de Angola United Kingdom Petroleum 5 25
B. Tertiary
Sonangol USA United States Wholesale trade 4 14 a
C. Finance and insurance Assets Employees
.. .. .. .. ..
a 2002.
Sources: Thomson Analytics (http://analytics.thomsonib.com/); Who Owns Whom database(https://solutions.dnb.com/wow).
UNCTAD WID Country Profile: ANGOLA Page 10 of 14
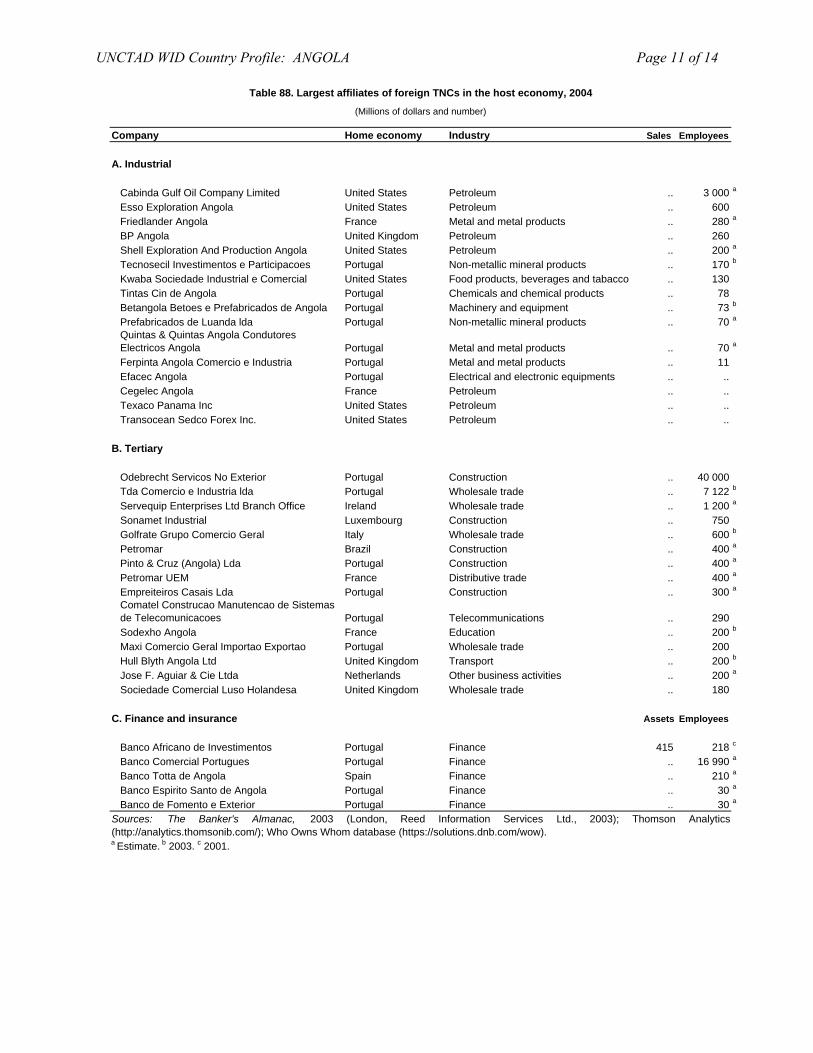
Table 88. Largest affiliates of foreign TNCs in the host economy, 2004
(Millions of dollars and number)
Company Home economy Industry Sales Employees
A. Industrial
Cabinda Gulf Oil Company Limited United States Petroleum .. 3 000 a
Esso Exploration Angola United States Petroleum .. 600Friedlander Angola France Metal and metal products .. 280 a
BP Angola United Kingdom Petroleum .. 260Shell Exploration And Production Angola United States Petroleum .. 200 a
Tecnosecil Investimentos e Participacoes Portugal Non-metallic mineral products .. 170 b
Kwaba Sociedade Industrial e Comercial United States Food products, beverages and tabacco .. 130Tintas Cin de Angola Portugal Chemicals and chemical products .. 78Betangola Betoes e Prefabricados de Angola Portugal Machinery and equipment .. 73 b
Prefabricados de Luanda lda Portugal Non-metallic mineral products .. 70 a
Quintas & Quintas Angola Condutores Electricos Angola Portugal Metal and metal products .. 70 a
Ferpinta Angola Comercio e Industria Portugal Metal and metal products .. 11Efacec Angola Portugal Electrical and electronic equipments .. ..Cegelec Angola France Petroleum .. ..Texaco Panama Inc United States Petroleum .. ..Transocean Sedco Forex Inc. United States Petroleum .. ..
B. Tertiary
Odebrecht Servicos No Exterior Portugal Construction .. 40 000Tda Comercio e Industria lda Portugal Wholesale trade .. 7 122 b
Servequip Enterprises Ltd Branch Office Ireland Wholesale trade .. 1 200 a
Sonamet Industrial Luxembourg Construction .. 750Golfrate Grupo Comercio Geral Italy Wholesale trade .. 600 b
Petromar Brazil Construction .. 400 a
Pinto & Cruz (Angola) Lda Portugal Construction .. 400 a
Petromar UEM France Distributive trade .. 400 a
Empreiteiros Casais Lda Portugal Construction .. 300 a
Comatel Construcao Manutencao de Sistemas de Telecomunicacoes Portugal Telecommunications .. 290Sodexho Angola France Education .. 200 b
Maxi Comercio Geral Importao Exportao Portugal Wholesale trade .. 200Hull Blyth Angola Ltd United Kingdom Transport .. 200 b
Jose F. Aguiar & Cie Ltda Netherlands Other business activities .. 200 a
Sociedade Comercial Luso Holandesa United Kingdom Wholesale trade .. 180
C. Finance and insurance Assets Employees
Banco Africano de Investimentos Portugal Finance 415 218 c
Banco Comercial Portugues Portugal Finance .. 16 990 a
Banco Totta de Angola Spain Finance .. 210 a
Banco Espirito Santo de Angola Portugal Finance .. 30 a
Banco de Fomento e Exterior Portugal Finance .. 30 a
a Estimate. b 2003. c 2001.
Sources: The Banker's Almanac, 2003 (London, Reed Information Services Ltd., 2003); Thomson Analytics(http://analytics.thomsonib.com/); Who Owns Whom database (https://solutions.dnb.com/wow).
UNCTAD WID Country Profile: ANGOLA Page 11 of 14
C. Legal frameworks for transnational corporations I. National framework Investors in Angola, particularly of foreign origin, are subject to specific regulations through national, bilateral and multilateral legal instruments. The key regulatory instruments that are applicable to all foreign investors in the country include: Law relative to Oil Activities, Law No. 13/78, 1978. Source: Ministry of Finance, Evaluation of Angolan Petroleum Sector, Executive Summary: Initial Report (http://www.angola.org/referenc/reports/oil_diagnostic_eng.pdf). Decree 30/95 of 1995 related to the regulation of financial flows and currency exchange Source: Ministry of Finance, Evaluation of Angolan Petroleum Sector, Executive Summary: Initial Report (http://www.angola.org/referenc/reports/oil_diagnostic_eng.pdf). The Law of Economic Activities", Law No 10/88, of 2 July 1988. Source: http://209.183.193.172/business/law1394.html Foreign Investment Law No. 15/94 of 23 September 1994, repeals Law 13/1988 of 16 June 1988. Source: Unofficial translation. French Embassy in Luanda (1990), available at: Centre Francais du Commenrce Exterieur – Paris. Republic Of Angola Law On The Bases For Private Investment Law, 2003. Source: http://209.183.193.172/business/Private_invest_law_2003.pdf Industrial Property Law No. 3/92, February 1992. Source: WIPO (http://www.wipo.org). Copyright Law No. 4/90, March 1990. Source: WIPO (http://www.wipo.org). Decree No. 14/88, June 1988, replacing what was formerly: Conselho de Ministros. Decreto No. 180/80 de outubro 1980. Estatuto Orgânico da Secretaria de Estado da Cultura (Artigo 15°, Subsecçao V: Do Instituto Nacional da Propriedade Intelectual). Source: WIPO (http://www.wipo.org). Law of Delimitation of the Sectors of Economic Activity (Law No. 13/94) Source: http://209.183.193.172/business/Private_invest_law_2003.pdf Foreign Exchange Law (Law No. 5/97) Source: http://209.183.193.172/business/Private_invest_law_2003.pdf II. International Framework A. Angola is a party to the following multilateral and regional instruments: Paris Convention for the Protection of Industrial Property of 1883 (Revised at Brussels in 1900, Washington in 1911, The Hague in 1925, London in 1934, Lisbon in 1958 and Stockholm in 1967, and as amended in 1979). Signed in 1994.
UNCTAD WID Country Profile: ANGOLA Page 12 of 14
D. Sources of information Official Banco Nacional de Angola (central bank - www.bna.ao). Foreign investment Office (www.minfin.gv.ao). Secondary Bennell, Paul (1997). "Foreign direct investment in Africa: rhetoric and reality", SAIS Review (Summer/Fall) pp.
127-139.
Bennell, Paul (1997). "Privatization in Sub-Saharan Africa: progress and prospects during the 1990s", World Development, vol. 25, no. 11, pp. 1785-1803.
Business Map (2000). SADC Investor Survey-Complex Terrain (Johannesburg: Business Map), pp. 25-27.
Broll, U. (2003). "Foreign direct investment, credible policy: the role of risk sharing", International trade journal, vol. XVII, No. 2., pp. 165 – 176.
Dahl, J. (2002). "Incentives for foreign direct investments – the case of SADC in the 1990s" (Namibia: NEPRU, Working paper).
Economist Intelligence Unit (EIU) (2002a). Country Profile: Angola (London: EIU Ltd.).
_____________________(2002b). Country Report: Angola (London: EIU Ltd.), April.
_____________________(2005a). Country Profile: Angola (London: EIU Ltd.).
_____________________(2005b). Country Report: Angola (London: EIU Ltd.), April.
Global Witness (2002). "A crude awakening: the role of the oil and banking industries in Angola’s civil war and the plunder of state assets", www.oneworld.org/globalwitness March).
Hodges, Tony (2001). Angola from Afro-Stalinism to Petro-diamond capitalism (James Currey: Indiana University Press).
International Monetary Fund (IMF) (2006). IMF's Sub-Saharan Africa Regional Economic Outlook, March 10, 2006. (Washington D.C.: IMF).
McCormick, Shawn (1994). The Angolan Economy, Prospects for Growth in a Post-War Environment (Washington D.C.: Centre for Strategic and International Studies).
Morisset, J. (2001). "Foreign direct investment in Africa: policies also matter", OECD Global Forum on International Investment (Paris: OECD).
Rosenn, Keith (1997). "Regulation of foreign investment in Angola", Briefing note for consulting assistance on economic reform (CAER II Discussion Paper No. 12).
Soderbom, M. and F. Teal (2004). "Size and Efficiency in Africa Manufacturing firms: Evidence from Firm-Level Panel Data." Journal of Development Economics, 73. pp 369 - 394.
United Nations Conference on Trade and Development (UNCTAD) (2002). FDI in Least Developed Countries at a Glance (Geneva: UNCTAD) (www.unctad.org/en/subsites/dite/LDCs/ pdfs/Countries/benin.pdf).
__________________(2005a). Investor-Disputes Arising from Investment Treaties: A Review. UNCTAD
Series of International Investment Policies for Development (UNCTAD/ITE/IIT/2005/4). __________________(2005b). A Survey of Support by Investment Promotion Agencies to Linkages,
Advisory Studies No. 18 (UNCTAD/ITE/IPC/2005/12).
UNCTAD WID Country Profile: ANGOLA Page 13 of 14

___________________(2005c). FDI in least developed countries at a glance: 2005/2006
(UNCTAD/ITE/IIA/2005/17). United States Trade Representative (2006). 2006 Comprehensive Report on U.S. Trade and Investment Policy
Toward Sub-Saharan Africa and Implementation of the Africa Growth and Opportunity Act: The Sixth of Eight Annual Reports, May 2006. (Washington D.C.: US Government).
World Bank (2003). "Transitional support strategy for the Republic of Angola" (Washington D.C.: World
Bank).
UNCTAD WID Country Profile: ANGOLA Page 14 of 14