Embed Size (px)
Citation preview
1
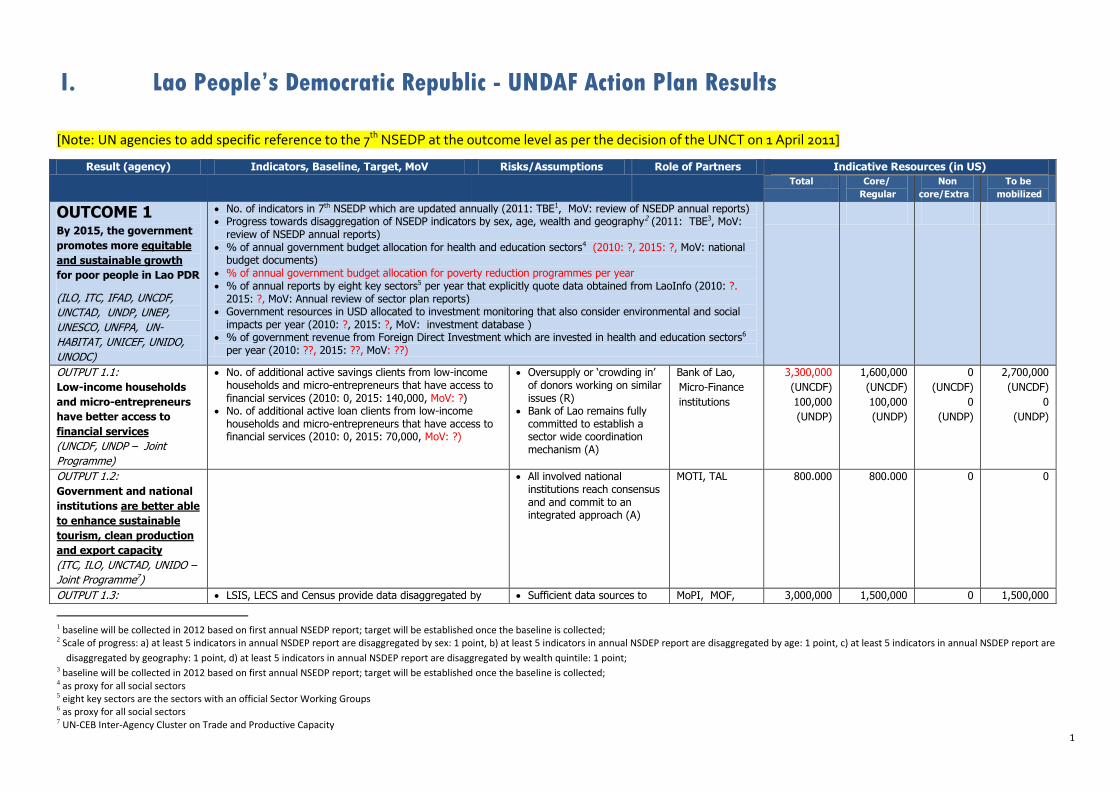
I. Lao People’s Democratic Republic - UNDAF Action Plan Results
[Note: UN agencies to add specific reference to the 7th NSEDP at the outcome level as per the decision of the UNCT on 1 April 2011]
1 baseline will be collected in 2012 based on first annual NSEDP report; target will be established once the baseline is collected; 2 Scale of progress: a) at least 5 indicators in annual NSDEP report are disaggregated by sex: 1 point, b) at least 5 indicators in annual NSDEP report are disaggregated by age: 1 point, c) at least 5 indicators in annual NSDEP report are
disaggregated by geography: 1 point, d) at least 5 indicators in annual NSDEP report are disaggregated by wealth quintile: 1 point; 3 baseline will be collected in 2012 based on first annual NSEDP report; target will be established once the baseline is collected; 4 as proxy for all social sectors 5 eight key sectors are the sectors with an official Sector Working Groups 6 as proxy for all social sectors 7 UN-CEB Inter-Agency Cluster on Trade and Productive Capacity
Result (agency) Indicators, Baseline, Target, MoV Risks/Assumptions Role of Partners Indicative Resources (in US)
Total Core/
Regular
Non
core/Extra
To be
mobilized
OUTCOME 1
By 2015, the government
promotes more equitable
and sustainable growth
for poor people in Lao PDR
(ILO, ITC, IFAD, UNCDF,
UNCTAD, UNDP, UNEP,
UNESCO, UNFPA, UN-
HABITAT, UNICEF, UNIDO,
UNODC)
No. of indicators in 7th NSEDP which are updated annually (2011: TBE1, MoV: review of NSEDP annual reports) Progress towards disaggregation of NSEDP indicators by sex, age, wealth and geography2 (2011: TBE3, MoV:
review of NSEDP annual reports) % of annual government budget allocation for health and education sectors4 (2010: ?, 2015: ?, MoV: national
budget documents) % of annual government budget allocation for poverty reduction programmes per year % of annual reports by eight key sectors5 per year that explicitly quote data obtained from LaoInfo (2010: ?.
2015: ?, MoV: Annual review of sector plan reports) Government resources in USD allocated to investment monitoring that also consider environmental and social
impacts per year (2010: ?, 2015: ?, MoV: investment database ) % of government revenue from Foreign Direct Investment which are invested in health and education sectors6
per year (2010: ??, 2015: ??, MoV: ??)
OUTPUT 1.1:
Low-income households
and micro-entrepreneurs
have better access to
financial services
(UNCDF, UNDP – Joint
Programme)
No. of additional active savings clients from low-income households and micro-entrepreneurs that have access to financial services (2010: 0, 2015: 140,000, MoV: ?)
No. of additional active loan clients from low-income households and micro-entrepreneurs that have access to financial services (2010: 0, 2015: 70,000, MoV: ?)
Oversupply or „crowding in‟ of donors working on similar issues (R)
Bank of Lao remains fully committed to establish a sector wide coordination mechanism (A)
Bank of Lao,
Micro-Finance
institutions
3,300,000
(UNCDF)
100,000
(UNDP)
1,600,000
(UNCDF)
100,000
(UNDP)
0
(UNCDF)
0
(UNDP)
2,700,000
(UNCDF)
0
(UNDP)
OUTPUT 1.2:
Government and national
institutions are better able
to enhance sustainable
tourism, clean production
and export capacity
(ITC, ILO, UNCTAD, UNIDO –
Joint Programme7)
All involved national institutions reach consensus and and commit to an integrated approach (A)
MOTI, TAL 800.000 800.000 0 0
OUTPUT 1.3: LSIS, LECS and Census provide data disaggregated by Sufficient data sources to MoPI, MOF, 3,000,000 1,500,000 0 1,500,000
2
8 not a joint programme, but close coordination
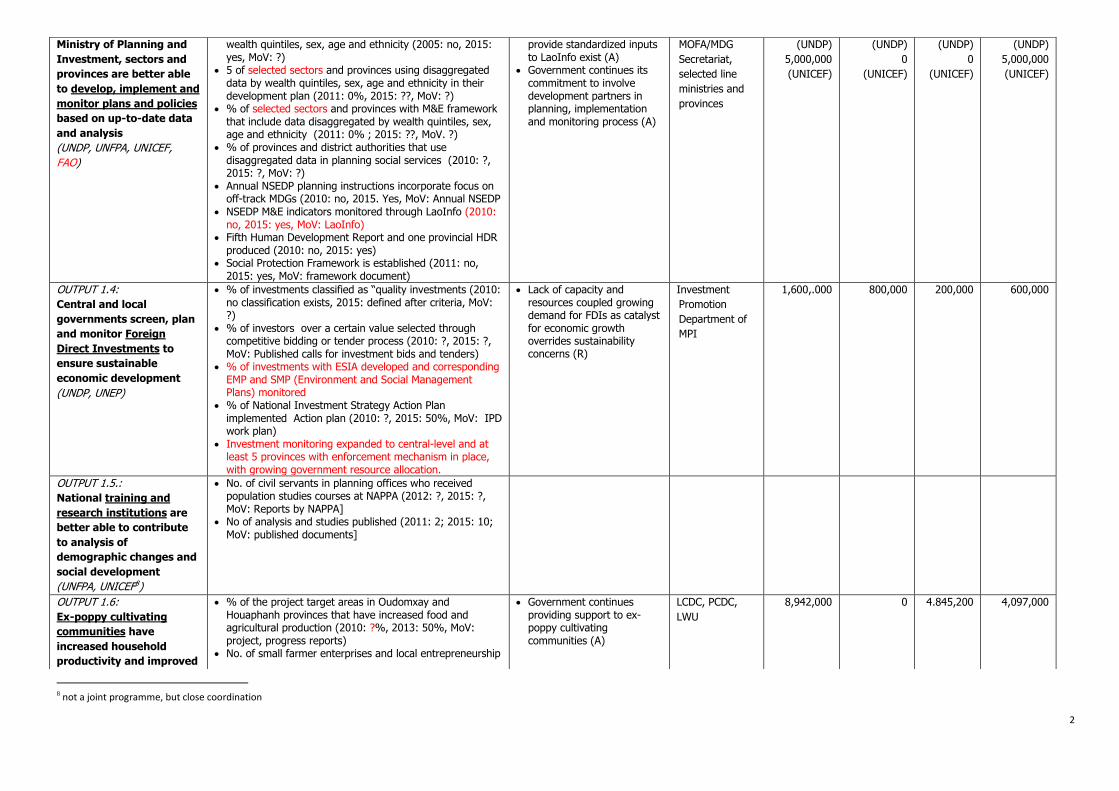
Ministry of Planning and
Investment, sectors and
provinces are better able
to develop, implement and
monitor plans and policies
based on up-to-date data
and analysis
(UNDP, UNFPA, UNICEF,
FAO)
wealth quintiles, sex, age and ethnicity (2005: no, 2015: yes, MoV: ?)
5 of selected sectors and provinces using disaggregated data by wealth quintiles, sex, age and ethnicity in their development plan (2011: 0%, 2015: ??, MoV: ?)
% of selected sectors and provinces with M&E framework that include data disaggregated by wealth quintiles, sex, age and ethnicity (2011: 0% ; 2015: ??, MoV. ?)
% of provinces and district authorities that use disaggregated data in planning social services (2010: ?, 2015: ?, MoV: ?)
Annual NSEDP planning instructions incorporate focus on off-track MDGs (2010: no, 2015. Yes, MoV: Annual NSEDP
NSEDP M&E indicators monitored through LaoInfo (2010: no, 2015: yes, MoV: LaoInfo)
Fifth Human Development Report and one provincial HDR produced (2010: no, 2015: yes)
Social Protection Framework is established (2011: no, 2015: yes, MoV: framework document)
provide standardized inputs to LaoInfo exist (A)
Government continues its commitment to involve development partners in planning, implementation and monitoring process (A)
MOFA/MDG
Secretariat,
selected line
ministries and
provinces
(UNDP)
5,000,000
(UNICEF)
(UNDP)
0
(UNICEF)
(UNDP)
0
(UNICEF)
(UNDP)
5,000,000
(UNICEF)
OUTPUT 1.4:
Central and local
governments screen, plan
and monitor Foreign
Direct Investments to
ensure sustainable
economic development
(UNDP, UNEP)
% of investments classified as “quality investments (2010: no classification exists, 2015: defined after criteria, MoV: ?)
% of investors over a certain value selected through competitive bidding or tender process (2010: ?, 2015: ?, MoV: Published calls for investment bids and tenders)
% of investments with ESIA developed and corresponding EMP and SMP (Environment and Social Management Plans) monitored
% of National Investment Strategy Action Plan implemented Action plan (2010: ?, 2015: 50%, MoV: IPD work plan)
Investment monitoring expanded to central-level and at least 5 provinces with enforcement mechanism in place, with growing government resource allocation.
Lack of capacity and resources coupled growing demand for FDIs as catalyst for economic growth overrides sustainability concerns (R)
Investment
Promotion
Department of
MPI
1,600,.000 800,000 200,000 600,000
OUTPUT 1.5.:
National training and
research institutions are
better able to contribute
to analysis of
demographic changes and
social development
(UNFPA, UNICEF8)
No. of civil servants in planning offices who received population studies courses at NAPPA (2012: ?, 2015: ?, MoV: Reports by NAPPA]
No of analysis and studies published (2011: 2; 2015: 10; MoV: published documents]
OUTPUT 1.6:
Ex-poppy cultivating
communities have
increased household
productivity and improved
% of the project target areas in Oudomxay and Houaphanh provinces that have increased food and agricultural production (2010: ?%, 2013: 50%, MoV: project, progress reports)
No. of small farmer enterprises and local entrepreneurship
Government continues providing support to ex-poppy cultivating communities (A)
LCDC, PCDC,
LWU
8,942,000 0 4.845,200 4,097,000
3
9 the Drug Control Master Plan include nine subject matter pillars, not only inclusive and sustainable economic development for ex-poppy cultivating communities, but also criminal justice responses to drug trafficking, and drug demand
reduction and rehabilitation. This output focuses primarily on support to inter-agency coordination on implementation of the overall Master Plan. 10 0=no interpretation guideline or draft amendment to any law; 1= interpretation guidelines or draft amendment to any one of the three laws; 2=guidelines or draft amendment to two of the three laws; 3=guidelines or draft
amendment to all the three laws 11 including implementation of rural employment programme at the local level and skills standard upgrade in construction, touris and automotive sectors
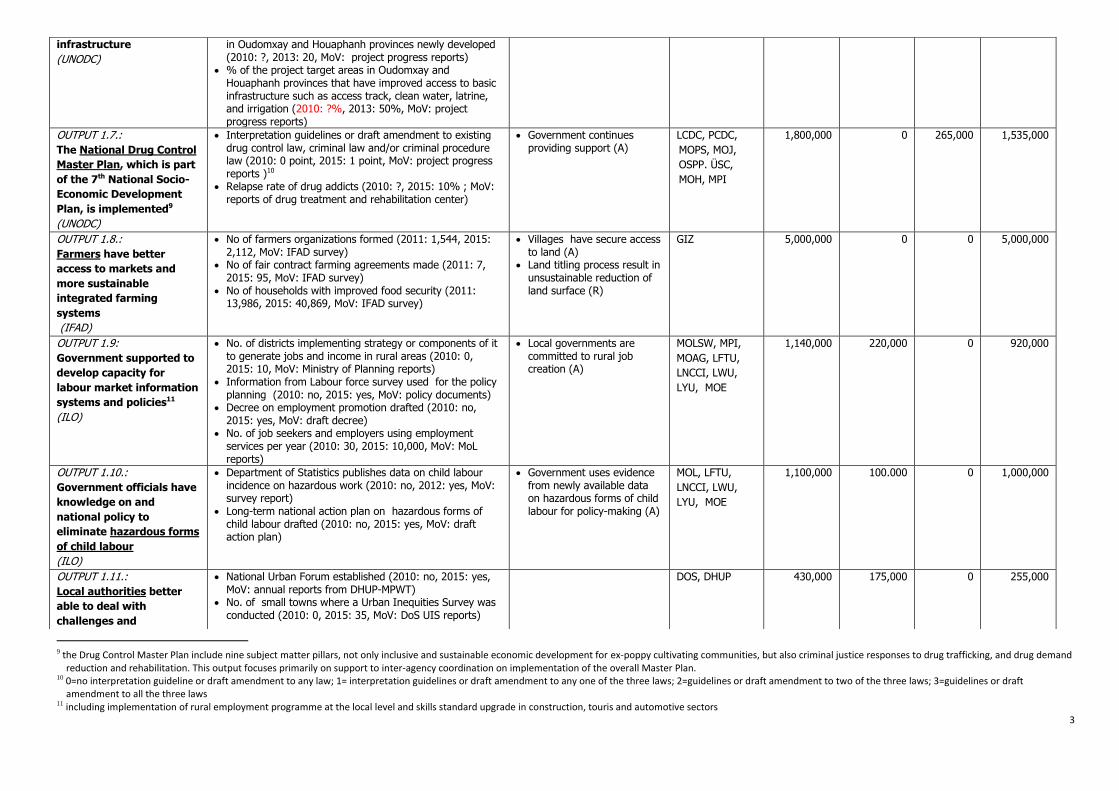
infrastructure
(UNODC)
in Oudomxay and Houaphanh provinces newly developed (2010: ?, 2013: 20, MoV: project progress reports)
% of the project target areas in Oudomxay and Houaphanh provinces that have improved access to basic infrastructure such as access track, clean water, latrine, and irrigation (2010: ?%, 2013: 50%, MoV: project progress reports)
OUTPUT 1.7.:
The National Drug Control
Master Plan, which is part
of the 7th National Socio-
Economic Development
Plan, is implemented9
(UNODC)
Interpretation guidelines or draft amendment to existing drug control law, criminal law and/or criminal procedure law (2010: 0 point, 2015: 1 point, MoV: project progress reports )10
Relapse rate of drug addicts (2010: ?, 2015: 10% ; MoV: reports of drug treatment and rehabilitation center)
Government continues providing support (A)
LCDC, PCDC,
MOPS, MOJ,
OSPP. ÜSC,
MOH, MPI
1,800,000
0 265,000 1,535,000
OUTPUT 1.8.:
Farmers have better
access to markets and
more sustainable
integrated farming
systems
(IFAD)
No of farmers organizations formed (2011: 1,544, 2015: 2,112, MoV: IFAD survey)
No of fair contract farming agreements made (2011: 7, 2015: 95, MoV: IFAD survey)
No of households with improved food security (2011: 13,986, 2015: 40,869, MoV: IFAD survey)
Villages have secure access to land (A)
Land titling process result in unsustainable reduction of land surface (R)
GIZ 5,000,000
0 0 5,000,000
OUTPUT 1.9:
Government supported to
develop capacity for
labour market information
systems and policies11
(ILO)
No. of districts implementing strategy or components of it to generate jobs and income in rural areas (2010: 0, 2015: 10, MoV: Ministry of Planning reports)
Information from Labour force survey used for the policy planning (2010: no, 2015: yes, MoV: policy documents)
Decree on employment promotion drafted (2010: no, 2015: yes, MoV: draft decree)
No. of job seekers and employers using employment services per year (2010: 30, 2015: 10,000, MoV: MoL reports)
Local governments are committed to rural job creation (A)
MOLSW, MPI,
MOAG, LFTU,
LNCCI, LWU,
LYU, MOE
1,140,000 220,000 0 920,000
OUTPUT 1.10.:
Government officials have
knowledge on and
national policy to
eliminate hazardous forms
of child labour
(ILO)
Department of Statistics publishes data on child labour incidence on hazardous work (2010: no, 2012: yes, MoV: survey report)
Long-term national action plan on hazardous forms of child labour drafted (2010: no, 2015: yes, MoV: draft action plan)
Government uses evidence from newly available data on hazardous forms of child labour for policy-making (A)
MOL, LFTU,
LNCCI, LWU,
LYU, MOE
1,100,000 100.000 0 1,000,000
OUTPUT 1.11.:
Local authorities better
able to deal with
challenges and
National Urban Forum established (2010: no, 2015: yes, MoV: annual reports from DHUP-MPWT)
No. of small towns where a Urban Inequities Survey was conducted (2010: 0, 2015: 35, MoV: DoS UIS reports)
DOS, DHUP 430,000 175,000 0 255,000
4
12 Sector Working Group mechanism included where agency support exists
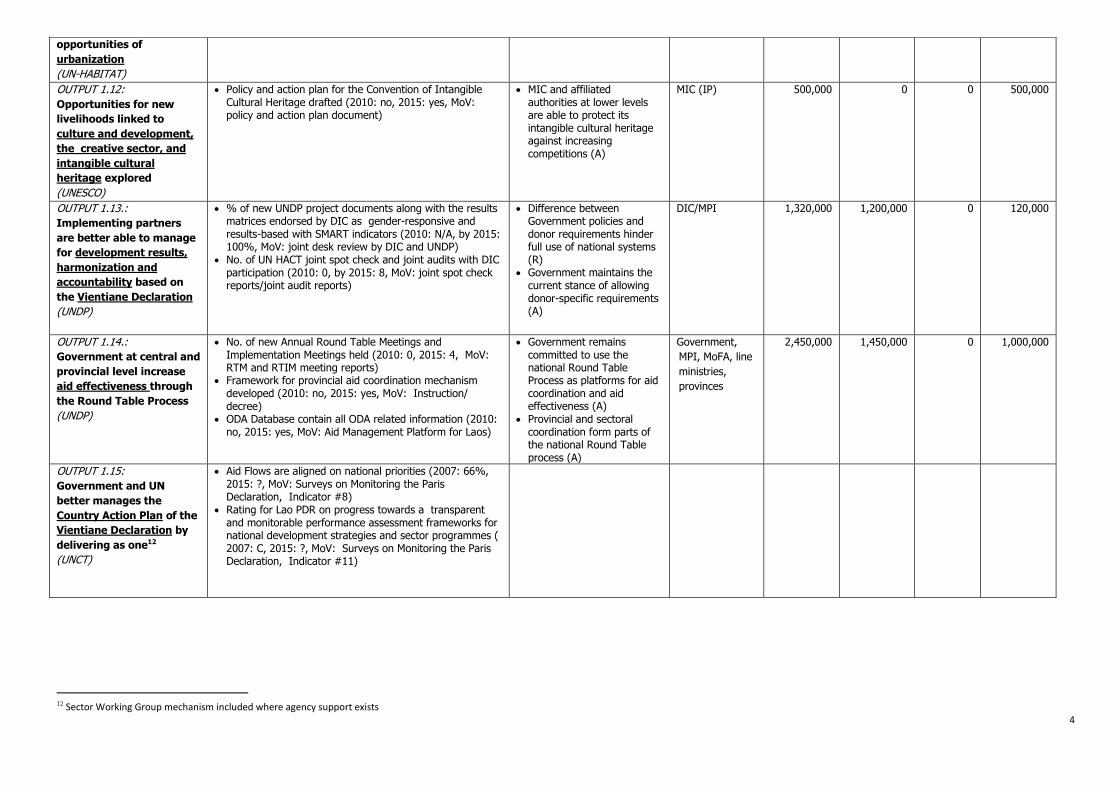
opportunities of
urbanization
(UN-HABITAT)
OUTPUT 1.12:
Opportunities for new
livelihoods linked to
culture and development,
the creative sector, and
intangible cultural
heritage explored
(UNESCO)
Policy and action plan for the Convention of Intangible Cultural Heritage drafted (2010: no, 2015: yes, MoV: policy and action plan document)
MIC and affiliated authorities at lower levels are able to protect its intangible cultural heritage against increasing competitions (A)
MIC (IP) 500,000 0 0 500,000
OUTPUT 1.13.:
Implementing partners
are better able to manage
for development results,
harmonization and
accountability based on
the Vientiane Declaration
(UNDP)
% of new UNDP project documents along with the results matrices endorsed by DIC as gender-responsive and results-based with SMART indicators (2010: N/A, by 2015: 100%, MoV: joint desk review by DIC and UNDP)
No. of UN HACT joint spot check and joint audits with DIC participation (2010: 0, by 2015: 8, MoV: joint spot check reports/joint audit reports)
Difference between Government policies and donor requirements hinder full use of national systems (R)
Government maintains the current stance of allowing donor-specific requirements (A)
DIC/MPI
1,320,000 1,200,000 0 120,000
OUTPUT 1.14.:
Government at central and
provincial level increase
aid effectiveness through
the Round Table Process
(UNDP)
No. of new Annual Round Table Meetings and Implementation Meetings held (2010: 0, 2015: 4, MoV: RTM and RTIM meeting reports)
Framework for provincial aid coordination mechanism developed (2010: no, 2015: yes, MoV: Instruction/ decree)
ODA Database contain all ODA related information (2010: no, 2015: yes, MoV: Aid Management Platform for Laos)
Government remains committed to use the national Round Table Process as platforms for aid coordination and aid effectiveness (A)
Provincial and sectoral coordination form parts of the national Round Table process (A)
Government,
MPI, MoFA, line
ministries,
provinces
2,450,000 1,450,000 0 1,000,000
OUTPUT 1.15:
Government and UN
better manages the
Country Action Plan of the
Vientiane Declaration by
delivering as one12
(UNCT)
Aid Flows are aligned on national priorities (2007: 66%, 2015: ?, MoV: Surveys on Monitoring the Paris Declaration, Indicator #8)
Rating for Lao PDR on progress towards a transparent and monitorable performance assessment frameworks for national development strategies and sector programmes ( 2007: C, 2015: ?, MoV: Surveys on Monitoring the Paris Declaration, Indicator #11)
5
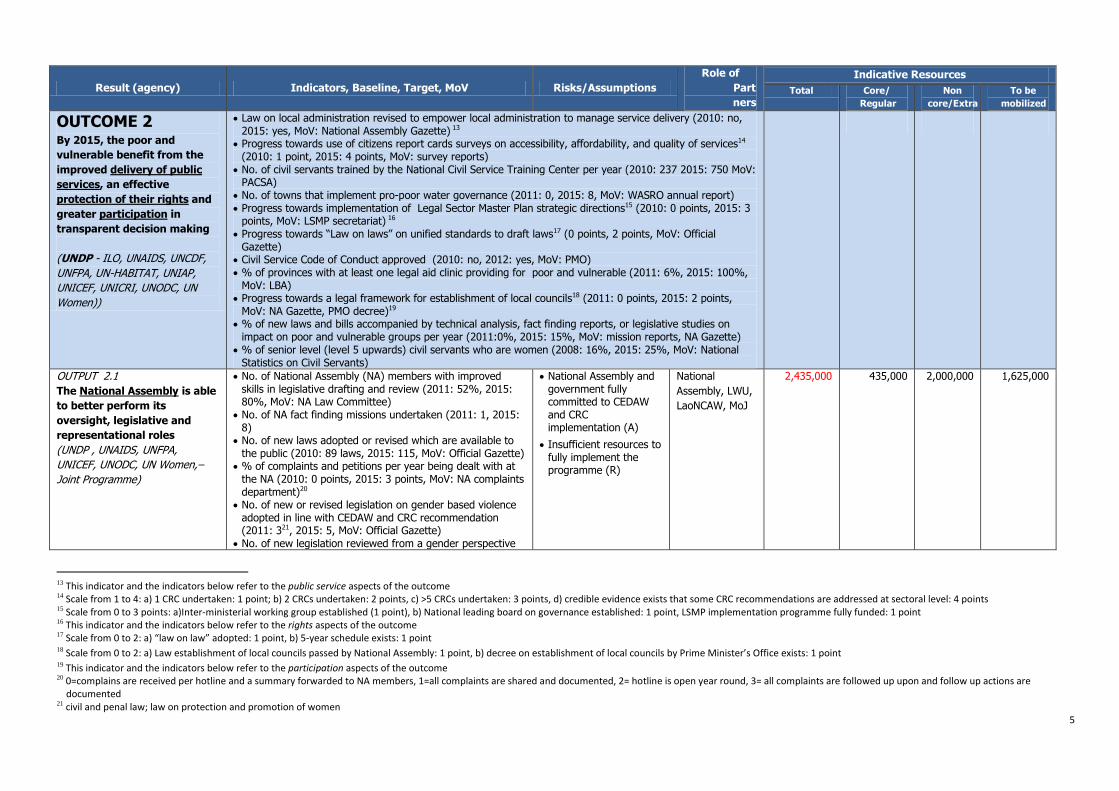
Result (agency) Indicators, Baseline, Target, MoV Risks/Assumptions
Role of
Part
ners
Indicative Resources
Total Core/
Regular Non
core/Extra To be
mobilized
OUTCOME 2 By 2015, the poor and
vulnerable benefit from the
improved delivery of public
services, an effective
protection of their rights and
greater participation in
transparent decision making
(UNDP - ILO, UNAIDS, UNCDF,
UNFPA, UN-HABITAT, UNIAP,
UNICEF, UNICRI, UNODC, UN
Women))
Law on local administration revised to empower local administration to manage service delivery (2010: no, 2015: yes, MoV: National Assembly Gazette) 13
Progress towards use of citizens report cards surveys on accessibility, affordability, and quality of services14 (2010: 1 point, 2015: 4 points, MoV: survey reports)
No. of civil servants trained by the National Civil Service Training Center per year (2010: 237 2015: 750 MoV: PACSA)
No. of towns that implement pro-poor water governance (2011: 0, 2015: 8, MoV: WASRO annual report)
Progress towards implementation of Legal Sector Master Plan strategic directions15 (2010: 0 points, 2015: 3 points, MoV: LSMP secretariat) 16
Progress towards “Law on laws” on unified standards to draft laws17 (0 points, 2 points, MoV: Official Gazette)
Civil Service Code of Conduct approved (2010: no, 2012: yes, MoV: PMO) % of provinces with at least one legal aid clinic providing for poor and vulnerable (2011: 6%, 2015: 100%,
MoV: LBA) Progress towards a legal framework for establishment of local councils18 (2011: 0 points, 2015: 2 points,
MoV: NA Gazette, PMO decree)19 % of new laws and bills accompanied by technical analysis, fact finding reports, or legislative studies on
impact on poor and vulnerable groups per year (2011:0%, 2015: 15%, MoV: mission reports, NA Gazette) % of senior level (level 5 upwards) civil servants who are women (2008: 16%, 2015: 25%, MoV: National
Statistics on Civil Servants)
OUTPUT 2.1
The National Assembly is able
to better perform its
oversight, legislative and
representational roles
(UNDP , UNAIDS, UNFPA,
UNICEF, UNODC, UN Women,–
Joint Programme)
No. of National Assembly (NA) members with improved skills in legislative drafting and review (2011: 52%, 2015: 80%, MoV: NA Law Committee)
No. of NA fact finding missions undertaken (2011: 1, 2015: 8)
No. of new laws adopted or revised which are available to the public (2010: 89 laws, 2015: 115, MoV: Official Gazette)
% of complaints and petitions per year being dealt with at the NA (2010: 0 points, 2015: 3 points, MoV: NA complaints department)20
No. of new or revised legislation on gender based violence adopted in line with CEDAW and CRC recommendation (2011: 321, 2015: 5, MoV: Official Gazette)
No. of new legislation reviewed from a gender perspective
National Assembly and government fully committed to CEDAW and CRC implementation (A)
Insufficient resources to fully implement the programme (R)
National
Assembly, LWU,
LaoNCAW, MoJ
2,435,000 435,000 2,000,000 1,625,000
13 This indicator and the indicators below refer to the public service aspects of the outcome 14 Scale from 1 to 4: a) 1 CRC undertaken: 1 point; b) 2 CRCs undertaken: 2 points, c) >5 CRCs undertaken: 3 points, d) credible evidence exists that some CRC recommendations are addressed at sectoral level: 4 points 15 Scale from 0 to 3 points: a)Inter-ministerial working group established (1 point), b) National leading board on governance established: 1 point, LSMP implementation programme fully funded: 1 point 16 This indicator and the indicators below refer to the rights aspects of the outcome 17 Scale from 0 to 2: a) “law on law” adopted: 1 point, b) 5-year schedule exists: 1 point 18 Scale from 0 to 2: a) Law establishment of local councils passed by National Assembly: 1 point, b) decree on establishment of local councils by Prime Minister’s Office exists: 1 point 19 This indicator and the indicators below refer to the participation aspects of the outcome 20 0=complains are received per hotline and a summary forwarded to NA members, 1=all complaints are shared and documented, 2= hotline is open year round, 3= all complaints are followed up upon and follow up actions are
documented 21 civil and penal law; law on protection and promotion of women
6
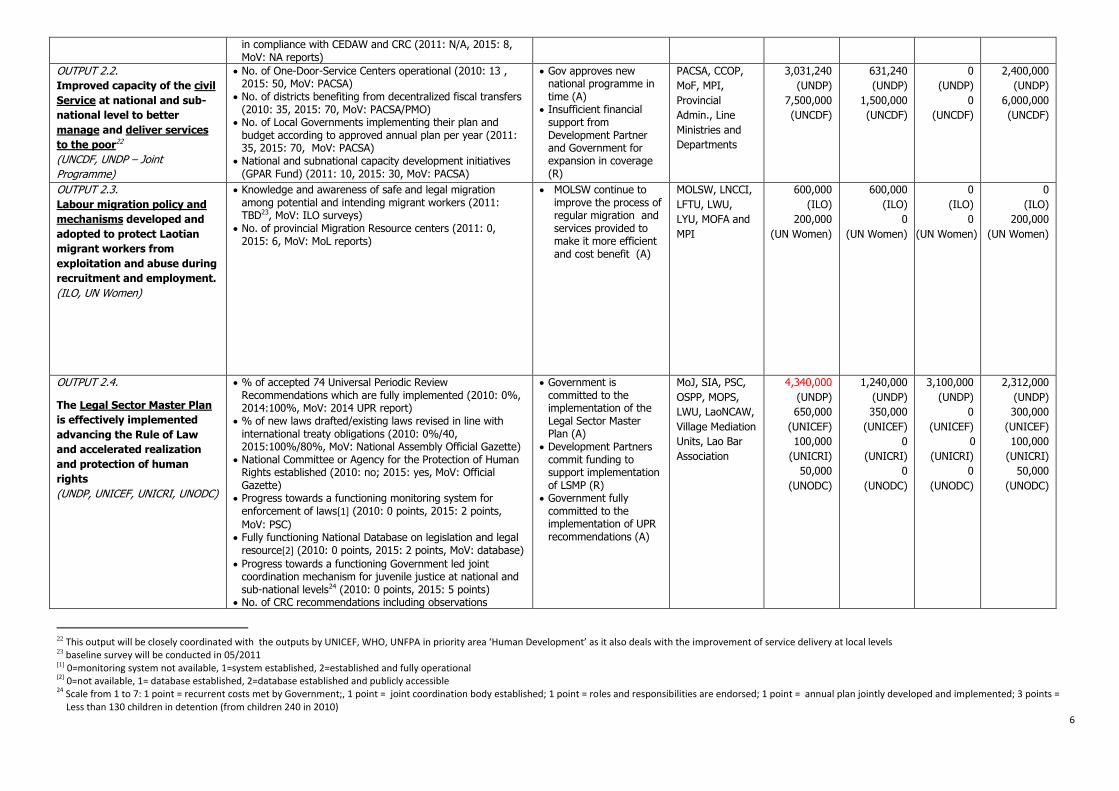
in compliance with CEDAW and CRC (2011: N/A, 2015: 8, MoV: NA reports)
OUTPUT 2.2.
Improved capacity of the civil
Service at national and sub-
national level to better
manage and deliver services
to the poor22
(UNCDF, UNDP – Joint
Programme)
No. of One-Door-Service Centers operational (2010: 13 , 2015: 50, MoV: PACSA)
No. of districts benefiting from decentralized fiscal transfers (2010: 35, 2015: 70, MoV: PACSA/PMO)
No. of Local Governments implementing their plan and budget according to approved annual plan per year (2011: 35, 2015: 70, MoV: PACSA)
National and subnational capacity development initiatives (GPAR Fund) (2011: 10, 2015: 30, MoV: PACSA)
Gov approves new national programme in time (A)
Insufficient financial support from Development Partner and Government for expansion in coverage (R)
PACSA, CCOP,
MoF, MPI,
Provincial
Admin., Line
Ministries and
Departments
3,031,240
(UNDP)
7,500,000
(UNCDF)
631,240
(UNDP)
1,500,000
(UNCDF)
0
(UNDP)
0
(UNCDF)
2,400,000
(UNDP)
6,000,000
(UNCDF)
OUTPUT 2.3.
Labour migration policy and
mechanisms developed and
adopted to protect Laotian
migrant workers from
exploitation and abuse during
recruitment and employment.
(ILO, UN Women)
Knowledge and awareness of safe and legal migration among potential and intending migrant workers (2011: TBD23, MoV: ILO surveys)
No. of provincial Migration Resource centers (2011: 0, 2015: 6, MoV: MoL reports)
MOLSW continue to improve the process of regular migration and services provided to make it more efficient and cost benefit (A)
MOLSW, LNCCI,
LFTU, LWU,
LYU, MOFA and
MPI
600,000
(ILO)
200,000
(UN Women)
600,000
(ILO)
0
(UN Women)
0
(ILO)
0
(UN Women)
0
(ILO)
200,000
(UN Women)
OUTPUT 2.4.
The Legal Sector Master Plan
is effectively implemented
advancing the Rule of Law
and accelerated realization
and protection of human
rights (UNDP, UNICEF, UNICRI, UNODC)
% of accepted 74 Universal Periodic Review Recommendations which are fully implemented (2010: 0%, 2014:100%, MoV: 2014 UPR report)
% of new laws drafted/existing laws revised in line with international treaty obligations (2010: 0%/40, 2015:100%/80%, MoV: National Assembly Official Gazette)
National Committee or Agency for the Protection of Human Rights established (2010: no; 2015: yes, MoV: Official Gazette)
Progress towards a functioning monitoring system for enforcement of laws[1] (2010: 0 points, 2015: 2 points,
MoV: PSC) Fully functioning National Database on legislation and legal
resource[2] (2010: 0 points, 2015: 2 points, MoV: database)
Progress towards a functioning Government led joint coordination mechanism for juvenile justice at national and sub-national levels24 (2010: 0 points, 2015: 5 points)
No. of CRC recommendations including observations
Government is committed to the implementation of the Legal Sector Master Plan (A)
Development Partners commit funding to support implementation of LSMP (R)
Government fully committed to the implementation of UPR recommendations (A)
MoJ, SIA, PSC,
OSPP, MOPS,
LWU, LaoNCAW,
Village Mediation
Units, Lao Bar
Association
4,340,000
(UNDP)
650,000
(UNICEF)
100,000
(UNICRI)
50,000
(UNODC)
1,240,000
(UNDP)
350,000
(UNICEF)
0
(UNICRI)
0
(UNODC)
3,100,000
(UNDP)
0
(UNICEF)
0
(UNICRI)
0
(UNODC)
2,312,000
(UNDP)
300,000
(UNICEF)
100,000
(UNICRI)
50,000
(UNODC)
22 This output will be closely coordinated with the outputs by UNICEF, WHO, UNFPA in priority area ‘Human Development’ as it also deals with the improvement of service delivery at local levels 23 baseline survey will be conducted in 05/2011 [1] 0=monitoring system not available, 1=system established, 2=established and fully operational [2] 0=not available, 1= database established, 2=database established and publicly accessible 24 Scale from 1 to 7: 1 point = recurrent costs met by Government;, 1 point = joint coordination body established; 1 point = roles and responsibilities are endorsed; 1 point = annual plan jointly developed and implemented; 3 points =
Less than 130 children in detention (from children 240 in 2010)
7
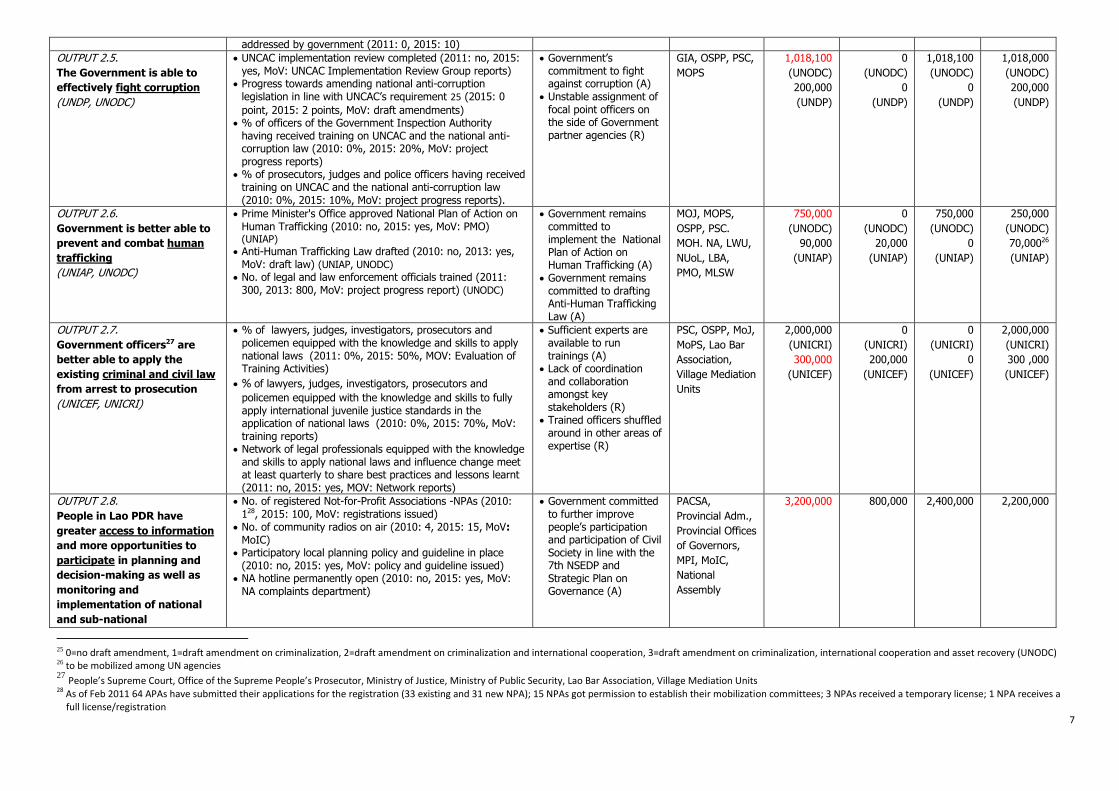
addressed by government (2011: 0, 2015: 10)
OUTPUT 2.5.
The Government is able to
effectively fight corruption
(UNDP, UNODC)
UNCAC implementation review completed (2011: no, 2015: yes, MoV: UNCAC Implementation Review Group reports)
Progress towards amending national anti-corruption legislation in line with UNCAC‟s requirement 25 (2015: 0
point, 2015: 2 points, MoV: draft amendments) % of officers of the Government Inspection Authority
having received training on UNCAC and the national anti-corruption law (2010: 0%, 2015: 20%, MoV: project progress reports)
% of prosecutors, judges and police officers having received training on UNCAC and the national anti-corruption law (2010: 0%, 2015: 10%, MoV: project progress reports).
Government‟s commitment to fight against corruption (A)
Unstable assignment of focal point officers on the side of Government partner agencies (R)
GIA, OSPP, PSC,
MOPS 1,018,100
(UNODC)
200,000
(UNDP)
0
(UNODC)
0
(UNDP)
1,018,100
(UNODC)
0
(UNDP)
1,018,000
(UNODC)
200,000
(UNDP)
OUTPUT 2.6.
Government is better able to
prevent and combat human
trafficking
(UNIAP, UNODC)
Prime Minister's Office approved National Plan of Action on Human Trafficking (2010: no, 2015: yes, MoV: PMO) (UNIAP)
Anti-Human Trafficking Law drafted (2010: no, 2013: yes, MoV: draft law) (UNIAP, UNODC)
No. of legal and law enforcement officials trained (2011: 300, 2013: 800, MoV: project progress report) (UNODC)
Government remains committed to implement the National Plan of Action on Human Trafficking (A)
Government remains committed to drafting Anti-Human Trafficking Law (A)
MOJ, MOPS,
OSPP, PSC.
MOH. NA, LWU,
NUoL, LBA,
PMO, MLSW
750,000
(UNODC)
90,000
(UNIAP)
0
(UNODC)
20,000
(UNIAP)
750,000
(UNODC)
0
(UNIAP)
250,000
(UNODC)
70,00026
(UNIAP)
OUTPUT 2.7.
Government officers27 are
better able to apply the
existing criminal and civil law
from arrest to prosecution
(UNICEF, UNICRI)
% of lawyers, judges, investigators, prosecutors and policemen equipped with the knowledge and skills to apply national laws (2011: 0%, 2015: 50%, MOV: Evaluation of Training Activities)
% of lawyers, judges, investigators, prosecutors and
policemen equipped with the knowledge and skills to fully apply international juvenile justice standards in the application of national laws (2010: 0%, 2015: 70%, MoV: training reports)
Network of legal professionals equipped with the knowledge and skills to apply national laws and influence change meet at least quarterly to share best practices and lessons learnt (2011: no, 2015: yes, MOV: Network reports)
Sufficient experts are available to run trainings (A)
Lack of coordination and collaboration amongst key stakeholders (R)
Trained officers shuffled around in other areas of expertise (R)
PSC, OSPP, MoJ,
MoPS, Lao Bar
Association,
Village Mediation
Units
2,000,000
(UNICRI)
300,000
(UNICEF)
0
(UNICRI)
200,000
(UNICEF)
0
(UNICRI)
0
(UNICEF)
2,000,000
(UNICRI)
300 ,000
(UNICEF)
OUTPUT 2.8.
People in Lao PDR have
greater access to information
and more opportunities to
participate in planning and
decision-making as well as
monitoring and
implementation of national
and sub-national
No. of registered Not-for-Profit Associations -NPAs (2010: 128, 2015: 100, MoV: registrations issued)
No. of community radios on air (2010: 4, 2015: 15, MoV: MoIC)
Participatory local planning policy and guideline in place (2010: no, 2015: yes, MoV: policy and guideline issued)
NA hotline permanently open (2010: no, 2015: yes, MoV: NA complaints department)
Government committed to further improve people‟s participation and participation of Civil Society in line with the 7th NSEDP and Strategic Plan on Governance (A)
PACSA,
Provincial Adm.,
Provincial Offices
of Governors,
MPI, MoIC,
National
Assembly
3,200,000 800,000 2,400,000 2,200,000
25 0=no draft amendment, 1=draft amendment on criminalization, 2=draft amendment on criminalization and international cooperation, 3=draft amendment on criminalization, international cooperation and asset recovery (UNODC) 26 to be mobilized among UN agencies 27 People’s Supreme Court, Office of the Supreme People’s Prosecutor, Ministry of Justice, Ministry of Public Security, Lao Bar Association, Village Mediation Units 28 As of Feb 2011 64 APAs have submitted their applications for the registration (33 existing and 31 new NPA); 15 NPAs got permission to establish their mobilization committees; 3 NPAs received a temporary license; 1 NPA receives a
full license/registration
8
development plans
(UNDP)
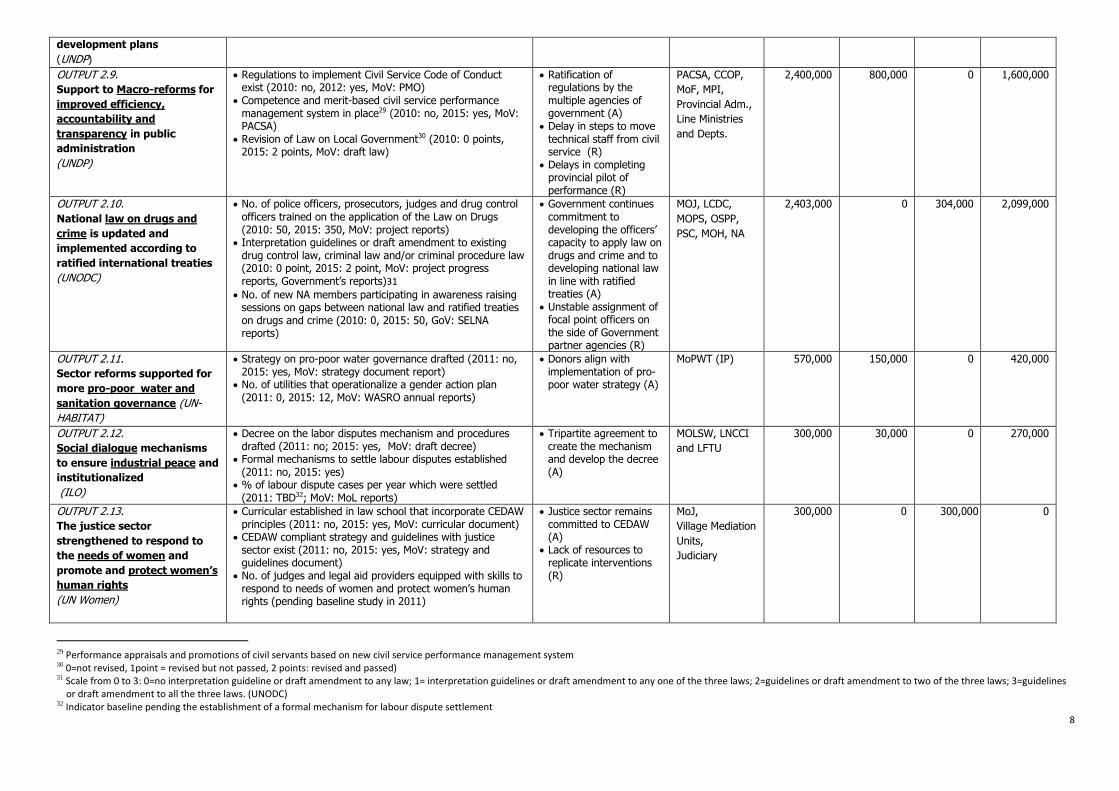
OUTPUT 2.9.
Support to Macro-reforms for
improved efficiency,
accountability and
transparency in public
administration
(UNDP)
Regulations to implement Civil Service Code of Conduct exist (2010: no, 2012: yes, MoV: PMO)
Competence and merit-based civil service performance management system in place29 (2010: no, 2015: yes, MoV: PACSA)
Revision of Law on Local Government30 (2010: 0 points, 2015: 2 points, MoV: draft law)
Ratification of regulations by the multiple agencies of government (A)
Delay in steps to move technical staff from civil service (R)
Delays in completing provincial pilot of performance (R)
PACSA, CCOP,
MoF, MPI,
Provincial Adm.,
Line Ministries
and Depts.
2,400,000 800,000 0 1,600,000
OUTPUT 2.10.
National law on drugs and
crime is updated and
implemented according to
ratified international treaties
(UNODC)
No. of police officers, prosecutors, judges and drug control officers trained on the application of the Law on Drugs (2010: 50, 2015: 350, MoV: project reports)
Interpretation guidelines or draft amendment to existing drug control law, criminal law and/or criminal procedure law (2010: 0 point, 2015: 2 point, MoV: project progress reports, Government‟s reports)31
No. of new NA members participating in awareness raising sessions on gaps between national law and ratified treaties on drugs and crime (2010: 0, 2015: 50, GoV: SELNA reports)
Government continues commitment to developing the officers‟ capacity to apply law on drugs and crime and to developing national law in line with ratified treaties (A)
Unstable assignment of focal point officers on the side of Government partner agencies (R)
MOJ, LCDC,
MOPS, OSPP,
PSC, MOH, NA
2,403,000 0 304,000 2,099,000
OUTPUT 2.11.
Sector reforms supported for
more pro-poor water and
sanitation governance (UN-
HABITAT)
Strategy on pro-poor water governance drafted (2011: no, 2015: yes, MoV: strategy document report)
No. of utilities that operationalize a gender action plan (2011: 0, 2015: 12, MoV: WASRO annual reports)
Donors align with implementation of pro-poor water strategy (A)
MoPWT (IP) 570,000 150,000 0 420,000
OUTPUT 2.12.
Social dialogue mechanisms
to ensure industrial peace and
institutionalized
(ILO)
Decree on the labor disputes mechanism and procedures drafted (2011: no; 2015: yes, MoV: draft decree)
Formal mechanisms to settle labour disputes established (2011: no, 2015: yes)
% of labour dispute cases per year which were settled (2011: TBD32; MoV: MoL reports)
Tripartite agreement to create the mechanism and develop the decree (A)
MOLSW, LNCCI
and LFTU
300,000 30,000 0 270,000
OUTPUT 2.13.
The justice sector
strengthened to respond to
the needs of women and
promote and protect women’s
human rights
(UN Women)
Curricular established in law school that incorporate CEDAW principles (2011: no, 2015: yes, MoV: curricular document)
CEDAW compliant strategy and guidelines with justice sector exist (2011: no, 2015: yes, MoV: strategy and guidelines document)
No. of judges and legal aid providers equipped with skills to respond to needs of women and protect women‟s human rights (pending baseline study in 2011)
Justice sector remains committed to CEDAW (A)
Lack of resources to replicate interventions (R)
MoJ,
Village Mediation
Units,
Judiciary
300,000
0
300,000
0
29 Performance appraisals and promotions of civil servants based on new civil service performance management system 30 0=not revised, 1point = revised but not passed, 2 points: revised and passed) 31 Scale from 0 to 3: 0=no interpretation guideline or draft amendment to any law; 1= interpretation guidelines or draft amendment to any one of the three laws; 2=guidelines or draft amendment to two of the three laws; 3=guidelines
or draft amendment to all the three laws. (UNODC) 32 Indicator baseline pending the establishment of a formal mechanism for labour dispute settlement
9
Result (agency) Indicators, Baseline, Target, MoV Risks/Assumptio
ns
Role of Partners Indicative Resources
Total Core/
Regular
Non
core/Extra
To be
mobilized
10
33 Communities without a school within reasonable walking distance, or with only an 'incomplete' school, offering less than the full five years of primary 34 Areas where net enrolment and primary completion rates for girls are lower than the national average (MOE definition) 35 Lao Social Indicator Survey 36 Education Sector Development Framework 2009-15; Inclusive Education Strategy and Action Plan 2011-2015 (draft); MDG2/3 37 Inclusive Education Strategy and Action Plan 2011-2015 (draft) 38 EFA National Plan of Action 2003-15; Inclusive Education Strategy and Action Plan 2011-2015 (draft) 39 MDG 2/3 40 with focus on most remote and vulnerable populations 41 including in emergency situations
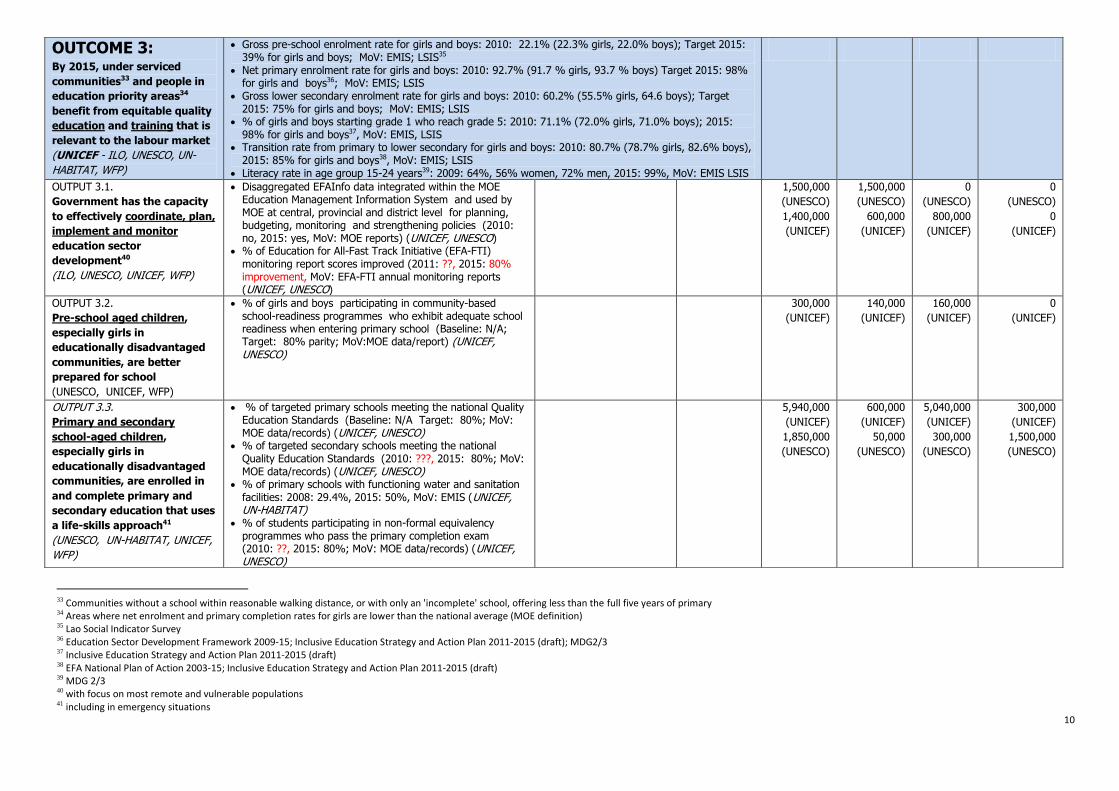
OUTCOME 3: By 2015, under serviced
communities33 and people in
education priority areas34
benefit from equitable quality
education and training that is
relevant to the labour market
(UNICEF - ILO, UNESCO, UN-
HABITAT, WFP)
Gross pre-school enrolment rate for girls and boys: 2010: 22.1% (22.3% girls, 22.0% boys); Target 2015: 39% for girls and boys; MoV: EMIS; LSIS35
Net primary enrolment rate for girls and boys: 2010: 92.7% (91.7 % girls, 93.7 % boys) Target 2015: 98% for girls and boys36; MoV: EMIS; LSIS
Gross lower secondary enrolment rate for girls and boys: 2010: 60.2% (55.5% girls, 64.6 boys); Target 2015: 75% for girls and boys; MoV: EMIS; LSIS
% of girls and boys starting grade 1 who reach grade 5: 2010: 71.1% (72.0% girls, 71.0% boys); 2015: 98% for girls and boys37, MoV: EMIS, LSIS
Transition rate from primary to lower secondary for girls and boys: 2010: 80.7% (78.7% girls, 82.6% boys), 2015: 85% for girls and boys38, MoV: EMIS; LSIS
Literacy rate in age group 15-24 years39: 2009: 64%, 56% women, 72% men, 2015: 99%, MoV: EMIS LSIS
OUTPUT 3.1.
Government has the capacity
to effectively coordinate, plan,
implement and monitor
education sector
development40
(ILO, UNESCO, UNICEF, WFP)
Disaggregated EFAInfo data integrated within the MOE Education Management Information System and used by MOE at central, provincial and district level for planning, budgeting, monitoring and strengthening policies (2010: no, 2015: yes, MoV: MOE reports) (UNICEF, UNESCO)
% of Education for All-Fast Track Initiative (EFA-FTI) monitoring report scores improved (2011: ??, 2015: 80% improvement, MoV: EFA-FTI annual monitoring reports (UNICEF, UNESCO)
1,500,000
(UNESCO)
1,400,000
(UNICEF)
1,500,000
(UNESCO)
600,000
(UNICEF)
0
(UNESCO)
800,000
(UNICEF)
0
(UNESCO)
0
(UNICEF)
OUTPUT 3.2.
Pre-school aged children,
especially girls in
educationally disadvantaged
communities, are better
prepared for school
(UNESCO, UNICEF, WFP)
% of girls and boys participating in community-based school-readiness programmes who exhibit adequate school readiness when entering primary school (Baseline: N/A; Target: 80% parity; MoV:MOE data/report) (UNICEF, UNESCO)
300,000
(UNICEF)
140,000
(UNICEF)
160,000
(UNICEF)
0
(UNICEF)
OUTPUT 3.3.
Primary and secondary
school-aged children,
especially girls in
educationally disadvantaged
communities, are enrolled in
and complete primary and
secondary education that uses
a life-skills approach41
(UNESCO, UN-HABITAT, UNICEF,
WFP)
% of targeted primary schools meeting the national Quality Education Standards (Baseline: N/A Target: 80%; MoV: MOE data/records) (UNICEF, UNESCO)
% of targeted secondary schools meeting the national Quality Education Standards (2010: ???, 2015: 80%; MoV: MOE data/records) (UNICEF, UNESCO)
% of primary schools with functioning water and sanitation facilities: 2008: 29.4%, 2015: 50%, MoV: EMIS (UNICEF, UN-HABITAT)
% of students participating in non-formal equivalency programmes who pass the primary completion exam (2010: ??, 2015: 80%; MoV: MOE data/records) (UNICEF, UNESCO)
5,940,000
(UNICEF)
1,850,000
(UNESCO)
600,000
(UNICEF)
50,000
(UNESCO)
5,040,000
(UNICEF)
300,000
(UNESCO)
300,000
(UNICEF)
1,500,000
(UNESCO)
11
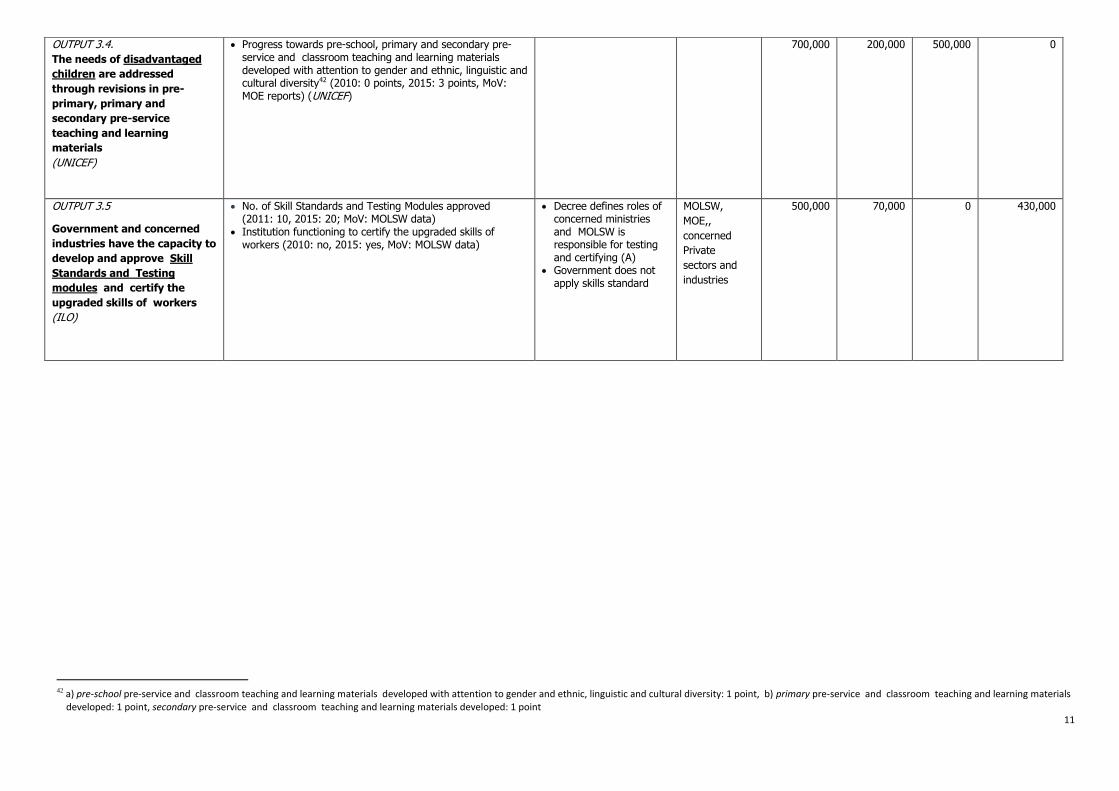
42 a) pre-school pre-service and classroom teaching and learning materials developed with attention to gender and ethnic, linguistic and cultural diversity: 1 point, b) primary pre-service and classroom teaching and learning materials
developed: 1 point, secondary pre-service and classroom teaching and learning materials developed: 1 point
OUTPUT 3.4.
The needs of disadvantaged
children are addressed
through revisions in pre-
primary, primary and
secondary pre-service
teaching and learning
materials
(UNICEF)
Progress towards pre-school, primary and secondary pre-service and classroom teaching and learning materials developed with attention to gender and ethnic, linguistic and cultural diversity42 (2010: 0 points, 2015: 3 points, MoV: MOE reports) (UNICEF)
700,000 200,000 500,000 0
OUTPUT 3.5
Government and concerned
industries have the capacity to
develop and approve Skill
Standards and Testing
modules and certify the
upgraded skills of workers
(ILO)
No. of Skill Standards and Testing Modules approved (2011: 10, 2015: 20; MoV: MOLSW data)
Institution functioning to certify the upgraded skills of workers (2010: no, 2015: yes, MoV: MOLSW data)
Decree defines roles of concerned ministries and MOLSW is responsible for testing and certifying (A)
Government does not apply skills standard
MOLSW,
MOE,,
concerned
Private
sectors and
industries
500,000 70,000 0 430,000
12
Result (agency) Indicators, Baseline, Target, MoV Risks/Assumptions Role of
Partners
Indicative Resources
13
43 indicator baseline and target will be established after data collection through LSIS in 2011 44 excl. TBAs 45 a) disaggregated by sex: 1 point, b) disaggregated by age: 1 point, c) disaggregated by geographic location: 1 point 46informed by reliable and accessible evidence and with enhanced focus on most remote and vulnerable populations 47 including micro-nutrient deficiencies 47e.g. stunting, wasting, micronutrient
Total Core/ Regular Non
core/Extra
To be
mobilized
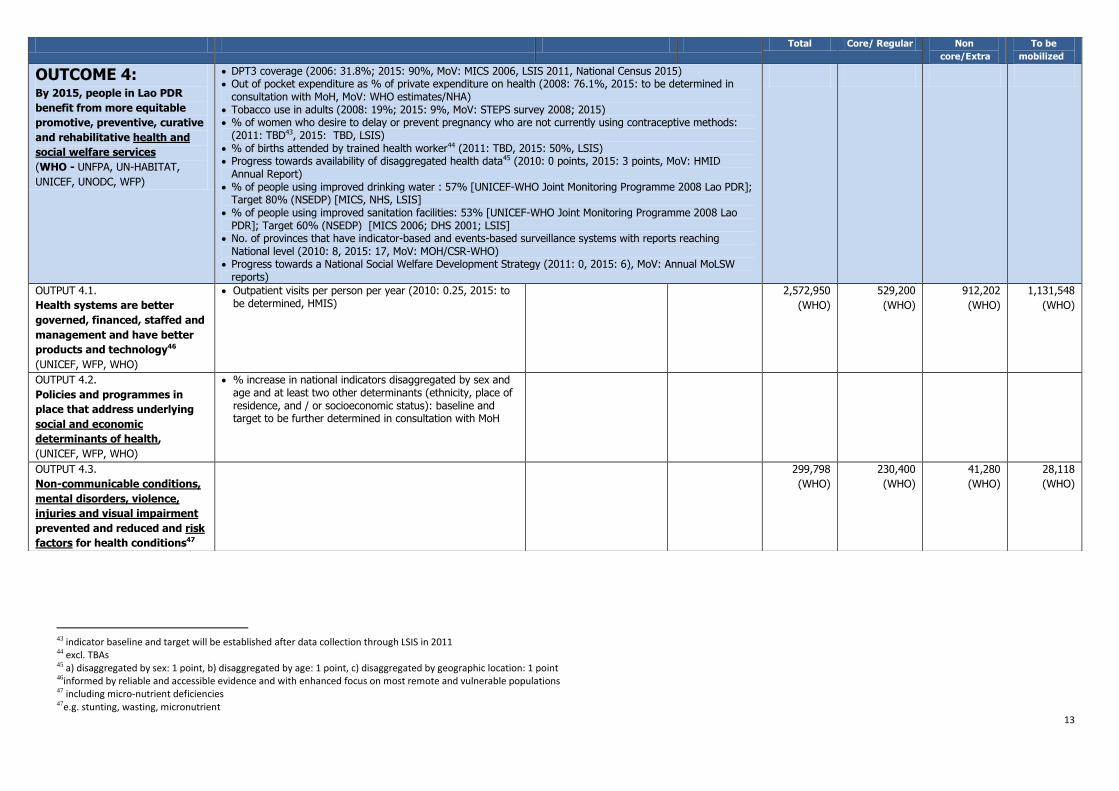
OUTCOME 4: By 2015, people in Lao PDR
benefit from more equitable
promotive, preventive, curative
and rehabilitative health and
social welfare services
(WHO - UNFPA, UN-HABITAT,
UNICEF, UNODC, WFP)
DPT3 coverage (2006: 31.8%; 2015: 90%, MoV: MICS 2006, LSIS 2011, National Census 2015) Out of pocket expenditure as % of private expenditure on health (2008: 76.1%, 2015: to be determined in
consultation with MoH, MoV: WHO estimates/NHA) Tobacco use in adults (2008: 19%; 2015: 9%, MoV: STEPS survey 2008; 2015) % of women who desire to delay or prevent pregnancy who are not currently using contraceptive methods:
(2011: TBD43, 2015: TBD, LSIS) % of births attended by trained health worker44 (2011: TBD, 2015: 50%, LSIS) Progress towards availability of disaggregated health data45 (2010: 0 points, 2015: 3 points, MoV: HMID
Annual Report) % of people using improved drinking water : 57% [UNICEF-WHO Joint Monitoring Programme 2008 Lao PDR];
Target 80% (NSEDP) [MICS, NHS, LSIS] % of people using improved sanitation facilities: 53% [UNICEF-WHO Joint Monitoring Programme 2008 Lao
PDR]; Target 60% (NSEDP) [MICS 2006; DHS 2001; LSIS] No. of provinces that have indicator-based and events-based surveillance systems with reports reaching
National level (2010: 8, 2015: 17, MoV: MOH/CSR-WHO) Progress towards a National Social Welfare Development Strategy (2011: 0, 2015: 6), MoV: Annual MoLSW
reports)
OUTPUT 4.1.
Health systems are better
governed, financed, staffed and
management and have better
products and technology46
(UNICEF, WFP, WHO)
Outpatient visits per person per year (2010: 0.25, 2015: to be determined, HMIS)
2,572,950
(WHO)
529,200
(WHO)
912,202
(WHO)
1,131,548
(WHO)
OUTPUT 4.2.
Policies and programmes in
place that address underlying
social and economic
determinants of health,
(UNICEF, WFP, WHO)
% increase in national indicators disaggregated by sex and age and at least two other determinants (ethnicity, place of residence, and / or socioeconomic status): baseline and target to be further determined in consultation with MoH
OUTPUT 4.3.
Non-communicable conditions,
mental disorders, violence,
injuries and visual impairment
prevented and reduced and risk
factors for health conditions47
299,798
(WHO)
230,400
(WHO)
41,280
(WHO)
28,118
(WHO)
14
deficiencies prevalence 48including integrated packages of services on maternal, neonatal and child health 48?????? 48 SW, MS
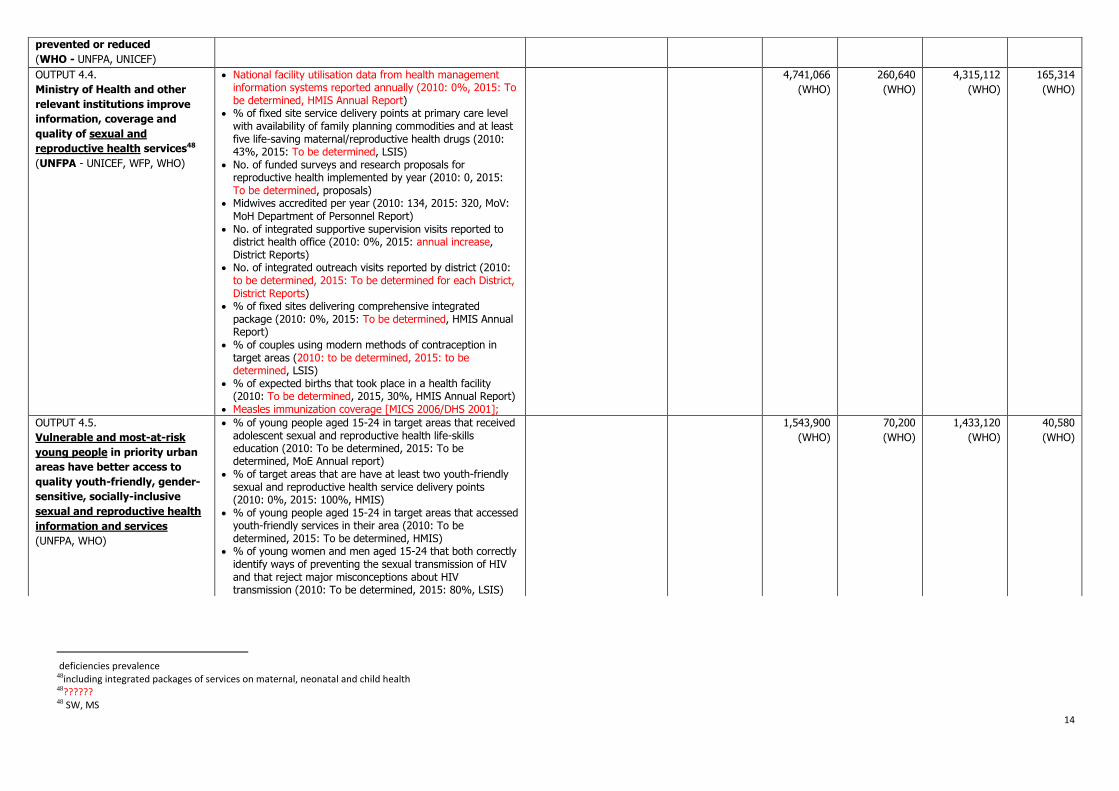
prevented or reduced
(WHO - UNFPA, UNICEF)
OUTPUT 4.4.
Ministry of Health and other
relevant institutions improve
information, coverage and
quality of sexual and
reproductive health services48
(UNFPA - UNICEF, WFP, WHO)
National facility utilisation data from health management information systems reported annually (2010: 0%, 2015: To be determined, HMIS Annual Report)
% of fixed site service delivery points at primary care level with availability of family planning commodities and at least five life-saving maternal/reproductive health drugs (2010: 43%, 2015: To be determined, LSIS)
No. of funded surveys and research proposals for reproductive health implemented by year (2010: 0, 2015: To be determined, proposals)
Midwives accredited per year (2010: 134, 2015: 320, MoV: MoH Department of Personnel Report)
No. of integrated supportive supervision visits reported to district health office (2010: 0%, 2015: annual increase, District Reports)
No. of integrated outreach visits reported by district (2010: to be determined, 2015: To be determined for each District, District Reports)
% of fixed sites delivering comprehensive integrated package (2010: 0%, 2015: To be determined, HMIS Annual Report)
% of couples using modern methods of contraception in target areas (2010: to be determined, 2015: to be determined, LSIS)
% of expected births that took place in a health facility (2010: To be determined, 2015, 30%, HMIS Annual Report)
Measles immunization coverage [MICS 2006/DHS 2001];
4,741,066
(WHO)
260,640
(WHO)
4,315,112
(WHO)
165,314
(WHO)
OUTPUT 4.5.
Vulnerable and most-at-risk
young people in priority urban
areas have better access to
quality youth-friendly, gender-
sensitive, socially-inclusive
sexual and reproductive health
information and services
(UNFPA, WHO)
% of young people aged 15-24 in target areas that received adolescent sexual and reproductive health life-skills education (2010: To be determined, 2015: To be determined, MoE Annual report)
% of target areas that are have at least two youth-friendly sexual and reproductive health service delivery points (2010: 0%, 2015: 100%, HMIS)
% of young people aged 15-24 in target areas that accessed youth-friendly services in their area (2010: To be determined, 2015: To be determined, HMIS)
% of young women and men aged 15-24 that both correctly identify ways of preventing the sexual transmission of HIV and that reject major misconceptions about HIV transmission (2010: To be determined, 2015: 80%, LSIS)
1,543,900
(WHO)
70,200
(WHO)
1,433,120
(WHO)
40,580
(WHO)
15
49 a minimum of a) water treatment plant, b) pipe networks, c) household metered connections, d) 24/7 water supply 50including for emerging, neglected tropical and other communicable diseases
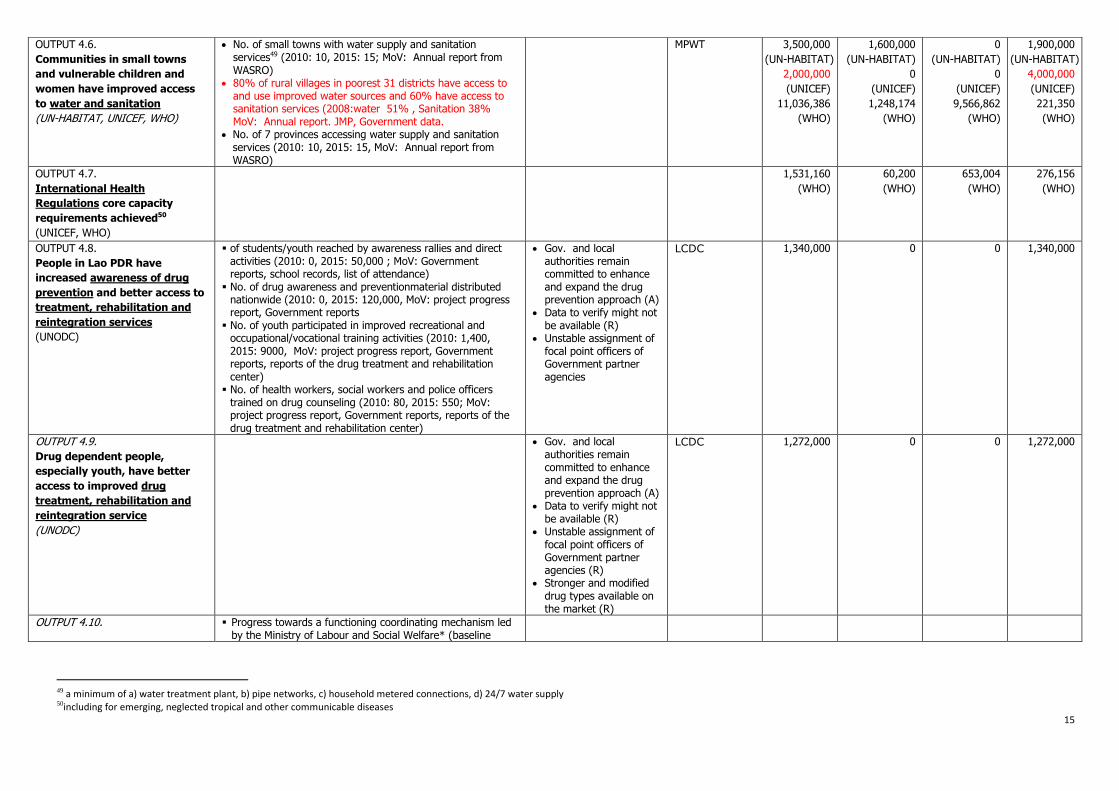
OUTPUT 4.6.
Communities in small towns
and vulnerable children and
women have improved access
to water and sanitation
(UN-HABITAT, UNICEF, WHO)
No. of small towns with water supply and sanitation services49 (2010: 10, 2015: 15; MoV: Annual report from WASRO)
80% of rural villages in poorest 31 districts have access to and use improved water sources and 60% have access to sanitation services (2008:water 51% , Sanitation 38% MoV: Annual report. JMP, Government data.
No. of 7 provinces accessing water supply and sanitation services (2010: 10, 2015: 15, MoV: Annual report from WASRO)
MPWT 3,500,000
(UN-HABITAT)
2,000,000
(UNICEF)
11,036,386
(WHO)
1,600,000
(UN-HABITAT)
0
(UNICEF)
1,248,174
(WHO)
0
(UN-HABITAT)
0
(UNICEF)
9,566,862
(WHO)
1,900,000
(UN-HABITAT)
4,000,000
(UNICEF)
221,350
(WHO)
OUTPUT 4.7.
International Health
Regulations core capacity
requirements achieved50
(UNICEF, WHO)
1,531,160
(WHO)
60,200
(WHO)
653,004
(WHO)
276,156
(WHO)
OUTPUT 4.8.
People in Lao PDR have
increased awareness of drug
prevention and better access to
treatment, rehabilitation and
reintegration services
(UNODC)
of students/youth reached by awareness rallies and direct activities (2010: 0, 2015: 50,000 ; MoV: Government reports, school records, list of attendance)
No. of drug awareness and preventionmaterial distributed nationwide (2010: 0, 2015: 120,000, MoV: project progress report, Government reports
No. of youth participated in improved recreational and occupational/vocational training activities (2010: 1,400, 2015: 9000, MoV: project progress report, Government reports, reports of the drug treatment and rehabilitation center)
No. of health workers, social workers and police officers trained on drug counseling (2010: 80, 2015: 550; MoV: project progress report, Government reports, reports of the drug treatment and rehabilitation center)
Gov. and local authorities remain committed to enhance and expand the drug prevention approach (A)
Data to verify might not be available (R)
Unstable assignment of focal point officers of Government partner agencies
LCDC 1,340,000 0 0 1,340,000
OUTPUT 4.9.
Drug dependent people,
especially youth, have better
access to improved drug
treatment, rehabilitation and
reintegration service
(UNODC)
Gov. and local authorities remain committed to enhance and expand the drug prevention approach (A)
Data to verify might not be available (R)
Unstable assignment of focal point officers of Government partner agencies (R)
Stronger and modified drug types available on the market (R)
LCDC 1,272,000 0 0 1,272,000
OUTPUT 4.10. Progress towards a functioning coordinating mechanism led by the Ministry of Labour and Social Welfare* (baseline
16
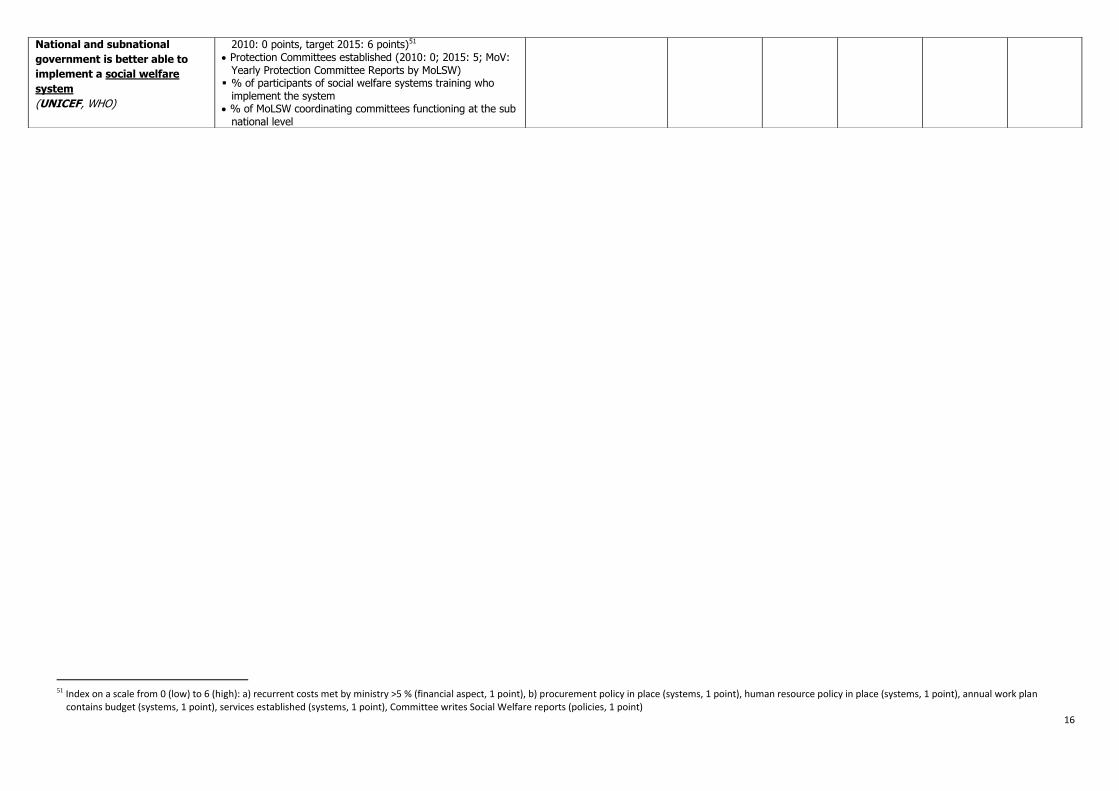
51 Index on a scale from 0 (low) to 6 (high): a) recurrent costs met by ministry >5 % (financial aspect, 1 point), b) procurement policy in place (systems, 1 point), human resource policy in place (systems, 1 point), annual work plan
contains budget (systems, 1 point), services established (systems, 1 point), Committee writes Social Welfare reports (policies, 1 point)
National and subnational
government is better able to
implement a social welfare
system
(UNICEF, WHO)
2010: 0 points, target 2015: 6 points)51 Protection Committees established (2010: 0; 2015: 5; MoV:
Yearly Protection Committee Reports by MoLSW) % of participants of social welfare systems training who
implement the system % of MoLSW coordinating committees functioning at the sub
national level
17
Result (agency) Indicators, Baseline, Target, MoV Risks/Assumptions Role of
Partners
Indicative Resources
18
52 including micro-nutrient deficiencies 53e.g. stunting, wasting, micronutrient deficiencies prevalence
Total Core/
Regular
Non
core/Extra
To be
mobilized
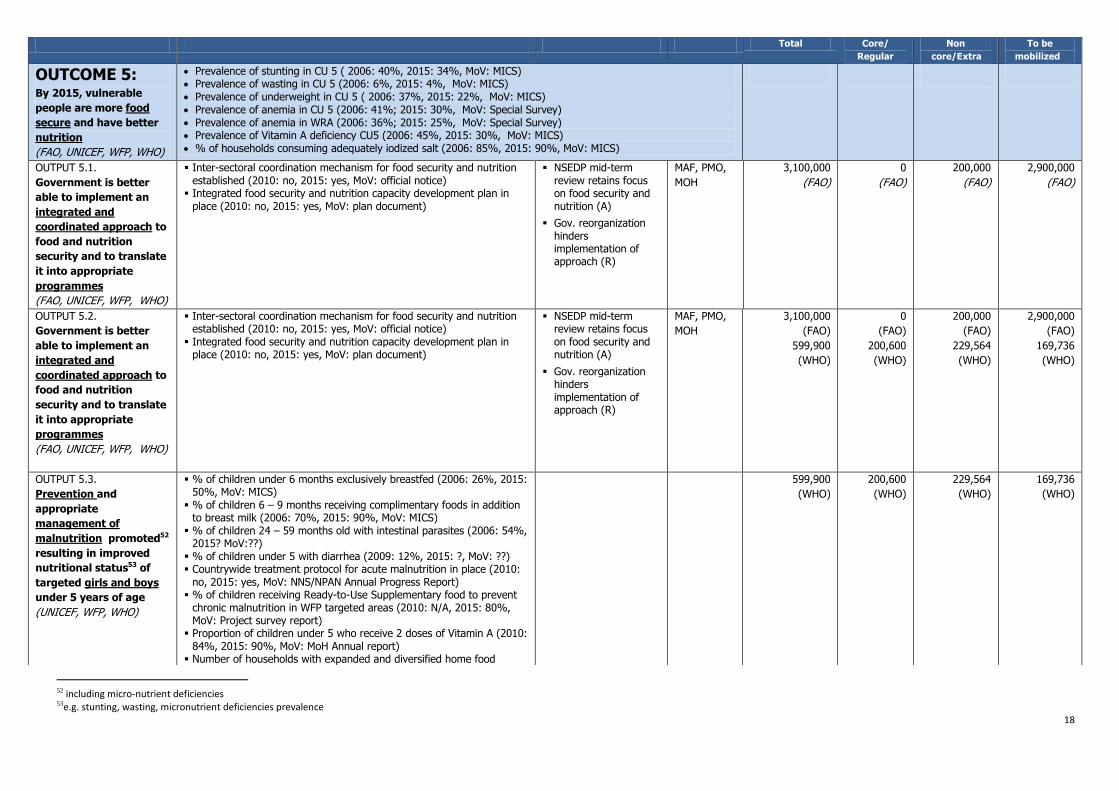
OUTCOME 5: By 2015, vulnerable
people are more food
secure and have better
nutrition
(FAO, UNICEF, WFP, WHO)
Prevalence of stunting in CU 5 ( 2006: 40%, 2015: 34%, MoV: MICS) Prevalence of wasting in CU 5 (2006: 6%, 2015: 4%, MoV: MICS) Prevalence of underweight in CU 5 ( 2006: 37%, 2015: 22%, MoV: MICS) Prevalence of anemia in CU 5 (2006: 41%; 2015: 30%, MoV: Special Survey) Prevalence of anemia in WRA (2006: 36%; 2015: 25%, MoV: Special Survey) Prevalence of Vitamin A deficiency CU5 (2006: 45%, 2015: 30%, MoV: MICS) % of households consuming adequately iodized salt (2006: 85%, 2015: 90%, MoV: MICS)
OUTPUT 5.1.
Government is better
able to implement an
integrated and
coordinated approach to
food and nutrition
security and to translate
it into appropriate
programmes
(FAO, UNICEF, WFP, WHO)
Inter-sectoral coordination mechanism for food security and nutrition established (2010: no, 2015: yes, MoV: official notice)
Integrated food security and nutrition capacity development plan in place (2010: no, 2015: yes, MoV: plan document)
NSEDP mid-term review retains focus on food security and nutrition (A)
Gov. reorganization hinders implementation of approach (R)
MAF, PMO,
MOH
3,100,000
(FAO)
0
(FAO)
200,000
(FAO)
2,900,000
(FAO)
OUTPUT 5.2.
Government is better
able to implement an
integrated and
coordinated approach to
food and nutrition
security and to translate
it into appropriate
programmes
(FAO, UNICEF, WFP, WHO)
Inter-sectoral coordination mechanism for food security and nutrition established (2010: no, 2015: yes, MoV: official notice)
Integrated food security and nutrition capacity development plan in place (2010: no, 2015: yes, MoV: plan document)
NSEDP mid-term review retains focus on food security and nutrition (A)
Gov. reorganization hinders implementation of approach (R)
MAF, PMO,
MOH
3,100,000
(FAO)
599,900
(WHO)
0
(FAO)
200,600
(WHO)
200,000
(FAO)
229,564
(WHO)
2,900,000
(FAO)
169,736
(WHO)
OUTPUT 5.3.
Prevention and
appropriate
management of
malnutrition promoted52
resulting in improved
nutritional status53 of
targeted girls and boys
under 5 years of age
(UNICEF, WFP, WHO)
% of children under 6 months exclusively breastfed (2006: 26%, 2015: 50%, MoV: MICS)
% of children 6 – 9 months receiving complimentary foods in addition to breast milk (2006: 70%, 2015: 90%, MoV: MICS)
% of children 24 – 59 months old with intestinal parasites (2006: 54%, 2015? MoV:??)
% of children under 5 with diarrhea (2009: 12%, 2015: ?, MoV: ??) Countrywide treatment protocol for acute malnutrition in place (2010:
no, 2015: yes, MoV: NNS/NPAN Annual Progress Report) % of children receiving Ready-to-Use Supplementary food to prevent
chronic malnutrition in WFP targeted areas (2010: N/A, 2015: 80%, MoV: Project survey report)
Proportion of children under 5 who receive 2 doses of Vitamin A (2010: 84%, 2015: 90%, MoV: MoH Annual report)
Number of households with expanded and diversified home food
599,900
(WHO)
200,600
(WHO)
229,564
(WHO)
169,736
(WHO)

19
54 at least 2 week training
production % of children affected by emergencies provided with supplementary
food to address wasting (2010: N/A, 2015:
OUTPUT 5.4.
Individuals, families and
communities have
improved nutritional
knowledge and practices
(FAO, UNICEF, WFP, WHO)
% of caregiver who have improved knowledge on nutrition and care practices in WFP targeted areas (2010: N/A, 2015: 80%, Project surveys), (WFP)
No. of government staff who are trained to provide nutrition education to communities (2011: 385, 2015: ???, MoV: MoH Annual report) (FAO)
MOH (IP) 2,500,000
(FAO)
0
(FAO)
0
(FAO)
2,500,000
(FAO)
OUTPUT 5.5.
Small holder farmers are
better linked to the
market and agencies
procuring food
commodities are
increasingly using these
farmers
(WFP)
% of WFP‟s food purchased locally from small holder farmers (2010: N/A, 2015: 50%, MoV: Annual Procurement Report)
OUTPUT 5.6
Farmers are better able
to implement integrated
pest management, good
agricultural practices
and pesticide risk
reduction
(FAO)
No. of farmers trained54 in Pesticide Risk Reduction or season-long IPM Farmers Field Schoo, (2010: 2,000, 2015: 5,000, training survey)
No. of IPM/FFS trained farmers that use 50% less pesticide (2010: 10%, 2015: 90%, MoV: training survey)
No. of trained farmers that have increased use of non-chemical pest management approaches (2010: 15%, 2015: 90%, MoV: training survey)
Severe outbreak of pests and/or diseases (R)
Promotion of cost-effective pesticides amongst farmers and extension officers continues to be successful (A)
Plant
Protection
Centre/DoA
1,000,000
(FAO)
500,000
(FAO)
0
(FAO)
500,000
(FAO)
OUTPUT 5.7.
Consumption and
production of edible
insects and indigenous
foods supported
(FAO, WFP)
Indicator on consumption of insects in project villages No. of households that start farming edible insect with UN support
(2010: not known, 2015: pending baseline, MoV: project data)
Matched supply and demand between farmer and consumer (A)
Disease outbreak for farmed insects (A)
MAF, MoH,
MoE
5,000,000
(FAO)
1,800,000
(FAO)
0 3,200,000
(FAO)
OUTPUT 5.8.
Sustainable fisheries
arrangements and
aquaculture under local
management developed
(FAO)
Fisheries management regulations developed (2010: no, 2015: yes, MoV: Fisheries management regulations)
% of respondents in target communities that agree that local management of fisheries is sustainable (2010: first survey, 2015: 75%, MoV: FAO survey on sustainable fisheries management)
Communities follow fishery management regulations (A)
Disease outbreak occurring to drastically reduce aquaculture feasibly (R)
500,000
500,000
0 0
20
55 sex workers, clients of sex workers, men having sex with men, drug users and injecting drug users, migrants and low risk population 56 clients of sex workers, men having sex with men, MARA/MARP, injecting drug users, Migrants and low risk population 57 output contributes directly to the first of three strategic components in the National Strategic and Action Plan on HIV/ADIS/STI 2011-2015 58 including civil servants, uniformed men, migrants, transport workers, business men, others 59 Pending first baseline survey 60 pending collection of baseline data through LSIS 2011 61 94 priority districts of 143 listed I National Strategic and Action Plan on HIV/ADIS/STI 2011-2015, Annex 6B
Result (agency) Indicators, Baseline, Target, MoV Risks/Assumptions Role of Partners Indicative Resources
Total Core/ Regular Non core/Extra To be
mobilized
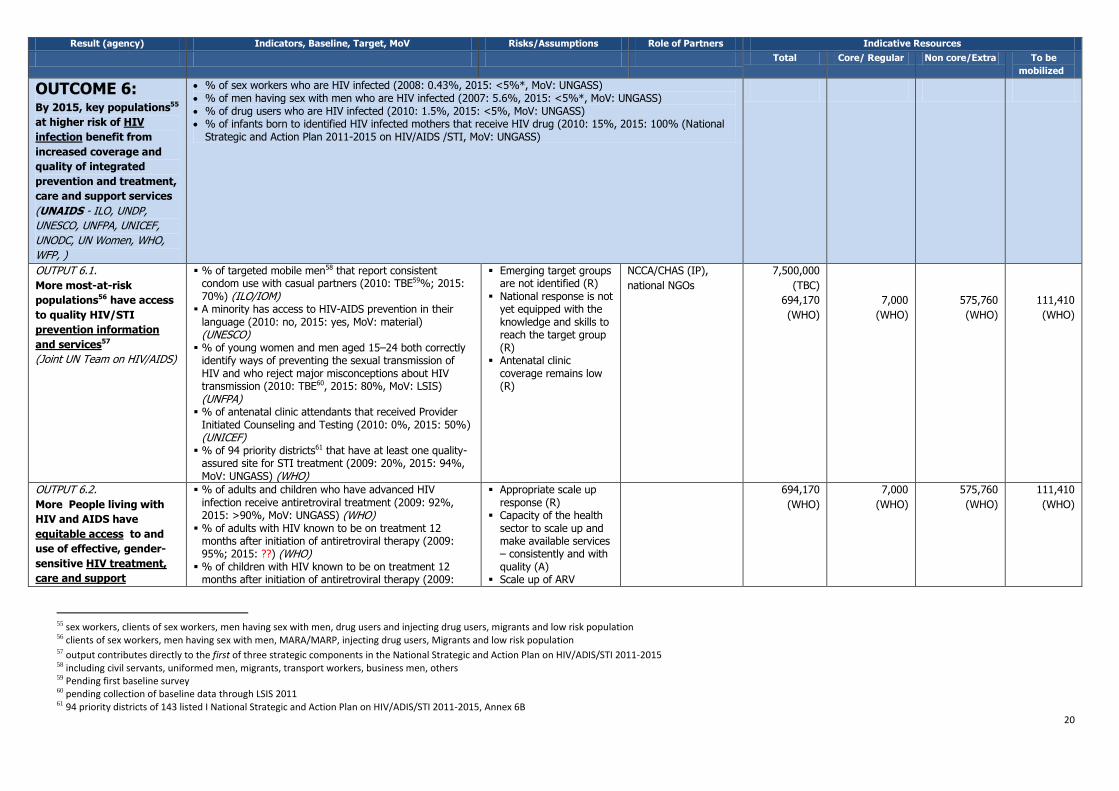
OUTCOME 6: By 2015, key populations55
at higher risk of HIV
infection benefit from
increased coverage and
quality of integrated
prevention and treatment,
care and support services
(UNAIDS - ILO, UNDP,
UNESCO, UNFPA, UNICEF,
UNODC, UN Women, WHO,
WFP, )
% of sex workers who are HIV infected (2008: 0.43%, 2015: <5%*, MoV: UNGASS) % of men having sex with men who are HIV infected (2007: 5.6%, 2015: <5%*, MoV: UNGASS) % of drug users who are HIV infected (2010: 1.5%, 2015: <5%, MoV: UNGASS) % of infants born to identified HIV infected mothers that receive HIV drug (2010: 15%, 2015: 100% (National
Strategic and Action Plan 2011-2015 on HIV/AIDS /STI, MoV: UNGASS)
OUTPUT 6.1.
More most-at-risk
populations56 have access
to quality HIV/STI
prevention information
and services57
(Joint UN Team on HIV/AIDS)
% of targeted mobile men58 that report consistent condom use with casual partners (2010: TBE59%; 2015: 70%) (ILO/IOM)
A minority has access to HIV-AIDS prevention in their language (2010: no, 2015: yes, MoV: material) (UNESCO)
% of young women and men aged 15–24 both correctly identify ways of preventing the sexual transmission of HIV and who reject major misconceptions about HIV transmission (2010: TBE60, 2015: 80%, MoV: LSIS) (UNFPA)
% of antenatal clinic attendants that received Provider Initiated Counseling and Testing (2010: 0%, 2015: 50%) (UNICEF)
% of 94 priority districts61 that have at least one quality-assured site for STI treatment (2009: 20%, 2015: 94%, MoV: UNGASS) (WHO)
Emerging target groups are not identified (R)
National response is not yet equipped with the knowledge and skills to reach the target group (R)
Antenatal clinic coverage remains low (R)
NCCA/CHAS (IP),
national NGOs
7,500,000
(TBC)
694,170
(WHO)
7,000
(WHO)
575,760
(WHO)
111,410
(WHO)
OUTPUT 6.2.
More People living with
HIV and AIDS have
equitable access to and
use of effective, gender-
sensitive HIV treatment,
care and support
% of adults and children who have advanced HIV infection receive antiretroviral treatment (2009: 92%, 2015: >90%, MoV: UNGASS) (WHO)
% of adults with HIV known to be on treatment 12 months after initiation of antiretroviral therapy (2009: 95%; 2015: ??) (WHO)
% of children with HIV known to be on treatment 12 months after initiation of antiretroviral therapy (2009:
Appropriate scale up response (R)
Capacity of the health sector to scale up and make available services – consistently and with quality (A)
Scale up of ARV
694,170
(WHO)
7,000
(WHO)
575,760
(WHO)
111,410
(WHO)
21
62 output contributes directly to the second of three strategic components in the National Strategic and Action Plan on HIV/ADIS/STI 2011-2015 63 output contributes directly to the third of three strategic components in the National Strategic and Action Plan on HIV/ADIS/STI 2011-2015 64 including testing & counseling, medical management of HIV, PMTCT, targeted prevention interventions and home/community-based care
services62
(Joint UN Team on HIV/AIDS)
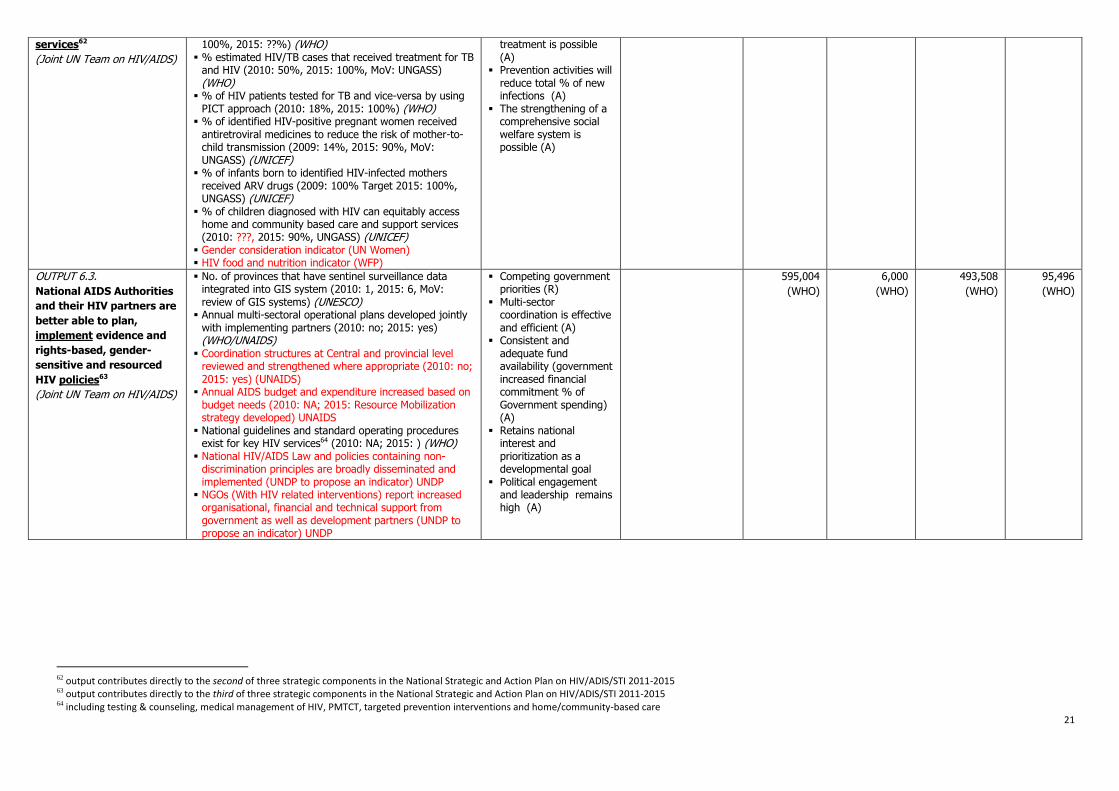
100%, 2015: ??%) (WHO) % estimated HIV/TB cases that received treatment for TB
and HIV (2010: 50%, 2015: 100%, MoV: UNGASS) (WHO)
% of HIV patients tested for TB and vice-versa by using PICT approach (2010: 18%, 2015: 100%) (WHO)
% of identified HIV-positive pregnant women received antiretroviral medicines to reduce the risk of mother-to-child transmission (2009: 14%, 2015: 90%, MoV: UNGASS) (UNICEF)
% of infants born to identified HIV-infected mothers received ARV drugs (2009: 100% Target 2015: 100%, UNGASS) (UNICEF)
% of children diagnosed with HIV can equitably access home and community based care and support services (2010: ???, 2015: 90%, UNGASS) (UNICEF)
Gender consideration indicator (UN Women) HIV food and nutrition indicator (WFP)
treatment is possible (A)
Prevention activities will reduce total % of new infections (A)
The strengthening of a comprehensive social welfare system is possible (A)
OUTPUT 6.3.
National AIDS Authorities
and their HIV partners are
better able to plan,
implement evidence and
rights-based, gender-
sensitive and resourced
HIV policies63
(Joint UN Team on HIV/AIDS)
No. of provinces that have sentinel surveillance data integrated into GIS system (2010: 1, 2015: 6, MoV: review of GIS systems) (UNESCO)
Annual multi-sectoral operational plans developed jointly with implementing partners (2010: no; 2015: yes) (WHO/UNAIDS)
Coordination structures at Central and provincial level reviewed and strengthened where appropriate (2010: no; 2015: yes) (UNAIDS)
Annual AIDS budget and expenditure increased based on budget needs (2010: NA; 2015: Resource Mobilization strategy developed) UNAIDS
National guidelines and standard operating procedures exist for key HIV services64 (2010: NA; 2015: ) (WHO)
National HIV/AIDS Law and policies containing non-discrimination principles are broadly disseminated and implemented (UNDP to propose an indicator) UNDP
NGOs (With HIV related interventions) report increased organisational, financial and technical support from government as well as development partners (UNDP to propose an indicator) UNDP
Competing government priorities (R)
Multi-sector coordination is effective and efficient (A)
Consistent and adequate fund availability (government increased financial commitment % of Government spending) (A)
Retains national interest and prioritization as a developmental goal
Political engagement and leadership remains high (A)
595,004
(WHO)
6,000
(WHO)
493,508
(WHO)
95,496
(WHO)
22
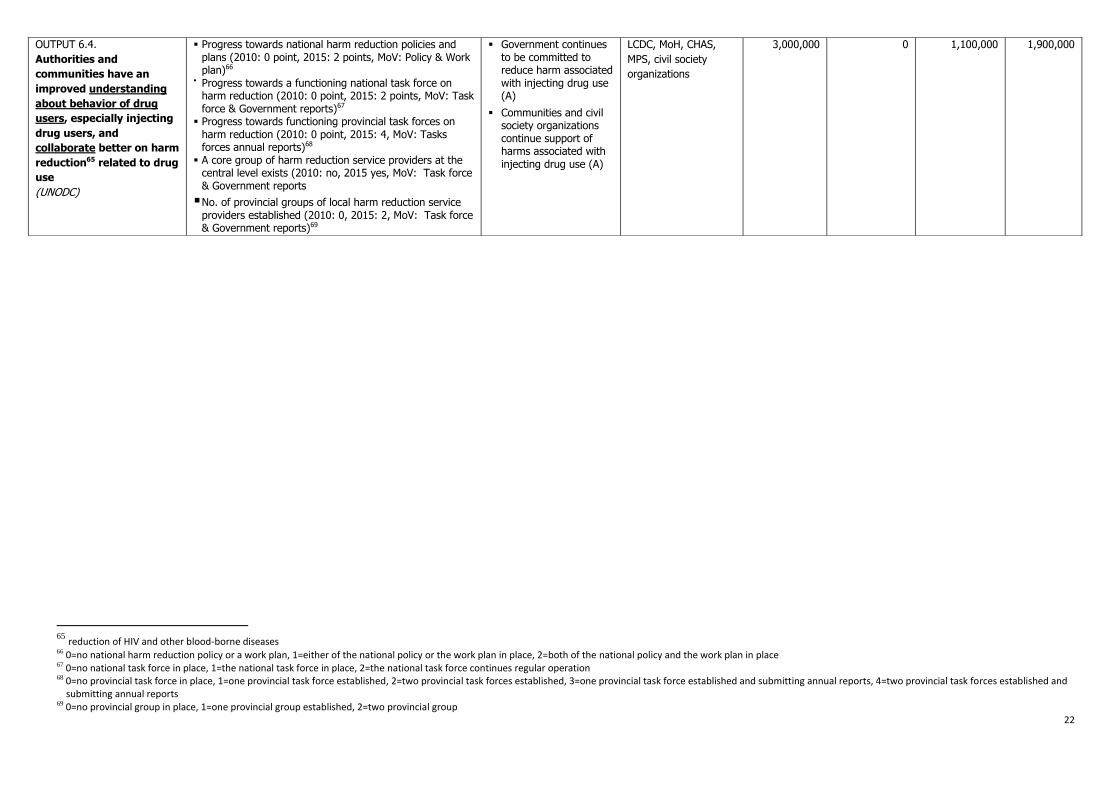
65 reduction of HIV and other blood-borne diseases 66 0=no national harm reduction policy or a work plan, 1=either of the national policy or the work plan in place, 2=both of the national policy and the work plan in place 67 0=no national task force in place, 1=the national task force in place, 2=the national task force continues regular operation 68 0=no provincial task force in place, 1=one provincial task force established, 2=two provincial task forces established, 3=one provincial task force established and submitting annual reports, 4=two provincial task forces established and
submitting annual reports 69 0=no provincial group in place, 1=one provincial group established, 2=two provincial group
OUTPUT 6.4.
Authorities and
communities have an
improved understanding
about behavior of drug
users, especially injecting
drug users, and
collaborate better on harm
reduction65 related to drug
use
(UNODC)
Progress towards national harm reduction policies and plans (2010: 0 point, 2015: 2 points, MoV: Policy & Work plan)66
Progress towards a functioning national task force on harm reduction (2010: 0 point, 2015: 2 points, MoV: Task force & Government reports)67
Progress towards functioning provincial task forces on harm reduction (2010: 0 point, 2015: 4, MoV: Tasks forces annual reports)68
A core group of harm reduction service providers at the central level exists (2010: no, 2015 yes, MoV: Task force & Government reports
No. of provincial groups of local harm reduction service providers established (2010: 0, 2015: 2, MoV: Task force & Government reports)69
Government continues to be committed to reduce harm associated with injecting drug use (A)
Communities and civil society organizations continue support of harms associated with injecting drug use (A)
LCDC, MoH, CHAS,
MPS, civil society
organizations
3,000,000 0 1,100,000 1,900,000
23
70 natural forest (>20% crown cover) 71 Indicator will be refined – including baseline data and target – once data becomes available in 2011 72 to be defined prior to start of UNDAF cycle 73 Information still classified; figures will be made public from 2011 on in SUFORD/DoF Annual Reports 74 co-management of a) fisheries, b) wetlands and production and c) village forests 75 co-management of a) forests (protection and conservation), b) water resources (wetlands and river systems) and c) biodiversity hotspots
Result (agency) Indicators, Baseline, Target, MoV Risks/Assumptions Role of Partners Indicative Resources
Total Core/
Regular
Non core/Extra To be
mobilized
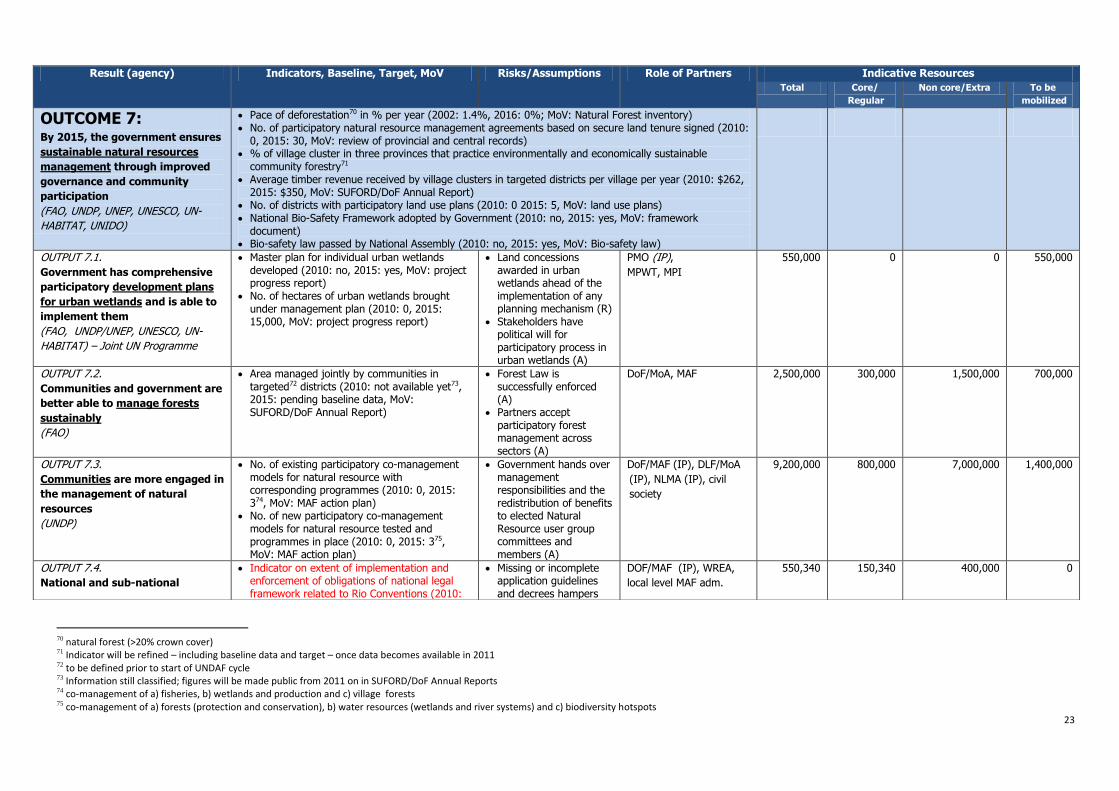
OUTCOME 7: By 2015, the government ensures
sustainable natural resources
management through improved
governance and community
participation
(FAO, UNDP, UNEP, UNESCO, UN-
HABITAT, UNIDO)
Pace of deforestation70 in % per year (2002: 1.4%, 2016: 0%; MoV: Natural Forest inventory) No. of participatory natural resource management agreements based on secure land tenure signed (2010:
0, 2015: 30, MoV: review of provincial and central records) % of village cluster in three provinces that practice environmentally and economically sustainable
community forestry71 Average timber revenue received by village clusters in targeted districts per village per year (2010: $262,
2015: $350, MoV: SUFORD/DoF Annual Report) No. of districts with participatory land use plans (2010: 0 2015: 5, MoV: land use plans) National Bio-Safety Framework adopted by Government (2010: no, 2015: yes, MoV: framework
document) Bio-safety law passed by National Assembly (2010: no, 2015: yes, MoV: Bio-safety law)
OUTPUT 7.1.
Government has comprehensive
participatory development plans
for urban wetlands and is able to
implement them
(FAO, UNDP/UNEP, UNESCO, UN-
HABITAT) – Joint UN Programme
Master plan for individual urban wetlands developed (2010: no, 2015: yes, MoV: project progress report)
No. of hectares of urban wetlands brought under management plan (2010: 0, 2015: 15,000, MoV: project progress report)
Land concessions awarded in urban wetlands ahead of the implementation of any planning mechanism (R)
Stakeholders have political will for participatory process in urban wetlands (A)
PMO (IP),
MPWT, MPI
550,000 0 0 550,000
OUTPUT 7.2.
Communities and government are
better able to manage forests
sustainably
(FAO)
Area managed jointly by communities in targeted72 districts (2010: not available yet73, 2015: pending baseline data, MoV: SUFORD/DoF Annual Report)
Forest Law is successfully enforced (A)
Partners accept participatory forest management across sectors (A)
DoF/MoA, MAF
2,500,000 300,000 1,500,000 700,000
OUTPUT 7.3.
Communities are more engaged in
the management of natural
resources
(UNDP)
No. of existing participatory co-management models for natural resource with corresponding programmes (2010: 0, 2015: 374, MoV: MAF action plan)
No. of new participatory co-management models for natural resource tested and programmes in place (2010: 0, 2015: 375, MoV: MAF action plan)
Government hands over management responsibilities and the redistribution of benefits to elected Natural Resource user group committees and members (A)
DoF/MAF (IP), DLF/MoA
(IP), NLMA (IP), civil
society
9,200,000 800,000 7,000,000 1,400,000
OUTPUT 7.4.
National and sub-national
Indicator on extent of implementation and enforcement of obligations of national legal framework related to Rio Conventions (2010:
Missing or incomplete application guidelines and decrees hampers
DOF/MAF (IP), WREA,
local level MAF adm.
550,340 150,340 400,000 0
24
76 Forestry Law from 2008 and Fishery Law from 2009
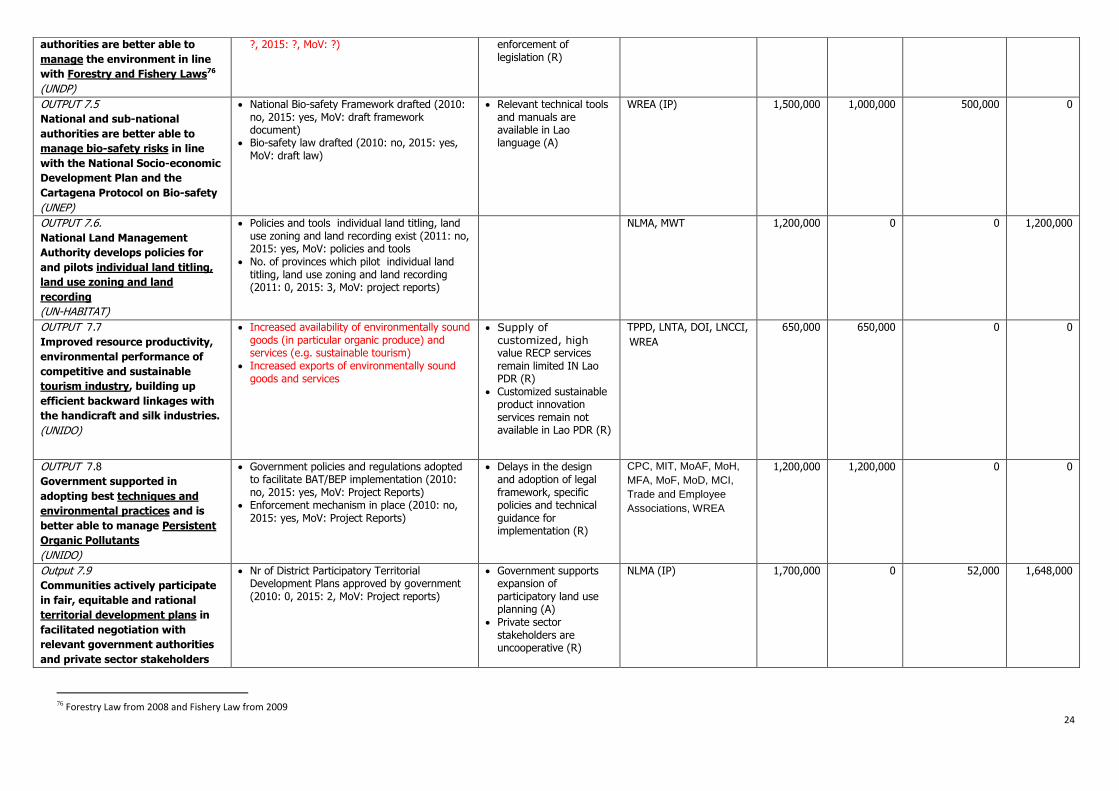
authorities are better able to
manage the environment in line
with Forestry and Fishery Laws76
(UNDP)
?, 2015: ?, MoV: ?) enforcement of legislation (R)
OUTPUT 7.5
National and sub-national
authorities are better able to
manage bio-safety risks in line
with the National Socio-economic
Development Plan and the
Cartagena Protocol on Bio-safety
(UNEP)
National Bio-safety Framework drafted (2010: no, 2015: yes, MoV: draft framework document)
Bio-safety law drafted (2010: no, 2015: yes, MoV: draft law)
Relevant technical tools and manuals are available in Lao language (A)
WREA (IP) 1,500,000 1,000,000 500,000 0
OUTPUT 7.6.
National Land Management
Authority develops policies for
and pilots individual land titling,
land use zoning and land
recording
(UN-HABITAT)
Policies and tools individual land titling, land use zoning and land recording exist (2011: no, 2015: yes, MoV: policies and tools
No. of provinces which pilot individual land titling, land use zoning and land recording (2011: 0, 2015: 3, MoV: project reports)
NLMA, MWT 1,200,000 0 0 1,200,000
OUTPUT 7.7
Improved resource productivity,
environmental performance of
competitive and sustainable
tourism industry, building up
efficient backward linkages with
the handicraft and silk industries.
(UNIDO)
Increased availability of environmentally sound goods (in particular organic produce) and services (e.g. sustainable tourism)
Increased exports of environmentally sound goods and services
Supply of customized, high value RECP services remain limited IN Lao PDR (R)
Customized sustainable product innovation services remain not available in Lao PDR (R)
TPPD, LNTA, DOI, LNCCI,
WREA
650,000 650,000 0 0
OUTPUT 7.8
Government supported in
adopting best techniques and
environmental practices and is
better able to manage Persistent
Organic Pollutants
(UNIDO)
Government policies and regulations adopted to facilitate BAT/BEP implementation (2010: no, 2015: yes, MoV: Project Reports)
Enforcement mechanism in place (2010: no, 2015: yes, MoV: Project Reports)
Delays in the design and adoption of legal framework, specific policies and technical guidance for implementation (R)
CPC, MIT, MoAF, MoH,
MFA, MoF, MoD, MCI,
Trade and Employee
Associations, WREA
1,200,000 1,200,000 0 0
Output 7.9
Communities actively participate
in fair, equitable and rational
territorial development plans in
facilitated negotiation with
relevant government authorities
and private sector stakeholders
Nr of District Participatory Territorial Development Plans approved by government (2010: 0, 2015: 2, MoV: Project reports)
Government supports expansion of participatory land use planning (A)
Private sector stakeholders are uncooperative (R)
NLMA (IP) 1,700,000 0 52,000 1,648,000
25
77 such as forestry, agriculture and water resources, as identified in 2nd National Communication, NAMA, NAPA and National climate change strategy 78 ministries with a sector working group 79 Index of scale from 0 to 5: district and community disaster management plans (1 point), sub-national early warning system in place (1 point), Standard Operating Procedure in the target communities (1 point), emergency plans in
place (1 point), mock training provided: 1 point 80 not joint programme, but close cooperation
(FAO)
Result (agency Indicators, Baseline, Target, MoV Risks/Assumptions Role of Partners Indicative Resources
Total Core/
Regular
Non
core/Extra
To be mobilized
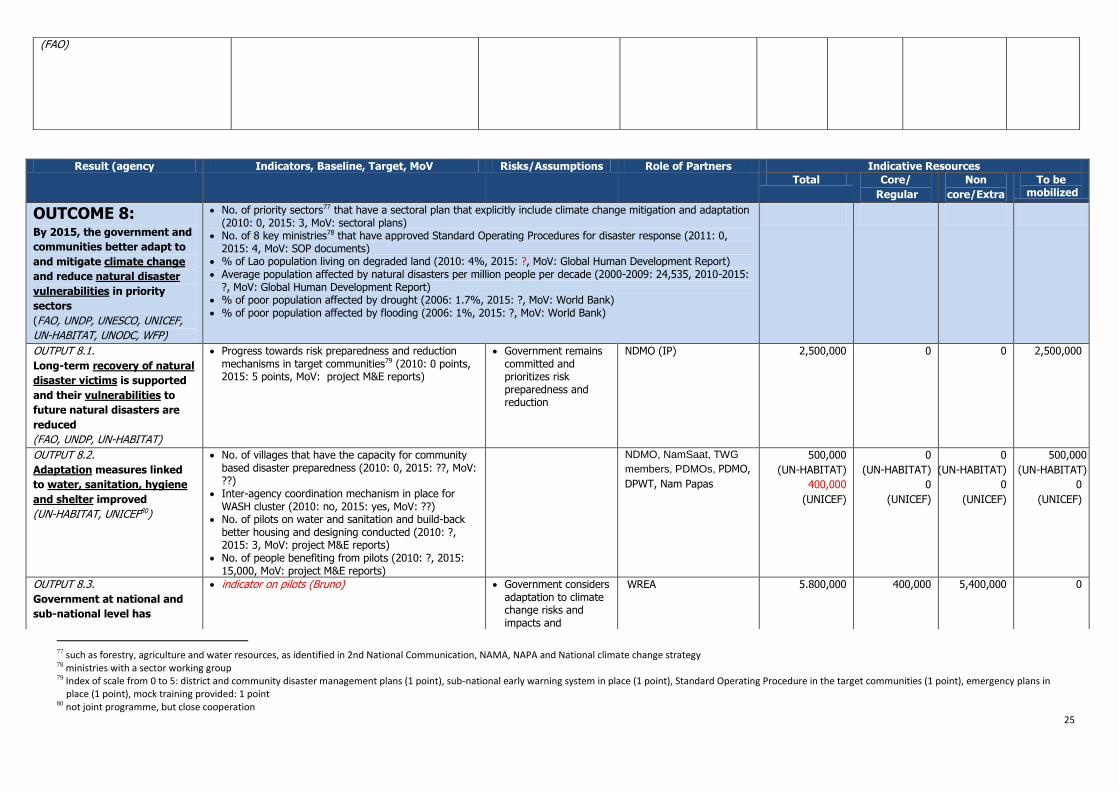
OUTCOME 8: By 2015, the government and
communities better adapt to
and mitigate climate change
and reduce natural disaster
vulnerabilities in priority
sectors
(FAO, UNDP, UNESCO, UNICEF,
UN-HABITAT, UNODC, WFP)
No. of priority sectors77 that have a sectoral plan that explicitly include climate change mitigation and adaptation (2010: 0, 2015: 3, MoV: sectoral plans)
No. of 8 key ministries78 that have approved Standard Operating Procedures for disaster response (2011: 0, 2015: 4, MoV: SOP documents)
% of Lao population living on degraded land (2010: 4%, 2015: ?, MoV: Global Human Development Report) Average population affected by natural disasters per million people per decade (2000-2009: 24,535, 2010-2015:
?, MoV: Global Human Development Report) % of poor population affected by drought (2006: 1.7%, 2015: ?, MoV: World Bank) % of poor population affected by flooding (2006: 1%, 2015: ?, MoV: World Bank)
OUTPUT 8.1.
Long-term recovery of natural
disaster victims is supported
and their vulnerabilities to
future natural disasters are
reduced
(FAO, UNDP, UN-HABITAT)
Progress towards risk preparedness and reduction mechanisms in target communities79 (2010: 0 points, 2015: 5 points, MoV: project M&E reports)
Government remains committed and prioritizes risk preparedness and reduction
NDMO (IP) 2,500,000 0 0 2,500,000
OUTPUT 8.2.
Adaptation measures linked
to water, sanitation, hygiene
and shelter improved
(UN-HABITAT, UNICEF80)
No. of villages that have the capacity for community based disaster preparedness (2010: 0, 2015: ??, MoV: ??)
Inter-agency coordination mechanism in place for WASH cluster (2010: no, 2015: yes, MoV: ??)
No. of pilots on water and sanitation and build-back better housing and designing conducted (2010: ?, 2015: 3, MoV: project M&E reports)
No. of people benefiting from pilots (2010: ?, 2015: 15,000, MoV: project M&E reports)
NDMO, NamSaat, TWG
members, PDMOs, PDMO,
DPWT, Nam Papas
500,000
(UN-HABITAT)
400,000
(UNICEF)
0
(UN-HABITAT)
0
(UNICEF)
0
(UN-HABITAT)
0
(UNICEF)
500,000
(UN-HABITAT)
0
(UNICEF)
OUTPUT 8.3.
Government at national and
sub-national level has
indicator on pilots (Bruno)
Government considers adaptation to climate change risks and impacts and
WREA 5.800,000 400,000 5,400,000 0
26
81 including the National Disaster Management Committee and the National Disaster Management Office 82 Index of scale: National and Provincial Emergency Operations exist (point 1), National Standard Operating Procedures for Disaster Preparedness and Response (point 1) Provincial Standard Operating Procedures for Disaster
Preparedness and Response (point 1), National Emergency Plan in place (point 1), provincial emergency plan (point 1). 83 according to International Centre of Research on Agroforestry Forestry 84 The indicative budget only refers to training activities. The direct response for emergency food assistance will be carried out under Emergency Operations (e.g. $25m between 2007 and 2010).
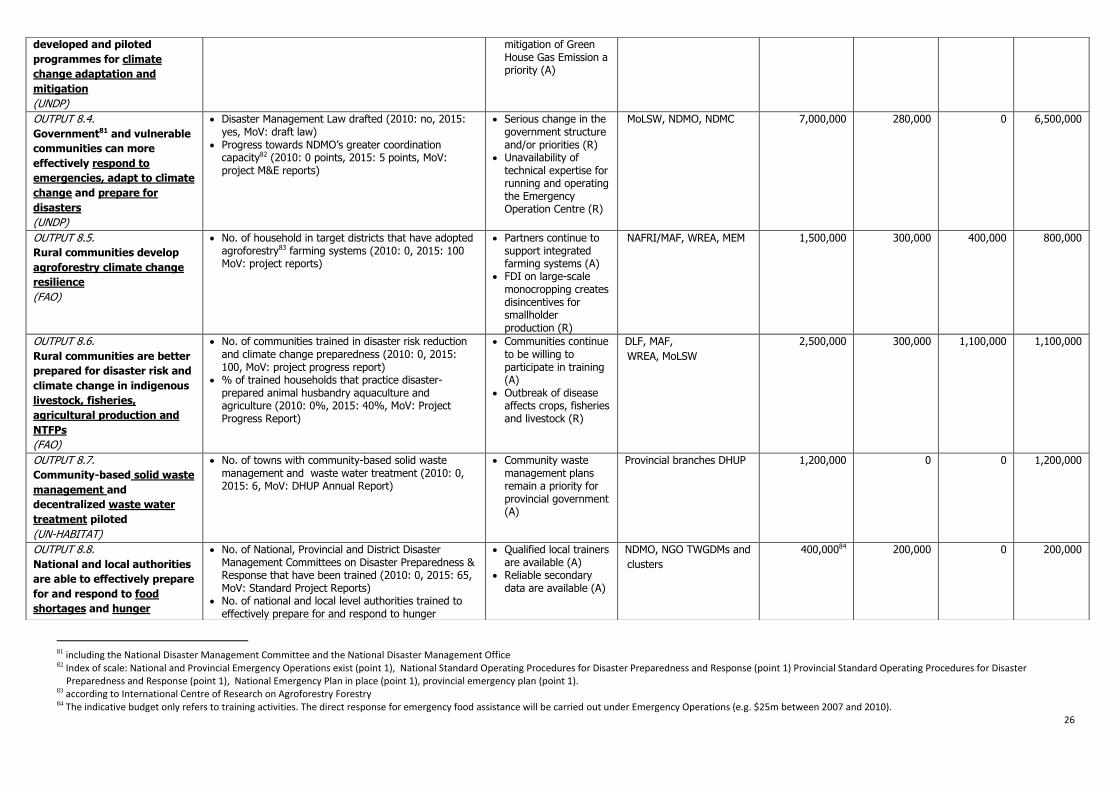
developed and piloted
programmes for climate
change adaptation and
mitigation
(UNDP)
mitigation of Green House Gas Emission a priority (A)
OUTPUT 8.4.
Government81 and vulnerable
communities can more
effectively respond to
emergencies, adapt to climate
change and prepare for
disasters
(UNDP)
Disaster Management Law drafted (2010: no, 2015: yes, MoV: draft law)
Progress towards NDMO‟s greater coordination capacity82 (2010: 0 points, 2015: 5 points, MoV: project M&E reports)
Serious change in the government structure and/or priorities (R)
Unavailability of technical expertise for running and operating the Emergency Operation Centre (R)
MoLSW, NDMO, NDMC 7,000,000 280,000 0 6,500,000
OUTPUT 8.5.
Rural communities develop
agroforestry climate change
resilience
(FAO)
No. of household in target districts that have adopted agroforestry83 farming systems (2010: 0, 2015: 100 MoV: project reports)
Partners continue to support integrated farming systems (A)
FDI on large-scale monocropping creates disincentives for smallholder production (R)
NAFRI/MAF, WREA, MEM 1,500,000 300,000 400,000 800,000
OUTPUT 8.6.
Rural communities are better
prepared for disaster risk and
climate change in indigenous
livestock, fisheries,
agricultural production and
NTFPs
(FAO)
No. of communities trained in disaster risk reduction and climate change preparedness (2010: 0, 2015: 100, MoV: project progress report)
% of trained households that practice disaster-prepared animal husbandry aquaculture and agriculture (2010: 0%, 2015: 40%, MoV: Project Progress Report)
Communities continue to be willing to participate in training (A)
Outbreak of disease affects crops, fisheries and livestock (R)
DLF, MAF,
WREA, MoLSW
2,500,000 300,000 1,100,000 1,100,000
OUTPUT 8.7.
Community-based solid waste
management and
decentralized waste water
treatment piloted
(UN-HABITAT)
No. of towns with community-based solid waste management and waste water treatment (2010: 0, 2015: 6, MoV: DHUP Annual Report)
Community waste management plans remain a priority for provincial government (A)
Provincial branches DHUP 1,200,000 0 0 1,200,000
OUTPUT 8.8.
National and local authorities
are able to effectively prepare
for and respond to food
shortages and hunger
No. of National, Provincial and District Disaster Management Committees on Disaster Preparedness & Response that have been trained (2010: 0, 2015: 65, MoV: Standard Project Reports)
No. of national and local level authorities trained to effectively prepare for and respond to hunger
Qualified local trainers are available (A)
Reliable secondary data are available (A)
NDMO, NGO TWGDMs and
clusters
400,00084 200,000 0 200,000
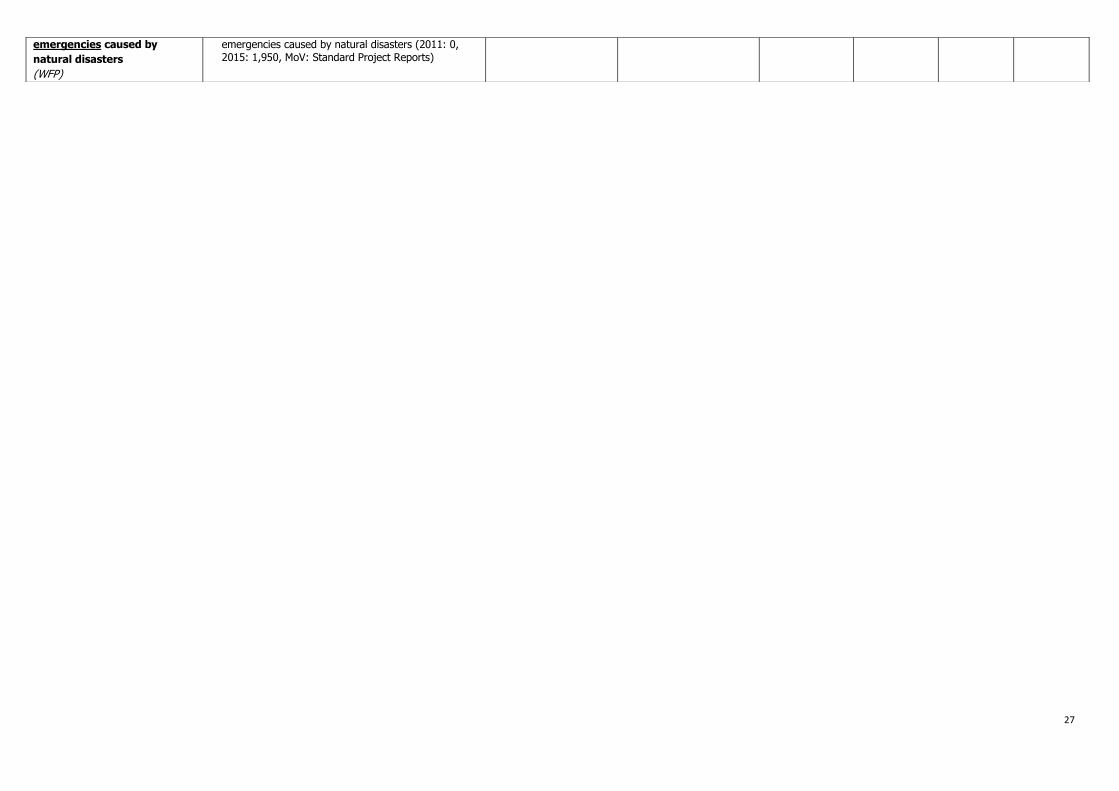
27
emergencies caused by
natural disasters
(WFP)
emergencies caused by natural disasters (2011: 0, 2015: 1,950, MoV: Standard Project Reports)
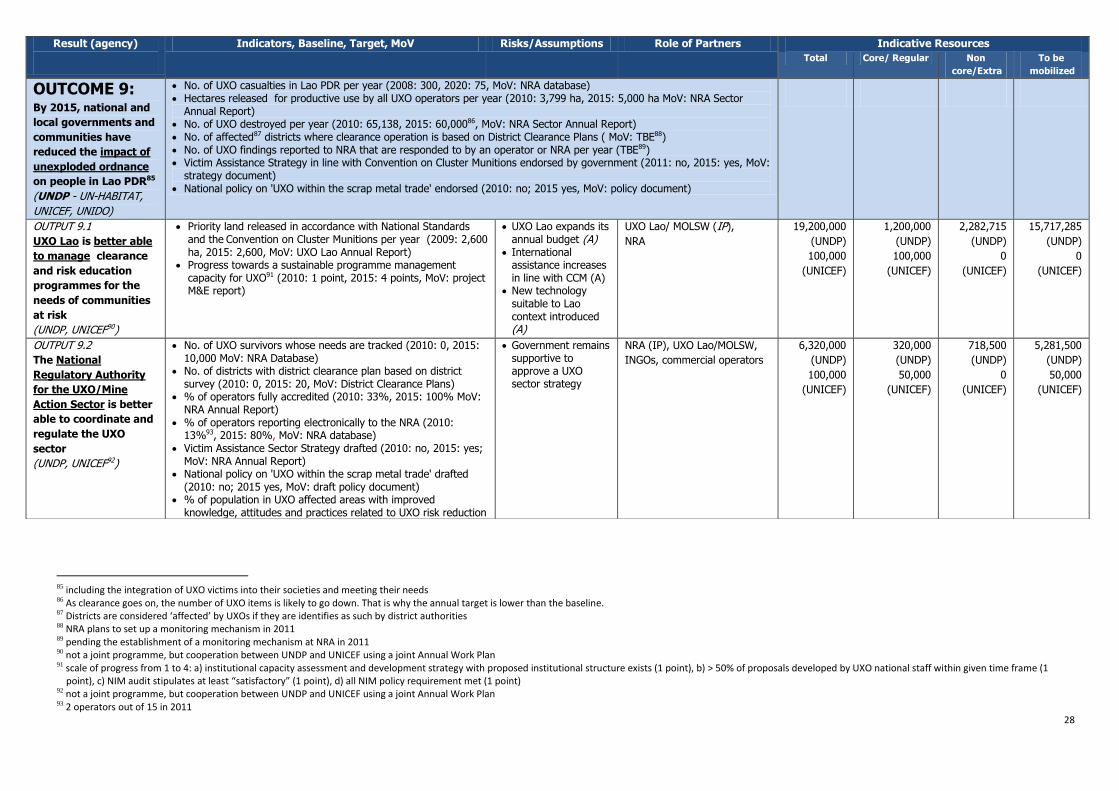
28
85 including the integration of UXO victims into their societies and meeting their needs 86 As clearance goes on, the number of UXO items is likely to go down. That is why the annual target is lower than the baseline. 87 Districts are considered ‘affected’ by UXOs if they are identifies as such by district authorities 88 NRA plans to set up a monitoring mechanism in 2011 89 pending the establishment of a monitoring mechanism at NRA in 2011 90 not a joint programme, but cooperation between UNDP and UNICEF using a joint Annual Work Plan 91 scale of progress from 1 to 4: a) institutional capacity assessment and development strategy with proposed institutional structure exists (1 point), b) > 50% of proposals developed by UXO national staff within given time frame (1
point), c) NIM audit stipulates at least “satisfactory” (1 point), d) all NIM policy requirement met (1 point) 92 not a joint programme, but cooperation between UNDP and UNICEF using a joint Annual Work Plan 93 2 operators out of 15 in 2011
Result (agency)
Indicators, Baseline, Target, MoV Risks/Assumptions Role of Partners Indicative Resources
Total Core/ Regular Non
core/Extra
To be
mobilized
OUTCOME 9: By 2015, national and
local governments and
communities have
reduced the impact of
unexploded ordnance
on people in Lao PDR85
(UNDP - UN-HABITAT,
UNICEF, UNIDO)
No. of UXO casualties in Lao PDR per year (2008: 300, 2020: 75, MoV: NRA database) Hectares released for productive use by all UXO operators per year (2010: 3,799 ha, 2015: 5,000 ha MoV: NRA Sector
Annual Report) No. of UXO destroyed per year (2010: 65,138, 2015: 60,00086, MoV: NRA Sector Annual Report) No. of affected87 districts where clearance operation is based on District Clearance Plans ( MoV: TBE88) No. of UXO findings reported to NRA that are responded to by an operator or NRA per year (TBE89) Victim Assistance Strategy in line with Convention on Cluster Munitions endorsed by government (2011: no, 2015: yes, MoV:
strategy document) National policy on 'UXO within the scrap metal trade' endorsed (2010: no; 2015 yes, MoV: policy document)
OUTPUT 9.1
UXO Lao is better able
to manage clearance
and risk education
programmes for the
needs of communities
at risk
(UNDP, UNICEF90)
Priority land released in accordance with National Standards and the Convention on Cluster Munitions per year (2009: 2,600 ha, 2015: 2,600, MoV: UXO Lao Annual Report)
Progress towards a sustainable programme management capacity for UXO91 (2010: 1 point, 2015: 4 points, MoV: project M&E report)
UXO Lao expands its annual budget (A)
International assistance increases in line with CCM (A)
New technology suitable to Lao context introduced (A)
UXO Lao/ MOLSW (IP),
NRA
19,200,000
(UNDP)
100,000
(UNICEF)
1,200,000
(UNDP)
100,000
(UNICEF)
2,282,715
(UNDP)
0
(UNICEF)
15,717,285
(UNDP)
0
(UNICEF)
OUTPUT 9.2
The National
Regulatory Authority
for the UXO/Mine
Action Sector is better
able to coordinate and
regulate the UXO
sector
(UNDP, UNICEF92)
No. of UXO survivors whose needs are tracked (2010: 0, 2015: 10,000 MoV: NRA Database)
No. of districts with district clearance plan based on district survey (2010: 0, 2015: 20, MoV: District Clearance Plans)
% of operators fully accredited (2010: 33%, 2015: 100% MoV: NRA Annual Report)
% of operators reporting electronically to the NRA (2010: 13%93, 2015: 80%, MoV: NRA database)
Victim Assistance Sector Strategy drafted (2010: no, 2015: yes; MoV: NRA Annual Report)
National policy on 'UXO within the scrap metal trade' drafted (2010: no; 2015 yes, MoV: draft policy document)
% of population in UXO affected areas with improved knowledge, attitudes and practices related to UXO risk reduction
Government remains supportive to approve a UXO sector strategy
NRA (IP), UXO Lao/MOLSW,
INGOs, commercial operators
6,320,000
(UNDP)
100,000
(UNICEF)
320,000
(UNDP)
50,000
(UNICEF)
718,500
(UNDP)
0
(UNICEF)
5,281,500
(UNDP)
50,000
(UNICEF)
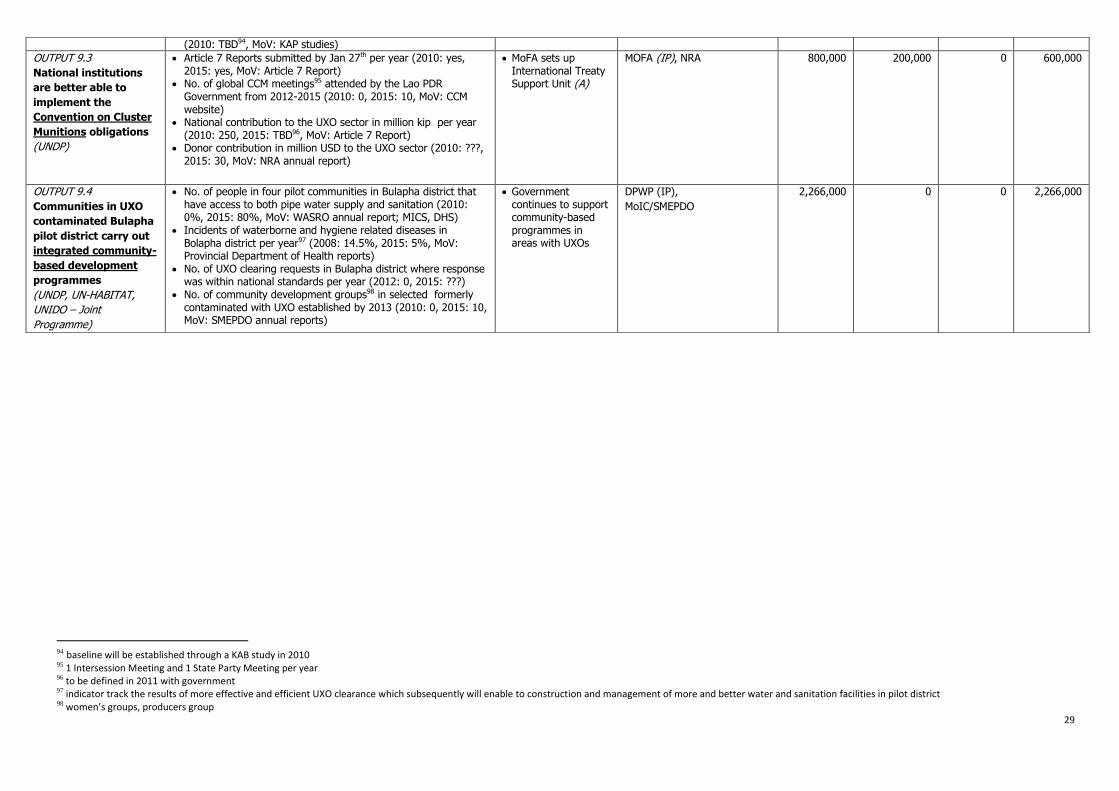
29
94 baseline will be established through a KAB study in 2010 95 1 Intersession Meeting and 1 State Party Meeting per year 96 to be defined in 2011 with government 97 indicator track the results of more effective and efficient UXO clearance which subsequently will enable to construction and management of more and better water and sanitation facilities in pilot district 98 women’s groups, producers group
(2010: TBD94, MoV: KAP studies)
OUTPUT 9.3
National institutions
are better able to
implement the
Convention on Cluster
Munitions obligations
(UNDP)
Article 7 Reports submitted by Jan 27th per year (2010: yes, 2015: yes, MoV: Article 7 Report)
No. of global CCM meetings95 attended by the Lao PDR Government from 2012-2015 (2010: 0, 2015: 10, MoV: CCM website)
National contribution to the UXO sector in million kip per year (2010: 250, 2015: TBD96, MoV: Article 7 Report)
Donor contribution in million USD to the UXO sector (2010: ???, 2015: 30, MoV: NRA annual report)
MoFA sets up International Treaty Support Unit (A)
MOFA (IP), NRA 800,000 200,000 0 600,000
OUTPUT 9.4
Communities in UXO
contaminated Bulapha
pilot district carry out
integrated community-
based development
programmes
(UNDP, UN-HABITAT,
UNIDO – Joint
Programme)
No. of people in four pilot communities in Bulapha district that have access to both pipe water supply and sanitation (2010: 0%, 2015: 80%, MoV: WASRO annual report; MICS, DHS)
Incidents of waterborne and hygiene related diseases in Bolapha district per year97 (2008: 14.5%, 2015: 5%, MoV: Provincial Department of Health reports)
No. of UXO clearing requests in Bulapha district where response was within national standards per year (2012: 0, 2015: ???)
No. of community development groups98 in selected formerly contaminated with UXO established by 2013 (2010: 0, 2015: 10, MoV: SMEPDO annual reports)
Government continues to support community-based programmes in areas with UXOs
DPWP (IP),
MoIC/SMEPDO
2,266,000
0 0 2,266,000
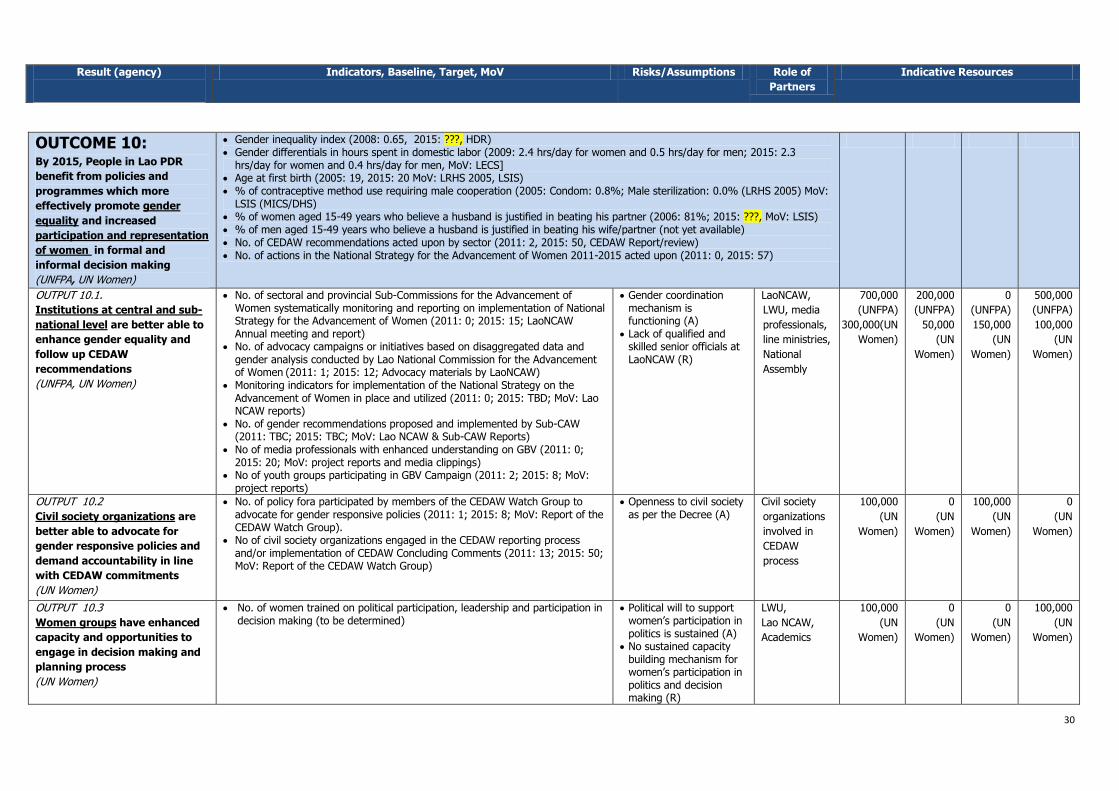
30
OUTCOME 10: By 2015, People in Lao PDR
benefit from policies and
programmes which more
effectively promote gender
equality and increased
participation and representation
of women in formal and
informal decision making
(UNFPA, UN Women)
Gender inequality index (2008: 0.65, 2015: ???, HDR) Gender differentials in hours spent in domestic labor (2009: 2.4 hrs/day for women and 0.5 hrs/day for men; 2015: 2.3
hrs/day for women and 0.4 hrs/day for men, MoV: LECS] Age at first birth (2005: 19, 2015: 20 MoV: LRHS 2005, LSIS) % of contraceptive method use requiring male cooperation (2005: Condom: 0.8%; Male sterilization: 0.0% (LRHS 2005) MoV:
LSIS (MICS/DHS) % of women aged 15-49 years who believe a husband is justified in beating his partner (2006: 81%; 2015: ???, MoV: LSIS) % of men aged 15-49 years who believe a husband is justified in beating his wife/partner (not yet available) No. of CEDAW recommendations acted upon by sector (2011: 2, 2015: 50, CEDAW Report/review) No. of actions in the National Strategy for the Advancement of Women 2011-2015 acted upon (2011: 0, 2015: 57)
OUTPUT 10.1.
Institutions at central and sub-
national level are better able to
enhance gender equality and
follow up CEDAW
recommendations
(UNFPA, UN Women)
No. of sectoral and provincial Sub-Commissions for the Advancement of Women systematically monitoring and reporting on implementation of National Strategy for the Advancement of Women (2011: 0; 2015: 15; LaoNCAW Annual meeting and report)
No. of advocacy campaigns or initiatives based on disaggregated data and gender analysis conducted by Lao National Commission for the Advancement of Women (2011: 1; 2015: 12; Advocacy materials by LaoNCAW)
Monitoring indicators for implementation of the National Strategy on the Advancement of Women in place and utilized (2011: 0; 2015: TBD; MoV: Lao NCAW reports)
No. of gender recommendations proposed and implemented by Sub-CAW (2011: TBC; 2015: TBC; MoV: Lao NCAW & Sub-CAW Reports)
No of media professionals with enhanced understanding on GBV (2011: 0; 2015: 20; MoV: project reports and media clippings)
No of youth groups participating in GBV Campaign (2011: 2; 2015: 8; MoV: project reports)
Gender coordination mechanism is functioning (A)
Lack of qualified and skilled senior officials at LaoNCAW (R)
LaoNCAW,
LWU, media
professionals,
line ministries,
National
Assembly
700,000
(UNFPA)
300,000(UN
Women)
200,000
(UNFPA)
50,000
(UN
Women)
0
(UNFPA)
150,000
(UN
Women)
500,000
(UNFPA)
100,000
(UN
Women)
OUTPUT 10.2
Civil society organizations are
better able to advocate for
gender responsive policies and
demand accountability in line
with CEDAW commitments
(UN Women)
No. of policy fora participated by members of the CEDAW Watch Group to advocate for gender responsive policies (2011: 1; 2015: 8; MoV: Report of the CEDAW Watch Group).
No of civil society organizations engaged in the CEDAW reporting process and/or implementation of CEDAW Concluding Comments (2011: 13; 2015: 50; MoV: Report of the CEDAW Watch Group)
Openness to civil society as per the Decree (A)
Civil society
organizations
involved in
CEDAW
process
100,000
(UN
Women)
0
(UN
Women)
100,000
(UN
Women)
0
(UN
Women)
OUTPUT 10.3
Women groups have enhanced
capacity and opportunities to
engage in decision making and
planning process
(UN Women)
No. of women trained on political participation, leadership and participation in decision making (to be determined)
Political will to support women‟s participation in politics is sustained (A)
No sustained capacity building mechanism for women‟s participation in politics and decision making (R)
LWU,
Lao NCAW,
Academics
100,000
(UN
Women)
0
(UN
Women)
0
(UN
Women)
100,000
(UN
Women)
Result (agency)
Indicators, Baseline, Target, MoV Risks/Assumptions Role of
Partners
Indicative Resources
31
REMARK: The UN will work towards greater gender equality and increased participation and representation of women (UNDAF outcome 4) in two ways: through specific outputs by mainstreaming gender-specific activities throughout all other outcomes

32