Embed Size (px)
Citation preview
Patron:HerMajestyTheQueen RothamstedResearchHarpenden,Herts,AL52JQTelephone:+44(0)1582763133Web:http://www.rothamsted.ac.uk/
Rothamsted Research is a Company Limited by Guarantee Registered Office: as above. Registered in England No. 2393175. Registered Charity No. 802038. VAT No. 197 4201 51. Founded in 1843 by John Bennet Lawes.
Rothamsted Repository DownloadA - Papers appearing in refereed journals
Senapati, N., Brown, H. E. and Semenov, M. A. 2019. Raising genetic
yield potential in high productive countries: Designing wheat ideotypes
under climate change. Agricultural and Forest Meteorology. 271, pp. 33-
45.
The publisher's version can be accessed at:
• https://dx.doi.org/10.1016/j.agrformet.2019.02.025
The output can be accessed at: https://repository.rothamsted.ac.uk/item/8w9y6.
© 2 March 2019, Rothamsted Research. Licensed under the Creative Commons CC BY.
12/04/2019 13:43 repository.rothamsted.ac.uk [email protected]
Contents lists available at ScienceDirect
Agricultural and Forest Meteorology
journal homepage: www.elsevier.com/locate/agrformet
Raising genetic yield potential in high productive countries: Designingwheat ideotypes under climate change
Nimai Senapatia,⁎, Hamish E. Brownb, Mikhail A. Semenova
a Department of Plant Sciences, Rothamsted Research, West Common, Harpenden, Hertfordshire, AL5 2JQ, United Kingdomb The New Zealand Institute for Plant and Food Research, Private Bag 4704, Christchurch, New Zealand
A R T I C L E I N F O
Keywords:Climate changeCrop modellingIdeotype designSirius modelWheatGenetic yield potential
A B S T R A C T
Designing crop ideotype is an important step to raise genetic yield potential in a target environment. In thepresent study, we designed wheat ideotypes based on the state-of-the-art knowledge in crop physiology to in-crease genetic yield potential for the 2050-climate, as projected by the HadGEM2 global climate model for theRCP8.5 emission scenario, in two high-wheat-productive countries, viz. the United Kingdom (UK) and NewZealand (NZ). Wheat ideotypes were optimized to maximize yield potential for both water-limited (IW2050) andpotential (IP2050) conditions by using Sirius model and exploring the full range of cultivar parameters. Onaverage, a 43–51% greater yield potential over the present winter wheat cv. Claire was achieved for IW2050 in theUK and NZ, whereas a 51–62% increase was obtained for IP2050. Yield benefits due to the potential conditionover water-limitation were small in the UK, but 13% in NZ. The yield potentials of wheat were 16% (2.6 t ha−1)and 31% (5 t ha−1) greater in NZ than in the UK under 2050-climate in water-limited and potential conditionsrespectively. Modelling predicts the possibility of substantial increase in genetic yield potential of winter wheatunder climate change in high productive countries. Wheat ideotypes optimized for future climate could provideplant scientists and breeders with a road map for selection of the target traits and their optimal combinations forwheat improvement and genetic adaptation to raise the yield potential.
1. Introduction
To ensure food security for the world’s growing population, foodproduction will need to increase by around 70% by 2050 (FAO, 2009,2014). Wheat (Triticum aestivum L.) is one of the key staple crops inglobal food security, providing about 20% of total dietary calories andprotein needs, with about 730 million tonnes of annual production froma harvested area of around 2.1 million km2 globally (FAO, 2016;Shiferaw et al., 2013). A trend of stagnating yields has already beenobserved around the world for staple crops, including wheat (Brissonet al., 2010). The widespread degradation of land and the exhaustion ofwater and other natural resources are challenging the sustainability ofcurrent food production systems (FAO, 2014). At the same time, thecombination of ongoing climate change, including increasing air tem-perature, changing precipitation patterns and quantities, the increasingfrequency and severity of extreme climatic events and adverse weatherconditions, threatens present food production and any future targets(Asseng et al., 2015; Trnka et al., 2015; Zampieri et al., 2017). With thelimited scope for extending present crop-growing areas, a considerable
increase in crop productivity is required to guarantee future food se-curity in the face of ongoing climate change (Reynolds et al., 2011).Increasing the upper limit of genetic yield potential is one of the keycomponents of an integrated approach to improve crop productivity,besides optimization of agronomic management and sustainable in-tensification (Godfray et al., 2010, Reynolds et al., 2011, 2009).
Crop yield is a quantitative trait controlled by many plant traits,where most of the traits are polygenic in nature (Shi et al., 2009; Wuet al., 2012). Raising the upper limit of genetic yield potential throughtraditional plant breeding has remained very successful, for example,increasing wheat yields by using gene encoding for the dwarfing ofplants in the Green Revolution (Hawkesford et al., 2013; Reynoldset al., 2009). However, the rate of success of the traditional plantbreeding, which is generally defined as “selection for yield”, is heavilydependent on the availability of a wide range of parents, the choice ofthe crosses to be made and the skilful evaluation of the emergentgenotypes, together with one’s share of good fortune (Donald, 1968).Conventional breeding is constrained by time and resources and is,thus, less efficient in terms of progress achieved, as desirable traits
https://doi.org/10.1016/j.agrformet.2019.02.025Received 14 December 2018; Received in revised form 12 February 2019; Accepted 17 February 2019
⁎ Corresponding author at: Rothamsted Research, West Common, Harpenden, Hertfordshire, AL5 2JQ, United Kingdom.E-mail addresses: [email protected], [email protected] (N. Senapati), [email protected] (H.E. Brown),
[email protected] (M.A. Semenov).
Agricultural and Forest Meteorology 271 (2019) 33–45
0168-1923/ © 2019 The Authors. Published by Elsevier B.V. This is an open access article under the CC BY-NC-ND license (http://creativecommons.org/licenses/BY-NC-ND/4.0/).
T
come mostly by chance without the underlying physiology being fullyunderstood (Fischer, 2007). Breeding for new cultivars of high yieldpotential in a target environment, such as future climate change, is adifferent and challenging task for plant breeders as a) understandingthe physiological basis of yield potential in a changing environment isrequired, b) selection of desirable traits and their exact combinationsfor future improvements is difficult, and c) reproducing future climaticconditions for evaluation of the performance of a new cultivar is dif-ficult. Designing crop ideotypes based on the state-of-the-art knowledgein crop physiology and assessment of their performances in the targetenvironment beforehand could help in breeding crops for high yieldpotential under climate change. Donald (1968) first proposed the ideaof ‘breeding of crop ideotypes’, in which breeders select plant ideotypesbased on their knowledge of crop physiology for improvement of planttraits in the target environment, and then breed for them. A cropideotype is a virtual idealized crop, or a crop model, that is expected toproduce a greater quality and quantity of grain yield when developed asa cultivar. Designing crop ideotypes in silico has gradually become areality with the substantial increase in computational power of moderncomputers and the significant improvements in process-based eco-physiological crop models (Donald, 1968; Senapati et al., 2018;Stratonovitch and Semenov, 2015; Tao et al., 2017). Crop modelling isthe most powerful tool for designing such crop ideotypes in target en-vironments. Crop models (a) are efficient in designing crop ideotypes interms of time and resources, (b) help in selecting optimal combinationsof target traits when considering possible trade-offs between them, (c)assess performance of potential candidates across target environments,(d) assist in deconvoluting complex traits, such as crop yield, to a list ofsimpler component traits suitable for further analysis and improvement(Gouache et al., 2017; Hammer et al., 2005; Martre et al., 2015; Rötteret al., 2015; Tao et al., 2017). In the present study, we designed wheatideotypes for raising genetic yield potential under future climate usingSirius, a process-based wheat model coupled with a powerful compu-tational framework for ideotype optimization (Jamieson et al., 1998b;Semenov and Stratonovitch, 2013; Stratonovitch and Semenov, 2010).Sirius was extensively calibrated and validated for many modern wheatcultivars, and it performed well under diverse climatic conditionsacross Europe, the USA, Australia and New Zealand, including Free-AirCO2 Enrichment experiments (Asseng et al., 2015; Jamieson et al.,2000; Jamieson and Semenov, 2000; Lawless et al., 2005; Martre et al.,2006; Semenov et al., 2007, 2009; Stratonovitch and Semenov, 2010).
High-wheat-productive countries are situated at high latitudes forvarious reasons, such as cooler seasonal temperature, sufficient rainfall,long crop-growing season, high cumulative intercepted radiation, etc.The United Kingdom (UK) and New Zealand (NZ) are two of the highproductive countries at high latitude, with an average national wheatyields of≥8 t ha−1 over the last decade (Defra, 2017; FAOSTAT, 2018).These two countries have been competing for the Guinness World Re-cords for wheat yield (16–17 t ha-1) for the last decade (GWR, 2015,2017). However, these countries are characterized with opposite wheatgrowth calendar because of their positions in different hemisphereswith different latitudes, viz. northern hemisphere (UK) and southernhemisphere (NZ). Thus, these two countries together provide a uniqueopportunity to investigate the possibility of raising the upper thresholdof wheat yield in contrasting growing conditions.
Although there are some studies on the quantitative design ofideotypes for high yield potential of winter cereals under current orfuture climatic conditions, either they involve local or manual optimi-zation of only a few traits (e.g., wheat ideotypes by Sylvester-Bradleyet al., 2012), or they do not explore the full parameter space for opti-mization (e.g., barley ideotypes by Tao et al., 2017). Ideotypes for atarget environment need to be optimized in a global multidimensionalcultivar parameter space exploring in full the parameter ranges andtheir possible interactions. Although a few studies have assessed thequantitative yield potentials of wheat ideotypes under future climaticconditions in Europe, the ideotype design was not focused on shifting
the upper threshold of genetic yield potential, particularly in highwheat productive countries at high latitude (Semenov et al., 2009;Semenov and Shewry, 2011; Semenov and Stratonovitch, 2013;Senapati et al., 2018; Stratonovitch and Semenov, 2015). The objectiveof this study was to design wheat ideotypes to increase the genetic yieldpotential in the 2050-climate as projected by the HadGEM2 global cli-mate model (GCM) for the RCP8.5 emission scenario in two high-wheat-productive countries, viz. the UK and NZ. The design methodology wasbased on the knowledge of crop physiology, the Sirius wheat simulationmodel and evolutionary optimization in the multidimensional cultivarparameter space.
2. Material and methods
2.1. Target sites
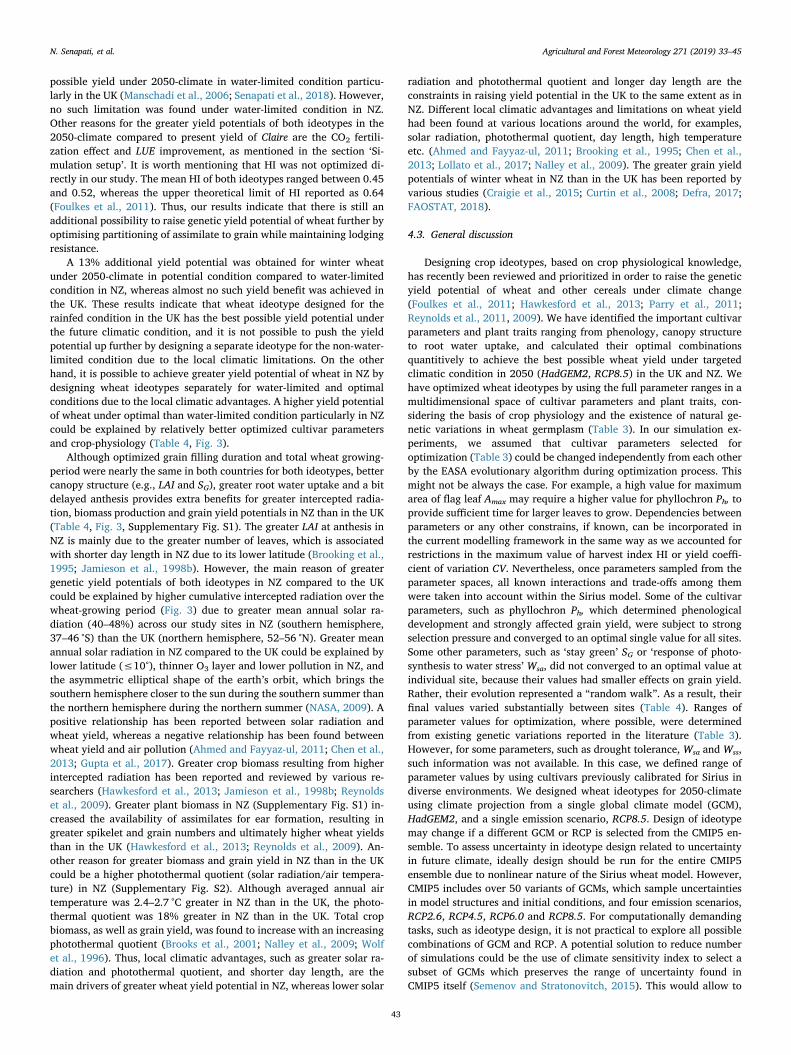
For the present study, two high wheat-productive countries, withmean national yields of ≥8 t ha−1 (FAOSTAT, 2018), were selectedfrom two different hemispheres, viz. the UK in the northern hemisphereand NZ in the southern hemisphere. Three sites were selected acrossmajor wheat-growing regions in the UK, covering high (northern)(Edinburgh: ED) and medium (Leeds: LE) to low (southern) (Ro-thamsted: RR) latitudes. Similarly, three sites were selected acrossmajor wheat-growing regions in NZ, covering high (southern) (Gore:GO) and medium (Lincoln: LI) to low (northern) (Pukekohe: PU) lati-tudes (Fig. 1). Table 1 shows the detailed site characteristics.
2.2. Baseline and target 2050-climate
30-years (1980–2010) of daily observed weather data at each studysite were used for estimating site parameters for the baseline climate.To assess inter-annual variation in crop production in the baseline cli-mate, a stochastic weather generator (LARS-WG 6.0) (Semenov andStratonovitch, 2010, 2015) was used to generate 100 years of dailyweather data at each site using the baseline site parameters, hereafterdefined as ‘baseline-climate’, or the ‘current-climate’, with an atmo-spheric CO2 concentration of 364 ppm. The ability of the LARS-WGweather generator to reproduce climatic variability and climatic ex-treme events was thoroughly tested in diverse climates (Semenov,2007, 2008; Semenov et al., 1998). The baseline-climate at each sitewas used for evaluation of the performance of a local winter wheatcultivar in present conditions. The target 2050 climate at each site wasbased on projection from the HadGEM2 global climate model from theCMIP5 ensemble (Taylor et al., 2012) for the period 2040–2060 for theRepresentative Concentration Pathway of 8.5 (RCP8.5), with an atmo-spheric CO2 concentration of 541 ppm (Riahi et al., 2011). Similar tothe baseline, 100 years of daily weather data for 2050 were generatedat each site by using LARS-WG 6.0, hereafter defined as the ‘2050-cli-mate’ (HadGEM2, RCP8.5). The daily 2050-climate data were used astarget climatic conditions to design wheat ideotypes and evaluate theirperformances in comparison to the baseline.
In the baseline-climate, mean annual air temperature, annual pre-cipitation and mean daily global radiation were 9.3 °C, 681mm yr−1
and 9.0MJm-2 day−1 respectively in the UK, and 12 °C, 956mm yr−1
and 13.3MJm-2 day-1 respectively in NZ (Fig. 1, Table 1). This re-presents 2.7 °C, 40% and 48% greater mean annual air temperature,mean annual precipitation and daily mean global radiation, respec-tively in NZ compared to the UK. There were increasing trends intemperature and global radiation between sites from high (northern) tolow (southern) latitudes in the UK (ED–RR). Similar trends were alsofound among sites in NZ from high (southern) to low (northern) lati-tudes (GO–PU). In the UK, annual precipitation was almost equally highat ED and RR, and lowest at LE, whereas annual precipitation for NZwas highest at PU and lowest at LI. In the 2050-climate, averaged airtemperature and global radiation increased compared to the baseline-climate by 2.1 °C and 6.7% respectively in the UK, and 1.9 °C and 1.1%
N. Senapati, et al. Agricultural and Forest Meteorology 271 (2019) 33–45
34
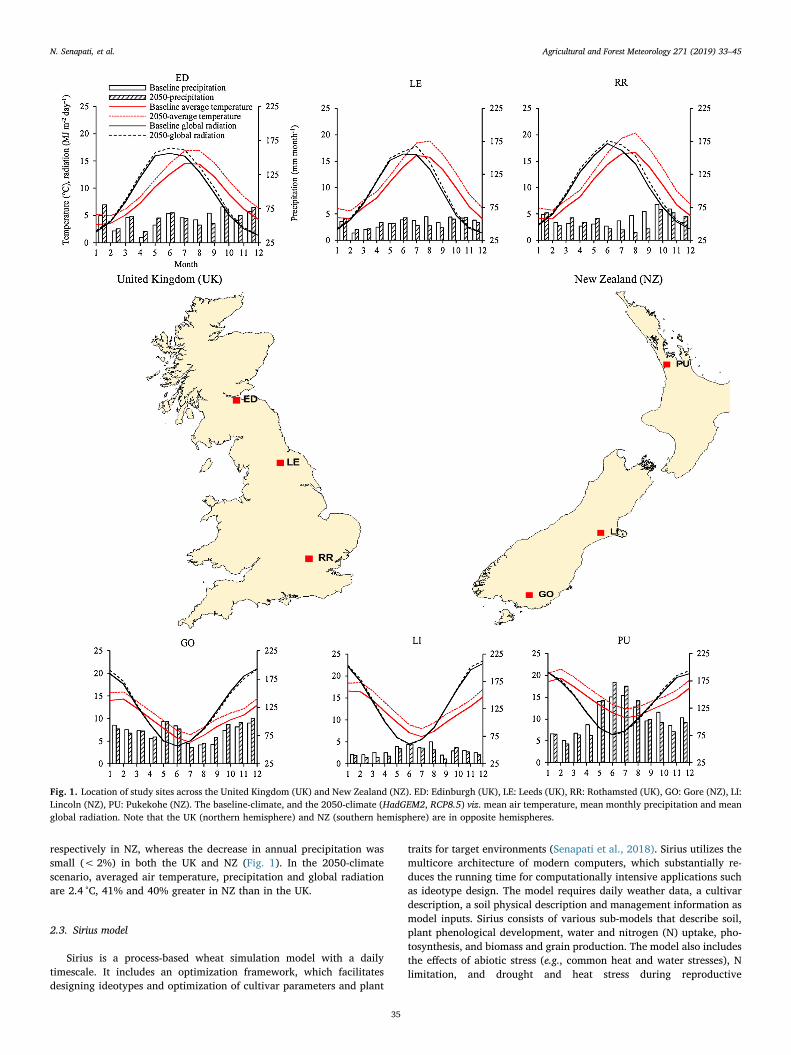
respectively in NZ, whereas the decrease in annual precipitation wassmall (< 2%) in both the UK and NZ (Fig. 1). In the 2050-climatescenario, averaged air temperature, precipitation and global radiationare 2.4 °C, 41% and 40% greater in NZ than in the UK.
2.3. Sirius model
Sirius is a process-based wheat simulation model with a dailytimescale. It includes an optimization framework, which facilitatesdesigning ideotypes and optimization of cultivar parameters and plant
traits for target environments (Senapati et al., 2018). Sirius utilizes themulticore architecture of modern computers, which substantially re-duces the running time for computationally intensive applications suchas ideotype design. The model requires daily weather data, a cultivardescription, a soil physical description and management information asmodel inputs. Sirius consists of various sub-models that describe soil,plant phenological development, water and nitrogen (N) uptake, pho-tosynthesis, and biomass and grain production. The model also includesthe effects of abiotic stress (e.g., common heat and water stresses), Nlimitation, and drought and heat stress during reproductive
Fig. 1. Location of study sites across the United Kingdom (UK) and New Zealand (NZ). ED: Edinburgh (UK), LE: Leeds (UK), RR: Rothamsted (UK), GO: Gore (NZ), LI:Lincoln (NZ), PU: Pukekohe (NZ). The baseline-climate, and the 2050-climate (HadGEM2, RCP8.5) viz. mean air temperature, mean monthly precipitation and meanglobal radiation. Note that the UK (northern hemisphere) and NZ (southern hemisphere) are in opposite hemispheres.
N. Senapati, et al. Agricultural and Forest Meteorology 271 (2019) 33–45
35
development on photosynthesis, biomass production and grain yield.Table 2 shows the important cultivar parameters used in Sirius. Briefly,photosynthesis and biomass production are simulated on a daily basisas the product of intercepted photosynthetically active radiation (PAR)and radiation use efficiency (RUE), limited by temperature and waterstress. Phyllochron (Ph) and day length response (Pp) control the rate ofcrop development. Phenological development is calculated from themainstem leaf appearance rate and final leaf numbers, with the latterdetermined by responses to day length and vernalisation. Canopy isdescribed as a series of leaf layers associated with individual mainstemleaves. Leaf area development in each layer is simulated by a thermaltime sub-model, and actual leaf area is calculated using a simple lim-itation rule. Leaf senescence is expressed in thermal time and linked tothe rank of the leaf in the canopy. Total canopy senescence synchro-nizes with the end of grain filling. Leaf senescence could be acceleratedby N limitation to sustain green leaves and grain filling, or by abioticstress, viz. temperature or water stresses. Soil is described as a cascadeof 5-cm layers up to a user-defined depth. Photosynthesis and newbiomass production are reduced by water stress proportionally to theresponse of photosynthesis to water stress. The water stress reducesphotosynthesis and biomass production during the crop-growingperiod. Water stress also increases the rate of leaf senescence, whichultimately reduces the grain yield. Drought and heat stresses, especiallyduring the reproductive phase, decrease the primary fertile grain set-ting number as a result of the abnormal development of both ovary andanthers, the premature abortion of florets, and the irreversible abortionand sterility of both male and female reproductive organs and game-tophytes. Sirius computes a drought stress factor (DSF) and heat stress
index (HSI) to estimate the effects of drought and heat stresses re-spectively on the primary grain setting number during reproductivedevelopment. Additionally, the potential weight of grain could belimited by heat stress and water limitation during grain filling andendosperm development. A detailed description of the Sirius model canbe found elsewhere (Brooks et al., 2001; Jamieson and Semenov, 2000;Jamieson et al., 1998b; Lawless et al., 2005; Semenov andStratonovitch, 2013; Senapati et al., 2018; Stratonovitch and Semenov,2015).
2.4. Designing wheat ideotypes for raising genetic yield potential for the2050-climate
In the present study, a crop ideotype was defined as a subset ofSirius cultivar parameters that would deliver high yield performance ina target environment when optimized (Table 3). A cultivar, which isbased on an ideotype and utilizes its optimal combination of trait va-lues, would deliver optimal yields for the environment in question.Claire is a popular winter wheat variety in Europe, including the UK,and in NZ for its soft milling, early sowing, lodging and disease-resistantcharacteristics, and consistent high yield performance (Limagrain,2018; Powell et al., 2013). For the same reasons, Claire has been usedextensively as a parent in many wheat breeding programmes (Powellet al., 2013). In the present study, the local winter wheat cv. Claire wasused as a parent for designing wheat ideotypes. The Sirius model wascalibrated for Claire as being heat- and drought-sensitive during re-productive development. A list of the 22 Sirius cultivar parameters ascalibrated for Claire is presented in Table 2. In our study, only eight
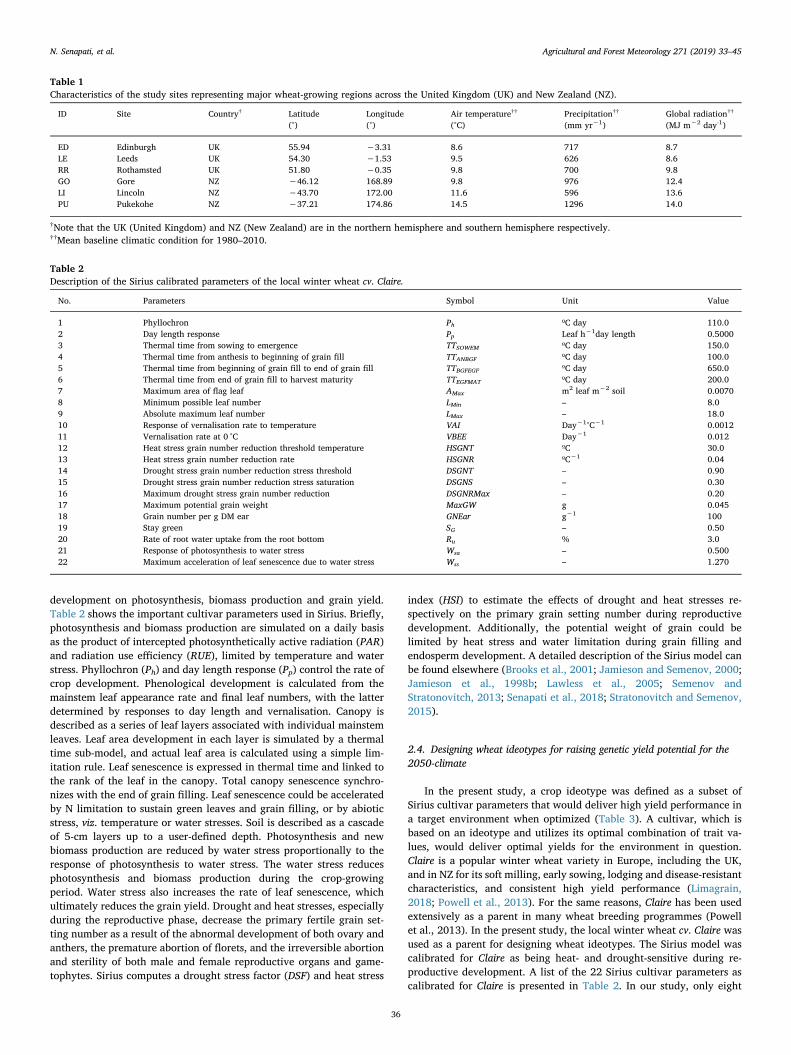
Table 1Characteristics of the study sites representing major wheat-growing regions across the United Kingdom (UK) and New Zealand (NZ).
ID Site Country† Latitude Longitude Air temperature†† Precipitation†† Global radiation††
(°) (°) (°C) (mm yr−1) (MJ m−2 day-1)
ED Edinburgh UK 55.94 −3.31 8.6 717 8.7LE Leeds UK 54.30 −1.53 9.5 626 8.6RR Rothamsted UK 51.80 −0.35 9.8 700 9.8GO Gore NZ −46.12 168.89 9.8 976 12.4LI Lincoln NZ −43.70 172.00 11.6 596 13.6PU Pukekohe NZ −37.21 174.86 14.5 1296 14.0
†Note that the UK (United Kingdom) and NZ (New Zealand) are in the northern hemisphere and southern hemisphere respectively.††Mean baseline climatic condition for 1980–2010.
Table 2Description of the Sirius calibrated parameters of the local winter wheat cv. Claire.
No. Parameters Symbol Unit Value
1 Phyllochron Ph ºC day 110.02 Day length response Pp Leaf h−1day length 0.50003 Thermal time from sowing to emergence TTSOWEM ºC day 150.04 Thermal time from anthesis to beginning of grain fill TTANBGF ºC day 100.05 Thermal time from beginning of grain fill to end of grain fill TTBGFEGF ºC day 650.06 Thermal time from end of grain fill to harvest maturity TTEGFMAT ºC day 200.07 Maximum area of flag leaf AMax m2 leaf m−2 soil 0.00708 Minimum possible leaf number LMin – 8.09 Absolute maximum leaf number LMax – 18.010 Response of vernalisation rate to temperature VAI Day−1°C−1 0.001211 Vernalisation rate at 0 °C VBEE Day−1 0.01212 Heat stress grain number reduction threshold temperature HSGNT ºC 30.013 Heat stress grain number reduction rate HSGNR ºC−1 0.0414 Drought stress grain number reduction stress threshold DSGNT – 0.9015 Drought stress grain number reduction stress saturation DSGNS – 0.3016 Maximum drought stress grain number reduction DSGNRMax – 0.2017 Maximum potential grain weight MaxGW g 0.04518 Grain number per g DM ear GNEar g−1 10019 Stay green SG – 0.5020 Rate of root water uptake from the root bottom Ru % 3.021 Response of photosynthesis to water stress Wsa – 0.50022 Maximum acceleration of leaf senescence due to water stress Wss – 1.270
N. Senapati, et al. Agricultural and Forest Meteorology 271 (2019) 33–45
36
cultivar parameters were selected from the above list for optimization(Table 3). As winter wheat is mostly grown under rainfed condition inthe UK and NZ, we designed a wheat ideotype for the water-limitedcondition (rainfed) under 2050-climate (IW2050). Additionally, as irri-gation is also available in NZ at present and will probably be availablein the future, we designed a wheat ideotype for the potential condition(irrigated or no-water limitation) under 2050-climate (IP2050). Both theideotypes, viz. IW2050 and IP2050, were optimized to raise the geneticyield potential under 2050-climate in the UK and NZ.
2.5. Target traits for improvement under the 2050-climate
A total of eight Sirius cultivar parameters related with differentimportant plant traits, viz. growth rate, phenological development, re-sponse to abiotic stresses etc., were selected to design wheat ideotypesfor increasing yield potential due to their a) large natural variationsobserved in wheat germplasms, b) potential for improvement throughgenetic adaptation, and c) importance in improving wheat yield underfuture climate change (Semenov et al., 2014; Semenov andStratonovitch, 2013). The targeted traits are summarized in Table 3 anddescribed briefly below.
2.5.1. PhenologyThe phyllochron (Ph) is the thermal time required for the appear-
ance of successive leaves, and day length response (Pp) is the responseof the final leaf number to day length (Brooking et al., 1995; Jamiesonet al., 2007, 1998a, 1998b). An optimal flowering time and anthesis inrelation to seasonal variations of temperature, solar radiation, daylength and water availability are critical factors in maximizing grainyield (Akkaya et al., 2006; Richards, 2006). The rate of crop develop-ment and, consequently, the timing of anthesis and maturity could bealtered by modifying Ph and Pp in plants (Jamieson et al., 2007;Semenov et al., 2014). The duration of grain filling (Gf) is an importanttrait for increasing grain yield in wheat (Evans and Fischer, 1999). InSirius, Gf is defined as the cultivar-specific thermal time that needs to beaccumulated to complete grain filling. During grain filling, assimilatesfor the grain are available from two sources, viz. new photosynthatesproduced from intercepted radiation and water-soluble carbohydratesstored mostly in the stem before anthesis. In Sirius, the labile carbo-hydrate pool is calculated as a fixed 25% of biomass at anthesis and istranslocated to the grain during grain filling. Increasing Gf will increasethe amount of radiation intercepted by the crop and, consequently,grain yield. Under stress conditions, when grain growth could be ter-minated early as a result of leaves dying before the end of grain filling
due to water or heat stress, grain yield will decrease not only because ofthe reduction in intercepted radiation, but also because not all of thelabile carbohydrate pool will be translocated to the grain due to theshortage of time (Brooks et al., 2001; Semenov and Halford, 2009).
2.5.2. CanopyThe rate of canopy expansion and achievement of the optimal ca-
nopy development and leaf area index are the key factors affecting thecumulative amount of intercepted radiation and transpiration demandduring the growing season. The potential maximum area of flag leaf(AMax) is a key trait in modifying the rate of canopy expansion and themaximum achievable leaf area index (LAI), which in turn will changethe pattern of light interception and transpiration and, therefore, affectcrop growth and final grain yield (Semenov and Stratonovitch, 2013;Semenov et al., 2014). On the other hand, reduced AMax could help toavoid drought stress by reducing transpiration and root water uptake.Delaying leaf senescence after anthesis is a possible strategy to increasegrain yield by extending the duration of leaf senescence and main-taining the green leaf area longer: the so-called ‘stay green’ trait (SG)(Christopher et al., 2016; Luche et al., 2015; Silva et al., 2001).
2.5.3. Root water uptakeIn Sirius, we assume that only a proportion of available soil water
can be extracted from each layer in the root zone by the plant on anyday, depending on efficiency of water extraction (λ) and rate of rootwater uptake (Ru). The proportion of daily water extractable by theplant declines from 10% at the top of the soil to Ru at maximum rootlength. Faster root water uptake could reduce the current water stressexperienced by plant in anticipation of additional available water laterin the season in the form of precipitation or irrigation. In contrast, analternative strategy of slower root water uptake might increase yield indry environments by conserving water for successful completion of thelife cycle (Manschadi et al., 2006).
2.5.4. Drought toleranceWater stress adversely affects both source and sink strength in
plants. Photosynthesis and biomass production are reduced by waterstress. New biomass production decreases proportionally to the re-sponse of photosynthesis to water stress (Wsa). The rate of leaf senes-cence increases under water stress due to the modification in daily in-crement of thermal time by a factor termed maximum acceleration ofleaf senescence due to water stress (Wss). Earlier leaf senescence willreduce grain yield due to reduction in intercepted radiation and pho-tosynthesis and also reduction in translocation of the labile plant
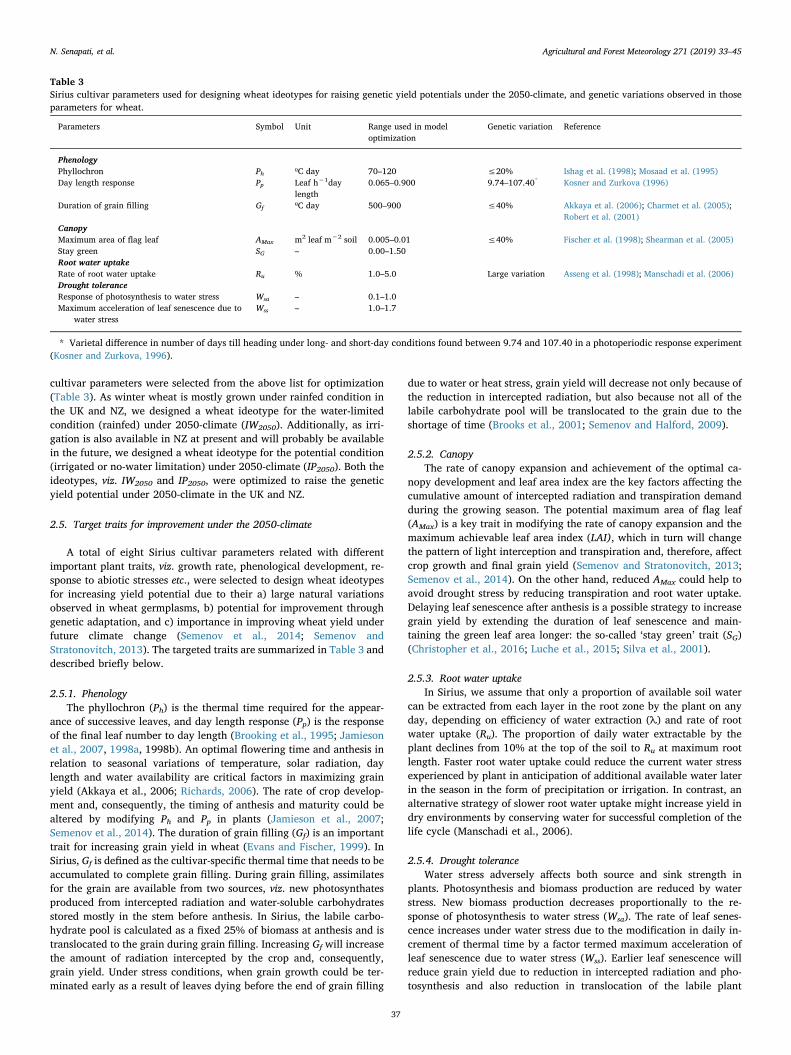
Table 3Sirius cultivar parameters used for designing wheat ideotypes for raising genetic yield potentials under the 2050-climate, and genetic variations observed in thoseparameters for wheat.
Parameters Symbol Unit Range used in modeloptimization
Genetic variation Reference
PhenologyPhyllochron Ph ºC day 70–120 ≤20% Ishag et al. (1998); Mosaad et al. (1995)Day length response Pp Leaf h−1day
length0.065–0.900 9.74–107.40* Kosner and Zurkova (1996)
Duration of grain filling Gf ºC day 500–900 ≤40% Akkaya et al. (2006); Charmet et al. (2005);Robert et al. (2001)
CanopyMaximum area of flag leaf AMax m2 leaf m−2 soil 0.005–0.01 ≤40% Fischer et al. (1998); Shearman et al. (2005)Stay green SG – 0.00–1.50Root water uptakeRate of root water uptake Ru % 1.0–5.0 Large variation Asseng et al. (1998); Manschadi et al. (2006)Drought toleranceResponse of photosynthesis to water stress Wsa – 0.1–1.0Maximum acceleration of leaf senescence due to
water stressWss – 1.0–1.7
* Varietal difference in number of days till heading under long- and short-day conditions found between 9.74 and 107.40 in a photoperiodic response experiment(Kosner and Zurkova, 1996).
N. Senapati, et al. Agricultural and Forest Meteorology 271 (2019) 33–45
37
reserve carbohydrate to the grain due to premature termination of grainfilling. Drought tolerance traits such as reduced Wsa and Wss could bebeneficial in rainfed conditions under drought (Semenov et al., 2009,2014; Semenov and Halford, 2009).
2.6. Ideotype optimization under the 2050-climate
At each site in the UK and NZ, for both ideotypes, IW2050 and IP2050,the eight selected parameters were optimized to maximize wheat yieldunder the 2050-climate (Table 3 and 4). An evolutionary search algo-rithm with self-adaptation (EASA) was used in Sirius to optimize cul-tivar parameters in a high-dimensional parameter space with a complexfitness function for the best performance of crop ideotypes (Schwefeland Rudolph, 1995; Semenov and Terkel, 2003; Stratonovitch andSemenov, 2010). The EASA is a universal search optimization method,in which control parameters, inherited from a parent, determine var-iation in the target parameters, mutate randomly and independently,and evolve along with the target parameters to accelerate convergence(Semenov and Terkel, 2003). In each step of optimization, 16 newcandidate ideotypes were generated from a ‘parent’ by perturbing itscultivar parameters randomly within the parameters’ ranges as definedin Table 3. As mentioned in “Designing wheat ideotypes”, the local winterwheat cv. Claire was used as a parent in our study, and the parameterranges were based on model calibrations for existing modern wheatcultivars, allowing variations corresponding to the existing wheatgermplasm (Table 3) (Akkaya et al., 2006; Kosner and Zurkova, 1996;Manschadi et al., 2006; Mosaad et al., 1995; Semenov and Halford,2009; Shearman et al., 2005). Then for each candidate, yields weresimulated for 100 years of future climate scenario. The candidate withthe highest mean yield was selected as a parent for the next step.Candidates with a coefficient of variation (CV) of yield exceeding 10%or a harvest index (HI) over 0.64 were removed from the selectionprocess. A CV of less than 10% guarantees high yield stability, which isa desirable trait in future cultivars, while the upper limit of HI wasreported as 0.64 (Foulkes et al., 2011). The optimization process con-tinued until no further improvement in yield potential was possible, orparameters converged to optimal values. To avoid convergence to a
local maximum and to explore fully the parameter spaces, we initializedEASA with multiple ‘parents’. For each site, we used eight parentsrandomly scattered in the parameter space, except one parent that hasthe same cultivar parameters as Claire. For each of the eight initialparents, EASA converges to an optimal combination of parameters; thebest of the eight was selected as an optimal ideotype for a selected site.
2.7. Simulation setup
We used Sirius version 2018, which is available from https://sites.google.com/view/sirius-wheat. A single soil-water profile, Rothamsted,with a total available water capacity of 210mm, was used for all sites inthe UK, and a single soil-water profile, Lincoln, with a total availablewater capacity of 270mm, was used for all sites in NZ, to eliminate site-specific soil effects from the analysis. The soil profile was filled with themaximum available water capacity at sowing in both countries, the UKand NZ. Typical sowing dates of 20-October in the UK and 20-April inNZ were used. The performance of the current local winter wheat cv.Claire, as characterized before (Table 2), was simulated with waterlimitation under the baseline- (CLBase) and 2050-climate (CL2050) toprovide a baseline for comparison and assess future climate impacts oncv. Claire. In Sirius, radiation use efficiency (RUE) is proportional toatmospheric [CO2], with an increase of 30% for doubling in [CO2]compared with the baseline of 338 ppm, which agrees with the recentmeta-analysis of different field-scale experiments on the effects of [CO2]on crop (Vanuytrecht et al., 2012). A similar response is used by otherwheat simulation models, such as CERES (Jamieson et al., 2000) andEPIC (Tubiello et al., 2000). For designing ideotype for the 2050-cli-mate, a 10% increase in light use efficiency (LUE) was assumed (Zhuet al., 2010). Zhu et al. (2010) showed that 10% more carbon would beassimilated if the Rubisco specificity factor (λ) that represents thediscrimination between CO2 and O2, is optimal under the current [CO2]level. Both wheat ideotypes, IW2050 and IP2050, were optimized in-dependently for each site for the maximum yield under 2050-climatic(HadGEM2, RCP8.5) condition. In all simulations, we assumed optimalagronomic managements, e.g. no N limitation or yield losses due todisease, pests or competition with weeds.
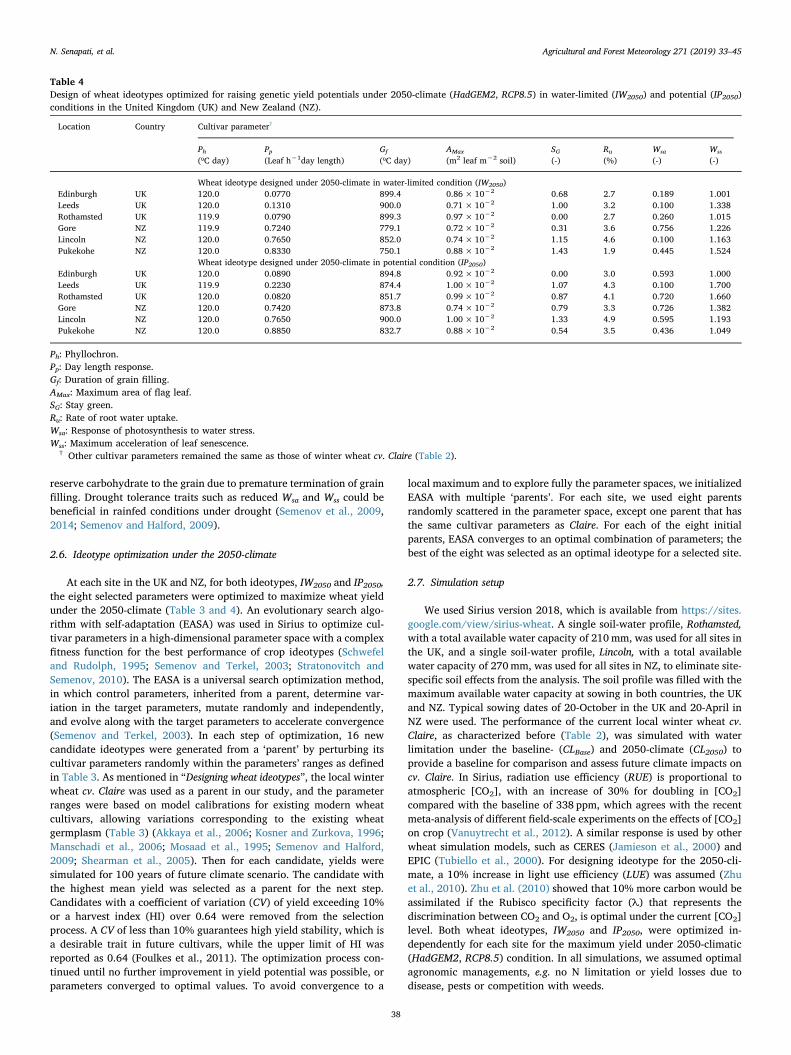
Table 4Design of wheat ideotypes optimized for raising genetic yield potentials under 2050-climate (HadGEM2, RCP8.5) in water-limited (IW2050) and potential (IP2050)conditions in the United Kingdom (UK) and New Zealand (NZ).
Location Country Cultivar parameter†
Ph Pp Gf AMax SG Ru Wsa Wss
(ºC day) (Leaf h−1day length) (ºC day) (m2 leaf m−2 soil) (-) (%) (-) (-)
Wheat ideotype designed under 2050-climate in water-limited condition (IW2050)Edinburgh UK 120.0 0.0770 899.4 0.86× 10⁻² 0.68 2.7 0.189 1.001Leeds UK 120.0 0.1310 900.0 0.71× 10⁻² 1.00 3.2 0.100 1.338Rothamsted UK 119.9 0.0790 899.3 0.97× 10⁻² 0.00 2.7 0.260 1.015Gore NZ 119.9 0.7240 779.1 0.72× 10⁻² 0.31 3.6 0.756 1.226Lincoln NZ 120.0 0.7650 852.0 0.74× 10⁻² 1.15 4.6 0.100 1.163Pukekohe NZ 120.0 0.8330 750.1 0.88× 10⁻² 1.43 1.9 0.445 1.524
Wheat ideotype designed under 2050-climate in potential condition (IP2050)Edinburgh UK 120.0 0.0890 894.8 0.92× 10⁻² 0.00 3.0 0.593 1.000Leeds UK 119.9 0.2230 874.4 1.00× 10⁻² 1.07 4.3 0.100 1.700Rothamsted UK 120.0 0.0820 851.7 0.99× 10⁻² 0.87 4.1 0.720 1.660Gore NZ 120.0 0.7420 873.8 0.74× 10⁻² 0.79 3.3 0.726 1.382Lincoln NZ 120.0 0.7650 900.0 1.00× 10⁻² 1.33 4.9 0.595 1.193Pukekohe NZ 120.0 0.8850 832.7 0.88× 10⁻² 0.54 3.5 0.436 1.049
Ph: Phyllochron.Pp: Day length response.Gf: Duration of grain filling.AMax: Maximum area of flag leaf.SG: Stay green.Ru: Rate of root water uptake.Wsa: Response of photosynthesis to water stress.Wss: Maximum acceleration of leaf senescence.
† Other cultivar parameters remained the same as those of winter wheat cv. Claire (Table 2).
N. Senapati, et al. Agricultural and Forest Meteorology 271 (2019) 33–45
38
3. Results
3.1. Grain yield of cv. Claire under baseline- and 2050-climate
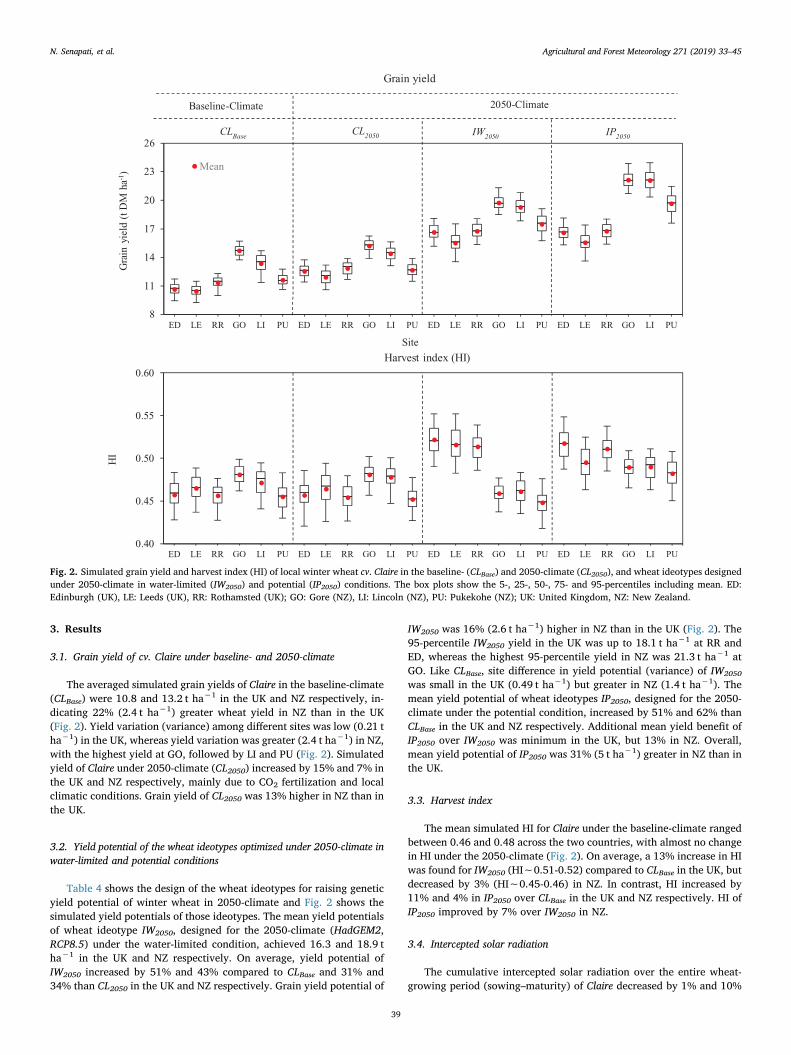
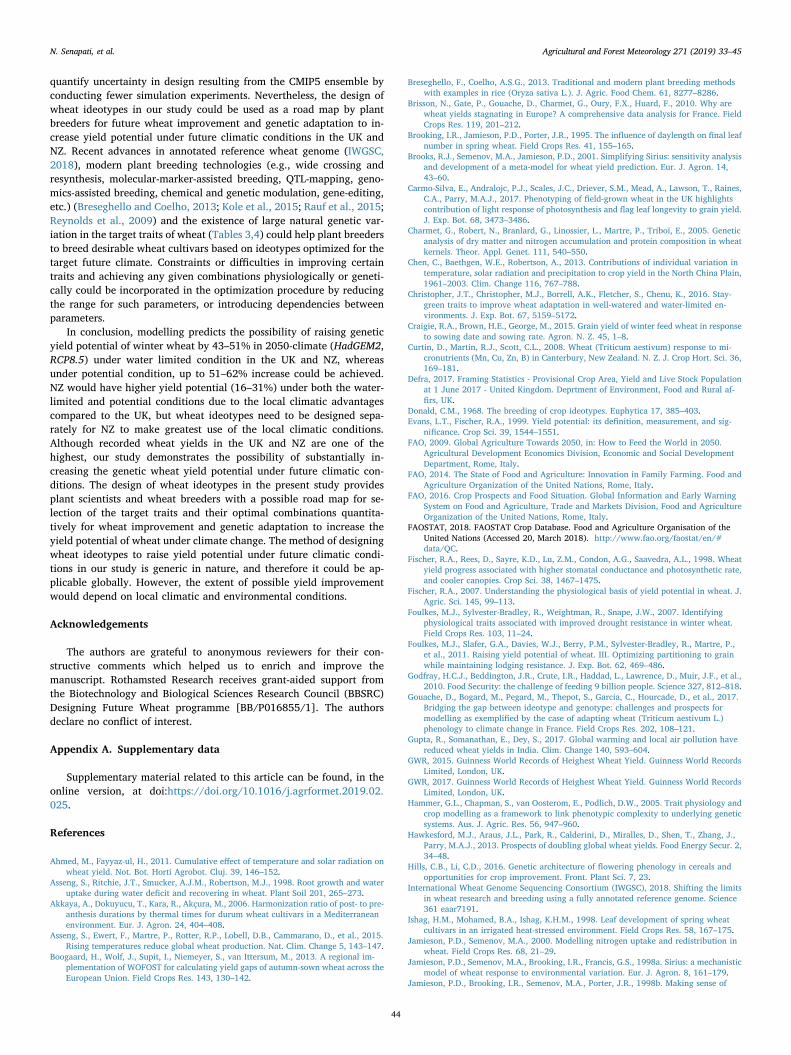
The averaged simulated grain yields of Claire in the baseline-climate(CLBase) were 10.8 and 13.2 t ha−1 in the UK and NZ respectively, in-dicating 22% (2.4 t ha−1) greater wheat yield in NZ than in the UK(Fig. 2). Yield variation (variance) among different sites was low (0.21 tha−1) in the UK, whereas yield variation was greater (2.4 t ha−1) in NZ,with the highest yield at GO, followed by LI and PU (Fig. 2). Simulatedyield of Claire under 2050-climate (CL2050) increased by 15% and 7% inthe UK and NZ respectively, mainly due to CO2 fertilization and localclimatic conditions. Grain yield of CL2050 was 13% higher in NZ than inthe UK.
3.2. Yield potential of the wheat ideotypes optimized under 2050-climate inwater-limited and potential conditions
Table 4 shows the design of the wheat ideotypes for raising geneticyield potential of winter wheat in 2050-climate and Fig. 2 shows thesimulated yield potentials of those ideotypes. The mean yield potentialsof wheat ideotype IW2050, designed for the 2050-climate (HadGEM2,RCP8.5) under the water-limited condition, achieved 16.3 and 18.9 tha−1 in the UK and NZ respectively. On average, yield potential ofIW2050 increased by 51% and 43% compared to CLBase and 31% and34% than CL2050 in the UK and NZ respectively. Grain yield potential of
IW2050 was 16% (2.6 t ha−1) higher in NZ than in the UK (Fig. 2). The95-percentile IW2050 yield in the UK was up to 18.1 t ha−1 at RR andED, whereas the highest 95-percentile yield in NZ was 21.3 t ha−1 atGO. Like CLBase, site difference in yield potential (variance) of IW2050
was small in the UK (0.49 t ha−1) but greater in NZ (1.4 t ha−1). Themean yield potential of wheat ideotypes IP2050, designed for the 2050-climate under the potential condition, increased by 51% and 62% thanCLBase in the UK and NZ respectively. Additional mean yield benefit ofIP2050 over IW2050 was minimum in the UK, but 13% in NZ. Overall,mean yield potential of IP2050 was 31% (5 t ha−1) greater in NZ than inthe UK.
3.3. Harvest index
The mean simulated HI for Claire under the baseline-climate rangedbetween 0.46 and 0.48 across the two countries, with almost no changein HI under the 2050-climate (Fig. 2). On average, a 13% increase in HIwas found for IW2050 (HI∼0.51-0.52) compared to CLBase in the UK, butdecreased by 3% (HI∼0.45-0.46) in NZ. In contrast, HI increased by11% and 4% in IP2050 over CLBase in the UK and NZ respectively. HI ofIP2050 improved by 7% over IW2050 in NZ.
3.4. Intercepted solar radiation
The cumulative intercepted solar radiation over the entire wheat-growing period (sowing–maturity) of Claire decreased by 1% and 10%
Fig. 2. Simulated grain yield and harvest index (HI) of local winter wheat cv. Claire in the baseline- (CLBase) and 2050-climate (CL2050), and wheat ideotypes designedunder 2050-climate in water-limited (IW2050) and potential (IP2050) conditions. The box plots show the 5-, 25-, 50-, 75- and 95-percentiles including mean. ED:Edinburgh (UK), LE: Leeds (UK), RR: Rothamsted (UK); GO: Gore (NZ), LI: Lincoln (NZ), PU: Pukekohe (NZ); UK: United Kingdom, NZ: New Zealand.
N. Senapati, et al. Agricultural and Forest Meteorology 271 (2019) 33–45
39
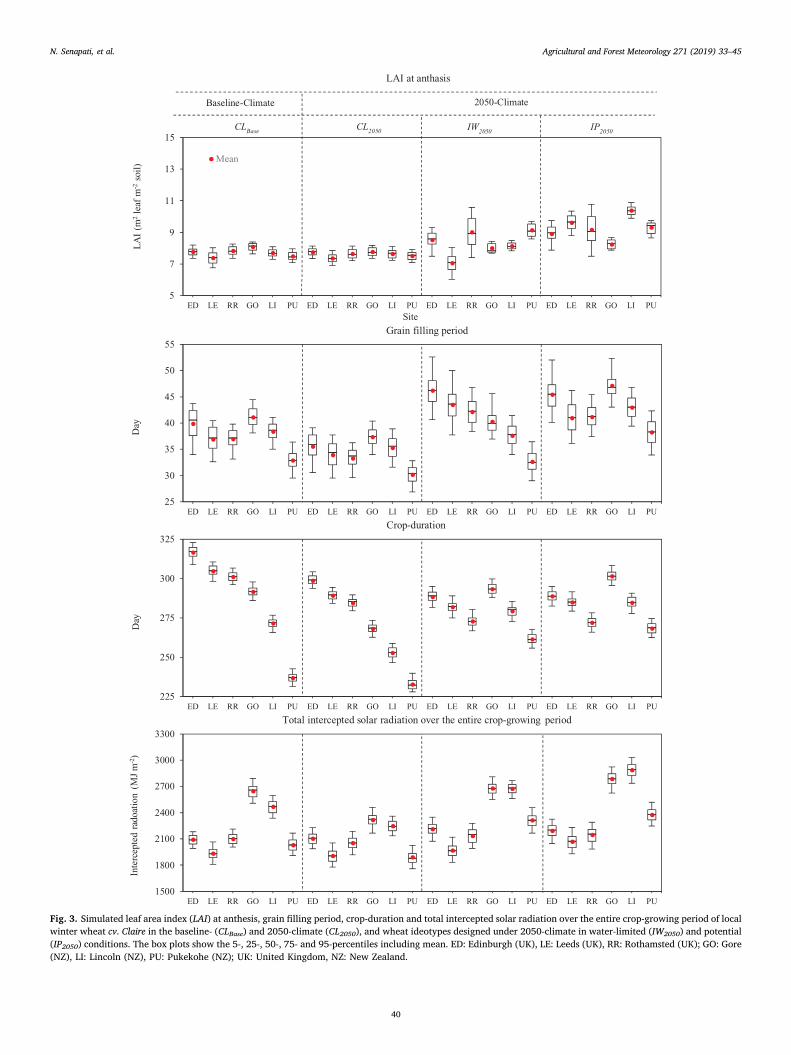
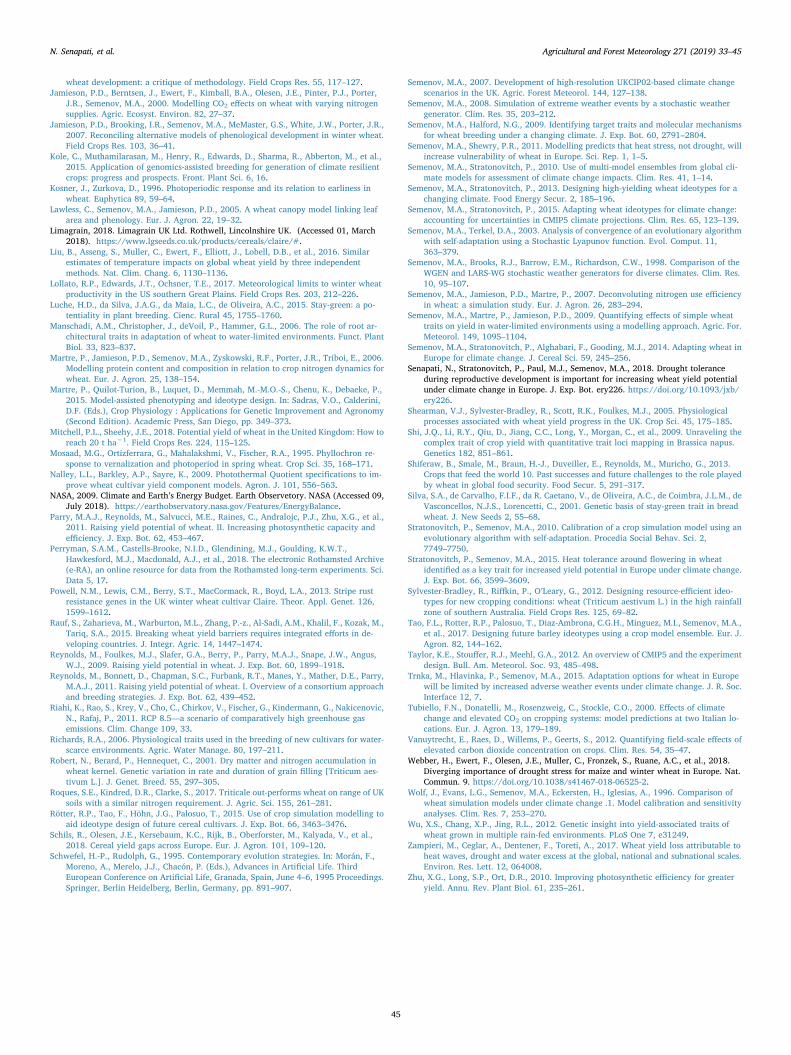
Fig. 3. Simulated leaf area index (LAI) at anthesis, grain filling period, crop-duration and total intercepted solar radiation over the entire crop-growing period of localwinter wheat cv. Claire in the baseline- (CLBase) and 2050-climate (CL2050), and wheat ideotypes designed under 2050-climate in water-limited (IW2050) and potential(IP2050) conditions. The box plots show the 5-, 25-, 50-, 75- and 95-percentiles including mean. ED: Edinburgh (UK), LE: Leeds (UK), RR: Rothamsted (UK); GO: Gore(NZ), LI: Lincoln (NZ), PU: Pukekohe (NZ); UK: United Kingdom, NZ: New Zealand.
N. Senapati, et al. Agricultural and Forest Meteorology 271 (2019) 33–45
40
under 2050-climate compared to the baseline-climate in the UK and NZrespectively (Fig. 3). On contrary, intercepted radiation increased by3–8% for IW2050 and 5–13% for IP2050. Total intercepted radiationswere 17%, 7%, 21% and 26% greater in NZ than in the UK for CLBase,CL2050, IW2050 and IP2050 respectively.
3.5. Crop canopy
Averaged simulated leaf area index (LAI) at anthesis of CLBase was7.7 and 7.8 in the UK and NZ respectively (Fig. 3). Mean LAI remainedalmost the same for CL2050 compared to CLBase, but increased by 7 and9% for IW2050 and 21% and 20% for IP2050 in the UK and NZ respec-tively. On an average, LAI at anthesis was 1–3% greater in NZ than inthe UK for CLBase, CL2050, IW2050 and IP2050. Table 4 shows associatedimprovements in the optimized cultivar parameter ‘Maximum area offlag leaf’ AMax for IW2050 and IP2050. On an average, 12% and 93%improvements were found in the ‘stay green’ trait SG for IW2050 com-pared to CLBase in the UK and NZ respectively, whereas improvementsin SG were 29% and 77% for IP2050 (Table 4). The mean optimized SGvalue of IW2050 was 72% greater in NZ than in the UK, whereas SG was37% greater for IP2050 in NZ than in the UK.
3.6. Wheat phenology
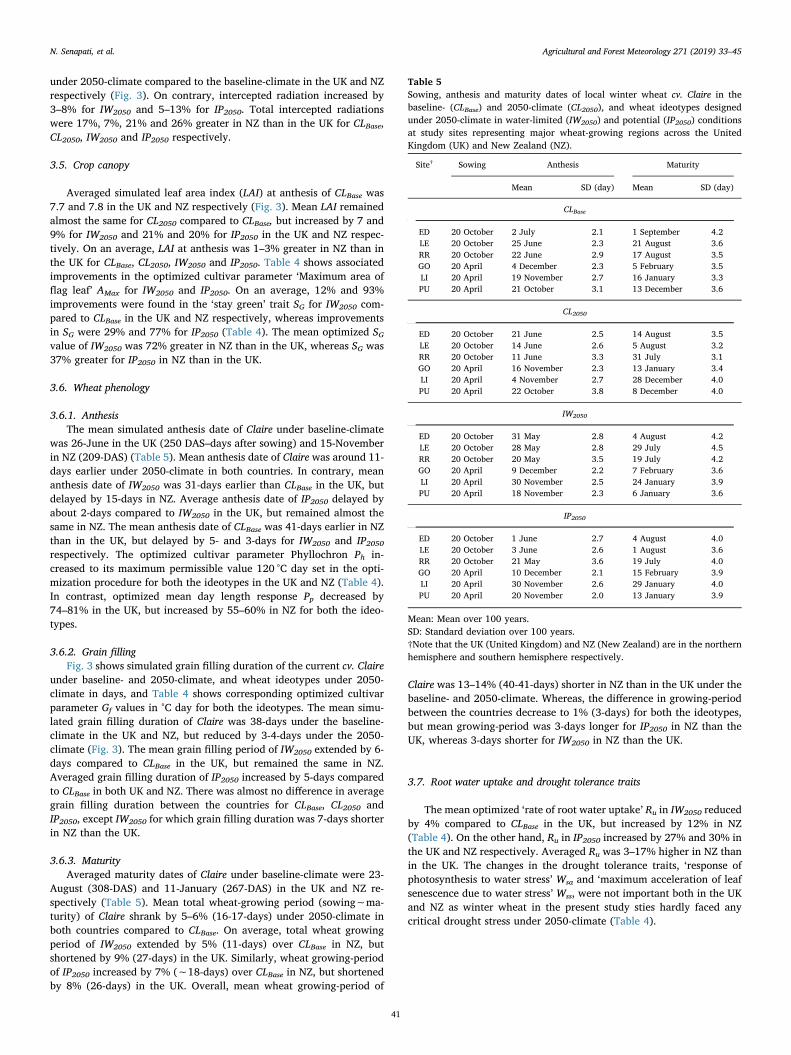
3.6.1. AnthesisThe mean simulated anthesis date of Claire under baseline-climate
was 26-June in the UK (250 DAS–days after sowing) and 15-Novemberin NZ (209-DAS) (Table 5). Mean anthesis date of Claire was around 11-days earlier under 2050-climate in both countries. In contrary, meananthesis date of IW2050 was 31-days earlier than CLBase in the UK, butdelayed by 15-days in NZ. Average anthesis date of IP2050 delayed byabout 2-days compared to IW2050 in the UK, but remained almost thesame in NZ. The mean anthesis date of CLBase was 41-days earlier in NZthan in the UK, but delayed by 5- and 3-days for IW2050 and IP2050respectively. The optimized cultivar parameter Phyllochron Ph in-creased to its maximum permissible value 120 °C day set in the opti-mization procedure for both the ideotypes in the UK and NZ (Table 4).In contrast, optimized mean day length response Pp decreased by74–81% in the UK, but increased by 55–60% in NZ for both the ideo-types.
3.6.2. Grain fillingFig. 3 shows simulated grain filling duration of the current cv. Claire
under baseline- and 2050-climate, and wheat ideotypes under 2050-climate in days, and Table 4 shows corresponding optimized cultivarparameter Gf values in °C day for both the ideotypes. The mean simu-lated grain filling duration of Claire was 38-days under the baseline-climate in the UK and NZ, but reduced by 3-4-days under the 2050-climate (Fig. 3). The mean grain filling period of IW2050 extended by 6-days compared to CLBase in the UK, but remained the same in NZ.Averaged grain filling duration of IP2050 increased by 5-days comparedto CLBase in both UK and NZ. There was almost no difference in averagegrain filling duration between the countries for CLBase, CL2050 andIP2050, except IW2050 for which grain filling duration was 7-days shorterin NZ than the UK.
3.6.3. MaturityAveraged maturity dates of Claire under baseline-climate were 23-
August (308-DAS) and 11-January (267-DAS) in the UK and NZ re-spectively (Table 5). Mean total wheat-growing period (sowing∼ma-turity) of Claire shrank by 5–6% (16-17-days) under 2050-climate inboth countries compared to CLBase. On average, total wheat growingperiod of IW2050 extended by 5% (11-days) over CLBase in NZ, butshortened by 9% (27-days) in the UK. Similarly, wheat growing-periodof IP2050 increased by 7% (∼18-days) over CLBase in NZ, but shortenedby 8% (26-days) in the UK. Overall, mean wheat growing-period of
Claire was 13–14% (40-41-days) shorter in NZ than in the UK under thebaseline- and 2050-climate. Whereas, the difference in growing-periodbetween the countries decrease to 1% (3-days) for both the ideotypes,but mean growing-period was 3-days longer for IP2050 in NZ than theUK, whereas 3-days shorter for IW2050 in NZ than the UK.
3.7. Root water uptake and drought tolerance traits
The mean optimized ‘rate of root water uptake’ Ru in IW2050 reducedby 4% compared to CLBase in the UK, but increased by 12% in NZ(Table 4). On the other hand, Ru in IP2050 increased by 27% and 30% inthe UK and NZ respectively. Averaged Ru was 3–17% higher in NZ thanin the UK. The changes in the drought tolerance traits, ‘response ofphotosynthesis to water stress’ Wsa and ‘maximum acceleration of leafsenescence due to water stress’ Wss, were not important both in the UKand NZ as winter wheat in the present study sties hardly faced anycritical drought stress under 2050-climate (Table 4).
Table 5Sowing, anthesis and maturity dates of local winter wheat cv. Claire in thebaseline- (CLBase) and 2050-climate (CL2050), and wheat ideotypes designedunder 2050-climate in water-limited (IW2050) and potential (IP2050) conditionsat study sites representing major wheat-growing regions across the UnitedKingdom (UK) and New Zealand (NZ).
Site† Sowing Anthesis Maturity
Mean SD (day) Mean SD (day)
CLBase
ED 20 October 2 July 2.1 1 September 4.2LE 20 October 25 June 2.3 21 August 3.6RR 20 October 22 June 2.9 17 August 3.5GO 20 April 4 December 2.3 5 February 3.5LI 20 April 19 November 2.7 16 January 3.3PU 20 April 21 October 3.1 13 December 3.6
CL2050
ED 20 October 21 June 2.5 14 August 3.5LE 20 October 14 June 2.6 5 August 3.2RR 20 October 11 June 3.3 31 July 3.1GO 20 April 16 November 2.3 13 January 3.4LI 20 April 4 November 2.7 28 December 4.0PU 20 April 22 October 3.8 8 December 4.0
IW2050
ED 20 October 31 May 2.8 4 August 4.2LE 20 October 28 May 2.8 29 July 4.5RR 20 October 20 May 3.5 19 July 4.2GO 20 April 9 December 2.2 7 February 3.6LI 20 April 30 November 2.5 24 January 3.9PU 20 April 18 November 2.3 6 January 3.6
IP2050
ED 20 October 1 June 2.7 4 August 4.0LE 20 October 3 June 2.6 1 August 3.6RR 20 October 21 May 3.6 19 July 4.0GO 20 April 10 December 2.1 15 February 3.9LI 20 April 30 November 2.6 29 January 4.0PU 20 April 20 November 2.0 13 January 3.9
Mean: Mean over 100 years.SD: Standard deviation over 100 years.†Note that the UK (United Kingdom) and NZ (New Zealand) are in the northernhemisphere and southern hemisphere respectively.
N. Senapati, et al. Agricultural and Forest Meteorology 271 (2019) 33–45
41
4. Discussion
4.1. Simulated grain yield of cv. Claire under baseline and future climate
The mean simulated grain yields of the local winter wheat cv. Claire,used in our study, were 10.8 t ha−1 in the UK and 13.2 t ha-1 in NZunder the baseline (1980–2010) climatic condition, which is2.6–3.4 times greater than the global average wheat yield of 3 t ha-1
(FAOSTAT, 2018). High winter wheat yield in the UK and NZ could belinked to low air temperature (9–15 °C) and sufficient precipitation(596–1296mm yr-1), with very few or almost no extreme climaticevents and abiotic stresses (e.g., heat and drought stresses), which en-sure slow growth and longer crop maturity (237–317 days). These re-sults in greater cumulative intercepted solar radiation over the growingseason, and higher total crop biomass and grain yields in these twohigh-latitude (56 °N–46 °S) countries. For similar reasons, the highestwheat productive countries are generally lie at high latitudes, for ex-amples, Ireland, Belgium, the Netherlands, including NZ and the UK(FAOSTAT, 2018; Hawkesford et al., 2013). The mean simulated wheatyields in our study are 39–57% greater than the national averages of theUK and NZ (FAOSTAT, 2018). This could be explained by our as-sumptions about agronomic management practices that are effective inmeeting the N demand and achieving full control of any weed, diseaseand pest infestations, factors that may reduce the national mean wheatyield. The mean baseline wheat yields in the present study are close togood year wheat yields (8–14 t ha-1) as reported by various studiesacross the UK and NZ (Carmo-Silva et al., 2017; Craigie et al., 2015;Curtin et al., 2008; Perryman et al., 2018; Roques et al., 2017). Dif-ferent studies reported similar yield potentials of current wheat culti-vars under optimal managements in high productive countries at highlatitude (Boogaard et al., 2013; Schils et al., 2018).
Yield of cereal crops including wheat is generally predicted to re-duce under future climate change due to mainly increase temperature,changing precipitation pattern and quantity, and increasing climateextreme events, which are supposed to erode positive impacts of CO2
fertilization under future climatic condition (Asseng et al., 2015; Liuet al., 2016). Our simulation study predicts that anthesis of Claire willbe early and total crop growing period as well as grain filling durationwill be shortened under 2050-climate both in the UK and NZ, resultingreduction in cumulative intercepted solar radiation (1–10%). These canbe explained by an increase in air temperature which speeds up the cropphenological development. Reduction in total intercepted radiationreduces total photosynthesis, biomass production and ultimately grainyield. Nevertheless, grain yield of Claire increased by 7–15% under2050-climate in our study, as CO2 fertilization ([CO2] 541 ppm, 49%increase compared to baseline [CO2] of 364 ppm) overrides the nega-tive impacts of reduced intercepted radiation in the UK and NZ. Manystudies reported an increase in wheat production due to CO2 fertiliza-tion under future climatic conditions in high productive countries athigh latitude, such as NW-Europe including the UK (Semenov andShewry, 2011; Webber et al., 2018).
4.2. Wheat ideotypes designed for raising genetic yield potential under2050-climate
In the present study, wheat ideotypes were optimized for raisinggenetic yield potential under 2050-climate (HadGEM2, RCP8.5) in bothwater-limited (IW2050) and potential conditions (IP2050) in the two highproductive countries viz. the UK and NZ. Modelling predicts the possi-bility of increasing mean yield potential of winter wheat to 16-19 tha−1 (43–51%) under 2050-climate in water limited condition in theUK and NZ, whereas 16-21 t ha-1 (51–62%) in the potential condition.Various experimental and review studies indicated necessity of cropimprovement, genetic adaptation and new cultivars for increasing theyield potential of wheat under climate change (Reynolds et al., 2011;Semenov and Halford, 2009; Semenov et al., 2014). Mitchell and
Sheehy (2018) have recently indicated that potential wheat yield couldreach to 20 t ha-1 in the UK under optimal condition from new wheatcultivars. Craigie et al. (2015) obtained wheat yield a maximum of15.9 t ha-1 in their experimental fields in NZ and believe that furtherincrease is possible with the improved future cultivars.
The increase in yield potential of both the wheat ideotypes (IW2050
and IP2050) compared to Claire is due to the improvements in both thesources (e.g., photosynthate and biomass) and sink sizes (e.g., grainnumber) resulting from optimised cultivar parameters and plant traitsunder 2050-climate. The optimized canopy structure under 2050-cli-mate, in terms of LAI at flowering and ‘stay green’ trait SG, is one reasonof increasing genetic yield potential of both ideotypes compared topresent cv. Claire. Greater LAI leads to greater intercepted radiation andphotosynthesis, whereas improved SG is an important trait for delayingleaf secession, maintaining the green leaf tissue longer after anthesis forphotosynthesis, and increasing biomass, HI and grain yield under bothwater-limited and potential conditions (Christopher et al., 2016;Foulkes et al., 2007; Luche et al., 2015; Richards, 2006; Semenov andStratonovitch, 2013). Improved grain filling duration is another im-portant trait for raising yield potentials of both ideotypes. Extendinggrain filling period not only increases intercepted radiation and pho-tosynthesis after anthesis for direct grain filling, but also increase thechance of complete translocation of plant-reserved labile carbohydrateinto grain, and thus improved HI and grain yield (Brooks et al., 2001;Semenov and Stratonovitch, 2013). The phyllochron Ph and day lengthresponse Pp are two plant traits which mostly control the rate of cropphenological development, and the timing of anthesis and maturity(Brooking et al., Jamieson et al., 1998a). The rate of crop development,and anthesis and maturity time could be manipulated by modifying Phand Pp (Jamieson et al., 2007; Semenov et al., 2014). Increased Ph inboth the ideotypes, IW2050 and IP2050, is beneficial for keeping the rateof crop development lower under higher temperatures in the 2050-climate. A slower phenological development supports a longer cropduration, resulting in greater intercepted radiation and crop yield. Anoptimal anthesis date is one of the key traits for high yield potential, asfavourable environmental conditions at anthesis promotes greater pri-mary grain seating (Hills and Li, 2016). Timing of athesis (early/late)influences also biomass production and labile carbohydrate reserve atanthesis. Our results show that a late anthesis is beneficial for high yieldpotential of both ideotypes under 2050-climate in NZ, but an earlyanthesis is important in the UK. Additional model runs with the lateanthesis under 2050-climate in the UK revealed that a higher tem-perature during grain filling was the main reason for compromise be-tween early anthesis and extended grain filling duration for a betteryield potential in the UK, whereas no such limitation was found in NZ.Present results predict that longer wheat growing season compared toClaire is important under 2050-climate for high yield potential of bothideotypes particularly in NZ. The delayed anthesis and maturity help toincrease total intercepted solar radiation, photosynthesis, biomassproduction and grain yield NZ (Hawkesford et al., 2013; Semenov andStratonovitch, 2013). However, a shorter wheat-growing season thanthe current cv. Claire is beneficial to optimize anthesis, grain fillingduration, intercepted radiation and ultimately the grain yield under2050-climate in the UK. Relatively longer day length during wheatgrowing period in the UK than NZ due to the higher latitude is anotherconstraint in increasing leaf number, and hence delaying anthesis andextending maturity in the UK. In Sirius, final leaf number before an-thesis decreases with increasing day length, resulting in a shorter ve-getative stage and early flowering and maturity (Brooking et al., 1995;Jamieson et al., 1998b). Increased optimized trait ‘rate of root wateruptake’ Ru in both the ideotypes in NZ and IP2050 in the UK compared toClaire shows that improvement in rate of root water uptake is helpful toincrease biomass and grain yield potentials and to satisfy any waterstress particularly under potential condition in both countries. On thecontrary, a reduced rate of root water uptake would be an importantstrategy for successful completion of the crop life-cycle along with best
N. Senapati, et al. Agricultural and Forest Meteorology 271 (2019) 33–45
42
possible yield under 2050-climate in water-limited condition particu-larly in the UK (Manschadi et al., 2006; Senapati et al., 2018). However,no such limitation was found under water-limited condition in NZ.Other reasons for the greater yield potentials of both ideotypes in the2050-climate compared to present yield of Claire are the CO2 fertili-zation effect and LUE improvement, as mentioned in the section ‘Si-mulation setup’. It is worth mentioning that HI was not optimized di-rectly in our study. The mean HI of both ideotypes ranged between 0.45and 0.52, whereas the upper theoretical limit of HI reported as 0.64(Foulkes et al., 2011). Thus, our results indicate that there is still anadditional possibility to raise genetic yield potential of wheat further byoptimising partitioning of assimilate to grain while maintaining lodgingresistance.
A 13% additional yield potential was obtained for winter wheatunder 2050-climate in potential condition compared to water-limitedcondition in NZ, whereas almost no such yield benefit was achieved inthe UK. These results indicate that wheat ideotype designed for therainfed condition in the UK has the best possible yield potential underthe future climatic condition, and it is not possible to push the yieldpotential up further by designing a separate ideotype for the non-water-limited condition due to the local climatic limitations. On the otherhand, it is possible to achieve greater yield potential of wheat in NZ bydesigning wheat ideotypes separately for water-limited and optimalconditions due to the local climatic advantages. A higher yield potentialof wheat under optimal than water-limited condition particularly in NZcould be explained by relatively better optimized cultivar parametersand crop-physiology (Table 4, Fig. 3).
Although optimized grain filling duration and total wheat growing-period were nearly the same in both countries for both ideotypes, bettercanopy structure (e.g., LAI and SG), greater root water uptake and a bitdelayed anthesis provides extra benefits for greater intercepted radia-tion, biomass production and grain yield potentials in NZ than in the UK(Table 4, Fig. 3, Supplementary Fig. S1). The greater LAI at anthesis inNZ is mainly due to the greater number of leaves, which is associatedwith shorter day length in NZ due to its lower latitude (Brooking et al.,1995; Jamieson et al., 1998b). However, the main reason of greatergenetic yield potentials of both ideotypes in NZ compared to the UKcould be explained by higher cumulative intercepted radiation over thewheat-growing period (Fig. 3) due to greater mean annual solar ra-diation (40–48%) across our study sites in NZ (southern hemisphere,37–46 °S) than the UK (northern hemisphere, 52–56 °N). Greater meanannual solar radiation in NZ compared to the UK could be explained bylower latitude (≤10°), thinner O3 layer and lower pollution in NZ, andthe asymmetric elliptical shape of the earth’s orbit, which brings thesouthern hemisphere closer to the sun during the southern summer thanthe northern hemisphere during the northern summer (NASA, 2009). Apositive relationship has been reported between solar radiation andwheat yield, whereas a negative relationship has been found betweenwheat yield and air pollution (Ahmed and Fayyaz-ul, 2011; Chen et al.,2013; Gupta et al., 2017). Greater crop biomass resulting from higherintercepted radiation has been reported and reviewed by various re-searchers (Hawkesford et al., 2013; Jamieson et al., 1998b; Reynoldset al., 2009). Greater plant biomass in NZ (Supplementary Fig. S1) in-creased the availability of assimilates for ear formation, resulting ingreater spikelet and grain numbers and ultimately higher wheat yieldsthan in the UK (Hawkesford et al., 2013; Reynolds et al., 2009). An-other reason for greater biomass and grain yield in NZ than in the UKcould be a higher photothermal quotient (solar radiation/air tempera-ture) in NZ (Supplementary Fig. S2). Although averaged annual airtemperature was 2.4–2.7 °C greater in NZ than in the UK, the photo-thermal quotient was 18% greater in NZ than in the UK. Total cropbiomass, as well as grain yield, was found to increase with an increasingphotothermal quotient (Brooks et al., 2001; Nalley et al., 2009; Wolfet al., 1996). Thus, local climatic advantages, such as greater solar ra-diation and photothermal quotient, and shorter day length, are themain drivers of greater wheat yield potential in NZ, whereas lower solar
radiation and photothermal quotient and longer day length are theconstraints in raising yield potential in the UK to the same extent as inNZ. Different local climatic advantages and limitations on wheat yieldhad been found at various locations around the world, for examples,solar radiation, photothermal quotient, day length, high temperatureetc. (Ahmed and Fayyaz-ul, 2011; Brooking et al., 1995; Chen et al.,2013; Lollato et al., 2017; Nalley et al., 2009). The greater grain yieldpotentials of winter wheat in NZ than in the UK has been reported byvarious studies (Craigie et al., 2015; Curtin et al., 2008; Defra, 2017;FAOSTAT, 2018).
4.3. General discussion
Designing crop ideotypes, based on crop physiological knowledge,has recently been reviewed and prioritized in order to raise the geneticyield potential of wheat and other cereals under climate change(Foulkes et al., 2011; Hawkesford et al., 2013; Parry et al., 2011;Reynolds et al., 2011, 2009). We have identified the important cultivarparameters and plant traits ranging from phenology, canopy structureto root water uptake, and calculated their optimal combinationsquantitively to achieve the best possible wheat yield under targetedclimatic condition in 2050 (HadGEM2, RCP8.5) in the UK and NZ. Wehave optimized wheat ideotypes by using the full parameter ranges in amultidimensional space of cultivar parameters and plant traits, con-sidering the basis of crop physiology and the existence of natural ge-netic variations in wheat germplasm (Table 3). In our simulation ex-periments, we assumed that cultivar parameters selected foroptimization (Table 3) could be changed independently from each otherby the EASA evolutionary algorithm during optimization process. Thismight not be always the case. For example, a high value for maximumarea of flag leaf Amax may require a higher value for phyllochron Ph, toprovide sufficient time for larger leaves to grow. Dependencies betweenparameters or any other constrains, if known, can be incorporated inthe current modelling framework in the same way as we accounted forrestrictions in the maximum value of harvest index HI or yield coeffi-cient of variation CV. Nevertheless, once parameters sampled from theparameter spaces, all known interactions and trade-offs among themwere taken into account within the Sirius model. Some of the cultivarparameters, such as phyllochron Ph, which determined phenologicaldevelopment and strongly affected grain yield, were subject to strongselection pressure and converged to an optimal single value for all sites.Some other parameters, such as ‘stay green’ SG or ‘response of photo-synthesis to water stress’ Wsa, did not converged to an optimal value atindividual site, because their values had smaller effects on grain yield.Rather, their evolution represented a “random walk”. As a result, theirfinal values varied substantially between sites (Table 4). Ranges ofparameter values for optimization, where possible, were determinedfrom existing genetic variations reported in the literature (Table 3).However, for some parameters, such as drought tolerance, Wsa and Wss,such information was not available. In this case, we defined range ofparameter values by using cultivars previously calibrated for Sirius indiverse environments. We designed wheat ideotypes for 2050-climateusing climate projection from a single global climate model (GCM),HadGEM2, and a single emission scenario, RCP8.5. Design of ideotypemay change if a different GCM or RCP is selected from the CMIP5 en-semble. To assess uncertainty in ideotype design related to uncertaintyin future climate, ideally design should be run for the entire CMIP5ensemble due to nonlinear nature of the Sirius wheat model. However,CMIP5 includes over 50 variants of GCMs, which sample uncertaintiesin model structures and initial conditions, and four emission scenarios,RCP2.6, RCP4.5, RCP6.0 and RCP8.5. For computationally demandingtasks, such as ideotype design, it is not practical to explore all possiblecombinations of GCM and RCP. A potential solution to reduce numberof simulations could be the use of climate sensitivity index to select asubset of GCMs which preserves the range of uncertainty found inCMIP5 itself (Semenov and Stratonovitch, 2015). This would allow to
N. Senapati, et al. Agricultural and Forest Meteorology 271 (2019) 33–45
43
quantify uncertainty in design resulting from the CMIP5 ensemble byconducting fewer simulation experiments. Nevertheless, the design ofwheat ideotypes in our study could be used as a road map by plantbreeders for future wheat improvement and genetic adaptation to in-crease yield potential under future climatic conditions in the UK andNZ. Recent advances in annotated reference wheat genome (IWGSC,2018), modern plant breeding technologies (e.g., wide crossing andresynthesis, molecular-marker-assisted breeding, QTL-mapping, geno-mics-assisted breeding, chemical and genetic modulation, gene-editing,etc.) (Breseghello and Coelho, 2013; Kole et al., 2015; Rauf et al., 2015;Reynolds et al., 2009) and the existence of large natural genetic var-iation in the target traits of wheat (Tables 3,4) could help plant breedersto breed desirable wheat cultivars based on ideotypes optimized for thetarget future climate. Constraints or difficulties in improving certaintraits and achieving any given combinations physiologically or geneti-cally could be incorporated in the optimization procedure by reducingthe range for such parameters, or introducing dependencies betweenparameters.
In conclusion, modelling predicts the possibility of raising geneticyield potential of winter wheat by 43–51% in 2050-climate (HadGEM2,RCP8.5) under water limited condition in the UK and NZ, whereasunder potential condition, up to 51–62% increase could be achieved.NZ would have higher yield potential (16–31%) under both the water-limited and potential conditions due to the local climatic advantagescompared to the UK, but wheat ideotypes need to be designed sepa-rately for NZ to make greatest use of the local climatic conditions.Although recorded wheat yields in the UK and NZ are one of thehighest, our study demonstrates the possibility of substantially in-creasing the genetic wheat yield potential under future climatic con-ditions. The design of wheat ideotypes in the present study providesplant scientists and wheat breeders with a possible road map for se-lection of the target traits and their optimal combinations quantita-tively for wheat improvement and genetic adaptation to increase theyield potential of wheat under climate change. The method of designingwheat ideotypes to raise yield potential under future climatic condi-tions in our study is generic in nature, and therefore it could be ap-plicable globally. However, the extent of possible yield improvementwould depend on local climatic and environmental conditions.
Acknowledgements
The authors are grateful to anonymous reviewers for their con-structive comments which helped us to enrich and improve themanuscript. Rothamsted Research receives grant-aided support fromthe Biotechnology and Biological Sciences Research Council (BBSRC)Designing Future Wheat programme [BB/P016855/1]. The authorsdeclare no conflict of interest.
Appendix A. Supplementary data
Supplementary material related to this article can be found, in theonline version, at doi:https://doi.org/10.1016/j.agrformet.2019.02.025.
References
Ahmed, M., Fayyaz-ul, H., 2011. Cumulative effect of temperature and solar radiation onwheat yield. Not. Bot. Horti Agrobot. Cluj. 39, 146–152.
Asseng, S., Ritchie, J.T., Smucker, A.J.M., Robertson, M.J., 1998. Root growth and wateruptake during water deficit and recovering in wheat. Plant Soil 201, 265–273.
Akkaya, A., Dokuyucu, T., Kara, R., Akçura, M., 2006. Harmonization ratio of post- to pre-anthesis durations by thermal times for durum wheat cultivars in a Mediterraneanenvironment. Eur. J. Agron. 24, 404–408.
Asseng, S., Ewert, F., Martre, P., Rotter, R.P., Lobell, D.B., Cammarano, D., et al., 2015.Rising temperatures reduce global wheat production. Nat. Clim. Change 5, 143–147.
Boogaard, H., Wolf, J., Supit, I., Niemeyer, S., van Ittersum, M., 2013. A regional im-plementation of WOFOST for calculating yield gaps of autumn-sown wheat across theEuropean Union. Field Crops Res. 143, 130–142.
Breseghello, F., Coelho, A.S.G., 2013. Traditional and modern plant breeding methodswith examples in rice (Oryza sativa L.). J. Agric. Food Chem. 61, 8277–8286.
Brisson, N., Gate, P., Gouache, D., Charmet, G., Oury, F.X., Huard, F., 2010. Why arewheat yields stagnating in Europe? A comprehensive data analysis for France. FieldCrops Res. 119, 201–212.
Brooking, I.R., Jamieson, P.D., Porter, J.R., 1995. The influence of daylength on final leafnumber in spring wheat. Field Crops Res. 41, 155–165.
Brooks, R.J., Semenov, M.A., Jamieson, P.D., 2001. Simplifying Sirius: sensitivity analysisand development of a meta-model for wheat yield prediction. Eur. J. Agron. 14,43–60.
Carmo-Silva, E., Andralojc, P.J., Scales, J.C., Driever, S.M., Mead, A., Lawson, T., Raines,C.A., Parry, M.A.J., 2017. Phenotyping of field-grown wheat in the UK highlightscontribution of light response of photosynthesis and flag leaf longevity to grain yield.J. Exp. Bot. 68, 3473–3486.
Charmet, G., Robert, N., Branlard, G., Linossier, L., Martre, P., Triboï, E., 2005. Geneticanalysis of dry matter and nitrogen accumulation and protein composition in wheatkernels. Theor. Appl. Genet. 111, 540–550.
Chen, C., Baethgen, W.E., Robertson, A., 2013. Contributions of individual variation intemperature, solar radiation and precipitation to crop yield in the North China Plain,1961–2003. Clim. Change 116, 767–788.
Christopher, J.T., Christopher, M.J., Borrell, A.K., Fletcher, S., Chenu, K., 2016. Stay-green traits to improve wheat adaptation in well-watered and water-limited en-vironments. J. Exp. Bot. 67, 5159–5172.
Craigie, R.A., Brown, H.E., George, M., 2015. Grain yield of winter feed wheat in responseto sowing date and sowing rate. Agron. N. Z. 45, 1–8.
Curtin, D., Martin, R.J., Scott, C.L., 2008. Wheat (Triticum aestivum) response to mi-cronutrients (Mn, Cu, Zn, B) in Canterbury, New Zealand. N. Z. J. Crop Hort. Sci. 36,169–181.
Defra, 2017. Framing Statistics - Provisional Crop Area, Yield and Live Stock Populationat 1 June 2017 - United Kingdom. Deprtment of Environment, Food and Rural af-firs, UK.
Donald, C.M., 1968. The breeding of crop ideotypes. Euphytica 17, 385–403.Evans, L.T., Fischer, R.A., 1999. Yield potential: its definition, measurement, and sig-
nificance. Crop Sci. 39, 1544–1551.FAO, 2009. Global Agriculture Towards 2050, in: How to Feed the World in 2050.
Agricultural Development Economics Division, Economic and Social DevelopmentDepartment, Rome, Italy.
FAO, 2014. The State of Food and Agriculture: Innovation in Family Farming. Food andAgriculture Organization of the United Nations, Rome, Italy.
FAO, 2016. Crop Prospects and Food Situation. Global Information and Early WarningSystem on Food and Agriculture, Trade and Markets Division, Food and AgricultureOrganization of the United Nations, Rome, Italy.
FAOSTAT, 2018. FAOSTAT Crop Database. Food and Agriculture Organisation of theUnited Nations (Accessed 20, March 2018). http://www.fao.org/faostat/en/#data/QC.
Fischer, R.A., Rees, D., Sayre, K.D., Lu, Z.M., Condon, A.G., Saavedra, A.L., 1998. Wheatyield progress associated with higher stomatal conductance and photosynthetic rate,and cooler canopies. Crop Sci. 38, 1467–1475.
Fischer, R.A., 2007. Understanding the physiological basis of yield potential in wheat. J.Agric. Sci. 145, 99–113.
Foulkes, M.J., Sylvester-Bradley, R., Weightman, R., Snape, J.W., 2007. Identifyingphysiological traits associated with improved drought resistance in winter wheat.Field Crops Res. 103, 11–24.
Foulkes, M.J., Slafer, G.A., Davies, W.J., Berry, P.M., Sylvester-Bradley, R., Martre, P.,et al., 2011. Raising yield potential of wheat. III. Optimizing partitioning to grainwhile maintaining lodging resistance. J. Exp. Bot. 62, 469–486.
Godfray, H.C.J., Beddington, J.R., Crute, I.R., Haddad, L., Lawrence, D., Muir, J.F., et al.,2010. Food Security: the challenge of feeding 9 billion people. Science 327, 812–818.
Gouache, D., Bogard, M., Pegard, M., Thepot, S., Garcia, C., Hourcade, D., et al., 2017.Bridging the gap between ideotype and genotype: challenges and prospects formodelling as exemplified by the case of adapting wheat (Triticum aestivum L.)phenology to climate change in France. Field Crops Res. 202, 108–121.
Gupta, R., Somanathan, E., Dey, S., 2017. Global warming and local air pollution havereduced wheat yields in India. Clim. Change 140, 593–604.
GWR, 2015. Guinness World Records of Heighest Wheat Yield. Guinness World RecordsLimited, London, UK.
GWR, 2017. Guinness World Records of Heighest Wheat Yield. Guinness World RecordsLimited, London, UK.
Hammer, G.L., Chapman, S., van Oosterom, E., Podlich, D.W., 2005. Trait physiology andcrop modelling as a framework to link phenotypic complexity to underlying geneticsystems. Aus. J. Agric. Res. 56, 947–960.
Hawkesford, M.J., Araus, J.L., Park, R., Calderini, D., Miralles, D., Shen, T., Zhang, J.,Parry, M.A.J., 2013. Prospects of doubling global wheat yields. Food Energy Secur. 2,34–48.
Hills, C.B., Li, C.D., 2016. Genetic architecture of flowering phenology in cereals andopportunities for crop improvement. Front. Plant Sci. 7, 23.
International Wheat Genome Sequencing Consortium (IWGSC), 2018. Shifting the limitsin wheat research and breeding using a fully annotated reference genome. Science361 eaar7191.
Ishag, H.M., Mohamed, B.A., Ishag, K.H.M., 1998. Leaf development of spring wheatcultivars in an irrigated heat-stressed environment. Field Crops Res. 58, 167–175.
Jamieson, P.D., Semenov, M.A., 2000. Modelling nitrogen uptake and redistribution inwheat. Field Crops Res. 68, 21–29.
Jamieson, P.D., Semenov, M.A., Brooking, I.R., Francis, G.S., 1998a. Sirius: a mechanisticmodel of wheat response to environmental variation. Eur. J. Agron. 8, 161–179.
Jamieson, P.D., Brooking, I.R., Semenov, M.A., Porter, J.R., 1998b. Making sense of
N. Senapati, et al. Agricultural and Forest Meteorology 271 (2019) 33–45
44
wheat development: a critique of methodology. Field Crops Res. 55, 117–127.Jamieson, P.D., Berntsen, J., Ewert, F., Kimball, B.A., Olesen, J.E., Pinter, P.J., Porter,
J.R., Semenov, M.A., 2000. Modelling CO2 effects on wheat with varying nitrogensupplies. Agric. Ecosyst. Environ. 82, 27–37.
Jamieson, P.D., Brooking, I.R., Semenov, M.A., MeMaster, G.S., White, J.W., Porter, J.R.,2007. Reconciling alternative models of phenological development in winter wheat.Field Crops Res. 103, 36–41.
Kole, C., Muthamilarasan, M., Henry, R., Edwards, D., Sharma, R., Abberton, M., et al.,2015. Application of genomics-assisted breeding for generation of climate resilientcrops: progress and prospects. Front. Plant Sci. 6, 16.
Kosner, J., Zurkova, D., 1996. Photoperiodic response and its relation to earliness inwheat. Euphytica 89, 59–64.
Lawless, C., Semenov, M.A., Jamieson, P.D., 2005. A wheat canopy model linking leafarea and phenology. Eur. J. Agron. 22, 19–32.
Limagrain, 2018. Limagrain UK Ltd. Rothwell, Lincolnshire UK. (Accessed 01, March2018). https://www.lgseeds.co.uk/products/cereals/claire/#.
Liu, B., Asseng, S., Muller, C., Ewert, F., Elliott, J., Lobell, D.B., et al., 2016. Similarestimates of temperature impacts on global wheat yield by three independentmethods. Nat. Clim. Chang. 6, 1130–1136.
Lollato, R.P., Edwards, J.T., Ochsner, T.E., 2017. Meteorological limits to winter wheatproductivity in the US southern Great Plains. Field Crops Res. 203, 212–226.
Luche, H.D., da Silva, J.A.G., da Maia, L.C., de Oliveira, A.C., 2015. Stay-green: a po-tentiality in plant breeding. Cienc. Rural 45, 1755–1760.
Manschadi, A.M., Christopher, J., deVoil, P., Hammer, G.L., 2006. The role of root ar-chitectural traits in adaptation of wheat to water-limited environments. Funct. PlantBiol. 33, 823–837.
Martre, P., Jamieson, P.D., Semenov, M.A., Zyskowski, R.F., Porter, J.R., Triboi, E., 2006.Modelling protein content and composition in relation to crop nitrogen dynamics forwheat. Eur. J. Agron. 25, 138–154.
Martre, P., Quilot-Turion, B., Luquet, D., Memmah, M.-M.O.-S., Chenu, K., Debaeke, P.,2015. Model-assisted phenotyping and ideotype design. In: Sadras, V.O., Calderini,D.F. (Eds.), Crop Physiology : Applications for Genetic Improvement and Agronomy(Second Edition). Academic Press, San Diego, pp. 349–373.
Mitchell, P.L., Sheehy, J.E., 2018. Potential yield of wheat in the United Kingdom: How toreach 20 t ha−1. Field Crops Res. 224, 115–125.
Mosaad, M.G., Ortizferrara, G., Mahalakshmi, V., Fischer, R.A., 1995. Phyllochron re-sponse to vernalization and photoperiod in spring wheat. Crop Sci. 35, 168–171.
Nalley, L.L., Barkley, A.P., Sayre, K., 2009. Photothermal Quotient specifications to im-prove wheat cultivar yield component models. Agron. J. 101, 556–563.
NASA, 2009. Climate and Earth’s Energy Budget. Earth Observetory. NASA (Accessed 09,July 2018). https://earthobservatory.nasa.gov/Features/EnergyBalance.
Parry, M.A.J., Reynolds, M., Salvucci, M.E., Raines, C., Andralojc, P.J., Zhu, X.G., et al.,2011. Raising yield potential of wheat. II. Increasing photosynthetic capacity andefficiency. J. Exp. Bot. 62, 453–467.
Perryman, S.A.M., Castells-Brooke, N.I.D., Glendining, M.J., Goulding, K.W.T.,Hawkesford, M.J., Macdonald, A.J., et al., 2018. The electronic Rothamsted Archive(e-RA), an online resource for data from the Rothamsted long-term experiments. Sci.Data 5, 17.
Powell, N.M., Lewis, C.M., Berry, S.T., MacCormack, R., Boyd, L.A., 2013. Stripe rustresistance genes in the UK winter wheat cultivar Claire. Theor. Appl. Genet. 126,1599–1612.
Rauf, S., Zaharieva, M., Warburton, M.L., Zhang, P.-z., Al-Sadi, A.M., Khalil, F., Kozak, M.,Tariq, S.A., 2015. Breaking wheat yield barriers requires integrated efforts in de-veloping countries. J. Integr. Agric. 14, 1447–1474.
Reynolds, M., Foulkes, M.J., Slafer, G.A., Berry, P., Parry, M.A.J., Snape, J.W., Angus,W.J., 2009. Raising yield potential in wheat. J. Exp. Bot. 60, 1899–1918.
Reynolds, M., Bonnett, D., Chapman, S.C., Furbank, R.T., Manes, Y., Mather, D.E., Parry,M.A.J., 2011. Raising yield potential of wheat. I. Overview of a consortium approachand breeding strategies. J. Exp. Bot. 62, 439–452.
Riahi, K., Rao, S., Krey, V., Cho, C., Chirkov, V., Fischer, G., Kindermann, G., Nakicenovic,N., Rafaj, P., 2011. RCP 8.5—a scenario of comparatively high greenhouse gasemissions. Clim. Change 109, 33.
Richards, R.A., 2006. Physiological traits used in the breeding of new cultivars for water-scarce environments. Agric. Water Manage. 80, 197–211.
Robert, N., Berard, P., Hennequet, C., 2001. Dry matter and nitrogen accumulation inwheat kernel. Genetic variation in rate and duration of grain filling [Triticum aes-tivum L.]. J. Genet. Breed. 55, 297–305.
Roques, S.E., Kindred, D.R., Clarke, S., 2017. Triticale out-performs wheat on range of UKsoils with a similar nitrogen requirement. J. Agric. Sci. 155, 261–281.
Rötter, R.P., Tao, F., Höhn, J.G., Palosuo, T., 2015. Use of crop simulation modelling toaid ideotype design of future cereal cultivars. J. Exp. Bot. 66, 3463–3476.
Schils, R., Olesen, J.E., Kersebaum, K.C., Rijk, B., Oberforster, M., Kalyada, V., et al.,2018. Cereal yield gaps across Europe. Eur. J. Agron. 101, 109–120.
Schwefel, H.-P., Rudolph, G., 1995. Contemporary evolution strategies. In: Morán, F.,Moreno, A., Merelo, J.J., Chacón, P. (Eds.), Advances in Artificial Life. ThirdEuropean Conference on Artificial Life, Granada, Spain, June 4–6, 1995 Proceedings.Springer, Berlin Heidelberg, Berlin, Germany, pp. 891–907.
Semenov, M.A., 2007. Development of high-resolution UKCIP02-based climate changescenarios in the UK. Agric. Forest Meteorol. 144, 127–138.
Semenov, M.A., 2008. Simulation of extreme weather events by a stochastic weathergenerator. Clim. Res. 35, 203–212.
Semenov, M.A., Halford, N.G., 2009. Identifying target traits and molecular mechanismsfor wheat breeding under a changing climate. J. Exp. Bot. 60, 2791–2804.
Semenov, M.A., Shewry, P.R., 2011. Modelling predicts that heat stress, not drought, willincrease vulnerability of wheat in Europe. Sci. Rep. 1, 1–5.
Semenov, M.A., Stratonovitch, P., 2010. Use of multi-model ensembles from global cli-mate models for assessment of climate change impacts. Clim. Res. 41, 1–14.
Semenov, M.A., Stratonovitch, P., 2013. Designing high-yielding wheat ideotypes for achanging climate. Food Energy Secur. 2, 185–196.
Semenov, M.A., Stratonovitch, P., 2015. Adapting wheat ideotypes for climate change:accounting for uncertainties in CMIP5 climate projections. Clim. Res. 65, 123–139.
Semenov, M.A., Terkel, D.A., 2003. Analysis of convergence of an evolutionary algorithmwith self-adaptation using a Stochastic Lyapunov function. Evol. Comput. 11,363–379.
Semenov, M.A., Brooks, R.J., Barrow, E.M., Richardson, C.W., 1998. Comparison of theWGEN and LARS-WG stochastic weather generators for diverse climates. Clim. Res.10, 95–107.
Semenov, M.A., Jamieson, P.D., Martre, P., 2007. Deconvoluting nitrogen use efficiencyin wheat: a simulation study. Eur. J. Agron. 26, 283–294.
Semenov, M.A., Martre, P., Jamieson, P.D., 2009. Quantifying effects of simple wheattraits on yield in water-limited environments using a modelling approach. Agric. For.Meteorol. 149, 1095–1104.
Semenov, M.A., Stratonovitch, P., Alghabari, F., Gooding, M.J., 2014. Adapting wheat inEurope for climate change. J. Cereal Sci. 59, 245–256.
Senapati, N., Stratonovitch, P., Paul, M.J., Semenov, M.A., 2018. Drought toleranceduring reproductive development is important for increasing wheat yield potentialunder climate change in Europe. J. Exp. Bot. ery226. https://doi.org/10.1093/jxb/ery226.
Shearman, V.J., Sylvester-Bradley, R., Scott, R.K., Foulkes, M.J., 2005. Physiologicalprocesses associated with wheat yield progress in the UK. Crop Sci. 45, 175–185.
Shi, J.Q., Li, R.Y., Qiu, D., Jiang, C.C., Long, Y., Morgan, C., et al., 2009. Unraveling thecomplex trait of crop yield with quantitative trait loci mapping in Brassica napus.Genetics 182, 851–861.
Shiferaw, B., Smale, M., Braun, H.-J., Duveiller, E., Reynolds, M., Muricho, G., 2013.Crops that feed the world 10. Past successes and future challenges to the role playedby wheat in global food security. Food Secur. 5, 291–317.
Silva, S.A., de Carvalho, F.I.F., da R. Caetano, V., de Oliveira, A.C., de Coimbra, J.L.M., deVasconcellos, N.J.S., Lorencetti, C., 2001. Genetic basis of stay-green trait in breadwheat. J. New Seeds 2, 55–68.
Stratonovitch, P., Semenov, M.A., 2010. Calibration of a crop simulation model using anevolutionary algorithm with self-adaptation. Procedia Social Behav. Sci. 2,7749–7750.
Stratonovitch, P., Semenov, M.A., 2015. Heat tolerance around flowering in wheatidentified as a key trait for increased yield potential in Europe under climate change.J. Exp. Bot. 66, 3599–3609.
Sylvester-Bradley, R., Riffkin, P., O’Leary, G., 2012. Designing resource-efficient ideo-types for new cropping conditions: wheat (Triticum aestivum L.) in the high rainfallzone of southern Australia. Field Crops Res. 125, 69–82.
Tao, F.L., Rotter, R.P., Palosuo, T., Diaz-Ambrona, C.G.H., Minguez, M.I., Semenov, M.A.,et al., 2017. Designing future barley ideotypes using a crop model ensemble. Eur. J.Agron. 82, 144–162.
Taylor, K.E., Stouffer, R.J., Meehl, G.A., 2012. An overview of CMIP5 and the experimentdesign. Bull. Am. Meteorol. Soc. 93, 485–498.
Trnka, M., Hlavinka, P., Semenov, M.A., 2015. Adaptation options for wheat in Europewill be limited by increased adverse weather events under climate change. J. R. Soc.Interface 12, 7.
Tubiello, F.N., Donatelli, M., Rosenzweig, C., Stockle, C.O., 2000. Effects of climatechange and elevated CO2 on cropping systems: model predictions at two Italian lo-cations. Eur. J. Agron. 13, 179–189.
Vanuytrecht, E., Raes, D., Willems, P., Geerts, S., 2012. Quantifying field-scale effects ofelevated carbon dioxide concentration on crops. Clim. Res. 54, 35–47.
Webber, H., Ewert, F., Olesen, J.E., Muller, C., Fronzek, S., Ruane, A.C., et al., 2018.Diverging importance of drought stress for maize and winter wheat in Europe. Nat.Commun. 9. https://doi.org/10.1038/s41467-018-06525-2.
Wolf, J., Evans, L.G., Semenov, M.A., Eckersten, H., Iglesias, A., 1996. Comparison ofwheat simulation models under climate change .1. Model calibration and sensitivityanalyses. Clim. Res. 7, 253–270.
Wu, X.S., Chang, X.P., Jing, R.L., 2012. Genetic insight into yield-associated traits ofwheat grown in multiple rain-fed environments. PLoS One 7, e31249.
Zampieri, M., Ceglar, A., Dentener, F., Toreti, A., 2017. Wheat yield loss attributable toheat waves, drought and water excess at the global, national and subnational scales.Environ. Res. Lett. 12, 064008.
Zhu, X.G., Long, S.P., Ort, D.R., 2010. Improving photosynthetic efficiency for greateryield. Annu. Rev. Plant Biol. 61, 235–261.
N. Senapati, et al. Agricultural and Forest Meteorology 271 (2019) 33–45
45