Embed Size (px)
Citation preview
Under the Microscope
The State of Resourcing of Practical Science in Secondary Schools and Sixth-Form College in England
Authors: Jennifer Brennan, James Legard & Keith Pye
April 2013
Pye Tait Consulting Royal House, 110 Station Parade, Harrogate, HG1 1EP Tel: 01423-509433 Fax: 01423-509502 Email: [email protected] Web: www.pyetait.com
Cert No: 5120

Under the Microscope: The State of Resourcing of Practical Science in Secondary Schools and Sixth-Form Colleges in England
April 2013
2 | P a g e
Acknowledgements
Pye Tait Consulting would like to thank all the schools and colleges that took the time to participate
in this research. We would also like to thank all the members of the Expert Working Groups and
Task and Finish Group for their time and valuable contributions, and in particular, Tamsin Barton and
Fiona Miller at SCORE.
Under the Microscope: The State of Resourcing of Practical Science in Secondary Schools and Sixth-Form Colleges in England
April 2013
3 | P a g e
Table of Contents
Glossary....................................................................................................................................... 6 1. Executive Summary .................................................................................................................. 7 2. Introduction ........................................................................................................................... 10
2.1 About the research and why it was commissioned .................................................................... 10 2.2 Research objectives .................................................................................................................... 12 2.3 Research methodology ............................................................................................................... 13
3. Context of research findings ................................................................................................... 17
3.1 Background ................................................................................................................................. 17 3.2 Breakdown of survey respondents ............................................................................................. 21
4. Funding .................................................................................................................................. 24
4.1 Key messages in relation to funding for practical science .......................................................... 24 4.2 Per capita and average budgets for science ............................................................................... 26 4.3 Expenditure on practical science ................................................................................................ 28 4.4 Additional sources of funding ..................................................................................................... 33 4.5 Satisfaction with funding available for practical science ............................................................ 35 4.6 Anticipated future changes in funding for practical science ...................................................... 38 4.7 Impacts of funding levels on teaching and learning of practical science ................................... 39
5. Resourcing ............................................................................................................................. 44
5.1 Benchmarking against indicative items ...................................................................................... 44 5.2 Equipment and consumables ...................................................................................................... 48 5.3 Laboratory facilities..................................................................................................................... 76 5.4 Technician support ...................................................................................................................... 84 5.5 Access to outside learning environments ................................................................................... 89 5.6 Approaches to resourcing in new builds ..................................................................................... 96 5.7 Anticipated future levels of resourcing for practical science ..................................................... 97 5.8 Impacts of resourcing levels on teaching and learning of practical science ............................... 99
6. Drivers influencing resourcing of practical science in secondary schools and sixth-form colleges................................................................................................................................................ 102
6.1 Curriculum changes .................................................................................................................. 102 6.2 Controlled assessments ............................................................................................................ 102 6.3 Economic factors ....................................................................................................................... 103
7. What would improve the resourcing of practical science? ..................................................... 105 8. Conclusions and recommendations ....................................................................................... 107
8.1 Conclusions ............................................................................................................................... 107 8.2 Recommendations .................................................................................................................... 109
Appendix 1: List of indicative items .......................................................................................... 112
Under the Microscope: The State of Resourcing of Practical Science in Secondary Schools and Sixth-Form Colleges in England
April 2013
4 | P a g e
List of Figures and Tables Table 1: Sample frame for the online survey of secondary schools and sixth-form colleges............... 15
Figure 1: Breakdown of survey respondents by school type ................................................................ 21
Figure 2: Breakdown of survey respondents by region ........................................................................ 22
Figure 3: Breakdown of survey respondents by job role ...................................................................... 22
Figure 4: Use of science association membership ................................................................................ 23
Figure 5: Average per capita spend on science academic year 2011/12 (by school type) ................... 27
Figure 6: Average per capita spend on science academic year 2011/12 (by region) ........................... 28
Figure 7: Whether schools ring-fence part of budget for practical science ......................................... 29
Table 2: Breakdown of average allocations of science expenditure (all schools) ................................ 30
Table 3: Breakdown of average allocations of science expenditure (state-funded schools only) ....... 30
Table 4: Average proportion of science budget spent on reprographics by school age range and size
.............................................................................................................................................................. 31
Figure 8: Proportion of science budget spent on reprographics (by school type) ............................... 31
Figure 9: Other allocations of the science budget (all schools) ............................................................ 32
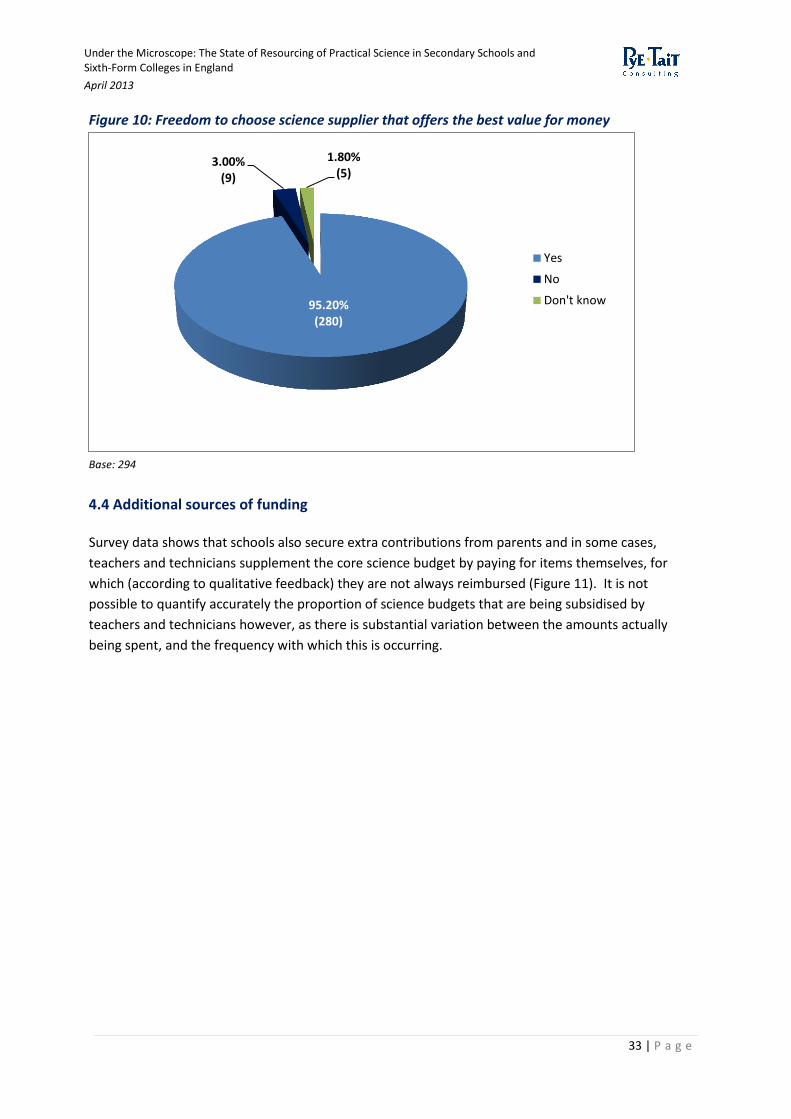
Figure 10: Freedom to choose science supplier that offers the best value for money ........................ 33
Figure 11: Additional contributions to normal and extra-curricular science activities ........................ 34
Figure 12: Satisfaction that funding for science practical work is sufficient (all schools) .................... 35
Figure 13: Satisfaction that funding for science practical work is sufficient (by school type) .............. 36
Figure 14: Satisfaction that funding for science practical work is sufficient (by school age range) ..... 37
Figure 15: Average science budget by level of satisfaction .................................................................. 38
Figure 16: Expected impacts on practical science as a result of future anticipated funding over the
next two academic years (all schools) .................................................................................................. 39
Figure 17: Expected impacts on practical science as a result of future anticipated funding over the
next two academic years (by school type) ............................................................................................ 40
Figure 18: Expected impacts on practical science as a result of as a result of future anticipated
funding over the next two academic years (by school age range) ....................................................... 41
Figure 19: Resourcing levels for pre-16 biology .................................................................................... 49
Figure 20: Pre-16 biology - distribution of schools by percentage of equipment & consumables fully
accessible .............................................................................................................................................. 50
Figure 21: Resourcing levels for post-16 biology .................................................................................. 51
Figure 22: Post-16 biology - distribution of schools by percentage of equipment & consumables fully
accessible .............................................................................................................................................. 52
Figure 23: Resourcing levels for pre-16 biology – equipment and consumables ................................. 54
Figure 24: Equipment resourcing levels for post-16 biology – equipment and consumables ............. 55
Figure 25: Resourcing levels for pre-16 chemistry ............................................................................... 56
Figure 26: Pre-16 chemistry - distribution of schools by percentage of equipment & consumables
fully accessible ...................................................................................................................................... 57
Figure 27: Resourcing levels for post-16 chemistry .............................................................................. 58
Figure 28: Post-16 chemistry - distribution of schools by percentage of equipment & consumables
fully accessible ...................................................................................................................................... 59
Figure 29: Resourcing levels for pre-16 chemistry – equipment and consumables ............................. 61
Figure 30: Resourcing levels for post-16 chemistry – equipment and consumables ........................... 62
Under the Microscope: The State of Resourcing of Practical Science in Secondary Schools and Sixth-Form Colleges in England
April 2013
5 | P a g e
Figure 31: Resourcing levels for pre-16 physics .................................................................................... 63
Figure 32: Pre-16 physics - distribution of Schools by percentage of equipment & consumables fully
accessible .............................................................................................................................................. 64
Figure 33: Resourcing levels for post-16 physics .................................................................................. 65
Figure 34: Post-16 physics - distribution of schools by percentage of equipment & consumables fully
accessible .............................................................................................................................................. 66
Figure 35: Resourcing levels for pre-16 physics – equipment and consumables ................................. 68
Figure 36: Resourcing levels for post-16 physics – equipment and consumables ............................... 70
Figure 37: Resourcing levels for general science equipment ............................................................... 72
Figure 38: Equipment resourcing levels for general science equipment (for ages 11-18) ................... 73
Figure 39: Satisfaction there is sufficient equipment and consumables .............................................. 74
Figure 40: Satisfaction there is sufficient equipment and consumables (by school type) ................... 75
Figure 41: Science resources that schools would like to have .............................................................. 76
Figure 42: Mix of laboratory facilities – general or specialist (by school type) .................................... 77
Figure 43: Resourcing levels – accessibility of laboratory facilities ...................................................... 78
Figure 44: % access to adequate laboratory facilities ........................................................................... 79
Figure 45: Resourcing levels - laboratory facilities ............................................................................... 80
Figure 46: Satisfaction with sufficient laboratory facilities (all schools)............................................... 82
Figure 47: Satisfaction with sufficient laboratory facilities (by school type) ........................................ 83
Figure 48: Satisfaction there is sufficient technician support (all schools) .......................................... 88
Figure 49: Satisfaction there is sufficient technician support (by school type) .................................... 88
Figure 50: Resourcing levels for pre-16 access to outside space for practical science ........................ 89
Figure 51: Access to outside learning environments (pre-16 provision) .............................................. 90
Figure 52: % access to adequate outside learning environments (pre-16 provision) .......................... 91
Figure 53: Resourcing levels for post-16 access to outside space for practical science ....................... 91
Figure 54: Access to outside learning environments (post-16 provision) ............................................ 93
Figure 55: % access to adequate outside learning environments (post-16 provision) ......................... 94
Figure 56: Satisfaction with sufficient access to outside learning environments (all schools)............. 95
Figure 57: Satisfaction with sufficient access to outside space (by school type) ................................. 95
Figure 58: Confidence there will be enough equipment and consumables over the next two academic
years (all schools) .................................................................................................................................. 98
Figure 59: Confidence there will be enough equipment and consumables (by school type) .............. 98
Figure 60: Extent to which school science departments make use of new technologies/IT ................ 99
Figure 61: Extent to which school science departments make use of new technologies/IT (by school
type) .................................................................................................................................................... 100
Figure 62: Summary of key issues respondents face in resourcing practical science ........................ 105
Figure 63: What respondents consider would improve resourcing of practical science .................... 106
Under the Microscope: The State of Resourcing of Practical Science in Secondary Schools and Sixth-Form Colleges in England
April 2013
6 | P a g e
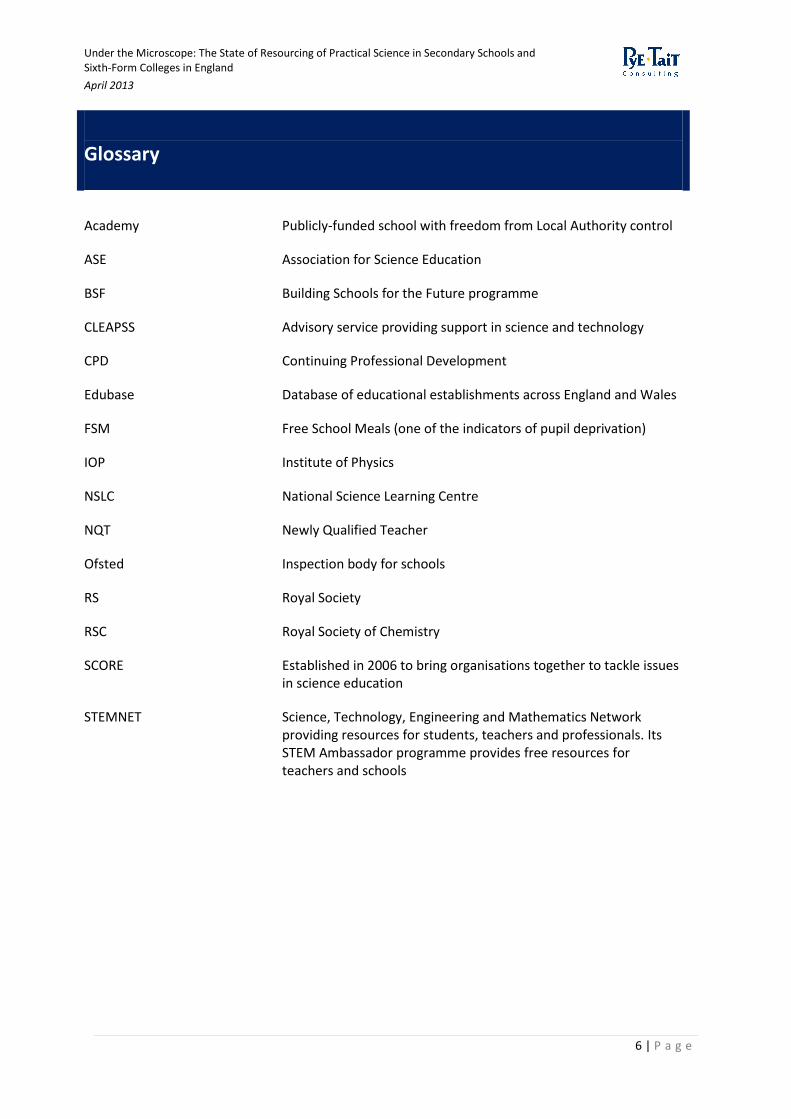
Glossary
Academy Publicly-funded school with freedom from Local Authority control
ASE Association for Science Education
BSF Building Schools for the Future programme
CLEAPSS Advisory service providing support in science and technology
CPD Continuing Professional Development
Edubase Database of educational establishments across England and Wales
FSM Free School Meals (one of the indicators of pupil deprivation)
IOP Institute of Physics
NSLC National Science Learning Centre
NQT Newly Qualified Teacher
Ofsted Inspection body for schools
RS Royal Society
RSC Royal Society of Chemistry
SCORE Established in 2006 to bring organisations together to tackle issues in science education
STEMNET Science, Technology, Engineering and Mathematics Network providing resources for students, teachers and professionals. Its STEM Ambassador programme provides free resources for teachers and schools
Under the Microscope: The State of Resourcing of Practical Science in Secondary Schools and Sixth-Form Colleges in England
April 2013
7 | P a g e
1. Executive Summary
This research has sought evidence about the nature of resourcing and funding of practical science
within schools and colleges, in order to identify and understand the types of issues that may be
encountered, and actions that may be taken to help remedy problems. This report presents the
detailed findings of this research for secondary schools and sixth-form colleges in England. Findings
in relation to primary schools in England are presented separately.
Evidence gathered from this research points to disparities between resourcing and funding levels
between schools and within regions of England, contributing to variations in the practical science
teaching and learning experience for students.
This report raises concerns about the levels of resourcing for practical science in comparison with
the benchmark standards defined for the purpose of this research. In relation to schools surveyed
for this research:
The average state-funded secondary school has just 70% of the equipment and
consumables it needs to teach science subjects, but four in ten state-funded schools have
less than 70% of the equipment and consumables they require;
A third of state-funded schools have 80% or more of the equipment and consumables they
need;
Biology at pre-16 level is the least well-resourced of the three sciences (63.1% of responses
indicate schools have access to sufficient quantities of required items in full working order,
compared with 70.7% for pre-16 chemistry and 72% for pre-16 physics);
Less than 1 in 7 schools are able to access over 90% of the indicative items for pre-16
biology;
Less than 12% of schools have access to more than 90% of the indicative items required for
post-16 biology;
Only a quarter of schools can access more than 90% of the indicative items for pre-16
chemistry;
Less than 1 in 5 schools have access to more than 90% of the indicative items and 1 in 6
have access to less than 50% of the indicative items for post-16 chemistry;
Nearly 1 in 3 schools that have access to more than 90% of the indicative items for pre-16
physics), and around 4 in 10 schools having access to less than 70% of the indicative items
for post-16 physics;
Compared with the individual science subjects, schools are relatively well-resourced in
relation to general science equipment – however sufficient quantities of the indicative items
are still not available to 15% of schools;
Nearly a third of maintained schools and nearly a fifth of academies are either quite or very
dissatisfied with resourcing of science equipment and consumables;
Under the Microscope: The State of Resourcing of Practical Science in Secondary Schools and Sixth-Form Colleges in England
April 2013
8 | P a g e
Laboratory facilities are not easily or not accessible to 23% of respondents. Nearly a fifth of
schools have access to less than 70% of the indicative laboratory facilities;
Less than 7% of schools have access to indicative outside learning environments for pre-16
provision; there are substantially more concerns in relation to post-16 provision, where
nearly 60% of schools only have access to less than 10% of the indicative items;
Around 70% of respondents employ technicians during term-time only. Nearly 30% of
maintained schools and nearly a quarter of academies state they are quite or very
dissatisfied with the amount of technician support available to them.
Impacts on teaching and learning of practical science as a result of inadequate resourcing include:
changes to group sizes (for example work undertaken in groups of 3 or 4 rather than individually or
in pairs); and fewer practical experiences undertaken where there is insufficient technician support
to adequately resource this.
There is also substantial variation in the amount of funding allocated to science, and to practical
science in particular, between schools and sixth-form colleges. The average per capita spend on
science for the academic year 2011/12 is £11.16 across all school types. However within state-
funded schools the average per capita spend on science is £8.81, compared with an average of
£27.29 within independent schools.
Per capita spend on science within state-funded schools ranges from as little as £0.75 to as much as
£31.25. Within independent schools the variation is even more apparent, ranging from per capita
spend on science of £7.18 to £83.21.
In relation to schools surveyed for this research:
Over 80% of respondent state-funded schools do not formally allocate funding specifically
to science practical work;
The highest proportion of the science budget is spent on equipment and consumables (at an
average of nearly 40% in state-funded schools). However the proportion of the science
budget spent on reprographics accounts for, on average, just over 28% of the budget in
state-funded schools (compared with just over 7% within independent schools) which can
substantially impact resourcing of science, as the monies allocated to reprographics can
mean there is less available to purchase new or upgraded equipment;
Nearly 45% of respondents from maintained schools and just over 30% of respondents from
academies that say they are quite or very dissatisfied with the funding available for
resourcing science, compared with 6.5% of respondents from independent schools that
indicate dissatisfaction;
Respondents in state-funded schools that are very satisfied with the funding available for
resourcing science have, on average, just over double the per capita spend on science
(£16.95 – academic year 2011/12), compared with those that report being very dissatisfied
(average per capita of £7.86);
Science staff are, in some cases, supplementing the core science budget with contributions
from their own pocket – however it is not possible to quantify the typical amount spent, and
Under the Microscope: The State of Resourcing of Practical Science in Secondary Schools and Sixth-Form Colleges in England
April 2013
9 | P a g e
the frequency with which this is occurring;
Nearly a third of maintained schools expect to offer less science practical teaching and
experiences in the next two academic years as a result of future funding levels.
Respondents in state-funded schools report impacts on science teaching and learning as a result of
limited funding – notably a need to adapt to a culture of ‘make do and mend’ – cited as an issue by
over a third of respondents.
Other drivers affecting resourcing of practical science include external factors outside of schools’
control – notably the uncertain economic climate and regular curriculum change (both of which
have impacted on schools’ capacity to plan ahead for resourcing), as well as the requirements of
controlled assessments (notably needing higher volumes of certain types of equipment to all be in
use concurrently).
Under the Microscope: The State of Resourcing of Practical Science in Secondary Schools and Sixth-Form Colleges in England
April 2013
10 | P a g e
2. Introduction
2.1 About the research and why it was commissioned
“The importance of practical work in science is widely accepted and it is acknowledged that good
quality practical work promotes the engagement and interest of students as well as developing a
range of skills, science knowledge and conceptual understanding”1
SCORE, 2008
This document reports research into the resourcing of practical science in secondary schools and
sixth-form colleges in England. It is part of a larger project that considers practical science
resourcing across English schools and sixth form colleges that has been funded by SCORE2, a
collaborative partnership of some of the UK’s leading science organisations.
Science and technology undoubtedly play a crucial role in the UK, contributing directly and
indirectly to economic growth, global competitiveness and the management of environmental
change as well as supporting individual quality of life through achievement and self-fulfilment. It is
vital, therefore, that schools and colleges are able not only to develop their pupils’ knowledge and
understanding of science, but also to engage and motivate them for long-term scientific study and
employment.
It is widely agreed that hands-on, practical science experiences play a crucial role in developing
pupils’ conceptual understanding and increasing their enjoyment of science lessons3. However,
recent research into provision of practical science in secondary schools and sixth-form colleges
points to an uneven distribution of practical work4 between institutions, which may in part be
explained by variations in resources. A report from the House of Commons Committee of Public
Accounts in 2011 stated that the numbers of pupils studying triple science at GCSE rose by almost
150% between 2004-05 and 2009-10, yet concluded that science facilities in many schools were,
“unsatisfactory and unsafe”5. Furthermore the Department for Education (DfE) had no plans at
that time to collate or analyse information regarding the conditions of science facilities and had
also abandoned facility improvement targets. Other research also conducted in 2011 highlighted
that, in spite of a commitment to the provision of learning opportunities outside the classroom,
these were not always taken up in practice6.
1 SCORE (2008), Practical work in science: a report and proposal for a strategic framework
2 SCORE was established in 2006 to bring organisations together to tackle issues in science education. SCORE member
organisations are the Association for Science Education, the Institute of Physics, the Royal Society, the Royal Society of Chemistry, and the Society of Biology http://www.score-education.org/about-score 3 SCORE (2008), Practical work in science: a report and proposal for a strategic framework
4 Ibid
5 House of Commons Committee of Public Accounts (2011), Educating the next generation of scientists
6 Royal Society of Chemistry (2011), Outdoor Science
Under the Microscope: The State of Resourcing of Practical Science in Secondary Schools and Sixth-Form Colleges in England
April 2013
11 | P a g e
SCORE therefore decided to commission research in response to concerns that there is a wide
variation among schools and sixth-form colleges in the resourcing of practical science taught to
pupils between the ages of 5 and 19, which Pye Tait Consulting was commissioned to carry out.
SCORE considers that this variation is likely to affect the amount and quality of practical work
taking place in schools. Practical work is integral to science education and should be intrinsic to the
curriculum and, although adequate resourcing does not guarantee that high quality practical work
will take place, insufficient resourcing could be a barrier to it happening at all. Moreover, the
Government has a clear policy to increase the number of pupils taking Triple Science and Science A-
levels, yet SCORE is concerned this commitment is not being matched with the necessary increase
in resource to ensure that all of these pupils have access to high quality practical work.
SCORE has already undertaken a series of important investigations of science practical work in
schools, most notably Practical Work in Science: A Report and Proposal for a Strategic Framework
(2008).7 This report demonstrated the high importance attached to practical work as a pedagogical
tool and sought to identify obstacles to the effective provision of practical work in schools. It
identified resourcing as a critical issue, showing that among teachers and technicians, resources
and facilities were cited as the second most important obstacle to undertaking high quality
practical science in schools, and were also the most cited factors among individuals who gave
detailed responses to the research. It also found that ‘school science departments differ in their
resourcing levels and this affects their ability to equally offer high-quality practical work’.
The SCORE report advocated a five-strand strategy for improving the quality and availability of
science practical work, with “Strand C” aiming ‘to bring together the best advice on facilities and
resources to support practical work in science’. More generally, the report suggested that SCORE
should lobby policymakers to ‘ring-fence department funding’ for science subjects to ensure that
schools are able to fund high quality science practical work.
SCORE’s current four-module research project, Resourcing School Science, has been designed to
provide the first robust enquiry into the funding and resourcing of practical science work in schools
and sixth-form colleges in England. The first module consisted of background research into the
resourcing of practical science. The second module updated the Royal Society’s benchmark list of
resources needed to deliver the national curriculum in science. The benchmarks are explicitly
intended to provide schools with guidance on an ‘appropriate’, rather than a ‘minimum’ or ‘gold
standard’ level of resourcing.
The aim of our research - the third module within the project - is to gather and analyse evidence
that will enable SCORE to further understand the nature of resourcing of practical science in
schools and sixth-form colleges, and in particular to ascertain the extent to which schools are able
to meet the standard set out in the benchmark list; to understand the impacts of the approaches to
resourcing taken by schools and colleges; and consider how any issues might be addressed.
7 Available for download from http://www.score-education.org/media/3668/report.pdf
Under the Microscope: The State of Resourcing of Practical Science in Secondary Schools and Sixth-Form Colleges in England
April 2013
12 | P a g e
Research findings are intended to inform local school policies as well as national Government
policy. The evidence is intended to influence national policy in relation to: 1) the level of resourcing
required to ensure that every pupil has the opportunity to experience appropriate practical work in
science; and 2) the potential need to protect funding for science departments within a devolved
funding model. In addition, the research findings will assist school science departments by
providing them with the evidence they need to make the case for appropriate resources, budgets
and technical support to deliver good quality practical work.
This report presents our findings in relation to secondary schools and sixth-form colleges in
England. Findings for primary schools and are presented separately8.
2.2 Research objectives The objectives for this research were to:
ascertain the availability, accessibility and scope of the resources used for practical science
work in schools in comparison with a series of indicative items drawn from a
comprehensive benchmark list developed as part of the previous module of SCORE’s
research project (subsequently refined in conjunction with an expert Working Group9);
use both the process and the findings of the research to test the robustness of the
indicative items, suggesting revisions where appropriate;
identify the amount and adequacy of historical, current, and likely future sources of
funding for science practical work in schools;
understand the relationship between funding and resource levels and the scope and
adequacy of practical science provision;
determine how new build science departments are resourced.
Consideration of the purposes and definition of ‘high quality practical work’ was out of scope for
this research. For the purposes of this research, SCORE10 defines practical science as:
Practical work to encompass learning activities in which students observe, investigate, and develop
an understanding of the world around them through:
- having direct, often hands-on, experience of phenomena or manipulating real objects and
materials; and
- where primary data/observations are not possible or appropriate, use secondary sources of data
8 Pye Tait Consulting (2013), Under the Microscope: The State of Resourcing of Practical Science in Primary Schools in
England 9 See Section 2.3.1 for more detail
10 Agreed in conjunction with a Task and Finish Group, see Section 2.3 for more detail

Under the Microscope: The State of Resourcing of Practical Science in Secondary Schools and Sixth-Form Colleges in England
April 2013
13 | P a g e
to examine experimental observations (for example: aerial photographs to examine lunar and earth
geographic features: spectra to examine the nature of stars and atmosphere: sonar images to
examine living systems).
In addition, SCORE considers practical work to include fieldwork, class demonstrations and any
computer simulations that generate experimental data. Practical work does not include watching
videos, attending educational visits (for example to the science museum or a science workplace) or
use of computer simulation for illustrative purposes.
The resources that are used to support practical work are clearly defined for the purposes of the
research as:
a) laboratory facilities11;
b) equipment and consumables;
c) technician support;
d) access to outside learning environments for learning outside the classroom.
The geographical scope of this report is restricted to England; however similar research may be
undertaken in the remaining UK nations in the future.
2.3 Research methodology
This research commenced in April 2012. Throughout the research Pye Tait Consulting remained in
regular contact with the Task and Finish Group convened to provide oversight of the work. This
Group comprised:
SCORE’s Manager and Deputy Manager
Representatives from all SCORE partner organisations: Association for Science Education;
Royal Society of Chemistry; Royal Society; Society of Biology and Institute of Physics;
Teachers representing both primary and secondary education.
All fieldwork data collection tools (quantitative and qualitative) were submitted to SCORE and the
Task and Finish Group for review and approval before they were used.
This piece of social science research utilised a mixed methodology, combining quantitative and
qualitative research tools as follows:
Desk-based review of relevant literature, including national and local resourcing and
funding policies;
Selection of a set of indicative items (mapped to the relevant resource areas outlined
above in Section 2.2) that could be used to assess the level of resources available to
participant schools (see Section 2.3.1 for details);
11
Classroom facilities in the case of primary schools
Under the Microscope: The State of Resourcing of Practical Science in Secondary Schools and Sixth-Form Colleges in England
April 2013
14 | P a g e
Design and facilitation of an online survey for secondary schools and sixth-form colleges
with an objective of securing 460 respondents to gain evidence on a wide range of
information relevant to the resourcing of practical science, including school characteristics,
funding levels, and staff attitudes, as well as the extent to which schools were able to
access the indicative items;
Follow up via in-depth qualitative telephone interviews and visits with a selected sample of
schools to explore the resourcing of practical science in depth.
The research findings presented in this report are drawn from:
quantitative data obtained from the online survey to define the current resourcing and
funding levels for practical science in secondary schools and sixth-form colleges;
qualitative data obtained from the interviews and schools visits to provide additional
understanding of the impacts of current levels of funding and resourcing, and of the key
drivers that shape them.
It should therefore be noted that the findings presented here are based on self-report from
participating schools on the basis of selected indicative items; it is not an exhaustive audit. With
this limitation, however, the research is the most comprehensive of its kind yet undertaken in
England. Where feasible to do so, research data are presented by region; however it should be
taken into consideration that there may be relatively low numbers of respondents per region and
therefore these findings should be viewed as indicative only.
2.3.1 Development of list of indicative items used in the survey
The indicative items were drawn from a complete set of resourcing benchmarks developed by
SCORE in the previous module of this research. The indicative items were selected from the
benchmarks with the advice of an expert Working Group convened for this purpose. The Group
comprised representatives from schools spanning all three sciences as well as CLEAPSS, the
advisory and support service for science and technology. Discussions about the benchmarks were
facilitated by SCORE and Pye Tait Consulting.
The workshop with the Working Group first identified a wide range of benchmark items as
potential indicators. These were subsequently refined to a smaller set of indicative items that the
Group considered would be necessary to deliver effective practical science. These lists (grouped
into three: equipment and consumables; laboratory facilities; and outside learning environments)
were used for the purpose of the survey. The list of indicative items used in the survey is included
as Appendix 1.
Under the Microscope: The State of Resourcing of Practical Science in Secondary Schools and Sixth-Form Colleges in England
April 2013
15 | P a g e
2.3.2 Quantitative online survey
The sample frame for the survey was established using official statistics published by the
Department for Education12 to define a representative sample spanning all types of school
(maintained, academy, free, etc.) and a range of sizes and locations (urban/rural, regional).
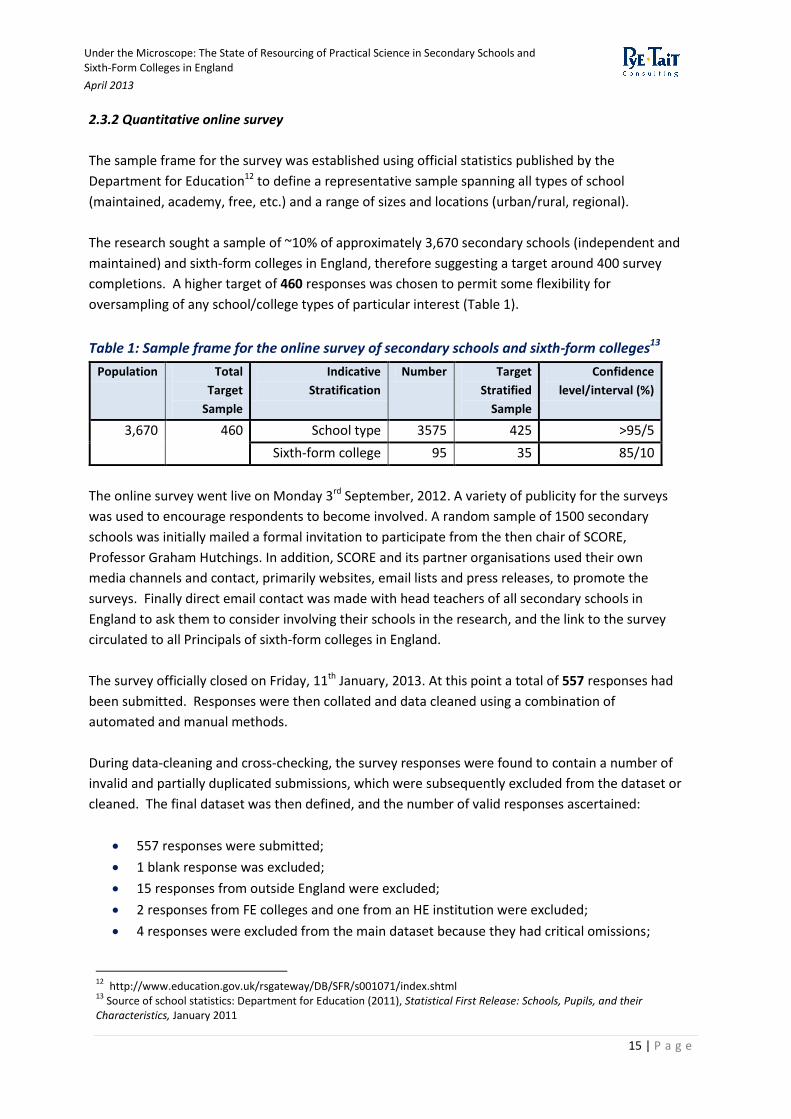
The research sought a sample of ~10% of approximately 3,670 secondary schools (independent and
maintained) and sixth-form colleges in England, therefore suggesting a target around 400 survey
completions. A higher target of 460 responses was chosen to permit some flexibility for
oversampling of any school/college types of particular interest (Table 1).
Table 1: Sample frame for the online survey of secondary schools and sixth-form colleges13
Population Total
Target
Sample
Indicative
Stratification
Number Target
Stratified
Sample
Confidence
level/interval (%)
3,670 460 School type 3575 425 >95/5
Sixth-form college 95 35 85/10
The online survey went live on Monday 3rd September, 2012. A variety of publicity for the surveys
was used to encourage respondents to become involved. A random sample of 1500 secondary
schools was initially mailed a formal invitation to participate from the then chair of SCORE,
Professor Graham Hutchings. In addition, SCORE and its partner organisations used their own
media channels and contact, primarily websites, email lists and press releases, to promote the
surveys. Finally direct email contact was made with head teachers of all secondary schools in
England to ask them to consider involving their schools in the research, and the link to the survey
circulated to all Principals of sixth-form colleges in England.
The survey officially closed on Friday, 11th January, 2013. At this point a total of 557 responses had
been submitted. Responses were then collated and data cleaned using a combination of
automated and manual methods.
During data-cleaning and cross-checking, the survey responses were found to contain a number of
invalid and partially duplicated submissions, which were subsequently excluded from the dataset or
cleaned. The final dataset was then defined, and the number of valid responses ascertained:
557 responses were submitted;
1 blank response was excluded;
15 responses from outside England were excluded;
2 responses from FE colleges and one from an HE institution were excluded;
4 responses were excluded from the main dataset because they had critical omissions;
12
http://www.education.gov.uk/rsgateway/DB/SFR/s001071/index.shtml 13
Source of school statistics: Department for Education (2011), Statistical First Release: Schools, Pupils, and their Characteristics, January 2011
Under the Microscope: The State of Resourcing of Practical Science in Secondary Schools and Sixth-Form Colleges in England
April 2013
16 | P a g e
however, where there were literal comments these were retained for qualitative analysis;
12 respondents submitted duplicate responses – these were manually cross-checked; in
each case, the most complete survey response was retained and the less complete
excluded;
2 responses were not from schools or colleges, but represented the views of other
stakeholders (a STEM ambassador and a home schooling association); these were excluded
from the main dataset; however, where there were literal comments these were retained
for qualitative analysis;
58 schools and colleges submitted multiple responses;
The final dataset therefore consisted of a total of 522 valid responses from 448 unique
schools and colleges.
Much of the analysis was concerned with determining the situation at the level of schools rather
than individual respondents. There were a total of 19 schools that submitted multiple responses
from the same target group; if all these individual responses from the same target group within an
individual school had been included in the dataset, the effect would have been to over-represent
that school. For this type of analysis, therefore, multiple responses were consolidated to produce a
single response per respondent type per school.
The regional distribution of responses from individual schools was checked against the actual
distribution of secondary schools across England as reported in official statistics. The number of
responses from all but two regions was well within the expected margin of error. It was
nevertheless decided to weight the data during the analysis to equate more closely to the known
regional distribution in order to ensure that the final statistics were as representative as possible of
the overall national picture.
2.3.3 Qualitative in-depth fieldwork
Qualitative telephone interviews and visits were undertaken, to explore emerging findings in more
detail, with secondary schools and sixth-form colleges as follows:
72 telephone interviews; and
11 visits.
These institutions were selected based on the following criteria:
Agreement to participate in further follow up research (question posed within the survey);
Spread by region, type and size; and
Spread across spectrum of satisfaction levels with funding and resourcing of practical
science.
Under the Microscope: The State of Resourcing of Practical Science in Secondary Schools and Sixth-Form Colleges in England
April 2013
17 | P a g e
3. Context of research findings
3.1 Background
There is broad consensus that practical experiences are of central importance to teaching
secondary science in an effective and engaging way14. Indeed, the recent report of the House of
Commons Science and Technology Select Committee on Experiments and Practical Science
concluded that ‘both practical lessons and learning outside the classroom are essential contributors
to good quality science education’15. The level of commitment within the science community to
science practical experiences is also evident in the large number of grants and other resources
provided by science societies and charitable foundations to support practical science provision16.
This consensus is supported by teachers and by the schools inspectorate, Ofsted. Recent research
shows that secondary teachers are committed to the importance of practical science, and
convinced of its value for engaging students and increasing their understanding of scientific
concepts and ways of working17. Among participants in a teacher panel surveyed by the National
Science Learning Centre (NSLC), there was a clear view that students enjoyed carrying out practical
work as it offered different challenges from other types of learning. Moreover, 93% of participants
said that practical techniques should be listed in the national curriculum, and a majority felt that it
was important for practical techniques to be externally assessed at both GCSE and A-level18.
Ofsted’s engagement with secondary schools that have succeeded in improving science education
also emphasises the value of practical work. It found that among ‘schools which showed clear
improvement in science subjects, key factors in promoting students’ engagement, learning and
progress were more practical science lessons and the development of the skills of scientific enquiry’.
Ofsted therefore recommends that secondary schools should ‘use practical work and scientific
enquiry as the key stimulus to develop scientific knowledge, understanding and skills’19.
Moreover, the increasing emphasis on ‘science literacy’ as one of the major goals of science
education has also put practical work to the fore. Science literacy focuses heavily on understanding
‘how science works’, on the processes and procedures that underlie scientific knowledge. Active
enquiry, practical experimentation and critical thinking are recognised as having great value in
14
SCORE (2008), Practical work in science: a report and proposal for a strategic framework 15
House of Commons Science and Technology Committee (2011), Practical experiments in school science lessons and science field trips 16
See: https://www.sciencelearningcentres.org.uk/WebPortal.aspx?page=1&module=DB920A53-01EA-4886-8878-F2CDF5FA8CFD&mode=101&newsIdDB920A53_01EA_4886_8878_F2CDF5FA8CFD=6207&returnPageDB920A53_01EA_4886_8878_F2CDF5FA8CFD=http%3a%2f%2fwww.sciencelearningcentres.org.uk%2fWebPortal.aspx%3fpage%3d14%26module%3dDB920A53-01EA-4886-8878-F2CDF5FA8CFD 17
Science Learning Centre Panel (2012), Practical Science Survey Topline Report 18
Ibid 19
Ofsted (2011), Successful Science
Under the Microscope: The State of Resourcing of Practical Science in Secondary Schools and Sixth-Form Colleges in England
April 2013
18 | P a g e
developing this understanding20.
The importance attached to practical science is reflected in its prominence within schools. Practical
science work, through experimentation, fieldwork, and demonstrations, has long been a particular
feature of science education in the UK at secondary level21. In the NSLC panel research, 84% of
teachers said that they use practical work frequently or very frequently, and only 1% said that
practical work was a rare occurrence. Overall, the participants also reported little change over the
previous five years in the amount of practical work that took place22.
Nevertheless, there have also been longstanding concerns across the science community that the
quantity and quality of practical works in secondary schools may be insufficient23. Such concerns
have been explored in considerable depth by the House of Commons Science and Technology
Committee in its 2011 report on practical science in schools24. The committee particularly explored
the reasons why there may be problems with practical science, initially focusing on the possible
barriers that may be posed by health and safety concerns. This reflects a longstanding popular view
that real or perceived health and safety issues have led schools to reduce the amount and quality
of practical science learning they offer their pupils.
The Committee found little evidence of this. It did however express considerable concern about the
professional preparation of teachers to undertake practical science teaching, the status and career
prospects of science technicians, and the equipment and facilities available to them in schools.
Their report concluded that ‘science teachers need fit for purpose facilities and the support of
qualified and experienced technical support’25.
This reiterates concerns that have been expressed within the science community for some years. In
2008, SCORE observed that ‘there is well-documented evidence of the shortcomings of equipment
funding and replacement of laboratories which require continued monitoring and should be
addressed as part of wider strategy and improvement in facilities’26.
More detailed research into the resourcing of practical science has also identified potential issues
in a range of areas, most notably in funding, laboratories, technician support, and access to
fieldwork. The NSLC panel research found that 35% of teachers believed that better quality
equipment would do the most to help improve practical science, and 38% of respondents cited lack
of money for equipment or consumables as the most important limiting factor for practical work27.
Moreover, 39% of respondents reported that the amount of funding they received had decreased
significantly in recent years.
20
2008 Report to the Nuffield Foundation - Science education in Europe: Critical reflection 21
SCORE (2008), Practical work in science: a report and proposal for a strategic framework 22
Ofsted (2011), Successful Science 23
SCORE (2008), Practical work in science: a report and proposal for a strategic framework 24
House of Commons Science and Technology Committee (2011), Practical experiments in school science lessons and science field trips 25
Educating the next generation of scientists 2011 26
SCORE (2008), Practical work in science: a report and proposal for a strategic framework 27
Science Learning Centre Panel (2012), Practical Science Survey Topline Report
Under the Microscope: The State of Resourcing of Practical Science in Secondary Schools and Sixth-Form Colleges in England
April 2013
19 | P a g e
Laboratories were identified as a particular area of concern by research undertaken in 2004 for the
Royal Society of Chemistry28. On average, teachers reported needing an additional laboratory in
every school, and found that existing laboratories were often inadequate. Indeed, the report made
a conservative estimate that nearly £1.4 billion would need to be spent to bring all laboratories up
to a ‘good’ standard.
It also found that that this would need to be backed up by a continuing commitment of resources if
even a ‘minimum’ standard of provision was to be maintained. Subsequent research found that
even where schools were given resources for new or refurbished labs, this did not always result in
high quality facilities. In particular, there were complaints that new equipment and furniture were
badly specified, often of poor quality and frequently deteriorated quickly under normal usage.
Some respondents also reported that preparation areas often saw little improvement, or even
deteriorated, during the refurbishment process29. Complaints were also noted in relation to
facilities being better prior to refurbishment than afterwards.
The availability of appropriate technician support has also attracted attention. The Association for
Science Education’s National Technician Survey, last carried out in 2010, found that, although most
science technicians work full-time hours, many are on term-time only contracts. It also found that
60% of technicians worked overtime every week, and that most did not receive any compensation
for this, either in pay or time off in lieu. This was a marked increase on the corresponding figure for
2000, when only 12% worked more than their contractual hours.
In addition, there was evidence that technicians were taking on a wider range of responsibilities,
including increased involvement in dealing with finances; assisting with practical lessons; and
undertaking demonstrations in class30. These issues have been noted by the House of Commons
Science and Technology Committee, which has called for action ‘to address the pay and conditions
of science technicians and create a career structure that will attract skilled and dedicated people to
work as technicians’31.
Finally, fieldwork has recently been identified as an area for concern, with reports that there is a
long-term trend of declining provision and quality of fieldwork in GCSE and A level science32.
Science teachers have been found to value fieldwork less than their colleagues in geography, and
there is also evidence of a state-funded/independent divide across schools, with independent
schools making more use of fieldwork for science subjects.
In spite of all these concerns, however, there has been relatively little robust research into the
resourcing of practical science in secondary schools. Indeed, almost all the existing literature raises
concerns about the adequacy of the current evidence base. The Science and Technology
Committee in particular noted that the Government does not routinely collect data on the
28
Royal Society of Chemistry (2004), Laboratories, Resources and Budgets 29
Royal Society of Chemistry/CLEAPSS (2006), Improving School Laboratories 30
ASE (2012), National Technicians Survey 2010 31
House of Commons Science and Technology Committee (2011), Practical experiments in school science lessons and science field trips 32
Royal Society of Chemistry (2011), Outdoor Science
Under the Microscope: The State of Resourcing of Practical Science in Secondary Schools and Sixth-Form Colleges in England
April 2013
20 | P a g e
availability or condition of practical science resources, and has noted the need for agreed basic
standards for laboratory provision33. The Royal Society has also stated in a recent report that policy
making in science education more generally is hampered by ‘issues with data collection and
insufficient consideration of research evidence’34.
Before the research was undertaken, we lacked a clear, detailed understanding of
what resourcing standards secondary schools need to meet; and
how many schools actually meet these standards.
These issues are particularly problematic given the current policy context. For example there is a
clear Government commitment to incorporating science within assessment processes both inside
and outside the laboratory35. This is likely to have considerable resource implications, given there is
evidence that only around two-thirds of pupils currently have to take practical assessments in
science, with a similar proportion undertaking open-ended science investigations36. The
introduction of universal testing of practical skills would, therefore, be likely to lead to a substantial
increase in the amount of practical science teaching.
In addition, the strong current focus on extending enrolments in triple science GCSE is likely to have
similarly significant implications for science resourcing – not only in itself, but also because it is
associated with increasing enrolments in A-Level science37. No less significantly, finance and
resource decisions are increasing being devolved to local schools – a development which will give
schools more discretion to focus on their own needs and priorities, but which may also increase
disparities in levels of practical science provision from one school to another.
Moreover, these changes are happening a time of financial stringency due to budgetary
constraints. Recent Government proposals suggest that, in the future, all academic 16-19
qualifications could be funded at base rate, which would remove the 12% weighting for science38.
The following sections will therefore seek to define more closely the level and degree of
consistency of science funding across different schools; to consider the actual levels of equipment
and consumables available; to assess the levels of technician support available; and to consider the
accessibility of the outside environments needed to deliver appropriate fieldwork to secondary
pupils. Taken together, these findings will provide the first comprehensive baseline of evidence on
the resourcing of practical school science in secondary schools and colleges.
33
House of Commons Science and Technology Committee (2011), Practical experiments in school science lessons and science field trips 34
The Royal Society (2010), Science and Mathematics Education 5-14 35
Government Response to Science and Technology Committee Recommendations 2011 36
ASE (2012), National Technicians Survey 2010 37
Broecke (2010), Does Offering More Science at School Increase the Supply of Scientists? The Impact of Offering Triple Science at GCSE on Subsequent Educational Choices and Outcomes 38
This was announced after the scope of this research was defined, and therefore survey questions were not designed to gain feedback in relation to this issue specifically, however the researchers were able to gain some evidence via the qualitative interviews about the potential impact of such changes
Under the Microscope: The State of Resourcing of Practical Science in Secondary Schools and Sixth-Form Colleges in England
April 2013
21 | P a g e
3.2 Breakdown of survey respondents
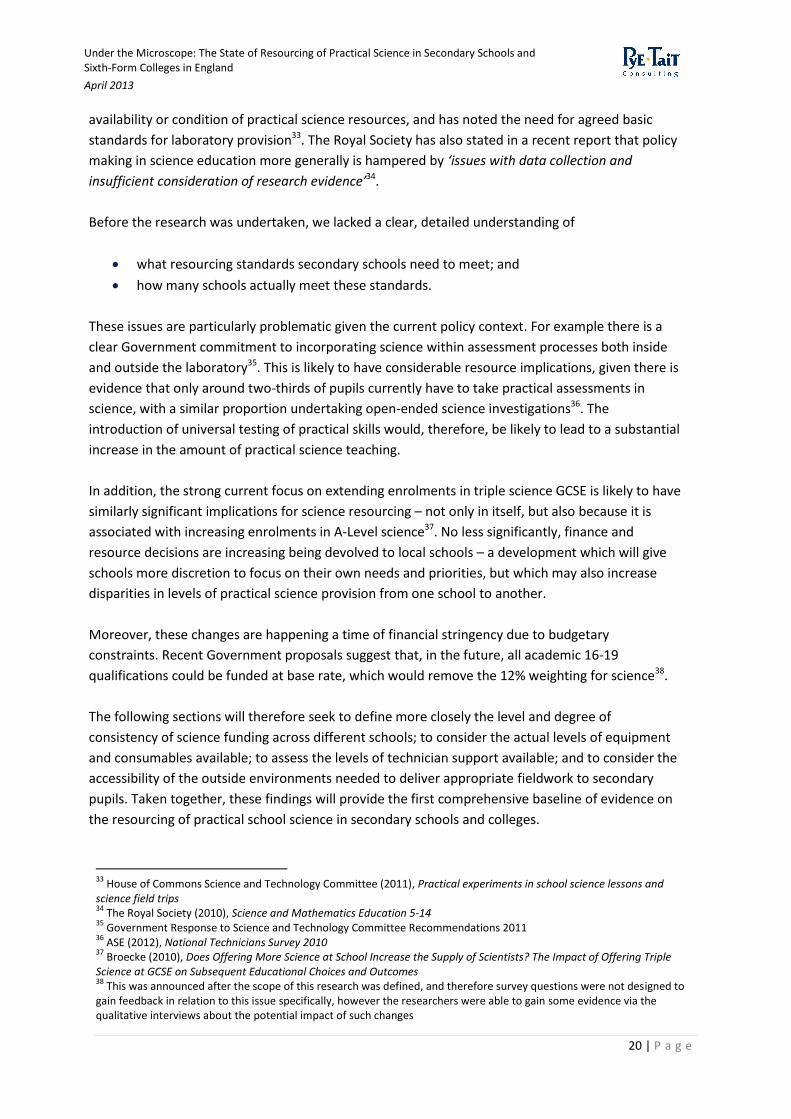
The majority of respondents to the survey came from academies (53.5%), followed by nearly a third
of respondents (31.6%) from maintained schools (Figure 1). Other school types that responded to
the survey included a small number of pupil referral units and studio schools.
Figure 1: Breakdown of survey respondents by school type
Base: 449
Figure 2 shows the breakdown of respondents by geographical region.
31.60% (141)
53.50% (240)
0.90% (4)
9.30% (42)
3.80% (17)
0.90% (4)
Maintained school
Academy
Free school
Independent school
Sixth-form college
Other
Under the Microscope: The State of Resourcing of Practical Science in Secondary Schools and Sixth-Form Colleges in England
April 2013
22 | P a g e
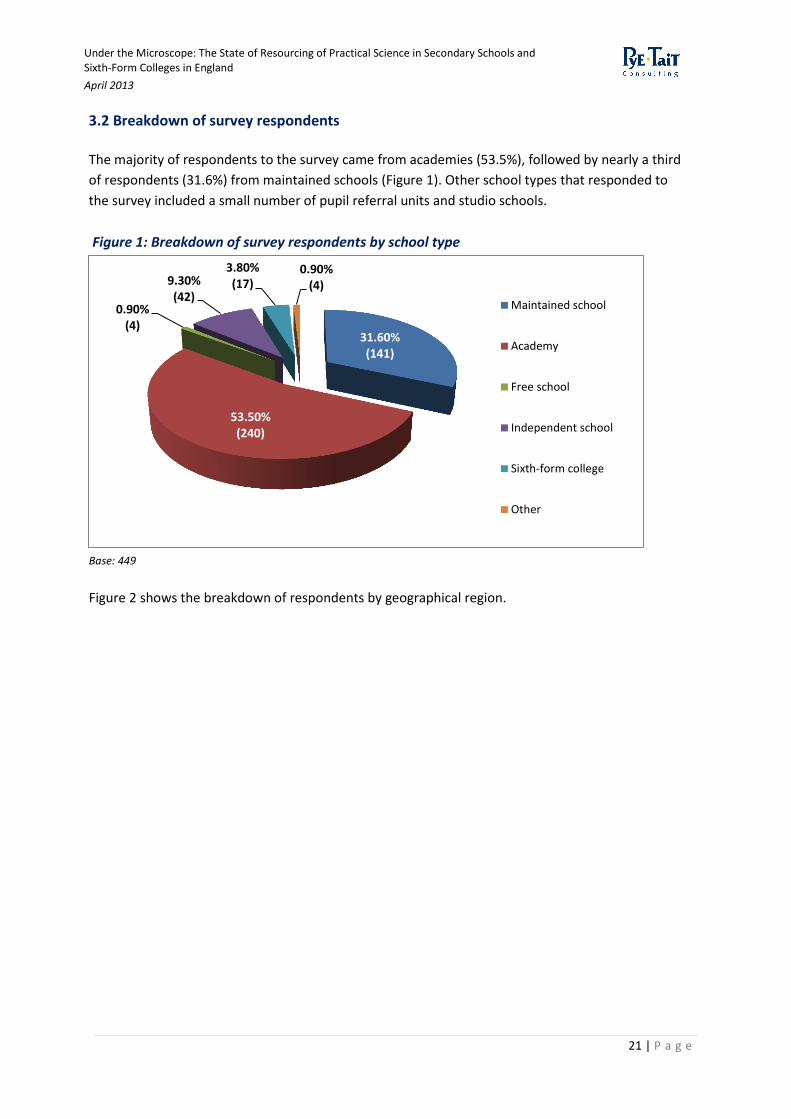
Figure 2: Breakdown of survey respondents by region
Base: 448
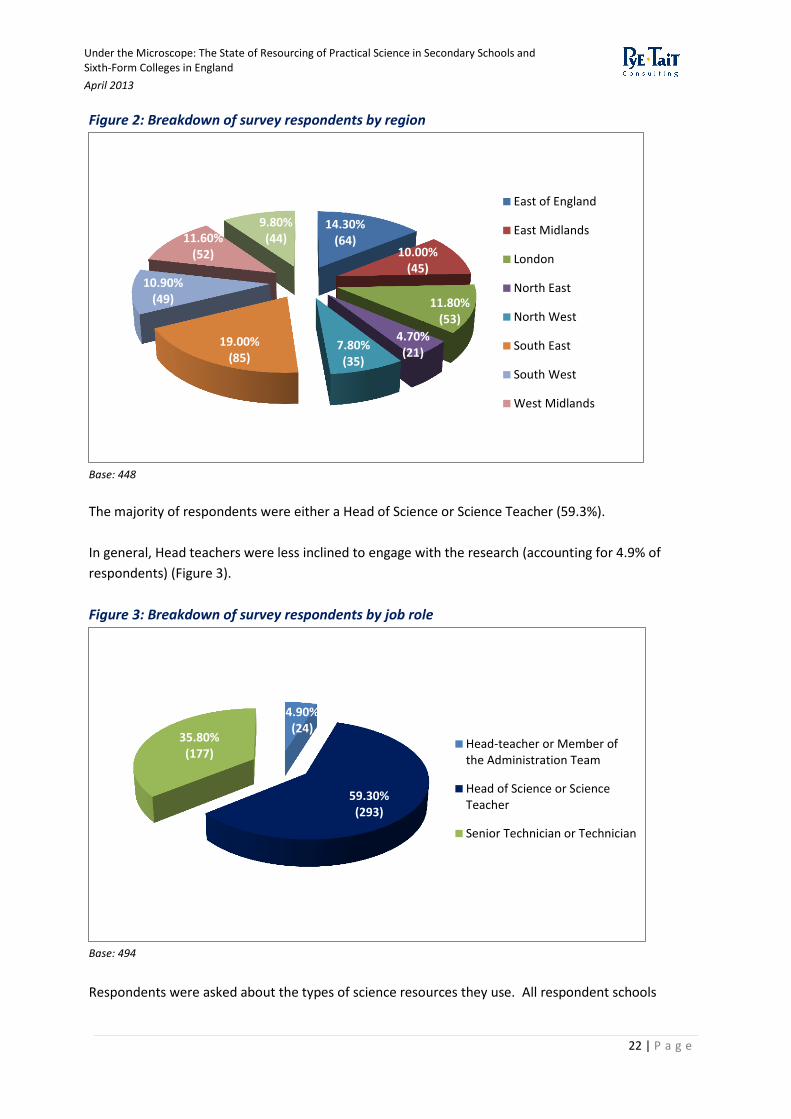
The majority of respondents were either a Head of Science or Science Teacher (59.3%).
In general, Head teachers were less inclined to engage with the research (accounting for 4.9% of
respondents) (Figure 3).
Figure 3: Breakdown of survey respondents by job role
Base: 494
Respondents were asked about the types of science resources they use. All respondent schools
14.30% (64)
10.00% (45)
11.80% (53)
4.70% (21)
7.80% (35)
19.00% (85)
10.90% (49)
11.60% (52)
9.80% (44)
East of England
East Midlands
London
North East
North West
South East
South West
West Midlands
4.90% (24)
59.30% (293)
35.80% (177)
Head-teacher or Member ofthe Administration Team
Head of Science or ScienceTeacher
Senior Technician or Technician
Under the Microscope: The State of Resourcing of Practical Science in Secondary Schools and Sixth-Form Colleges in England
April 2013
23 | P a g e
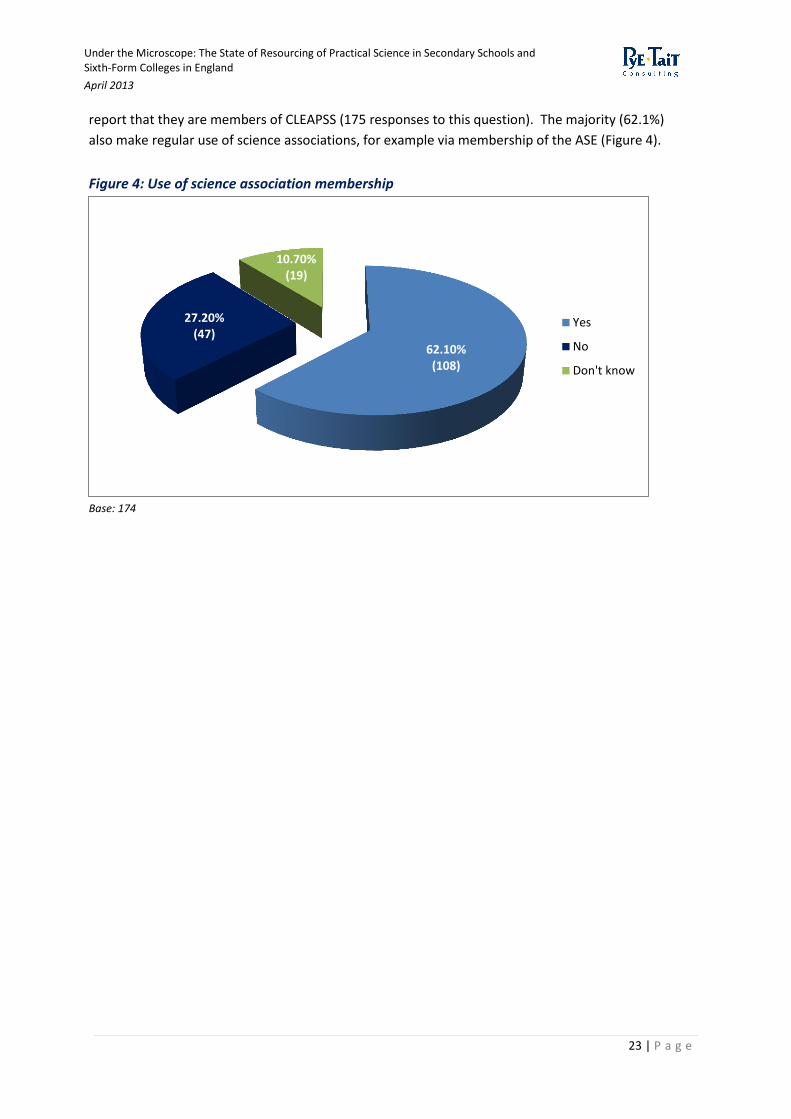
report that they are members of CLEAPSS (175 responses to this question). The majority (62.1%)
also make regular use of science associations, for example via membership of the ASE (Figure 4).
Figure 4: Use of science association membership
Base: 174
62.10% (108)
27.20% (47)
10.70% (19)
Yes
No
Don't know

Under the Microscope: The State of Resourcing of Practical Science in Secondary Schools and Sixth-Form Colleges in England
April 2013
24 | P a g e
4. Funding
4.1 Key messages in relation to funding for practical science
The survey included specific sections on funding that asked respondents to disclose a range of
budgetary, expenditure and other information connected with the funding of the science
curriculum area in general and practical science in particular. The relevant questions were
developed on the basis of background literature and qualitative research with secondary school
and college science teachers, and were refined on the basis of the pilot survey and the advice of
the SCORE Task and Finish Group. The final questionnaire sought information on:
Annual expenditure on science;
Whether spending on science was expected to increase or decrease in the current and
future financial years;
The way that science budgets are allocated to various types of expenditure;
Whether any of the science budget was specifically allocated to science practical work;
Any additional sources of funding used by the school;
Levels of satisfaction with current science funding;
The anticipated impact of future funding levels on the amount of science practical work
that will be provided over the next two years.
Data gathered from these questions were used to build up a comprehensive picture of the funding
of practical science in English secondary schools and sixth-form colleges on the basis of the
predominantly quantitative survey data. This was then supplemented by additional qualitative
evidence drawn from literal comments in the surveys and from the in-depth interviews. Where
findings are derived from qualitative data, this is specifically indicated.
Key messages in relation to this funding section are presented in the box below.
The average per capita spend on science for the academic year 2011/12 is £11.16 – across
all school types. However there is considerable variation between school types – within
state-funded schools the average per capita spend on science is £8.81, compared with an
average of £27.29 within independent schools39;
There is also a great deal of variation across schools in England in relation to the funding
they allocate to science, and to practical science in particular. Per capita spend on science
within state-funded schools ranges from £0.75 to £31.25. Within independent schools the
variation is even more apparent, ranging from per capita spend on science of £7.18 to as
much as £83.21;
39
Although it should be noted that only 18 independent schools provided data for this question
Under the Microscope: The State of Resourcing of Practical Science in Secondary Schools and Sixth-Form Colleges in England
April 2013
25 | P a g e
Over 80% of respondent state-funded schools do not formally allocate funding specifically
to science practical work;
The highest proportion of the science budget is spent on equipment and consumables (at
an average of nearly 40% in state-funded schools). However the proportion of the science
budget spent on reprographics accounts for, on average, just over 28% of the budget in
state-funded schools (compared with just over 7% within independent schools) –
qualitative feedback suggests this figure has risen in recent years and there are concerns it
may continue to increase. This can substantially impact resourcing of science, as the
monies allocated to reprographics can mean there is less available to purchase new or
upgraded equipment;
Around a third of all respondents report they are quite or very dissatisfied with the funding
available for resourcing science; again there are differences between school type – with
44.4% of respondents from maintained schools and 30.3% of respondents from academies
that say they are quite or very dissatisfied, compared with 6.5% of respondents from
independent schools that indicate dissatisfaction;
Respondents in state-funded schools that are very satisfied with the funding available for
resourcing science have, on average, just over double the per capita spend on science
(£16.95 – academic year 2011/12), compared with those that report being very dissatisfied
(average per capita of £7.86);
Science teachers and technicians are, in some cases, supplementing the core science
budget with contributions from their own pocket – however it is not possible to quantify
the typical amount spent, and the frequency with which this is occurring;
Nearly a quarter of all respondents anticipate that future funding levels will mean they
have to provide less science practical teaching and experiences; within state-funded
schools the concerns are more prominent – with nearly a third of maintained schools
expecting to offer less science practical teaching and experiences in the next two academic
years;
Respondents in state-funded schools report impacts on science teaching and learning as a
result of limited funding – notably a need to adapt to a culture of ‘make do and mend’ –
cited as an issue by over a third of respondents. Constraints on funding typically mean
schools cannot purchase as much equipment as they need (whether to buy new items or
upgrade or increase quantities of existing items) cited as an issue for over a fifth of
respondents – this in turn then can impact on the delivery of practical science, for example
equipment may have to be shared by small groups rather than individual or pair working
(an issue for nearly a fifth of respondents).
Under the Microscope: The State of Resourcing of Practical Science in Secondary Schools and Sixth-Form Colleges in England
April 2013
26 | P a g e
4.2 Per capita and average budgets for science Data on the overall budget for science were requested from all respondent schools. Where
relevant data were available, they were used to calculate the per capita science spend at each of
the participating schools. In 2011/12 across the schools that responded to this question, the
average budget spent on science across all key stages for all surveyed schools and colleges is
£11,896 per annum, per school40, with an average per capita spend on science of £11.16.
There are differences between state-funded and independent schools, with substantial variation
within and between school types. In state-funded schools, the average budget spent on science is
£10,265 per annum (academic year 2011/12), per school, with an average per capita spend on
science of £8.81. However among independent schools41, the average budget spent on science per
annum (academic year 2011/12), per school is £25,272, with an average per capita spend on
science of £27.29.
Among the state-funded schools that participated in the survey, the per capita spend on science for
the academic year 2011/12 ranges from as little as £0.75 to as much as £31.25. The annual budget
allocated to science within state-funded schools for the same academic year ranges from £800 to
£41,337.
Among independent schools the per capita spend on science for the academic year 2011/12 ranges
from £7.18 to £83.21. The annual budget allocated to science within independent schools for the
same academic year ranges from £4,000 to £80,383.
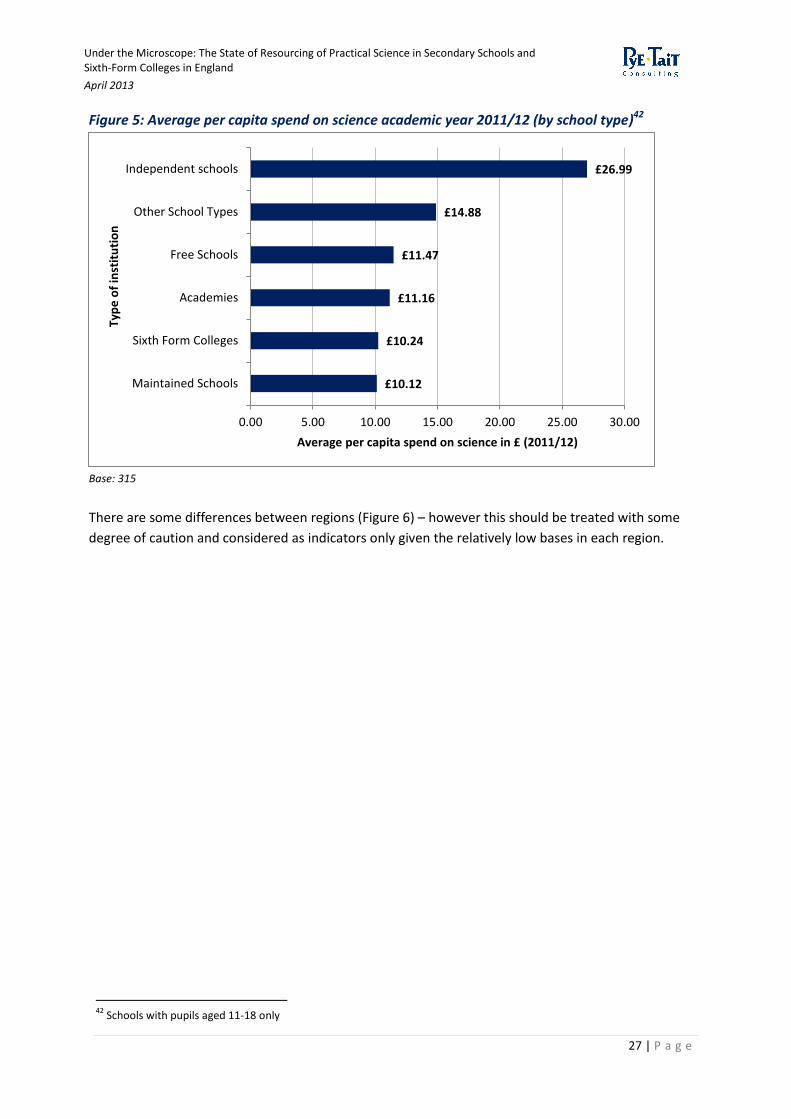
Figure 5 shows the differences in per capita spend on science by school type, for schools with
pupils aged 11-18.
40
Surveyed schools reported a total combined science budget of £5.3m 41
These figures should be treated with a degree of caution given only 18 independent schools responded to the budgetary questions in the survey
Under the Microscope: The State of Resourcing of Practical Science in Secondary Schools and Sixth-Form Colleges in England
April 2013
27 | P a g e
Figure 5: Average per capita spend on science academic year 2011/12 (by school type)42
Base: 315
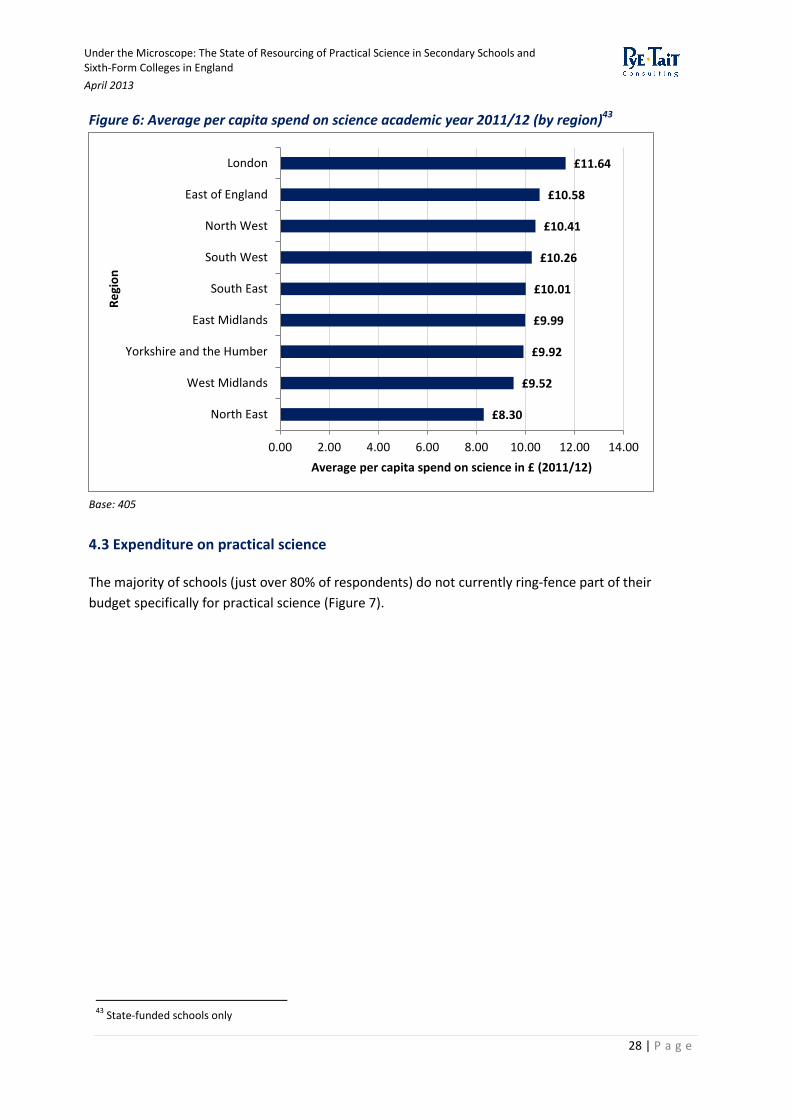
There are some differences between regions (Figure 6) – however this should be treated with some
degree of caution and considered as indicators only given the relatively low bases in each region.
42
Schools with pupils aged 11-18 only
£26.99
£14.88
£11.47
£11.16
£10.24
£10.12
0.00 5.00 10.00 15.00 20.00 25.00 30.00
Independent schools
Other School Types
Free Schools
Academies
Sixth Form Colleges
Maintained Schools
Average per capita spend on science in £ (2011/12)
Typ
e o
f in
stit
uti
on
Under the Microscope: The State of Resourcing of Practical Science in Secondary Schools and Sixth-Form Colleges in England
April 2013
28 | P a g e
Figure 6: Average per capita spend on science academic year 2011/12 (by region)43
Base: 405
4.3 Expenditure on practical science The majority of schools (just over 80% of respondents) do not currently ring-fence part of their
budget specifically for practical science (Figure 7).
43
State-funded schools only
£11.64
£10.58
£10.41
£10.26
£10.01
£9.99
£9.92
£9.52
£8.30
0.00 2.00 4.00 6.00 8.00 10.00 12.00 14.00
London
East of England
North West
South West
South East
East Midlands
Yorkshire and the Humber
West Midlands
North East
Average per capita spend on science in £ (2011/12)
Re
gio
n
Under the Microscope: The State of Resourcing of Practical Science in Secondary Schools and Sixth-Form Colleges in England
April 2013
29 | P a g e
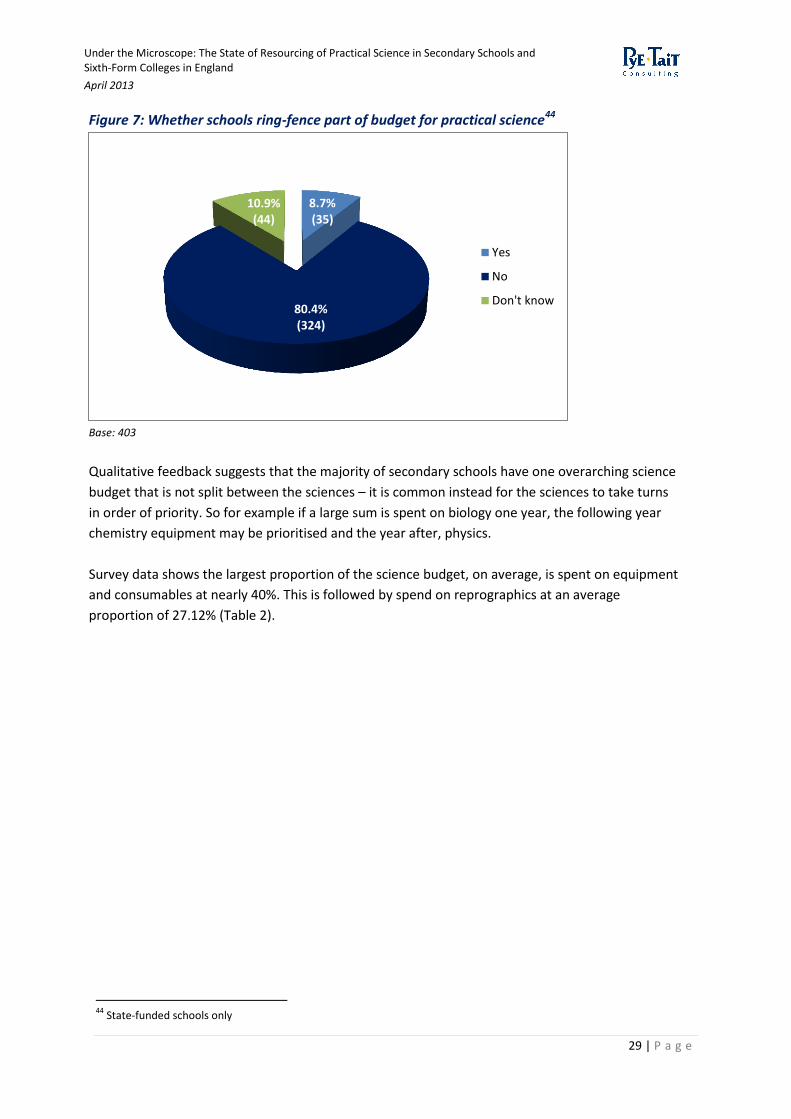
Figure 7: Whether schools ring-fence part of budget for practical science44
Base: 403
Qualitative feedback suggests that the majority of secondary schools have one overarching science
budget that is not split between the sciences – it is common instead for the sciences to take turns
in order of priority. So for example if a large sum is spent on biology one year, the following year
chemistry equipment may be prioritised and the year after, physics.
Survey data shows the largest proportion of the science budget, on average, is spent on equipment
and consumables at nearly 40%. This is followed by spend on reprographics at an average
proportion of 27.12% (Table 2).
44
State-funded schools only
8.7% (35)
80.4% (324)
10.9% (44)
Yes
No
Don't know
Under the Microscope: The State of Resourcing of Practical Science in Secondary Schools and Sixth-Form Colleges in England
April 2013
30 | P a g e
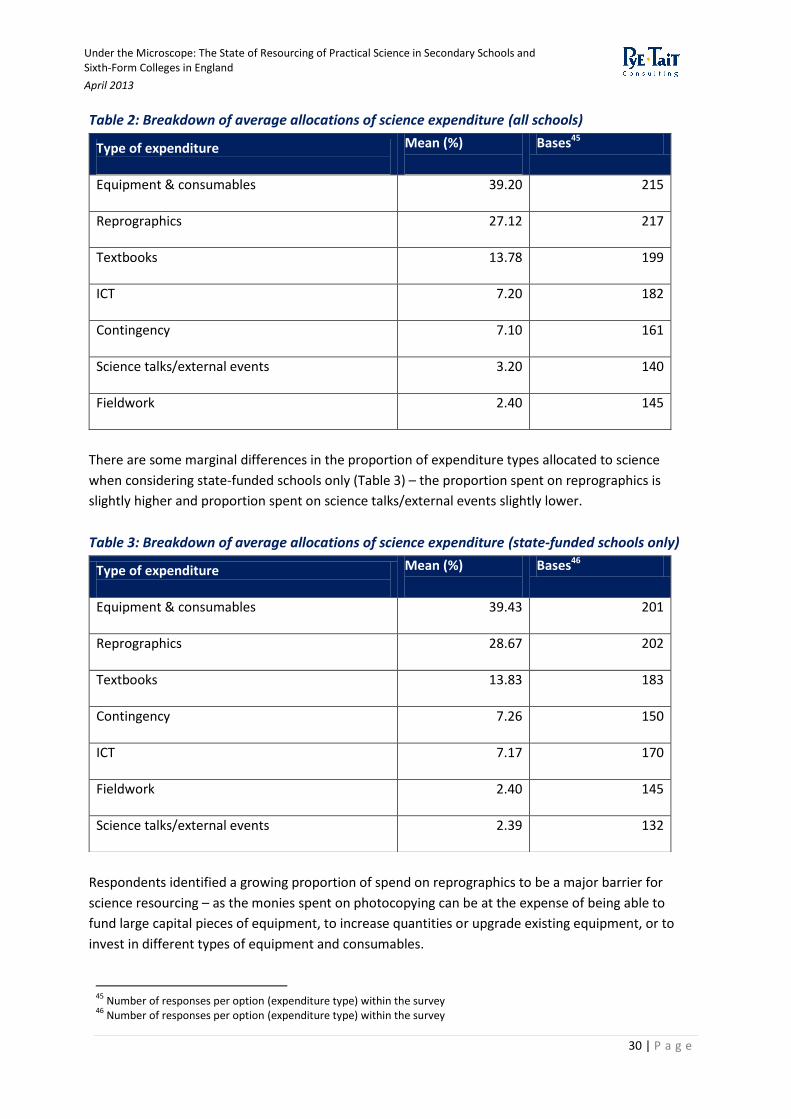
Table 2: Breakdown of average allocations of science expenditure (all schools)
Type of expenditure
Mean (%)
Bases45
Equipment & consumables
39.20 215
Reprographics
27.12 217
Textbooks
13.78 199
ICT
7.20 182
Contingency
7.10 161
Science talks/external events
3.20 140
Fieldwork
2.40 145
There are some marginal differences in the proportion of expenditure types allocated to science
when considering state-funded schools only (Table 3) – the proportion spent on reprographics is
slightly higher and proportion spent on science talks/external events slightly lower.
Table 3: Breakdown of average allocations of science expenditure (state-funded schools only)
Type of expenditure
Mean (%)
Bases46
Equipment & consumables
39.43 201
Reprographics
28.67 202
Textbooks
13.83 183
Contingency
7.26 150
ICT
7.17 170
Fieldwork
2.40 145
Science talks/external events
2.39 132
Respondents identified a growing proportion of spend on reprographics to be a major barrier for
science resourcing – as the monies spent on photocopying can be at the expense of being able to
fund large capital pieces of equipment, to increase quantities or upgrade existing equipment, or to
invest in different types of equipment and consumables.
45
Number of responses per option (expenditure type) within the survey 46
Number of responses per option (expenditure type) within the survey
Under the Microscope: The State of Resourcing of Practical Science in Secondary Schools and Sixth-Form Colleges in England
April 2013
31 | P a g e
There are slight differences in the proportion of budget spend on reprographics by school size and
whether or not it has a sixth form (Table 4).
Table 4: Average proportion of science budget spent on reprographics by school age range and size
Age range 11-16
Age range 11-18 More than 1000 pupils Less than 1000 pupils
30.63
25.73 29.18 24.26
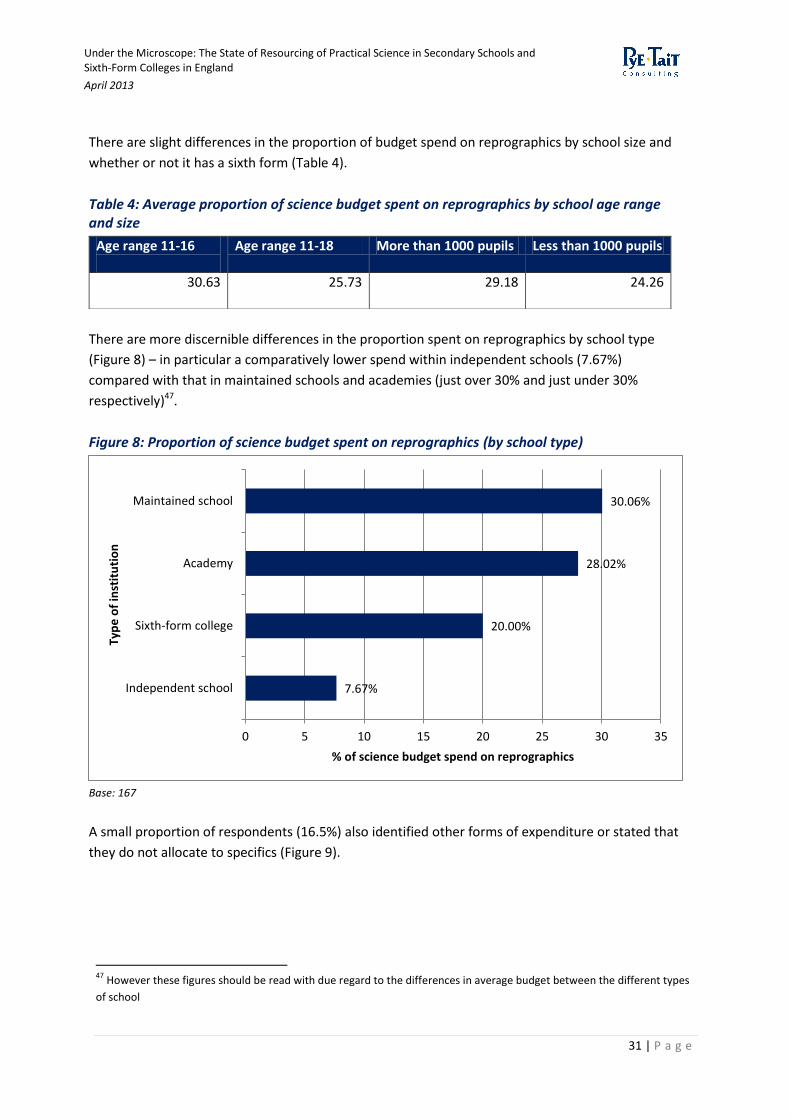
There are more discernible differences in the proportion spent on reprographics by school type
(Figure 8) – in particular a comparatively lower spend within independent schools (7.67%)
compared with that in maintained schools and academies (just over 30% and just under 30%
respectively)47.
Figure 8: Proportion of science budget spent on reprographics (by school type)
Base: 167
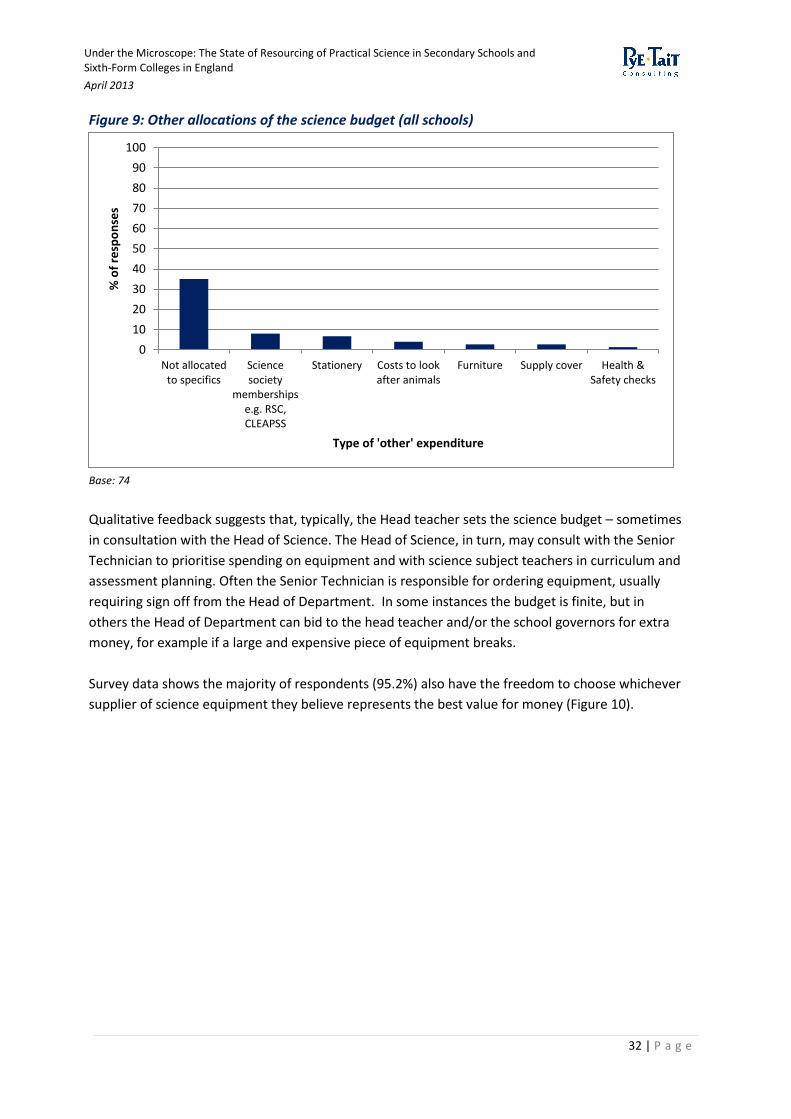
A small proportion of respondents (16.5%) also identified other forms of expenditure or stated that
they do not allocate to specifics (Figure 9).
47
However these figures should be read with due regard to the differences in average budget between the different types
of school
7.67%
20.00%
28.02%
30.06%
0 5 10 15 20 25 30 35
Independent school
Sixth-form college
Academy
Maintained school
% of science budget spend on reprographics
Typ
e o
f in
stit
uti
on
Under the Microscope: The State of Resourcing of Practical Science in Secondary Schools and Sixth-Form Colleges in England
April 2013
32 | P a g e
Figure 9: Other allocations of the science budget (all schools)
Base: 74
Qualitative feedback suggests that, typically, the Head teacher sets the science budget – sometimes
in consultation with the Head of Science. The Head of Science, in turn, may consult with the Senior
Technician to prioritise spending on equipment and with science subject teachers in curriculum and
assessment planning. Often the Senior Technician is responsible for ordering equipment, usually
requiring sign off from the Head of Department. In some instances the budget is finite, but in
others the Head of Department can bid to the head teacher and/or the school governors for extra
money, for example if a large and expensive piece of equipment breaks.
Survey data shows the majority of respondents (95.2%) also have the freedom to choose whichever
supplier of science equipment they believe represents the best value for money (Figure 10).
0
10
20
30
40
50
60
70
80
90
100
Not allocatedto specifics
Sciencesociety
membershipse.g. RSC,CLEAPSS
Stationery Costs to lookafter animals
Furniture Supply cover Health &Safety checks
% o
f re
spo
nse
s
Type of 'other' expenditure
Under the Microscope: The State of Resourcing of Practical Science in Secondary Schools and Sixth-Form Colleges in England
April 2013
33 | P a g e
Figure 10: Freedom to choose science supplier that offers the best value for money
Base: 294
4.4 Additional sources of funding Survey data shows that schools also secure extra contributions from parents and in some cases,
teachers and technicians supplement the core science budget by paying for items themselves, for
which (according to qualitative feedback) they are not always reimbursed (Figure 11). It is not
possible to quantify accurately the proportion of science budgets that are being subsidised by
teachers and technicians however, as there is substantial variation between the amounts actually
being spent, and the frequency with which this is occurring.
95.20% (280)
3.00% (9)
1.80% (5)
Yes
No
Don't know

Under the Microscope: The State of Resourcing of Practical Science in Secondary Schools and Sixth-Form Colleges in England
April 2013
34 | P a g e
Figure 11: Additional contributions to normal and extra-curricular science activities48
Base: 400 responses
Other forms of contribution come from such sources as:
External secondment/consultancy work;
Payment for PGCE49 students;
Fundraising (typically via the Parent Teacher Association);
Via awards;
Gifted & talented budget.
Qualitative feedback suggests that some schools appear to be much more knowledgeable than
others when it comes to accessing additional funding for science. Certain schools face difficulties as
they do not appear to know what types of opportunities are available, whilst others submit
numerous bids which can raise thousands of pounds of additional money in a number of ways:
Working collaboratively with local science centres to borrow equipment and acquire CPD50
for staff;
48
State-funded schools only 49
Postgraduate Certificate of Education 50
Continuing Professional Development
0%
10%
20%
30%
40%
50%
60%
70%
80%
90%
100%
% o
f re
spo
nse
s
Type of additional source of funding for science
Normal curricular
Extra-curricular
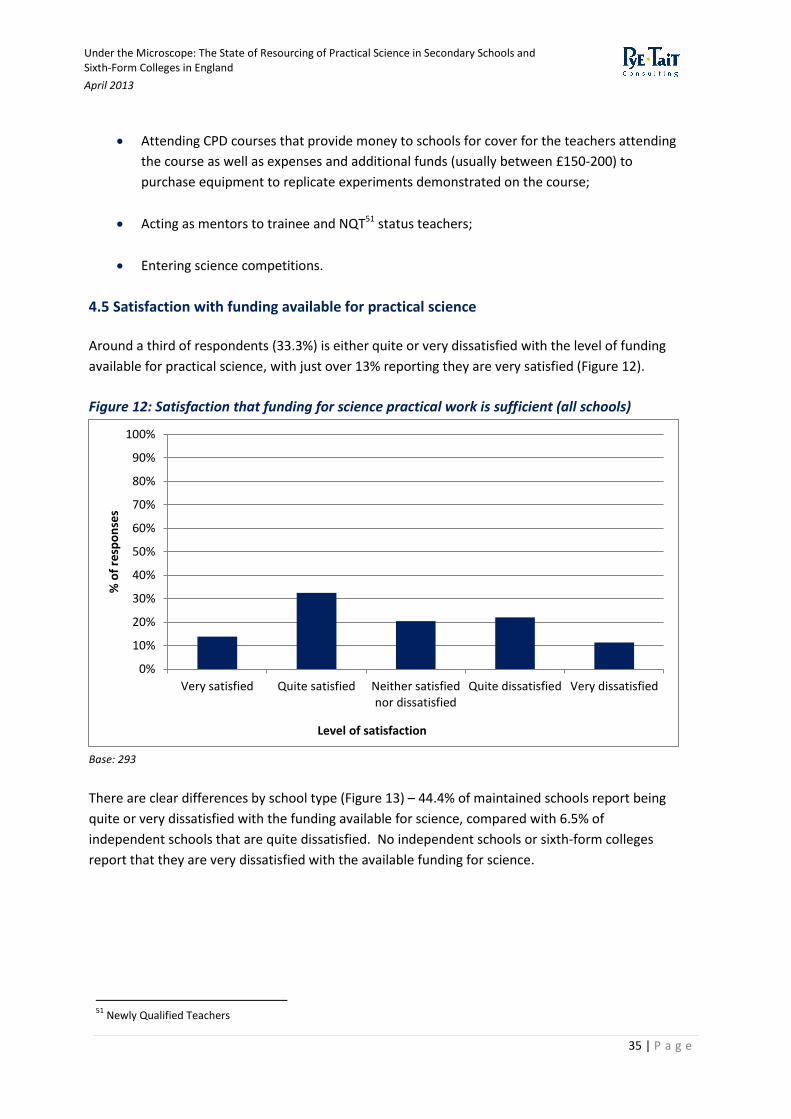
Under the Microscope: The State of Resourcing of Practical Science in Secondary Schools and Sixth-Form Colleges in England
April 2013
35 | P a g e
Attending CPD courses that provide money to schools for cover for the teachers attending
the course as well as expenses and additional funds (usually between £150-200) to
purchase equipment to replicate experiments demonstrated on the course;
Acting as mentors to trainee and NQT51 status teachers;
Entering science competitions.
4.5 Satisfaction with funding available for practical science
Around a third of respondents (33.3%) is either quite or very dissatisfied with the level of funding
available for practical science, with just over 13% reporting they are very satisfied (Figure 12).
Figure 12: Satisfaction that funding for science practical work is sufficient (all schools)
Base: 293
There are clear differences by school type (Figure 13) – 44.4% of maintained schools report being
quite or very dissatisfied with the funding available for science, compared with 6.5% of
independent schools that are quite dissatisfied. No independent schools or sixth-form colleges
report that they are very dissatisfied with the available funding for science.
51
Newly Qualified Teachers
0%
10%
20%
30%
40%
50%
60%
70%
80%
90%
100%
Very satisfied Quite satisfied Neither satisfiednor dissatisfied
Quite dissatisfied Very dissatisfied
% o
f re
spo
nse
s
Level of satisfaction
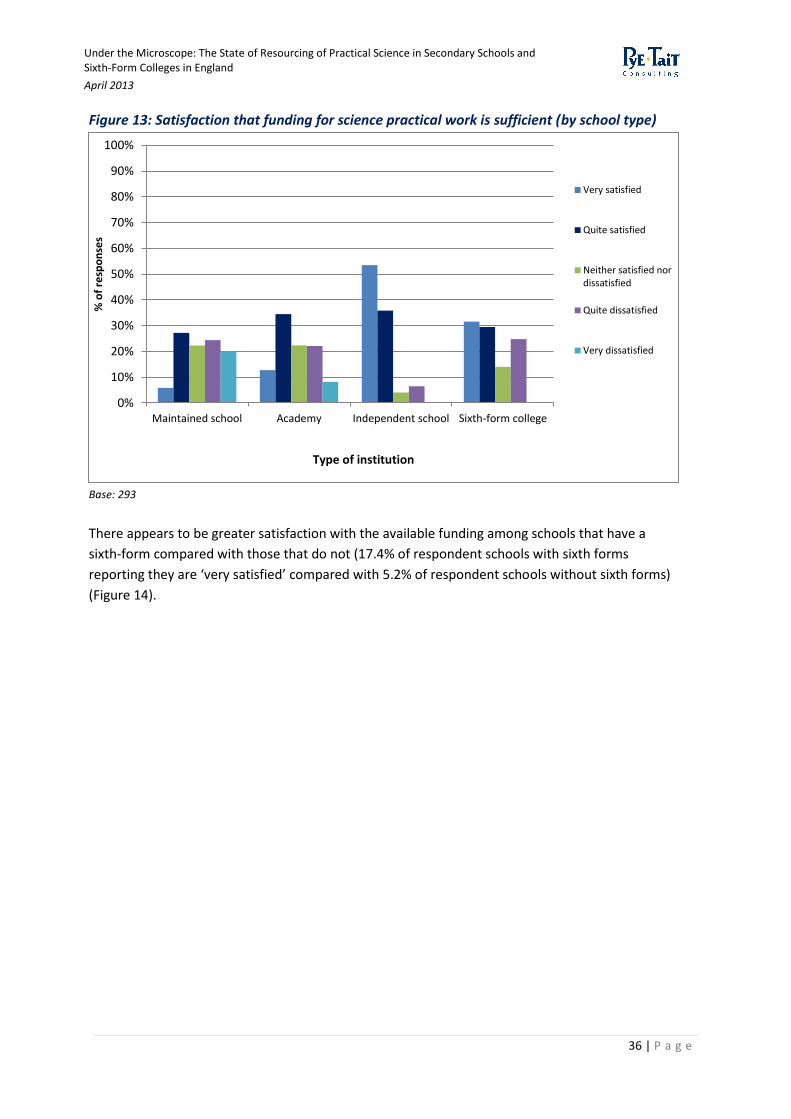
Under the Microscope: The State of Resourcing of Practical Science in Secondary Schools and Sixth-Form Colleges in England
April 2013
36 | P a g e
Figure 13: Satisfaction that funding for science practical work is sufficient (by school type)
Base: 293
There appears to be greater satisfaction with the available funding among schools that have a
sixth-form compared with those that do not (17.4% of respondent schools with sixth forms
reporting they are ‘very satisfied’ compared with 5.2% of respondent schools without sixth forms)
(Figure 14).
0%
10%
20%
30%
40%
50%
60%
70%
80%
90%
100%
Maintained school Academy Independent school Sixth-form college
% o
f re
spo
nse
s
Type of institution
Very satisfied
Quite satisfied
Neither satisfied nordissatisfied
Quite dissatisfied
Very dissatisfied
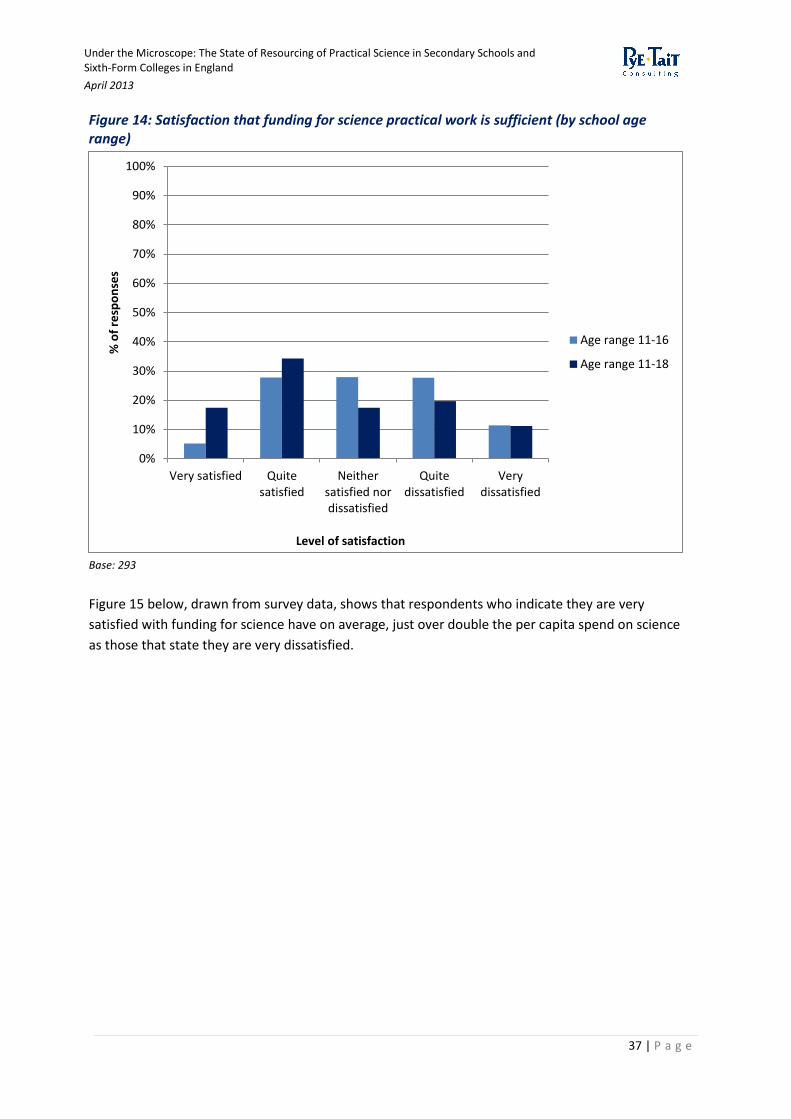
Under the Microscope: The State of Resourcing of Practical Science in Secondary Schools and Sixth-Form Colleges in England
April 2013
37 | P a g e
Figure 14: Satisfaction that funding for science practical work is sufficient (by school age range)
Base: 293
Figure 15 below, drawn from survey data, shows that respondents who indicate they are very
satisfied with funding for science have on average, just over double the per capita spend on science
as those that state they are very dissatisfied.
0%
10%
20%
30%
40%
50%
60%
70%
80%
90%
100%
Very satisfied Quitesatisfied
Neithersatisfied nordissatisfied
Quitedissatisfied
Verydissatisfied
% o
f re
spo
nse
s
Level of satisfaction
Age range 11-16
Age range 11-18

Under the Microscope: The State of Resourcing of Practical Science in Secondary Schools and Sixth-Form Colleges in England
April 2013
38 | P a g e
Figure 15: Average science budget by level of satisfaction52
Base: 234
4.6 Anticipated future changes in funding for practical science
Findings in this section are drawn purely from qualitative feedback, which indicates that among
state-funded schools, funding has remained more or less static in money terms for at least the last
five years, against a backdrop of rising equipment/consumables costs and increasing pupil numbers
and class sizes. Where there has been an increase in funding it is usually because of a change in
status:
Taking up academy status provided some extra one-off funding. The majority of
respondents report this extra money was spent quickly (because of a perception that it
could be reallocated elsewhere if not immediately used);
The addition of a sixth form to a school allows for extra funding to resource A-level
science; however in some cases this appears to have been spent on science equipment
and resources to benefit the whole school.
Qualitative feedback shows that respondents are concerned that there has not been, and does not
appear likely to be any time soon, an increase in funding for science to reflect the pressures of
rising costs and higher numbers of pupils.
“Science in the UK is dreadfully underfunded for a 21st century experience”
“Our budget has been cut EVERY year for the last five and will be cut in the next two years as well”
52
State-funded schools only
£7.86
£10.56
£9.97
£14.91
£16.95
0 2 4 6 8 10 12 14 16 18
Very dissatisfied
Quite dissatisfied
Neither satisfied nor dissatisfied
Quite satisfied
Very satisfied
Average per capita spend on science (£)
Leve
l of
sati
sfac
tio
n w
ith
fu
nd
ing
for
scie
nce
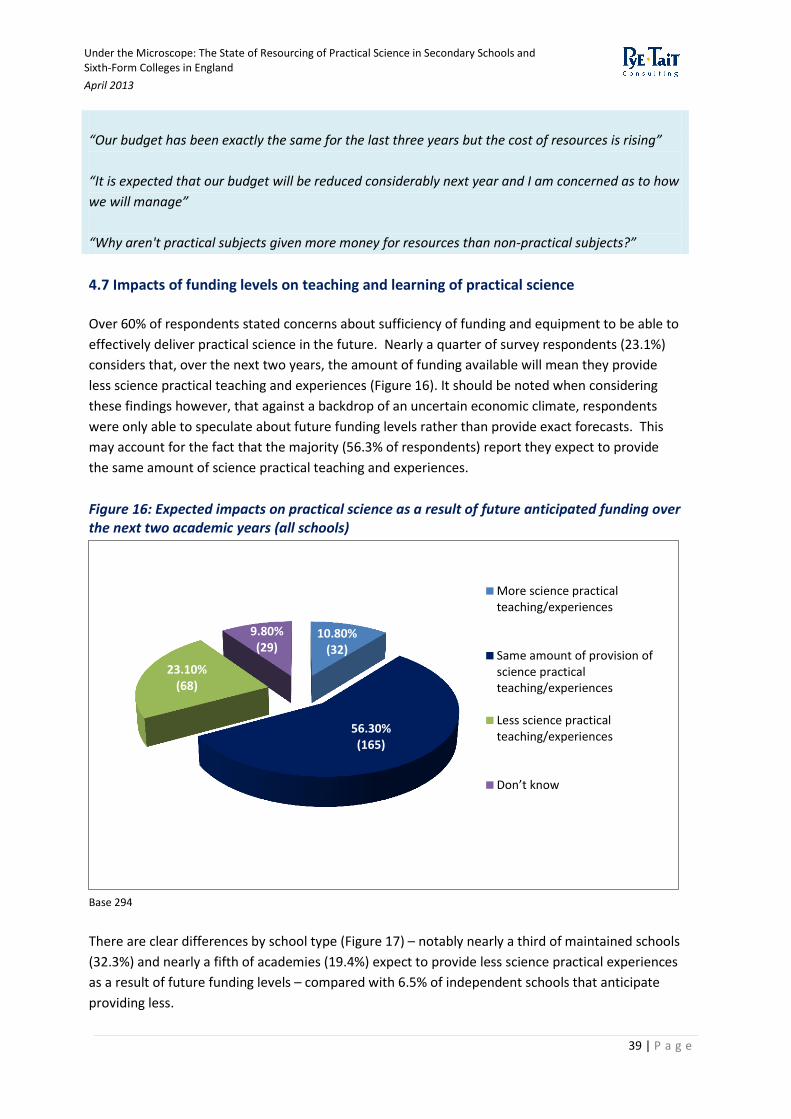
Under the Microscope: The State of Resourcing of Practical Science in Secondary Schools and Sixth-Form Colleges in England
April 2013
39 | P a g e
“Our budget has been exactly the same for the last three years but the cost of resources is rising”
“It is expected that our budget will be reduced considerably next year and I am concerned as to how
we will manage”
“Why aren't practical subjects given more money for resources than non-practical subjects?”
4.7 Impacts of funding levels on teaching and learning of practical science
Over 60% of respondents stated concerns about sufficiency of funding and equipment to be able to
effectively deliver practical science in the future. Nearly a quarter of survey respondents (23.1%)
considers that, over the next two years, the amount of funding available will mean they provide
less science practical teaching and experiences (Figure 16). It should be noted when considering
these findings however, that against a backdrop of an uncertain economic climate, respondents
were only able to speculate about future funding levels rather than provide exact forecasts. This
may account for the fact that the majority (56.3% of respondents) report they expect to provide
the same amount of science practical teaching and experiences.
Figure 16: Expected impacts on practical science as a result of future anticipated funding over the next two academic years (all schools)
Base 294
There are clear differences by school type (Figure 17) – notably nearly a third of maintained schools
(32.3%) and nearly a fifth of academies (19.4%) expect to provide less science practical experiences
as a result of future funding levels – compared with 6.5% of independent schools that anticipate
providing less.
10.80% (32)
56.30% (165)
23.10% (68)
9.80% (29)
More science practicalteaching/experiences
Same amount of provision ofscience practicalteaching/experiences
Less science practicalteaching/experiences
Don’t know
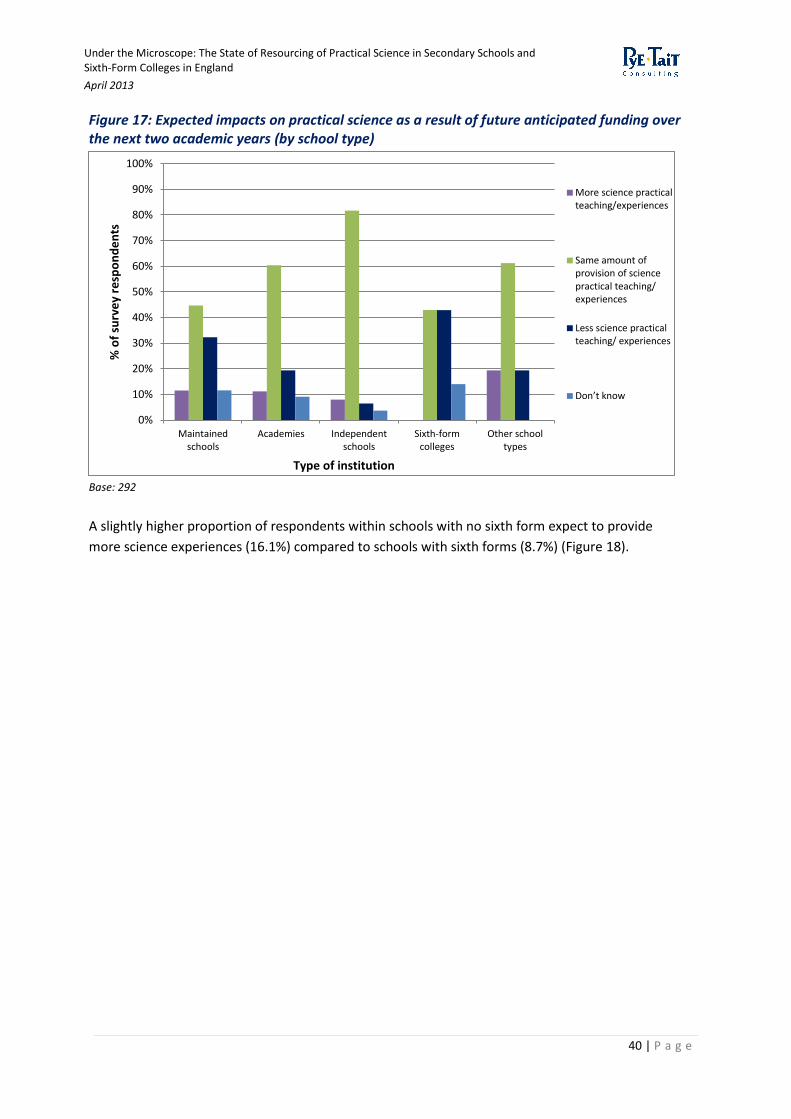
Under the Microscope: The State of Resourcing of Practical Science in Secondary Schools and Sixth-Form Colleges in England
April 2013
40 | P a g e
Figure 17: Expected impacts on practical science as a result of future anticipated funding over the next two academic years (by school type)
Base: 292
A slightly higher proportion of respondents within schools with no sixth form expect to provide
more science experiences (16.1%) compared to schools with sixth forms (8.7%) (Figure 18).
0%
10%
20%
30%
40%
50%
60%
70%
80%
90%
100%
Maintainedschools
Academies Independentschools
Sixth-formcolleges
Other schooltypes
% o
f su
rve
y re
spo
nd
en
ts
Type of institution
More science practicalteaching/experiences
Same amount ofprovision of sciencepractical teaching/experiences
Less science practicalteaching/ experiences
Don’t know

Under the Microscope: The State of Resourcing of Practical Science in Secondary Schools and Sixth-Form Colleges in England
April 2013
41 | P a g e
Figure 18: Expected impacts on practical science as a result of as a result of future anticipated funding over the next two academic years (by school age range)
Base: 292
Qualitative feedback53 suggests schools typically are not replacing items of equipment unless
absolutely necessary. Where schools have to “save up” for expensive items, such as Van de Graaf
generators, fume cupboards, microscopes and equipment for teaching radioactivity, they tend to
keep the broken equipment for spare parts. If a piece of equipment is out of action for a long time
teachers report using YouTube and other virtual visual demonstrations to at least partially fill in the
gap (this is not considered a satisfactory replacement because pupils do not get personal
experience of the experimental process or use of the equipment).
“Replacement of equipment which is worn out is probably our biggest issue”
Schools also report they are unlikely to be able to purchase ‘high end’ or high cost items of
equipment unless there will be in regular usage. This links to a requirement, for many schools, to
present a business case for financing new purchases.
Another barrier in some schools is the rule that budgets must be completely spent in the academic
year or the surplus will be clawed back into central funds. Qualitative feedback strongly suggests
that this approach has the effect of forcing spending on smaller items some of which may not be
strictly necessary, while preventing science departments from “saving up” for higher end items.
“High end A-Level equipment that is only used once or twice a year is a luxury and one we cannot
afford”
“There are pieces of equipment that require too much capital outlay to purchase and possibly have
53
State-funded schools only
0% 20% 40% 60% 80% 100%
Don’t know
Less science practicalteaching/experiences
Same amount of provision of sciencepractical teaching/experiences
More science practicalteaching/experiences
% of respondents
An
tici
pat
ed
ch
ange
s
Age range 11-18
Age range 11-16
Under the Microscope: The State of Resourcing of Practical Science in Secondary Schools and Sixth-Form Colleges in England
April 2013
42 | P a g e
too high maintenance costs for us to justify, since they would be used for a specific teaching
component, and then limited annual use thereafter”
Qualitative feedback indicates that many schools are now cash free and this has implications for
the availability of petty cash to buy small one-off items for practical experiments. Some schools are
creative in overcoming this issue – for example, one school charges learners 20p to borrow a
replacement lab coat or text book if they forget their own and so builds its own petty cash coffers.
Respondents that participated in the qualitative phase of the research report that reduced funding
and budget cuts can impact negatively on the teaching and learning of practical science, with areas
of particular concern spanning:
A culture of adapting and ‘making do’ due to widely held expectations of limited budgets
and the prospects of further funding cuts (cited by 34% of respondents);
Risk of running out of consumables and having to alter the delivery of lessons as a result
(for example by cutting practical work and/or using class demonstrations when the
pedagogical preference would be for work in pairs or small groups) (cited by 22.8% of
respondents);
Limited capacity to buy new or upgrade existing equipment, which can curtail the type of
practical work that can be offered – appears to be a particular issue for physics (cited by
19.5% of respondents).
In a small number of cases (just under 7% of respondents), planned upgrades to existing stock
levels or refurbishments have been abruptly halted as a result of policy changes such as the
withdrawal of the Building Schools for the Future programme, or because of budget cuts.
“Just had a 30% cut to budget so am concerned about simply running out of consumables such as
test tubes, chemicals etc.”
“There is a lot of equipment that we would like to purchase, but due to a 54% budget reduction over
the last 2 years, we have been unable to continue our programme of improvements”
“Very little ICT equipment is available due to a limited budget”
“We undoubtedly cannot do everything we want (because of funding shortages)”
“Pre and post-16 physics equipment have a high individual cost and keep getting put to the bottom
of the list in favour of buying more lower cost equipment and consumables”
“Whilst we are well resourced at the moment, we no longer get the same level of funding that we
used to, so updating equipment or repairing broken equipment may be a problem in the future”
Under the Microscope: The State of Resourcing of Practical Science in Secondary Schools and Sixth-Form Colleges in England
April 2013
43 | P a g e
“We have adapted to science on a shoe string”
“Our budget is so small that we always have to get the minimum number/cheapest of everything”
“Owing to a 50% cut in budget we are struggling to stand still let alone improve”
“The cost of resourcing a science department is usually underestimated as it is expensive to replace
worn out equipment and often money has to be spent to comply with safety regulations. We have
existed on a culture of 'make do and mend’ for too long”
4.7.1 Expected impacts of the removal of weighting for funding of science provision (post-16)
A small proportion of respondents interviewed during the qualitative phase of the research (9%)
provided feedback about the Government proposals to remove weighting of funding for science
provision at post-16 level54. All felt that, if enforced, such proposals are likely to have a negative
impact on science teaching and learning, potentially resulting in:
Less money to buy equipment necessary for A-Level and A-Level equivalent curriculum
delivery;
Diminished quality in science teaching and learning, which could mean lower numbers of
students apply to the institution to study science;
Students insufficiently prepared to study at university as a result of severely curtailed
practical science experiences.
“This [the proposals to cut the 12% weighting for science for 16-19 provision] concerns me greatly –
we have had to manage with a tight budget for the past few years and have tightened our belts as
much as we can, I really don’t know how we would cope if the weighting was lost”
“I am quite lucky at the moment but am concerned that the reduction in sixth form funding will
impact on resourcing their lessons”
“My gut reaction is that it is an awful idea. It is fairly obvious that the practical requirements at A-
Level require more costly equipment and surely if we are wanting to encourage young scientists to
take up STEM careers we need to provide them with as good an education at school level as we
possibly can”
“It [would be] disastrous. We would have to stop doing as many practicals”
54
This this was not in the original scope of the research as proposals emerged after research had been started, therefore could only be tested with a small sample and these findings should be treated as indicative only
Under the Microscope: The State of Resourcing of Practical Science in Secondary Schools and Sixth-Form Colleges in England
April 2013
44 | P a g e
5. Resourcing 5.1 Benchmarking against indicative items In addition to quantifying the levels of funding available for practical science in secondary schools
and sixth form colleges, the research sought to identify the availability of the full range of practical
science resources: equipment and consumables; laboratory facilities; access to outside learning
environments; and availability of technician support.
The starting point for this part of the research was the full benchmark list of resources developed
by SCORE in the previous phase of the Resourcing School Science project. The full benchmarks
represent a full and comprehensive list of the items required for appropriate delivery of the
National Curriculum programme of study in science for Key Stages 3 and 4, and science A levels in
biology, chemistry and physics. It was therefore not felt to be practicable to ask schools to report
on the availability of all the various benchmark items.
For each of the main resource areas, a smaller list of ‘indicative’ items was therefore drawn from
the full benchmark list by an expert Working Group convened by SCORE. These items were then
incorporated within the main survey of secondary schools and sixth-form colleges.
Respondents to the survey were asked to consider the availability in their school of science
equipment and consumables, for a) general science and for b) pre- and post-16 biology, chemistry,
and physics. Respondents were asked whether they consider they have:
Enough of each item in working order (‘enough’ in this context was clearly defined as
either one per pupil, one between two pupils, one for small groups of three-four pupils, or
one for a class demonstration);
Enough of each item but not all in full working order;
Not enough to meet requirements;
Not enough and respondents state they need items in question;
Not enough, but respondents state they do not need items in question;
Items not in use.
For each of the laboratory facilities and outside learning environments, respondents were asked to
state whether the facility or form of outside space is:
Under the Microscope: The State of Resourcing of Practical Science in Secondary Schools and Sixth-Form Colleges in England
April 2013
45 | P a g e
Easy to access and used regularly;
Easy to access, and used sometimes;
Not easy to access;
Not accessible, and needed;
Not accessible, but not needed.
The research also considered the availability of the technician support available to schools, using a
combination of rating-scale questions and in-depth qualitative research to assess the adequacy of
technician support within secondary schools and sixth form colleges.
It should be noted that the evidence gathered in both the quantitative and qualitative phases of
the research strongly suggested that the indicative items represent an appropriate level of resource
for secondary schools and sixth form colleges. Very few schools reported that they had any of the
items but did not need them. In addition, just over 85% of respondents who took part in telephone
or face-to-face interviews agreed that the indicative items outlined in the survey55 are fit for
purpose and give an accurate picture of the items needed to offer an effective practical science
learning experience.
The main areas where there was some disagreement were:
The need for klinostats for the teaching of pre-16 biology. A significant proportion (just
over 27%) of survey respondents stated that they neither have nor need them, and a
further 16.1% stating that they have, but do not use them;
The need for access to several of the indicative outside spaces, particularly at post-16 level.
Several of the environments were reported as being inaccessible but not needed, most
notably ‘access to a functioning renewable energy source’ at pre-16 level (although it
should be noted that this finding must be contextualised against a still higher proportion
stating that this was needed).
The frequency with which post-16 level outside learning environments were reported as not
needed suggests that, with the sole exception of ‘access to varied habitats’, they currently play a
relatively small role in the delivery of the post-16 curriculum at many English schools.
In addition to the sections of the survey dealing with the accessibility and availability of the
indicative resources, respondents were asked to consider their satisfaction with current levels of
resourcing; and their confidence that future levels of resource would enable them to sustain
current levels of practical science experiences. A small number of open response questions were
also included to allow respondents to raise additional issues that may not have been covered in the
rest of the survey. Finally, the issues that emerged from the survey research were discussed in
detail with a sample of respondents during the subsequent phase of in-depth qualitative research.
55
The list of equipment and facilities in the survey summarised indicative items and was not intended to be an exhaustive list of everything required (for a more comprehensive list of all items required readers should refer to the SCORE benchmarks)
Under the Microscope: The State of Resourcing of Practical Science in Secondary Schools and Sixth-Form Colleges in England
April 2013
46 | P a g e
Key messages in relation to resourcing of practical science are:
There is considerable variation in the resourcing levels of secondary schools and sixth-form
colleges, and also disparity between resourcing of individual science subjects;
Nearly a fifth of schools have issues accessing over half or more of the indicative items
needed for resourcing pre-16 biology and less than 1 in 7 schools are able to access over
90% of the indicative items. Biology at pre-16 level is the least well-resourced of the three
sciences (63.1% of responses indicate sufficient quantities in full working order, compared
with 70.7% for pre-16 chemistry and 72% for pre-16 physics);
The average state-funded secondary school has just 70% of the equipment and
consumables it needs to teach science subjects, but four in ten state-funded schools have
less than 70% of the equipment and consumables they require;
A third of state-funded schools have 80% or more of the equipment and consumables they
need;
At post-16 levels, resourcing for biology presents no smaller cause for concern – less than
44% of responses indicate access to sufficient numbers of the indicative items (compared
with 66% for post-16 chemistry and 62% for post-16 physics). Less than 12% of schools
have access to more than 90% of the indicative items for post-16 biology;
The biggest issue for resourcing of pre-16 chemistry appears to be maintaining the
indicative items in sufficient quantities, in full working order. For 4 out of 10 schools, less
than 70% of the indicative items are easily available, and only a quarter of schools can
easily access more than 90% of the indicative items for pre-16 chemistry;
Less than 1 in 5 schools have access to more than 90% of the indicative items and 1 in 6
have access to less than 50% of the indicative items for post-16 chemistry;
Nearly 1 in 3 schools that have access to more than 90% of the indicative items for pre-16
physics), and around 4 in 10 schools having access to less than 70% of the indicative items
for post-16 physics;
Compared with the individual science subjects, schools are relatively well-resourced in
relation to general science equipment – however sufficient quantities of the indicative
items are still not available to 15% of schools. The most frequently cited type of general
equipment needed by schools are heated magnetic stirrers (not available to 40% of schools
in sufficient quantities) and data loggers (not available to 36% of schools in sufficient
quantities);
Under the Microscope: The State of Resourcing of Practical Science in Secondary Schools and Sixth-Form Colleges in England
April 2013
47 | P a g e
Nearly a third of maintained schools and nearly a fifth of academies are either quite or very
dissatisfied with resourcing of science equipment and consumables. However, despite
issues with resourcing of equipment and consumables, respondents appear somewhat
tolerant of the situation, with the majority of state-funded schools (over 45% on average)
reporting they are quite satisfied with resourcing levels;
Laboratory facilities are not easily or not accessible to 23% of respondents. Nearly a fifth of
schools have access to less than 70% of the indicative laboratory facilities. Issues with
laboratories relate predominantly to design, in terms of sufficient space and proximity to
critical resources; for example the prep room. Just over 27% of respondents are either
quite or very dissatisfied with laboratory facilities; however no sixth-form colleges report
dissatisfaction – which may relate to the fact that 60% of sixth-form college respondents
have specialist laboratories per science subject (compared with 1.7% of maintained schools
and 3.8% of academies that do);
Less than 7% of schools have access to indicative outside learning environments for pre-16
provision; there are substantially more concerns in relation to post-16 provision, where
nearly 60% of schools have access to less than 10% of the indicative items. In spite of this
only 14.2% of maintained schools and 12% of academies report being either quite or very
dissatisfied with access to outside learning environments – which may suggest a lack of
awareness among schools about what ‘good’ access to outside space for learning actually
looks like;
Around 70% of respondents employ technicians during term-time only. Nearly 30% of
maintained schools and nearly a quarter of academies state they are quite or very
dissatisfied with the amount of technician support available to them;
Impacts on teaching and learning of practical science as a result of inadequate resourcing
include: changes to group sizes (for example work undertaken in groups of 3 or 4 rather
than individually or in pairs); and fewer practical experiences undertaken where there is
insufficient technician support to adequately resource this.
Under the Microscope: The State of Resourcing of Practical Science in Secondary Schools and Sixth-Form Colleges in England
April 2013
48 | P a g e
5.2 Equipment and consumables
A major objective of the survey research was to ascertain the extent to which schools are well
resourced or otherwise in comparison with the indicative list of equipment and consumables.
These provided detailed information on indicative lists of equipment for:
Pre-16 biology (fifteen items) and post-16 biology (eleven items);
Pre-16 chemistry (fifteen items) and post-16 chemistry (sixteen items);
Pre-16 physics (twenty-four items) and post-16 physics (twenty-one items);
General science equipment relevant to all curriculum areas and phases (eleven items).
This section begins by outlining the detailed findings from the indicative lists of equipment by
subject area and phase of education; it then summarises the overall availability of equipment and
consumables; finally, it goes on to consider the satisfaction levels with current resourcing levels
reported by respondents.
The detailed discussion in this section of the reports explores the level of resourcing in state-
funded secondary schools and sixth form colleges in England in greatest detail, as these are
SCORE’s primary policy focus. Most of the tables and the discussion are therefore based on the 152
responses from state-funded secondary schools and sixth form colleges that provided detailed
information on resourcing levels. However, comparative data is given from other schools types
where this is considered to be illuminating.
Overall the research has found that the average state-funded secondary school has just 70% of the
indicative equipment and consumables it needs to teach science subjects, however four in ten
state-funded schools have less than 70% of the equipment and consumables they require, while a
third of state-funded schools have 80% or more of the equipment and consumables they need.
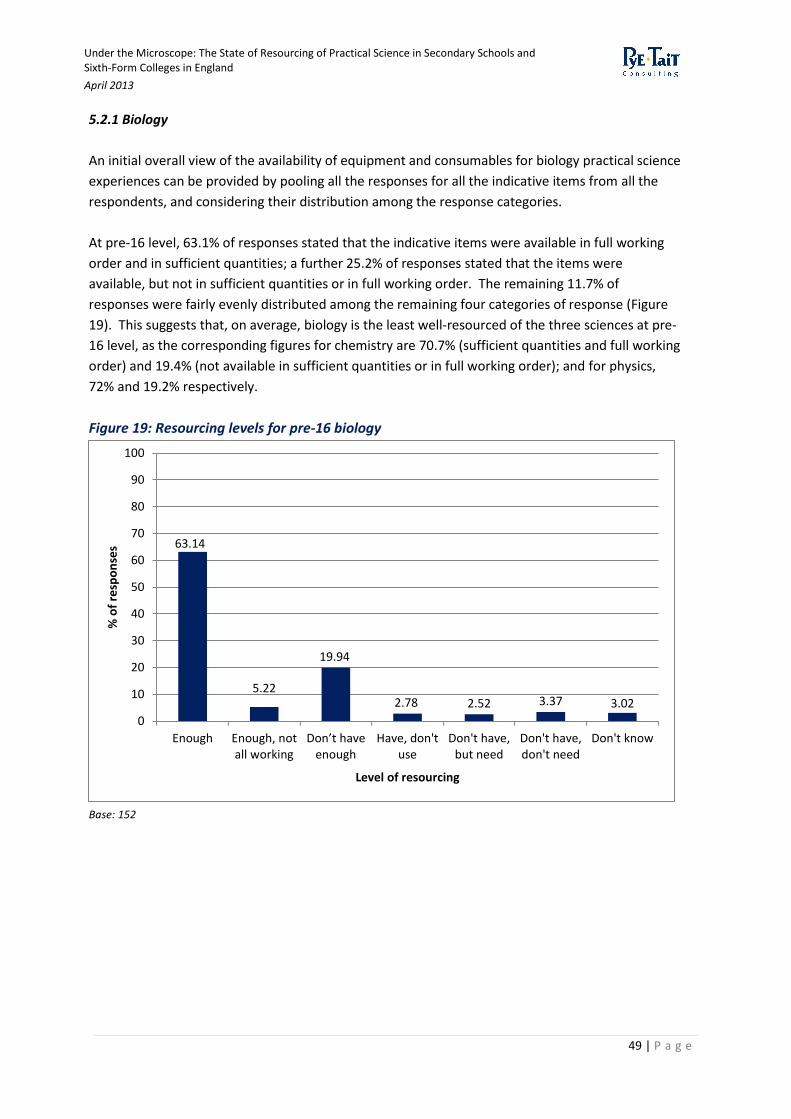
Under the Microscope: The State of Resourcing of Practical Science in Secondary Schools and Sixth-Form Colleges in England
April 2013
49 | P a g e
5.2.1 Biology
An initial overall view of the availability of equipment and consumables for biology practical science
experiences can be provided by pooling all the responses for all the indicative items from all the
respondents, and considering their distribution among the response categories.
At pre-16 level, 63.1% of responses stated that the indicative items were available in full working
order and in sufficient quantities; a further 25.2% of responses stated that the items were
available, but not in sufficient quantities or in full working order. The remaining 11.7% of
responses were fairly evenly distributed among the remaining four categories of response (Figure
19). This suggests that, on average, biology is the least well-resourced of the three sciences at pre-
16 level, as the corresponding figures for chemistry are 70.7% (sufficient quantities and full working
order) and 19.4% (not available in sufficient quantities or in full working order); and for physics,
72% and 19.2% respectively.
Figure 19: Resourcing levels for pre-16 biology
Base: 152
63.14
5.22
19.94
2.78 2.52 3.37 3.02
0
10
20
30
40
50
60
70
80
90
100
Enough Enough, notall working
Don’t have enough
Have, don'tuse
Don't have,but need
Don't have,don't need
Don't know
% o
f re
spo
nse
s
Level of resourcing
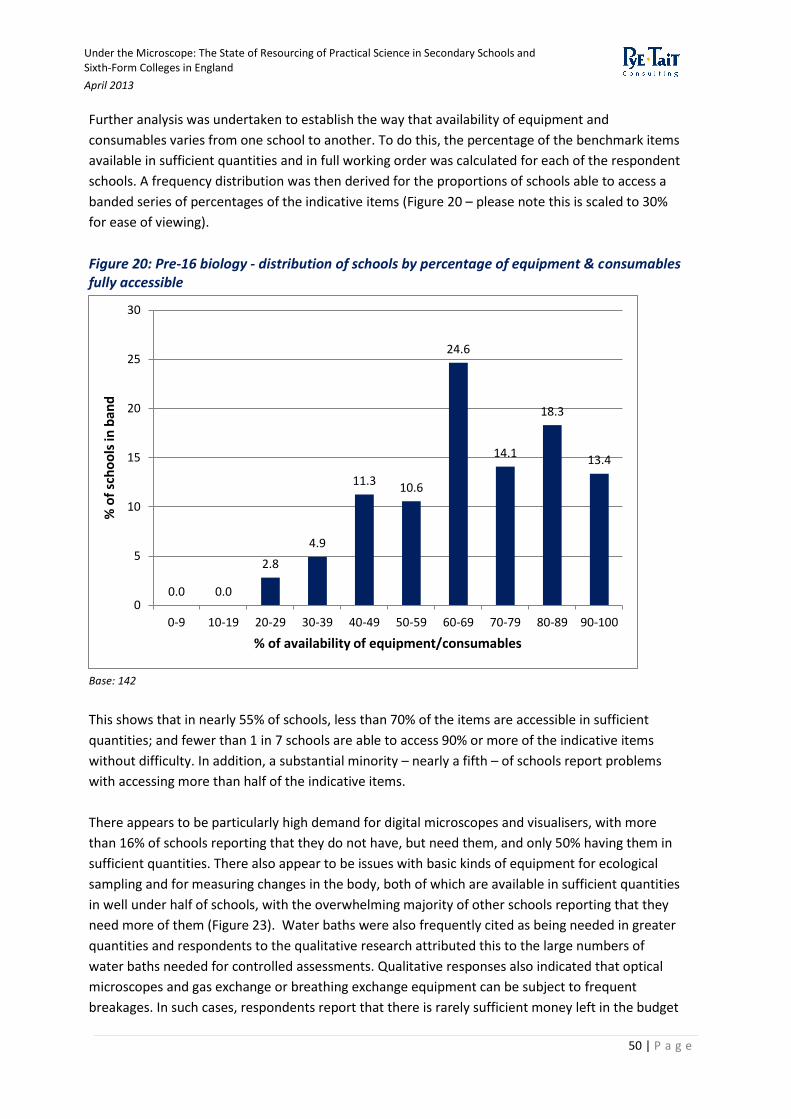
Under the Microscope: The State of Resourcing of Practical Science in Secondary Schools and Sixth-Form Colleges in England
April 2013
50 | P a g e
Further analysis was undertaken to establish the way that availability of equipment and
consumables varies from one school to another. To do this, the percentage of the benchmark items
available in sufficient quantities and in full working order was calculated for each of the respondent
schools. A frequency distribution was then derived for the proportions of schools able to access a
banded series of percentages of the indicative items (Figure 20 – please note this is scaled to 30%
for ease of viewing).
Figure 20: Pre-16 biology - distribution of schools by percentage of equipment & consumables fully accessible
Base: 142
This shows that in nearly 55% of schools, less than 70% of the items are accessible in sufficient
quantities; and fewer than 1 in 7 schools are able to access 90% or more of the indicative items
without difficulty. In addition, a substantial minority – nearly a fifth – of schools report problems
with accessing more than half of the indicative items.
There appears to be particularly high demand for digital microscopes and visualisers, with more
than 16% of schools reporting that they do not have, but need them, and only 50% having them in
sufficient quantities. There also appear to be issues with basic kinds of equipment for ecological
sampling and for measuring changes in the body, both of which are available in sufficient quantities
in well under half of schools, with the overwhelming majority of other schools reporting that they
need more of them (Figure 23). Water baths were also frequently cited as being needed in greater
quantities and respondents to the qualitative research attributed this to the large numbers of
water baths needed for controlled assessments. Qualitative responses also indicated that optical
microscopes and gas exchange or breathing exchange equipment can be subject to frequent
breakages. In such cases, respondents report that there is rarely sufficient money left in the budget
0.0 0.0
2.8
4.9
11.3 10.6
24.6
14.1
18.3
13.4
0
5
10
15
20
25
30
0-9 10-19 20-29 30-39 40-49 50-59 60-69 70-79 80-89 90-100
% o
f sc
ho
ols
in b
and
% of availability of equipment/consumables
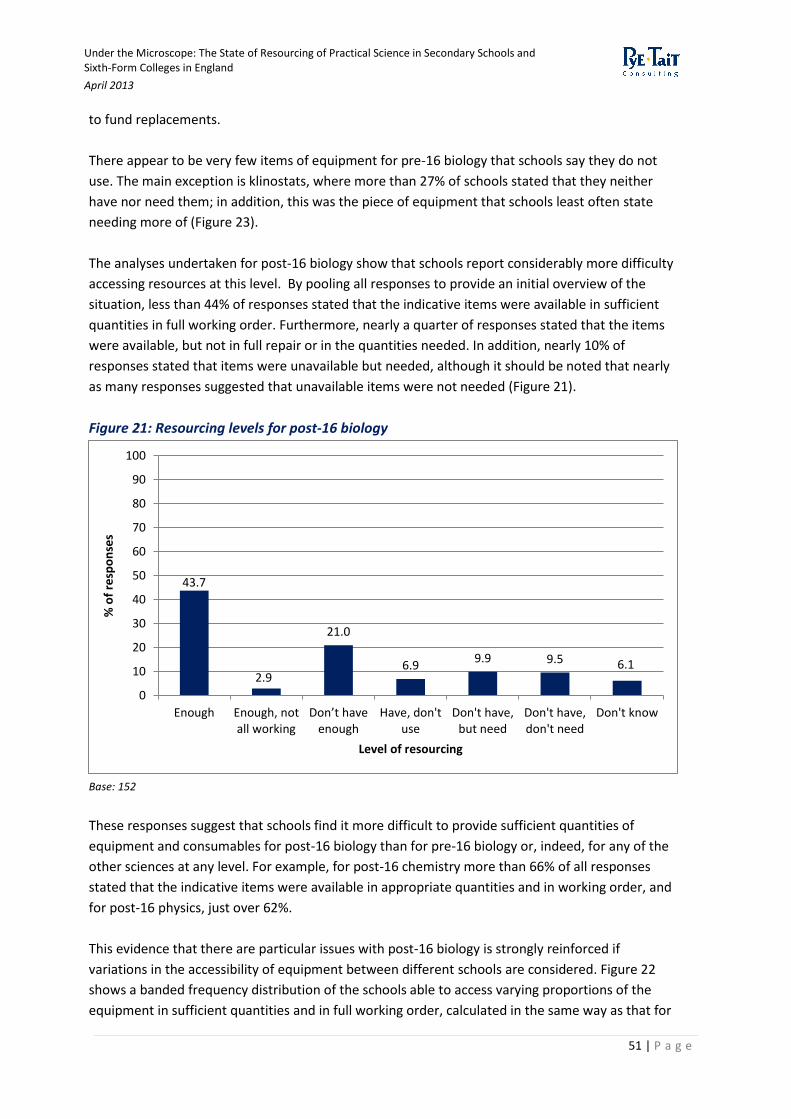
Under the Microscope: The State of Resourcing of Practical Science in Secondary Schools and Sixth-Form Colleges in England
April 2013
51 | P a g e
to fund replacements.
There appear to be very few items of equipment for pre-16 biology that schools say they do not
use. The main exception is klinostats, where more than 27% of schools stated that they neither
have nor need them; in addition, this was the piece of equipment that schools least often state
needing more of (Figure 23).
The analyses undertaken for post-16 biology show that schools report considerably more difficulty
accessing resources at this level. By pooling all responses to provide an initial overview of the
situation, less than 44% of responses stated that the indicative items were available in sufficient
quantities in full working order. Furthermore, nearly a quarter of responses stated that the items
were available, but not in full repair or in the quantities needed. In addition, nearly 10% of
responses stated that items were unavailable but needed, although it should be noted that nearly
as many responses suggested that unavailable items were not needed (Figure 21).
Figure 21: Resourcing levels for post-16 biology
Base: 152
These responses suggest that schools find it more difficult to provide sufficient quantities of
equipment and consumables for post-16 biology than for pre-16 biology or, indeed, for any of the
other sciences at any level. For example, for post-16 chemistry more than 66% of all responses
stated that the indicative items were available in appropriate quantities and in working order, and
for post-16 physics, just over 62%.
This evidence that there are particular issues with post-16 biology is strongly reinforced if
variations in the accessibility of equipment between different schools are considered. Figure 22
shows a banded frequency distribution of the schools able to access varying proportions of the
equipment in sufficient quantities and in full working order, calculated in the same way as that for
43.7
2.9
21.0
6.9 9.9 9.5 6.1
0
10
20
30
40
50
60
70
80
90
100
Enough Enough, notall working
Don’t have enough
Have, don'tuse
Don't have,but need
Don't have,don't need
Don't know
% o
f re
spo
nse
s
Level of resourcing
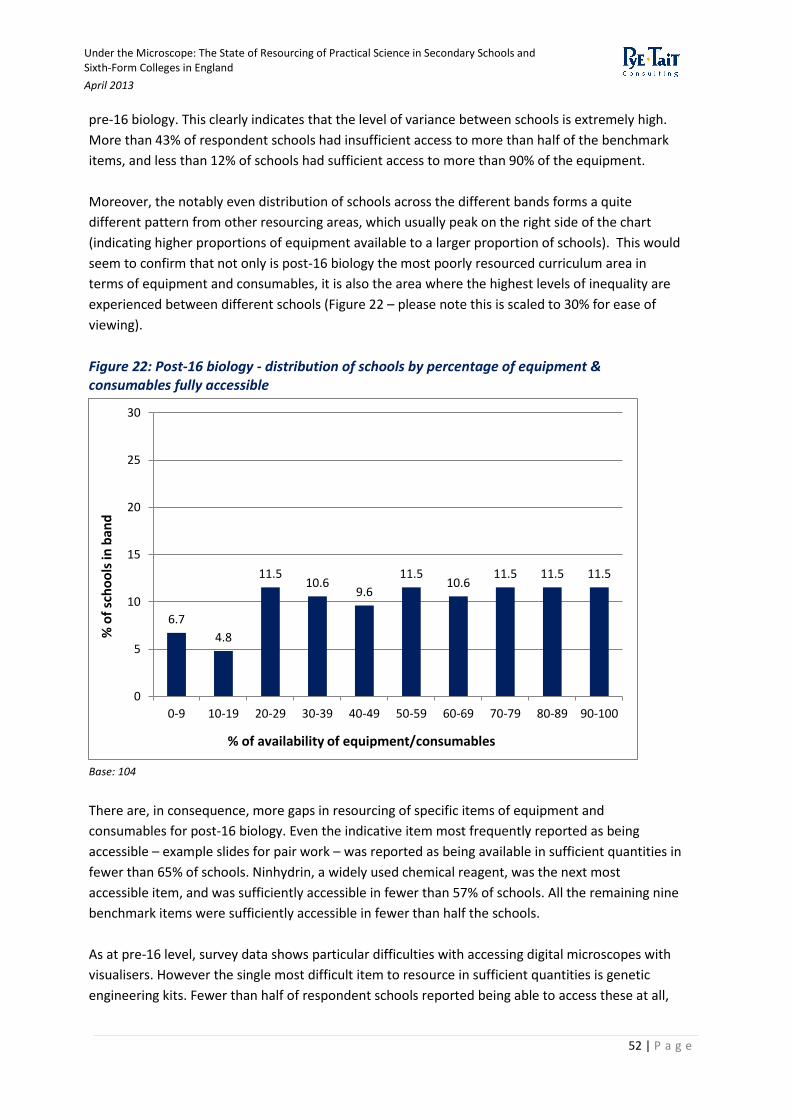
Under the Microscope: The State of Resourcing of Practical Science in Secondary Schools and Sixth-Form Colleges in England
April 2013
52 | P a g e
pre-16 biology. This clearly indicates that the level of variance between schools is extremely high.
More than 43% of respondent schools had insufficient access to more than half of the benchmark
items, and less than 12% of schools had sufficient access to more than 90% of the equipment.
Moreover, the notably even distribution of schools across the different bands forms a quite
different pattern from other resourcing areas, which usually peak on the right side of the chart
(indicating higher proportions of equipment available to a larger proportion of schools). This would
seem to confirm that not only is post-16 biology the most poorly resourced curriculum area in
terms of equipment and consumables, it is also the area where the highest levels of inequality are
experienced between different schools (Figure 22 – please note this is scaled to 30% for ease of
viewing).
Figure 22: Post-16 biology - distribution of schools by percentage of equipment & consumables fully accessible
Base: 104
There are, in consequence, more gaps in resourcing of specific items of equipment and
consumables for post-16 biology. Even the indicative item most frequently reported as being
accessible – example slides for pair work – was reported as being available in sufficient quantities in
fewer than 65% of schools. Ninhydrin, a widely used chemical reagent, was the next most
accessible item, and was sufficiently accessible in fewer than 57% of schools. All the remaining nine
benchmark items were sufficiently accessible in fewer than half the schools.
As at pre-16 level, survey data shows particular difficulties with accessing digital microscopes with
visualisers. However the single most difficult item to resource in sufficient quantities is genetic
engineering kits. Fewer than half of respondent schools reported being able to access these at all,
6.7
4.8
11.5 10.6
9.6
11.5 10.6
11.5 11.5 11.5
0
5
10
15
20
25
30
0-9 10-19 20-29 30-39 40-49 50-59 60-69 70-79 80-89 90-100
% o
f sc
ho
ols
in b
and
% of availability of equipment/consumables
Under the Microscope: The State of Resourcing of Practical Science in Secondary Schools and Sixth-Form Colleges in England
April 2013
53 | P a g e
and nearly a fifth of schools (18.8%) reported that they do not have, but need, them. Qualitative
feedback indicates that the relatively high cost of these kits typically acts as a barrier. Respondents
also report a need for more colorimeters and top pan balances, with the main concerns relating to
purchasing them in sufficient quantities and then maintaining them in good working order (Figure
24).
No less striking than the relatively low levels of resource for post-16 biology is the relatively large
proportion of respondents reporting that items are available but not used, or unavailable but not
needed. For example, nearly 17% of respondents reported having, but not using, gram stains, and
more than 13% that they neither had nor needed it, even though this is one of the basic procedures
for bacteriological analysis. More than 18% of respondents reported that they neither have nor
need haemocytometers, and a further 11.4% that they have these but do not use them; and nearly
20% of schools either do not use, or feel they do not need, spirometers (Figure 24). This would
seem to suggest that, at least in a substantial minority of schools, practical work in post-16 biology
may be much less varied and extensive than SCORE considers appropriate.
The overall picture, then, is that biology appears to be the ‘poor relation’ among the three sciences,
with equipment and consumables levels being lower than in physics and chemistry for both pre and
post-16 levels.
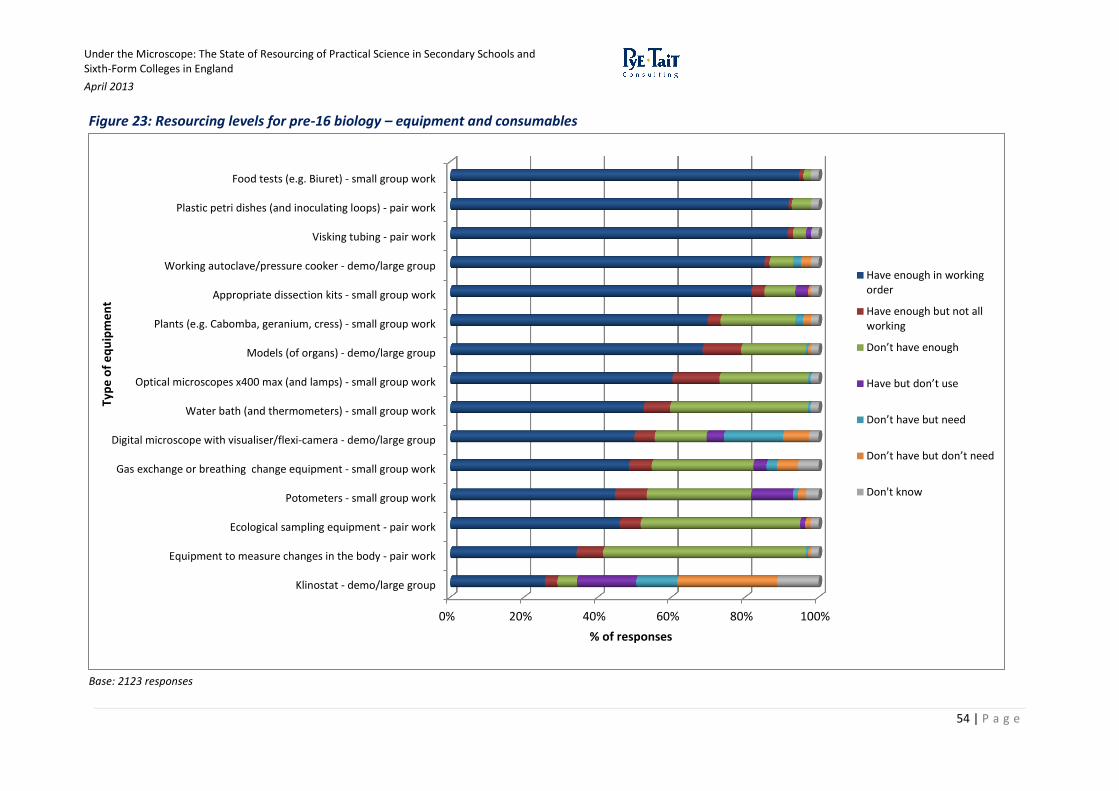
Under the Microscope: The State of Resourcing of Practical Science in Secondary Schools and Sixth-Form Colleges in England
April 2013
54 | P a g e
Figure 23: Resourcing levels for pre-16 biology – equipment and consumables
Base: 2123 responses
0% 20% 40% 60% 80% 100%
Klinostat - demo/large group
Equipment to measure changes in the body - pair work
Ecological sampling equipment - pair work
Potometers - small group work
Gas exchange or breathing change equipment - small group work
Digital microscope with visualiser/flexi-camera - demo/large group
Water bath (and thermometers) - small group work
Optical microscopes x400 max (and lamps) - small group work
Models (of organs) - demo/large group
Plants (e.g. Cabomba, geranium, cress) - small group work
Appropriate dissection kits - small group work
Working autoclave/pressure cooker - demo/large group
Visking tubing - pair work
Plastic petri dishes (and inoculating loops) - pair work
Food tests (e.g. Biuret) - small group work
% of responses
Typ
e o
f e
qu
ipm
en
t
Have enough in workingorder
Have enough but not allworking
Don’t have enough
Have but don’t use
Don’t have but need
Don’t have but don’t need
Don't know

Under the Microscope: The State of Resourcing of Practical Science in Secondary Schools and Sixth-Form Colleges in England
April 2013
55 | P a g e
Figure 24: Equipment resourcing levels for post-16 biology – equipment and consumables
Base: 1174 responses
0% 10% 20% 30% 40% 50% 60% 70% 80% 90% 100%
Genetic engineering kits - small group work
Top pan balance +/- 0.001g - pair work
Haemocytometer - demo/large group
Gel electrophoresis equipment and centrifuge - demo/large group
Eye piece graticular - pair work
Digital microscope with visualiser/flexi-camera/stage micrometers- demo/large group
Spirometer - demo/large group
Gram Stains - demo/large group
Colorimeter - small group work
Ninhydrin - demo/large group
Example slides - pair work
% of responses
Typ
e o
f e
qu
ipm
en
t
Have enough in working order
Have enough but not all working
Don’t have enough
Have but don’t use
Don’t have but need
Don’t have but don’t need
Don't know
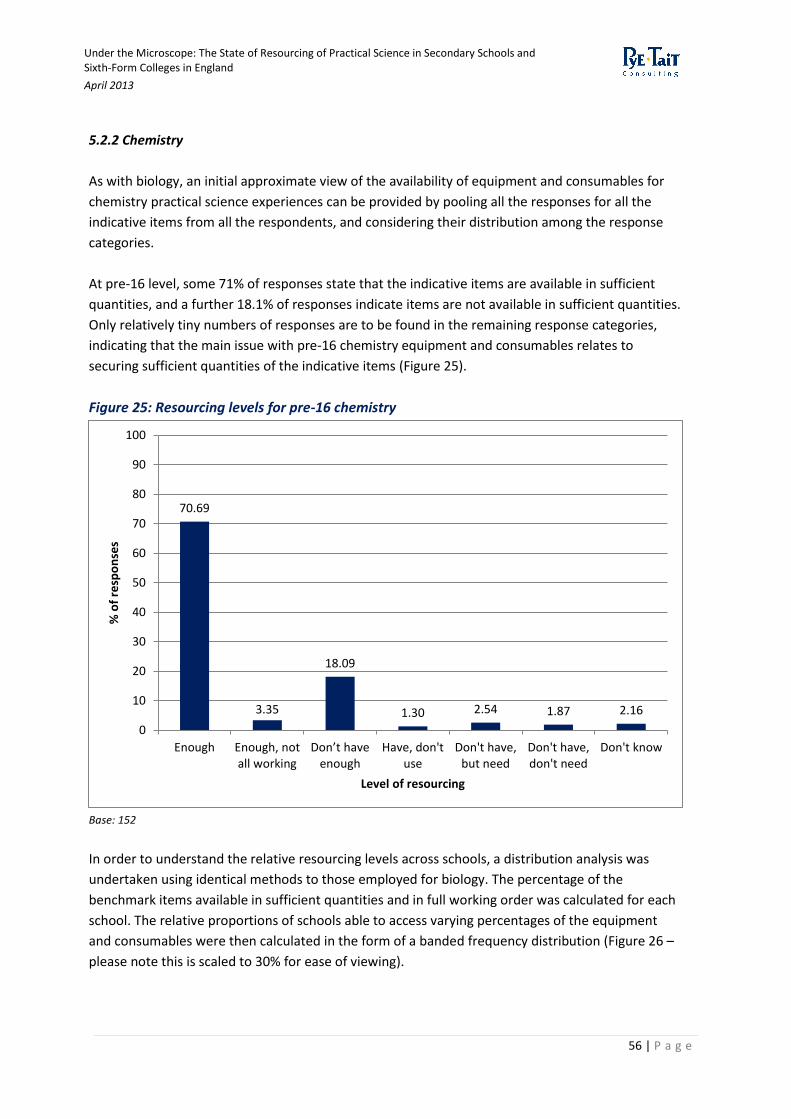
Under the Microscope: The State of Resourcing of Practical Science in Secondary Schools and Sixth-Form Colleges in England
April 2013
56 | P a g e
5.2.2 Chemistry
As with biology, an initial approximate view of the availability of equipment and consumables for
chemistry practical science experiences can be provided by pooling all the responses for all the
indicative items from all the respondents, and considering their distribution among the response
categories.
At pre-16 level, some 71% of responses state that the indicative items are available in sufficient
quantities, and a further 18.1% of responses indicate items are not available in sufficient quantities.
Only relatively tiny numbers of responses are to be found in the remaining response categories,
indicating that the main issue with pre-16 chemistry equipment and consumables relates to
securing sufficient quantities of the indicative items (Figure 25).
Figure 25: Resourcing levels for pre-16 chemistry
Base: 152
In order to understand the relative resourcing levels across schools, a distribution analysis was
undertaken using identical methods to those employed for biology. The percentage of the
benchmark items available in sufficient quantities and in full working order was calculated for each
school. The relative proportions of schools able to access varying percentages of the equipment
and consumables were then calculated in the form of a banded frequency distribution (Figure 26 –
please note this is scaled to 30% for ease of viewing).
70.69
3.35
18.09
1.30 2.54 1.87 2.16
0
10
20
30
40
50
60
70
80
90
100
Enough Enough, notall working
Don’t have enough
Have, don'tuse
Don't have,but need
Don't have,don't need
Don't know
% o
f re
spo
nse
s
Level of resourcing
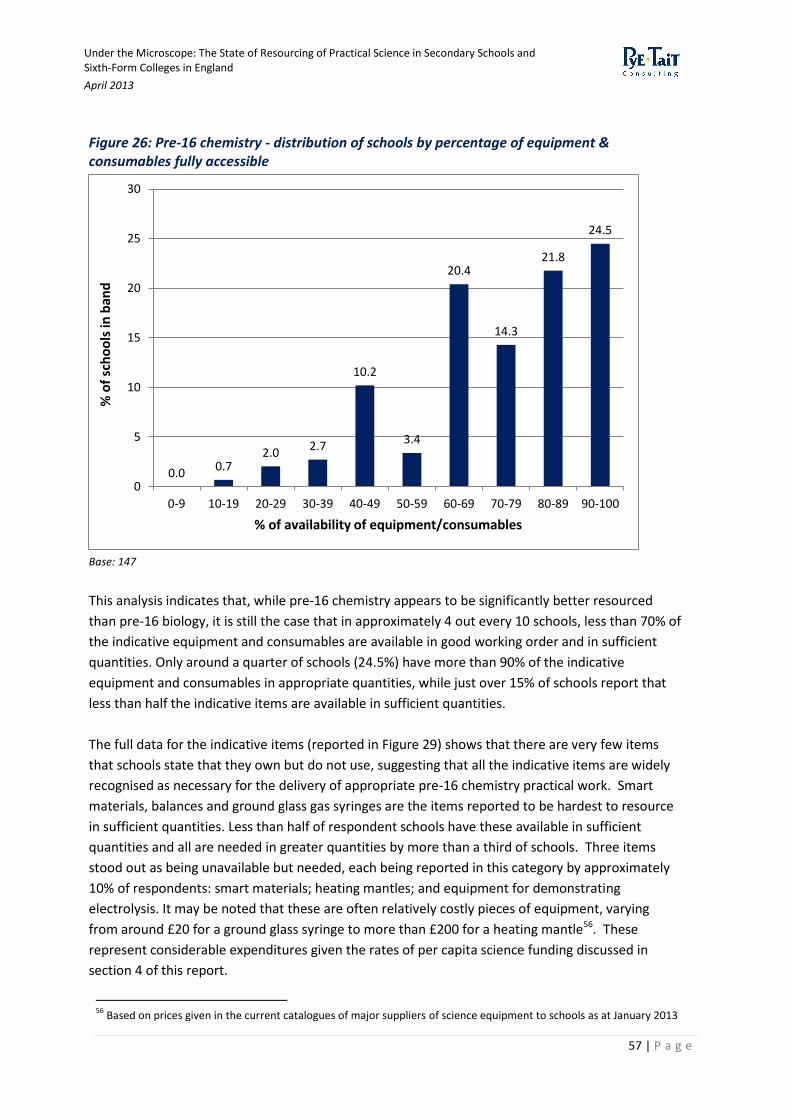
Under the Microscope: The State of Resourcing of Practical Science in Secondary Schools and Sixth-Form Colleges in England
April 2013
57 | P a g e
Figure 26: Pre-16 chemistry - distribution of schools by percentage of equipment & consumables fully accessible
Base: 147
This analysis indicates that, while pre-16 chemistry appears to be significantly better resourced
than pre-16 biology, it is still the case that in approximately 4 out every 10 schools, less than 70% of
the indicative equipment and consumables are available in good working order and in sufficient
quantities. Only around a quarter of schools (24.5%) have more than 90% of the indicative
equipment and consumables in appropriate quantities, while just over 15% of schools report that
less than half the indicative items are available in sufficient quantities.
The full data for the indicative items (reported in Figure 29) shows that there are very few items
that schools state that they own but do not use, suggesting that all the indicative items are widely
recognised as necessary for the delivery of appropriate pre-16 chemistry practical work. Smart
materials, balances and ground glass gas syringes are the items reported to be hardest to resource
in sufficient quantities. Less than half of respondent schools have these available in sufficient
quantities and all are needed in greater quantities by more than a third of schools. Three items
stood out as being unavailable but needed, each being reported in this category by approximately
10% of respondents: smart materials; heating mantles; and equipment for demonstrating
electrolysis. It may be noted that these are often relatively costly pieces of equipment, varying
from around £20 for a ground glass syringe to more than £200 for a heating mantle56. These
represent considerable expenditures given the rates of per capita science funding discussed in
section 4 of this report.
56
Based on prices given in the current catalogues of major suppliers of science equipment to schools as at January 2013
0.0 0.7
2.0 2.7
10.2
3.4
20.4
14.3
21.8
24.5
0
5
10
15
20
25
30
0-9 10-19 20-29 30-39 40-49 50-59 60-69 70-79 80-89 90-100
% o
f sc
ho
ols
in b
and
% of availability of equipment/consumables
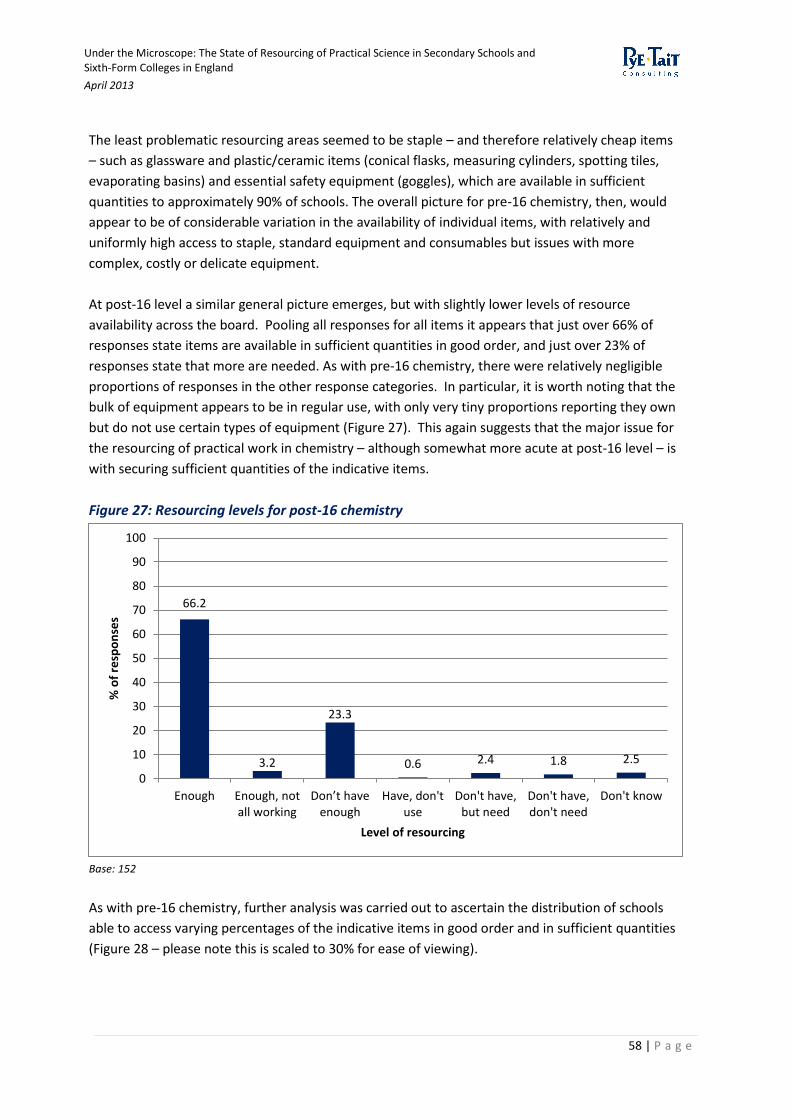
Under the Microscope: The State of Resourcing of Practical Science in Secondary Schools and Sixth-Form Colleges in England
April 2013
58 | P a g e
The least problematic resourcing areas seemed to be staple – and therefore relatively cheap items
– such as glassware and plastic/ceramic items (conical flasks, measuring cylinders, spotting tiles,
evaporating basins) and essential safety equipment (goggles), which are available in sufficient
quantities to approximately 90% of schools. The overall picture for pre-16 chemistry, then, would
appear to be of considerable variation in the availability of individual items, with relatively and
uniformly high access to staple, standard equipment and consumables but issues with more
complex, costly or delicate equipment.
At post-16 level a similar general picture emerges, but with slightly lower levels of resource
availability across the board. Pooling all responses for all items it appears that just over 66% of
responses state items are available in sufficient quantities in good order, and just over 23% of
responses state that more are needed. As with pre-16 chemistry, there were relatively negligible
proportions of responses in the other response categories. In particular, it is worth noting that the
bulk of equipment appears to be in regular use, with only very tiny proportions reporting they own
but do not use certain types of equipment (Figure 27). This again suggests that the major issue for
the resourcing of practical work in chemistry – although somewhat more acute at post-16 level – is
with securing sufficient quantities of the indicative items.
Figure 27: Resourcing levels for post-16 chemistry
Base: 152
As with pre-16 chemistry, further analysis was carried out to ascertain the distribution of schools
able to access varying percentages of the indicative items in good order and in sufficient quantities
(Figure 28 – please note this is scaled to 30% for ease of viewing).
66.2
3.2
23.3
0.6 2.4 1.8 2.5
0
10
20
30
40
50
60
70
80
90
100
Enough Enough, notall working
Don’t have enough
Have, don'tuse
Don't have,but need
Don't have,don't need
Don't know
% o
f re
spo
nse
s
Level of resourcing
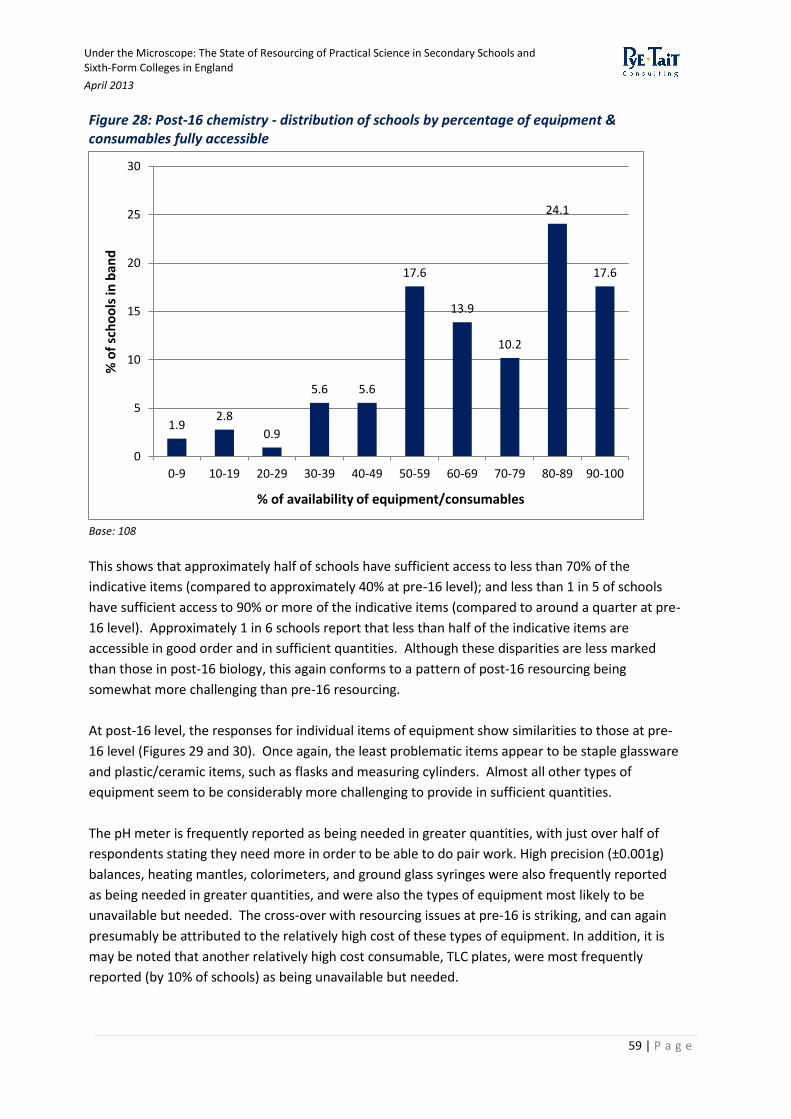
Under the Microscope: The State of Resourcing of Practical Science in Secondary Schools and Sixth-Form Colleges in England
April 2013
59 | P a g e
Figure 28: Post-16 chemistry - distribution of schools by percentage of equipment & consumables fully accessible
Base: 108
This shows that approximately half of schools have sufficient access to less than 70% of the
indicative items (compared to approximately 40% at pre-16 level); and less than 1 in 5 of schools
have sufficient access to 90% or more of the indicative items (compared to around a quarter at pre-
16 level). Approximately 1 in 6 schools report that less than half of the indicative items are
accessible in good order and in sufficient quantities. Although these disparities are less marked
than those in post-16 biology, this again conforms to a pattern of post-16 resourcing being
somewhat more challenging than pre-16 resourcing.
At post-16 level, the responses for individual items of equipment show similarities to those at pre-
16 level (Figures 29 and 30). Once again, the least problematic items appear to be staple glassware
and plastic/ceramic items, such as flasks and measuring cylinders. Almost all other types of
equipment seem to be considerably more challenging to provide in sufficient quantities.
The pH meter is frequently reported as being needed in greater quantities, with just over half of
respondents stating they need more in order to be able to do pair work. High precision (±0.001g)
balances, heating mantles, colorimeters, and ground glass syringes were also frequently reported
as being needed in greater quantities, and were also the types of equipment most likely to be
unavailable but needed. The cross-over with resourcing issues at pre-16 is striking, and can again
presumably be attributed to the relatively high cost of these types of equipment. In addition, it is
may be noted that another relatively high cost consumable, TLC plates, were most frequently
reported (by 10% of schools) as being unavailable but needed.
1.9 2.8
0.9
5.6 5.6
17.6
13.9
10.2
24.1
17.6
0
5
10
15
20
25
30
0-9 10-19 20-29 30-39 40-49 50-59 60-69 70-79 80-89 90-100
% o
f sc
ho
ols
in b
and
% of availability of equipment/consumables
Under the Microscope: The State of Resourcing of Practical Science in Secondary Schools and Sixth-Form Colleges in England
April 2013
60 | P a g e
In general, then, the resourcing of practical experiences in chemistry appears to exhibit a number
of problems. The resourcing of higher cost equipment and consumables seems to be challenging,
with substantial proportions of schools reporting that they lack sufficient quantities of many of the
indicative items. In addition, there appears to be considerable variation between schools, with
around one-sixth of schools reporting that more than half of the items are not accessible in
sufficient quantities. In contrast to the situation in post-16 biology, the responses suggest that
there is broad acceptance of the need for all the benchmark items in the suggested quantities, and
by implication acceptance that the kinds of practical work envisaged by SCORE are appropriate.
The key issue seems to be cost, as it is the higher-cost equipment and consumables that are most
frequently reported as being insufficiently available, or even, in some cases, not available at all.
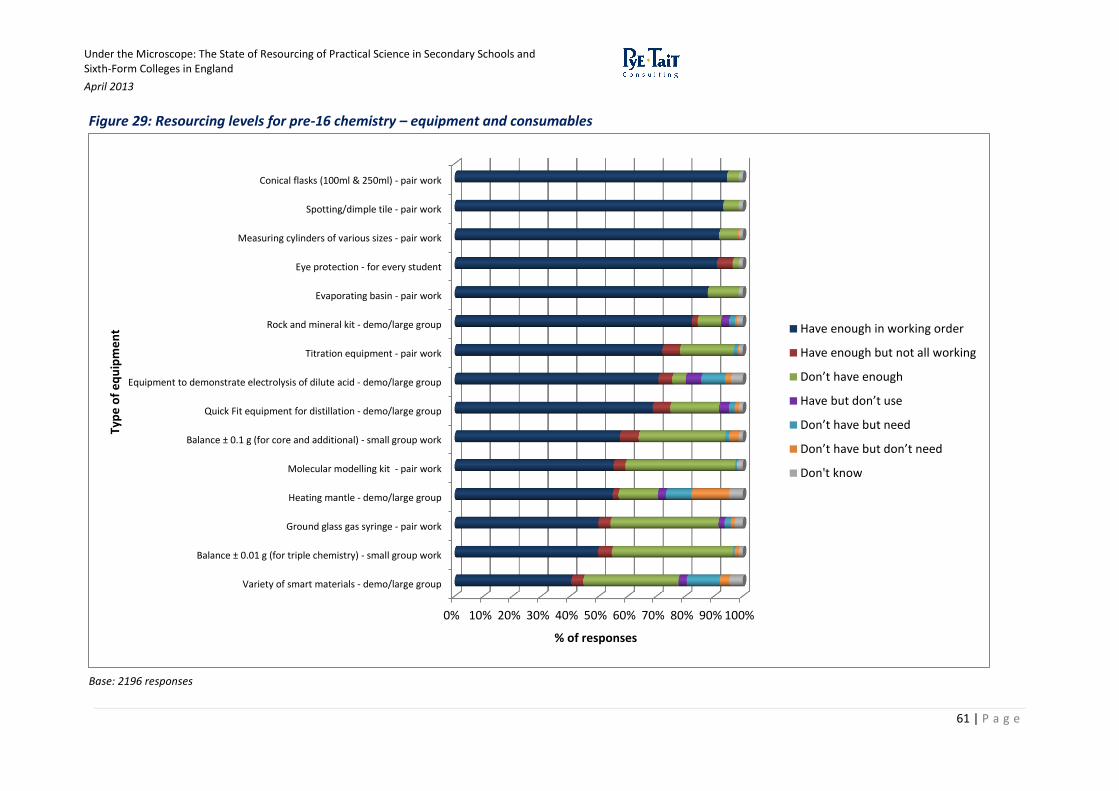
Under the Microscope: The State of Resourcing of Practical Science in Secondary Schools and Sixth-Form Colleges in England
April 2013
61 | P a g e
Figure 29: Resourcing levels for pre-16 chemistry – equipment and consumables
Base: 2196 responses
0% 10% 20% 30% 40% 50% 60% 70% 80% 90% 100%
Variety of smart materials - demo/large group
Balance ± 0.01 g (for triple chemistry) - small group work
Ground glass gas syringe - pair work
Heating mantle - demo/large group
Molecular modelling kit - pair work
Balance ± 0.1 g (for core and additional) - small group work
Quick Fit equipment for distillation - demo/large group
Equipment to demonstrate electrolysis of dilute acid - demo/large group
Titration equipment - pair work
Rock and mineral kit - demo/large group
Evaporating basin - pair work
Eye protection - for every student
Measuring cylinders of various sizes - pair work
Spotting/dimple tile - pair work
Conical flasks (100ml & 250ml) - pair work
% of responses
Typ
e o
f e
qu
ipm
en
t Have enough in working order
Have enough but not all working
Don’t have enough
Have but don’t use
Don’t have but need
Don’t have but don’t need
Don't know
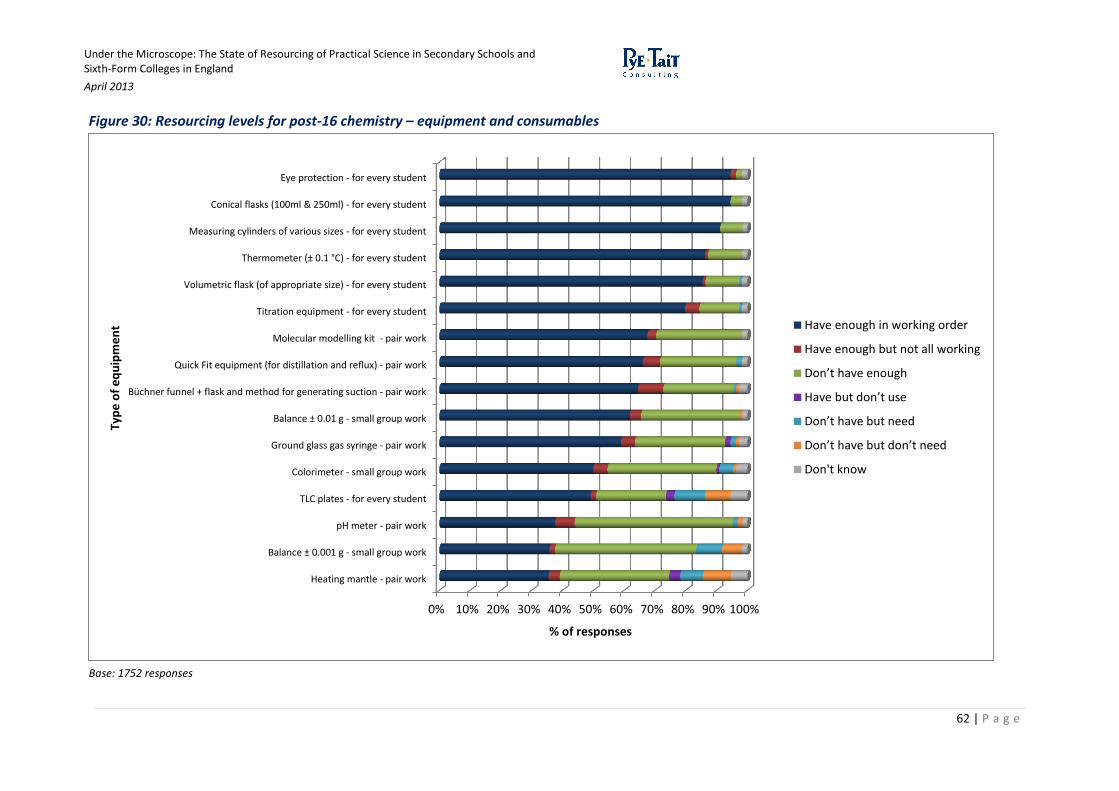
Under the Microscope: The State of Resourcing of Practical Science in Secondary Schools and Sixth-Form Colleges in England
April 2013
62 | P a g e
Figure 30: Resourcing levels for post-16 chemistry – equipment and consumables
Base: 1752 responses
0% 10% 20% 30% 40% 50% 60% 70% 80% 90% 100%
Heating mantle - pair work
Balance ± 0.001 g - small group work
pH meter - pair work
TLC plates - for every student
Colorimeter - small group work
Ground glass gas syringe - pair work
Balance ± 0.01 g - small group work
Büchner funnel + flask and method for generating suction - pair work
Quick Fit equipment (for distillation and reflux) - pair work
Molecular modelling kit - pair work
Titration equipment - for every student
Volumetric flask (of appropriate size) - for every student
Thermometer (± 0.1 °C) - for every student
Measuring cylinders of various sizes - for every student
Conical flasks (100ml & 250ml) - for every student
Eye protection - for every student
% of responses
Typ
e o
f e
qu
ipm
en
t Have enough in working order
Have enough but not all working
Don’t have enough
Have but don’t use
Don’t have but need
Don’t have but don’t need
Don't know

Under the Microscope: The State of Resourcing of Practical Science in Secondary Schools and Sixth-Form Colleges in England
April 2013
63 | P a g e
5.2.3 Physics
An initial overview of the availability of equipment and consumables for physics practical science
experiences can be given by pooling all the responses for all the indicative items from all the
respondents, and considering their distribution among the response categories.
At pre-16 level, some 72% of responses state that the indicative items are available in sufficient
quantities, and a further 15.6% of responses relate to items that are not available in sufficient
quantities. As with chemistry, only relatively tiny numbers of responses are to be found in the
remaining response categories, suggesting the main issue with pre-16 physics equipment and
consumables relates to securing sufficient quantities of the indicative items (Figure 31). These
figures further suggest that physics is, on average, the best resourced of the three sciences at pre-
16 level: the availability of resources slightly exceeds that reported for chemistry and substantially
exceeds that reported for biology; and the proportion of responses stating that items are not
available in sufficient quantities is somewhat lower.
Figure 31: Resourcing levels for pre-16 physics
Base: 152
71.99
4.18
15.06
0.94 2.79 1.39
3.65
0
10
20
30
40
50
60
70
80
90
100
Enough Enough, notall working
Don’t have enough
Have, don'tuse
Don't have,but need
Don't have,don't need
Don't know
% o
f re
spo
nse
s
Level of resourcing
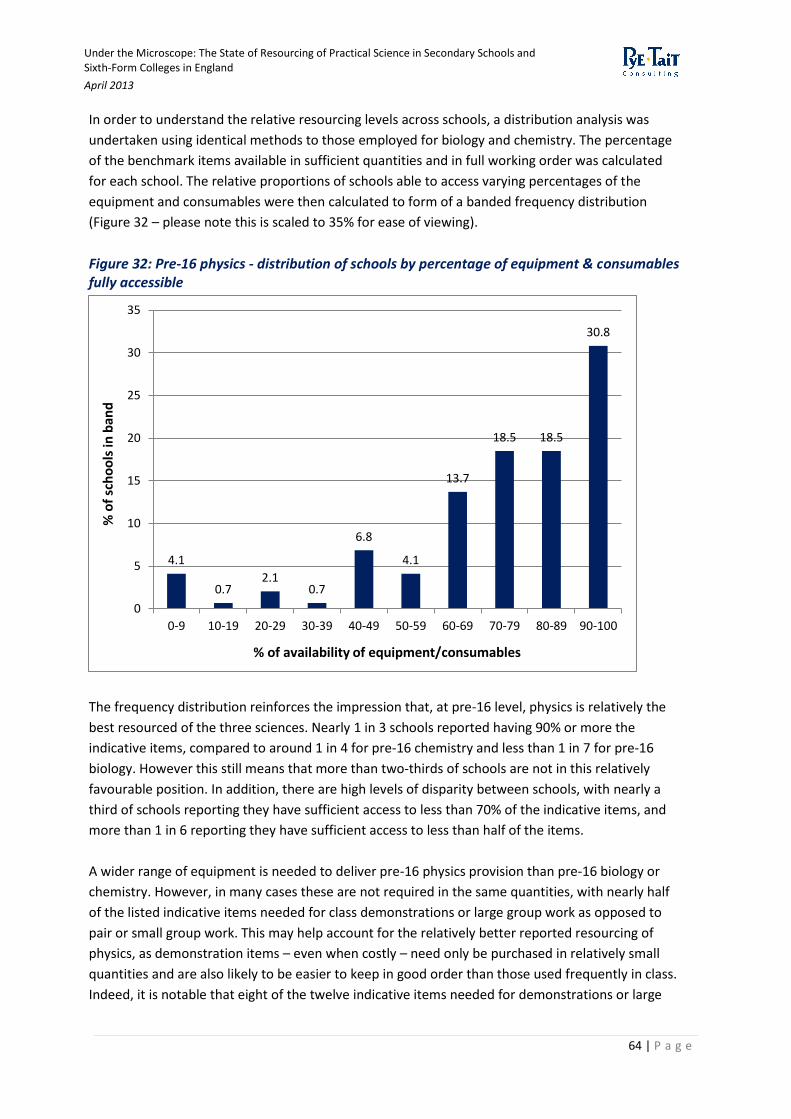
Under the Microscope: The State of Resourcing of Practical Science in Secondary Schools and Sixth-Form Colleges in England
April 2013
64 | P a g e
In order to understand the relative resourcing levels across schools, a distribution analysis was
undertaken using identical methods to those employed for biology and chemistry. The percentage
of the benchmark items available in sufficient quantities and in full working order was calculated
for each school. The relative proportions of schools able to access varying percentages of the
equipment and consumables were then calculated to form of a banded frequency distribution
(Figure 32 – please note this is scaled to 35% for ease of viewing).
Figure 32: Pre-16 physics - distribution of schools by percentage of equipment & consumables fully accessible
The frequency distribution reinforces the impression that, at pre-16 level, physics is relatively the
best resourced of the three sciences. Nearly 1 in 3 schools reported having 90% or more the
indicative items, compared to around 1 in 4 for pre-16 chemistry and less than 1 in 7 for pre-16
biology. However this still means that more than two-thirds of schools are not in this relatively
favourable position. In addition, there are high levels of disparity between schools, with nearly a
third of schools reporting they have sufficient access to less than 70% of the indicative items, and
more than 1 in 6 reporting they have sufficient access to less than half of the items.
A wider range of equipment is needed to deliver pre-16 physics provision than pre-16 biology or
chemistry. However, in many cases these are not required in the same quantities, with nearly half
of the listed indicative items needed for class demonstrations or large group work as opposed to
pair or small group work. This may help account for the relatively better reported resourcing of
physics, as demonstration items – even when costly – need only be purchased in relatively small
quantities and are also likely to be easier to keep in good order than those used frequently in class.
Indeed, it is notable that eight of the twelve indicative items needed for demonstrations or large
4.1
0.7 2.1
0.7
6.8
4.1
13.7
18.5 18.5
30.8
0
5
10
15
20
25
30
35
0-9 10-19 20-29 30-39 40-49 50-59 60-69 70-79 80-89 90-100
% o
f sc
ho
ols
in b
and
% of availability of equipment/consumables
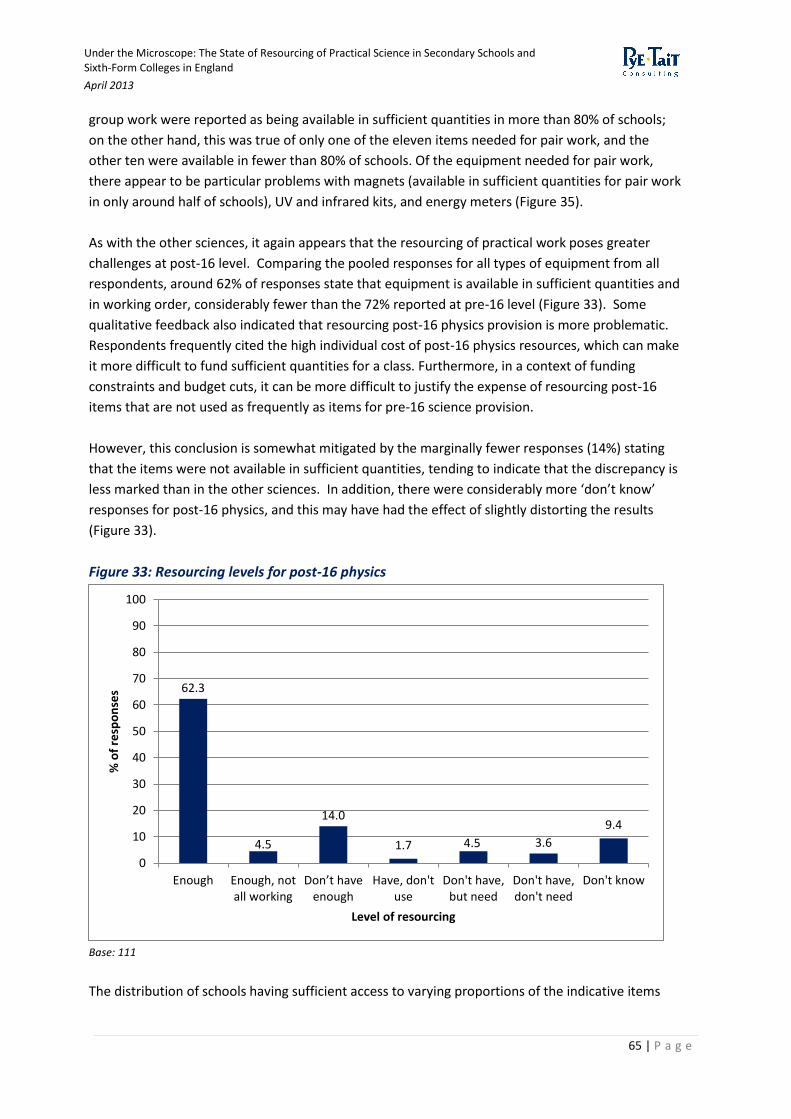
Under the Microscope: The State of Resourcing of Practical Science in Secondary Schools and Sixth-Form Colleges in England
April 2013
65 | P a g e
group work were reported as being available in sufficient quantities in more than 80% of schools;
on the other hand, this was true of only one of the eleven items needed for pair work, and the
other ten were available in fewer than 80% of schools. Of the equipment needed for pair work,
there appear to be particular problems with magnets (available in sufficient quantities for pair work
in only around half of schools), UV and infrared kits, and energy meters (Figure 35).
As with the other sciences, it again appears that the resourcing of practical work poses greater
challenges at post-16 level. Comparing the pooled responses for all types of equipment from all
respondents, around 62% of responses state that equipment is available in sufficient quantities and
in working order, considerably fewer than the 72% reported at pre-16 level (Figure 33). Some
qualitative feedback also indicated that resourcing post-16 physics provision is more problematic.
Respondents frequently cited the high individual cost of post-16 physics resources, which can make
it more difficult to fund sufficient quantities for a class. Furthermore, in a context of funding
constraints and budget cuts, it can be more difficult to justify the expense of resourcing post-16
items that are not used as frequently as items for pre-16 science provision.
However, this conclusion is somewhat mitigated by the marginally fewer responses (14%) stating
that the items were not available in sufficient quantities, tending to indicate that the discrepancy is
less marked than in the other sciences. In addition, there were considerably more ‘don’t know’
responses for post-16 physics, and this may have had the effect of slightly distorting the results
(Figure 33).
Figure 33: Resourcing levels for post-16 physics
Base: 111
The distribution of schools having sufficient access to varying proportions of the indicative items
62.3
4.5
14.0
1.7 4.5 3.6
9.4
0
10
20
30
40
50
60
70
80
90
100
Enough Enough, notall working
Don’t have enough
Have, don'tuse
Don't have,but need
Don't have,don't need
Don't know
% o
f re
spo
nse
s
Level of resourcing
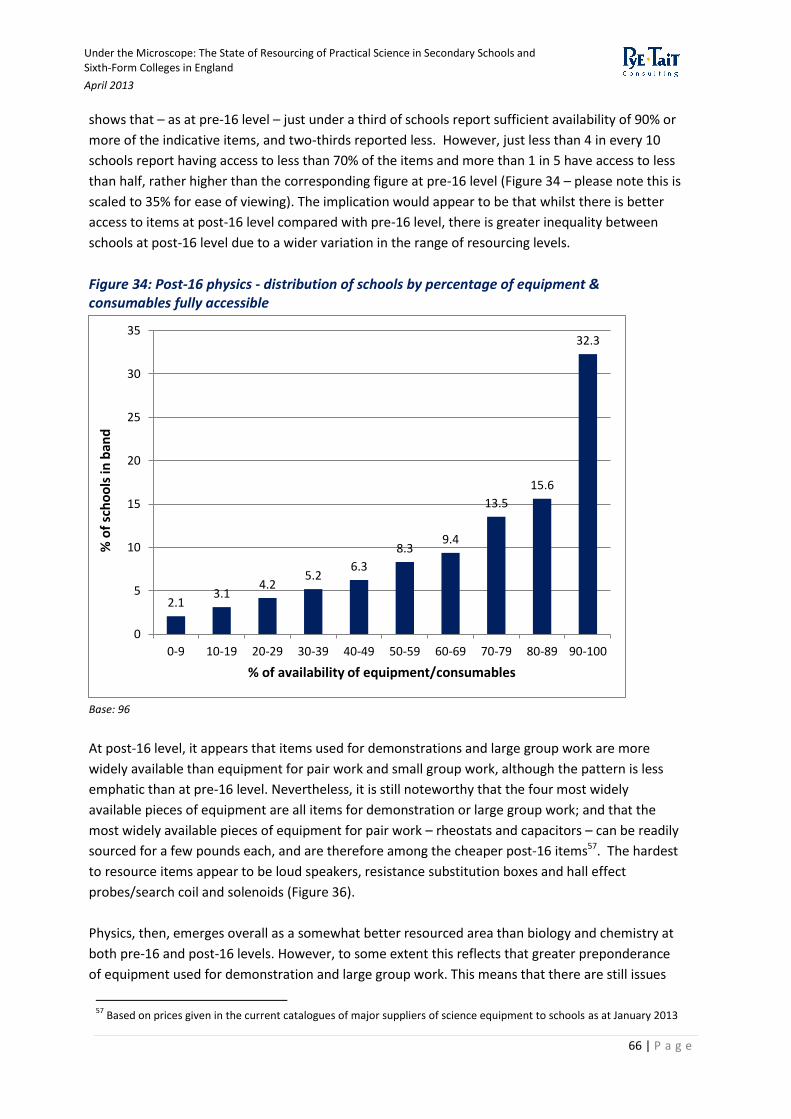
Under the Microscope: The State of Resourcing of Practical Science in Secondary Schools and Sixth-Form Colleges in England
April 2013
66 | P a g e
shows that – as at pre-16 level – just under a third of schools report sufficient availability of 90% or
more of the indicative items, and two-thirds reported less. However, just less than 4 in every 10
schools report having access to less than 70% of the items and more than 1 in 5 have access to less
than half, rather higher than the corresponding figure at pre-16 level (Figure 34 – please note this is
scaled to 35% for ease of viewing). The implication would appear to be that whilst there is better
access to items at post-16 level compared with pre-16 level, there is greater inequality between
schools at post-16 level due to a wider variation in the range of resourcing levels.
Figure 34: Post-16 physics - distribution of schools by percentage of equipment & consumables fully accessible
Base: 96
At post-16 level, it appears that items used for demonstrations and large group work are more
widely available than equipment for pair work and small group work, although the pattern is less
emphatic than at pre-16 level. Nevertheless, it is still noteworthy that the four most widely
available pieces of equipment are all items for demonstration or large group work; and that the
most widely available pieces of equipment for pair work – rheostats and capacitors – can be readily
sourced for a few pounds each, and are therefore among the cheaper post-16 items57. The hardest
to resource items appear to be loud speakers, resistance substitution boxes and hall effect
probes/search coil and solenoids (Figure 36).
Physics, then, emerges overall as a somewhat better resourced area than biology and chemistry at
both pre-16 and post-16 levels. However, to some extent this reflects that greater preponderance
of equipment used for demonstration and large group work. This means that there are still issues
57
Based on prices given in the current catalogues of major suppliers of science equipment to schools as at January 2013
2.1 3.1
4.2 5.2
6.3
8.3 9.4
13.5
15.6
32.3
0
5
10
15
20
25
30
35
0-9 10-19 20-29 30-39 40-49 50-59 60-69 70-79 80-89 90-100
% o
f sc
ho
ols
in b
and
% of availability of equipment/consumables

Under the Microscope: The State of Resourcing of Practical Science in Secondary Schools and Sixth-Form Colleges in England
April 2013
67 | P a g e
with supplying equipment in sufficient quantities to enable work in pairs and small groups.
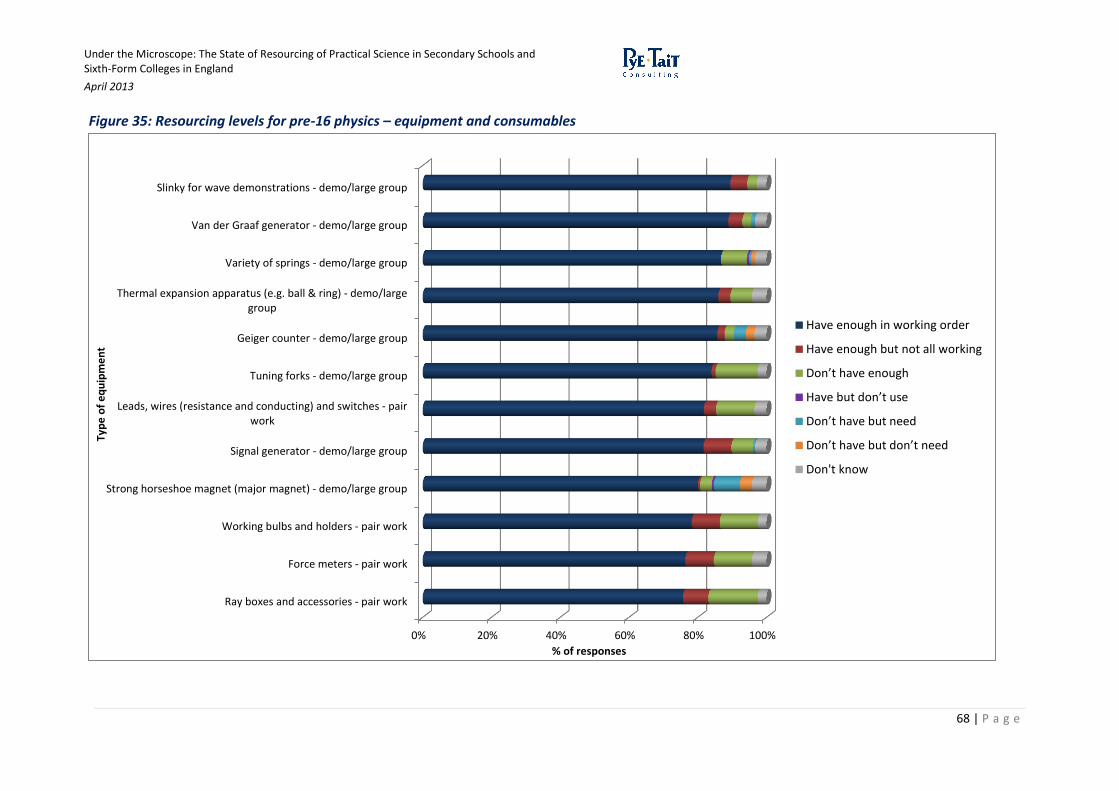
Under the Microscope: The State of Resourcing of Practical Science in Secondary Schools and Sixth-Form Colleges in England
April 2013
68 | P a g e
Figure 35: Resourcing levels for pre-16 physics – equipment and consumables
0% 20% 40% 60% 80% 100%
Ray boxes and accessories - pair work
Force meters - pair work
Working bulbs and holders - pair work
Strong horseshoe magnet (major magnet) - demo/large group
Signal generator - demo/large group
Leads, wires (resistance and conducting) and switches - pairwork
Tuning forks - demo/large group
Geiger counter - demo/large group
Thermal expansion apparatus (e.g. ball & ring) - demo/largegroup
Variety of springs - demo/large group
Van der Graaf generator - demo/large group
Slinky for wave demonstrations - demo/large group
% of responses
Typ
e o
f e
qu
ipm
en
t
Have enough in working order
Have enough but not all working
Don’t have enough
Have but don’t use
Don’t have but need
Don’t have but don’t need
Don't know
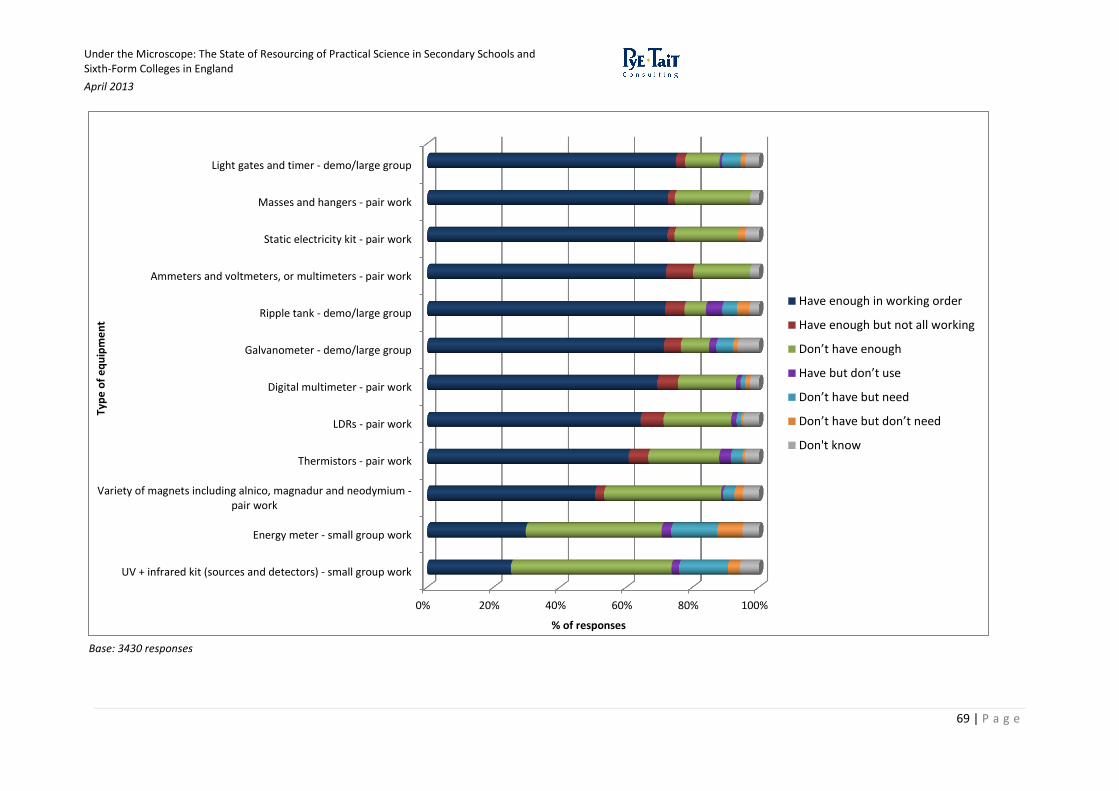
Under the Microscope: The State of Resourcing of Practical Science in Secondary Schools and Sixth-Form Colleges in England
April 2013
69 | P a g e
Base: 3430 responses
0% 20% 40% 60% 80% 100%
UV + infrared kit (sources and detectors) - small group work
Energy meter - small group work
Variety of magnets including alnico, magnadur and neodymium -pair work
Thermistors - pair work
LDRs - pair work
Digital multimeter - pair work
Galvanometer - demo/large group
Ripple tank - demo/large group
Ammeters and voltmeters, or multimeters - pair work
Static electricity kit - pair work
Masses and hangers - pair work
Light gates and timer - demo/large group
% of responses
Typ
e o
f e
qu
ipm
en
t
Have enough in working order
Have enough but not all working
Don’t have enough
Have but don’t use
Don’t have but need
Don’t have but don’t need
Don't know
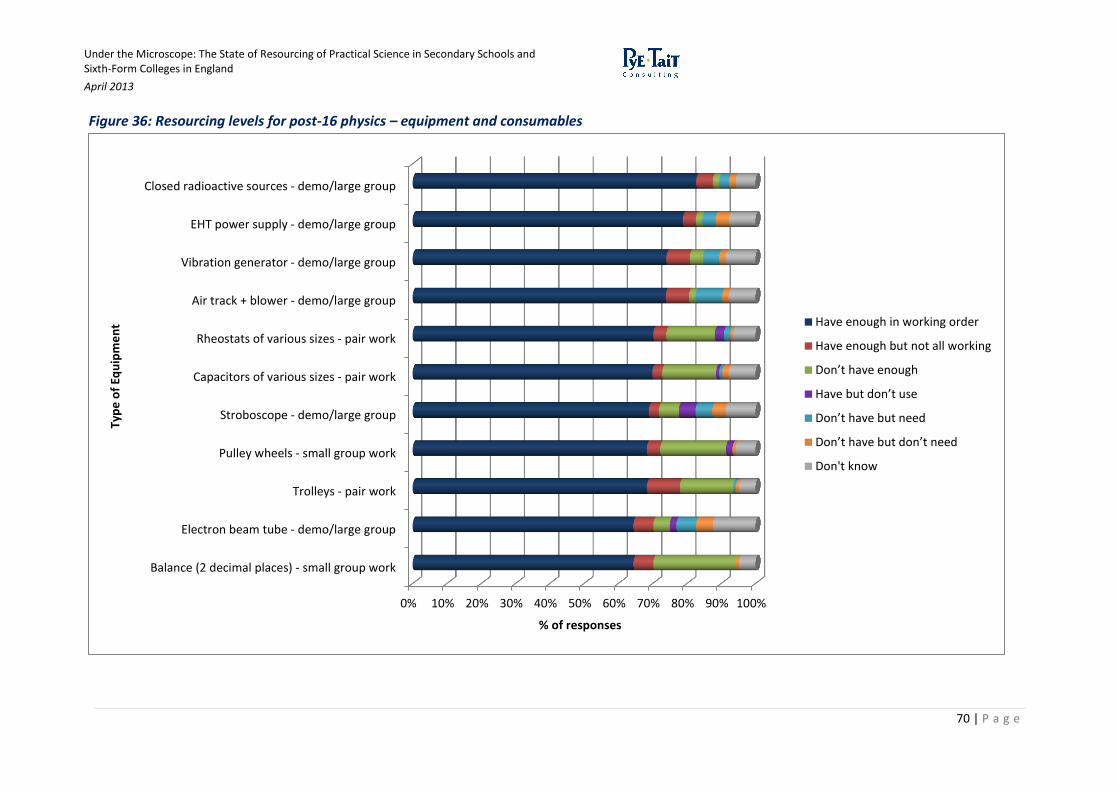
Under the Microscope: The State of Resourcing of Practical Science in Secondary Schools and Sixth-Form Colleges in England
April 2013
70 | P a g e
Figure 36: Resourcing levels for post-16 physics – equipment and consumables
0% 10% 20% 30% 40% 50% 60% 70% 80% 90% 100%
Balance (2 decimal places) - small group work
Electron beam tube - demo/large group
Trolleys - pair work
Pulley wheels - small group work
Stroboscope - demo/large group
Capacitors of various sizes - pair work
Rheostats of various sizes - pair work
Air track + blower - demo/large group
Vibration generator - demo/large group
EHT power supply - demo/large group
Closed radioactive sources - demo/large group
% of responses
Typ
e o
f Eq
uip
me
nt
Have enough in working order
Have enough but not all working
Don’t have enough
Have but don’t use
Don’t have but need
Don’t have but don’t need
Don't know
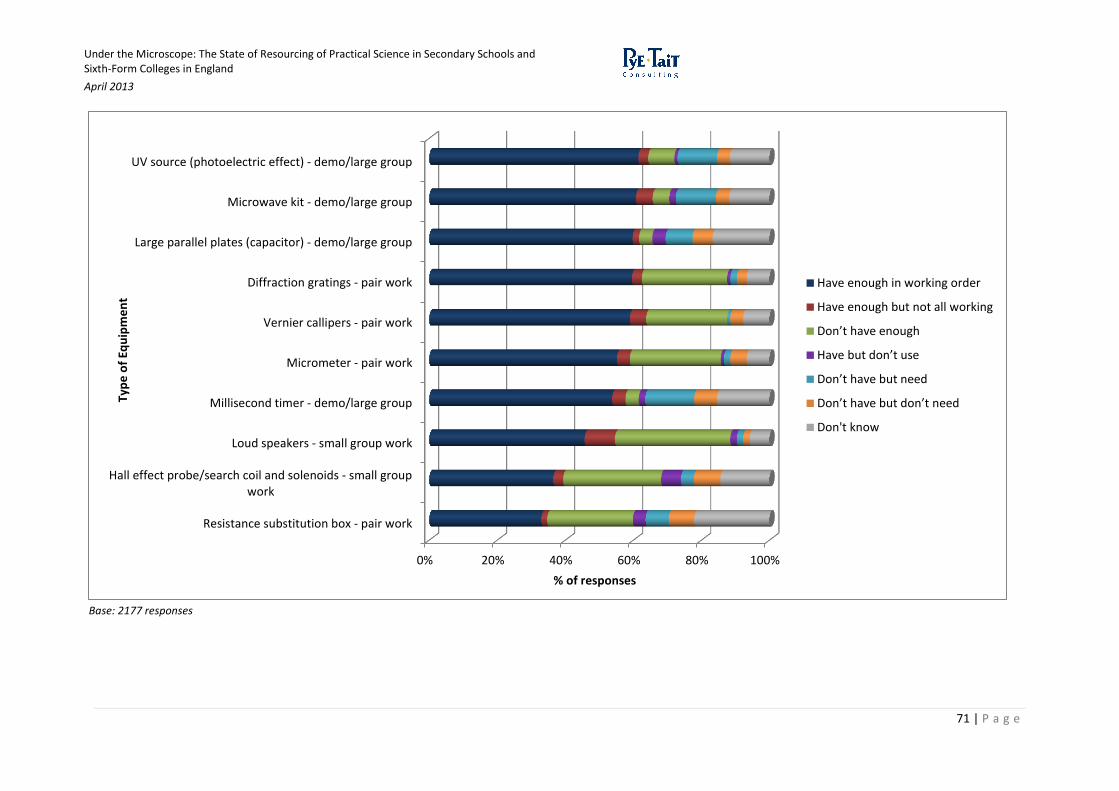
Under the Microscope: The State of Resourcing of Practical Science in Secondary Schools and Sixth-Form Colleges in England
April 2013
71 | P a g e
Base: 2177 responses
0% 20% 40% 60% 80% 100%
Resistance substitution box - pair work
Hall effect probe/search coil and solenoids - small groupwork
Loud speakers - small group work
Millisecond timer - demo/large group
Micrometer - pair work
Vernier callipers - pair work
Diffraction gratings - pair work
Large parallel plates (capacitor) - demo/large group
Microwave kit - demo/large group
UV source (photoelectric effect) - demo/large group
% of responses
Typ
e o
f Eq
uip
me
nt
Have enough in working order
Have enough but not all working
Don’t have enough
Have but don’t use
Don’t have but need
Don’t have but don’t need
Don't know
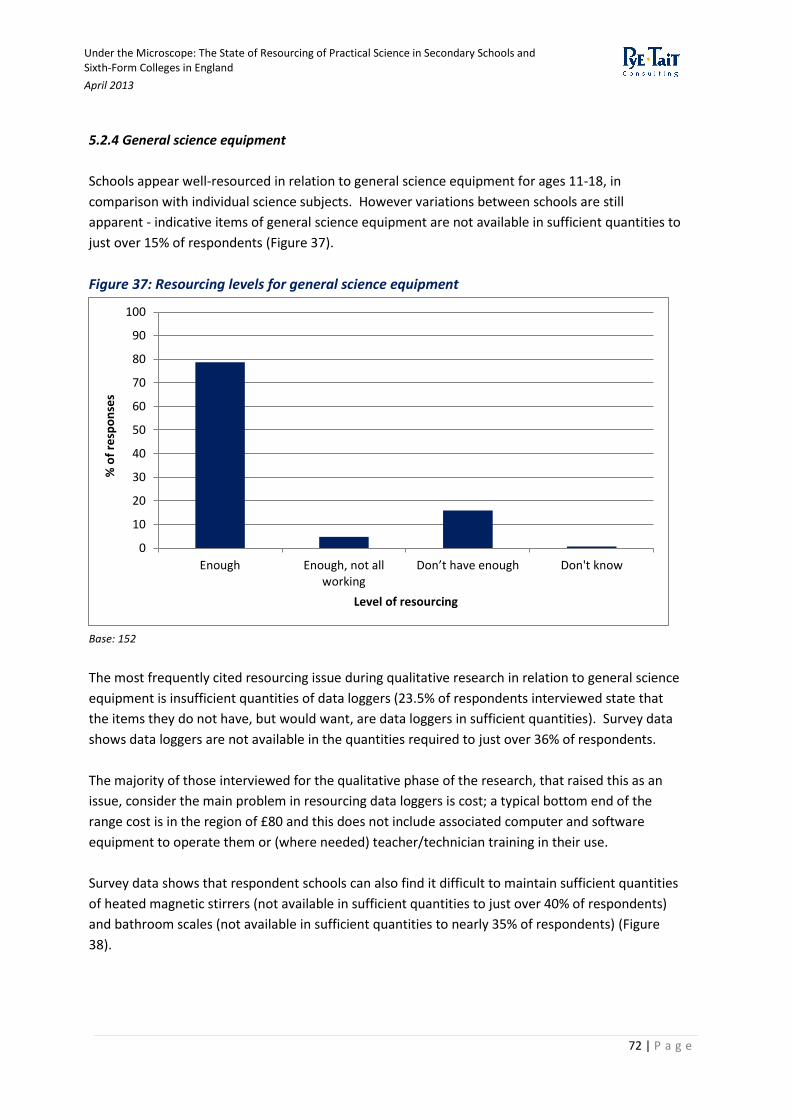
Under the Microscope: The State of Resourcing of Practical Science in Secondary Schools and Sixth-Form Colleges in England
April 2013
72 | P a g e
5.2.4 General science equipment
Schools appear well-resourced in relation to general science equipment for ages 11-18, in
comparison with individual science subjects. However variations between schools are still
apparent - indicative items of general science equipment are not available in sufficient quantities to
just over 15% of respondents (Figure 37).
Figure 37: Resourcing levels for general science equipment
Base: 152
The most frequently cited resourcing issue during qualitative research in relation to general science
equipment is insufficient quantities of data loggers (23.5% of respondents interviewed state that
the items they do not have, but would want, are data loggers in sufficient quantities). Survey data
shows data loggers are not available in the quantities required to just over 36% of respondents.
The majority of those interviewed for the qualitative phase of the research, that raised this as an
issue, consider the main problem in resourcing data loggers is cost; a typical bottom end of the
range cost is in the region of £80 and this does not include associated computer and software
equipment to operate them or (where needed) teacher/technician training in their use.
Survey data shows that respondent schools can also find it difficult to maintain sufficient quantities
of heated magnetic stirrers (not available in sufficient quantities to just over 40% of respondents)
and bathroom scales (not available in sufficient quantities to nearly 35% of respondents) (Figure
38).
0
10
20
30
40
50
60
70
80
90
100
Enough Enough, not allworking
Don’t have enough Don't know
% o
f re
spo
nse
s
Level of resourcing

Under the Microscope: The State of Resourcing of Practical Science in Secondary Schools and Sixth-Form Colleges in England
April 2013
73 | P a g e
Figure 38: Equipment resourcing levels for general science equipment (for ages 11-18)
Base: 1655 responses
0% 10% 20% 30% 40% 50% 60% 70% 80% 90% 100%
Data logger + computer with range of sensors - small group work
Bathroom scales (in Newtons) - small group work
Heated magnetic stirrers - demo/large group
LV power supply - pair work
Stop watch/stop clock - pair work
Working batteries - pair work
Spirit or mercury thermometers, range -10 °C to 110 °C - pairwork
Clamps and stands - pair work
Metre rulers - pair work
Mirrors - pair work
Crocodile clips - pair work
% of responses
Typ
e o
f e
qu
ipm
en
t Have enough in working order
Have enough but not all working
Don’t have enough
Don't know
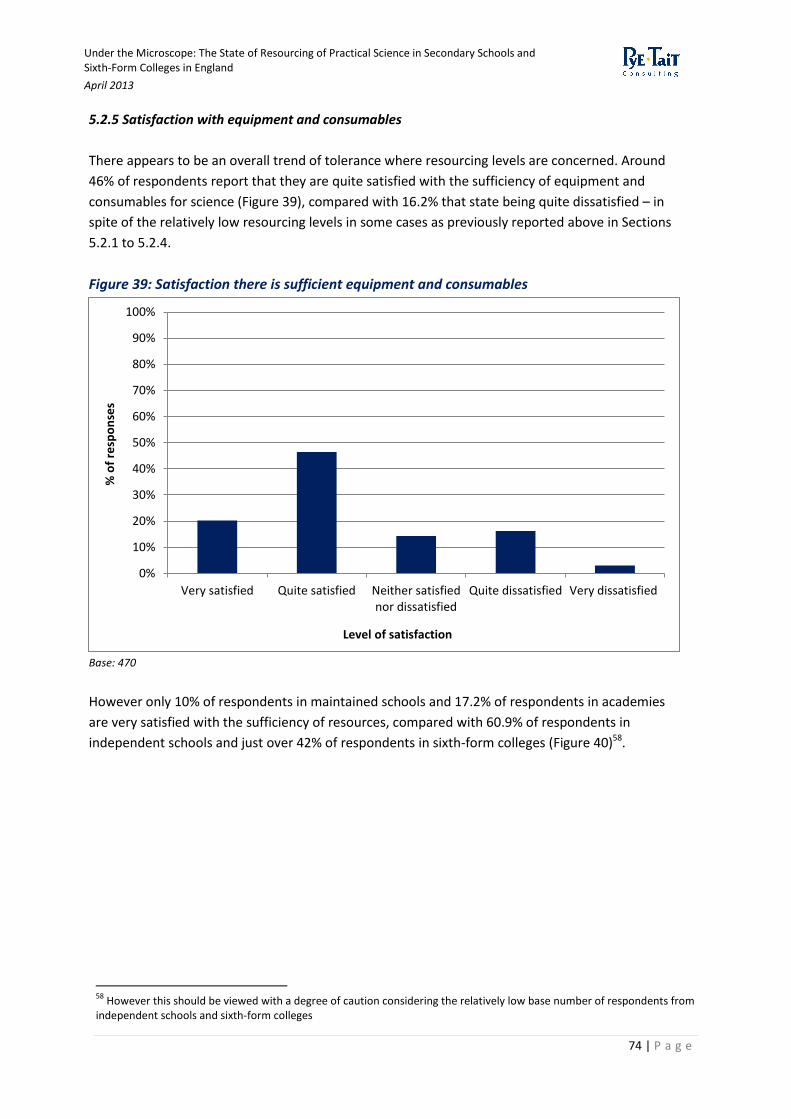
Under the Microscope: The State of Resourcing of Practical Science in Secondary Schools and Sixth-Form Colleges in England
April 2013
74 | P a g e
5.2.5 Satisfaction with equipment and consumables
There appears to be an overall trend of tolerance where resourcing levels are concerned. Around
46% of respondents report that they are quite satisfied with the sufficiency of equipment and
consumables for science (Figure 39), compared with 16.2% that state being quite dissatisfied – in
spite of the relatively low resourcing levels in some cases as previously reported above in Sections
5.2.1 to 5.2.4.
Figure 39: Satisfaction there is sufficient equipment and consumables
Base: 470
However only 10% of respondents in maintained schools and 17.2% of respondents in academies
are very satisfied with the sufficiency of resources, compared with 60.9% of respondents in
independent schools and just over 42% of respondents in sixth-form colleges (Figure 40)58.
58
However this should be viewed with a degree of caution considering the relatively low base number of respondents from independent schools and sixth-form colleges
0%
10%
20%
30%
40%
50%
60%
70%
80%
90%
100%
Very satisfied Quite satisfied Neither satisfiednor dissatisfied
Quite dissatisfied Very dissatisfied
% o
f re
spo
nse
s
Level of satisfaction
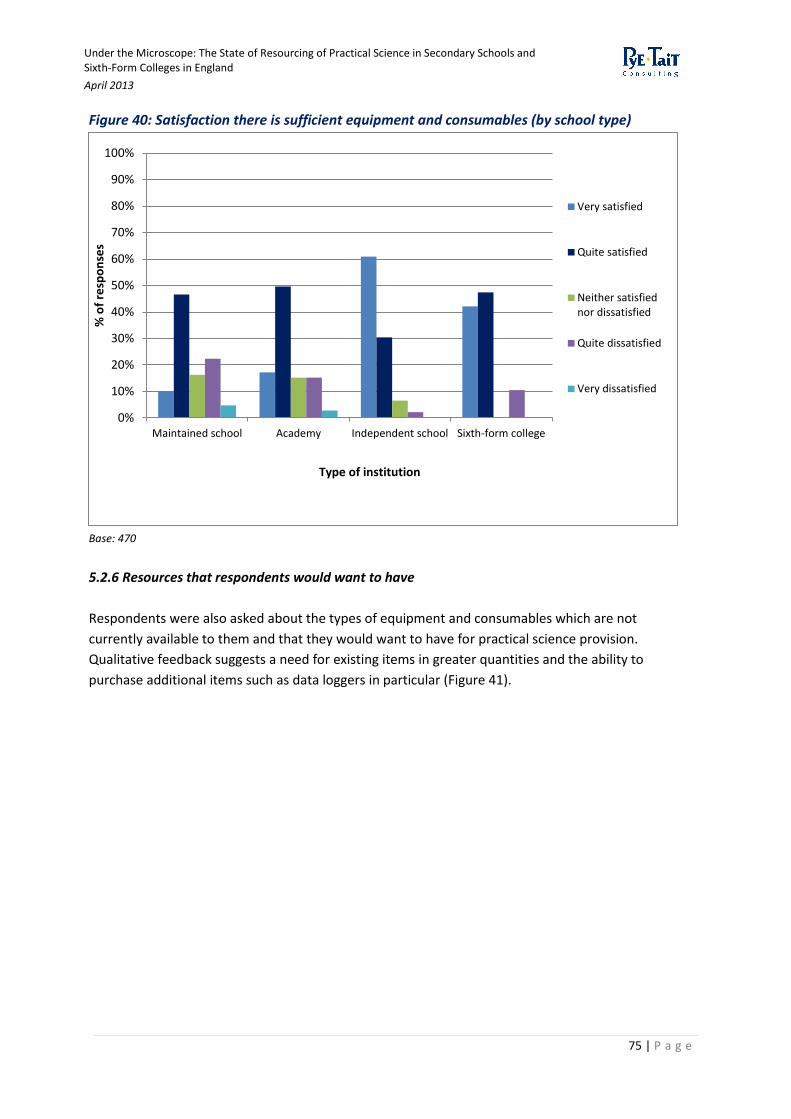
Under the Microscope: The State of Resourcing of Practical Science in Secondary Schools and Sixth-Form Colleges in England
April 2013
75 | P a g e
Figure 40: Satisfaction there is sufficient equipment and consumables (by school type)
Base: 470
5.2.6 Resources that respondents would want to have
Respondents were also asked about the types of equipment and consumables which are not
currently available to them and that they would want to have for practical science provision.
Qualitative feedback suggests a need for existing items in greater quantities and the ability to
purchase additional items such as data loggers in particular (Figure 41).
0%
10%
20%
30%
40%
50%
60%
70%
80%
90%
100%
Maintained school Academy Independent school Sixth-form college
% o
f re
spo
nse
s
Type of institution
Very satisfied
Quite satisfied
Neither satisfiednor dissatisfied
Quite dissatisfied
Very dissatisfied
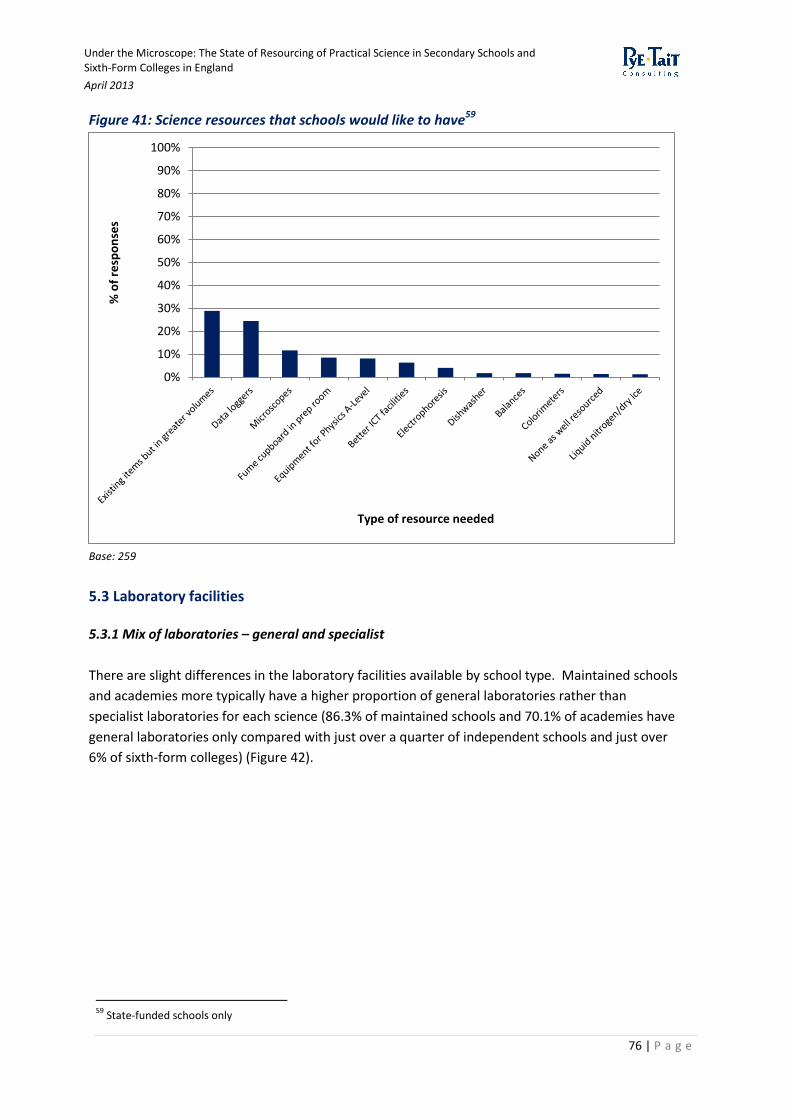
Under the Microscope: The State of Resourcing of Practical Science in Secondary Schools and Sixth-Form Colleges in England
April 2013
76 | P a g e
Figure 41: Science resources that schools would like to have59
Base: 259
5.3 Laboratory facilities 5.3.1 Mix of laboratories – general and specialist
There are slight differences in the laboratory facilities available by school type. Maintained schools
and academies more typically have a higher proportion of general laboratories rather than
specialist laboratories for each science (86.3% of maintained schools and 70.1% of academies have
general laboratories only compared with just over a quarter of independent schools and just over
6% of sixth-form colleges) (Figure 42).
59
State-funded schools only
0%
10%
20%
30%
40%
50%
60%
70%
80%
90%
100%
% o
f re
spo
nse
s
Type of resource needed
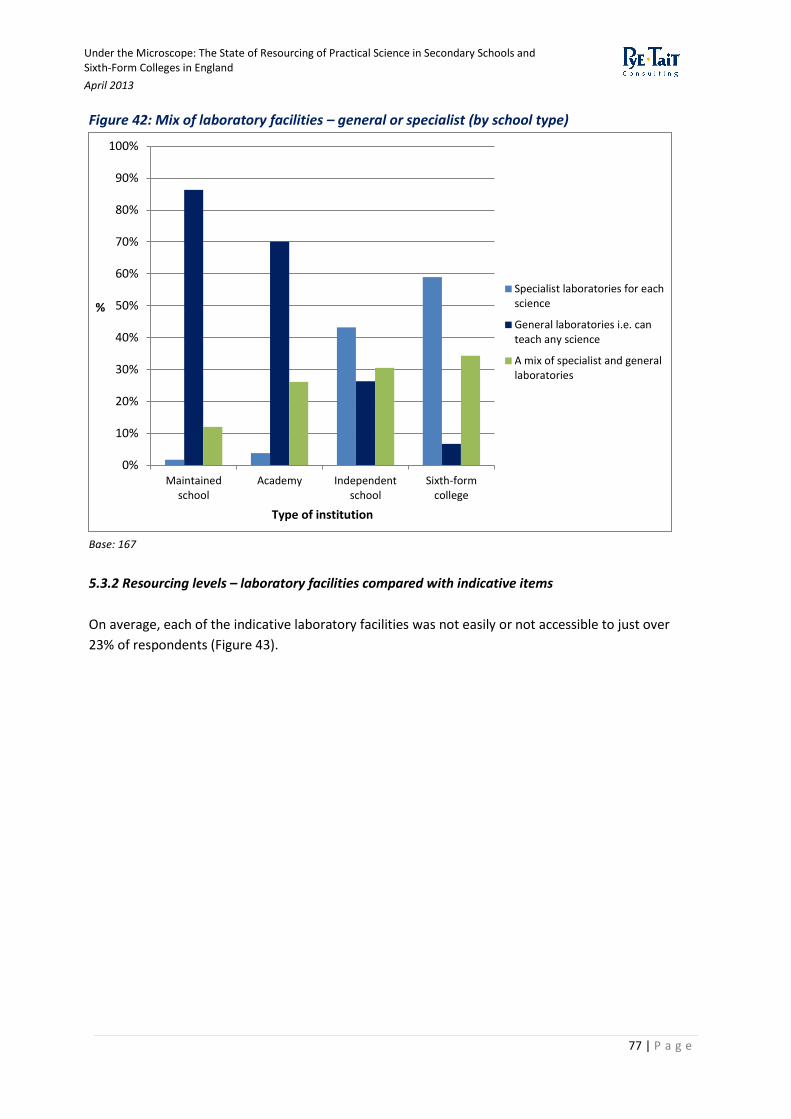
Under the Microscope: The State of Resourcing of Practical Science in Secondary Schools and Sixth-Form Colleges in England
April 2013
77 | P a g e
Figure 42: Mix of laboratory facilities – general or specialist (by school type)
Base: 167
5.3.2 Resourcing levels – laboratory facilities compared with indicative items
On average, each of the indicative laboratory facilities was not easily or not accessible to just over
23% of respondents (Figure 43).
0%
10%
20%
30%
40%
50%
60%
70%
80%
90%
100%
Maintainedschool
Academy Independentschool
Sixth-formcollege
%
Type of institution
Specialist laboratories for eachscience
General laboratories i.e. canteach any science
A mix of specialist and generallaboratories
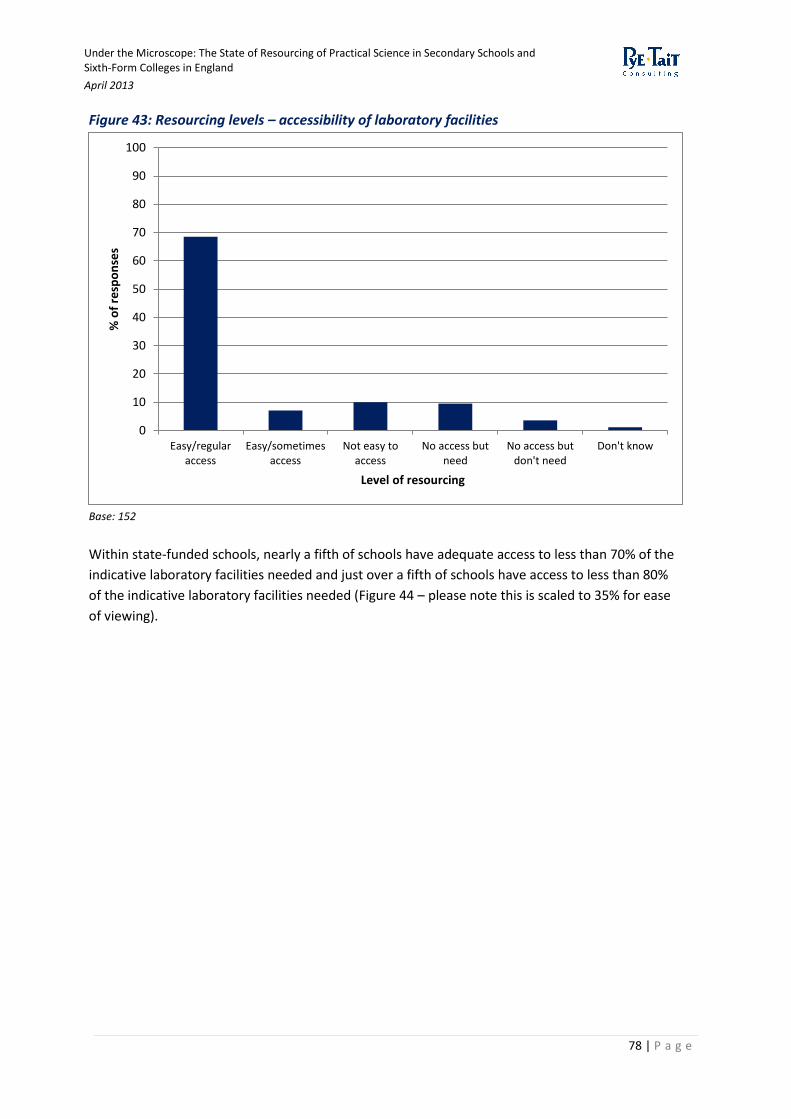
Under the Microscope: The State of Resourcing of Practical Science in Secondary Schools and Sixth-Form Colleges in England
April 2013
78 | P a g e
Figure 43: Resourcing levels – accessibility of laboratory facilities
Base: 152
Within state-funded schools, nearly a fifth of schools have adequate access to less than 70% of the
indicative laboratory facilities needed and just over a fifth of schools have access to less than 80%
of the indicative laboratory facilities needed (Figure 44 – please note this is scaled to 35% for ease
of viewing).
0
10
20
30
40
50
60
70
80
90
100
Easy/regularaccess
Easy/sometimesaccess
Not easy toaccess
No access butneed
No access butdon't need
Don't know
% o
f re
spo
nse
s
Level of resourcing
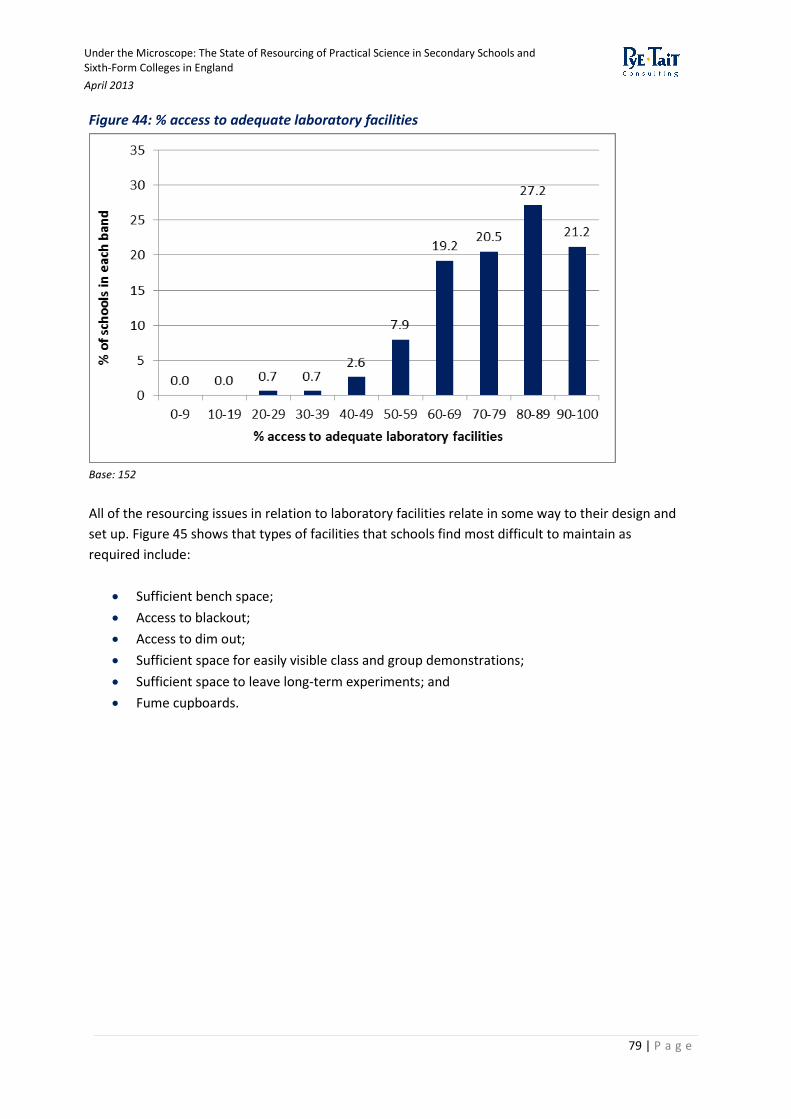
Under the Microscope: The State of Resourcing of Practical Science in Secondary Schools and Sixth-Form Colleges in England
April 2013
79 | P a g e
Figure 44: % access to adequate laboratory facilities
Base: 152
All of the resourcing issues in relation to laboratory facilities relate in some way to their design and
set up. Figure 45 shows that types of facilities that schools find most difficult to maintain as
required include:
Sufficient bench space;
Access to blackout;
Access to dim out;
Sufficient space for easily visible class and group demonstrations;
Sufficient space to leave long-term experiments; and
Fume cupboards.
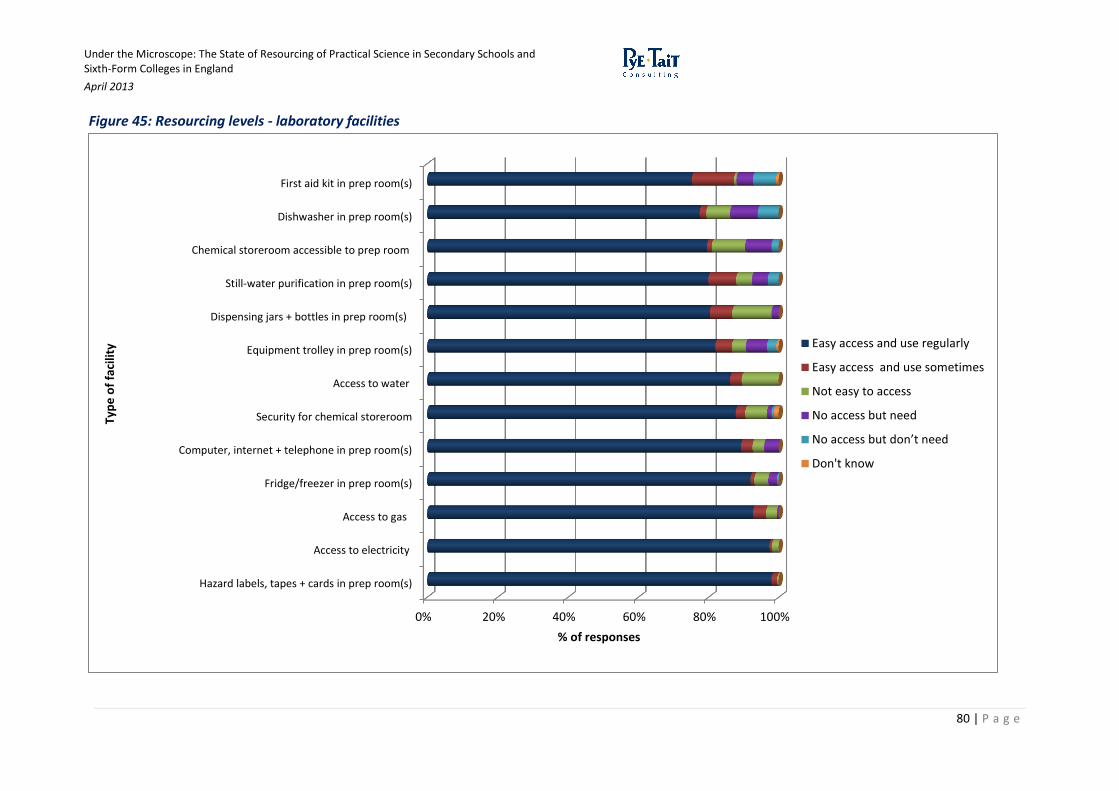
Under the Microscope: The State of Resourcing of Practical Science in Secondary Schools and Sixth-Form Colleges in England
April 2013
80 | P a g e
Figure 45: Resourcing levels - laboratory facilities
0% 20% 40% 60% 80% 100%
Hazard labels, tapes + cards in prep room(s)
Access to electricity
Access to gas
Fridge/freezer in prep room(s)
Computer, internet + telephone in prep room(s)
Security for chemical storeroom
Access to water
Equipment trolley in prep room(s)
Dispensing jars + bottles in prep room(s)
Still-water purification in prep room(s)
Chemical storeroom accessible to prep room
Dishwasher in prep room(s)
First aid kit in prep room(s)
% of responses
Typ
e o
f fa
cilit
y Easy access and use regularly
Easy access and use sometimes
Not easy to access
No access but need
No access but don’t need
Don't know
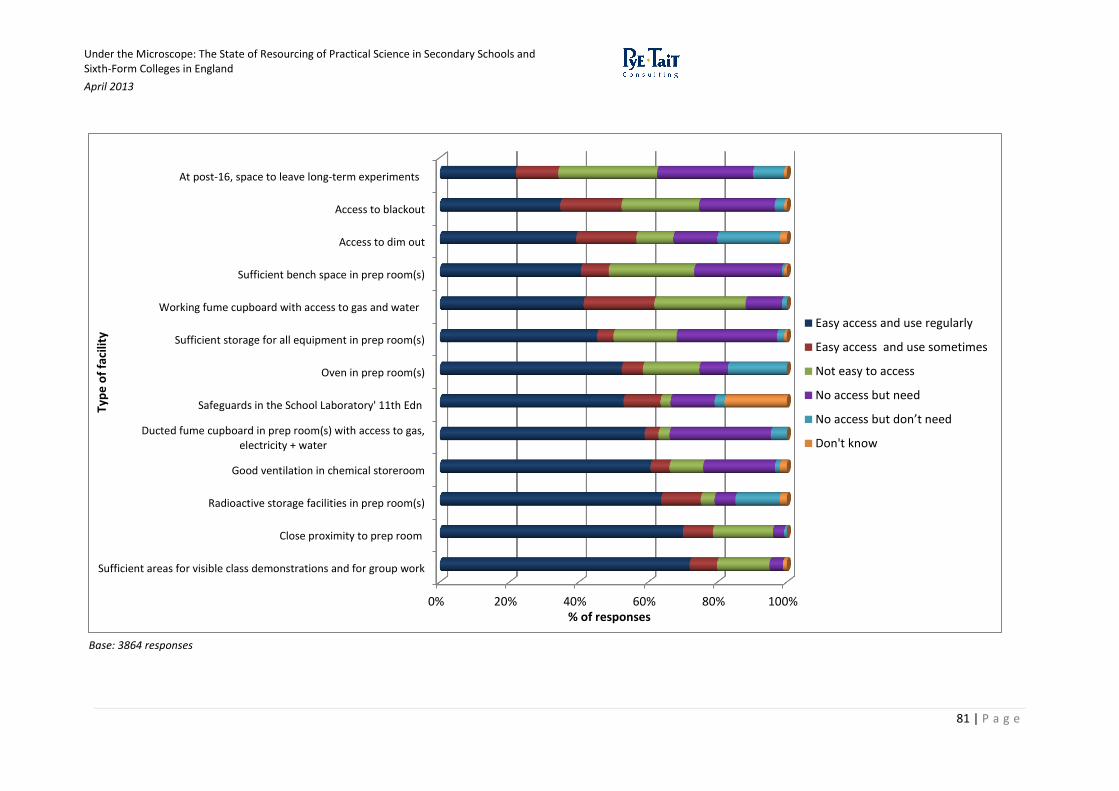
Under the Microscope: The State of Resourcing of Practical Science in Secondary Schools and Sixth-Form Colleges in England
April 2013
81 | P a g e
Base: 3864 responses
0% 20% 40% 60% 80% 100%
Sufficient areas for visible class demonstrations and for group work
Close proximity to prep room
Radioactive storage facilities in prep room(s)
Good ventilation in chemical storeroom
Ducted fume cupboard in prep room(s) with access to gas,electricity + water
Safeguards in the School Laboratory' 11th Edn
Oven in prep room(s)
Sufficient storage for all equipment in prep room(s)
Working fume cupboard with access to gas and water
Sufficient bench space in prep room(s)
Access to dim out
Access to blackout
At post-16, space to leave long-term experiments
% of responses
Typ
e o
f fa
cilit
y
Easy access and use regularly
Easy access and use sometimes
Not easy to access
No access but need
No access but don’t need
Don't know
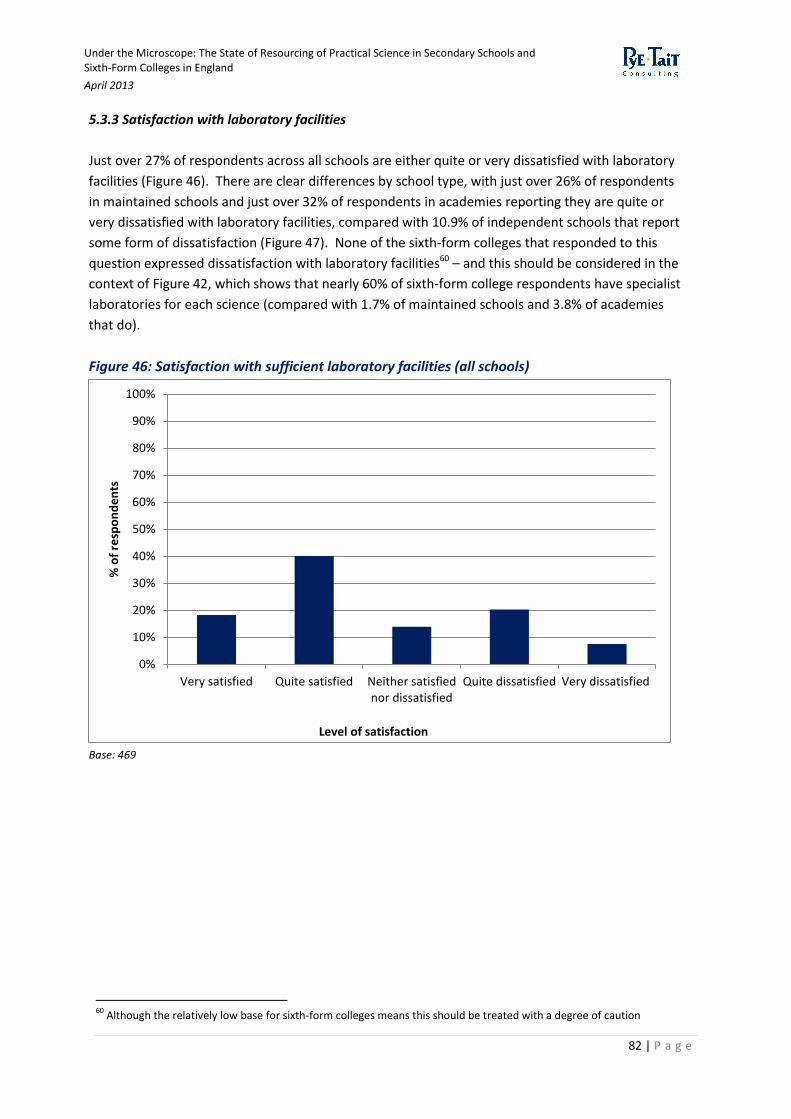
Under the Microscope: The State of Resourcing of Practical Science in Secondary Schools and Sixth-Form Colleges in England
April 2013
82 | P a g e
5.3.3 Satisfaction with laboratory facilities
Just over 27% of respondents across all schools are either quite or very dissatisfied with laboratory
facilities (Figure 46). There are clear differences by school type, with just over 26% of respondents
in maintained schools and just over 32% of respondents in academies reporting they are quite or
very dissatisfied with laboratory facilities, compared with 10.9% of independent schools that report
some form of dissatisfaction (Figure 47). None of the sixth-form colleges that responded to this
question expressed dissatisfaction with laboratory facilities60 – and this should be considered in the
context of Figure 42, which shows that nearly 60% of sixth-form college respondents have specialist
laboratories for each science (compared with 1.7% of maintained schools and 3.8% of academies
that do).
Figure 46: Satisfaction with sufficient laboratory facilities (all schools)
Base: 469
60
Although the relatively low base for sixth-form colleges means this should be treated with a degree of caution
0%
10%
20%
30%
40%
50%
60%
70%
80%
90%
100%
Very satisfied Quite satisfied Neither satisfiednor dissatisfied
Quite dissatisfied Very dissatisfied
% o
f re
spo
nd
en
ts
Level of satisfaction
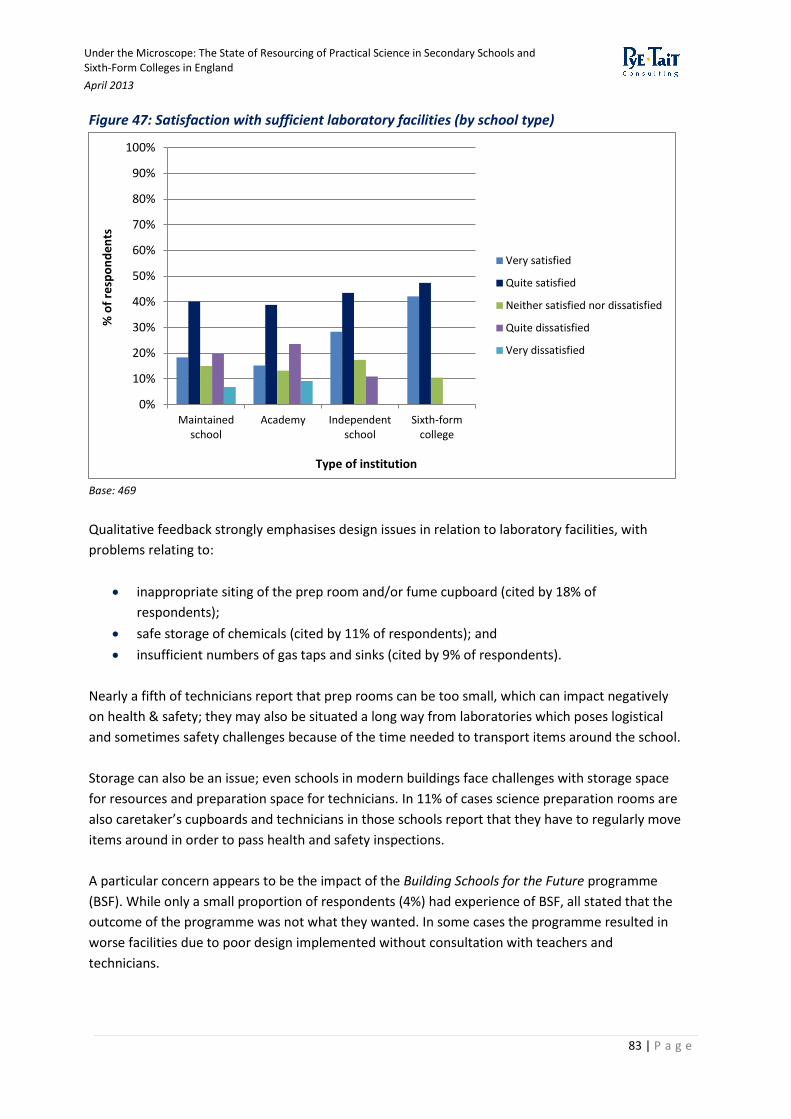
Under the Microscope: The State of Resourcing of Practical Science in Secondary Schools and Sixth-Form Colleges in England
April 2013
83 | P a g e
Figure 47: Satisfaction with sufficient laboratory facilities (by school type)
Base: 469
Qualitative feedback strongly emphasises design issues in relation to laboratory facilities, with
problems relating to:
inappropriate siting of the prep room and/or fume cupboard (cited by 18% of
respondents);
safe storage of chemicals (cited by 11% of respondents); and
insufficient numbers of gas taps and sinks (cited by 9% of respondents).
Nearly a fifth of technicians report that prep rooms can be too small, which can impact negatively
on health & safety; they may also be situated a long way from laboratories which poses logistical
and sometimes safety challenges because of the time needed to transport items around the school.
Storage can also be an issue; even schools in modern buildings face challenges with storage space
for resources and preparation space for technicians. In 11% of cases science preparation rooms are
also caretaker’s cupboards and technicians in those schools report that they have to regularly move
items around in order to pass health and safety inspections.
A particular concern appears to be the impact of the Building Schools for the Future programme
(BSF). While only a small proportion of respondents (4%) had experience of BSF, all stated that the
outcome of the programme was not what they wanted. In some cases the programme resulted in
worse facilities due to poor design implemented without consultation with teachers and
technicians.
0%
10%
20%
30%
40%
50%
60%
70%
80%
90%
100%
Maintainedschool
Academy Independentschool
Sixth-formcollege
% o
f re
spo
nd
en
ts
Type of institution
Very satisfied
Quite satisfied
Neither satisfied nor dissatisfied
Quite dissatisfied
Very dissatisfied
Under the Microscope: The State of Resourcing of Practical Science in Secondary Schools and Sixth-Form Colleges in England
April 2013
84 | P a g e
“Recent BSF resulted in fewer overall rooms with laboratory facilities”
“Never design a new prep room, chemical store or class laboratory without consulting the
technician. there are too many things that will be overlooked otherwise”
“BSF was our biggest problem. With 1200 pupils, 8 full time and 2 part time science teachers, we
only have access to 5 laboratories now, as we lost 3 to BSF new build. This means all of us lab-share
and have to do practicals in specific lessons which makes planning and teaching difficult at times”
This has meant that a higher proportion of science lessons are being taught in classrooms rather
than in laboratories in some schools – therefore practical work cannot be undertaken. Furthermore
older school laboratory buildings sometimes date back to the 1950s, and although in many cases
the furnishings are considered to be of very high quality, modern day occupancy rates mean that
they are overcrowded, impacting on the types of practical experiments that can be carried out.
“Whilst I have indicated that I am satisfied with laboratory facilities, it is a case of making do with
what you are working with”
5.4 Technician support
5.4.1 Technician role
Qualitative feedback points to a great deal of variation reported in relation to the way in which the
technician role is perceived within schools.
Technicians frequently have a career pattern of previous work as scientists in industry. Many can
be extremely well-qualified but this is not always recognised, with around a fifth of state-funded
schools appearing to perceive the technician role as administrative rather than as a science
specialist. This is clearly evidenced within schools that seek cover for absent technicians via
caretakers, kitchen or cleaning staff.
“The head teacher suggested that the only thing the technicians do when we come into work over
the holidays is water the plants”
“I believe that the role of the technician is sorely misunderstood; many people think that their role is
clerical or that of a teaching assistant when this isn’t the case…the technician is professional, they
mix complex solutions, they look after specialist equipment, and they aren’t there to do my
photocopying”
Even though other schools and colleges attach high value to their technicians and the role they
play, the majority of technicians interviewed for the qualitative phase of this research (78%) report
that they do not earn a ‘living wage’ and this can make it difficult to recruit as well as replace
technicians that leave. Respondents state it is particularly hard to recruit physics specialist
technicians with the salary and working conditions on offer.
Under the Microscope: The State of Resourcing of Practical Science in Secondary Schools and Sixth-Form Colleges in England
April 2013
85 | P a g e
“A major problem is often the standard of technician applicants - low pay structure for
(undervalued) technicians puts off more able applicants. Lack of "standing" for technicians is a VERY
sore point”
“A technician’s wage is not a living wage and you couldn’t afford to rely on it if you were the
breadwinner of a household”
“[As technicians] my colleagues and I take on temporary work during the holidays because we need
the money”
“We have a supply technician from an agency and want to make him permanent, but the school will
offer him a term-time only contract, which he can’t afford”
“Technicians do a big job for appalling pay”
“[As a technician] I really resent being poorly paid and having to work in my own time to get
through my workload…I have taken on increasing numbers of responsibilities and as a line manager
I am responsible for managing the other technicians but my salary doesn’t reflect my qualifications,
how long I have been doing the job or the responsibilities I have”
“If I could change just one thing about the teaching of science it would be that technicians should be
better understood and better paid to reflect their skill level”
The dual issues of salary and working conditions can mean it is difficult to recruit and retain
technicians, yet their absence or insufficient working hours clearly have a strong impact on
practical science. Typically technicians do not have to give a term’s notice as teachers do and in the
event of a technician leaving or absent due to illness, practical experiments may be changed or
cancelled altogether.
“The technician team can make or break a department’s ability to carry out meaningful practical
work”
“Often schools overlook the need for decent technical support and are happy to employ someone
'just to do the washing up'. A good technician will stretch the budget by making sure equipment is
used, stored and maintained properly, carry out repairs, even making equipment from scratch if
necessary, and ensuring new purchases are appropriate and good value for money”
“Many schools and colleges have the misguided belief that reducing the hours of science
technicians, making some redundant or perhaps not replacing those that retire is a great way to
save money. This management action actually impacts negatively on the safe and effective delivery
of science education within the department”
Under the Microscope: The State of Resourcing of Practical Science in Secondary Schools and Sixth-Form Colleges in England
April 2013
86 | P a g e
5.4.2 Technician working hours
Just over a quarter of respondents (28%) within state-funded schools report that they need at least
one additional technician.
Whilst around 30% of state-funded schools have full-time technicians employed all year round, the
majority of around 70% employ them during term times only, or on ‘term time plus’ arrangements.
The latter means they are employed during school terms and for a certain number of days outside
of this, usually between 15 and 30 days.
Qualitative feedback indicates that the delivery of practical science can be substantially
compromised because of insufficient technician time, including time in the laboratory or prep room
to set up experiments. Concerns were expressed about a decrease in the number of working
hours for technicians, particularly where respondents faced funding cuts, as this could make it
unlikely that either working hours would increase, or technicians would be replaced if they leave.
“The number of technicians is decreasing – as they retire they’re not going to be replaced. We have
four at the moment but it should be five. The chemistry technician is due to retire shortly – we’re
not sure what we will do”
“We currently have a technician and a half (4 hours a day) – but could do with at least another hour
a day”
“As technicians we work full-time and long hours, well above what the contract stipulates”
“In line with CLEAPSS guidance the department should currently have four technicians however the
school can’t afford to pay for this”
Furthermore nearly a fifth of respondents report that the workload of technicians has increased in
recent years due to the requirements of controlled assessments, which can require more work to
organise and plan resourcing. The majority of technicians interviewed for the qualitative phase of
this research (48%) state this means they have to put in extra hours in their own time to ensure
practical work does not suffer.
5.4.3 Technician training
Just over a fifth of respondents (21%) interviewed for the qualitative phase of this research state
that training provision and career pathways for technicians are not fit for purpose. This can impact
upon schools’ capacity to attract people to the role, as well as upon the approach to resourcing of
practical work – for example where technicians lack appropriate training, more experienced
technicians may need to spend more time supporting them, which could be more usefully spent on
planning and setting up practical experiments.

Under the Microscope: The State of Resourcing of Practical Science in Secondary Schools and Sixth-Form Colleges in England
April 2013
87 | P a g e
“There is no proper training system for technicians and it’s too much of a time burden for existing
technicians to train up new inexperienced people”
“I am concerned that I am the only qualified technician in the school and my two colleagues are
woefully badly equipped for dealing with the day-to-day of being a technician which in turn puts a
terrible strain on me. I see that most of my technician friends are aged fifty or thereabouts and
when they retire there will be nobody to replace them. We need some sort of system like an
Apprenticeship where you can train up your replacement”
My two colleagues in the technician team are not scientists so I spend a great deal of time training
them and helping them and fixing their mistakes. I often advise teachers on what to do because I
have a wealth of experience and a science background but I am paid a pittance and I have no career
prospects. When I started, there was a seven stage career framework from new starter to senior
technician with pay scales to match and it was a proper career – that’s all gone”
“I would like to see increased opportunities for training for technicians and the creation of a
national career structure for school science technicians”
5.4.4 Satisfaction with technician support
Heads of science and science teachers were asked whether they consider they have sufficient
technician support. Nearly a quarter of all respondents (23.2%) are either quite or very dissatisfied
with the amount of technician support available for practical science (Figure 48). Again there are
clear differences between school type, with 28.2% of respondents from maintained schools and
23.4% of respondents from academies stating they are quite or very dissatisfied with the amount of
technician support available – in stark contrast with independent schools and sixth-form colleges,
where no respondents report any level of dissatisfaction61 (Figure 49).
Where respondents state they are very or quite satisfied that there is sufficient technician support
qualitative feedback indicates that many of these individuals acknowledge that this is largely
because of the goodwill of the highly trained individuals concerned, who regularly work outside
their contracted hours for no additional pay, in order to provide teachers with the level of support
they need.
61
Although this should be treated with a degree of caution given the relatively low bases of respondents for independent schools and sixth-form colleges
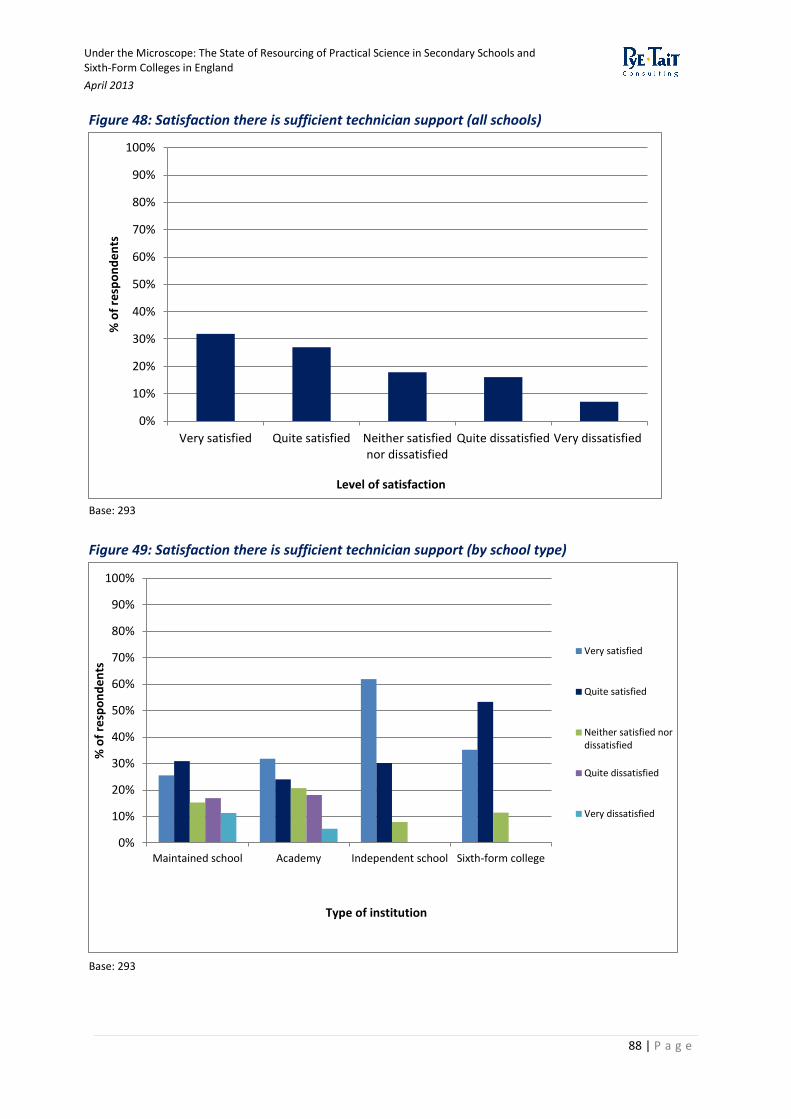
Under the Microscope: The State of Resourcing of Practical Science in Secondary Schools and Sixth-Form Colleges in England
April 2013
88 | P a g e
Figure 48: Satisfaction there is sufficient technician support (all schools)
Base: 293
Figure 49: Satisfaction there is sufficient technician support (by school type)
Base: 293
0%
10%
20%
30%
40%
50%
60%
70%
80%
90%
100%
Very satisfied Quite satisfied Neither satisfiednor dissatisfied
Quite dissatisfied Very dissatisfied
% o
f re
spo
nd
en
ts
Level of satisfaction
0%
10%
20%
30%
40%
50%
60%
70%
80%
90%
100%
Maintained school Academy Independent school Sixth-form college
% o
f re
spo
nd
en
ts
Type of institution
Very satisfied
Quite satisfied
Neither satisfied nordissatisfied
Quite dissatisfied
Very dissatisfied
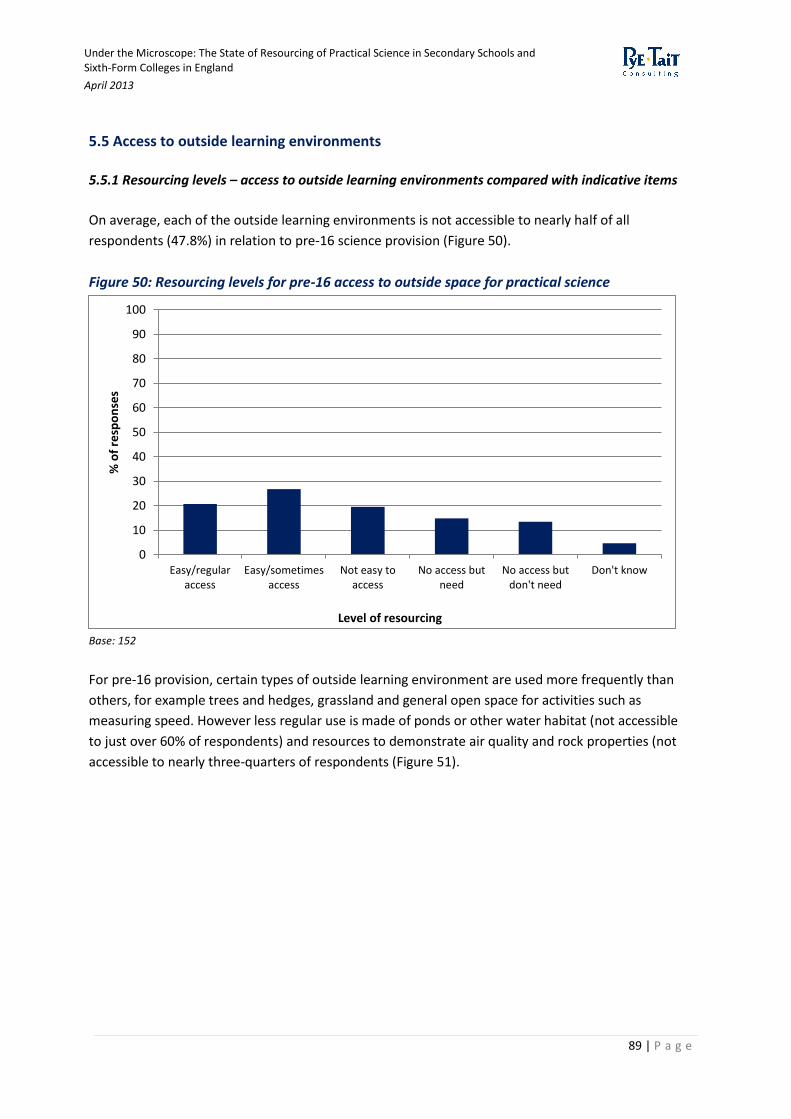
Under the Microscope: The State of Resourcing of Practical Science in Secondary Schools and Sixth-Form Colleges in England
April 2013
89 | P a g e
5.5 Access to outside learning environments
5.5.1 Resourcing levels – access to outside learning environments compared with indicative items
On average, each of the outside learning environments is not accessible to nearly half of all
respondents (47.8%) in relation to pre-16 science provision (Figure 50).
Figure 50: Resourcing levels for pre-16 access to outside space for practical science
Base: 152
For pre-16 provision, certain types of outside learning environment are used more frequently than
others, for example trees and hedges, grassland and general open space for activities such as
measuring speed. However less regular use is made of ponds or other water habitat (not accessible
to just over 60% of respondents) and resources to demonstrate air quality and rock properties (not
accessible to nearly three-quarters of respondents (Figure 51).
0
10
20
30
40
50
60
70
80
90
100
Easy/regularaccess
Easy/sometimesaccess
Not easy toaccess
No access butneed
No access butdon't need
Don't know
% o
f re
spo
nse
s
Level of resourcing
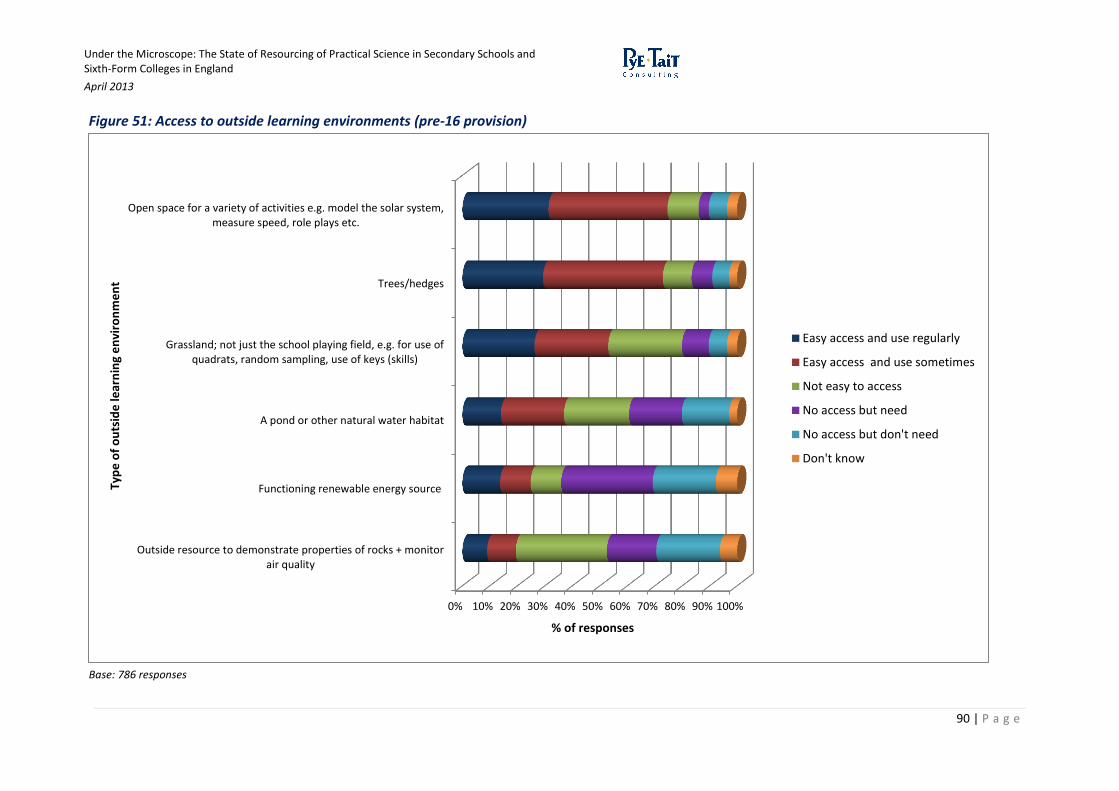
Under the Microscope: The State of Resourcing of Practical Science in Secondary Schools and Sixth-Form Colleges in England
April 2013
90 | P a g e
Figure 51: Access to outside learning environments (pre-16 provision)
Base: 786 responses
0% 10% 20% 30% 40% 50% 60% 70% 80% 90% 100%
Outside resource to demonstrate properties of rocks + monitorair quality
Functioning renewable energy source
A pond or other natural water habitat
Grassland; not just the school playing field, e.g. for use ofquadrats, random sampling, use of keys (skills)
Trees/hedges
Open space for a variety of activities e.g. model the solar system,measure speed, role plays etc.
% of responses
Typ
e o
f o
uts
ide
lear
nin
g e
nvi
ron
me
nt
Easy access and use regularly
Easy access and use sometimes
Not easy to access
No access but need
No access but don't need
Don't know
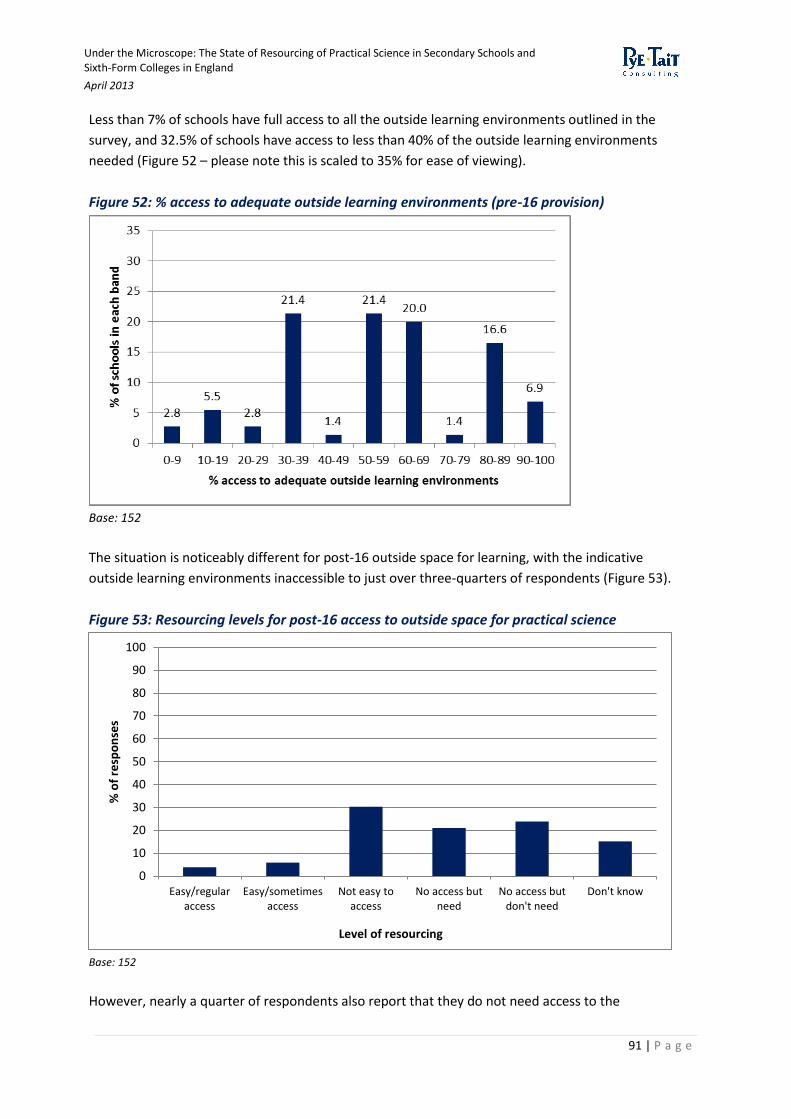
Under the Microscope: The State of Resourcing of Practical Science in Secondary Schools and Sixth-Form Colleges in England
April 2013
91 | P a g e
Less than 7% of schools have full access to all the outside learning environments outlined in the
survey, and 32.5% of schools have access to less than 40% of the outside learning environments
needed (Figure 52 – please note this is scaled to 35% for ease of viewing).
Figure 52: % access to adequate outside learning environments (pre-16 provision)
Base: 152
The situation is noticeably different for post-16 outside space for learning, with the indicative
outside learning environments inaccessible to just over three-quarters of respondents (Figure 53).
Figure 53: Resourcing levels for post-16 access to outside space for practical science
Base: 152
However, nearly a quarter of respondents also report that they do not need access to the
0
10
20
30
40
50
60
70
80
90
100
Easy/regularaccess
Easy/sometimesaccess
Not easy toaccess
No access butneed
No access butdon't need
Don't know
% o
f re
spo
nse
s
Level of resourcing
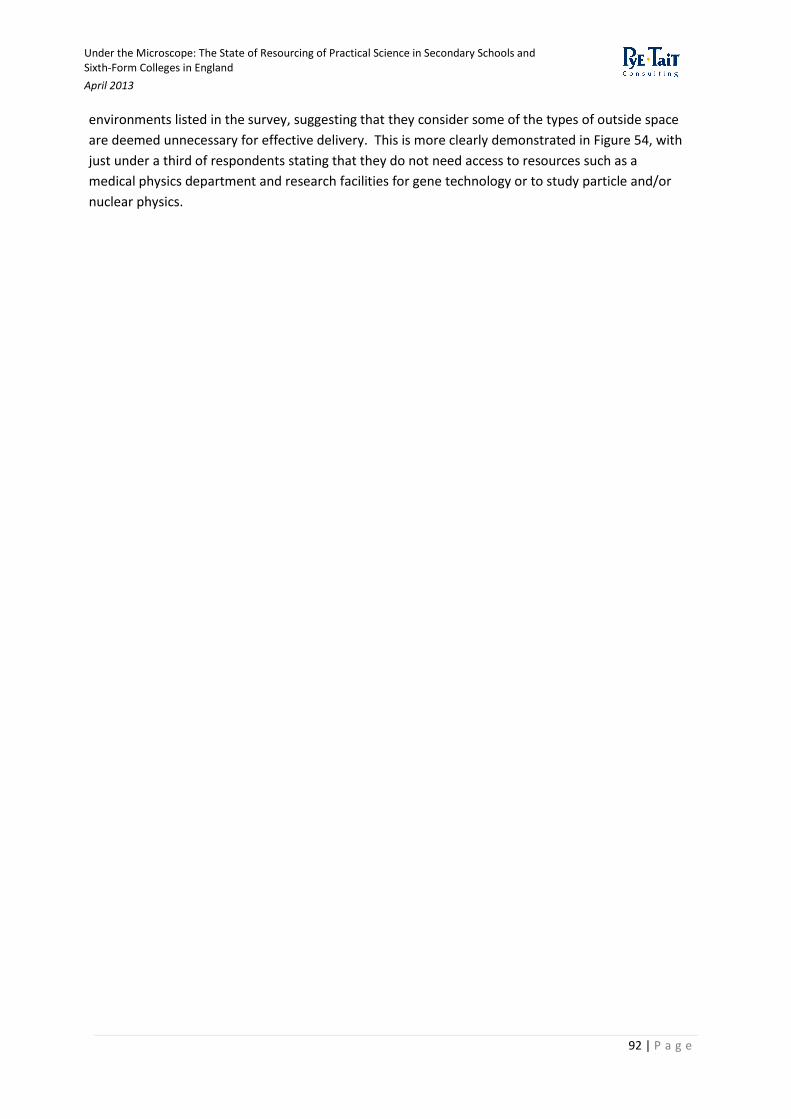
Under the Microscope: The State of Resourcing of Practical Science in Secondary Schools and Sixth-Form Colleges in England
April 2013
92 | P a g e
environments listed in the survey, suggesting that they consider some of the types of outside space
are deemed unnecessary for effective delivery. This is more clearly demonstrated in Figure 54, with
just under a third of respondents stating that they do not need access to resources such as a
medical physics department and research facilities for gene technology or to study particle and/or
nuclear physics.
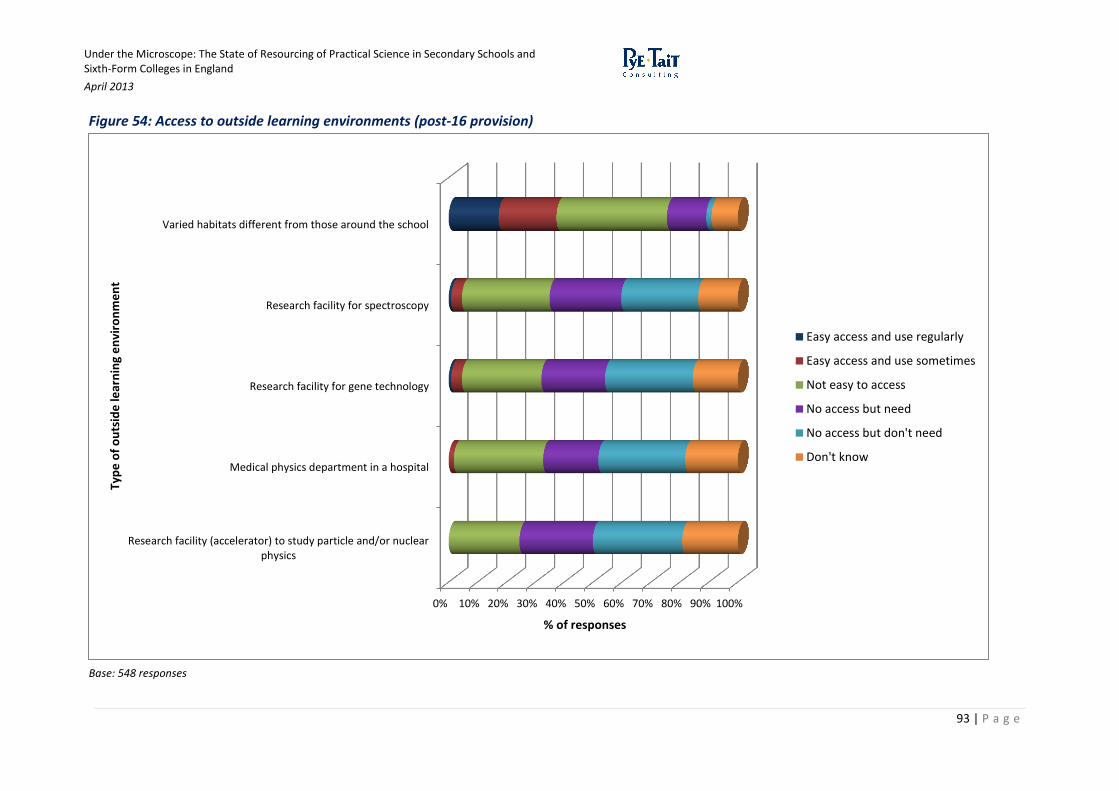
Under the Microscope: The State of Resourcing of Practical Science in Secondary Schools and Sixth-Form Colleges in England
April 2013
93 | P a g e
Figure 54: Access to outside learning environments (post-16 provision)
Base: 548 responses
0% 10% 20% 30% 40% 50% 60% 70% 80% 90% 100%
Research facility (accelerator) to study particle and/or nuclearphysics
Medical physics department in a hospital
Research facility for gene technology
Research facility for spectroscopy
Varied habitats different from those around the school
% of responses
Typ
e o
f o
uts
ide
lear
nin
g e
nvi
ron
me
nt
Easy access and use regularly
Easy access and use sometimes
Not easy to access
No access but need
No access but don't need
Don't know
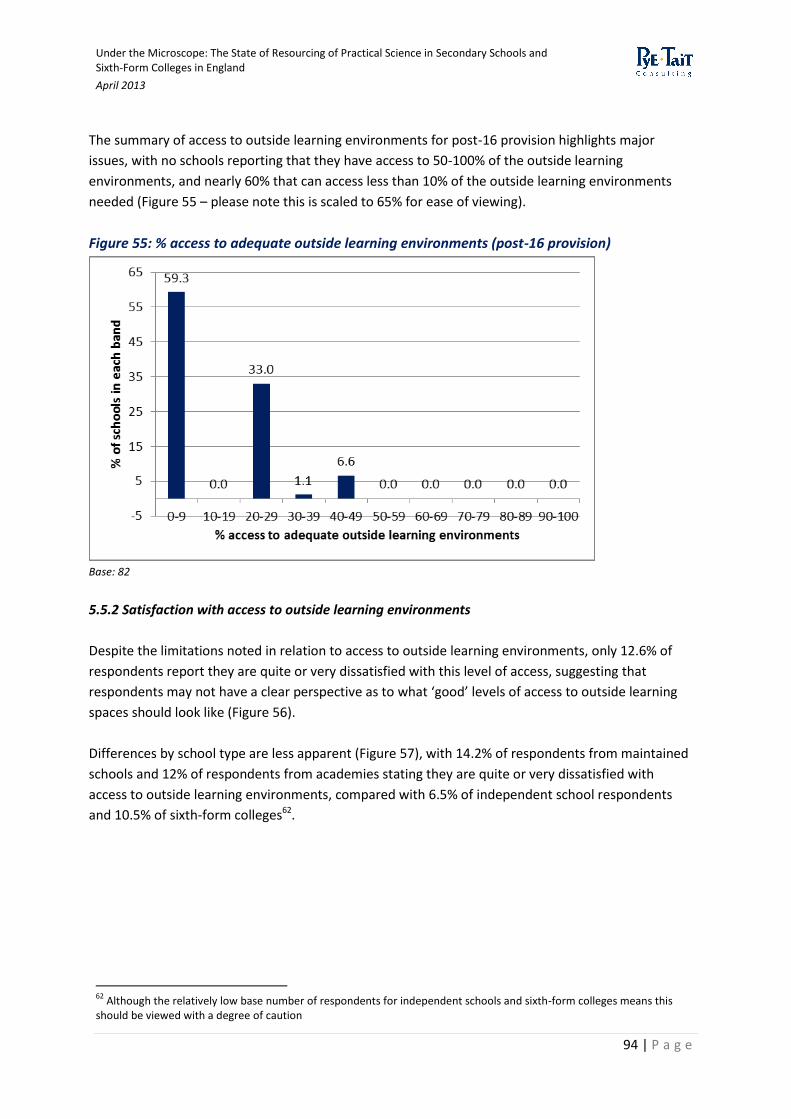
Under the Microscope: The State of Resourcing of Practical Science in Secondary Schools and Sixth-Form Colleges in England
April 2013
94 | P a g e
The summary of access to outside learning environments for post-16 provision highlights major
issues, with no schools reporting that they have access to 50-100% of the outside learning
environments, and nearly 60% that can access less than 10% of the outside learning environments
needed (Figure 55 – please note this is scaled to 65% for ease of viewing).
Figure 55: % access to adequate outside learning environments (post-16 provision)
Base: 82
5.5.2 Satisfaction with access to outside learning environments
Despite the limitations noted in relation to access to outside learning environments, only 12.6% of
respondents report they are quite or very dissatisfied with this level of access, suggesting that
respondents may not have a clear perspective as to what ‘good’ levels of access to outside learning
spaces should look like (Figure 56).
Differences by school type are less apparent (Figure 57), with 14.2% of respondents from maintained
schools and 12% of respondents from academies stating they are quite or very dissatisfied with
access to outside learning environments, compared with 6.5% of independent school respondents
and 10.5% of sixth-form colleges62.
62
Although the relatively low base number of respondents for independent schools and sixth-form colleges means this should be viewed with a degree of caution
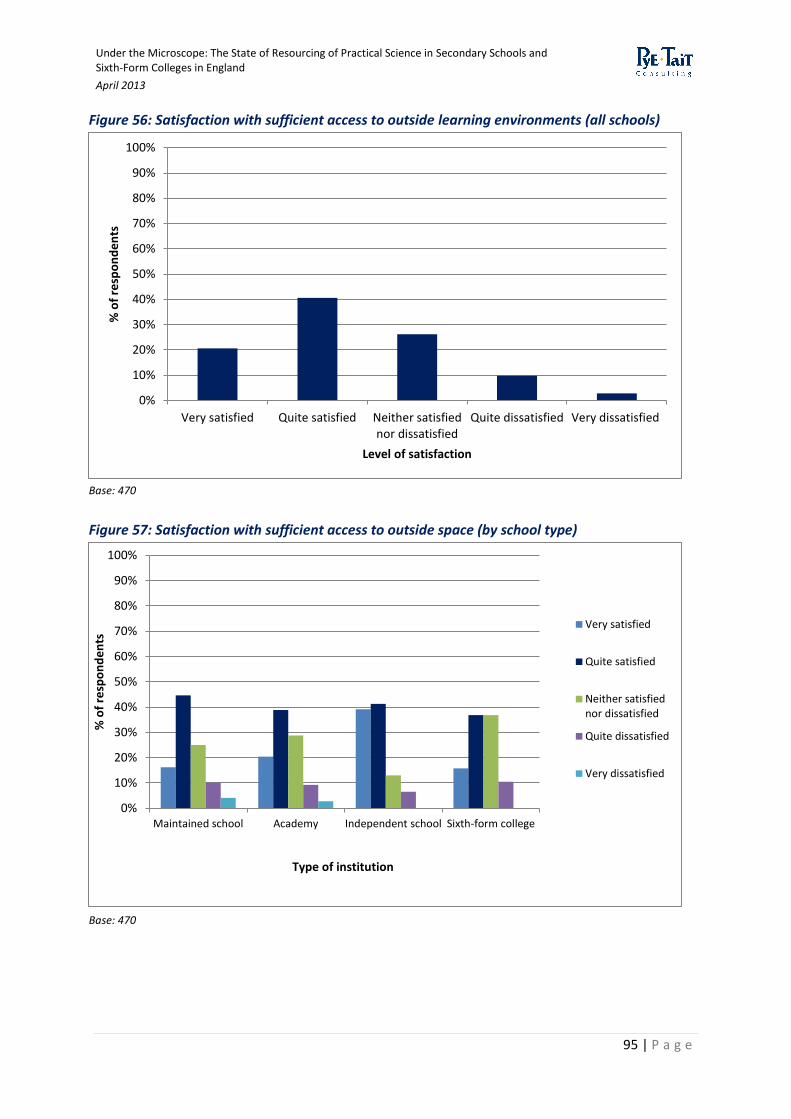
Under the Microscope: The State of Resourcing of Practical Science in Secondary Schools and Sixth-Form Colleges in England
April 2013
95 | P a g e
Figure 56: Satisfaction with sufficient access to outside learning environments (all schools)
Base: 470
Figure 57: Satisfaction with sufficient access to outside space (by school type)
Base: 470
0%
10%
20%
30%
40%
50%
60%
70%
80%
90%
100%
Very satisfied Quite satisfied Neither satisfiednor dissatisfied
Quite dissatisfied Very dissatisfied
% o
f re
spo
nd
en
ts
Level of satisfaction
0%
10%
20%
30%
40%
50%
60%
70%
80%
90%
100%
Maintained school Academy Independent school Sixth-form college
% o
f re
spo
nd
en
ts
Type of institution
Very satisfied
Quite satisfied
Neither satisfiednor dissatisfied
Quite dissatisfied
Very dissatisfied
Under the Microscope: The State of Resourcing of Practical Science in Secondary Schools and Sixth-Form Colleges in England
April 2013
96 | P a g e
5.6 Approaches to resourcing in new builds During the qualitative phase of the research approaches towards resourcing of science departments
in new build schools and colleges was explored. There does not appear to be one particularly
favoured approach to resourcing of new build science departments. In some cases resources have
been planned and secured by the Head of the department in consultation with technicians – thereby
ensuring that decisions on how to resource science is based upon their combined years of
experience.
In other circumstances this process can be outside the control of the teachers and/or technicians. As
previously stated, a major concern is that new facilities – and laboratories in particular – are
designed and planned without consultation with those who will be using them. Respondents strongly
emphasise concerns about a growing trend in new builds (or newly refurbished spaces) of insufficient
space to meet the science needs as well as accommodate growing pupil numbers.
“Laboratory facilities are often poor in new PFI63 builds. For example the arrangement of gas and
electric supplies makes access difficult, the fixed long benches are usually at the back and facing
AWAY from the teacher who is therefore unable to see what the pupil is doing. Water is only supplied
on the sides and back of the room instead of the arrangement in traditional laboratories, and there
are many other problems”
“No-one seemed to remember that storage space is critical for science labs”
“Too many of the new schools have been built ‘architecturally pretty’ but have utterly useless lab
spaces”
One school described having to divide one laboratory into two, so that two classes could proceed in
parallel. The alternative was to teach the second class in an ordinary classroom. However this
presents issues in ensuring there is enough equipment to go round.
Space is at a premium even in “new builds” where designers do not always take account of class sizes
and the way in which equipment needs to be used). This relates to secure storage of equipment,
chemicals and space for preparation, as well as overcrowding in laboratories. The latter can mean
there is not enough time, when laboratories are unoccupied, for preparation of practical experiments
for the next classes.
63
Private Finance Initiative – a school building programme announced by the Government in 2011 originally worth £2bn (this dropped to £1.75bn in December 2012)
Under the Microscope: The State of Resourcing of Practical Science in Secondary Schools and Sixth-Form Colleges in England
April 2013
97 | P a g e
Case study: laboratory design in a new build sixth-form college
After several years of planning, this college has been able to build state-of-the-art science facilities
including new laboratories and prep rooms with sufficient storage space. Five new chemistry
laboratories with accompanying prep and teaching rooms have been built in response to the growing
student intake, which meant more space and resources were required.
Laboratory layout in terms of seating, location of equipment and types of resources in the
laboratories is standardised to ensure consistency when teaching and to ensure all classes are able to
use the same types of consumables/equipment. Laboratories, prep rooms and teaching rooms are
spacious and well-organised with new equipment and electronic whiteboards with data projectors.
Prior to the extension project the laboratories were not laid out in a standard manner and layouts
varied dramatically which meant that not all were suitable for versatile practical work. However this
has now changed. Prep rooms have separate chemical stores and a vented funnel for flammables.
There is ample storage as well as extra hidden storage in small locked rooms which can house bulk
buys.
5.7 Anticipated future levels of resourcing for practical science Over a third of respondents (36.4%) report that they are not very, or not at all confident that they
will have sufficient resources for teaching practical science effectively over the forthcoming two
academic years (Figure 58). It should be noted when considering these findings however, that against
a backdrop of an uncertain economic climate, respondents were only able to speculate about future
resourcing levels rather than provide exact forecasts.
There is greater confidence among independent schools compared with state-funded schools (Figure
59) – 71.6% of respondents in the former are very confident about future resourcing levels compared
with 14.1% of respondents from maintained schools and 19.5% of respondents from academies.
Qualitative feedback has raised longer-term concerns about the sufficiency of resourcing in the
context of funding cuts and the prospect of not being able to replace equipment once it wears out
(also see Section 5.8).

Under the Microscope: The State of Resourcing of Practical Science in Secondary Schools and Sixth-Form Colleges in England
April 2013
98 | P a g e
Figure 58: Confidence there will be enough equipment and consumables over the next two academic years (all schools)
Base: 294
Figure 59: Confidence there will be enough equipment and consumables (by school type)
Base: 294
0%
10%
20%
30%
40%
50%
60%
70%
80%
90%
100%
Very confident Quite confident Not veryconfident
Not at allconfident
Don't know
% o
f re
spo
nd
en
ts
Level of confidence
0%
10%
20%
30%
40%
50%
60%
70%
80%
90%
100%
Maintained school Academy Independentschool
Sixth-form college
% o
f re
spo
nd
en
ts
Type of institution
Very confident
Quite confident
Not very confident
Not at all confident
Don't know
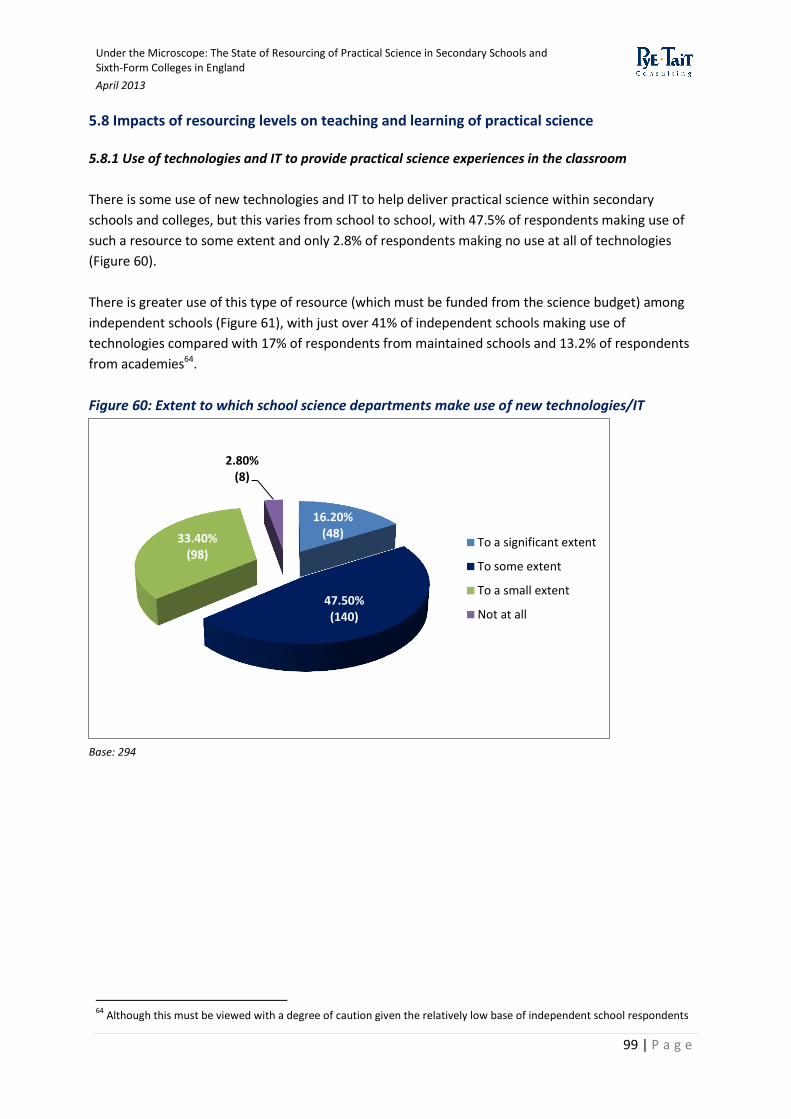
Under the Microscope: The State of Resourcing of Practical Science in Secondary Schools and Sixth-Form Colleges in England
April 2013
99 | P a g e
5.8 Impacts of resourcing levels on teaching and learning of practical science 5.8.1 Use of technologies and IT to provide practical science experiences in the classroom
There is some use of new technologies and IT to help deliver practical science within secondary
schools and colleges, but this varies from school to school, with 47.5% of respondents making use of
such a resource to some extent and only 2.8% of respondents making no use at all of technologies
(Figure 60).
There is greater use of this type of resource (which must be funded from the science budget) among
independent schools (Figure 61), with just over 41% of independent schools making use of
technologies compared with 17% of respondents from maintained schools and 13.2% of respondents
from academies64.
Figure 60: Extent to which school science departments make use of new technologies/IT
Base: 294
64
Although this must be viewed with a degree of caution given the relatively low base of independent school respondents
16.20% (48)
47.50% (140)
33.40% (98)
2.80% (8)
To a significant extent
To some extent
To a small extent
Not at all
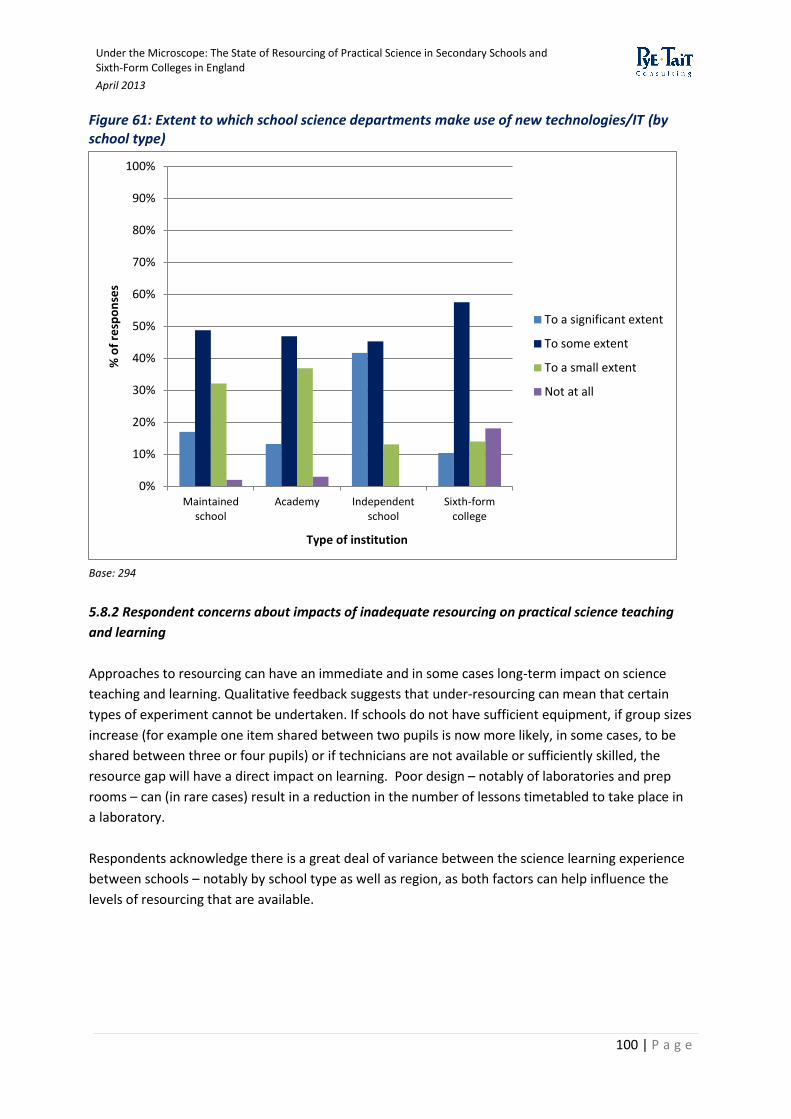
Under the Microscope: The State of Resourcing of Practical Science in Secondary Schools and Sixth-Form Colleges in England
April 2013
100 | P a g e
Figure 61: Extent to which school science departments make use of new technologies/IT (by school type)
Base: 294
5.8.2 Respondent concerns about impacts of inadequate resourcing on practical science teaching
and learning
Approaches to resourcing can have an immediate and in some cases long-term impact on science
teaching and learning. Qualitative feedback suggests that under-resourcing can mean that certain
types of experiment cannot be undertaken. If schools do not have sufficient equipment, if group sizes
increase (for example one item shared between two pupils is now more likely, in some cases, to be
shared between three or four pupils) or if technicians are not available or sufficiently skilled, the
resource gap will have a direct impact on learning. Poor design – notably of laboratories and prep
rooms – can (in rare cases) result in a reduction in the number of lessons timetabled to take place in
a laboratory.
Respondents acknowledge there is a great deal of variance between the science learning experience
between schools – notably by school type as well as region, as both factors can help influence the
levels of resourcing that are available.
0%
10%
20%
30%
40%
50%
60%
70%
80%
90%
100%
Maintainedschool
Academy Independentschool
Sixth-formcollege
% o
f re
spo
nse
s
Type of institution
To a significant extent
To some extent
To a small extent
Not at all
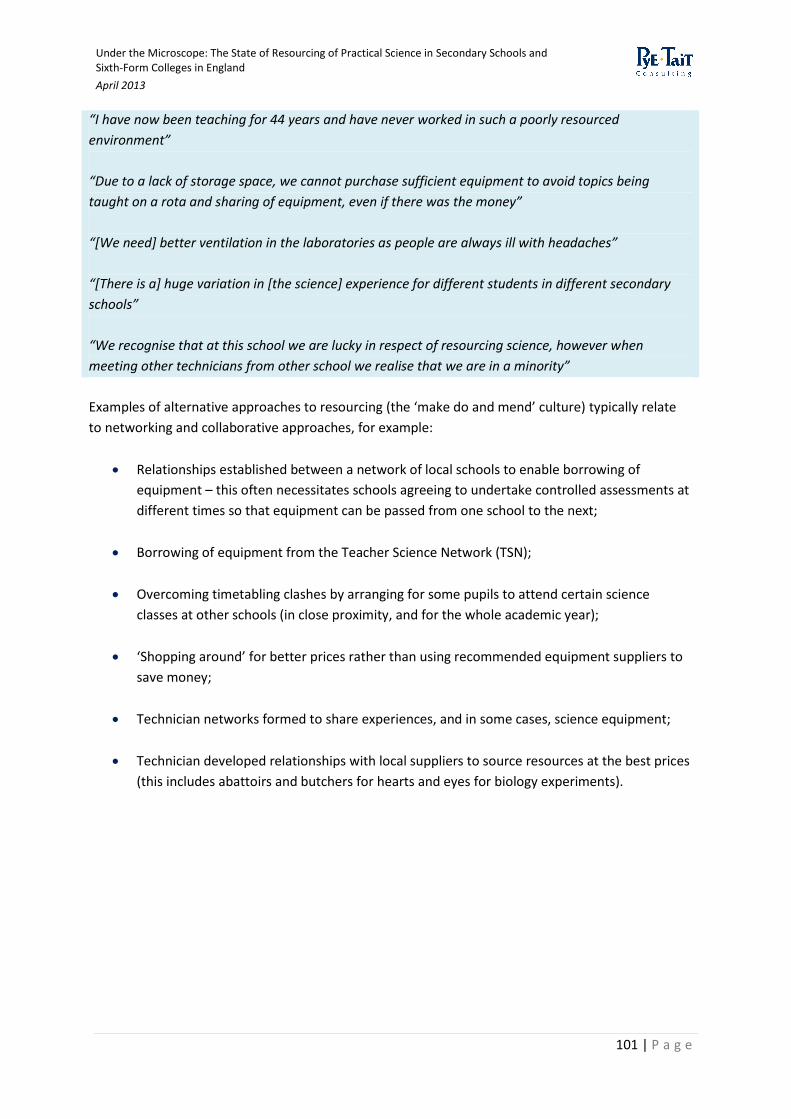
Under the Microscope: The State of Resourcing of Practical Science in Secondary Schools and Sixth-Form Colleges in England
April 2013
101 | P a g e
“I have now been teaching for 44 years and have never worked in such a poorly resourced
environment”
“Due to a lack of storage space, we cannot purchase sufficient equipment to avoid topics being
taught on a rota and sharing of equipment, even if there was the money”
“[We need] better ventilation in the laboratories as people are always ill with headaches”
“[There is a] huge variation in [the science] experience for different students in different secondary
schools”
“We recognise that at this school we are lucky in respect of resourcing science, however when
meeting other technicians from other school we realise that we are in a minority”
Examples of alternative approaches to resourcing (the ‘make do and mend’ culture) typically relate
to networking and collaborative approaches, for example:
Relationships established between a network of local schools to enable borrowing of
equipment – this often necessitates schools agreeing to undertake controlled assessments at
different times so that equipment can be passed from one school to the next;
Borrowing of equipment from the Teacher Science Network (TSN);
Overcoming timetabling clashes by arranging for some pupils to attend certain science
classes at other schools (in close proximity, and for the whole academic year);
‘Shopping around’ for better prices rather than using recommended equipment suppliers to
save money;
Technician networks formed to share experiences, and in some cases, science equipment;
Technician developed relationships with local suppliers to source resources at the best prices
(this includes abattoirs and butchers for hearts and eyes for biology experiments).
Under the Microscope: The State of Resourcing of Practical Science in Secondary Schools and Sixth-Form Colleges in England
April 2013
102 | P a g e
6. Drivers influencing resourcing of practical science in secondary schools and sixth-form colleges
A number of drivers combine to influence the manner, and the extent to which, practical science is
being resourced currently, and are likely to continue to sway approaches and attitudes over the next
few years. This section is drawn solely from qualitative feedback.
6.1 Curriculum changes On-going change to the curriculum is the most commonly cited factor (by 65% of respondents) that
drives resourcing of practical science. Respondents note that instability within the curriculum can act
as a major obstacle for resourcing, contributing to inability to plan ahead and wasted expenditure on
textbooks and equipment that must be regularly replaced.
Respondents indicate that changes enforced by examination boards and central Government result
in:
Wasted expenditure on textbooks that have to be frequently replaced;
Rising proportion of budget spent on reprographics as a result of regular curriculum change;
and
Lack of stability in the curriculum prevents planning ahead for resourcing, as the situation
may change.
“Funding for the ever changing political changes to science curriculum does not match the amount of
change currently being experienced”
“In my 10 years as a science teacher the one single issue that has prevented the development of more
and better practical work in science has been the constant change in programmes of study and
specifications for examined courses”
“The constant changes brought about because of Government initiatives means that any
medium/long term developments are not worth spending money on as in 3 or 4 years’ time the
Government will only change everything again”
6.2 Controlled assessments Over two-thirds of respondents (68%) state that controlled assessments act as a major driver of the
amount and type of equipment that is resourced for practical science. The need to run all
assessments for the same year group on the same day frequently means schools do not have the
equipment they need in sufficient quantities, compelling some to try to borrow from other local
Under the Microscope: The State of Resourcing of Practical Science in Secondary Schools and Sixth-Form Colleges in England
April 2013
103 | P a g e
institutions, and others to buy additional items that subsequently may not be used for the remainder
of the academic year.
Respondents also note that organisations designing controlled assessments do not take account of
equipment typically available for schools, meaning that those in poorly-funded regions can lose out.
Furthermore some schools object to some Awarding Organisations choosing to dictate which
suppliers they should use to source equipment for controlled assessments. This is partly because
they are perceived to be too expensive (having a ‘captive’ market meaning they can charge higher
prices); and partly because suppliers tend to run out of equipment as stocks are then ordered by a
large proportion of schools.
“New controlled assessment GCSE practicals sometimes requires large numbers of everyday items
(graduated pipettes, measuring cylinders, stopwatches, balances, burettes, data loggers) that we do
have, but not in sufficient quantities”
“We have found controlled assessments difficult because of the number of pupils doing the
experiment at the same time (usually the majority of a year group all at the same time)”
“Demands of equipment for controlled assessment at Key Stage 4 are a significant burden, greatly
increasing costs for consumables and sometimes requiring outlay on expensive additional equipment”
6.3 Economic factors Inevitably the economic downturn has impacted upon schools’ capacity to resource science, with
over 45% of respondents reporting funding cuts or budgets that have remained static. Where
budgets have increased year-on-year, the majority of respondents (63.7%) argue that in practice,
they do not see any uplift because pupil numbers and class sizes have also increased.
The impact of funding cuts can have a knock-on effect in a number of areas – for example the
number of technicians and/or technician working hours that can be funded, investment in training
and CPD (for teachers and technicians), and the type and volume of science equipment and
consumables that can be purchased.
“With budgets decreasing each year for the last three years, the amount of practical [work] has
decreased...and will continue to do so”
Respondents acknowledge that some schools in economically poor areas are at a major
disadvantage. For example respondents in poorly funded Local Authorities report that they are
unable to give students the freedom or support to design their own experiments, as they lack
sufficient equipment and/or technician time.

Under the Microscope: The State of Resourcing of Practical Science in Secondary Schools and Sixth-Form Colleges in England
April 2013
104 | P a g e
“There is a huge range of budgets among local schools. A straw poll at a Subject Leaders Network
indicated a range of £4,000 (us) to £40,000 in annual budget - even those of a comparable size (to us)
being around a range of £12-20,000”
“It is particularly unjust that students who study in the worst funded local authorities…may suffer”
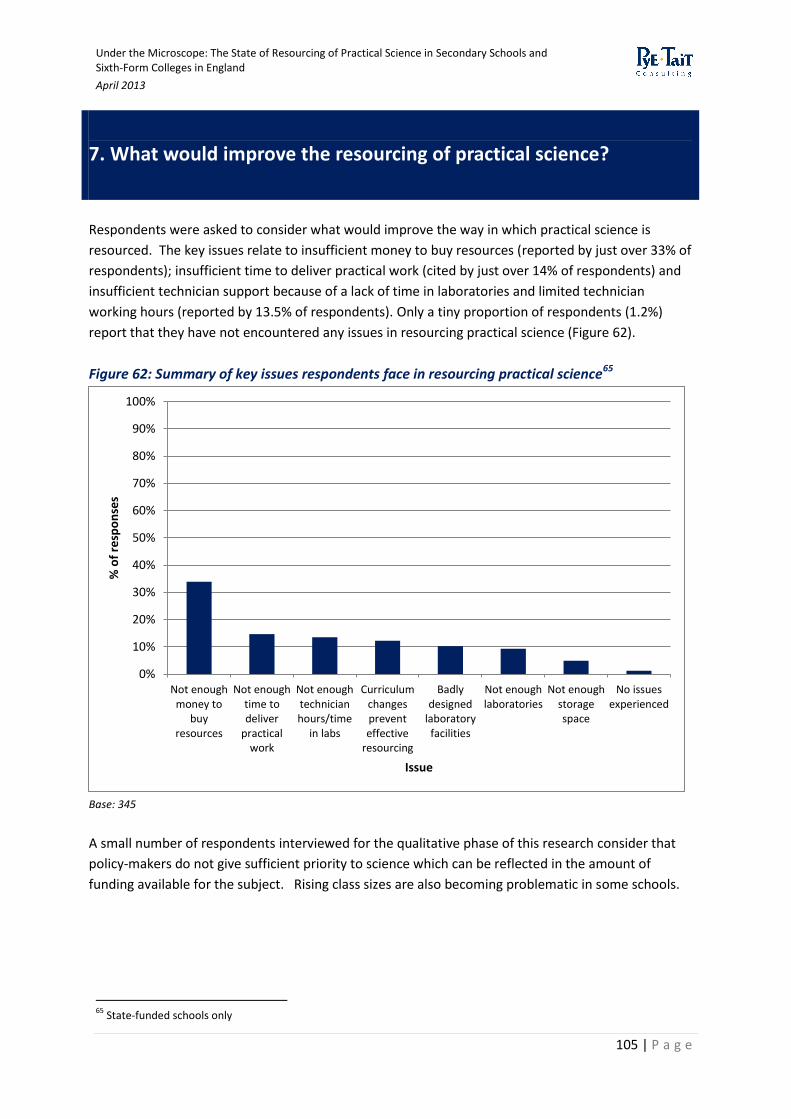
Under the Microscope: The State of Resourcing of Practical Science in Secondary Schools and Sixth-Form Colleges in England
April 2013
105 | P a g e
7. What would improve the resourcing of practical science?
Respondents were asked to consider what would improve the way in which practical science is
resourced. The key issues relate to insufficient money to buy resources (reported by just over 33% of
respondents); insufficient time to deliver practical work (cited by just over 14% of respondents) and
insufficient technician support because of a lack of time in laboratories and limited technician
working hours (reported by 13.5% of respondents). Only a tiny proportion of respondents (1.2%)
report that they have not encountered any issues in resourcing practical science (Figure 62).
Figure 62: Summary of key issues respondents face in resourcing practical science65
Base: 345
A small number of respondents interviewed for the qualitative phase of this research consider that
policy-makers do not give sufficient priority to science which can be reflected in the amount of
funding available for the subject. Rising class sizes are also becoming problematic in some schools.
65
State-funded schools only
0%
10%
20%
30%
40%
50%
60%
70%
80%
90%
100%
Not enoughmoney to
buyresources
Not enoughtime todeliver
practicalwork
Not enoughtechnicianhours/time
in labs
Curriculumchangespreventeffective
resourcing
Badlydesigned
laboratoryfacilities
Not enoughlaboratories
Not enoughstoragespace
No issuesexperienced
% o
f re
spo
nse
s
Issue
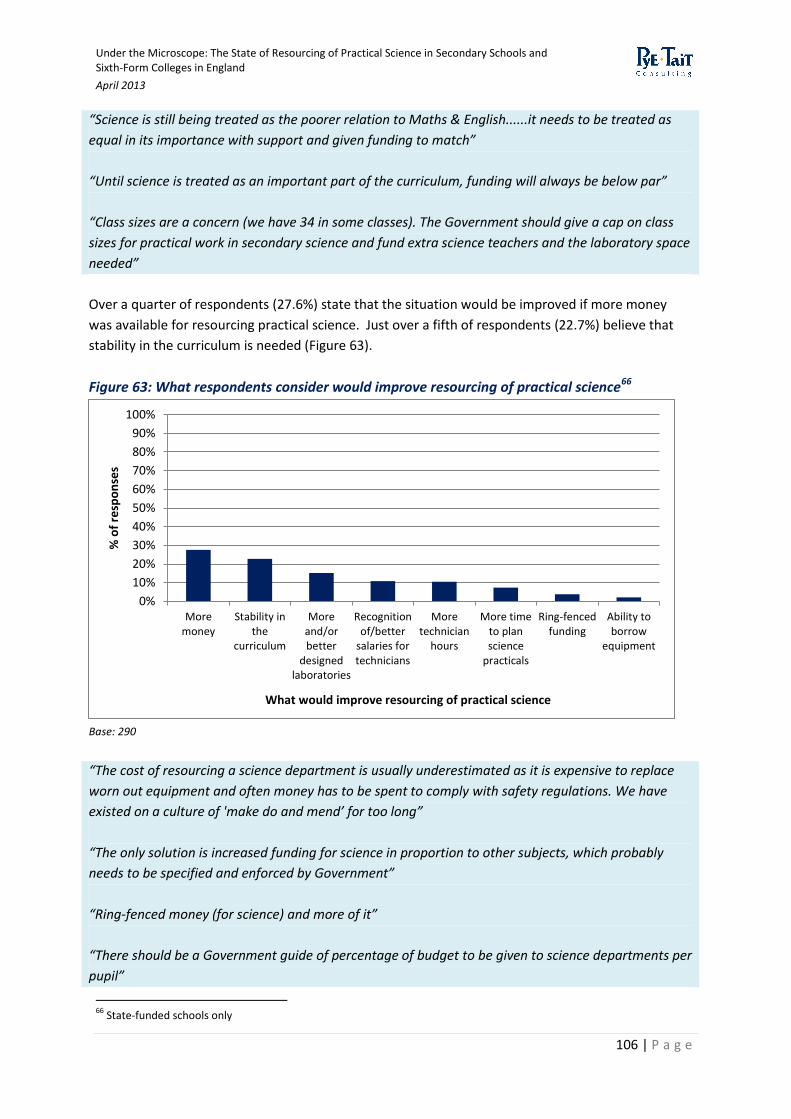
Under the Microscope: The State of Resourcing of Practical Science in Secondary Schools and Sixth-Form Colleges in England
April 2013
106 | P a g e
“Science is still being treated as the poorer relation to Maths & English......it needs to be treated as
equal in its importance with support and given funding to match”
“Until science is treated as an important part of the curriculum, funding will always be below par”
“Class sizes are a concern (we have 34 in some classes). The Government should give a cap on class
sizes for practical work in secondary science and fund extra science teachers and the laboratory space
needed”
Over a quarter of respondents (27.6%) state that the situation would be improved if more money
was available for resourcing practical science. Just over a fifth of respondents (22.7%) believe that
stability in the curriculum is needed (Figure 63).
Figure 63: What respondents consider would improve resourcing of practical science66
Base: 290
“The cost of resourcing a science department is usually underestimated as it is expensive to replace
worn out equipment and often money has to be spent to comply with safety regulations. We have
existed on a culture of 'make do and mend’ for too long”
“The only solution is increased funding for science in proportion to other subjects, which probably
needs to be specified and enforced by Government”
“Ring-fenced money (for science) and more of it”
“There should be a Government guide of percentage of budget to be given to science departments per
pupil”
66
State-funded schools only
0%
10%
20%
30%
40%
50%
60%
70%
80%
90%
100%
Moremoney
Stability inthe
curriculum
Moreand/orbetter
designedlaboratories
Recognitionof/better
salaries fortechnicians
Moretechnician
hours
More timeto planscience
practicals
Ring-fencedfunding
Ability toborrow
equipment
% o
f re
spo
nse
s
What would improve resourcing of practical science
Under the Microscope: The State of Resourcing of Practical Science in Secondary Schools and Sixth-Form Colleges in England
April 2013
107 | P a g e
8. Conclusions and recommendations
8.1 Conclusions
1. There is considerable variation between funding and resourcing levels for practical science
between secondary schools and sixth-form colleges in England – with particular disparity
noted between state-funded schools compared with independent schools. This variation
contributes to considerable differences in the type of practical science teaching and learning
experience that can be offered to pupils. For state-funded schools the average per capita
spend on science is £8.81 compared with £27.29 within independent schools. The spread
from the lowest per capita spend on science resourcing to the highest is also extensive:
ranging from £0.75 to £31.25 within state-funded schools, and from £7.18 to £83.21 within
independent schools.
2. Whilst a consistent science learning experience cannot be guaranteed in either the private
sector or state-funded schools, it is clear independent schools have greater control over
their science revenue and how they choose to spend it.
3. Over 80% of respondent state-funded schools do not formally allocate funding specifically to
science practical work. The largest proportion of the science budget is spent on equipment
and consumables (at an average of nearly 40% in state-funded schools). A significant
proportion of budget is being increasingly spent on reprographics amounting to an average
of 28% in state-funded schools. Those monies spent on reprographics are at the expense of
purchasing new or updating existing equipment.
4. The levels of dissatisfaction with science resourcing vary considerably between school types:
44.4% of respondents from maintained schools, 30.3% of respondents from academies and
6.5% of respondents from independent schools. Respondents in state-funded schools that
are very satisfied with the funding available for resourcing science have, on average, just
over double the per capita spend on science (£16.95 – academic year 2011/12), compared
with those that report being very dissatisfied (an average per capita of £7.86). Nearly a third
of maintained schools and nearly a fifth of academies are either quite or very dissatisfied
with resourcing of science equipment and consumables.
5. Science teachers and technicians are, in some cases, supplementing the core science budget
with contributions from their own pocket – however it is not possible to quantify the typical
amount spent, and the frequency with which this is occurring.
6. Respondents in state-funded schools report impacts on science teaching and learning as a
result of limited funding – notably a need to adapt to a culture of ‘make do and mend’ –
cited as an issue by over a third of respondents. Nearly a third of maintained schools expect
to offer less science practical teaching and experiences in the next two academic years as a
Under the Microscope: The State of Resourcing of Practical Science in Secondary Schools and Sixth-Form Colleges in England
April 2013
108 | P a g e
result of anticipated future funding levels.
7. The average state-funded secondary school has just 70% of the equipment and consumables
it needs to teach science subjects, but four in ten state-funded schools have less than 70%
of the equipment and consumables they require, while a third of state-funded schools have
80% or more of the equipment and consumables they need.
8. As well as disparity between schools in England in relation to resourcing, there is noticeable
variation in resourcing levels between individual science subjects. Biology appears to be the
‘poor relation’ (63.1% of responses indicate sufficient quantities in full working order at pre-
16 level, compared with 70.7% for pre-16 chemistry and 72% for pre-16 physics). At post-16
levels, resourcing for biology presents a bigger cause for concern – less than 44% of
responses indicate access to sufficient numbers of the indicative items (compared with 66%
for post-16 chemistry and 62% for post-16 physics).
Less than 12% of schools have access to more than 90% of the indicative items for post-
16 biology. Less than 1 in 5 schools have access to more than 90% of the indicative
items and 1 in 6 have access to less than 50% of the indicative items for post-16
chemistry;
The most pressing issue for resourcing of pre-16 chemistry appears to be maintaining
the indicative items in sufficient quantities, in full working order. Only a quarter of
schools can access more than 90% of the indicative items for pre-16 chemistry.
Although the best resourced of all three science subjects (with nearly 1 in 3 schools that
have access to more than 90% of the indicative items for pre-16 physics), there are still
issues, with nearly a third of schools with sufficient access to less than 70% of the items
required. There is greater inequality at post-16 level, with around 4 in 10 schools having
access to less than 70% of the indicative items.
Compared with the individual science subjects, schools are relatively well-resourced in
relation to general science equipment – however sufficient quantities of the indicative
items are still not available to 15% of schools. The most frequently cited type of general
equipment needed by schools is heated magnetic stirrers (not available to 40% of
schools in sufficient quantities) and data loggers (not available to 36% of schools in
sufficient quantities).
9. Laboratory facilities are not easily or simply not accessible to 23% of respondents. Nearly a
fifth of schools have access to less than 70% of the indicative laboratory facilities. The
research also found concerns about design issues with, and quality standards of, laboratory
facilities in schools, even – and perhaps especially – in schools that had been recently rebuilt
or refurbished. In the case of laboratories built through BSF and PFI programmes problems
are attributable to insufficient consultation with teaching staff and technicians.
10. Access to outside learning environments presents a major cause for concern, with less than
Under the Microscope: The State of Resourcing of Practical Science in Secondary Schools and Sixth-Form Colleges in England
April 2013
109 | P a g e
7% of schools having access to indicative outside learning environments for pre-16 provision
and nearly 60% of schools having access to less than 10% of the indicative items for post-16
provision. In spite of this, less than 15% of respondents report being either quite or very
dissatisfied with access to outside learning environments, an potential indicator of a lack of
awareness among schools about what ‘good’ access to outside space for learning actually
looks like.
11. Around 70% of respondents employ technicians during term-time only. Nearly 30% of
maintained schools and nearly a quarter of academies state they are quite or very
dissatisfied with the amount of technician support available to them.
12. The qualitative research revealed extensive concerns over salaries, working conditions and
career structure. In some schools, technicians were highly valued professionals, who were
able to make a significant contribution to the delivery of high quality practical science; in
others they seem to be perceived as a low-level role, and therefore expertise is not being
fully harnessed.
13. In spite of some major issues in relation to resourcing, respondents appear somewhat
tolerant of the situation, with the majority of state-funded schools (over 45% on average)
reporting they are quite satisfied with resourcing levels. However it is clear that schools
have adapted their approach to teaching and learning of practical science as a direct result
of inadequate funding and resourcing -– notably over a third of respondents cited a need to
adapt to a culture of ‘make do and mend’. Other impacts include larger group sizes and
fewer practical science experiences.
14. There are other drivers influencing the way in which practical science is resourced in
secondary schools and sixth-form colleges. In particular, external policy developments
appear to play an important role in determining the level and adequacy of resources –
notably on-going instability within the science curriculum, with frequent changes acting as a
barrier for long-term planning in relation to resourcing of science departments, as well as
maintaining equipment in sufficient quantities. The latter issue also comes about because
of the impact of controlled assessments requiring high volumes of equipment to be in use all
at the same time; schools find it challenging to secure the necessary quantities – particularly
if these items are then used only infrequently for the remainder of the year.
15. Respondents cite that actions most likely to improve resourcing of practical science are:
more funding, stability in the curriculum, better laboratory design and more time for
practical science (in relation to planning for science teachers and technicians as well as
longer lessons and more time in the timetable generally for practical science).
8.2 Recommendations Recommendations for SCORE – information for secondary schools and sixth-form colleges:
Develop and disseminate among schools guidance on maximum class sizes for different
Under the Microscope: The State of Resourcing of Practical Science in Secondary Schools and Sixth-Form Colleges in England
April 2013
110 | P a g e
types of practical work;
Develop and make available to schools (for example via SCORE and their partner websites)
guidance on external sources of funding such as grants, competitions and awards, and keep
this updated;
Develop and disseminate among schools guidance on utilising outside learning
environments for different types of practical work, and the value of this;
Develop and disseminate among schools information about the value of technicians for
science departments, and how to best utilise their expertise;
Develop and disseminate among schools the benchmark lists of items required to effectively
deliver science practical work, together with likely costs of sourcing these items.
Recommendations for SCORE – influencing policy:
Consider undertaking additional research into the costs of resourcing science compared
with the costs of resourcing other subjects such as English and Mathematics, which may
provide an evidence base (depending on findings) with which to lobby Government to retain
the 12% weighting for post-16 science;
Use this evidence base to lobby Government in relation to securing on-going stability in the
science curriculum;
Consider seeking the development of a national funding formula which could be used to
lobby for more equitable and consistent funding of science practical work across and within
schools;
Consider lobbying Government for the Technician Service Factor to become statutory, thus
compelling schools to ensure science departments retain a full complement of technicians;
Consider lobbying Government for statutory maximum class sizes and the amount of space
needed for practical science lessons;
Consider a need to lobby central and local Governments to provide one-off targeted funding
to ensure that every school has key equipment in every classroom and that preparation and
storage areas are fit-for-purpose;
Encourage Awarding Organisations to audit their support materials and assessment
processes to ensure that they are not inadvertently passing on costs to schools;
Encourage that laboratory new builds or refurbishments be designed in full consultation
with teachers and technicians, who should be regarded as the primary client for such work
and when such works take place, the provision of appropriate, suitably located storage and
Under the Microscope: The State of Resourcing of Practical Science in Secondary Schools and Sixth-Form Colleges in England
April 2013
111 | P a g e
preparation facilities should be a priority.
Recommendations for SCORE – general:
Repeat this research in approximately two years’ time, to maintain a clear understanding of
the level and sufficiency of funding and resourcing for practical science and to understand
the impact of any changes e.g. to policy that have taken place in the interim;
Undertake specific research into the issue of reprographics costs in maintained schools, and
in particular consider in more detail what the underlying causes of high and apparently
increasing reprographics costs might be, and how they might be addressed;
Consider whether there is a need for additional research to establish in more detail the
nature of the obstacles to more extensive use of outside learning environments, and how
they may be overcome;
Seek to influence the development and implementation of a national training, qualification
and progression structure specifically for science technicians.
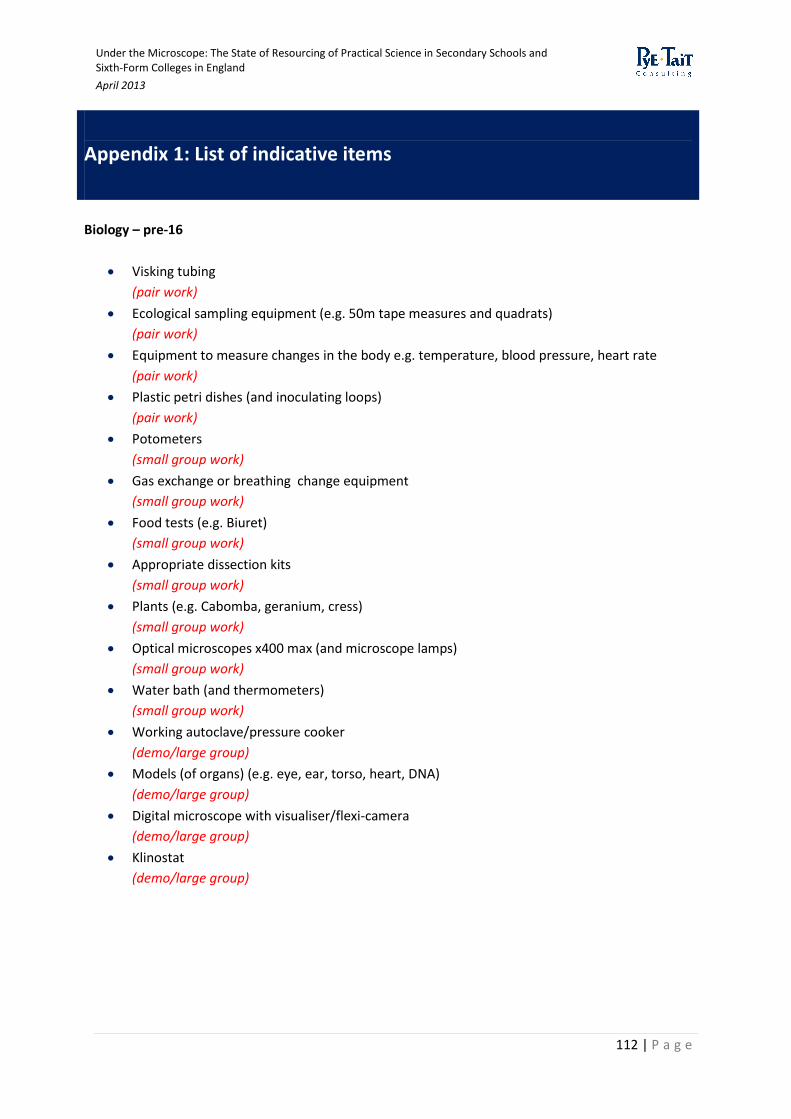
Under the Microscope: The State of Resourcing of Practical Science in Secondary Schools and Sixth-Form Colleges in England
April 2013
112 | P a g e
Appendix 1: List of indicative items
Biology – pre-16
Visking tubing
(pair work)
Ecological sampling equipment (e.g. 50m tape measures and quadrats)
(pair work)
Equipment to measure changes in the body e.g. temperature, blood pressure, heart rate
(pair work)
Plastic petri dishes (and inoculating loops)
(pair work)
Potometers
(small group work)
Gas exchange or breathing change equipment
(small group work)
Food tests (e.g. Biuret)
(small group work)
Appropriate dissection kits
(small group work)
Plants (e.g. Cabomba, geranium, cress)
(small group work)
Optical microscopes x400 max (and microscope lamps)
(small group work)
Water bath (and thermometers)
(small group work)
Working autoclave/pressure cooker
(demo/large group)
Models (of organs) (e.g. eye, ear, torso, heart, DNA)
(demo/large group)
Digital microscope with visualiser/flexi-camera
(demo/large group)
Klinostat
(demo/large group)

Under the Microscope: The State of Resourcing of Practical Science in Secondary Schools and Sixth-Form Colleges in England
April 2013
113 | P a g e
Biology – post-16
Eye piece graticular
(pair work)
Example slides
(pair work)
Top pan balance +/- 0.001g
(pair work)
Colorimeter
(small group work)
Genetic engineering kits
(small group work)
Haemocytometer
(demo/large group)
Spirometer
(demo/large group)
Gram Stains
(demo/large group)
Ninhydrin
(demo/large group)
Digital microscope with visualiser/flexi-camera/stage micrometers
(demo/large group)
Gel electrophoresis equipment and centrifuge
(demo/large group)

Under the Microscope: The State of Resourcing of Practical Science in Secondary Schools and Sixth-Form Colleges in England
April 2013
114 | P a g e
Chemistry – pre-16
Eye protection
(for every student)
Conical flasks (100ml & 250ml)
(pair work)
Measuring cylinders of various sizes
(pair work)
Spotting/dimple tile
(pair work)
Evaporating basin
(pair work)
Titration equipment (including burette, pipette and pipette filler)
(pair work)
Molecular modelling kit
(pair work)
Ground glass gas syringe
(pair work)
Balance ± 0.1 g (required for core and additional)
(small group work)
Balance ± 0.01 g (required for triple chemistry)
(small group work)
Quick Fit equipment for distillation
(demo/large group)
Heating mantle
(demo/large group)
Equipment for demonstrating the electrolysis products of dilute acid (e.g. a Hoffman
voltammeter)
(demo/large group)
Rock and mineral kit
(demo/large group)
Variety of smart materials
(demo/large group)
Chemistry – post-16
Titration equipment (including burette, pipette and pipette filler)
(for every student)
Volumetric flask (of appropriate size)
(for every student)
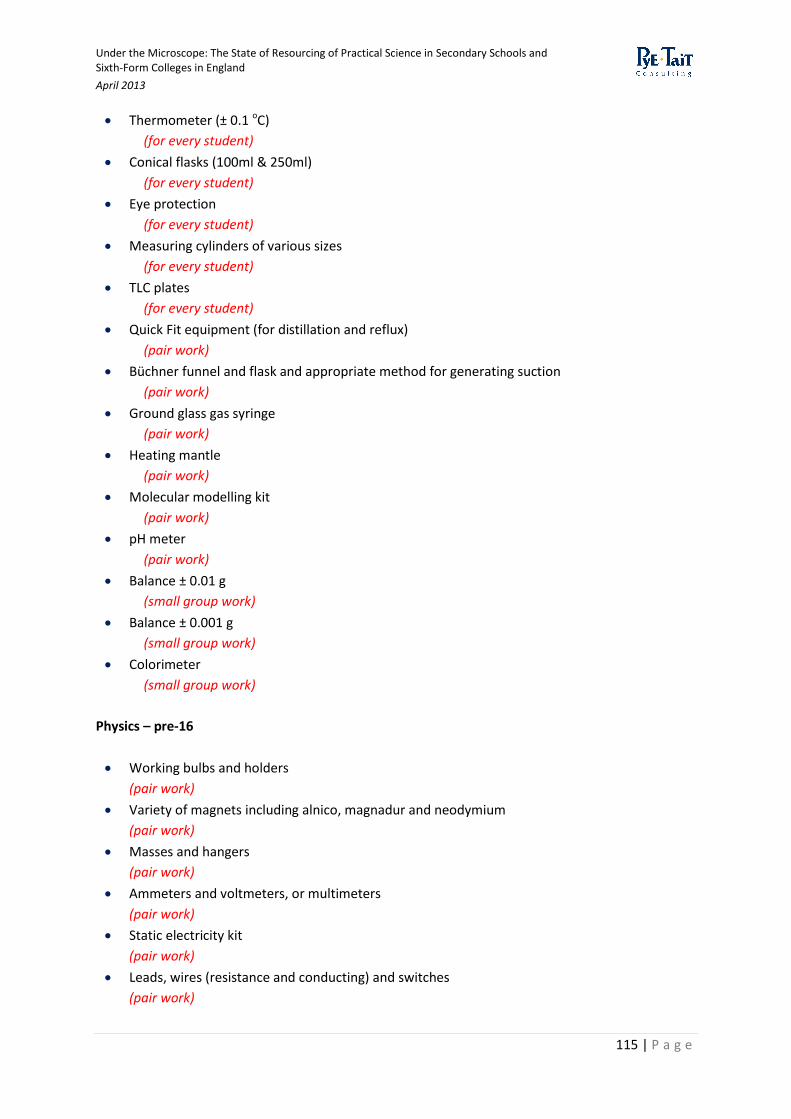
Under the Microscope: The State of Resourcing of Practical Science in Secondary Schools and Sixth-Form Colleges in England
April 2013
115 | P a g e
Thermometer (± 0.1 oC)
(for every student)
Conical flasks (100ml & 250ml)
(for every student)
Eye protection
(for every student)
Measuring cylinders of various sizes
(for every student)
TLC plates
(for every student)
Quick Fit equipment (for distillation and reflux)
(pair work)
Büchner funnel and flask and appropriate method for generating suction
(pair work)
Ground glass gas syringe
(pair work)
Heating mantle
(pair work)
Molecular modelling kit
(pair work)
pH meter
(pair work)
Balance ± 0.01 g
(small group work)
Balance ± 0.001 g
(small group work)
Colorimeter
(small group work)
Physics – pre-16
Working bulbs and holders
(pair work)
Variety of magnets including alnico, magnadur and neodymium
(pair work)
Masses and hangers
(pair work)
Ammeters and voltmeters, or multimeters
(pair work)
Static electricity kit
(pair work)
Leads, wires (resistance and conducting) and switches
(pair work)

Under the Microscope: The State of Resourcing of Practical Science in Secondary Schools and Sixth-Form Colleges in England
April 2013
116 | P a g e
Force meters
(pair work)
Thermistors
(pair work)
LDRs
(pair work)
Ray boxes and accessories
(pair work)
Digital multimeter
(pair work)
Energy meter
(small group work)
UV + infrared kit (sources and detectors)
(small group work)
Tuning forks
(demo/large group)
Variety of springs
(demo/large group)
Slinky for wave demonstrations
(demo/large group)
Light gates and timer
demo/large group)
Signal generator
(demo/large group)
Van der Graaf generator
(demo/large group)
Geiger counter
(demo/large group)
Strong horseshoe magnet (major magnet)
(demo/large group)
Galvanometer
(demo/large group)
Ripple tank
(demo/large group)
Thermal expansion apparatus (e.g. ball & ring)
(demo/large group)
Physics – post-16
Micrometer
(pair work)
Vernier callipers
(pair work)
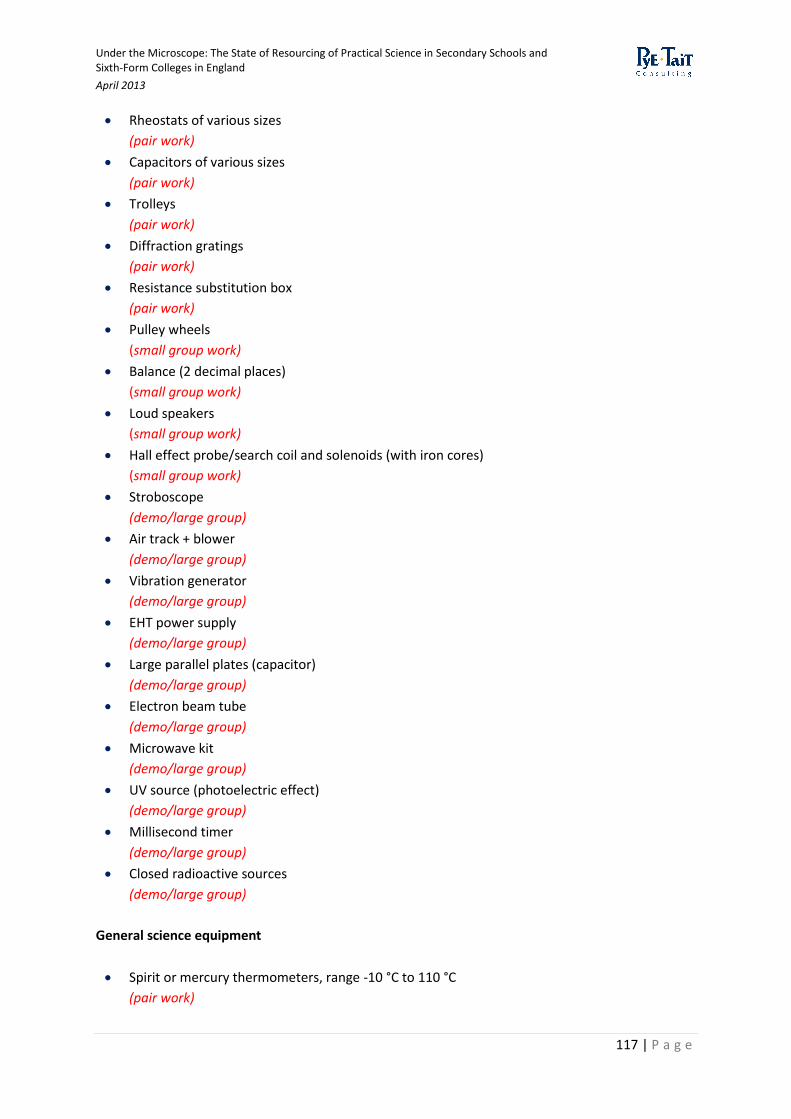
Under the Microscope: The State of Resourcing of Practical Science in Secondary Schools and Sixth-Form Colleges in England
April 2013
117 | P a g e
Rheostats of various sizes
(pair work)
Capacitors of various sizes
(pair work)
Trolleys
(pair work)
Diffraction gratings
(pair work)
Resistance substitution box
(pair work)
Pulley wheels
(small group work)
Balance (2 decimal places)
(small group work)
Loud speakers
(small group work)
Hall effect probe/search coil and solenoids (with iron cores)
(small group work)
Stroboscope
(demo/large group)
Air track + blower
(demo/large group)
Vibration generator
(demo/large group)
EHT power supply
(demo/large group)
Large parallel plates (capacitor)
(demo/large group)
Electron beam tube
(demo/large group)
Microwave kit
(demo/large group)
UV source (photoelectric effect)
(demo/large group)
Millisecond timer
(demo/large group)
Closed radioactive sources
(demo/large group)
General science equipment
Spirit or mercury thermometers, range -10 °C to 110 °C
(pair work)
Under the Microscope: The State of Resourcing of Practical Science in Secondary Schools and Sixth-Form Colleges in England
April 2013
118 | P a g e
Clamps and stands
(pair work)
Metre rulers
(pair work)
Stop watch/stop clock
(pair work)
LV power supply
(pair work)
Crocodile clips
(pair work)
Mirrors
(pair work)
Working batteries
(pair work)
Bathroom scales (in Newtons)
(small group work)
Data logger and computer with range of sensors (e.g. Temperature, pH, sound)
(small group work)
Heated magnetic stirrers
(demo/large group)
Laboratory facilities
Access to gas
Access to water
Access to electricity
Access to dim out
Access to blackout
Sufficient areas for visible class demonstrations and for group work
Working fume cupboard which has access to gas, electricity and water
At post-16, space to leave long term investigations/experiments
Close proximity to preparation room
Good ventilation in chemical storeroom
Security for chemical storeroom
Chemical storeroom accessibility to preparation room
Ducted fume cupboard in preparation room(s) with access to gas, electricity and water
Sufficient storage for all equipment in preparation room(s)
Radioactive storage facilities in preparation room(s)
Sufficient bench space in preparation room(s)
First aid kit in preparation room(s)
Computer, internet connections and telephone in preparation room(s)
Fridge/freezer in preparation room(s)
Dishwasher in preparation room(s)
Under the Microscope: The State of Resourcing of Practical Science in Secondary Schools and Sixth-Form Colleges in England
April 2013
119 | P a g e
Equipment trolley in preparation room(s)
Oven in preparation room(s)
Still-water purification in preparation room(s)
Dispensing jars and bottles in preparation room(s)
Hazard labels, tapes and cards in preparation room(s)
Safeguards in the School Laboratory 11th Edition
Access to outside learning opportunities– pre-16
A pond or other natural water habitat
Trees/hedges
Grassland; not just the school playing field, e.g. for use of quadrats, random sampling, use of
keys (skills).
Outside resource to demonstrate the different properties of rocks (erosion etc.) and to monitor
air quality
Open space for a variety of activities e.g. model the solar system, measure speed, role plays etc.
Functioning renewable energy source (e.g. photovoltaic or wind)
Access to learning opportunities outside the school – post-16
Varied ecology and habitats which are different from those around the school
Research facility for gene technology
Research facility for spectroscopy
Research facility (accelerator)to study particle and/or nuclear physics
Medical physics department in a hospital


![[William J. Croft] Under the Microscope](https://img.pdfslide.net/doc/110x75/577c82ec1a28abe054b2d492/william-j-croft-under-the-microscope.jpg)