Embed Size (px)
Citation preview

Journal of Experimental Botany, Vol. 61, No. 4, pp. 955–967, 2010doi:10.1093/jxb/erp377 Advance Access publication 27 December, 2009
REVIEW PAPER
Under what circumstances can process-based simulationmodels link genotype to phenotype for complex traits? Case-study of fruit and grain quality traits
Nadia Bertin1,*, Pierre Martre2,3, Michel Genard1, Benedicte Quilot4 and Christophe Salon5
1 INRA, UR1115 Plantes et Systemes de Culture Horticoles, F-84 914 Avignon, France2 INRA, UMR1095 Genetique, Diversite et Ecophysiologie des Cereales, F-63 100 Clermont-Ferrand, France3 Universite Blaise Pascal, UMR1095 Genetique, Diversite et Ecophysiologie des Cereales, F-63 100 Clermont-Ferrand, France4 INRA, UR1052 Genetique et Amelioration des Fruits et Legumes, F-84 143 Avignon, France5 INRA, UMR102 Genetique et Ecophysiologie des Legumineuses, F-21 065 Dijon, France
* To whom correspondence should be addressed: E-mail: [email protected]
Received 4 November 2009; Accepted 3 December 2009
Abstract
Detailed information has arisen from research at gene and cell levels, but it is still incomplete in the context of
a quantitative understanding of whole plant physiology. Because of their integrative nature, process-based simulation
models can help to bridge the gap between genotype and phenotype and assist in deconvoluting genotype-by-
environment (G3E) interactions for complex traits. Indeed, G3E interactions are emergent properties of simulationmodels, i.e. unexpected properties generated by complex interconnections between subsystem components and
biological processes. They co-occur in the system with synergistic or antagonistic effects. In this work, different kinds
of G3E interactions are illustrated. Approaches to link model parameters to genes or quantitative trait loci (QTL) are
briefly reviewed. Then the analysis of G3E interactions through simulation models is illustrated with an integrated
model simulation of peach (Prunus persica (L.) Batsch) fruit mass and sweetness, and with a model of wheat (Triticum
aestivum L.) grain yield and protein concentration. This paper suggests that the management of complex traits such as
fruit and grain quality may become possible, thanks to the increasing knowledge concerning the genetic and
environmental regulation of organ size and composition and to the development of models simulating the complexaspects of metabolism and biophysical behaviours at the plant and organ levels.
Key words: Fruit, gene-based model, genotype-by-environment interaction, genotypic parameter, grain, QTL-based model,quality, simulation model.
Introduction
Like many quantitative crop traits, the quality of harvested
organs is a complex issue, which results from many
overlapping physiological processes, genetically and envi-
ronmentally controlled during grain, seed or fruit develop-
ment. Over the last 50 years, yield for various crops has
continuously increased due to genetic and crop management
progresses (Calderini and Slafer, 1998; Cassman, 1999,
2001), but, at the same time, quality attributes have levelledoff or even decreased for numerous products such as cereals
(Oury et al., 2003), grain legumes (Weber and Salon, 2002;
Graham and Vance, 2003), oilseeds (Triboi and Triboi-
Blondel, 2002), fruits for processing (Grandillo et al., 1999)
or fresh fruits (Causse et al., 2003). Thus, a critical question
for the future is how to manage crop quality while
maintaining yield, by finding the best combinations of
genetic resources and cultural practices adapted to, and
respectful of specific environments.
Despite the identification of numerous quantitative traitloci (QTL) for quality traits, and the identification of genes
involved in their control for different species, the genetic
ª The Author [2009]. Published by Oxford University Press [on behalf of the Society for Experimental Biology]. All rights reserved.For Permissions, please e-mail: [email protected]
Downloaded from https://academic.oup.com/jxb/article-abstract/61/4/955/542452by gueston 18 February 2018

improvement of crop quality is still a complicated and
rather slow process. Up to now, few physiological functions
have been clearly ascribed to known gene sequences and, to
date, the huge progress in gene discovery has only weakly
aided genetic selection (Miflin, 2000; Sinclair et al., 2004).
This results at first, from the complexity of most of the
traits of interest and of their sensitivity to the environment.
Secondly, the processes involved are controlled by multipleinteracting genes, which themselves interact with the
environment and crop management (Causse et al., 2007).
For instance, in tomato (Solanum lycopersicum L.) fruit,
more than 100 genes located in 16 regions of the genome,
are associated with fruit composition, mainly sugar and acid
contents (Causse et al., 2004; Bermudez et al., 2008).
Consequently, QTLs for a given trait usually explain only
low proportions of the observed trait variations. Moreover,most of these QTLs depend on the environment and on the
genetic background (Borner et al., 1993; Blanco et al., 2002;
Chaıb et al., 2006; Dudley et al., 2007). This usually results
in strong genotype-by-environment (G3E) or genotype-by-
management interactions, which renders the research in
genetics and their applications for selection complex. As
a consequence, in order to analyse the genetic and
environmental determinants of crop attributes, agronomistsand geneticists often have to perform extensive experiments
over several years at different sites or under different
environmental conditions. Although this approach is still
useful to evaluate QTL stability (Prudent et al., 2009), it is
laborious, expensive, and time-consuming and, thus, it is
often limited to the comparison of a low number of
genotypes and traits conducted under restricted environ-
mental conditions.To overcome these difficulties, several authors have
proposed the use of ecophysiological process-based simula-
tion models for analysing QTL or genotype effects on
different processes and for different species. For example,
this has been done for yield in barley (Hordeum vulgare L.;
Yin et al., 2000), phenological development in soybean
[Glycine max (L.) Merr.; Stewart et al., 2003], leaf elonga-
tion rate in maize (Zea mays L.; Reymond et al., 2003), orfruit quality in peach [Prunus persica (L.) Batsch; Quilot
et al., 2005b]. Different approaches have been proposed to
introduce genetic information into simulation models; they
have been applied successfully to predict the parameter
values of specific gene or allele combinations (Shorter et al.,
1991; White and Hoogenboom, 1996; Yin et al., 1999), to
design new ideotypes adapted to target environments
(Kropff et al., 1995; Tardieu, 2003; Letort et al., 2008), andto analyse G3E interactions (Yin et al., 2005).
All of these studies outlined the possibility of process-
based simulation models for predicting G3E interactions
under a wide range of conditions. They also pointed out the
need for upgraded models, in particular to predict complex
traits, and highlighted the necessity to link model parame-
ters with easily measurable physiological traits and known
QTLs or genes (Yin et al., 2004; Struik et al., 2007).Objectives of this paper were to illustrate how process-
based simulation models can help in bridging the gap
between genotype and phenotype, due to their intrinsic
capacity to mimic complex systems and to integrate multi-
scale levels of controls. How G3E interactions emerge from
process-based simulation models is first outlined, and the
model structure necessary for such analysis is briefly
discussed. Ways to introduce genetic information in these
models are subsequently presented and are illustrated using
fruit size and sweetness, and cereal yield and grain proteinconcentration, as two examples.
Genotype-by-environment interactions areemergent properties of process-basedsimulation models
Process-based simulation models are mathematical surro-
gates, and one of their functions is to describe the
interconnections and feedback regulations between sub-
system components (e.g. organs or tissues) and biological
processes (e.g. photosynthesis or protein synthesis). The
notion of a single limiting factor is thereby replaced by theidea of a sequence and/or network of different limitations
operating through the plant’s life cycle. These interconnec-
tions and feedback regulations among the system compo-
nents generate unexpected global system properties, called
emergent properties, which do not appear when the
subsystems are individually considered (Trewavas, 2006).
G3E interactions are emergent properties of the whole
system in which several processes interact, though they canalso operate at the process level.
At the process level, G3E interactions occur when
expression of the genotypic variation of a process depends
on the environment. Three types of G3E interactions can
be observed (Fig. 1). The first type arises from genotype-
dependent responses to an environmental variable (Fig. 1a).
This is the case of fruit or grain demand for carbon, which
is driven by temperature, but the temperature responsecurve is genotype specific (Lescourret et al., 1998). A more
complex situation, although very frequent in plants, is when
a process does not depend directly on environmental
variables, but on plant variables which themselves depend
on environmental variables. In that case, the response of the
process to the plant variable may be unique whatever the
genotype (Fig. 1b). This is the case of light-saturated
photosynthesis which depends on leaf carbohydrate reservethrough a unique response curve, as shown for peach trees
(Prunus persica L.; Quilot et al., 2002). In such a case,
a G3E interaction arises if the plant variable depends both
on the genotype and on the environment, and the process
intensity varies with the plant variable (Fig. 1b). The third
type of interaction at the process level arises when the
response curve of the process to the plant variable also
depends on the genotype, which allows interactions for thesame reason as in the previous case, but also because the
response of the studied process to the plant variable
depends on the genotype (Fig. 1c). This is the case of leaf
photosynthesis response to leaf nitrogen content in rice
which is genotype dependent, as illustrated in Yin and
956 | Bertin et al.
Downloaded from https://academic.oup.com/jxb/article-abstract/61/4/955/542452by gueston 18 February 2018

Struik (2008). These three types of interactions can act
together in the whole system allowing either the emergence
of strong interactions at the whole system level or the loss
of interactions when several processes respond in an
opposite way to genotype or environmental variations.
Interactions can also emerge at the level of the whole
system. This can best be illustrated with a simple theoretical
model having just two processes, each of them varyinglinearly with an environmental variable without any G3E
interactions (i.e. the slope of the relationship between the
process and the environmental variable is independent of the
genotype; Fig. 2a, b), and where an output (or intermediate)
variable is the product of these two processes. If, for at least
one of these two processes, the y-intercept of the relationship
depends on the genotype, then the output (or intermediate)
variable varies non-linearly in response to environmentalvariations, and as a consequence, a G3E interaction emerges
at the whole system level (Fig. 2c).
Which models and which parameters to linkgenotype to phenotype?
Some mechanistic models to integrate physiologicalknowledge
Most growth simulation models currently used were origi-
nally developed for agronomic applications. These models
were constructed using empirical response curves or laws
describing the relationship between plant growth and
environmental conditions and management practices (e.g.N dilution curve; Lemaire and Gastal, 1997). Although
these process-control oriented models are robust, they are
less plastic than real plants, hence restricting their capabilities
to accurately represent the wide range of plant responses to
environmental and genetic variations.
Predicting complex issues such as product quality traits in
relation to G3E interactions, requires the design of mecha-
nistic models: such models have to describe physiologicalprocesses and their response to variations in environmental
conditions, to allow physiological feedback features and the
integration of information from different organizational
levels, for instance from cell to organ (Struik et al., 2005;
Genard et al., 2007). According to Chapman et al. (2003),
models need to produce emergent properties, i.e. they should
be able to handle perturbations to any process and self-
correct, as do real plants. As stated by these authors, thisphilosophy of modelling the principles of responses and
feedbacks infers that models should be able to express
complex behaviours. Such models of fruit and seed or grain
quality have been developed over the last decade. Their
current state has recently been reviewed (van Ittersum and
Donatelli, 2003; Bertin et al., 2006; Martre et al., 2009): for
Pro
cess
Plant variable
(b)
G1 G2E1
G1 G2E2
Pro
cess
Environmental variable
Genotype 1
Genotype 2
(a)
E1 E2
Pro
cess
Plant variable
(c)
G1 G2E1
G1 G2E2
Fig. 1. Schematic representation of three types of genotype (G) by
environment (E) interactions at the process level. (a) Direct G3E
interactions, i.e. the response of the process to environmental
variations depends on the genotype. The process may not depend
directly on the environment but on a plant variable. The response
of the process to the plant variable may be unique whatever the
genotype (b). In that case, a genotype-by-environment interaction
is observed if the process varies with the plant variable which itself
depends on G3E interactions. The third type of interactions occurs
when the response curve of the process to the plant variable also
depends on the genotype (c), which allows interactions for the
same reasons than in (b), but also because the response of the
process to the plant variable depends on the genotype.
From genotype to phenotype through simulation models | 957
Downloaded from https://academic.oup.com/jxb/article-abstract/61/4/955/542452by gueston 18 February 2018

wheat and seeds, they focus on size and protein concentra-
tion and composition (e.g. starch, gluten-forming proteins,
albumin proteins), which are the most important criterion
determining the end-use value of the product. For fresh
fruits, models of quality describe the main processes control-
ling fruit size, and sugar and acid composition, which are
largely involved in flavour perception. In these models, the
environment is characterized through the measurement ofenvironmental variables (temperature, light, humidity, min-
eral nutrient availability etc), and the plant is characterized
by developmental variables (date of flowering and number of
flowering nodes etc), growth variables (biomass, amount of
retrieved nitrogen etc) and metabolic variables (respiration,
sugar synthesis etc).
In such mechanistic models, it is now possible to link
model parameters with physiological traits or process andto link them with loci or genes. Below, the constraints on
model parameters are defined. The relatively low number of
parameters (a few tens to a couple of hundreds in most
simulation models) in comparison with the 20 000 to 40 000
genes of a plant can be explained by the co-ordinated action
of groups of genes, and the lower effect of a gene expression
when it is replaced in its metabolic pathway, at the cell,
organ or plant level (Salon and Vance, 2004, Fernie et al.,2005). The set of interconnected processes controlled by
such a group of genes was defined by Tardieu (2003) as
‘meta-mechanism’.
Genotypic and generic parameters of simulation models
Though plant traits are generally dependent on genotype,
environment, and management, the parameters of theequations describing these meta-mechanisms are, ideally,
independent of the environment and management. One can
distinguish two types of parameters in a process-based
simulation model: the genotypic parameters and the generic
parameters. Generic parameters do not significantly vary
among genotypes, or even among species. As such, in the
peach growth model (Quilot et al., 2002), the light-saturated
photosynthesis which determines the maximum dry matteraccumulation is a generic parameter since it does not vary
among peach genotypes and even seems stable in the Prunus
genus. By contrast, genotypic parameters (also called
genetic coefficients) are model parameters, (i) of which
values show a significant range of variation among the
studied genotypes, and (ii) which have significant influences
on model outputs (Boote et al., 2001), and thus are likely to
induce changes in important emergent properties. The set ofgenotypic parameters defining a particular genotype repre-
sents a phenotypic fingerprint of this genotype. To be con-
sidered as a ‘good’ genotypic parameter, a model parameter
must be precisely estimated and, ideally, with low labour
cost to be estimated on a large number of genotypes. It
should be process-based and, ideally, the availability of
mutants for this parameter would allow the validation of its
theoretical variations in the model. Examples of ‘good’genotypic parameters are illustrated later.
Environmental variable
Qua
lity
trai
t yP
roce
ss h
Pro
cess
f
Genotype 1
Genotype 2
(a)
(b)
(c)
E1 E2
Fig. 2. Schematic representation of G3E interactions at the whole
system level. A simple system with two processes, f (a) and h (b),
is considered. These two processes vary linearly with the
environment (E), and depend on the genotype without any G3E
interaction. The variations of f and h are described by the following
equations: f(E,G)¼aE+g1(G) and h(E, G)¼bE+g2(G) where a and bare two generic (constant) parameters, and g1(G) and g2(G) are
two parameters which depend on the genotype. A quality variable
(y) which depends on these two processes according to the
equation: y¼f(E,G)3h(E,G), is considered (c). y responds
non-linearly to variations of the environmental variable and
a G3E interaction emerges at the whole system level.
958 | Bertin et al.
Downloaded from https://academic.oup.com/jxb/article-abstract/61/4/955/542452by gueston 18 February 2018

Sensitivity analysis of the model to its parameters can
help in identifying important genotypic parameters, and
their putative effects under different climate and manage-
ment practices. Sensitivity analysis of the peach growth
model followed by the analysis of the variation among
genotypes in the values of the most important parameters,
showed that among the 40 parameters of this model, only
10 are genotypic key parameters (Quilot et al., 2005a).
From genotype to phenotype
Making links between model parameters and genes or QTLs,
implies that the model captures sufficient details and physio-
logical functionalities, necessary to simulate the expression
of single genes or a gene network. Several attempts and
approaches have been proposed to include genetic informa-tion into process-based models and to go from genome to
organ (Reymond et al., 2003), plant (Quilot et al., 2005b) or
crop (White and Hoogenboom, 1996; Chapman et al., 2003).
These approaches are briefly reviewed below.
Gene-based modelling
Because genotypic parameters are independent of the
environment, one can theoretically predict their value
knowing the genotype. On this basis, genetic information
can be integrated into simulation models. The phenotype
can then be simulated in silico under various environmentaland management conditions. This approach was pioneered
by White and Hoogenboom (1996) and Hoogenboom and
White (2003) who replaced genotypic parameters of the
BEANGRO simulation model for common bean (Phaseolus
vulgaris L.) by linear functions describing the effect of eight
genes affecting phenology (ppd, Hr, and Tip), growth habit
(Fin and Fd) and seed size (Ssz-1, Ssz-2, and Ssz-3). The
genotypes of 30 common bean cultivars were determined forthese genes, with two alleles for each gene, one dominant
(coded 1) and the other one recessive (coded 0). The new
model, GeneGro, simulated growth and development as
well as BEANGRO, and could even simulate new G3E
interactions, providing major simplifications since the 30
genotypic parameters of the BEANGRO model were
replaced by only eight binary coefficients, the eight loci. As
pointed out by these authors, the genotypes can usually bedetermined more precisely by these coefficients than by
field-determined genotypic parameters, so gene-based mod-
els should also reduce uncertainties in the calibration of
simulation models and facilitate model calibration for new
genotypes. This approach has recently been included into
the soybean simulation model CROPGRO-soybean to
characterize the effect of six loci on growth and develop-
ment, using a set of isogenic lines (Messina et al., 2006).These studies suggest that only a few genes need to be
characterized in order to simulate genetic variations and
G3E interactions for complex traits such as seed size,
challenging the current view that quantitative traits have
polygenic inheritance. However, the genes included in the
BEANGRO and CROPGRO-soybean models may repre-
sent the action of co-regulated groups of genes and thus
they are similar to estimates of QTL. Indeed the three
hypothetical genes controlling seed size for common bean
introduced in GenGro were mainly inferred from QTL
studies. The next steps would be to simulate the regulation
of gene expression(s) and the effects of genes at the process
level rather than through cultivar coefficients.When a trait is controlled by a low number of major
genes, bottom-up modelling of a gene network can also be
attempted. Such an approach has been successfully used to
model flowering time (Welch et al., 2003, 2004) and cell cycle
and expansion in leaves (Beemster et al., 2006) for Arabidop-
sis [Arabidopsis thaliana (L.) Heynh.], but it has not been
applied to fruit or grain quality traits yet. Although gene
networks have the potential for becoming overly complex,there is probably no need to model full networks, as it should
be possible to extract simple rules which could capture the
effects of major genes involved in the network.
Currently, the strongest limitation to develop a gene-
based model for complex traits, is the lack of knowledge
and characterization of specific genes or loci controlling
these traits, including epistatic interactions and pleiotropic
effects, to define the phenotypic fingerprint of cultivars forgenotypic parameters. Moreover, detailed studies to quan-
tify the environmental effects on gene expression and gene
action are also required.
QTL-based modelling
In the absence of information on specific genes or loci, QTL
analysis can be performed on model parameters considered
as quantitative physiological traits. Then, for each genotype
of a mapping population, the values of genotypic parame-
ters can thus be predicted based on the allelic composition
at the molecular markers flanking the QTLs, taking into
account interactions between alleles and among QTLs
(dominance, additivity, and epistasis). This approach waspioneered by Yin et al. (1999, 2000), who recalculated the
value of 10 genotypic parameters of the SYP-BL simulation
model for barley, related to crop growth. The major
weakness of this approach was the ability of the original
model to simulate observed variations. This work has been
extended to barley (Yin et al., 2005) and rice (Oryza sativa
L.; Nakagawa et al., 2005) phenology. The QTL-based
models were able to simulate the phenology of recombinantinbred lines in new environments. QTL-based models were
also developed to analyse the genetic variability of leaf
elongation rate for maize in response to temperature and
soil water deficit (Reymond et al., 2003, 2004). In these
studies, a simple static model based on response curves of
leaf elongation rate to temperature, vapour pressure deficit,
and soil water potential was used. Thirteen maize lines
grown under six contrasted environments were used asmaterial for validating the model, which accounted for 74%
of the genetic and environmental variations of leaf elonga-
tion rate (Reymond et al., 2004).
More recently, this approach was extended to peach
fruit quality. Based on the sensitivity analysis of the virtual
From genotype to phenotype through simulation models | 959
Downloaded from https://academic.oup.com/jxb/article-abstract/61/4/955/542452by gueston 18 February 2018
peach fruit model and the analysis of the variation among
139 genotypes in the values of the most important
parameters (Quilot et al., 2005a), 10 genotypic parameters
which strongly affect fruit growth and sugar accumulation
were selected among the 40 parameters of the model, for
a QTL analysis (Quilot et al., 2005b). These genotypic
parameters were substituted in the simulation model by the
sum of QTL effects. The model was then able to accountfor a large part of the genetic and environmental varia-
tions in fruit size (observed and predicted values of fruit
dry mass showed a correlation coefficient of 0.55). In this
example, the QTL analysis of the genotypic parameters
gave some insight on the processes that control quality
traits, as they co-localized on the genetic map with QTLs
for fruit size and sugar content. This suggests putative
physiological interpretations of the functions of genesunder these QTLs. For instance on the linkage groups 1
and 7 of the peach genetic map, QTLs for fruit fresh mass
were located at the same regions as QTLs for genetic
coefficients involved in sugar metabolism, pulp carbon
growth, and in and out water fluxes in the fruit (Quilot
et al., 2005b).
Analysis of G3E interactions throughprocess-based simulation models: case-study of fruit and grain quality traits
The significance of process-based simulation models of
quality traits can be exemplified through the analysis of
both genotypic and environmental effects, using two in-
tegrated models of quality, one for peach fruit and the other
for wheat grain.
Predicting peach fruit size and sweetness index inresponse to tree management and genetic variationsunder variable environmental conditions
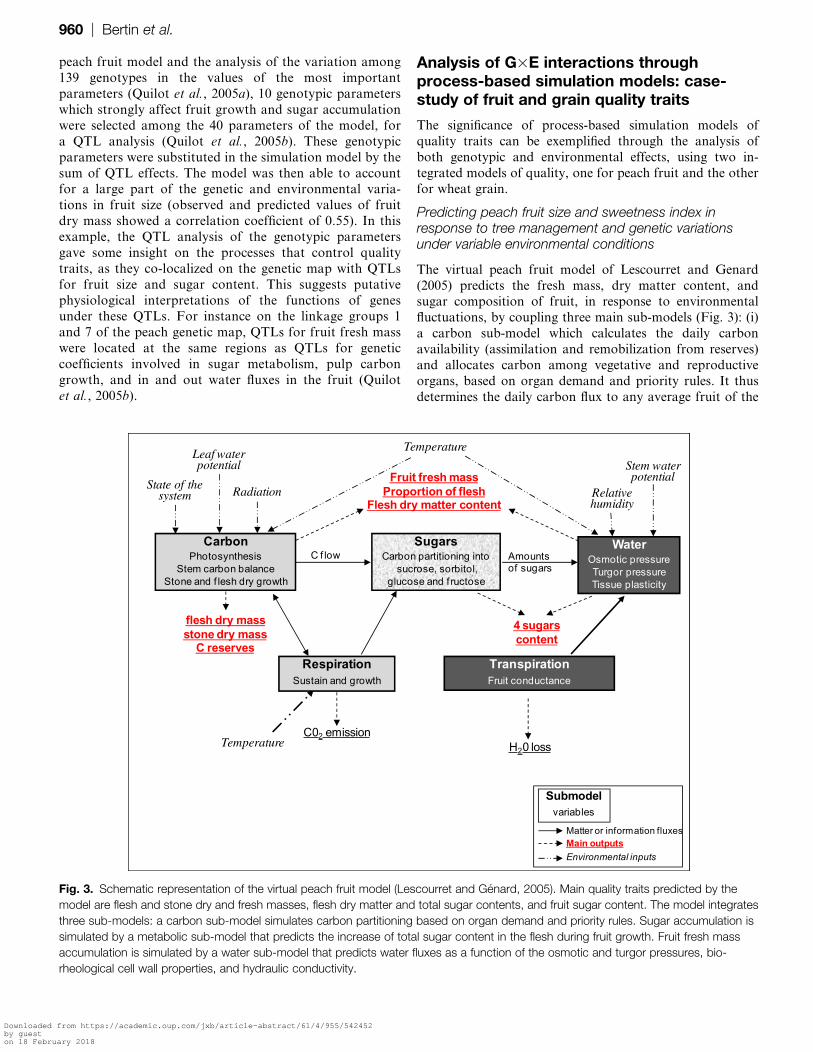
The virtual peach fruit model of Lescourret and Genard
(2005) predicts the fresh mass, dry matter content, andsugar composition of fruit, in response to environmental
fluctuations, by coupling three main sub-models (Fig. 3): (i)
a carbon sub-model which calculates the daily carbon
availability (assimilation and remobilization from reserves)
and allocates carbon among vegetative and reproductive
organs, based on organ demand and priority rules. It thus
determines the daily carbon flux to any average fruit of the
Relativehumidity
C f low
H20 loss
Fruit fresh massProportion of flesh
Flesh dry matter content
4 sugarscontent
C02 emission
flesh dry massstone dry mass
C reserves
Temperature
Temperature
CarbonPhotosynthesis
Stem carbon balanceStone and f lesh dry growth
Radiation
Leaf water potential
State of the system
WaterOsmotic pressureTurgor pressureTissue plasticity
Stem water potential
SugarsCarbon partitioning into
sucrose, sorbitol, glucose and f ructose
Amounts of sugars
RespirationSustain and growth
TranspirationFruit conductance
Matter or information fluxesMain outputsEnvironmental inputs
Submodelvariables
Fig. 3. Schematic representation of the virtual peach fruit model (Lescourret and Genard, 2005). Main quality traits predicted by the
model are flesh and stone dry and fresh masses, flesh dry matter and total sugar contents, and fruit sugar content. The model integrates
three sub-models: a carbon sub-model simulates carbon partitioning based on organ demand and priority rules. Sugar accumulation is
simulated by a metabolic sub-model that predicts the increase of total sugar content in the flesh during fruit growth. Fruit fresh mass
accumulation is simulated by a water sub-model that predicts water fluxes as a function of the osmotic and turgor pressures, bio-
rheological cell wall properties, and hydraulic conductivity.
960 | Bertin et al.
Downloaded from https://academic.oup.com/jxb/article-abstract/61/4/955/542452by gueston 18 February 2018

stem; (ii) the SUGAR model (Genard and Souty, 1996;
Genard et al., 2003) which uses this daily influx of carbon as
input to simulate the metabolic transformations among
respired CO2, individual sugar metabolism (sucrose, sorbi-
tol, glucose, and fructose) and other compounds (structural
carbohydrates); (iii) a water sub-model (Fishman and
Genard, 1998) that predicts the water fluxes and tissue
expansion as a function of the osmotic and turgor pressures,bio-rheological cell wall properties, and hydraulic conduc-
tivity. The fruit osmotic pressure is calculated from sugar
content and composition simulated by the SUGAR sub-
model. The rules of communication among the three sub-
models are detailed in Lescourret and Genard (2005). The
model predicts fairly well the fruit fresh and sweetness index
in response to wide ranges of tree management practices
(leaf to fruit ratio) and environmental conditions (year; Fig.4a, b). As experimentally observed by Genard et al. (2003),
under low fruit-to-leaf ratios the model predicts that fruit
sugar content increases with fruit size. The simulated
sweetness was slightly underestimated for the sweetest
fruits, hypothetically because of an over-simplified descrip-
tion of carbon metabolism in the SUGAR model.
The ability of the virtual peach fruit model to simulate
genetic variations of fruit quality has been investigated for
a mapping population of 139 hybrid lines (Fig. 4c, d). Ten
genotypic parameters have been assessed for each line
(Quilot et al., 2005a). They allowed 95% and 52%, re-
spectively, of the observed genetic variations in fruit fresh
mass and sweetness index to be explained.
Considering the ability of such models to simulate theeffects of crop management or genetic variations, they can
be used to analyse virtual variations in the system. Let us
consider ten virtual genotypes differing by a single geno-
typic trait involved in carbon allocation among sink organs,
i.e. their potential fruit dry mass which ranged from 10 g to
100 g. This parameter is positively linked to the individual
fruit demand (equation 1 in Lescourret and Genard, 2005).
The environment was manipulated through plant manage-ment, i.e fruit pruning, which varied from 1 to 10 fruits per
branch. This factor affects the level of competition among
growing sinks as the carbon available for growth has to be
shared among individual fruits. The model was run for the
100 combinations of these two factors, and simulations of
fruit fresh mass and sweetness at harvest were analysed. The
0
50
100
150
200
250
300
0 50 100 150 200 250 300
Sim
ulat
ed F
resh
wei
ght (
g)
Observed Fresh weight (g)
(a)
R2=0.95Slope = 0.90RRMSE = 0.13
0
50
100
150
200
250
300
350
0 50 100 150 200 250 300 350
Sim
ulat
ed F
resh
wei
ght (
g)
Observed Fresh weight (g)
(c)
R2=0.95Slope = 0.99RRMSE = 0.08
0
5
10
15
20
0 5 10 15 20
Sim
ulat
ed S
wee
tnes
s (%
)
Observed Sweetness (%)
(d)
R2=0.52Slope = 0.66RRMSE = 0.18
0
3
6
9
12
0 3 6 9 12
Sim
ulat
ed S
wee
tnes
s (%
)
Observed Sweetness (%)
(b)
R2=0.61Slope = 0.58RRMSE = 0.15
Fig. 4. Predicted values at maturity plotted against corresponding observed values for fresh fruit mass (a, c) and sweetness index (b, d)
collected in different experiments on peach fruit exploring the crop management (a, b) and genetic (c, d) variability. (a, b) Data (cv.
Suncrest) represent individual fruits sampled on experiments carried out over three years and at different leaf-to-fruit ratios. Simulations
were performed with a single set of parameters given in Lescourret and Genard (2005). (c, d) Data represent mean fruit value over five
fruits for 139 hybrid lines of a mapping population obtained from the second backcross of an interspecific Prunus persica L.
(Batsch)3Prunus davidiana cross. Simulations were performed considering 10 genotypic parameters (Quilot et al., 2005a). Statistics
concern the linear regression between observed and simulated data. RRMSE indicates the relative root mean squared error. Solid lines
are y¼x.
From genotype to phenotype through simulation models | 961
Downloaded from https://academic.oup.com/jxb/article-abstract/61/4/955/542452by gueston 18 February 2018

model predicted a significant management-by-genotype in-
teraction (Fig. 5) emerging from multiple interactions
among the processes involved in both traits, as more simply
illustrated in Fig, 2 for two processes. These interactions
induced a cascade of effects, including feedback effects
which cannot be intuitively predicted. Finally, fruit fresh
mass and fruit sweetness differently responded to fruit load
according to the potential dry mass. In good agreementwith observed data (Johnson and Handley, 1989), these
simulations clearly show that accurate management of fruit
load is essential for genotypes with high fruit size potential
to avoid any detrimental effects on quality. Moreover,
the behaviour of intermediate variables of the model could
help us to understand the physiological causes of such
interactions.
Both the fruit mass and fruit sweetness (deduced fromindividual sugar contents) can be affected by changes in the
carbon and water balances. In the case of low potential
genotypes, fruit mass was limited by the demand whatever
the number of fruits per shoot. The carbon flow, intermedi-
ate variable between the CARBON and SUGAR sub-
models (Fig. 3) was unchanged, as well as the sugar
accumulation, resulting osmotic pressure, and water influx.
Thus, the fruit sweetness remained independent of fruit load.
This was observed for genotypes with a potential fruit dry
mass up to 30 g. For genotypes with higher fruit potential
dry mass, both traits decreased as fruit load increased, andfruit growth was limited by the carbon supply. Conse-
quently, the carbon flow to individual fruits and thus the
accumulation of sugars decreased, as well as the osmotic
pressure. This contributed to reduce the fruit mass in the
WATER sub-model, which could be expected to attenuate
the decrease in sweetness resulting from low sugar accumu-
lation, by limiting the dilution effect. However, the absence
of proportionality among all these processes and thenumerous feedback effects made it difficult to analyse this
response quantitatively. For instance, the slope break of
the sweetness curve observed at a fruit load around 6–7
fruits per branch is difficult to explain, as many factors
might be involved, such as transpiration, osmotic regula-
tion, carbon partitioning between structural and soluble
compounds etc.
This example emphasizes that capturing and unravellingthe cascade of effects behind complex behaviours is not
obvious, because numerous feedback effects and interac-
tions among the physiological processes occur during fruit
development. This example also illustrates how unexpected
behaviours of complex systems can be predicted and
analysed by process-based simulation models. Such simula-
tion analysis can help in selecting the management (fruit
thinning) best adapted to particular genotypes to meetspecific objectives of yield and quality. Then, the main
question is ‘can we trust the model?’ The virtual fruit model
and its sub-models have been published and evaluated
before (Fishman and Genard, 1998; Genard et al., 1998,
2003; Lescourret et al., 1998; Quilot et al., 2002; Lescourret
and Genard, 2005). Moreover, the predicted responses are
in agreement with previous experimental observations
(Johnson and Handley, 1989; Genard et al., 2003).
Predicting wheat grain yield and protein concentrationin response to crop management and genetic variationsunder variable environmental conditions
The wheat simulation model SiriusQuality1 has been de-
veloped to analyse the responses of wheat crops to both
environmental and genetic variations (Martre et al., 2006),
it is based on the crop simulation model Sirius (Jamieson
et al., 1998; Jamieson and Semenov, 2000). It consists of
several sub-models describing soil water and nitrogen
balances and crop development, canopy expansion, bio-
mass, and N accumulation and partitioning, includingresponses to shortages in the supply of soil water and
nitrogen (Fig. 6). Canopy development is simulated as
a series of leaf layers associated with individual main stem
leaves, and tiller production is simulated through the
potential size of any layer. Each leaf layer within the
50
100
150
200
250
0 1 2 3 4 5 6 7 8 9 10
Fru
it m
ass
(g fr
uit-1
)
(a)
High potential genotypes
Low potential genotypes
3
4
5
6
7
8
9
10
11
0 1 2 3 4 5 6 7 8 9 10
Fru
it sw
eetn
ess
(%)
Number of fruits per shoot
(b)High potential genotypes
Low potential genotypes
Fig. 5. Changes in simulated fruit mass (a) and sweetness (b) in
response to modifications of the number of fruits per shoot. The
different lines represent model simulations for ten virtual genotypes
with an increasing potential fruit dry mass from low (10 g) to high
(100 g). Simulations were performed with the virtual peach fruit
model described by Lescourret and Genard (2005) for represen-
tative climatic conditions for south-east France.
962 | Bertin et al.
Downloaded from https://academic.oup.com/jxb/article-abstract/61/4/955/542452by gueston 18 February 2018

canopy intercepts light and uses it to produce biomass at an
efficiency calculated from temperature, CO2 concentration,
soil water status, and the ratio of diffuse to direct radiation.
Carbon and nitrogen allocation within the plant is thencalculated as a function of resource (light, nitrogen, and
water) availability using simple priority rules. After anthe-
sis, the translocation of carbon and nitrogen to grains is
first driven by the division of the endosperm cell, then,
during the linear period of grain filling, it mainly results
from the accumulation of starch and storage proteins
(Martre et al., 2006). As illustrated in Fig. 6, the allocation
of carbon and nitrogen to the different plant organs resultsfrom several interrelated feedback regulations. This model
has been calibrated and evaluated for several modern wheat
cultivars and tested in many environments and climates,
including conditions of climate change (Jamieson et al.,
1998, 2000; Jamieson and Semenov, 2000; Martre et al.,
2006). The ability of SiriusQuality1 to simulate grain yield,
nitrogen yield, and protein concentration variations for
both bread wheat and durum wheat (T. turgidum L. subsp.
durum (Desf.) Husn.) in response to crop management (e.g.
sowing date and N fertilization) and environmental con-
ditions (e.g. temperature and water supply) is illustrated in
Fig. 7.This model was used to analyse the effects on bread
wheat (Triticum aestivum L.) grain yield and protein
concentration of interactions between the environment and
a genotypic trait, i.e. the maximum stem nitrogen concen-
tration, which was decreased or increased by 30% compared
to its default value. The nitrogen storage capacity of the
stem is an important trait determining wheat nitrogen use
efficiency and grain protein concentration (Foulkes et al.,1998). In a wheat crop, at anthesis approximately 50% of
total crop nitrogen is stored in the stem and over 80% of
this nitrogen is translocated to the grain during the grain-
filling period. Environmental variations were taken into
account by performing the analysis for 100 years of weather
at three different sites representing the diversity of the
climate in the European wheat growing areas and at two
nitrogen supplies (Fig. 8).
Fig. 6. Simplified schematic representation of the wheat simulation model SiriusQuality1 (Martre et al., 2006) showing the main variables,
influences, and feedbacks. AGDM, average grain dry mass; ANT, anthesis; DM, dry matter; N, nitrogen; Eact, actual evapotranspiration;
Epot, potential evapotranspiration; ET, evapotranspiration; LAI, leaf area index; LUE, light use efficiency; maxStem[N], maximum stem
nitrogen concentration; minStem[N], minimum stem nitrogen concentration; PAR, photosynthetically active radiation; SLN, leaf nitrogen
mass per unit of leaf surface area; SLW, leaf dry mass per unit of leaf surface area.
From genotype to phenotype through simulation models | 963
Downloaded from https://academic.oup.com/jxb/article-abstract/61/4/955/542452by gueston 18 February 2018

At high nitrogen supply (Fig. 8a, c, e), a decrease in the
stem nitrogen concentration lessened the protein concentra-
tion without reducing the grain yield, except for the driest
years at Seville where water deficit severally reduced grain
yield (Fig. 8e). Therefore, under high nitrogen inputs,changing the nitrogen storage capacity of the stem may
significantly shift the negative relationship between grain
yield and protein concentration under most European
weather conditions (Martre et al., 2007). In contrast, at low
nitrogen supply (Fig. 8b, d, f), changes in grain protein
concentration in response to variations of the stem nitrogenstorage capacity depended on the year, independently of the
0,0
0,2
0,4
0,6
0,8
1,0
1,2
1,4
0,0 0,2 0,4 0,6 0,8 1,0 1,2 1,4
Sim
ulat
ed g
rain
yie
ld (k
g m
-2)
Observedgrain yield (kg m-2)
1994, bread wheat, N1994, bread wheat, temperature1998, bread wheat, temperature x water2003, durum wheat, sowing date x N2005, durum wheat, sowing date x N
(a)
R2=0.90Slope = 0.99RRMSE = 0.11
0
5
10
15
20
25
30
0 5 10 15 20 25 30
Sim
ulat
ed g
rain
N (g
m-2
)
Observedgrain N (g m-2)
(b)
R2=0.93Slope = 1.00RRMSE = 0.11
0
3
6
9
12
15
18
0 3 6 9 12 15 18
Sim
ulat
ed g
rain
pro
tein
(%dm
)
Observedgrain protein (% dry mass)
(c)
R2=0.85Slope = 0.77RRMSE = 0.08
Fig. 7. Simulated versus observed grain dry mass yield (a),
nitrogen yield (b), and protein concentration (c) for crops of bread
and durum wheat grown in the field with different sowing dates
(November to January) and rates of nitrogen fertilization (0–180 g
N m�2) or under semi-controlled conditions with different post-
anthesis temperature (14–25 �C) and water supply (13–235 mm).
Observed data are means for n¼3 independent replicates.
Statistics concern the linear regression between observed and
simulated data. RRMSE indicates the relative root mean squared
error. Solid lines are y¼x.
0.2 0.4 0.6 0.8 1.0 1.2
Grain yield (kg m-2)
0.2 0.4 0.6 0.8 1.0 1.2-15
-10
-5
0
5
10
15
20Cha
nges
in g
rain
pro
tein
(%
of d
ry m
ass)
-15
-10
-5
0
5
10
15
20
(b)
(d)
(f)
-15
-10
-5
0
5
10
15
20
(a)
(c)
(e)
High N Low N
Fig. 8. Changes in grain protein concentration versus grain yield in
response to changes in stem nitrogen storage capacity simulated
with the wheat simulation model SiriusQuality1 for the winter wheat
cultivar Thesee grown at Clermont-Ferrand, France (A, B), the
winter wheat cultivar Avalon grown at Rothamsted, UK (C, D), and
the spring wheat cultivar Cartaya grown at Seville, Spain (E, F) for
100 years of synthetic weather, generated using the LARS-WG
stochastic weather generator, under high (A, C, E) and low (B, D,
F) nitrogen supplies. For the high and low nitrogen treatments the
crops received 250 and 80 kg N ha�1 of nitrogen fertilizer,
respectively, at specific developmental stages as described by
Martre et al. (2007). The maximum stem nitrogen concentration
was decreased (open circles) or increased (closed circles) by 30%
from its default value of 10 mg N g�1 DM. This range of variation
encompasses the observed genetic range of variations of stem
nitrogen storage capacity for bread wheat (Triboi and Ollier, 1991).
Details of the soil and cultivar characteristics for Clermont-Ferrand
are given in Martre et al. (2007) and for Rothamsted and Seville in
Semenov et al. (2007). The cultivars used at the different sites are
adapted to the local climate.
964 | Bertin et al.
Downloaded from https://academic.oup.com/jxb/article-abstract/61/4/955/542452by gueston 18 February 2018

grain yield, and, on average, it had no strong effect on grain
protein concentration. The response of the grain protein
concentration under low nitrogen supply clearly illustrates
the power of a system analysis based on simulations, since
such G3E interactions may be difficult to capture in the
field under a restricted number of environmental conditions.
These two examples illustrate the potential of process-
based simulation models to analyse (i) the effect of simplephysiological parameters on complex traits using a system
approach, and (ii) the interactions among the system
components. However, some care is required when using
crop simulation models to assess the effects of a particular
trait, since the ability of a model to predict subtle G3E
interactions depends on the simplifications and assumptions
made in the model (Boote et al., 2001). On the other hand,
simulation models allow us to focus on the most importantaspects of the physiology and to reveal complex interactions
that were not intuitive.
Outlook
Recent advances in our knowledge of the genetic, environ-
mental, and management control of harvested organ size
and composition have led to the suggestion that their
phenotypic control will become a real possibility in the near
future. Several process-based simulation models are now
able to predict some quality traits of crop production as
a function of genotype and environment, and thus theycould be used to take a first step towards the analysis of
G3E interactions. However, to go further in this analysis, it
is still necessary to enlarge the ability of the model to
simulate the complexity of plant and organ functioning.
Indeed, most of the current models are restricted to the
description of phenology, growth, and carbon–nitrogen–
water balance at the plant or crop level. There is an urgent
need for models that are able to simulate important aspectsof metabolism and biophysical behaviour at the plant and
organ levels (Struik et al., 2005, 2007; Genard et al., 2007).
Great attention should be paid to the uncertainty of
model inputs, for instance, soil characteristics (including
their spatial heterogeneity) or plant endogenous variables,
when using simulation models to analyse the effect of
genetic variations. Indeed, changes in yield or quality traits
in response to genetic variations are often relatively smalland the uncertainty in model inputs may limit the use of
simulation models in predicting quantitatively the pheno-
type from the genotype.
The gap between detailed information emerging from
sciences at the gene and cell levels and the quantitative
understanding of the whole plant physiology is still large.
Models can provide a platform that can accommodate new
advances in this field science (Di Ventura et al., 2006). But,concomitantly to the development of process-based simula-
tion models, more information is needed on the genetic
control of the processes described in these models. In
particular, quantitative data are still lacking to understand
how gene actions are coordinated during plant develop-
ment, and in response to environmental signals. Adequate
data sets, with time series during fruit or grain filling and
adequate description and characterization of the growing
conditions and the genotypes are required. The production
of isogenic lines or mutants, which may be experimentally
described under well characterized environments, will play
an important role for unravelling the physiological pro-
cesses and G3E interactions involved in the control ofquality traits.
Acknowledgements
This work was funded and carried out under the ‘Environmen-
tal determinism of harvested organ quality’ research network
from INRA, Division of Environment and Agronomy.
References
Beemster GTS, Vercruysse S, De Veylder L, Kuiper M, Inze D.
2006. The arabidopsis leaf as a model system for investigating the role
of cell cycle regulation in organ growth. Journal of Plant Research 119,
43–50.
Bermudez L, Urias U, Milstein D, Kamenetzky L, Asis R,
Fernie AR, Van Sluys MA, Carrari F, Rossi M. 2008. A candidate
gene survey of quantitative trait loci affecting chemical composition in
tomato fruit. Journal of Experimental Botany 59, 2875–2890.
Bertin N, Bussieres P, Genard M. 2006. Ecophysiological models of
fruit quality: a challenge for peach and tomato. Acta Horticulturae 718,
633–645.
Blanco A, Pasqualone A, Troccoli A, Di Fonzo N, Simeone R.
2002. Detection of grain protien QTLs across environments in
tetraploid wheats. Plant Molecular Biology 48, 615–623.
Boote KJ, Kropff MJ, Bindraban PS. 2001. Physiology and
modelling of traits in crop plants: Implications for genetic improvement.
Agricultural Systems 70, 395–420.
Borner A, Worland AJ, Plaschke J, Schumann E, Law CN. 1993.
Pleiotropic effects of genes for reduced height (rht) and daylength
insensitivity (ppd) on yield and its components for wheat grown in
middle europe. Plant Breeding 111, 204–216.
Calderini DF, Slafer GA. 1998. Changes in yield and yield stability in
wheat during the 20th century. Field Crops Research 57, 335–347.
Cassman KG. 1999. Ecological intensification of cereal production
systems: yield potential, soil quality, and precision agriculture.
Proceedings of the National Academy of Sciences, USA 96,
5952–5959.
Cassman KG. 2001. Crop science research to assure food security.
In: Nosberger J, Geiger HH, Struik PC, eds. Crop science: progress
and prospects. New York: CAB International, 33–51.
Chapman S, Cooper M, Podlich D, Hammer G. 2003. Evaluating
plant breeding strategies by simulating gene action and dryland
environment effects. Agronomy Journal 95, 99–113.
Causse M, Buret M, Robini K, Verschave P. 2003. Inheritance of
nutritional and sensory quality traits in fresh market tomato and relation
to consumer preferences. Journal of Food Science 68, 2342–2350.
From genotype to phenotype through simulation models | 965
Downloaded from https://academic.oup.com/jxb/article-abstract/61/4/955/542452by gueston 18 February 2018

Causse M, Duffe P, Gomez MC, Buret M, Damidaux R, Zamir D,
Gur A, Chevalier C, Lemaire-Chamley M, Rothan C. 2004. A
genetic map of candidate genes and QTLs involved in tomato fruit size
and composition. Journal of Experimental Botany 55, 1671–1685.
Causse M, Chaıb J, Lecomte L, Buret M, Hospital F. 2007. Both
additivity and epistasis control the genetic variations for fruit quality
traits in tomato. Theoretical and Applied Genetics 115, 429–442.
Chaıb J, Lecomte L, Buret M, Causse M. 2006. Stability over
genetic backgrounds, generations and years of quantitative trait locus
(QTLs) for organoleptic quality in tomato. Theoretical Applied Genetics
112, 934–944.
Di Ventura B, Lemerle C, Michalodimitrakis K, Serrano L. 2006.
From in vivo to in silico biology and back. Nature 443, 527–533.
Dudley JW, Clark D, Rocheford TR, LeDeaux JR. 2007. Genetic
analysis of corn kernel chemical composition in the random mated 7
generation of the cross of generations 70 of ihp3ilp. Crop Science 47,
45–57.
Fernie AR, Geigenberger P, Stitt M. 2005. Flux, an important, but
neglected, component of functional genomics. Current Opinion in
Plant Biology 8, 174–182.
Fishman S, Genard M. 1998. A biophysical model of fruit growth:
simulation of seasonal and diurnal dynamics of mass. Plant, Cell and
Environment 21, 739–752.
Foulkes MJ, Sylvester-Bradley R, Scott RK. 1998. Evidence for
differences between winter wheat cultivars in acquisition of soil mineral
nitrogen and uptake and utilization of applied fertilizer nitrogen. Journal
of Agricultural Science 130, 29–44.
Genard M, Bertin N, Borel C, et al. 2007. Towards a virtual fruit
focusing on quality: modelling features and potential uses. Journal of
Experimental Botany 58, 917–928.
Genard M, Lescourret F, Ben Mimoun M, Besset J, Bussi C.
1998. A simulation model of growth at the shoot bearing fruit level. II.
Test and effect of source and sink factors in the case of peach.
European Journal of Agronomy 9, 189–202.
Genard M, Lescourret F, Gomez L, Habib R. 2003. Changes in
fruit sugar concentrations in response to assimilate supply,
metabolism and dilution: a modeling approach applied to peach fruit
(Prunus persica). Tree Physiology 23, 373–385.
Genard M, Souty M. 1996. Modeling the peach sugar contents in
relation to fruit growth. Journal of the American Society for Horticultural
Science 121, 1122–1131.
Graham PH, Vance CP. 2003. Legumes: importance and constraints
to greater use. Plant Physiology 131, 872–877.
Grandillo S, Zamir D, Tanksley SD. 1999. Genetic improvement of
processing tomatoes: a 20 years perspective. Euphytica 110, 85–97.
Hoogenboom G, White JW. 2003. Improving physiological
assumptions of simulation models by using gene-based approaches.
Agronomy Journal 95, 82–89.
Jamieson PD, Berntsen J, Ewert F, Kimball BA, Olesen JE,
Pinter Jr PJ, Porter JR, Semenov MA. 2000. Modelling CO2 effects
on wheat with varying nitrogen supplies. Agriculture, Ecosystems and
Environment 82, 27–37.
Jamieson PD, Semenov MA. 2000. Modelling nitrogen uptake and
redistribution in wheat. Field Crops Research 68, 21–29.
Jamieson PD, Semenov MA, Brooking IR, Francis GS. 1998.
Sirius: a mechanistic model of wheat response to environmental
variation. European Journal of Agronomy 8, 161–179.
Johnson RS, Handley DF. 1989. Thinning response of early, mid-,
and late-season peaches. Journal of the American Society for
Horticultural Science 114, 852–855.
Kropff MJ, Haverkort AJ, Aggarwal PK, Kooman PL. 1995. Using
systems approaches to design and evaluate ideotypes for specific
environments. In: Bouma J, Bouman BAM, Luyten JC, Zandstra HG,
eds. Eco-regional approaches for sustainable land use and food
production. Dordrecht, The Netherlands: Kluwer Academic Publishers,
417–435.
Lemaire G, Gastal F. 1997. N uptake and distribution in plant
canopies. In: Lemaire G, ed. Diagnosis on the nitrogen status in crops.
Heidelberg, Germany: Springer-Verlag, 3–43.
Lescourret F, BenMimoun M, Genard M. 1998. A simulation model
of growth at the shoot-bearing fruit level. I. Description and
parameterization for peach. European Journal of Agronomy 9,
173–188.
Lescourret F, Genard M. 2005. A virtual peach fruit model simulating
changes in fruit quality during the final stage of fruit growth. Tree
Physiology 25, 1303–1315.
Letort V, Mahe P, Cournede P-H, De Reffye P, Courtois B. 2008.
Quantitative genetics and functional–structural plant growth models:
simulation of quantitative trait loci detection for model parameters and
application to potential yield optimization. Annals of Botany 101,
1243–1254.
Martre P, Bertin N, Salon C, Genard M. 2009. Process-based
simulation models of fruit and grain size and composition. Tansley
Review. New Phytologist (in press).
Martre P, Jamieson PD, Semenov MA, Zyskowski RF,
Porter JR, Triboi E. 2006. Modelling protein content and
composition in relation to crop nitrogen dynamics for wheat. European
Journal of Agronomy 25, 138–154.
Martre P, Semenov MA, Jamieson PD. 2007. Simulation analysis of
physiological traits to improve yield, nitrogen use efficiency, and grain
protein concentration in wheat. In: Spiertz JHJ, Struik PC, Van Laar
HH, eds. Scale and complexity in plant systems research, gene–plant–
crop relations. The Netherlands: Springer, 181–201.
Messina CD, Jones JW, Boote KJ, Vallejos CE. 2006. A gene-
based model to simulate soybean development and yield responses to
environment. Crop Science 46, 456–466.
Miflin B. 2000. Crop improvement in the 21st century. Journal of
Experimental Botany 51, 1–8.
Nakagawa H, Yamagishi J, Miyamoto N, Motoyama M, Yano M,
Nemoto K. 2005. Flowering response of rice to photoperiod and
temperature: a QTL analysis using a phenological model. Theoretical
and Applied Genetics 110, 778–786.
Oury FX, Berard P, Brancourt-Hulmel M, et al. 2003. Yield and
grain protein concentration in bread wheat: a review and a study of
multi-annual data from a French breeding program. Journal of
Genetics and Breeding 57, 59–68.
Prudent M, Causse M, Genard M, Grandillo S, Tripodi P,
Bertin N. 2009. Genetic and physiological analysis of tomato fruit
966 | Bertin et al.
Downloaded from https://academic.oup.com/jxb/article-abstract/61/4/955/542452by gueston 18 February 2018

weight and composition: influence of carbon availability on QTL
detection. Journal of Experimental Botany 60, 923–937.
Quilot B, Genard M, Kervella J, Lescourret F. 2002.
Ecophysiological analysis of genotypic variation in peach fruit growth.
Journal of Experimental Botany 53, 1613–1625.
Quilot B, Genard M, Lescourret F, Kervella J. 2005a. Simulating
genotypic variation of fruit quality in an advanced peach3Prunus
davidiana cross. Journal of Experimental Botany 56, 3071–3081.
Quilot B, Kervella J, Genard M, Lescourret F. 2005b. Analysing
the genetic control of peach fruit quality through an ecophysiological
model combined with a QTL approach. Journal of Experimental
Botany 56, 3083–3092.
Reymond M, Muller B, Leonardi A, Charcosset A, Tardieu F.
2003. Combining quantitative trait loci analysis and an
ecophysiological model to analyse the genetic variability of the
responses of maize leaf growth to temperature and water deficit. Plant
Physiology 131, 664–675.
Reymond M, Muller B, Tardieu F. 2004. Dealing with the
genotype3environment interaction via a modelling approach:
a comparison of QTLs of maize leaf length or width with QTLs of
model parameters. Journal of Experimental Botany 55, 2461–2472.
Salon C, Vance C. 2004. Integration of omics science: from
laboratory to plant improvement. Grain Legumes 40, 18–19.
Semenov MA, Jamieson PD, Martre P. 2007. Deconvoluting
nitrogen use efficiency in wheat: a simulation study. European Journal
of Agronomy 26, 283–294.
Shorter R, Lawn RJ, Hammer GL. 1991. Improving genotypic
adaptation in crops: a role for breeders, physiologists, and modellers.
Experimental Agriculture 27, 155–175.
Sinclair TR, Purcell LC, Sneller CH. 2004. Crop transformation and
the challenge to increase yield potential. Trends in Plant Science 9,
70–75.
Stewart DW, Cober ER, Bernard RL. 2003. Modeling genetic
effects on the photothermal response of soybean phenological
development. Agronomy Journal 95, 65–70.
Struik PC, Yin X, de Visser P. 2005. Complex quality traits: now
time to model. Trends in Plant Science 10, 513–516.
Struik PC, Cassman KG, Koornneef M. 2007. A dialogue on
interdisciplinary collaboration to bridge the gap between plant
genomics and crop sciences. In: Spiertz JHJ, Struik PC, van Laar HH,
eds. Scale and complexity in plant systems research: gene–plant–crop
relations. The Netherlands: Springer, 319–328.
Tardieu F. 2003. Virtual plants: modelling as a tool for the genomics
of tolerance to water deficit. Trends in Plant Science 8, 9–14.
Trewavas A. 2006. A brief history of systems biology: ‘Every object
that biology studies is a system of systems.’ Francois Jacob (1974).
The Plant Cell 18, 2420–2430.
Triboi E, Ollier JL. 1991. Kinetic and role of C and N stored in stem
on 21 wheat genotypes. Agronomie 11, 239–246.
Triboi E, Triboi-Blondel AM. 2002. Productivity and grain or seed
composition: a new approach to an old problem: invited paper.
European Journal of Agronomy 16, 163–186.
van Ittersum MK, Donatelli M. 2003. Modelling cropping systems:
science, software and applications. European Journal of Agronomy
18, 187–393.
Weber H, Salon C. 2002. Interactions between yield stability and
seed composition. Grain Legumes 34, 16–17.
Welch SM, Dong Z, Roe JL. 2004. Modelling gene networks
controlling transition to flowering in arabidopsis. In: Fischer A, Turner
NC, Angus JF, McIntyre L, Robertson MJ, Borrell AK, Lloyd D, eds.
New directions for a diverse planet. Proceedings for the 4th
International Crop Science Congress, Brisbane: Australia, 1–20.
Welch SM, Roe JL, Dong Z. 2003. A genetic neural network model
of flowering time control in Arabidopsis thaliana. Agronomy Journal 95,
71–81.
White JW, Hoogenboom G. 1996. Simulating effects of genes for
physiological traits in a process-oriented crop model. Agronomy
Journal 88, 416–422.
Yin X, Chasalow SD, Dourleijn CJ, Stam P, Kropff MJ. 2000.
Coupling estimated effects of QTLs for physiological traits to a crop
growth model: predicting yield variation among recombinant inbred
lines in barley. Heredity 85, 539–549.
Yin X, Kropff MJ, Stam P. 1999. The role of ecophysiological models
in QTL analysis: the example of specific leaf area in barley. Heredity
82, 415–421.
Yin X, Struik PC, Kropff MJ. 2004. Role of crop physiology in
predicting gene-to-phenotype relationships. Trends in Plant Science 9,
426–432.
Yin X, Struik PC, Tang J, Qi C, Liu T. 2005. Model analysis of
flowering phenology in recombinant inbred lines of barley. Journal of
Experimental Botany 56, 959–965.
Yin X, Struik PC. 2008. Applying modelling experiences from the past
to shape crop systems biology: the need to converge crop physiology
and functional genomics. New Phytologist 179, 629–642.
From genotype to phenotype through simulation models | 967
Downloaded from https://academic.oup.com/jxb/article-abstract/61/4/955/542452by gueston 18 February 2018