Embed Size (px)
Citation preview
Undergraduate Economic Review Undergraduate Economic Review
Volume 5 Issue 1 Article 4
2009
High School Graduation Rates in the Metro-Detroit Area: What High School Graduation Rates in the Metro-Detroit Area: What
Really Affects Public Secondary Education Really Affects Public Secondary Education
Thomas A. Wilk University of Michigan - Dearborn
Follow this and additional works at: https://digitalcommons.iwu.edu/uer
Part of the Economics Commons
Recommended Citation Wilk, Thomas A. (2009) "High School Graduation Rates in the Metro-Detroit Area: What Really Affects Public Secondary Education," Undergraduate Economic Review: Vol. 5 : Iss. 1 , Article 4. Available at: https://digitalcommons.iwu.edu/uer/vol5/iss1/4
This Article is protected by copyright and/or related rights. It has been brought to you by Digital Commons @ IWU with permission from the rights-holder(s). You are free to use this material in any way that is permitted by the copyright and related rights legislation that applies to your use. For other uses you need to obtain permission from the rights-holder(s) directly, unless additional rights are indicated by a Creative Commons license in the record and/ or on the work itself. This material has been accepted for inclusion by faculty at Illinois Wesleyan University. For more information, please contact [email protected]. ©Copyright is owned by the author of this document.
High School Graduation Rates in the Metro-Detroit Area: What Really Affects High School Graduation Rates in the Metro-Detroit Area: What Really Affects Public Secondary Education Public Secondary Education
Abstract Abstract Education is essential to the future productivity of workers in the Metropolitan Detroit area, so determining what impacts high school graduation is vital to predicting the future success of our economy. This research investigates what key aspects in our society affect the high school graduation rate: poverty level, violent crime rate, student body, class size, local school taxes, and standardized test scores. Results from multiple regressions using school district and city data from the CCD and FBI suggest that poverty levels and violent crime in the Metro Detroit area significantly, negatively influence high school graduation rates. Reforms to public policy reducing crime and poverty rates in Metro Detroit could improve high school graduation rates and help minimize the potential for the Motor City to lose its cutting edge in the auto industry and help diversify Michigan’s future human capital.
This article is available in Undergraduate Economic Review: https://digitalcommons.iwu.edu/uer/vol5/iss1/4
Undergraduate Economic Review
A publication of Illinois Wesleyan University
Volume V—2008-2009
Title: High School Graduation Rates in the Metro-Detroit Area: What Really Affects Public Secondary Education
Author: Thomas A. Wilk Affiliation: University of Michigan - Dearborn
Abstract: Education is essential to the future productivity of workers in the Metropolitan Detroit area, so determining what impacts high school graduation is vital to predicting the future success of our economy. This research investigates what key aspects in our society affect the high school graduation rate: poverty level, violent crime rate, student body, class size, local school taxes, and standardized test scores. Results from multiple regressions using school district and city data from the CCD and FBI suggest that poverty levels and violent crime in the Metro Detroit area significantly, negatively influence high school graduation rates. Reforms to public policy reducing crime and poverty rates in Metro Detroit could improve high school graduation rates and help minimize the potential for the Motor City to lose its cutting edge in the auto industry and help diversify Michigan’s future human capital.
1
Wilk: High School Graduation Rates in the Metro-Detroit Area: What Real
Published by Digital Commons @ IWU, 2009
1
I. Introduction
Education is a vital component to the health and growth of our economy, a gauge of our
own technological skill level and future work force productivity, and is a reflection of our
society’s values and norms. It is the concern of every parent and prospective business owner, as
the young adults in our current school system today are the future of our economy. Today,
education is in the forefront of the news and politics, especially after the introduction of the No
Child Left Behind Act (NCLB) of 2002. As the public’s concern for our youth’s education
increases and as public policy focuses more on improving the quality and outcome of our
primary and secondary education system, it is imperative to us, as a developed nation, to find
what influences our youth’s ability to graduate from high school.
Understanding which variables affect high school graduation will enable us to act in a
way that is beneficial to society, creating policies that encourage education and eliminating
reasons for students to drop out. Furthermore, we’d be able to evaluate what factors in our
communities and neighborhoods matter the most and focus our attention on the local level.
Examining the Detroit Metropolitan area, we’d be able to enact policies that not only emphasize
education but strengthen Michigan’s economy by focusing efforts to improve education in
skilled automotive labor and by diversifying high tech jobs beyond the scope of the automobile.
This would create new standards or norms that will last beyond our current generation.
Education is our future and without this perceived value of importance, our economy will
flounder.
Using data from over seventy high schools in forty districts, this paper determines which
factors are associated with the graduation rate of high school students within the Metropolitan
Detroit area. Focusing on the Metro-Detroit area is vital to the well-being of Michigan. This
2
Undergraduate Economic Review, Vol. 5 [2009], Iss. 1, Art. 4
https://digitalcommons.iwu.edu/uer/vol5/iss1/4
2
study can help develop a sense of economic health of the future of our economy, absent of
external expected outcomes. Increasing the graduation rate of secondary education will offer
solutions to help maximize the potential for our human capital in the Detroit area and minimize
the costs of losing a local working base, failing to meet the needs of a high technology economy.
This paper examines, at the district level, the Metropolitan Detroit high school graduation
rate and its relationship between the level of poverty in the district, crime rate of the city, student
body make-up, class size or teacher ratio, local taxes going toward schools, and students passing
the Michigan Educational Assessment Program (MEAP) tests in science and math.
II. Literature Review
Heckman (2007) discusses the trends in high school graduation and drop-out rates over
the past fifty years using national data from the U.S. Census and Common Core of Data (CCD).
He defines actual graduation versus the completion of a GED, debating what exactly qualifies as
a high school graduate. Heckman adjusts for the fact that certain groups are not accurately
represented in the estimated rates. For example, the incarcerated are lower than the average
population in terms of education, so there is a strong negative causal relationship between
education and crime, causing biases in both black and male populations. The armed forces is
another group not accurately represented, though Heckman states that this under representation
doesn’t cause bias in the estimated graduation rate because most enlisted personnel have
obtained a diploma or GED. Immigrants are another group misrepresented, stating that “a
meaningful evaluation of the performance of U.S. educational system should not include people
who never attended U.S. schools or those who did so only briefly (Heckman, 2007).”
The main focus of Heckman’s paper is to argue that there are data collecting biases and
interpretations between different statistical agencies and how he controlled for some of these
3
Wilk: High School Graduation Rates in the Metro-Detroit Area: What Real
Published by Digital Commons @ IWU, 2009
3
biases. Though, this paper is a time trend analysis and no regression was performed, it helped
establish some variables that have influence on the graduation rate, such as crime, gender and
race. Also, it brought to light the possibility that my analysis might be biased. As this paper
focuses on trends, I plan to use similar variables in crime, gender, and race that could influence
high school graduation rates but using Ordinary Least Squares regression analysis.
Dearden (2005) discusses the possibility that education is “seen as a way for individuals
to escape poverty and welfare dependency,” motivating governments to focus their attention
towards education as a way to combat poverty. Many OECD countries have made their
secondary or college education free, while increasing the “compulsory school leaving age” from
14 to 16 years old since the Second World War. Some countries created means-tested grants to
students as incentives to stay in school. Opinions are mixed about any significant correlation
between school participation and monetary incentives.
This paper “examines the impact of a program that subsidizes children to remain in
school for up to two years beyond the statutory age (Dearden, 2005).” The results of data
collected from England’s national Education Maintenance Allowance program indicate that the
impact of subsidies on the graduation rates of students is quite substantial, especially for students
who receive the maximum payments. There is also strong evidence that the gender gap has
decreased, as male participation in schools has increased. Lastly, this program is more efficient
among children with poorer socio-economic backgrounds and slightly more significant if the
payments were made directly to the child, rather than the parent. This research indicates that a
subsidy to low income children to foster their education is an important variable in explaining
graduation rates.
4
Undergraduate Economic Review, Vol. 5 [2009], Iss. 1, Art. 4
https://digitalcommons.iwu.edu/uer/vol5/iss1/4
4
Vartanian (1999) discusses neighborhood conditions in both black and white
communities and their impact on high school completion. He tests what characteristics influence
high school drop out rates, such as growing up with wealthier neighbors, two parent households,
the degree of parental education and employment level, and if these neighborhood conditions are
more apparent in high school or college performance. Vartanian argues that, “if neighborhood
issues are important, then policies that focus solely on developing individuals’ skills without
dealing with his or her surroundings are unlikely to be completely successful in reducing high
school dropout rates (Vartanian, 1999).”
Vartanian offers four theoretical models that explain the significance of neighborhoods
and how they relate to a high school’s dropout rate. Isolation theory asserts that the negative
effects of living ‘socially isolated’ are most severe in children without family supports to offset
the effects of poor neighborhoods. Epidemic theory predicts that neighborhood quality will have
little effect on education until it reaches ‘epidemic levels,’ stronger at low levels of
neighborhood quality. Cultural deprivation theory suggests that high neighborhood quality can
have a negative effect on children that are classified as “disadvantaged” in wealthier
neighborhoods, resulting in a deviant subculture. Utility maximization theory states that all
students are rational and choose to maximize their utility by weighing the costs and benefits of
additional education.
Vartanian’s empirical analysis finds that the poverty rate, the percent of female headed
households, and the percent of professional and managerial occupations held by student’s parents
are statistically significant in measuring the dropout rate of high schools. Separating his findings
into subgroups of blacks and whites, he finds that family income in the lowest third is significant
for blacks in decreasing high school dropout rates, while family income in the highest third is
5
Wilk: High School Graduation Rates in the Metro-Detroit Area: What Real
Published by Digital Commons @ IWU, 2009
5
significant for whites in increasing college graduation rates. Also, having a household head who
is a dropout significantly lowers black students’ graduation rates, while having a college
educated household head significantly raises the graduation rates of white students.
Vartanian’s paper focuses on the differences between blacks and whites and their
neighborhood conditions on a socio-economic level. Analyzing the social relations between the
student, family role models, and other peer students, Vartanian focuses primarily on family
structure, parent’s education, and income distribution within the neighborhood. As this paper is
almost ten years old, I plan to reexamine Vartanian’s variables influencing high school
graduation rates, primarily differentials in race and income or poverty. Also, this paper will
focus on high school graduation rates only and will focus precisely on the Metro-Detroit area,
generating conclusions more relevant to our own community.
III. Economic Theory
The graduation rate for high school students can be impacted by many different variables,
ranging from the poverty level of the neighborhood, to overall size of the class, and even to a
student’s family stability in the household. Economic theory will explain how each of these
independent variables will affect the graduation rate of high school students. The factors that I
think are significant in influencing high school graduation rates are: one-on-one teacher time
with students, racial and gender make up of the student body, students from a divorced family,
crime, poverty, the amount of funding going towards students in the schools, and students’
performance on standardized tests. In this section, I will explain, in theory, how each variable
would affect high school graduation rates differently.
Teachers are an important part of a student’s education and their time and ability to focus
their energy and concentration towards students is limited. In schools that have larger class sizes
6
Undergraduate Economic Review, Vol. 5 [2009], Iss. 1, Art. 4
https://digitalcommons.iwu.edu/uer/vol5/iss1/4
6
or greater student per teacher ratios, the less of a focused, attentive education students will
receive. This reduced attention will be reflected in the student’s grades as they perceive
themselves to be less important or relevant to the class dynamic. These poor grades will create
indifference in the student’s education, decreasing the likelihood of the student to graduate.
A teacher’s ability to spend individual time with students is limited inside the classroom.
Teachers do not have unlimited time to properly attend to each student nor does the school have
an endless budget to support increased working hours of teachers or hiring of more teachers. As
the number of students increases or the number of teachers decreases, students are left with less
one-on-one time with their teachers. This reduces the quality of instruction offered to students
by the school. As stated earlier, a decrease in time spent with teachers at the school will
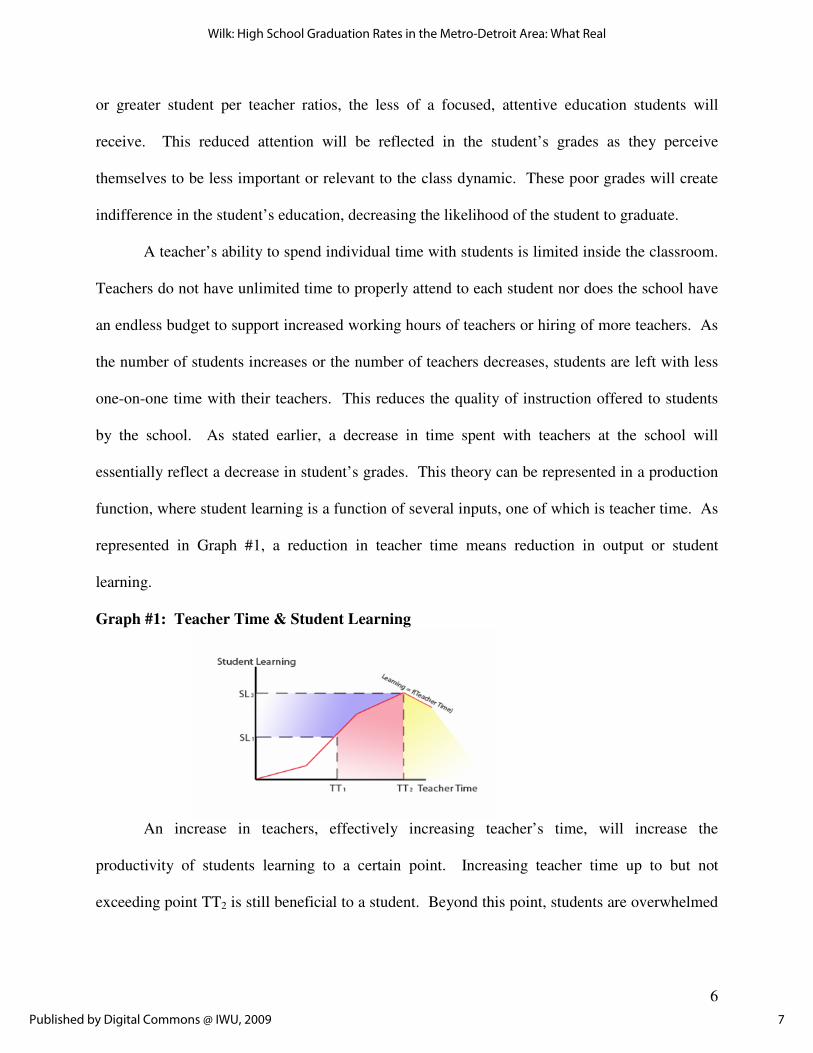
essentially reflect a decrease in student’s grades. This theory can be represented in a production
function, where student learning is a function of several inputs, one of which is teacher time. As
represented in Graph #1, a reduction in teacher time means reduction in output or student
learning.
Graph #1: Teacher Time & Student Learning
An increase in teachers, effectively increasing teacher’s time, will increase the
productivity of students learning to a certain point. Increasing teacher time up to but not
exceeding point TT2 is still beneficial to a student. Beyond this point, students are overwhelmed
7
Wilk: High School Graduation Rates in the Metro-Detroit Area: What Real
Published by Digital Commons @ IWU, 2009
7
with the advice of their teachers and spend more time consulting with teachers than studying or
learning.
Race and ethnicity can play a significant role in high school graduation. Minority races,
in particular, face a greater risk of discrimination, poverty, crime, and violence. Discrimination
can discourage students from working hard or studying. Living in a high crime or financially
neglected neighborhood can add stressors and distractions to a student’s life and education.
Since Caucasians are the predominant race in the United States, we can infer that if a school’s
student body has a greater percentage of Caucasians, there would be less discrimination, poverty,
crime, and have greater stability among students, weighed against multi-racial schools.
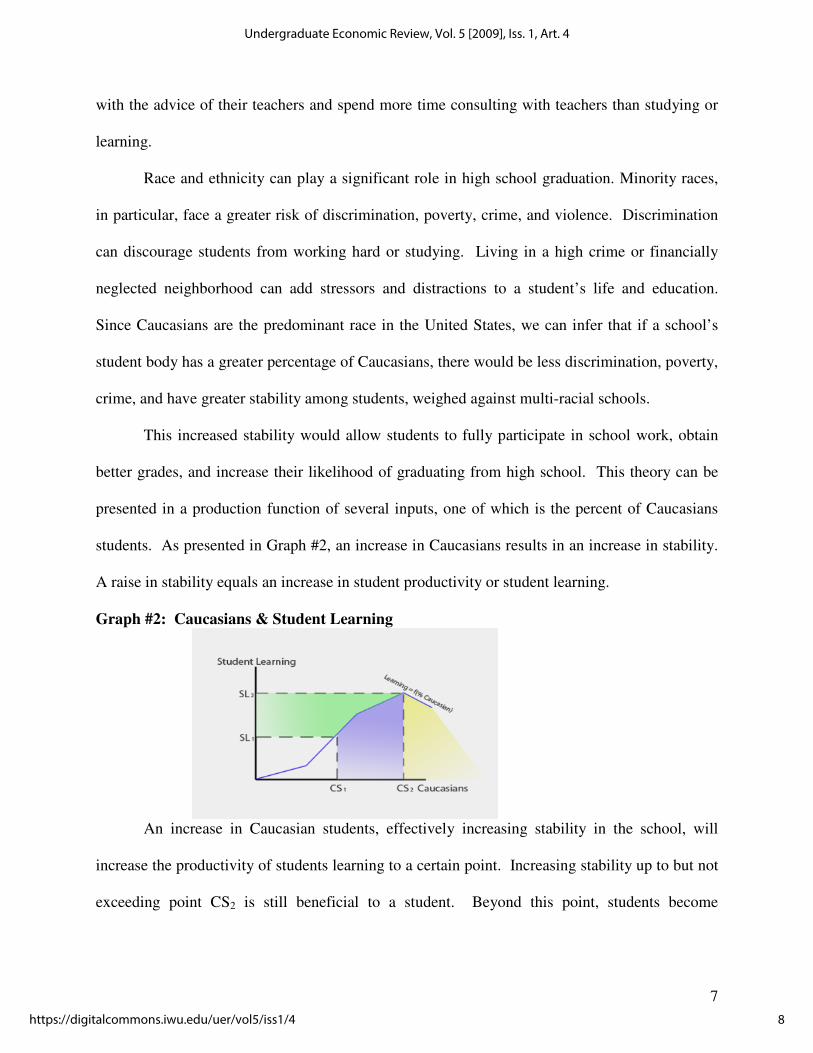
This increased stability would allow students to fully participate in school work, obtain
better grades, and increase their likelihood of graduating from high school. This theory can be
presented in a production function of several inputs, one of which is the percent of Caucasians
students. As presented in Graph #2, an increase in Caucasians results in an increase in stability.
A raise in stability equals an increase in student productivity or student learning.
Graph #2: Caucasians & Student Learning
An increase in Caucasian students, effectively increasing stability in the school, will
increase the productivity of students learning to a certain point. Increasing stability up to but not
exceeding point CS2 is still beneficial to a student. Beyond this point, students become
8
Undergraduate Economic Review, Vol. 5 [2009], Iss. 1, Art. 4
https://digitalcommons.iwu.edu/uer/vol5/iss1/4
8
complacent in their neighborhoods and schools. This can lead to false sense of security and
merit, leading to poor study habits and mischief.
Divorce can play a crucial role in the development in a child’s life. It can impact the way
they socialize, their perception of the world, their ability to trust others and their level of comfort
or support at home; in other words, their household stability. If a student is trying to cope with
stressful changes caused by divorce at their home and is unable to put their full attention towards
school, their grades and their ability to keep up with assignments will begin to lag and falter.
This lag could eventually keep students behind a grade and could force students to dropout as the
inconvenience of school is exceeded by the benefit of coping with and keeping a stable
household.
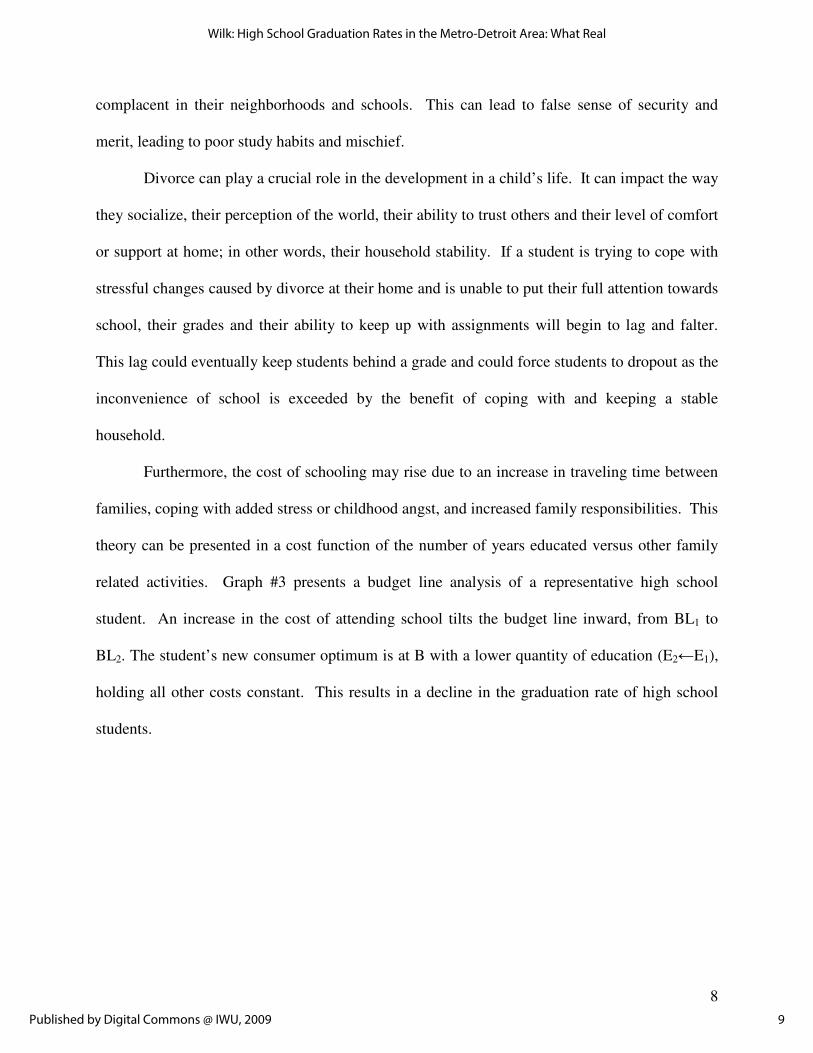
Furthermore, the cost of schooling may rise due to an increase in traveling time between
families, coping with added stress or childhood angst, and increased family responsibilities. This
theory can be presented in a cost function of the number of years educated versus other family
related activities. Graph #3 presents a budget line analysis of a representative high school
student. An increase in the cost of attending school tilts the budget line inward, from BL1 to
BL2. The student’s new consumer optimum is at B with a lower quantity of education (E2←E1),
holding all other costs constant. This results in a decline in the graduation rate of high school
students.
9
Wilk: High School Graduation Rates in the Metro-Detroit Area: What Real
Published by Digital Commons @ IWU, 2009
9
Graph #3: Cost of Education & Divorce
Women have had a long history of discrimination in the work place. Women, in general,
are paid less than their male counterparts and have had to work and study above and beyond the
average male worker just to be considered equal. A female student would recognize this
discrimination towards their mother, aunt or another adult female figure and work harder to
obtain better grades, as the benefits of succeeding far exceeds the costs of failing. Therefore,
women students will strive to achieve higher grades and get accepted to better colleges, to
compete against other men. Their ability to succeed later in life is highly dependent on
graduating from high school.
A student’s marginal benefit for more education results in a benefit curve that is sloping
down as the number of years educated increases and as the benefit for each additional year
decreases. So, the marginal benefit of a student decreases as the number of years educated
increases as you move down the benefit curve. Marginal cost increases as the number of years
educated increases for each additional year.
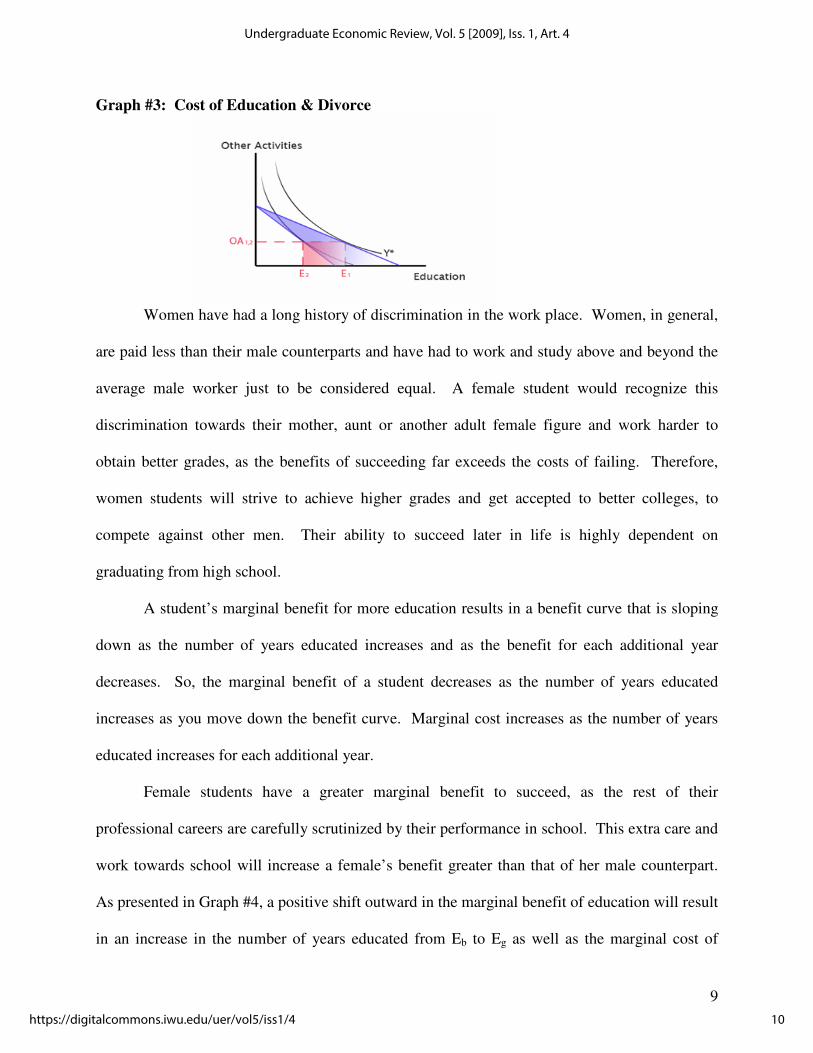
Female students have a greater marginal benefit to succeed, as the rest of their
professional careers are carefully scrutinized by their performance in school. This extra care and
work towards school will increase a female’s benefit greater than that of her male counterpart.
As presented in Graph #4, a positive shift outward in the marginal benefit of education will result
in an increase in the number of years educated from Eb to Eg as well as the marginal cost of
10
Undergraduate Economic Review, Vol. 5 [2009], Iss. 1, Art. 4
https://digitalcommons.iwu.edu/uer/vol5/iss1/4
10
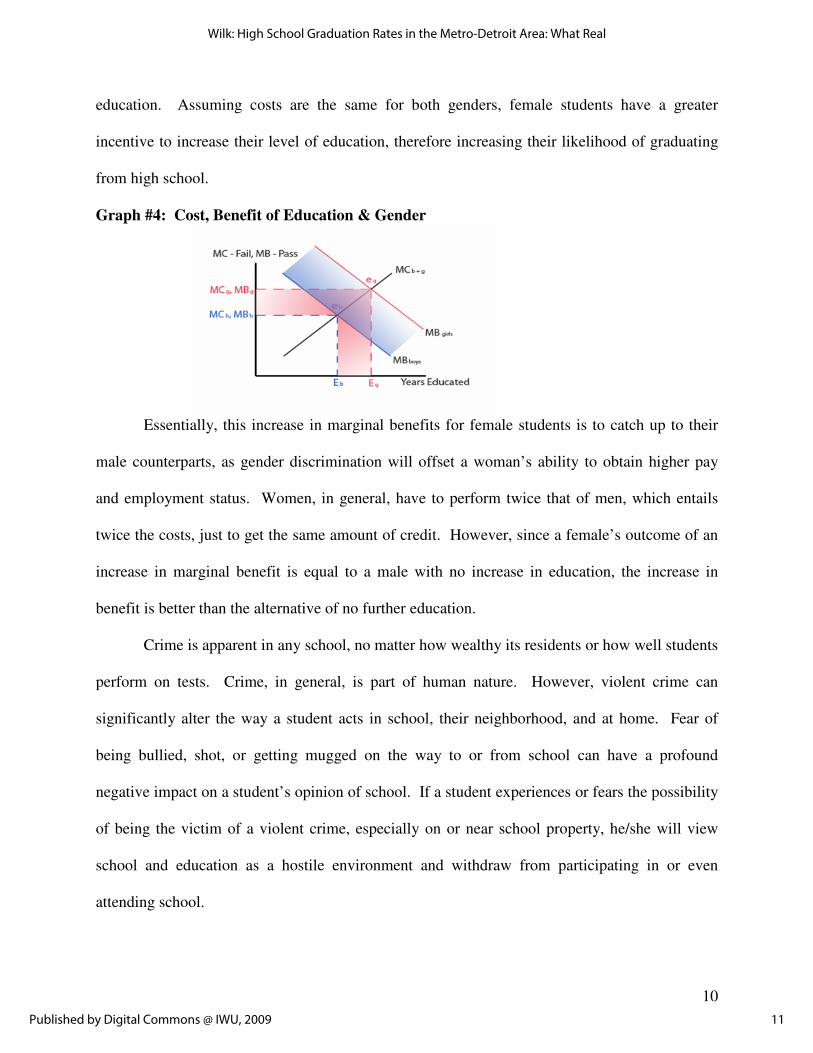
education. Assuming costs are the same for both genders, female students have a greater
incentive to increase their level of education, therefore increasing their likelihood of graduating
from high school.
Graph #4: Cost, Benefit of Education & Gender
Essentially, this increase in marginal benefits for female students is to catch up to their
male counterparts, as gender discrimination will offset a woman’s ability to obtain higher pay
and employment status. Women, in general, have to perform twice that of men, which entails
twice the costs, just to get the same amount of credit. However, since a female’s outcome of an
increase in marginal benefit is equal to a male with no increase in education, the increase in
benefit is better than the alternative of no further education.
Crime is apparent in any school, no matter how wealthy its residents or how well students
perform on tests. Crime, in general, is part of human nature. However, violent crime can
significantly alter the way a student acts in school, their neighborhood, and at home. Fear of
being bullied, shot, or getting mugged on the way to or from school can have a profound
negative impact on a student’s opinion of school. If a student experiences or fears the possibility
of being the victim of a violent crime, especially on or near school property, he/she will view
school and education as a hostile environment and withdraw from participating in or even
attending school.
11
Wilk: High School Graduation Rates in the Metro-Detroit Area: What Real
Published by Digital Commons @ IWU, 2009
11
Students living in areas of higher violent crime rates are more likely to withdraw from
school-related activities that present the most potential for risk: school. This theory can be
presented in a production function of several inputs, one of which is violent crime within the
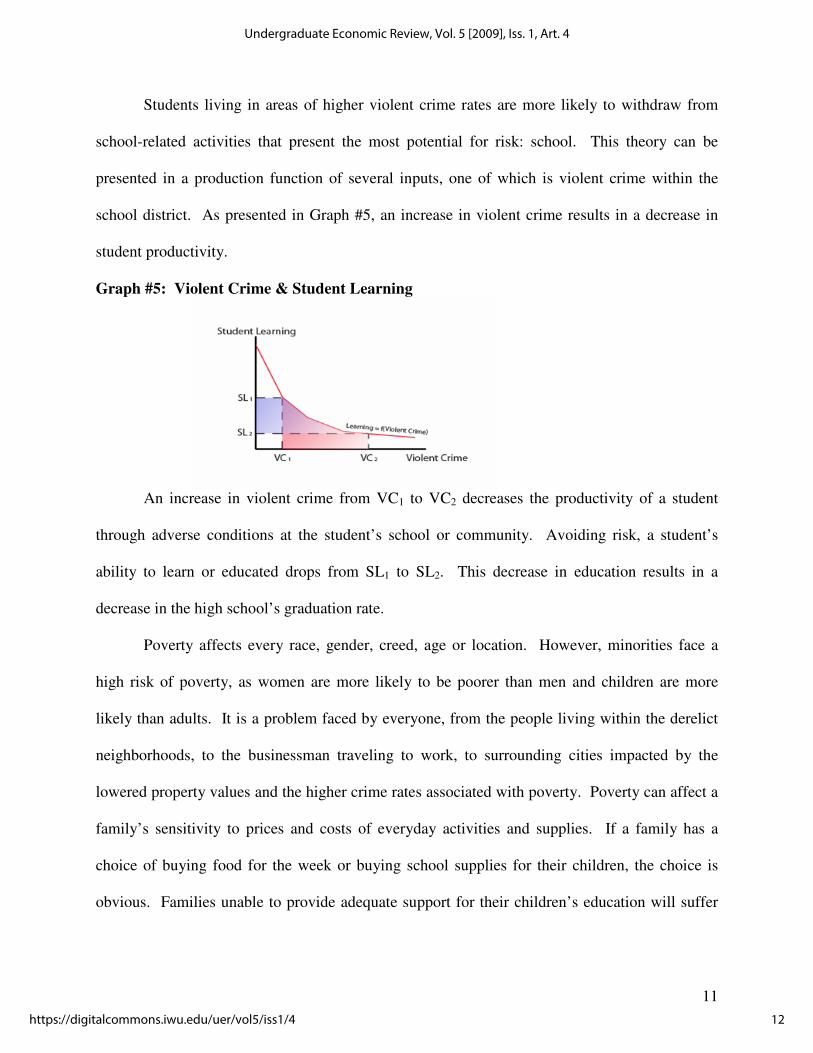
school district. As presented in Graph #5, an increase in violent crime results in a decrease in
student productivity.
Graph #5: Violent Crime & Student Learning
An increase in violent crime from VC1 to VC2 decreases the productivity of a student
through adverse conditions at the student’s school or community. Avoiding risk, a student’s
ability to learn or educated drops from SL1 to SL2. This decrease in education results in a
decrease in the high school’s graduation rate.
Poverty affects every race, gender, creed, age or location. However, minorities face a
high risk of poverty, as women are more likely to be poorer than men and children are more
likely than adults. It is a problem faced by everyone, from the people living within the derelict
neighborhoods, to the businessman traveling to work, to surrounding cities impacted by the
lowered property values and the higher crime rates associated with poverty. Poverty can affect a
family’s sensitivity to prices and costs of everyday activities and supplies. If a family has a
choice of buying food for the week or buying school supplies for their children, the choice is
obvious. Families unable to provide adequate support for their children’s education will suffer
12
Undergraduate Economic Review, Vol. 5 [2009], Iss. 1, Art. 4
https://digitalcommons.iwu.edu/uer/vol5/iss1/4
12
as they are unable to function properly in class and unable to keep up with other students in the
school.
Students living in poverty are more likely to value goods of necessity or immediate
survival and be cost-averse to items perceived as ‘discretionary,’ such as school supplies,
transportation to school, lunches, and related activities. A shortage of school supplies results in a
decrease in productivity of the student, decreasing the likelihood of graduating from high school.
Lack of food can impair a student’s ability to concentrate and negatively impact their cognitive
development. This theory can be presented in a production function with several inputs, one of
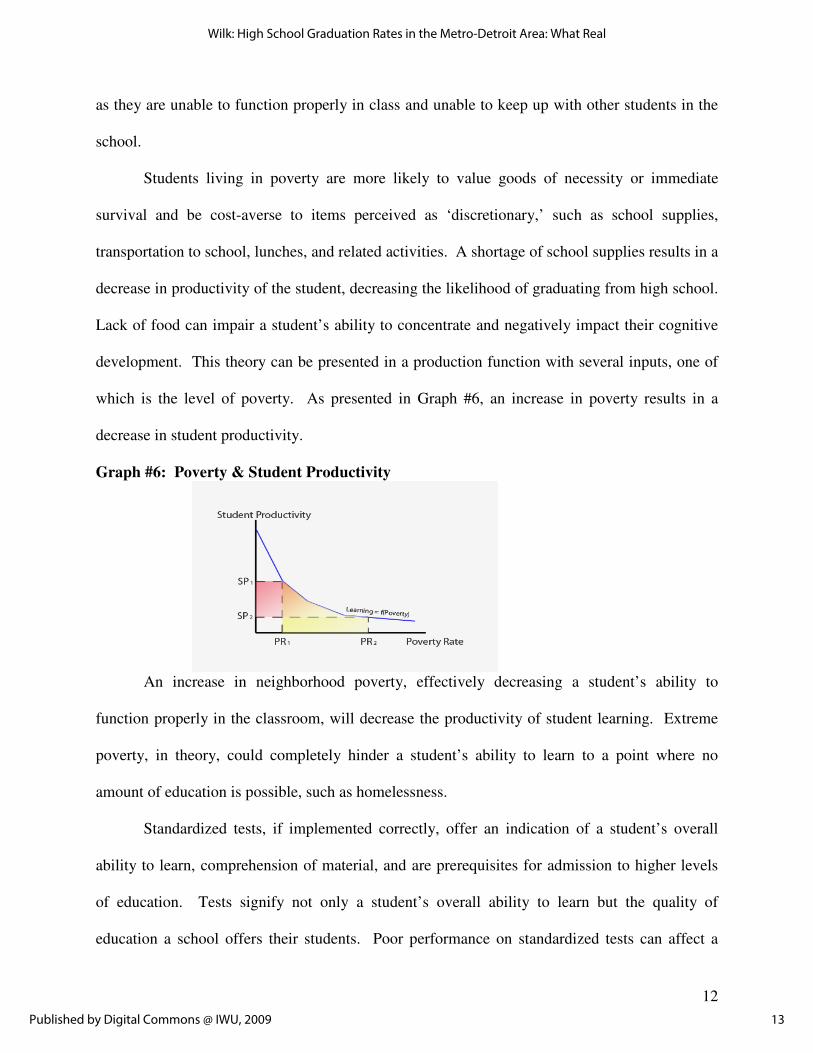
which is the level of poverty. As presented in Graph #6, an increase in poverty results in a
decrease in student productivity.
Graph #6: Poverty & Student Productivity
An increase in neighborhood poverty, effectively decreasing a student’s ability to
function properly in the classroom, will decrease the productivity of student learning. Extreme
poverty, in theory, could completely hinder a student’s ability to learn to a point where no
amount of education is possible, such as homelessness.
Standardized tests, if implemented correctly, offer an indication of a student’s overall
ability to learn, comprehension of material, and are prerequisites for admission to higher levels
of education. Tests signify not only a student’s overall ability to learn but the quality of
education a school offers their students. Poor performance on standardized tests can affect a
13
Wilk: High School Graduation Rates in the Metro-Detroit Area: What Real
Published by Digital Commons @ IWU, 2009
13
student’s likelihood of being accepted to a good college and their ability to obtain a job that pays
more than minimum wage, is not physically intensive, or is not considered an undesirable
profession.
Student’s who want to succeed in their academic and professional careers have a greater
marginal benefit to excel in their standardized test scores than students that have given up hope
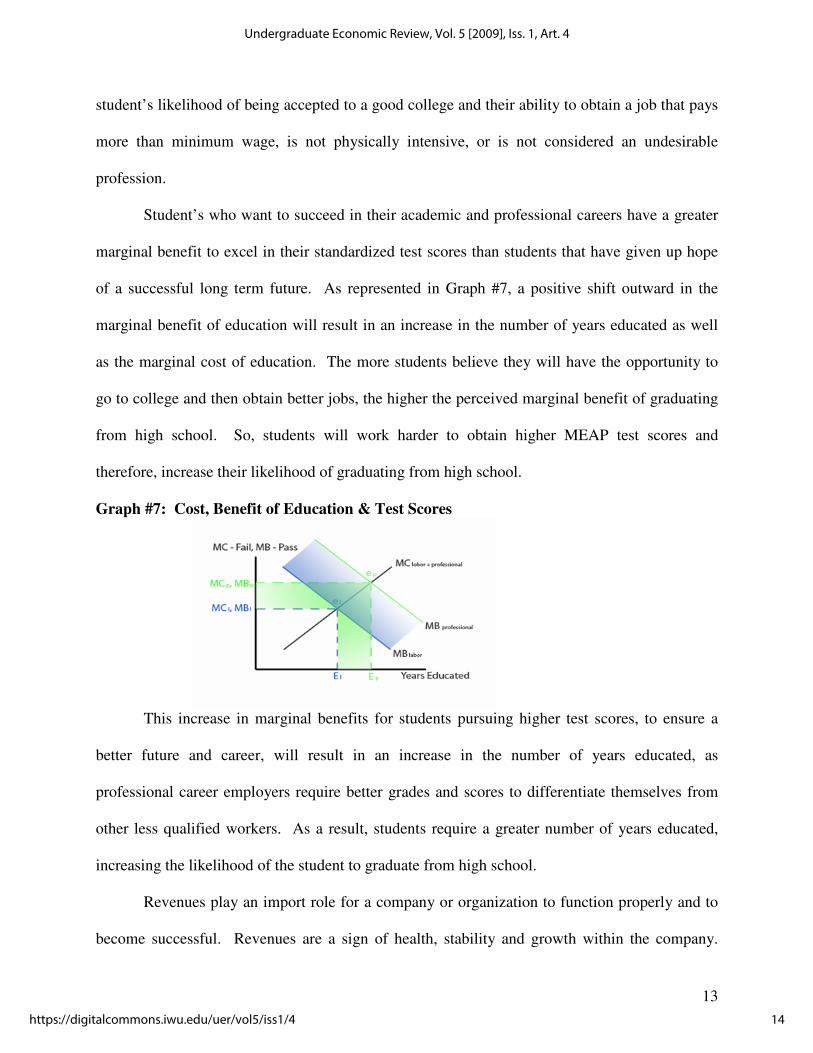
of a successful long term future. As represented in Graph #7, a positive shift outward in the
marginal benefit of education will result in an increase in the number of years educated as well
as the marginal cost of education. The more students believe they will have the opportunity to
go to college and then obtain better jobs, the higher the perceived marginal benefit of graduating
from high school. So, students will work harder to obtain higher MEAP test scores and
therefore, increase their likelihood of graduating from high school.
Graph #7: Cost, Benefit of Education & Test Scores
This increase in marginal benefits for students pursuing higher test scores, to ensure a
better future and career, will result in an increase in the number of years educated, as
professional career employers require better grades and scores to differentiate themselves from
other less qualified workers. As a result, students require a greater number of years educated,
increasing the likelihood of the student to graduate from high school.
Revenues play an import role for a company or organization to function properly and to
become successful. Revenues are a sign of health, stability and growth within the company.
14
Undergraduate Economic Review, Vol. 5 [2009], Iss. 1, Art. 4
https://digitalcommons.iwu.edu/uer/vol5/iss1/4
14
Public school revenues come from the property taxes, or millage, from the city’s residents,
signifying not only the health and stability of the neighborhood, but the perceived value school
holds in the residents of the surrounding neighborhoods. Without properly funded schools, a
student’s ability to learn is impeded by derelict, hazardous facilities, inadequate school supplies,
and the lack of extra-curricular activities.
An increase in revenues would create an environment beneficial to student learning. This
increase would allow students to fully participate in school work, obtain better grades, and
increase their likelihood of graduating from high school. This theory can be presented in a
production function of several inputs, one of which is the amount of revenue set aside per
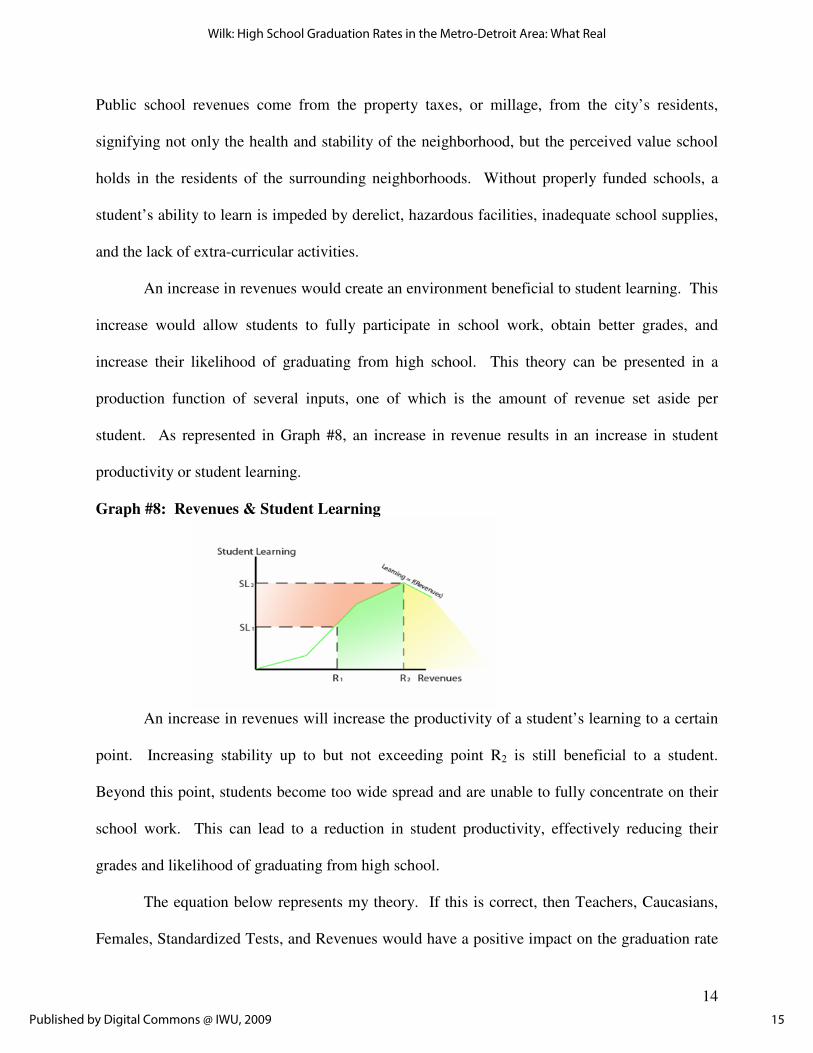
student. As represented in Graph #8, an increase in revenue results in an increase in student
productivity or student learning.
Graph #8: Revenues & Student Learning
An increase in revenues will increase the productivity of a student’s learning to a certain
point. Increasing stability up to but not exceeding point R2 is still beneficial to a student.
Beyond this point, students become too wide spread and are unable to fully concentrate on their
school work. This can lead to a reduction in student productivity, effectively reducing their
grades and likelihood of graduating from high school.
The equation below represents my theory. If this is correct, then Teachers, Caucasians,
Females, Standardized Tests, and Revenues would have a positive impact on the graduation rate
15
Wilk: High School Graduation Rates in the Metro-Detroit Area: What Real
Published by Digital Commons @ IWU, 2009
15
for public high school students, on average. Divorce, Violent Crime, and Poverty would have a
negative impact on the graduation rate for public high school students, on average.
Grad = ββββ1111 + β + β + β + β2222Teachers + ββββ3333Caucasians - ββββ4444Divorce + ββββ5555Females
- ββββ6666VCrime - ββββ7777Poverty + ββββ8888Tests + ββββ9999Revenues + Ui
IV. Econometric Model
Applying the theory presented, this model will include variables I believe will have a
significant impact on the public high school graduation rates for students in the Metropolitan
Detroit area. Given the scope and time constraints of this project, I have limited the number of
variables to what was feasible to obtain in the given time. All schools were picked on the basis
of central location around the Metro Detroit area, specifically a twenty mile radius from the
48230 zip code, including forty school districts and over seventy individual high schools. All
schools that are neither magnet nor charter schools are considered “regular” public schools.
The independent variables include: the average student to teacher ratio, the percentage of
students who are white; the percentage of students who are female; the percentage of students
receiving free lunches at school; local revenue going towards the students; the violent crime rate
of the city; and the percentage of students successfully passing the MEAP math and science tests.
All independent variables are quantitative and continuous, using school district and city data
from the CCD and FBI. Appendix A presents the sources and descriptive statistics for all the
variables used in this study.
The high school graduation rate in Michigan, the dependent variable, is determined by
the Department of Education’s Center for Educational Performance and Information (CEPI)
yearly report, Michigan Graduation / Dropout Rates. This rate represents the percent of students
16
Undergraduate Economic Review, Vol. 5 [2009], Iss. 1, Art. 4
https://digitalcommons.iwu.edu/uer/vol5/iss1/4
16
who graduated at the end of grade 12 in the spring of 2006, excluding students that dropped out
of school or obtained a certificate of completion or a General Equivalency Diploma (GED).
Based on the data collected, biases may occur due to the double counting of students held back in
9th grade that go into the graduation rate of schools four years later. However in light of NCLB,
this bias has decreased as schools are more inclined to graduate students to the next grade in
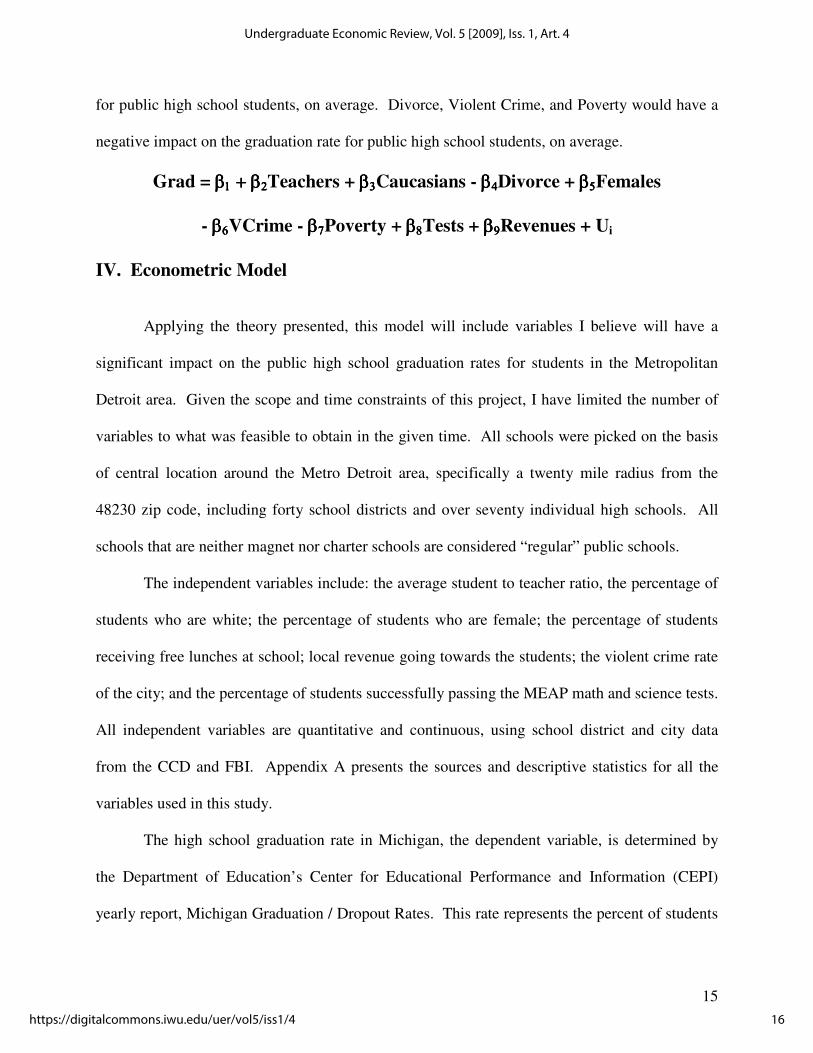
order to keep state and federal funding. The descriptive statistics for the high school graduation
rate (Grad) are:
N Minimum Maximum Mean Std. Deviation
Grad 40 .5484 .9915 .877603 .1130667
Troy School District had the highest high school graduation rate of 99.15% and Highland Park
City Schools had the lowest high school graduation rate of 54.84%. There was a difference of
44.31 percentage points.
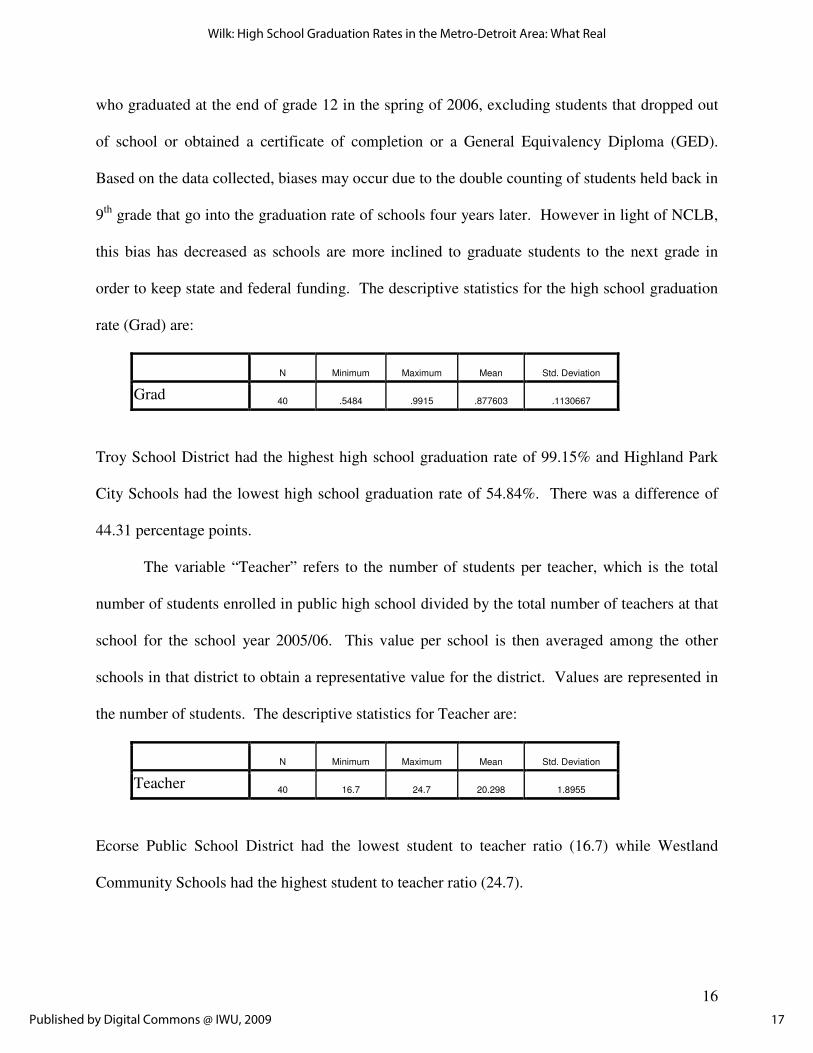
The variable “Teacher” refers to the number of students per teacher, which is the total
number of students enrolled in public high school divided by the total number of teachers at that
school for the school year 2005/06. This value per school is then averaged among the other
schools in that district to obtain a representative value for the district. Values are represented in
the number of students. The descriptive statistics for Teacher are:
N Minimum Maximum Mean Std. Deviation
Teacher 40 16.7 24.7 20.298 1.8955
Ecorse Public School District had the lowest student to teacher ratio (16.7) while Westland
Community Schools had the highest student to teacher ratio (24.7).
17
Wilk: High School Graduation Rates in the Metro-Detroit Area: What Real
Published by Digital Commons @ IWU, 2009
17
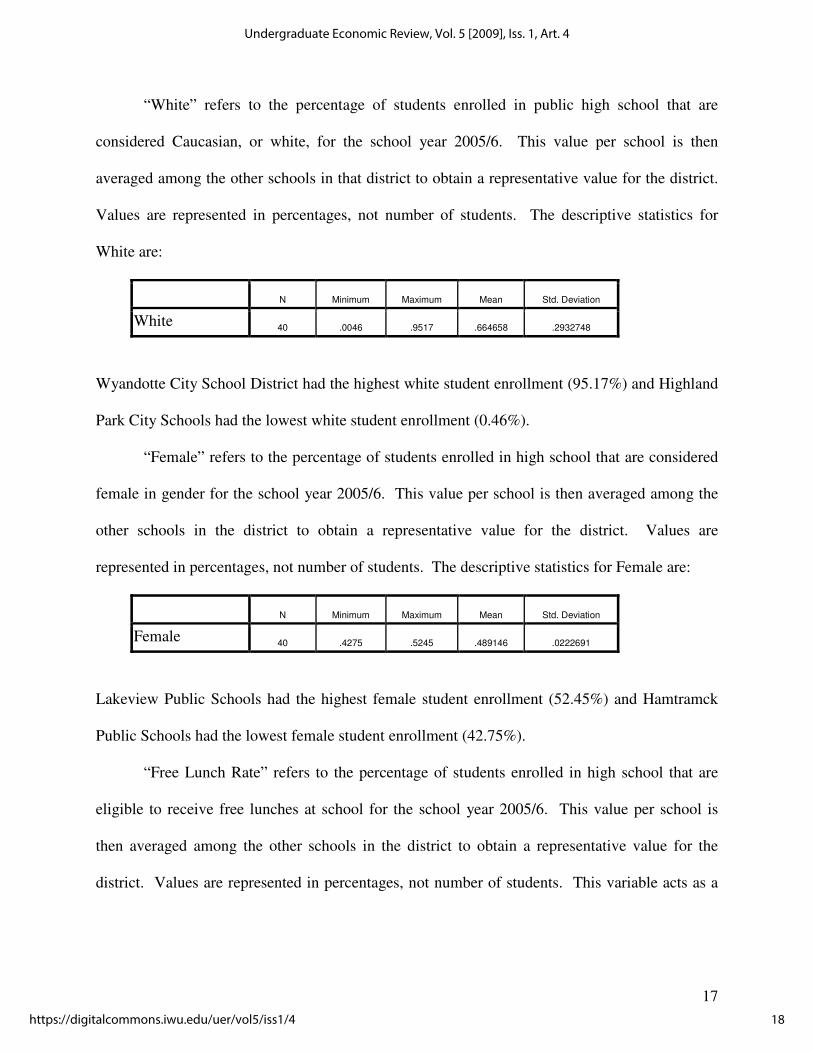
“White” refers to the percentage of students enrolled in public high school that are
considered Caucasian, or white, for the school year 2005/6. This value per school is then
averaged among the other schools in that district to obtain a representative value for the district.
Values are represented in percentages, not number of students. The descriptive statistics for
White are:
N Minimum Maximum Mean Std. Deviation
White 40 .0046 .9517 .664658 .2932748
Wyandotte City School District had the highest white student enrollment (95.17%) and Highland
Park City Schools had the lowest white student enrollment (0.46%).
“Female” refers to the percentage of students enrolled in high school that are considered
female in gender for the school year 2005/6. This value per school is then averaged among the
other schools in the district to obtain a representative value for the district. Values are
represented in percentages, not number of students. The descriptive statistics for Female are:
N Minimum Maximum Mean Std. Deviation
Female 40 .4275 .5245 .489146 .0222691
Lakeview Public Schools had the highest female student enrollment (52.45%) and Hamtramck
Public Schools had the lowest female student enrollment (42.75%).
“Free Lunch Rate” refers to the percentage of students enrolled in high school that are
eligible to receive free lunches at school for the school year 2005/6. This value per school is
then averaged among the other schools in the district to obtain a representative value for the
district. Values are represented in percentages, not number of students. This variable acts as a
18
Undergraduate Economic Review, Vol. 5 [2009], Iss. 1, Art. 4
https://digitalcommons.iwu.edu/uer/vol5/iss1/4
18
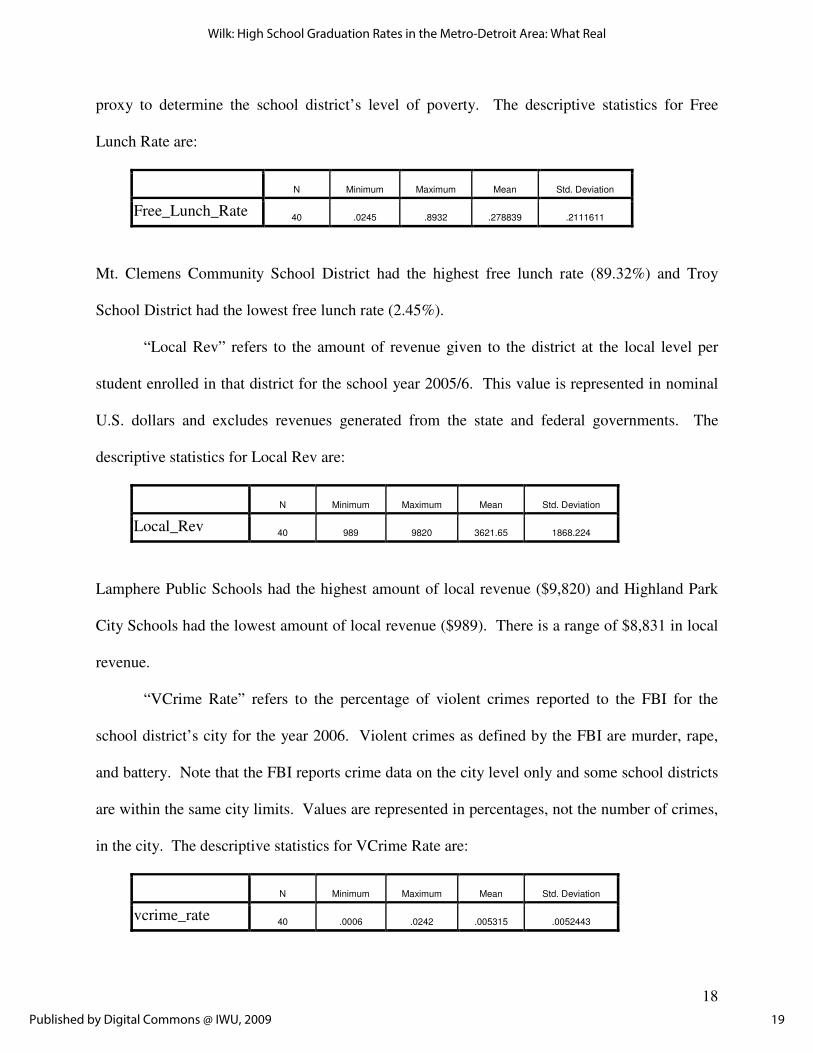
proxy to determine the school district’s level of poverty. The descriptive statistics for Free
Lunch Rate are:
N Minimum Maximum Mean Std. Deviation
Free_Lunch_Rate 40 .0245 .8932 .278839 .2111611
Mt. Clemens Community School District had the highest free lunch rate (89.32%) and Troy
School District had the lowest free lunch rate (2.45%).
“Local Rev” refers to the amount of revenue given to the district at the local level per
student enrolled in that district for the school year 2005/6. This value is represented in nominal
U.S. dollars and excludes revenues generated from the state and federal governments. The
descriptive statistics for Local Rev are:
N Minimum Maximum Mean Std. Deviation
Local_Rev 40 989 9820 3621.65 1868.224
Lamphere Public Schools had the highest amount of local revenue ($9,820) and Highland Park
City Schools had the lowest amount of local revenue ($989). There is a range of $8,831 in local
revenue.
“VCrime Rate” refers to the percentage of violent crimes reported to the FBI for the
school district’s city for the year 2006. Violent crimes as defined by the FBI are murder, rape,
and battery. Note that the FBI reports crime data on the city level only and some school districts
are within the same city limits. Values are represented in percentages, not the number of crimes,
in the city. The descriptive statistics for VCrime Rate are:
N Minimum Maximum Mean Std. Deviation
vcrime_rate 40 .0006 .0242 .005315 .0052443
19
Wilk: High School Graduation Rates in the Metro-Detroit Area: What Real
Published by Digital Commons @ IWU, 2009

19
Detroit City School District had the highest violent crime rate (2.42%) and Clawson City School
District had the lowest (0.06%).
“MEAP Math Sci” refers to the percentage of students enrolled in public school districts
that have met or exceeded the MEAP standards for math and science subjects for the class of
2006. This percentage excludes testing done in reading, writing, and social studies, as I believe
that these subjects are standard basic skills necessary to function in a class room setting. Math
and Science efficiency demonstrates greater skill to succeed beyond the high school level.
Values are represented in percentages, not the number of students. The descriptive statistics for
MEAP Math Sci are:
N Minimum Maximum Mean Std. Deviation
MEAP_math_sci 40 .0400 .7775 .416725 .1614550
Grosse Pointe Public Schools had the highest percent of students passing MEAP tests (77.75%)
and Highland Park City Schools had the lowest (4.0%), a 73.75 percentage point difference.
The equation below represents the econometric model, which predicts that Teacher,
White, Female Local Rev and MEAP variables will have a positive impact on public high school
graduation rates, on average. If my theory is correct, then Free Lunch and VCrime will have a
negative impact on the graduation rate for public high schools in the Metropolitan Detroit area
for the school year 2006, on average.
Grad = b1 + b2Teacher + b3White + b4Female - b5FreeLunch
+ b6LocalRev - b7VCrime + b8MEAP + ei
20
Undergraduate Economic Review, Vol. 5 [2009], Iss. 1, Art. 4
https://digitalcommons.iwu.edu/uer/vol5/iss1/4
20
V. Results
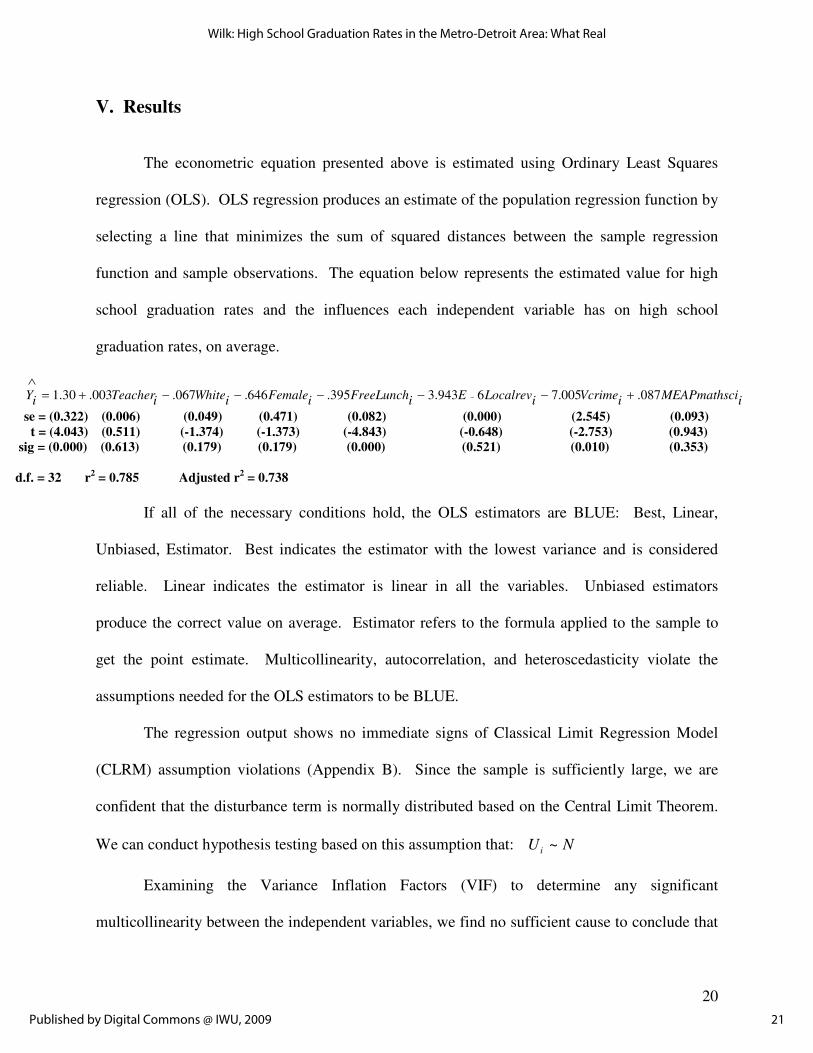
The econometric equation presented above is estimated using Ordinary Least Squares
regression (OLS). OLS regression produces an estimate of the population regression function by
selecting a line that minimizes the sum of squared distances between the sample regression
function and sample observations. The equation below represents the estimated value for high
school graduation rates and the influences each independent variable has on high school
graduation rates, on average.
iiMEAPmathsciVcrimeiLocalrevEiFreeLunchiFemaleiWhiteiTeacheriY 087.005.76943.3395.646.067.003.30.1 +−−−−−+=∧
−
se = (0.322) (0.006) (0.049) (0.471) (0.082) (0.000) (2.545) (0.093)
t = (4.043) (0.511) (-1.374) (-1.373) (-4.843) (-0.648) (-2.753) (0.943)
sig = (0.000) (0.613) (0.179) (0.179) (0.000) (0.521) (0.010) (0.353)
d.f. = 32 r2 = 0.785 Adjusted r
2 = 0.738
If all of the necessary conditions hold, the OLS estimators are BLUE: Best, Linear,
Unbiased, Estimator. Best indicates the estimator with the lowest variance and is considered
reliable. Linear indicates the estimator is linear in all the variables. Unbiased estimators
produce the correct value on average. Estimator refers to the formula applied to the sample to
get the point estimate. Multicollinearity, autocorrelation, and heteroscedasticity violate the
assumptions needed for the OLS estimators to be BLUE.
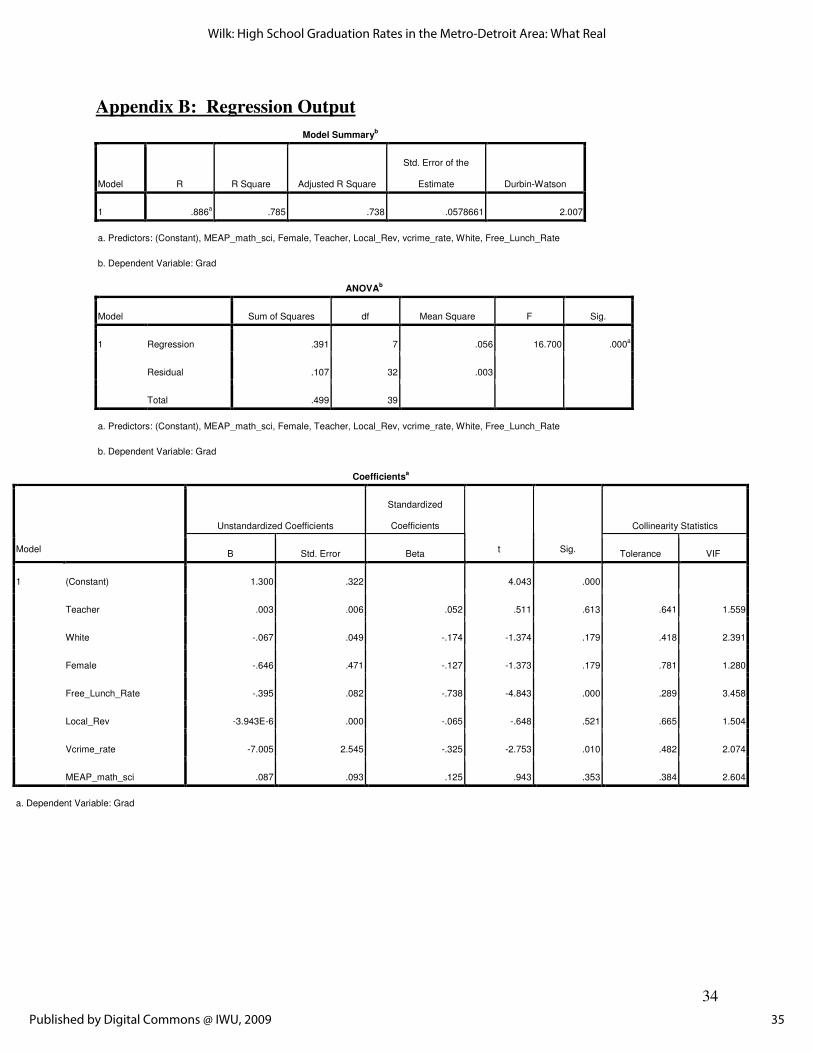
The regression output shows no immediate signs of Classical Limit Regression Model
(CLRM) assumption violations (Appendix B). Since the sample is sufficiently large, we are
confident that the disturbance term is normally distributed based on the Central Limit Theorem.
We can conduct hypothesis testing based on this assumption that: NU i ~
Examining the Variance Inflation Factors (VIF) to determine any significant
multicollinearity between the independent variables, we find no sufficient cause to conclude that
21
Wilk: High School Graduation Rates in the Metro-Detroit Area: What Real
Published by Digital Commons @ IWU, 2009
21
the regression suffers from multicollinearity. Since the largest VIF value is 3.458, for the Free
Lunch Rate variable, is less than 10, we can conclude that there is some collinearity, but it is not
statistically significant: 0),( =ji XXCOR ji≠∀
Since the data collected in this model are cross sectional data and not time series,
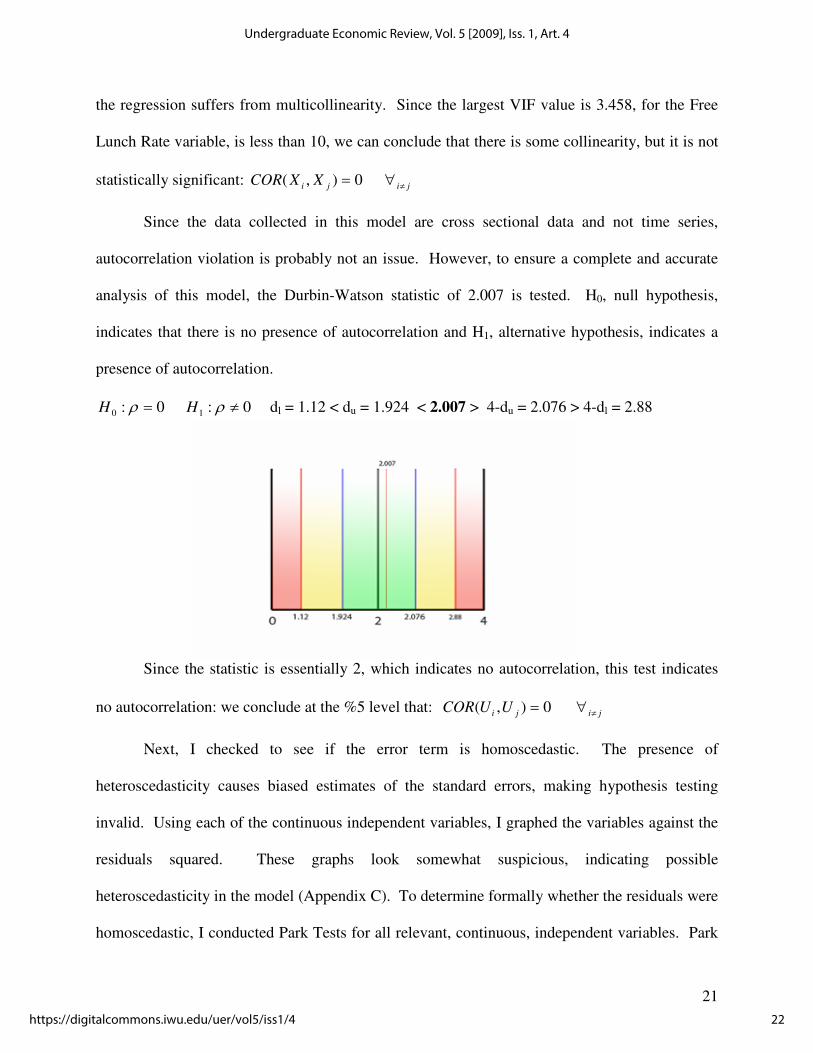
autocorrelation violation is probably not an issue. However, to ensure a complete and accurate
analysis of this model, the Durbin-Watson statistic of 2.007 is tested. H0, null hypothesis,
indicates that there is no presence of autocorrelation and H1, alternative hypothesis, indicates a
presence of autocorrelation.
0:0 =ρH 0:1 ≠ρH dl = 1.12 < du = 1.924 < 2.007 > 4-du = 2.076 > 4-dl = 2.88
Since the statistic is essentially 2, which indicates no autocorrelation, this test indicates
no autocorrelation: we conclude at the %5 level that: 0),( =ji UUCOR ji≠∀
Next, I checked to see if the error term is homoscedastic. The presence of
heteroscedasticity causes biased estimates of the standard errors, making hypothesis testing
invalid. Using each of the continuous independent variables, I graphed the variables against the
residuals squared. These graphs look somewhat suspicious, indicating possible
heteroscedasticity in the model (Appendix C). To determine formally whether the residuals were
homoscedastic, I conducted Park Tests for all relevant, continuous, independent variables. Park
22
Undergraduate Economic Review, Vol. 5 [2009], Iss. 1, Art. 4
https://digitalcommons.iwu.edu/uer/vol5/iss1/4
22
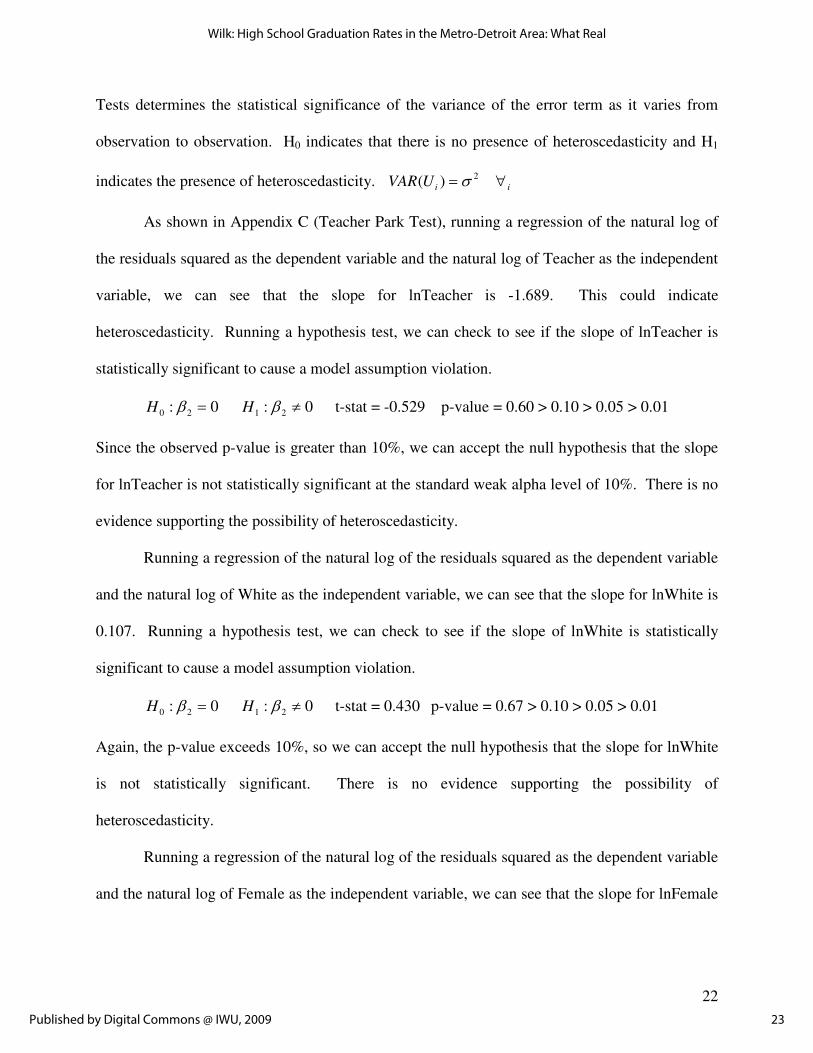
Tests determines the statistical significance of the variance of the error term as it varies from
observation to observation. H0 indicates that there is no presence of heteroscedasticity and H1
indicates the presence of heteroscedasticity. 2)( σ=iUVAR i∀
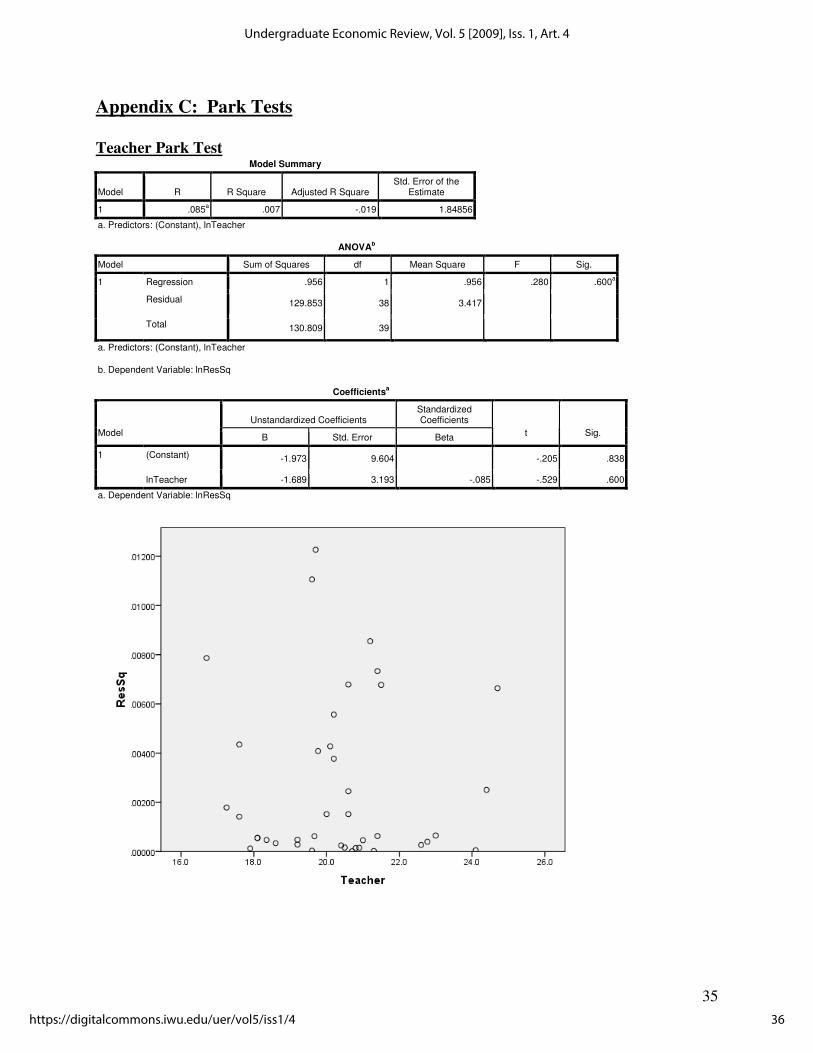
As shown in Appendix C (Teacher Park Test), running a regression of the natural log of
the residuals squared as the dependent variable and the natural log of Teacher as the independent
variable, we can see that the slope for lnTeacher is -1.689. This could indicate
heteroscedasticity. Running a hypothesis test, we can check to see if the slope of lnTeacher is
statistically significant to cause a model assumption violation.
0: 20 =βH 0: 21 ≠βH t-stat = -0.529 p-value = 0.60 > 0.10 > 0.05 > 0.01
Since the observed p-value is greater than 10%, we can accept the null hypothesis that the slope
for lnTeacher is not statistically significant at the standard weak alpha level of 10%. There is no
evidence supporting the possibility of heteroscedasticity.
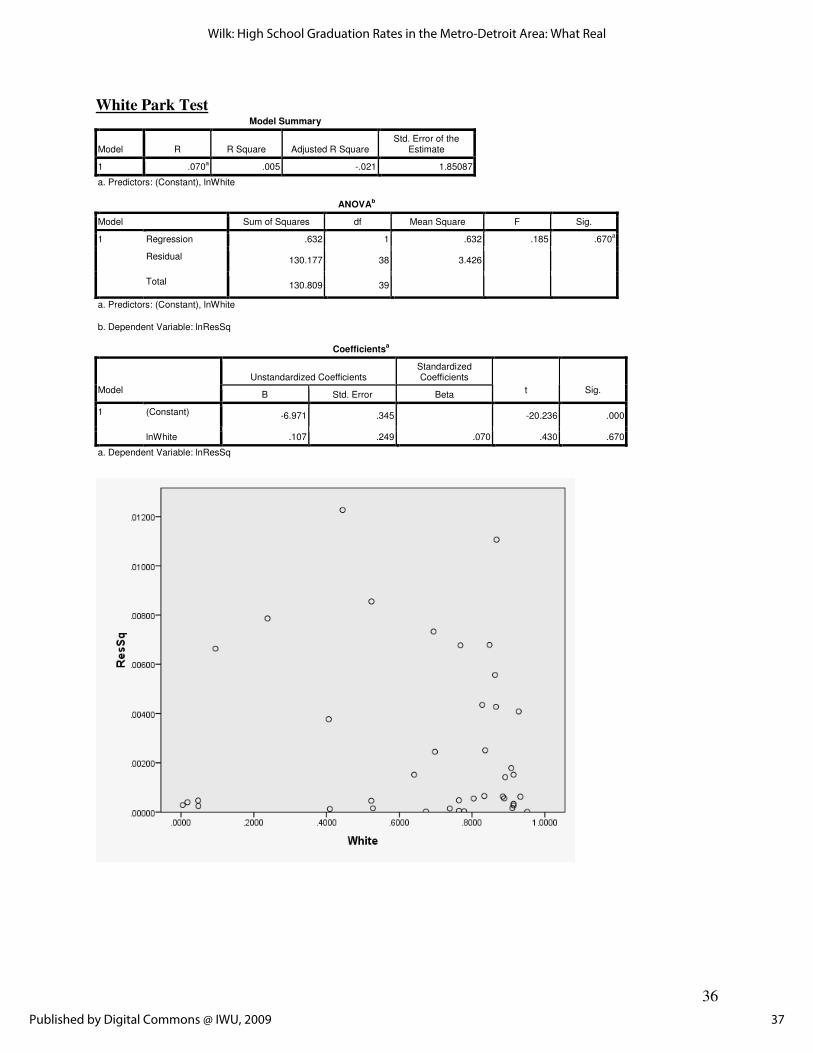
Running a regression of the natural log of the residuals squared as the dependent variable
and the natural log of White as the independent variable, we can see that the slope for lnWhite is
0.107. Running a hypothesis test, we can check to see if the slope of lnWhite is statistically
significant to cause a model assumption violation.
0: 20 =βH 0: 21 ≠βH t-stat = 0.430 p-value = 0.67 > 0.10 > 0.05 > 0.01
Again, the p-value exceeds 10%, so we can accept the null hypothesis that the slope for lnWhite
is not statistically significant. There is no evidence supporting the possibility of
heteroscedasticity.
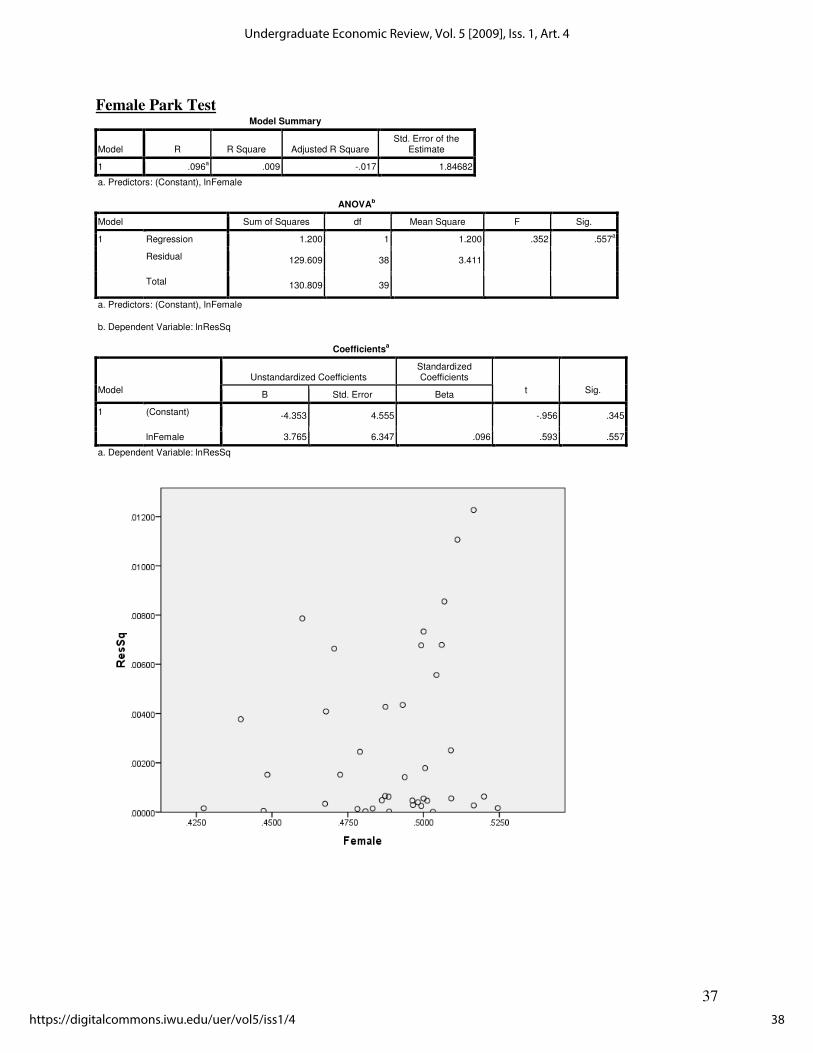
Running a regression of the natural log of the residuals squared as the dependent variable
and the natural log of Female as the independent variable, we can see that the slope for lnFemale
23
Wilk: High School Graduation Rates in the Metro-Detroit Area: What Real
Published by Digital Commons @ IWU, 2009
23
is 3.765. This could indicate heteroscedasticity. We conduct a hypothesis test of the slope of
lnFemale to see if heteroscedasticity is present:
0: 20 =βH 0: 21 ≠βH t-stat = 0.593 p-value = 0.557 > 0.10 > 0.05 > 0.01
Because the p-value exceeds 10%, we can accept the null hypothesis that the slope for lnFemale
is not statistically significant at the standard weak alpha level of 10%. There is no evidence
supporting the possibility of heteroscedasticity.
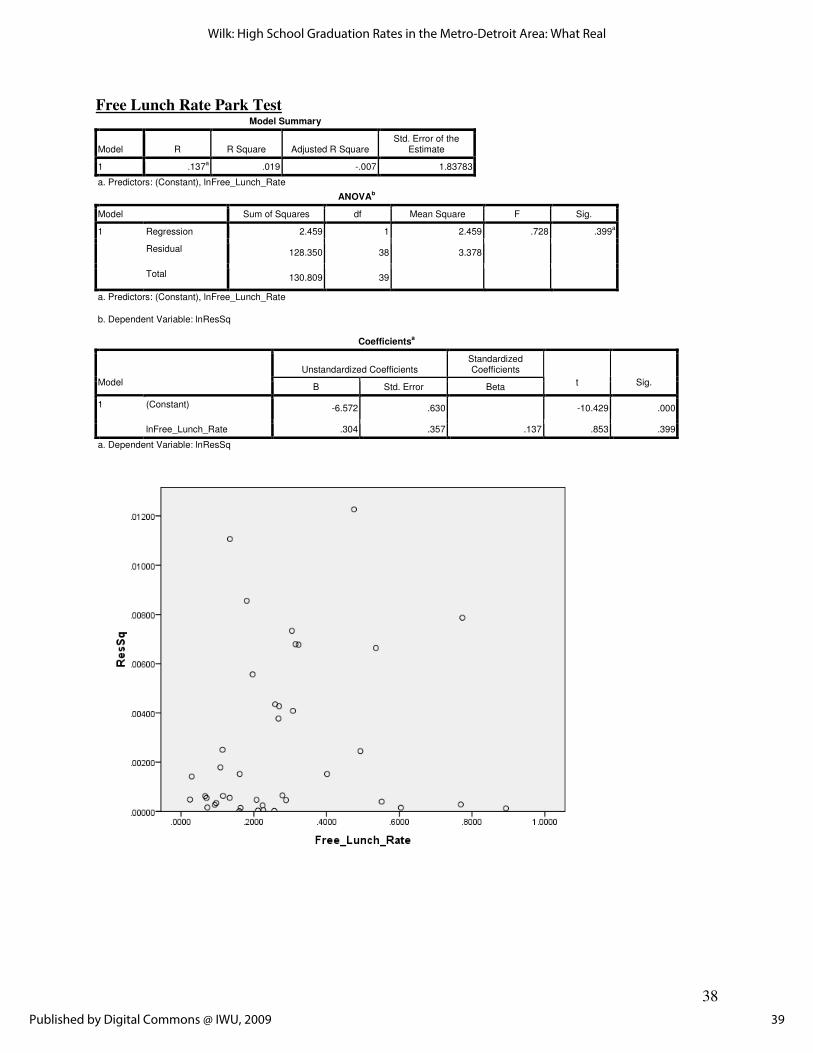
Repeating this process using the natural log of Free Lunch Rate, we can see that the slope
for lnFreeLunchRate is 0.304. The hypothesis test for the slope of lnFreeLunchRate is:
0: 20 =βH 0: 21 ≠βH t-stat = 0.853 p-value = 0.399 > 0.10 > 0.05 > 0.01
We can accept the null hypothesis that the slope for lnFreeLunchRate is not statistically
significant at the standard weak alpha level of 10%. There is no evidence supporting the
possibility of heteroscedasticity.
Running a regression of the natural log of the residuals squared as the dependent variable
and the natural log of Local Rev as the independent variable, we can see that the slope for
lnLocalRev is 0.541. We conduct a hypothesis test of the slope of lnLocalRev to see if
heteroscedasticity is present:
0: 20 =βH 0: 21 ≠βH t-stat = 0.92 p-value = 0.363 > 0.10 > 0.05 > 0.01
Because the p-value exceeds 10%, we can accept the null hypothesis that the slope for
lnLocalRev is not statistically significant at the standard weak alpha level of 10%. There is no
evidence supporting the possibility of heteroscedasticity.
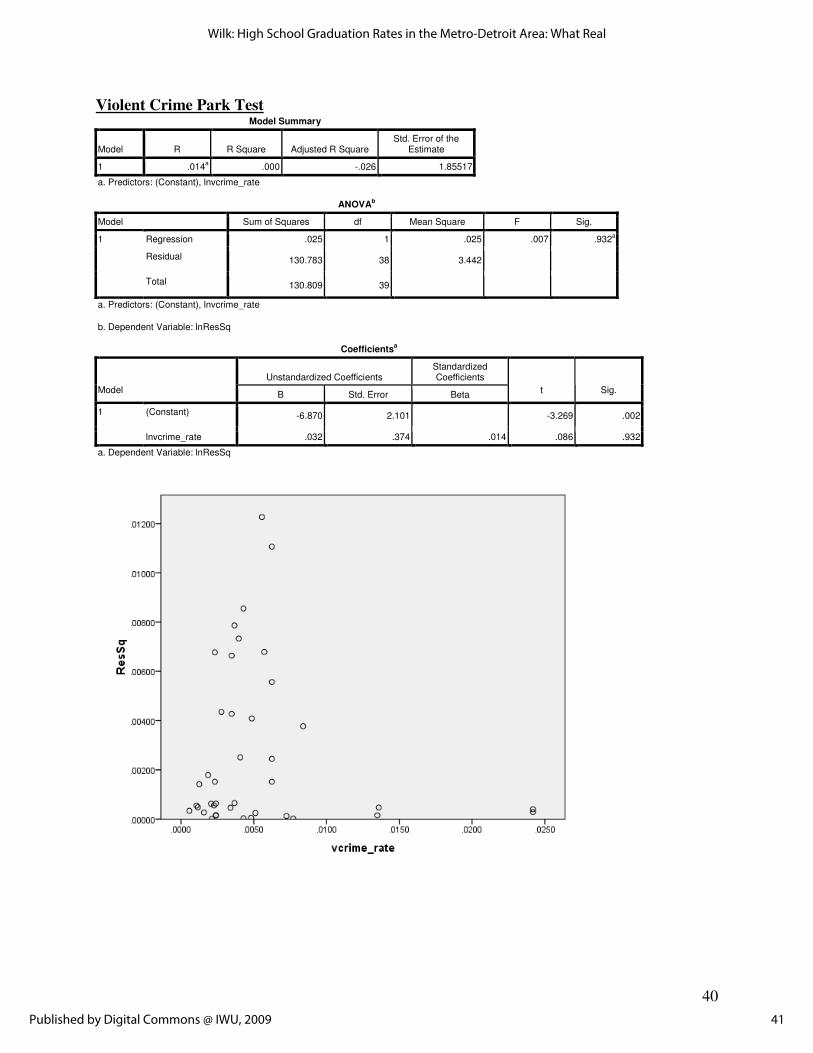
Running a regression of the natural log of the residuals squared as the dependent variable
and the natural log of VCrime as the independent variable, we can see that the slope for
24
Undergraduate Economic Review, Vol. 5 [2009], Iss. 1, Art. 4
https://digitalcommons.iwu.edu/uer/vol5/iss1/4
24
lnVCrime is 0.032. We conduct a hypothesis test of the slope of lnVCrime to see if
heteroscedasticity is present:
0: 20 =βH 0: 21 ≠βH t-stat = 0.086 p-value = 0.932 > 0.10 > 0.05 > 0.01
Since the observed p-value is greater than 10%, we can accept the null hypothesis that the slope
for lnVCrime is not statistically significant at the standard weak alpha level of 10%. There is no
evidence supporting the possibility of heteroscedasticity.
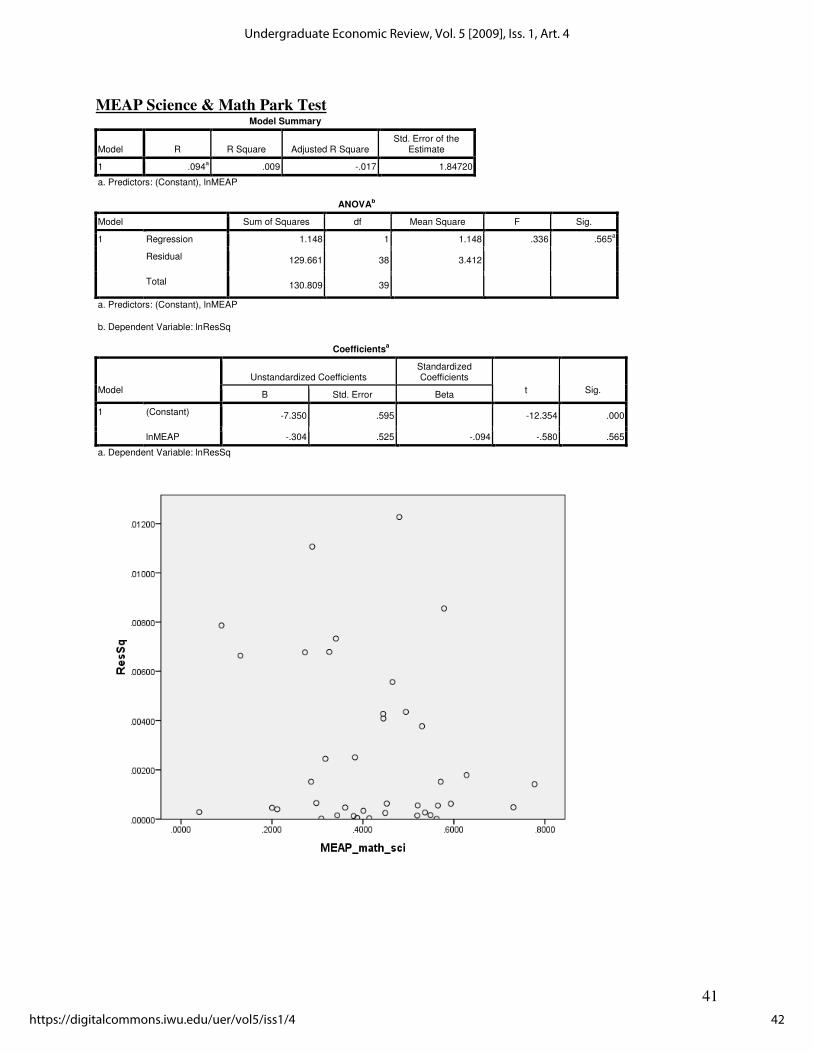
Repeating this process using the natural log of MEAPMathSci, we can see that the slope
for lnMEAPMathSci is -0.304. The hypothesis test for the slope of lnMEAPMathSci is:
0: 20 =βH 0: 21 ≠βH t-stat = -0.58 p-value = 0.565 > 0.10 > 0.05 > 0.01
We can accept the null hypothesis that the slope for lnMEAPMathSci is not statistically
significant at the standard weak alpha level of 10%. There is no evidence supporting the
possibility of heteroscedasticity.
Measurement error is a possibility within the model as the violent crime rates reflect only
crimes reported to the FBI and not the actual number of crimes within the city. Crime statistics
are usually under reported and, even though this is a concern, I believe that there is no better
alternative to collecting crime statistics than through the FBI. Collecting independent crime data
is too costly and time consuming and beyond the scope of this paper.
The graduation rates reported by CEPI and the CCD could be biased due to the double
counting of students held back in previous high school grades, 9th through 12th grade, that go into
the graduation rate of schools four years later. Collecting data from the U.S. Census Bureau is
an alternative, as they record actual household graduation data in the area. However, the data are
only available for 2000. With the introduction of NCLB Act of 2002, I believe the bias has
diminished as schools are more inclined to graduate students to the next grade. This creates a
25
Wilk: High School Graduation Rates in the Metro-Detroit Area: What Real
Published by Digital Commons @ IWU, 2009
25
more precise estimate of high school graduation rates and the possibility of measurement error is
limited.
Finally, there is no evidence that the data collected for this econometric model is
violating any of the CLRM assumptions needed for a BLUE model. There is no statistically
significant collinearity, auto-correlation, or heteroscedasticity between the variables and the
disturbance terms. Measurement error is limited and there is no need to re-run the regression and
we can now start hypothesis testing for levels of significance of the model and its independent
variables.
As shown in Appendix B (Regression Output), the regression explains 73.8% of the
variance in the high school graduation rate. We conduct a hypothesis test to ensure statistical
significance, and to see if the regression actually explains 73.8% of the variance in high school
graduation rates:
0: 2
__
0 =RH 0: 2
__
1 >RH F-stat = 16.7 p-value = 0.00 < 0.01 < 0.05 < 0.10
We reject the null hypothesis and conclude that there is a 0% chance to observe an adjusted R2 of
73.8% if the population’s adjusted R2 is equal to zero. This regression is statistically significant
at the 1% level and the regression explains 73.8% of the variance in high school graduation rates.
This regression works very well.
Examining “Teacher,” we can see the slope is 0.003, meaning that for every additional
student per teacher, there is a 0.003 percentage point increase in the high school graduation rate,
on average, ceteris paribus. We conduct a hypothesis test of the slope of Teacher to determine
statistical significance of a linear association between Teacher and Grad:
0: 20 =βH 0: 21 ≠βH t-stat = 0.511 p-value = 0.613 > 0.10 > 0.05 > 0.01
26
Undergraduate Economic Review, Vol. 5 [2009], Iss. 1, Art. 4
https://digitalcommons.iwu.edu/uer/vol5/iss1/4

26
We accept the null hypothesis and conclude that there is no evidence of a linear association
between the teacher to student ratio and the high school graduation rate at the 10% level of
significance.
To test our theory, we will conduct a hypothesis test for a statistically significant positive
linear relationship between the two variables:
0: 20 ≤βH 0: 21 >βH t-stat = 0.511 p-value = 0.613/2 = 0.3065 > 0.10
We accept the null hypothesis and conclude that there is no evidence to support the theory that
there is a positive association between the teacher to student ratio and the high school graduation
rate at the 10% level.
Examining “White,” we can see that the slope is -0.067, meaning that for every one
percentage point increase in percent of white students, there is a 0.067 percentage point decrease
in the high school graduation rate, on average, ceteris paribus. We conduct a hypothesis test of
the slope of White to determine statistical significance of a linear association between White and
Grad:
0: 30 =βH 0: 31 ≠βH t-stat = -1.374 p-value = 0.179 > 0.10 > 0.05 > 0.01
We accept the null hypothesis and conclude that there is no evidence of a linear association
between the percentage of white students and the high school graduation rate at the 10% level.
Due to the negative slope of the White variable, we suspect the theory is incorrect and we will
conduct a hypothesis test for a statistically significant negative linear relationship between the
two variables:
0: 30 ≥βH 0: 31 <βH t-stat = -1.374 p-value = 0.179/2 = 0.0895 < 0.10, > 0.05
27
Wilk: High School Graduation Rates in the Metro-Detroit Area: What Real
Published by Digital Commons @ IWU, 2009
27
We reject the null hypothesis, concluding that there is evidence to contradict the theory and there
is a weak negative association between the percentage of white students and the high school
graduation rate at the 10% level.
The slope for “Female” is -0.646, meaning that for every one percentage point increase in
female students enrolled in high school, there is a 0.646 percentage point decrease in the high
school graduation rate, on average, ceteris paribus. We conduct a hypothesis test of the slope of
Female to determine statistical significance of a linear association between Female and Grad:
0: 40 =βH 0: 41 ≠βH t-stat = -1.373 p-value = 0.179 > 0.10 > 0.05 > 0.01
We accept the null hypothesis and conclude that there is no evidence of a linear association
between the percentage of female students and the high school graduation rate at the 10% level.
Due to the negative slope of the Female variable, we suspect the theory is incorrect and we will
conduct a hypothesis test for a statistically significant negative linear relationship between the
two variables:
0: 40 ≥βH 0: 41 <βH t-stat = -1.373 p-value = 0.179/2 = 0.0895 < 0.10, > 0.05
We reject the null hypothesis and applied theory, concluding that there is evidence to contradict
the theory, there is a weak negative association between the percentage of female students and
the high school graduation rate at the 10% level.
The “Free Lunch Rate” slope is -0.395, meaning that for every one percentage point
increase in students eligible for free lunch, there is a 0.395 percentage point decrease in the high
school graduation rate, on average, ceteris paribus. We conduct a hypothesis test of the slope of
Free Lunch Rate to determine statistical significance of a linear association between Free Lunch
Rate and Grad:
0: 50 =βH 0: 51 ≠βH t-stat = -4.843 p-value = 0.00 < 0.01 < 0.05 < 0.10
28
Undergraduate Economic Review, Vol. 5 [2009], Iss. 1, Art. 4
https://digitalcommons.iwu.edu/uer/vol5/iss1/4
28
We reject the null hypothesis and conclude that there is strong evidence of a linear association
between the percentage of students eligible for a free lunch and the high school graduation rate at
the 1% level. To test our theory, we will conduct a hypothesis test for a statistically significant
negative linear relationship between the two variables:
0: 50 ≥βH 0: 51 <βH t-stat = -4.843 p-value = 0.00/2 = 0.00 < 0.01
We reject the null hypothesis and conclude that there is evidence of a strong negative association
between the percentage of students eligible for a free lunch and the high school graduation rate at
the 1% level. This supports the theory.
Examining “Local Rev,’ we can see that the slope is -3.943E-6, meaning that for every
one dollar increase in local revenue per student, there is a negative 3.943E-6 percentage point
decrease in the high school graduation rate, on average, ceteris paribus. We conduct a
hypothesis test of the slope of Local Rev to determine statistical significance of a linear
association between Local Rev and Grad:
0: 60 =βH 0: 61 ≠βH t-stat = -0.648 p-value = 0.521 > 0.10 > 0.05 > 0.01
We accept the null hypothesis and conclude that there is no evidence of a linear association
between the amount of local revenue per student and the high school graduation rate at the 10%
level. Due to the negative slope of the Local Rev variable, we suspect the theory is incorrect and
we will conduct a hypothesis test for a statistically significant negative linear relationship
between the two variables:
0: 60 ≥βH 0: 61 <βH t-stat = -0.648 p-value = 0.521/2 = 0.2605 > 0.10
We accept the null hypothesis, concluding that there is no evidence of negative association
between the amount of local revenue per student and the high school graduation rate at the 10%
level.
29
Wilk: High School Graduation Rates in the Metro-Detroit Area: What Real
Published by Digital Commons @ IWU, 2009
29
The slope of “VCrime Rate” is -7.005, meaning that for every one percentage point
increase in the city’s violent crime rate, there is a 7.005 percentage point decrease in the high
school graduation rate, on average, ceteris paribus. We conduct a hypothesis test of the slope of
VCrime to determine statistical significance of a linear association between VCrime Rate and
Grad:
0: 70 =βH 0: 71 ≠βH t-stat = -2.753 p-value = 0.01 = 0.01 < 0.05 < 0.10
We reject the null hypothesis and conclude that there is strong evidence of a linear association
between the violent crime rate of the city and the high school graduation rate at the 1% level. To
test the theory, we will conduct a hypothesis test for a statistically significant negative linear
relationship between the two variables:
0: 70 ≥βH 0: 71 <βH t-stat = -2.753 p-value = 0.01/2 = 0.005 < 0.01
We reject the null hypothesis and conclude that there is evidence of a strong negative association
between the violent crime rate of the city and the high school graduation rate at the 1% level.
This result supports the theoretical model.
Examining “MEAP Math Sci,” we can see that the slope is 0.087, meaning that for every
one percentage point increase in students meeting or exceeding the MEAP standards for math
and science, there is a 0.087 percentage point increase in the high school graduation rate, on
average, ceteris paribus. We conduct a hypothesis test of the slope of MEAP Math Sci to
determine statistical significance of a linear association between MEAP Math Sci and Grad:
0: 80 =βH 0: 81 ≠βH t-stat = 0.943 p-value = 0.353 > 0.10 > 0.05 > 0.01
We accept the null hypothesis and conclude that there is no evidence of a linear association
between the percent of students meeting or exceeding the MEAP standards for math and science
and the high school graduation rate at the 10% level. To test our theory, we will conduct a
30
Undergraduate Economic Review, Vol. 5 [2009], Iss. 1, Art. 4
https://digitalcommons.iwu.edu/uer/vol5/iss1/4
30
hypothesis test for a statistically significant positive linear relationship between the two
variables:
0: 80 ≤βH 0: 81 >βH t-stat = 0.943 p-value = 0.353/2 = 0.1765 > 0.10
We accept the null hypothesis and conclude that there is no evidence of a positive association
between the percent of students meeting or exceeding the MEAP standards for math and science
and the high school graduation rate at the 10% level.
VI. Summary & Conclusions
This paper has created a theoretical economic model explaining the differences in
graduation rates in high schools across school districts in the Metropolitan Detroit area. This
theory was then estimated using SPSS and Ordinary Least Squares (OLS) regression. Even
though this econometric model explains 73.8% of the variance in high school graduation rates, it
is surprising to find that most of the independent variables (Teacher, Local Rev, and MEAP
Math Sci) have no statistically significant effect on high school graduation rates. However, the
percent of white students and the percent of female students have a statistically weak negative
association with average graduation rates. These results contradict the model. The only
variables in this model that are statistically significant and bear the predicted signs were VCrime
Rate and Free Lunch Rate, which is a proxy for poverty in the surrounding area. School districts
with more crime and poverty have lower average graduation rates. These results are consistent
with the hypothesis that crime and poverty pose serious threats to children’s educational
attainment.
With these results, policy makers could effectively implement new policies precisely
targeting violence and poverty in high schools and in their surrounding neighborhoods. This
change in policy could also avoid certain pitfalls of allocating time and resources into certain
31
Wilk: High School Graduation Rates in the Metro-Detroit Area: What Real
Published by Digital Commons @ IWU, 2009
31
variables that have no effect on the graduation rate, such as increasing the number of teachers in
a class room, or increasing local millages directed towards students in schools.
This study also addresses the relevance of standardized tests in our schools, in particular,
the Michigan Educational Assessment Program (MEAP). In this econometric model, there is no
significant correlation between high school graduation rates and students passing the MEAP
math and science tests. One could infer that the ability or importance to pass the MEAP tests is
irrelevant to graduating high school or that high schools do not base student performance on
materials covered in the MEAP math and science sections. This could also present an underlying
social problem concerning our youth’s attitude towards math and science disciplines that cannot
be measured easily and is beyond the scope of this paper.
The theoretical implication that females would benefit more than men in continuing their
education and therefore, increasing high school graduation rates, has weak statistical evidence
proving otherwise in the econometric model. Perhaps an underlying factor of discrimination or
peer pressure to conform to the standard of a less intimidating female figure is responsible for
this weak negative relationship between the percentage of female students and high school
graduation rates. This is a limitation of the model, as measuring for social norms and unreported
discrimination is beyond the scope of this paper.
Even though this model explains a significant portion of the variance in high school
graduation rates, the model is limited due to its limited scope or extreme microeconomic area
studied. Certain factors, such as divorce rates, are recorded only at the county level, not by the
city or school district. This not only excludes a theoretically relevant variable, but limits the
econometric model from fully explaining the variance in high school graduation rates.
32
Undergraduate Economic Review, Vol. 5 [2009], Iss. 1, Art. 4
https://digitalcommons.iwu.edu/uer/vol5/iss1/4

32
With the high school graduation rate in Detroit plummeting below 50% this year, it is
imperative that politicians, communities and families completely understand the problems that
are faced by our public high schools. Education is the key to future productivity, as the students
of today will pave the way to our economy’s future. In order to stabilize and ensure a strong,
productive future economy for Detroit and the rest of Michigan, we must educate our high school
students by minimizing the effects of violent crime and poverty on our community.
33
Wilk: High School Graduation Rates in the Metro-Detroit Area: What Real
Published by Digital Commons @ IWU, 2009

33
Appendix A: Descriptive Statistics
Descriptive Statistics
N Minimum Maximum Mean Std. Deviation
Grad 40 .5484 .9915 .877603 .1130667
Teacher 40 16.7 24.7 20.298 1.8955
White 40 .0046 .9517 .664658 .2932748
Female 40 .4275 .5245 .489146 .0222691
Free_Lunch_Rate 40 .0245 .8932 .278839 .2111611
Local_Rev 40 989 9820 3621.65 1868.224
vcrime_rate 40 .0006 .0242 .005315 .0052443
MEAP_math_sci 40 .0400 .7775 .416725 .1614550
Graduation rates for public high schools came from Michigan’s Department of Education, Center for Educational Performance and Information. A yearly report called “Public Student Graduation/Dropout Data & Reports” found at www.michigan.gom/cepi/0,1607,7-113-21423_30451_30463---,00.html Teacher ratio, White, Female and Free Lunch Rate rates for public high schools came from the National Center for Education Statistics, Common Core of Data, Public Schools found at nces.edu.gov/ccd/schoolsearch and Local Rev rates found at nces.edu.gov.ccd/districtsearch under Fiscal data. VCrime Rate for cities came from the Federal Bureau of Investigation, Crime in the United States, Offenses Known to Law Enforcement Table 8 for Michigan in 2006 found at www.fbi.gov/ucr/cius2006/data/table_08_mi.html MEAP Math Sci rates for public high schools came from Michigan’s Department of Education, Michigan Education Assessment Program found at www.michigan.gov/mde/0,1607,7-140-22709_31168_31530---,00.html
34
Undergraduate Economic Review, Vol. 5 [2009], Iss. 1, Art. 4
https://digitalcommons.iwu.edu/uer/vol5/iss1/4
34
Appendix B: Regression Output
Model Summaryb
Model R R Square Adjusted R Square
Std. Error of the
Estimate Durbin-Watson
1 .886a .785 .738 .0578661 2.007
a. Predictors: (Constant), MEAP_math_sci, Female, Teacher, Local_Rev, vcrime_rate, White, Free_Lunch_Rate
b. Dependent Variable: Grad
ANOVAb
Model Sum of Squares df Mean Square F Sig.
Regression .391 7 .056 16.700 .000a
Residual .107 32 .003
1
Total .499 39
a. Predictors: (Constant), MEAP_math_sci, Female, Teacher, Local_Rev, vcrime_rate, White, Free_Lunch_Rate
b. Dependent Variable: Grad
Coefficientsa
Unstandardized Coefficients
Standardized
Coefficients Collinearity Statistics
Model B Std. Error Beta
t Sig. Tolerance VIF
(Constant) 1.300 .322
4.043 .000
Teacher .003 .006 .052 .511 .613 .641 1.559
White -.067 .049 -.174 -1.374 .179 .418 2.391
Female -.646 .471 -.127 -1.373 .179 .781 1.280
Free_Lunch_Rate -.395 .082 -.738 -4.843 .000 .289 3.458
Local_Rev -3.943E-6 .000 -.065 -.648 .521 .665 1.504
Vcrime_rate -7.005 2.545 -.325 -2.753 .010 .482 2.074
1
MEAP_math_sci .087 .093 .125 .943 .353 .384 2.604
a. Dependent Variable: Grad
35
Wilk: High School Graduation Rates in the Metro-Detroit Area: What Real
Published by Digital Commons @ IWU, 2009
35
Appendix C: Park Tests
Teacher Park Test
Model Summary
Model R R Square Adjusted R Square Std. Error of the
Estimate
1 .085a .007 -.019 1.84856
a. Predictors: (Constant), lnTeacher ANOVA
b
Model Sum of Squares df Mean Square F Sig.
Regression .956 1 .956 .280 .600a
Residual 129.853 38 3.417
1
Total 130.809 39 a. Predictors: (Constant), lnTeacher b. Dependent Variable: lnResSq
Coefficientsa
Unstandardized Coefficients Standardized Coefficients
Model B Std. Error Beta
t Sig.
(Constant) -1.973 9.604 -.205 .838 1
lnTeacher -1.689 3.193 -.085 -.529 .600
a. Dependent Variable: lnResSq
36
Undergraduate Economic Review, Vol. 5 [2009], Iss. 1, Art. 4
https://digitalcommons.iwu.edu/uer/vol5/iss1/4
36
White Park Test Model Summary
Model R R Square Adjusted R Square Std. Error of the
Estimate
1 .070a .005 -.021 1.85087
a. Predictors: (Constant), lnWhite ANOVA
b
Model Sum of Squares df Mean Square F Sig.
Regression .632 1 .632 .185 .670a
Residual 130.177 38 3.426
1
Total 130.809 39 a. Predictors: (Constant), lnWhite b. Dependent Variable: lnResSq
Coefficientsa
Unstandardized Coefficients Standardized Coefficients
Model B Std. Error Beta
t Sig.
(Constant) -6.971 .345 -20.236 .000 1
lnWhite .107 .249 .070 .430 .670
a. Dependent Variable: lnResSq
37
Wilk: High School Graduation Rates in the Metro-Detroit Area: What Real
Published by Digital Commons @ IWU, 2009
37
Female Park Test Model Summary
Model R R Square Adjusted R Square Std. Error of the
Estimate
1 .096a .009 -.017 1.84682
a. Predictors: (Constant), lnFemale ANOVA
b
Model Sum of Squares df Mean Square F Sig.
Regression 1.200 1 1.200 .352 .557a
Residual 129.609 38 3.411
1
Total 130.809 39 a. Predictors: (Constant), lnFemale b. Dependent Variable: lnResSq
Coefficientsa
Unstandardized Coefficients Standardized Coefficients
Model B Std. Error Beta
t Sig.
(Constant) -4.353 4.555 -.956 .345 1
lnFemale 3.765 6.347 .096 .593 .557
a. Dependent Variable: lnResSq
38
Undergraduate Economic Review, Vol. 5 [2009], Iss. 1, Art. 4
https://digitalcommons.iwu.edu/uer/vol5/iss1/4
38
Free Lunch Rate Park Test Model Summary
Model R R Square Adjusted R Square Std. Error of the
Estimate
1 .137a .019 -.007 1.83783
a. Predictors: (Constant), lnFree_Lunch_Rate
ANOVAb
Model Sum of Squares df Mean Square F Sig.
Regression 2.459 1 2.459 .728 .399a
Residual 128.350 38 3.378
1
Total 130.809 39 a. Predictors: (Constant), lnFree_Lunch_Rate b. Dependent Variable: lnResSq
Coefficientsa
Unstandardized Coefficients Standardized Coefficients
Model B Std. Error Beta
t Sig.
(Constant) -6.572 .630 -10.429 .000 1
lnFree_Lunch_Rate .304 .357 .137 .853 .399
a. Dependent Variable: lnResSq
39
Wilk: High School Graduation Rates in the Metro-Detroit Area: What Real
Published by Digital Commons @ IWU, 2009

39
Local Revenue Park Test Model Summary
Model R R Square Adjusted R Square Std. Error of the
Estimate
1 .148a .022 -.004 1.83502
a. Predictors: (Constant), lnLocal_Rev ANOVA
b
Model Sum of Squares df Mean Square F Sig.
Regression 2.852 1 2.852 .847 .363a
Residual 127.957 38 3.367
1
Total 130.809 39 a. Predictors: (Constant), lnLocal_Rev b. Dependent Variable: lnResSq
Coefficientsa
Unstandardized Coefficients Standardized Coefficients
Model B Std. Error Beta
t Sig.
(Constant) -11.421 4.759 -2.400 .021 1
lnLocal_Rev .541 .588 .148 .920 .363
a. Dependent Variable: lnResSq
40
Undergraduate Economic Review, Vol. 5 [2009], Iss. 1, Art. 4
https://digitalcommons.iwu.edu/uer/vol5/iss1/4
40
Violent Crime Park Test Model Summary
Model R R Square Adjusted R Square Std. Error of the
Estimate
1 .014a .000 -.026 1.85517
a. Predictors: (Constant), lnvcrime_rate ANOVA
b
Model Sum of Squares df Mean Square F Sig.
Regression .025 1 .025 .007 .932a
Residual 130.783 38 3.442
1
Total 130.809 39 a. Predictors: (Constant), lnvcrime_rate b. Dependent Variable: lnResSq
Coefficientsa
Unstandardized Coefficients Standardized Coefficients
Model B Std. Error Beta
t Sig.
(Constant) -6.870 2.101 -3.269 .002 1
lnvcrime_rate .032 .374 .014 .086 .932
a. Dependent Variable: lnResSq
41
Wilk: High School Graduation Rates in the Metro-Detroit Area: What Real
Published by Digital Commons @ IWU, 2009
41
MEAP Science & Math Park Test Model Summary
Model R R Square Adjusted R Square Std. Error of the
Estimate
1 .094a .009 -.017 1.84720
a. Predictors: (Constant), lnMEAP ANOVA
b
Model Sum of Squares df Mean Square F Sig.
Regression 1.148 1 1.148 .336 .565a
Residual 129.661 38 3.412
1
Total 130.809 39 a. Predictors: (Constant), lnMEAP b. Dependent Variable: lnResSq
Coefficientsa
Unstandardized Coefficients Standardized Coefficients
Model B Std. Error Beta
t Sig.
(Constant) -7.350 .595 -12.354 .000 1
lnMEAP -.304 .525 -.094 -.580 .565
a. Dependent Variable: lnResSq
42
Undergraduate Economic Review, Vol. 5 [2009], Iss. 1, Art. 4
https://digitalcommons.iwu.edu/uer/vol5/iss1/4
42
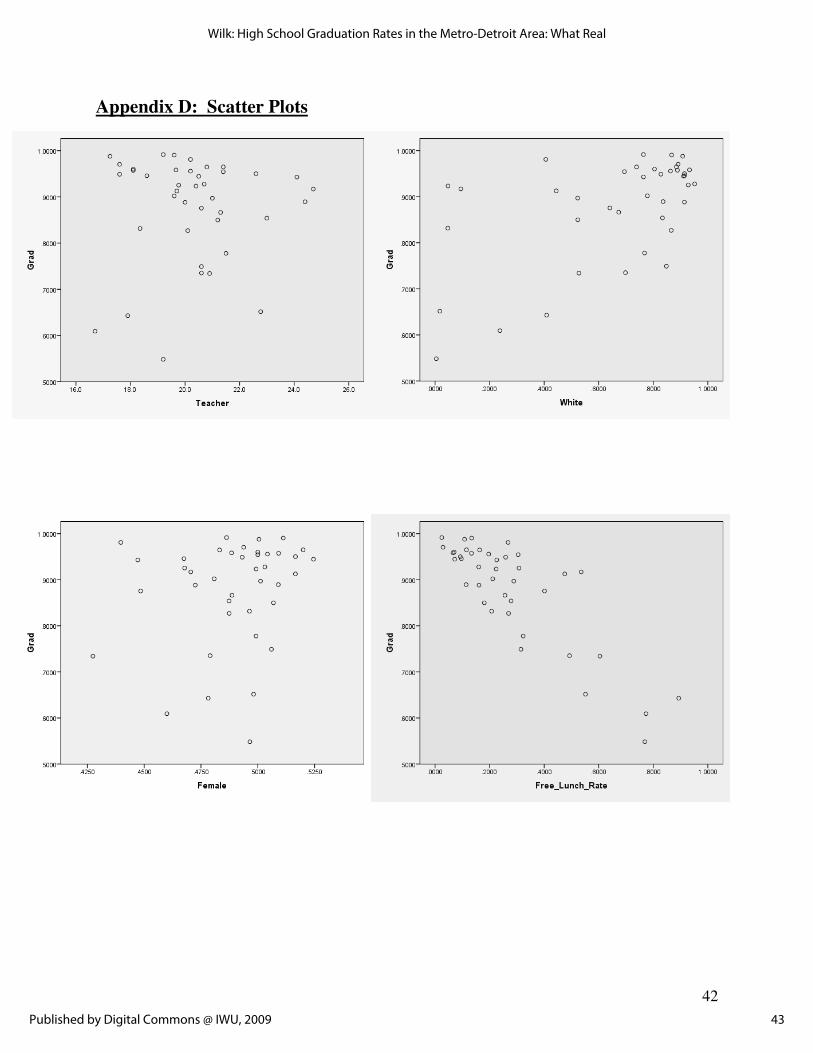
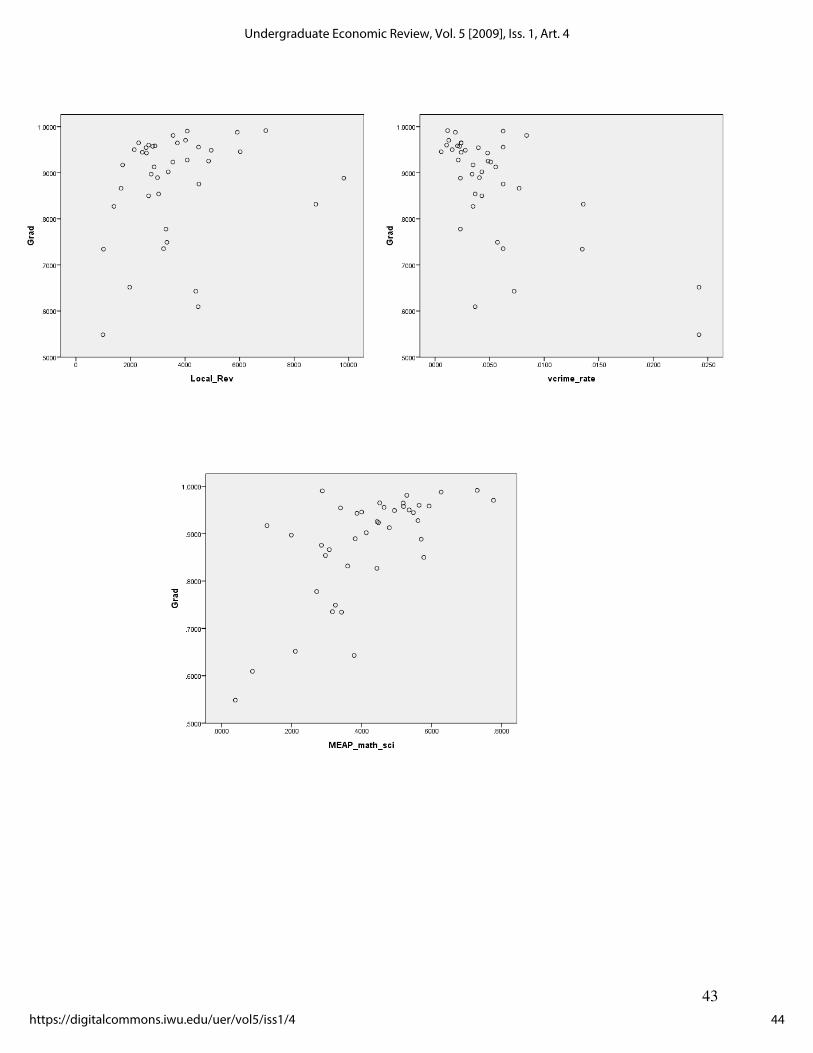
Appendix D: Scatter Plots
43
Wilk: High School Graduation Rates in the Metro-Detroit Area: What Real
Published by Digital Commons @ IWU, 2009
43
44
Undergraduate Economic Review, Vol. 5 [2009], Iss. 1, Art. 4
https://digitalcommons.iwu.edu/uer/vol5/iss1/4
44
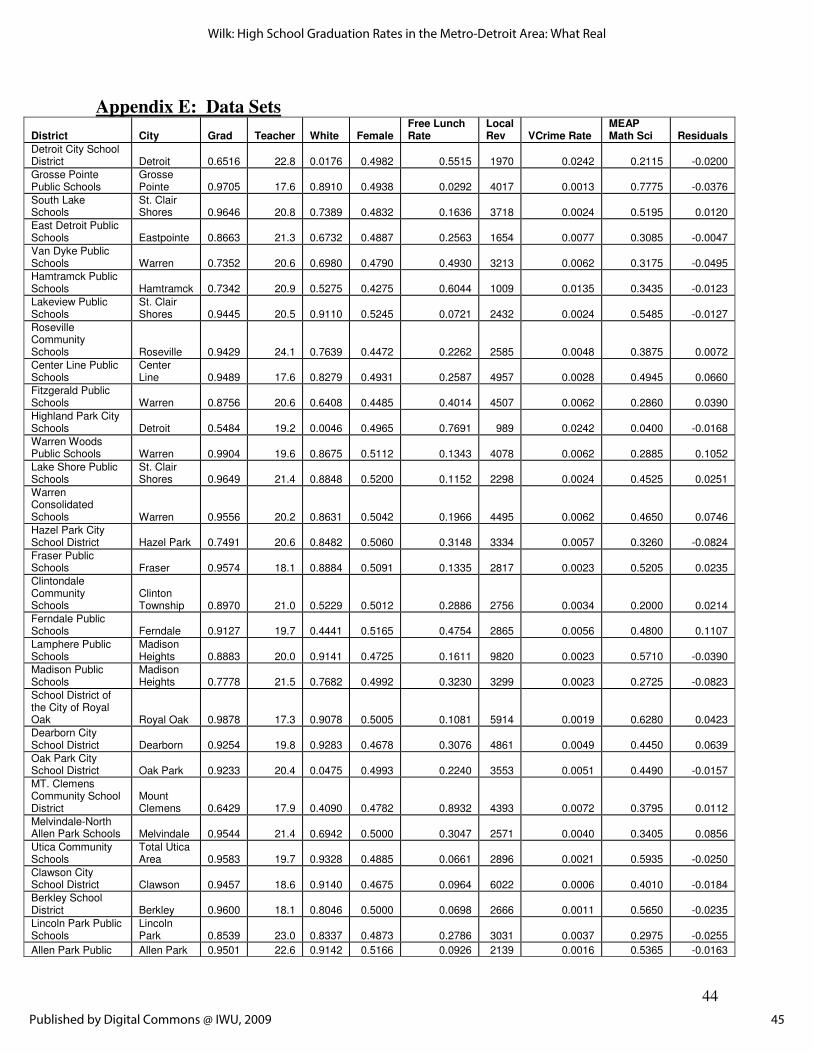
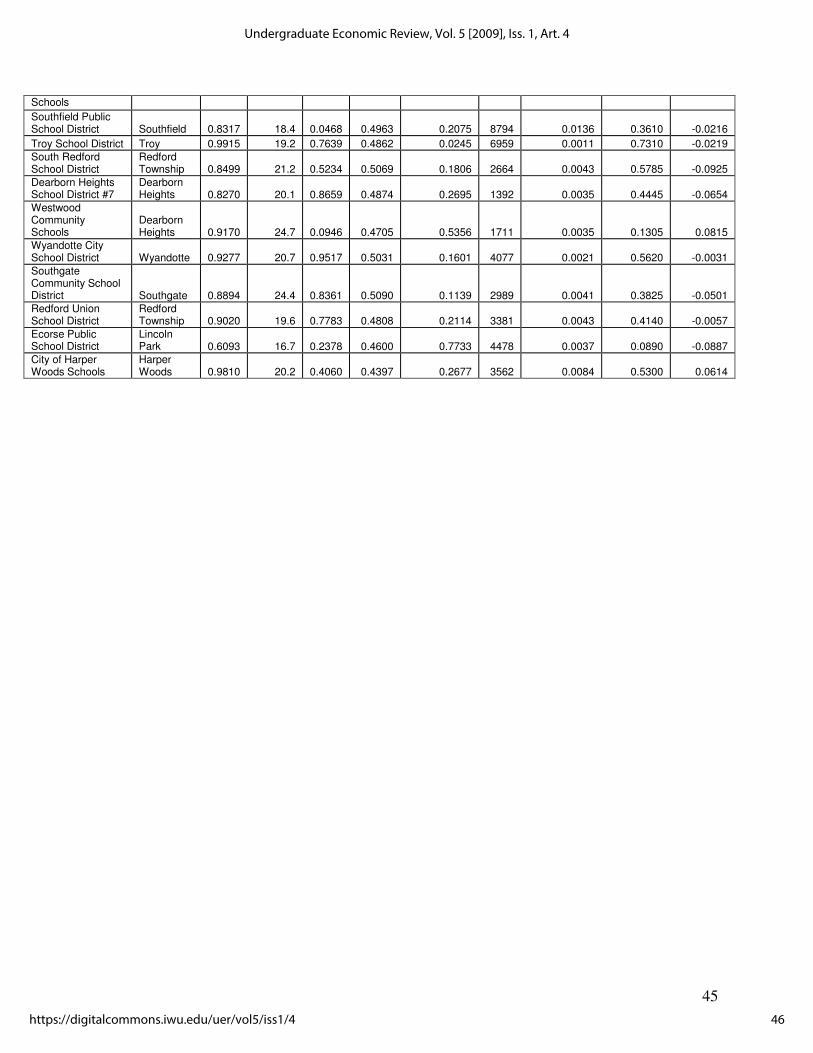
Appendix E: Data Sets
District City Grad Teacher White Female Free Lunch Rate
Local Rev VCrime Rate
MEAP Math Sci Residuals
Detroit City School District Detroit 0.6516 22.8 0.0176 0.4982 0.5515 1970 0.0242 0.2115 -0.0200
Grosse Pointe Public Schools
Grosse Pointe 0.9705 17.6 0.8910 0.4938 0.0292 4017 0.0013 0.7775 -0.0376
South Lake Schools
St. Clair Shores 0.9646 20.8 0.7389 0.4832 0.1636 3718 0.0024 0.5195 0.0120
East Detroit Public Schools Eastpointe 0.8663 21.3 0.6732 0.4887 0.2563 1654 0.0077 0.3085 -0.0047
Van Dyke Public Schools Warren 0.7352 20.6 0.6980 0.4790 0.4930 3213 0.0062 0.3175 -0.0495
Hamtramck Public Schools Hamtramck 0.7342 20.9 0.5275 0.4275 0.6044 1009 0.0135 0.3435 -0.0123
Lakeview Public Schools
St. Clair Shores 0.9445 20.5 0.9110 0.5245 0.0721 2432 0.0024 0.5485 -0.0127
Roseville Community Schools Roseville 0.9429 24.1 0.7639 0.4472 0.2262 2585 0.0048 0.3875 0.0072
Center Line Public Schools
Center Line 0.9489 17.6 0.8279 0.4931 0.2587 4957 0.0028 0.4945 0.0660
Fitzgerald Public Schools Warren 0.8756 20.6 0.6408 0.4485 0.4014 4507 0.0062 0.2860 0.0390
Highland Park City Schools Detroit 0.5484 19.2 0.0046 0.4965 0.7691 989 0.0242 0.0400 -0.0168
Warren Woods Public Schools Warren 0.9904 19.6 0.8675 0.5112 0.1343 4078 0.0062 0.2885 0.1052
Lake Shore Public Schools
St. Clair Shores 0.9649 21.4 0.8848 0.5200 0.1152 2298 0.0024 0.4525 0.0251
Warren Consolidated Schools Warren 0.9556 20.2 0.8631 0.5042 0.1966 4495 0.0062 0.4650 0.0746
Hazel Park City School District Hazel Park 0.7491 20.6 0.8482 0.5060 0.3148 3334 0.0057 0.3260 -0.0824
Fraser Public Schools Fraser 0.9574 18.1 0.8884 0.5091 0.1335 2817 0.0023 0.5205 0.0235
Clintondale Community Schools
Clinton Township 0.8970 21.0 0.5229 0.5012 0.2886 2756 0.0034 0.2000 0.0214
Ferndale Public Schools Ferndale 0.9127 19.7 0.4441 0.5165 0.4754 2865 0.0056 0.4800 0.1107
Lamphere Public Schools
Madison Heights 0.8883 20.0 0.9141 0.4725 0.1611 9820 0.0023 0.5710 -0.0390
Madison Public Schools
Madison Heights 0.7778 21.5 0.7682 0.4992 0.3230 3299 0.0023 0.2725 -0.0823
School District of the City of Royal Oak Royal Oak 0.9878 17.3 0.9078 0.5005 0.1081 5914 0.0019 0.6280 0.0423
Dearborn City School District Dearborn 0.9254 19.8 0.9283 0.4678 0.3076 4861 0.0049 0.4450 0.0639
Oak Park City School District Oak Park 0.9233 20.4 0.0475 0.4993 0.2240 3553 0.0051 0.4490 -0.0157
MT. Clemens Community School District
Mount Clemens 0.6429 17.9 0.4090 0.4782 0.8932 4393 0.0072 0.3795 0.0112
Melvindale-North Allen Park Schools Melvindale 0.9544 21.4 0.6942 0.5000 0.3047 2571 0.0040 0.3405 0.0856
Utica Community Schools
Total Utica Area 0.9583 19.7 0.9328 0.4885 0.0661 2896 0.0021 0.5935 -0.0250
Clawson City School District Clawson 0.9457 18.6 0.9140 0.4675 0.0964 6022 0.0006 0.4010 -0.0184
Berkley School District Berkley 0.9600 18.1 0.8046 0.5000 0.0698 2666 0.0011 0.5650 -0.0235
Lincoln Park Public Schools
Lincoln Park 0.8539 23.0 0.8337 0.4873 0.2786 3031 0.0037 0.2975 -0.0255
Allen Park Public Allen Park 0.9501 22.6 0.9142 0.5166 0.0926 2139 0.0016 0.5365 -0.0163
45
Wilk: High School Graduation Rates in the Metro-Detroit Area: What Real
Published by Digital Commons @ IWU, 2009
45
Schools
Southfield Public School District Southfield 0.8317 18.4 0.0468 0.4963 0.2075 8794 0.0136 0.3610 -0.0216
Troy School District Troy 0.9915 19.2 0.7639 0.4862 0.0245 6959 0.0011 0.7310 -0.0219
South Redford School District
Redford Township 0.8499 21.2 0.5234 0.5069 0.1806 2664 0.0043 0.5785 -0.0925
Dearborn Heights School District #7
Dearborn Heights 0.8270 20.1 0.8659 0.4874 0.2695 1392 0.0035 0.4445 -0.0654
Westwood Community Schools
Dearborn Heights 0.9170 24.7 0.0946 0.4705 0.5356 1711 0.0035 0.1305 0.0815
Wyandotte City School District Wyandotte 0.9277 20.7 0.9517 0.5031 0.1601 4077 0.0021 0.5620 -0.0031
Southgate Community School District Southgate 0.8894 24.4 0.8361 0.5090 0.1139 2989 0.0041 0.3825 -0.0501
Redford Union School District
Redford Township 0.9020 19.6 0.7783 0.4808 0.2114 3381 0.0043 0.4140 -0.0057
Ecorse Public School District
Lincoln Park 0.6093 16.7 0.2378 0.4600 0.7733 4478 0.0037 0.0890 -0.0887
City of Harper Woods Schools
Harper Woods 0.9810 20.2 0.4060 0.4397 0.2677 3562 0.0084 0.5300 0.0614
46
Undergraduate Economic Review, Vol. 5 [2009], Iss. 1, Art. 4
https://digitalcommons.iwu.edu/uer/vol5/iss1/4
46
Bibliography
Dearden, Lorraine, et al. Education Subsidies and School Drop-out Rates. Institute for Fiscal
Studies, IFS Working Papers: W05/11, 2005.
Federal Bureau of Investigation, Crime in the United States, Offences Known to Law
Enforcement, www.fbi.gov/ucr/cius2006/data/table_08_mi.html, 2008.
Gujarati, Damodar N. Essentials of Econometrics, 3rd ed., McGraw-Hill, New York, 2006.
Heckman, James J., and Paul A. LaFontaine. The American High School Graduation Rate:
Trends and Levels. National Bureau of Economic Research, Inc. NBER Working
Papers: 13670, 2007.
National Center of Education Statistics, Common Core of Data - Public Schools,
nces.ed.gov/ccd/schoolsearch, 2006.
National Center of Education Statistics, Common Core of Data – School Districts,
nces.ed.gov/ccd/districtsearch, 2006.
Shaffer, Ron and Steve Deller. Community Economics, Linking Theory and Practice, 2nd ed.,
Blackwell Publishing, Ames, 2004.
State of Michigan, Center for Educational Performance & Information (CEPI) – Public Student
Graduation/Dropout Data & Reports, www.michigan.gov/cepi/0,1607,7-113-
21423_30451_30463---,00.html, 2008.
State of Michigan, Michigan Educational Assessment Program (MEAP),
www.michigan.gov/mde/0,1607,7-140-22709_31168_31530---,00.html, 2008.
Vartanian, Thomas P., and Phillip M. Gleason. “Do Neighborhood Conditions Affect High
School Dropout and College Graduation Rates?” Journal of Socio-Economics. v28.n1
(1999): 21-41.
47
Wilk: High School Graduation Rates in the Metro-Detroit Area: What Real
Published by Digital Commons @ IWU, 2009