Embed Size (px)
Citation preview

THE PENNSYLVANIA STATE UNIVERSITY
UNDERGRADUATE STUDIES
DEPARTMENT OF SOCIOLOGY AND CRIMINOLOGY
PERCEPTIONS OF THE GLASS CEILING
AN ASSESSMENT OF PENN STATE STUDENTS’ OPINIONS ON GENDER AND RACIAL BARRIERS IN
HIGHER LEVEL CAREER POSITIONS
Kimberly J. Donovan
Spring 2015
A thesis
submitted in
partial fulfillment of the requirements
for a baccalaureate degree
in Criminology with honors in Criminology
Reviewed and approved* by the following:
Laurie K. Scheuble
Senior Lecturer in Sociology
Thesis Supervisor
Stacy Rogers Silver
Associate Professor of Sociology and Human Development
Honors Adviser
* Signatures are on file in the Schreyer Honors College.
i
ABSTRACT
This research focuses on the presence of the glass ceiling by asking respondents to evaluate the job and family
experiences of an individual with the same life story. The only thing that varied is whether the person in the
vignette was male or female and Black or White. Race and sex differences in predicted reactions to seven of the
job and family situations presented to the respondents. While respondents reported that a Black female is more
likely than a White male to receive a job out of college in the career she prefers, Black females are also perceived
to make significantly less money 20 years into their career than White males. Implications of the findings are
discussed.
Key words: glass ceiling, gender, race, work, family
ii Table of Contents
Contents ABSTRACT ................................................................................................................................................................ i
Table of Contents....................................................................................................................................................... ii
Introduction ................................................................................................................................................................ 1
Literature Review ....................................................................................................................................................... 2 Theoretical Frameworks ............................................................................................................................................. 2
Marxian Theory .......................................................................................................................................................... 3
Social Identity Theory ................................................................................................................................................. 4
Status Characteristics Theory ..................................................................................................................................... 5
The Glass Ceiling ......................................................................................................................................................... 7
Racial Minorities and the Glass Ceiling ..................................................................................................................... 12
Methods ..................................................................................................................................................................... 14 Participants ............................................................................................................................................................... 14
Materials and Procedures ........................................................................................................................................ 14
Dependent Variables ................................................................................................................................................ 15
Control Variables ...................................................................................................................................................... 15
Findings ..................................................................................................................................................................... 16
Discussion .................................................................................................................................................................. 18 Limitation ................................................................................................................................................................. 20
Conclusion ................................................................................................................................................................. 21
Table 2. Manager ........................................................................................................................................................ 23
Table 3. First Job. ....................................................................................................................................................... 24
Table 4. Higher Education. ........................................................................................................................................ 25
Table 5. Money Earned 20 years into Career.. .......................................................................................................... 26
Table 6. “Start Family”. .............................................................................................................................................. 27
Table 7. “Kids Prevent”. ............................................................................................................................................ 28
Table 8. “Advance 10 Years”. ................................................................................................................................... 29
References ................................................................................................................................................................. 30
Appendix A – Gender Role Scales......................................................................................................................... 384
Appendix B- Survey ................................................................................................................................................. 39

iii Acknowledgements
I would like to thank the Pennsylvania State University for the surplus of opportunities to learn and grow both
professionally and personally. From Holly Beaver, the Coordinator of Undergraduate Education and Student
Service, Maria Mosley, Coordinator of Residence Life, to Lindsay Kowalski in the Department of Student
Conduct, the surplus of student services has been beyond accommodating and supportive in my pursuit of my
undergraduate career.
I would also like to thank the entire Sociology and Criminology Department at Penn State, from the plethora of
educators to the academic advisers who take the time to teach and help students every day.
I would like to acknowledge Laurie Scheuble and Caren Bloom for their guidance and support. I could not state in
words how thankful I am to have had such amazing role models these past few years. Their influence has
motivated me to continue working towards the next level, first and foremost internally. Thank you both.
Matt Ferguson and Nietzsche Donovan-Ferguson have also been exceptional support systems and I
thank them for serving as ever persistent listeners, editors, and commenters.
Kim Massetti, thank you for being my second mom since I can remember.
Words are never enough.

1
Introduction
First noted by Gay Bryant in The Working Woman Report (1984), the ‘glass ceiling’ and women and
minority’s rights, have been a topic of discussion for decades. According to Coyne, Coyne, & Lee (2004), the
definition of the ‘glass ceiling’ refers to “an upper limit to professional advancement, especially as imposed upon
women, that is not readily perceived or openly acknowledged” (pg. 15).
Due to important changes in society including delayed marriage and childbearing, and increases in
women in the labor force, the issue of gender discrimination became a focal issue. The Glass Ceiling Act Title II
of the Rights Act of 1991 gave way to extensive research concerning women and minority’s discrepancies in the
workforce. One of the main objectives for the Federal Glass Ceiling Commission was to find invisible barriers
hindering women and minorities from moving up the “corporate ladder”. The glass ceiling is predominantly said to
be a “metaphor for the invisible and artificial barriers that block women and minorities from advancing up the
corporate ladder to management and executive positions” (Johns, 2013, p. 1). The Glass Ceiling Commission,
established by the Glass Ceiling Act of 1991, gave proof of the seemingly invisible, yet impermeable, barriers
women and minorities face. In 1995, Johns (2013) stated that the Glass Ceiling Commission “noted that only 3 to
5 percent of senior management positions in Fortune 500 companies were filled by women…that where women
held senior positions, their compensation was lower than that of their male counterparts,” and that “Furthermore,
the commission’s findings showed that for women who were in senior positions, the types of positions they held
were in areas such as human resources or research, which are not part of the usual pipeline or career pathway to
executive positions” (pg. 2-3). As of 2014, 4.8 percent (24 women) of the Fortune 500 companies have female
CEOs (Banga, 2014). Even at a greater disadvantage are racial minorities, with only nine African-American CEOs
in the Fortune 500 as of February 2010 (Kaplan, 2011).
The focus of my thesis is to assess students’ perceptions of the glass ceiling in relation to career
advancement opportunities while controlling for specific demographic variables such as gender, race, and

2
socioeconomic status as well as other background information. Data for my study come from a 2015 convenience
sample of 608 students at a large northeastern university. I examine the following hypotheses:
H1) Controlling for race and gender of the respondent, females are less likely to be
expected to advance in their career than males,.
H2) Controlling for race and gender of the respondent, females are more likely to be
expected to stay home to raise a family as compared to males.
H3) Black females will have lower career advancement expectations than any other
combination of race and gender.
H4) Racial minorities will be more likely to perceive discrimination towards
minorities as compared to Whites.
H5) The greater the student’s feminist views, the more likely she/he is to have equal
expectations for career advancement, regardless of race or gender differences.
H6) White males will perceive less discrimination towards women and racial
minorities than their counterparts.
Literature Review Theoretical Frameworks
There are a number of barriers impeding women and minority’s success in senior and executive positions,
as well as barriers in career advancement in a plethora of workforce fields. Political, familial, social and economic
obstacles all impact women and minority’s success in moving up to higher level career positions. Ridgeway,
Cecilia, Backor, Li, Tinkler, & Erickson, (2009) assessed the consequences of status distinctions based on social
differences (i.e. race, ethnicity, and gender). Status distinctions are said to “implicitly bias the everyday processes
through which people are evaluated, given access to rewards, and directed toward or away from positions of
power and prestige in society” (Ridgeway et. al., pg. 44-45). Beliefs about status distinctions are associated with
social worthiness, expectations, and competence and are and conceded as a social reality of the in-group out-
group distinction, and therefore the social reality of the disadvantaged and advantaged.

3
Similar to Cooley’s ‘looking glass self’ theory, status distinction effect the way in which individuals are
treated and reinforce, because of reactions, the stereotypes associated with status distinctions such as race and
gender. When status distinctions are obvious and diverse participants are required to work together for a common
goal, such as the workforce, a hierarchy of esteem and competence plagues the group- often based on socially
constructed prejudices associated with status distinctions (Ridgeway & Correll 2006). Similar to the social
identity theory experiment by Tajfel and Turner (1979), which shows how little similarity it takes to form in- and
out-groups, status distinctions are, in relation to this thesis, visible physical characteristics that are thought to hold
inhibitory presumptions towards racial and ethnic minorities and women. With the preceding information in mind,
the Marxian Theory, Social Identity Theory, and Status Characteristics Theory are used to aid in the explanations
of the results of the survey on students’ perceptions of the glass ceiling.
Marxian Theory
In The Communist Manifesto, Karl Marx establishes the historical pattern of oppression, stating that "In
the earlier epochs of history, we find almost everywhere a complicated arrangement of society into various orders,
a manifold gradation of social rank. In ancient Rome we have patricians, knights, plebeians, slaves; in the Middle
Ages, feudal lords, vassals, guild-masters, journeymen, apprentices, serfs; in almost all of these classes, again,
subordinate gradations” (Marx and Engels, 1848, pg. 3-4). Although Karl Marx was referring to a specific ‘class
struggle,’ the Marxist-feminist view argues the drive for capitalism, economic and material wealth oppresses
specific social groups, including women and racial minorities (1848). Social and economic oppressive behaviors
manifest themselves in much more implicit ways when applied to race and gender. This has been referred to as
the Glass Ceiling which describes today’s oppressed classes.
With views similar to that of a socialist feminist, Karl Marx focuses on the distribution of equal economic
and material goods (1848). Marx suggests that such economic distribution is notably divided unequally, with
private property and capital goods allocated disproportionately to (in 21st century United States) one specific race
and gender, regardless of hard work and due to oppressive societal norms (Marx and Engles, 1848). In relation to
the social identity theory, racial/ethnic makeup and gender of the individual is the ‘social comparison,’ whereby
males are the dominant in-group for administrative and higher level career positions in most bureaucratic entities.
Through social comparison, individuals notice the disproportionate groupings of women and racial minorities in

4 lower-level positions within organizational hierarchies and the categorization of an individual is therefore boiled
down to a checklist of race, socioeconomic status, and gender. Although Marxian theory takes a macro approach
to the application of the glass ceiling model, it is a relevant to my research because it focuses on ideas embedded
in the wider social structure of society. These ideas are transmitted to members of a society and result in different
perceptions of opportunities based on gender and race. Consequently, I expect that those individuals who are
members of the Marxian oppressed classes will be more likely to indicate they will have experiences consistent
with the glass ceiling as compared to their counterparts. This Marxian philosophy supports my hypothesis that
females are less likely to be expected to advance in their career than males, and racial minorities will be more
likely to perceive discrimination towards minorities as compared to Whites (H1 & H4).
Social Identity Theory
Social identity theory (Tajfel & Turner, 1979) suggests that groups in society (i.e. family, social class,
ethnic relations, soccer team, etc.) give individuals a social identity and, therefore, a sense of belonging in the
world, pride, and self-esteem (McLeod, 2008). Tajfel and Turner (1979) posits that individuals increase the status
of their own group, while also discriminating against other groups outside of their own, to enhance their self-
image. Tajfel and Turner (1979) refers to this phenomenon of a divided group as the ‘in group’ and ‘out group’. In
other words, the in-group purposely discriminates against the out-group to enhance their self-esteem and self-
image. Such in-groups and out-groups can have effects as simple as whose team one is on and as complex and
extreme as who is under attack in a war or genocide. Tajfel and Turner (1979) report that assigning individuals into
in- and out-groups is normal, as people have a natural tendency to group things together to make sense of them
and, as a result, often exaggerate differences between groups. The social identity theory is said to have three
mental processes involved which follow in the proceeding order: 1) categorization 2) social identification, and 3)
social comparison. Categorization is broad, and can begin from many characteristics, including but not limited to
characteristics such as gender, ethnicity, body weight, religion, geographical location, athletic ability, age, etc. and
can have a large influence on one’s status in society (i.e. student, teacher, administrator, janitor). Once an
individual determines, or once society determines, what group an individual will be in, the individual adopts that
identity and therefore acts according to expected norms of that in-group or identity. This adaptation into a group
and a specific identity is referred to as the social identification stage. Finally, social comparison is the root of the
distinction(s) between the in- and out-groups. This is where differences between groups are highlighted, where the

5 rivals pin-point the other group’s differences, and where the basis of prejudice and discrimination stem from
(Tajfel and Turner, 1979).
Although the social identity theory posits that there are a plethora of variables that determine whether,
from the eye of the beholder, a person is in the in- or out-group, my thesis suggests that certain characteristics
override or are more influential than others. For instance, even though educational attainment and success is
supposedly the most significant predictor of future career success according to the American merit system, I
expect that racial ethnicity and gender will have a greater impact on students’ perception of the likelihood of
career advancement into higher level career positions. I expect that, although academic success may be an
important predictor of the likelihood of future career advancement, the reality may be that women and racial
minorities are not perceived to be capable of reaching the economic and administrative expectations equivalent to
that of non-minorities. Because of these status distinctions and assumptions of specific groups, females are
hypothesized to be less likely to be expected to advance in their career than males and, following the socially
constructed gender norms; females are predicted to be more likely to be expected to stay home to raise a family as
compared to males (H1 & H2).
Status Characteristics Theory
Status characteristics theory, also known as the expectation states theory, is used to assess the cues and
characteristics of individuals in relation to their perceived and assumed ability to perform (a) specific task(s).
According to Berger et. al. "status characteristics theory focuses upon the behavioural manifestations of certain
attitudes and evaluations" (Ogilvie, S. n.d.). There are said to be two types of status characteristics, specific and
diffuse. Specific expectations are based upon culturally shared attitudes. For instance, in regards to the sex of an
individual, "male and female are accorded differentially valued attributes: males are accorded higher
mathematical ability, and females, higher creative ability" Ogilvie, S. (n.d.). Such evaluations are based on the
culturally preconceived notions about racial minorities and women. Diffuse status characteristics are these
evaluations based on larger-scaled stereotypes. A diffuse characteristic would be, for instance, the implicit
ideation that males are, in general, more competent and superior to females, or that Whites are more competent
than African Americans. Such preconceived notions can, for example, set expectations for who is supposedly the
better mechanic, babysitter, CEO, or president.
These stereotypes set a "burden of proof" for the individual, where it is her/his responsibility to prove
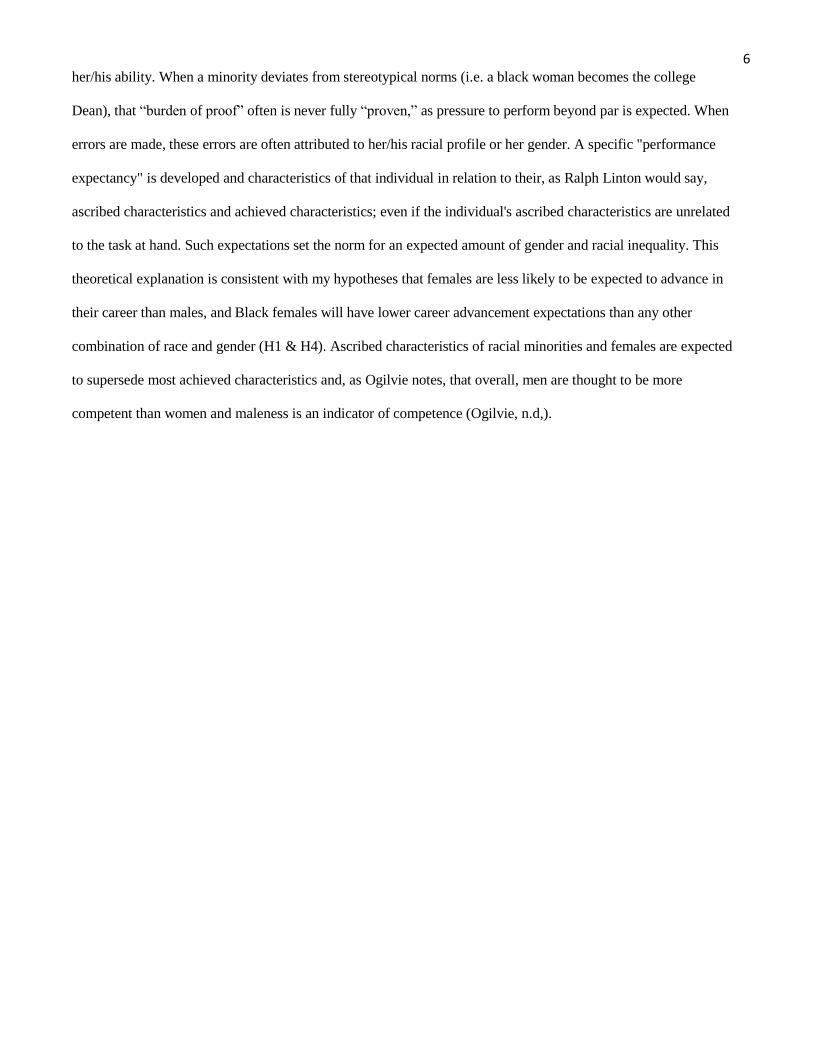
6 her/his ability. When a minority deviates from stereotypical norms (i.e. a black woman becomes the college
Dean), that “burden of proof” often is never fully “proven,” as pressure to perform beyond par is expected. When
errors are made, these errors are often attributed to her/his racial profile or her gender. A specific "performance
expectancy" is developed and characteristics of that individual in relation to their, as Ralph Linton would say,
ascribed characteristics and achieved characteristics; even if the individual's ascribed characteristics are unrelated
to the task at hand. Such expectations set the norm for an expected amount of gender and racial inequality. This
theoretical explanation is consistent with my hypotheses that females are less likely to be expected to advance in
their career than males, and Black females will have lower career advancement expectations than any other
combination of race and gender (H1 & H4). Ascribed characteristics of racial minorities and females are expected
to supersede most achieved characteristics and, as Ogilvie notes, that overall, men are thought to be more
competent than women and maleness is an indicator of competence (Ogilvie, n.d,).

7 The Glass Ceiling
Both social identity theory and status characteristics theory explain the existence of the glass ceiling since
they focus on the development and maintenance of status and prestige in societies. According to Coyne et. al.
(2004), there are four main areas of the notion of the ‘glass ceiling,’ these four main areas being: 1) job
discrimination, 2) perceptions of personal achievement, 3) the role of in-house training and development, and 4)
home-based issues such as caregiving. One of the theoretical explanations Foley (2002) used to dissect the
structure of the glass ceiling is the distributive justice theory (Maiese, 2013; Foley, 2002). Findings showed that
women and racial minorities both believed that White males were the most favored group in their workforce
environment, and that White males generally felt better overall about how they were treated within the
organization. Additional findings reveal the combination of being a racial minority and female effects perceptions
of promotions and high levels of discrimination were perceived. Similarly, perceptions of a glass ceiling were
found to have a deflating perception of promotional fairness, which impacts individuals’ perception of their own
career projections (Foley, 2002). Overall, the theme of existing literature shows that perceptions of the glass
ceiling tend to be more prominent, and more pervasive, for women and minorities than for White males.
Foley’s (2002) empirical findings revealed that discrimination and perceptions of the glass ceiling can
hinder such persons’ perceived ability to move up in the workforce (Foley, 2002). He concluded that the mere
perception of a glass ceiling can influence work-related attitudes (Foley, 2002). Focusing on the relationship
between the justice theory and the glass ceiling, it is also noted that fairness perceptions of third-party outcomes,
such as promotions, influence each individuals’ fairness perception and work-related attitudes. Perceived
discrimination towards a certain minority group, or preferential treatment of White males would decrease
Hispanic and females’ views of equality, fairness, and positive work-related attitudes. These suggestions support
my hypothesis that racial minorities will be more likely to perceive discrimination towards minorities as
compared to Whites (H4). In addition, Glick & Fiske (2007) report that, in relation to the status characteristics
theory, culturally defined norms associate women with communal, warm, and incompetent qualities, which can
elicit patronizing discrimination. Glick and Fiske’s (2007) findings support my hypothesis that females are more

8
likely to be expected to stay home to raise a family as compared to males, as the communal, warm, and nurturing
characteristics ascribed to women influence their economic and familial expected roles (H2). This patronizing
discrimination can, on a positive note, also lead to what Glick & Fiske describe as a “wow” effect (2007). The
“wow” effect is when the female or racial minority employee is undermined and stereotyped, allowing minority
employees to surpass presupposed “standards” for women and/or racial minorities (Glick & Fiske, 2007). This
“wow” effect may lead to greater integration (but by no means complete) for the individual into the impermeable
barrier of the “in-group,” yet it cannot justify the economic and administrative inequality still pervasive among
many professions in higher level positions. In opposition to my hypotheses that (H1) females are predicted to be
expected to advance in their career than males and (H2) Black females will have lower career advancement
expectations than any other combination of race and gender, perhaps findings to the contrary may be explained by
this “wow” effect.
Widely recognized in the literature is the disproportionate grouping of women and racial minorities in
lower-level positions within organizational hierarchies. Beller (1984) found that there is an obvious deficit in
female occupied administrative and higher level positions within specific occupations. To put matters into
perspective, John (2013) revealed that, as of 2009, “female college graduates earned 70.9 cents for every dollar
earned by male college graduates... [but] the gender pay gap is largest at the top of the educational spectrum, with
professional women earning 57.9 cents for every dollar earned by professional men” (pg. 2). Research findings
have shown that women are far more likely than men to have jobs in advising, counseling, and other staff
positions within certain organizations, such as an institution of higher education. Affirmative action is said to also
inflate minorities of gender and race in such positions, as well (Johnsrud & Heck, 1994).
Johnsrud and Heck (1994) provide an explanatory theoretical model describing how the gender of an
individual affects the organizational structure and hierarchy within higher education universities. While there is
little agreement to the explanation of their initial finding, researchers found, similar to much other literature, the
pervasiveness and persistence of gender stratification in the workforce (Johnsrud & Heck, 1994). The cumulative
effect gender has on the ability of females to ascend in administrative positions within a university setting was

9
found to have “significant direct effects on the status, salary, and responsibility achieved as a result of
promotion” as well as an effect on the placement of an individual prior to advancement(Johnsrud & Heck, 1994,
Pg. 39). For example, women are typically grouped in entry-level positions within administrative staffs. Similarly,
a specified designation in “women’s work” versus “men’s work” can lead to, or causes, subsequent pay disparities
as well as the amount of responsibilities the position holds. Even if women attain positions of “men’s work”,
women still have to face an uphill battle to preserve their status. Cikara & Morrow (2004) acknowledge that if
women do penetrate the glass ceiling barrier, the path they took to get there as well as their new status brings with
it hostile environments, sexual harassment, and a need to fight hard for the “grudging respect of their
competence” (pg. 83).
Focusing on the placement of an individual based on gender has empirically shown the cumulative effect
gender plays in status, salary, and responsibility within the university. As women were more likely to be placed in
lower level positions to begin with, their likelihood of ascending to an administrative is diminished. This is
referred to as the “power of the prior position” that puts females at a lower place in the hierarchy (Johnsrud &
Heck, 1994). In addition, researchers found there are no objective qualitative measures that validate the initial
lower level positions women are frequently initially placed in. In other words, the study indicates that “women
have equivalent educational backgrounds and significantly more experience when compared to males” (Johnsrud
&Heck, 1994). Such findings align with my hypothesis that women, regardless of their success on a resume,
experience a type of implicit bias towards their work-related expectations (H1).
Care-Giving, the Family and the Glass Ceiling
The traditional family model consisted of the familiar notion of a male breadwinner, a mother caretaker,
and children at home for her to tend to. Coyne, Coyne, & Lee, (2004) note this family model, developed in the
1940-60s, is not an efficient ideation of today’s family for a number of reasons. The ramifications of this structure
are discussed by Kossek et. al. (2001) in which the researchers state that “one of the most universal types of non-
work decisions that most employees will make during their careers are care-giving decisions” (pg. 3). Hasslette,
10
Geis and Carter (1992) also suggest that marriage and children and negatively correlated with women’s pay in the
workforce, and that a lack of geographic mobility that comes with having children, along with other factors,
substantially influences the negative correlation. Caregiving is a time and energy consuming job which may
overlap into a work setting and may result in less rewards at work. Similarly, numerous studies “have identified
both potential motherhood and motherhood as ‘impacting detrimentally’ on women’s opportunities for
employment and promotion (Coyne et. al., 2004, pg. 21). Also noted is the impact of divorce and the resulting
pattern of females still holding the majority of the primary custody caregiving role post-divorce, further increasing
the overlap between caregiving and career responsibilities.
To improve the caregiving and family dilemma, the Family Leave Act of 1992 was enacted, which
provided employees who worked 26 or more weeks of work to up to 12 weeks of unpaid work for “personal time”
(Coyne et. al., 2004, pg. 24). While there has been some recognition of family-related duties, such recognition
may even serve as a detriment. As reported by Cohn, S. (1996), organizations take into consideration pertinent
economic liabilities. For instance, women in particular are an economic deficit in the assumption that they will
need time away from work to care for child/children. From an economic perspective Cohn (1996) notes there is an
equation in which the cost of training is compared to the productivity of the worker. Similarly, Hasslette et. al.
(1992) show that women were less likely to hold managerial and administrative positions (in general more
demanding positions), and Cohn (1996) interprets such discrepancies to a fear to hire women for high-level firm
specific fields due to the notable likelihood of women taking time off of work and/or quitting to raise a family.
Perhaps more notable than the implicit hiring and promotion discrimination towards women is the
assigned gender roles women are still expected to adhere. Coyne et. al. (2004) reports that women still retain the
greater proportion of caregiving and home duties, men are increasingly valuing their family roles and willing to
modify their career and work schedule to accommodate such increasing values. The researchers also argue that, to
some degree, there has always been some gender-based division in caregiving; from the primitive evolutionary
leap to homo sapiens, providing the family with food and shelter, to the pre-industrial planned marriages, designed
for the women to be expected to marry into wealthy families where the male provides (Coyne et. al.,

11
2004) Such studies, along with the extensive history of a division of expectation of gender norms, support the
current study’s hypothesis that females are more likely to be expected to stay home to raise a family (H2).
Liss, O'Connor, Morosky, and Crawford (2001) found that certain beliefs of individuals are correlated
with feminist self-identification. More liberal views, such as having a high embeddedness/emanation score (i.e.
"Relationships with most men stunt my growth”), high self-reliant individualism and low denial of discrimination
score all contribute variance. Similarly, in a sample of young college women, Liss, Crawford, & Popp (2004)
utilized bivariate correlations to assess feminist collective action with specific life experience variables.
Researchers found that having a mother who was feminist, having experienced discrimination and having taken a
class that focused on women’s issues were correlated with feminist collective action (Liss, et. al., 2004). Such life
experiences were also found to be correlated with more liberal-sided beliefs versus conservative beliefs. These
findings support my hypothesis that student’s feminist views are likely to be positively correlated with the
likelihood she/he is to have equal expectations for career advancement (H4), as well as my prediction that those
who do not experience overt or implicit racism or sexism, such as white males, are less likely to perceive racial
and gender barriers in regards to career advancement (H5).
Current literature shows that perceptions of the glass ceiling tend to be more prominent, and more
pervasive, for women and minorities than for white males. Similarly, a Seagram Company sponsored survey was
sent out to various women in top-level managerial positions to examine gender discrimination (Coyne et. al.,
2004, pg. 18). While 52 percent of females reported male stereotyping as the most significant barrier to
promotion, only 25 percent of males cited male stereotyping as a problem (Coyne et. al., 2004, pg. 18). This study
supports my hypothesis that white males will perceive less discrimination towards women and racial minorities
(H6). It seems as though in-groups have a difficult time perceiving their own injustices; while, perhaps, at the
same time out-group members (i.e. racial minorities and women) may tend to have a cognitive bias to over
exaggerate the differences and prejudices of the in-group (i.e. white males). Or perhaps this still does not explain
the discrepancy in economic, social, political, and familial inequity.

12 Racial Minorities and the Glass Ceiling
According to the article “Racial Inequality and Meritocracy,” Kaplan quotes that “The net worth of
whites is eight to ten times more than blacks. Three times as many blacks as whites live below 125 percent of the
poverty level, and black median household income is only 65 percent that of whites” (Kaplan, 2011, p. 1).
According to the social identity theory, it is no surprise as to why such barriers to higher level career positions
exist- it is simply not part of one’s “in group”. Singh, Winkel, & Selvarajan (2013) sought to assess the effect
diversity at a specific firm has on racial differences in individuals’ reactions and how, hence, performance may or
may not be affected. Applying social and racial identity theories, it was found that an open, diversity-supportive
climate brings with it psychological safety and racial minorities feel safe expressing their real identities (Singh, et.
al., 2013). Concurrently, it was found that the opportunity and acceptability of expressing one’s identity was
positively correlated with individual performance (Singh, et. al., 2013).
In studying race relations of interviewer and interviewee interaction, Hannon & Defina (2014) reveal that,
not only does race matter, but the skin tone of both the interviewer and interviewee has significant effects on the
interviewer (Hannon & Defina, 2014). Using data from the National Longitudinal Survey of Youth and General
Social Survey, Hannon & Defina (2014) found that “On average, African American respondents with a white
interviewer were about 3 times more likely to be classified as dark than those with an African American
interviewer,” enhancing the likelihood of racial bias (pg. 1). When replying to CNN’s host Anderson Cooper
during the time of the 2007 presidential democratic debate, the question of whether or not Obama is “black
enough” to be considered the first black president, a question originally posed by a student at Kansas University,
Barrack Obama countered the question by stating “You know, when I'm catching a cab in Manhattan -- in the past,
I think I've given my credentials” (Part I: CNN/YouTube Democratic Presidential Debate Transcript, 2007).
Such findings and subjective knowledge both question the variances in responses of students’ perceptions of the
glass ceiling, noting that race is on a continuum, per se, more-so than a pigeonholed category that can be

13
objectively measured. Even in the absence of obvious, overt discrimination, aversive discrimination may be
becoming the norm.
In an in-depth analysis on perceptions of the glass ceiling focused on a cross-sampling of Hispanic law
associates, Foley (2002) utilized the term “perceived glass ceiling” to portray the perception that ascribed
characteristics (i.e. race, gender) instead of achieved characteristics (i.e. ability, intellect, qualifications) lay within
the foundation of certain organizations as a barrier to achieving promotions and/or career advancements. In
addition, “perceptions of the glass ceiling, and the processes that lead to these beliefs, do not occur within a social
vacuum, but within social contexts that often reward people differently on the basis of the social group to which
they belong” (Foley, 2002, pg. 472). Such social comparisons among race and gender are perhaps limitations in the
projected possibilities of salary and promotion. Applying the social identity theory, the preceding studies support
my hypothesis that racial minorities will be more likely to perceive discrimination (H4). Similarly, black females
will have lower career advancement expectations than any other combination of race and gender, as
gender merely exacerbates an already out-grouped individual (H3).
14 Methods
Participants
The goal of this study was to assess students’ perceptions of the glass ceiling. The universe of the study
are full-time college students who are 18 years or older. The population used in this study is college students
attending a large northeastern university. The sample is a convenience sample of 608 students enrolled in
introductory level courses at the large northeastern university in the spring of 2015. The population of this
convenience sample consisted of 55% freshman, 23% sophomores, 13% juniors, 8% seniors and fifth year or
more students. Of the respondents, 92% are between the ages of 18 and 21. The majority (75%) of the sample are
students of a Non-Hispanic White/Euro-American, 8% Black/Afro-Caribbean/African, 8% East Asian/Asian
American, and 7% Latino/Hispanic American. In addition, 359 of the respondents (58%) are female, 257 (42%)
male.
Participants were given an opportunity to volunteer for this study, with a small incentive of extra credit
for their course. An alternate assignment was available for students who did not feel comfortable partaking in the
survey. Responding to the survey served as implied consent. Students were told that all participation was
voluntary and each student had the opportunity to stop if she/he felt uncomfortable answering any of the
questions. This study was approved by the Institutional Review Board at the University.
Materials and Procedures
The study was designed as a series of vignette and respondent information was recorded through a survey
site called Qualtrics (http://www.qualtrics.com/). Each individual who volunteered in the study was randomly
assigned one-out-of four possible vignettes. All questions on the survey were the same, only the race and gender
of people in the vignette was varied (Black female, Black male, White Female, or White Male). The specific
vignette the person received is the independent variable.
Multiple regression analysis was utilized to analyze the results of the survey data. This is an appropriate
techniques because the data used for this analysis is a multi-category dependent variable and many independent
and control variables. This technique allows me to examine the direct effect of the vignette the person received on
the attitudes toward the questions about the person alone and while controlling for a number of additional
variables.
15
Dependent Variables
Students were asked to respond to eleven questions about the person described in the vignette. “A few
years down the road, [Black Meredith/White Meredith/Black Martin/White Martin] plans on starting a family. Do
you believe that beginning a family (i.e. marriage, kids) will prolong [Black Meredith/White Meredith/Black
Martin/White Martin] from advancing in [her/his] career?” A similar question was asked is as follows: “10 years
into [Black Meredith/White Meredith/Black Martin/White Martin’s] career, [she/he] advances to the managerial
position (i.e. program coordinator, director, vice president), working roughly 60-70 hours per week. [She/He]
alshas two kids and a [Husband/Wife]. In relation to [her/his] circumstances, [she/he]: 1) Far Exceeds
Expectations, 2) Exceeds Expectations, 3) Equals Expectations 4) Short of Expectations, and 5) Far Short of
Expectations.” The picture clearly depicting the race and gender of the vignette was shown on screen above the
above questions students received, as well as the correct female/male name and “she/he, “her/his” orientation.
The responses to the vignettes are the dependent variables in this research.
Control Variables
The control variables utilized in the multiple regression analyses included sex (0=male, 1=female), race
(White, other race), age (range from 18 to 24 and older), highest level of mother’s and father’ education (less than
high school to Ph.D.) and a gender role scale. Respondents reported that 2% completed less than a high school
diploma 16% high school diploma or equivalent, 9% some college or no degree, 12% associate’s degree, 40%
bachelor’s degree, and 21% master’s degree or higher. When respondents were asked, “What level of schooling
did your mother/female guardian complete?” 3% reported less than a high school diploma or GED, 10% high
school diploma or equivalent, 0% some college or no degree, 6% associate’s degree, 48% bachelor’s degree, and
33% master’s degree or higher. Eight gender attitudes items were included in a gender role scale (See Appendix A
for the items in the scale). Gender role scales were assessed on a five point scale with the higher number indicating
a more general role liberal/non-conventional response. The items were added together to form the
scale. The Chronbach’s alpha for the scale is .794 which shows that it is a reliable scale. The descriptives for the
variables in the analysis are presented in Table 1.
[Table 1 about here]

16
Findings
In this research, I examine the effects of the four vignettes on respondent attitudes toward the person in
the vignette’s career path and family. I examine eleven dependent variables and report on the seven that have a
significant main independent variable effect. There were no significant effects of the vignettes on the dependent
variables of managerial position in 1 to 3 years, and amount of money made between the first and third year in
thjob and first and fifth year in the job. There was also no significant effect on the vignette that focuses on the
likelihood of the person in the vignette being the primary caregiver.
Table 2 presents the relationship between the vignette and the control variables on whether or not the
respondent would like to work with this person as a manager. White male (Martin) is the reference category in all
of the analyses. Respondents are significantly more to say they would like to work with White Meredith, Black
Meredith and Black Martin as a manager compared to White Martin (p < .001). Interestingly, none of the control
variables have a significant effect on manager preference and there are no significant interactions with the
vignettes on race or sex.
[Table 2 about here]
The next analysis, shown in Table 3, examines the vignette of focusing on perceived success of getting a
first job of choice. Only one of the vignettes is significant with respondents indicating that Black Meredith will
be more likely to get her first job of choice as compared to White Martin (p < .05). None of the other control
variables or interactions is statistically significant.
[Table 3 about here]
Respondents were asked to assess the likelihood the person in the vignette they received will return to
school between 1-3 years into their career. Black Martin is found to be significantly more likely than White
Martin to attend higher education in 1-3 years (p < .05). Controlling for other variables, the sex of the respondent
is the only significant control variable (p < .05). Female respondents are more likely to believe people will attend
higher education 1-3 years into their career as compared to male respondents. The results for this analysis are
shown in Table 4.
[Table 4 about here]

17
Students were asked to predict approximately how much money the vignette will receive 20 years into the
randomly assigned vignette’s career. Table 5 shows the differences between White Martin and Black Meredith
arefound to be significant (p < .05), with students expecting Black Meredith to make less money than White
Martin. Sex of respondent is significant (p < .001) to the perceived income in twenty years variable with women
respondents indicating they are less likely than men to think people will make a great deal of money in twenty
years. The vignette received and race of the respondent interaction is also statistically significant (p < .05).
Respondents who received the Black Meredith vignette and are non-White do not expect Meredith to make as
much money 20 years into her career as do White respondents.
[Table 5 about here]
The next table (Table 6) presents results of the question, “A few years down the road, [Meredith/Martin]
plans on starting a family. Do you believe that beginning a family (i.e. marriage, kids) will prolong
[Meredith/Martin] from advancing in [her/his] career?” Analysis shows respondents who received the White
Meredith (p < .001) and Black Meredith (p < .05) vignettes are significantly more likely to think starting a family
will prolong their career advancement as compared to those who received the White Martin Vignettes. Sex of the
respondent has a statistically significant effect as well (p < .001). Women are more likely to believe starting a
family will prolong s one’s career as compared to male respondents.
[Table 6 about here]
Table 7 represents the results of the analysis with same question posed above, referring to the effects on
career advancement for starting a family, with the only difference referring to children preventing the parent from
advancing in his/her career as opposed to the likelihood of being prolonged from advancing in his/her career.
Respondents believe that White Meredith is significantly more likely to be prevented from advancing in her career
as compared to White Martin (p < .001). When examining the interaction between the race of the respondent and
the vignette received, respondents of a non-White race report that Black Meredith is significantly more likely to be
prevented in advancing in her career as compared to White Martin(p < .05).
[Table 7 about here]
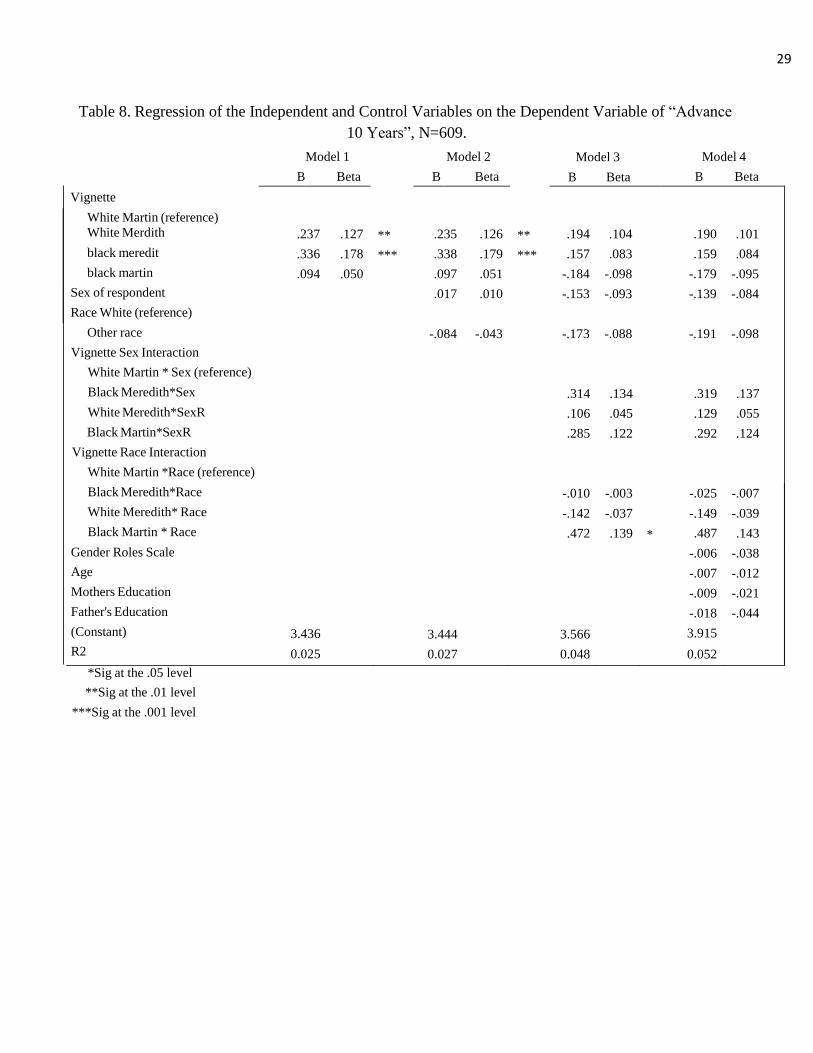
The last analysis focuses on the degree of expectations met in relation to balancing a demanding career as

18 well as a family. These findings are shown in Table 8. The results examine students’ responses to the question,
“10 years into [Meredith/Martin’s] career, [she/he] advances to the managerial position (i.e. program coordinator,
director, vice president), working roughly 60-70 hours per week. [She/he] also has two kids and a wife/husband.”
Respondents report White Meredith (p < .001) and Black Meredith (p < .01) significantly exceeds career
expectations as compared to White Martin. The interaction between vignette received and race of respondent is
also significant. Those respondents who received the Black Martin vignette and are non-White are significantly
more likely to report Black Martin exceeds expectations (p < .05) compared to White Martin.
[Table 8 about here]
Discussion
First, there is an ironic difference in the career outlook and expectations between respondents’
interpretations of the Black Meredith vignette and White Martin vignette. While respondents reported that a Black
female is more likely than a White male to receive a job out of college in the career she prefers, Black females are
also perceived to make significantly less money 20 years into their career than White males. This is perhaps the
most suggestive finding of the presence of a glass ceiling in this study. Students appear to assume being a
minority both racially and in sex helps provide a Black female an “upper hand” on getting their first job out of
college, but not making significantly as much as White males 20 years into their career. The Glass Ceiling Act,
Title II of the Rights Act of 1991 and Affirmative Action make cause respondents to assume the rights of
minorities to be hired in their desired positions is a legal mandate so they will indeed get their jobs and this is
especially true for Black females since they represent two minority groups. This finding is relevant to Tajfel and
Turner’s (1979) social identity theory, which shows how little similarity it takes to form in- and out-groups and the
visibility of physical characteristics that are thought to hold inhibitory presumptions towards racial and ethnic
minorities and women. Even a slight difference, such as an increase in very few “out-group” members in
aworkforce setting is thought to create a bias of how much Affirmative Action actually helps the employment
rights and career advancement of women.
When controlling for race, Non-whites are significantly more likely to believe a Black female will make
less money 20 years into her career compared to White males. This finding supports my hypothesis that non-
White individuals will be more likely to perceive discrimination and supports Foley’s (2002) use of the

19 distributive justice theory to explain the glass ceiling (H4). Foley (2002) noted that women and racial minorities
were both more likely to perceive discrimination in the workforce, and also more likely to believe that White
males were treated better and liked more. Similar to Tajfel and Turner’s (1979) in-group and out-group
comparisons, a perception of being in the “out-group” influences the likelihood a Black female will make as much
as a White male down the road in their respective careers.
Responses to Women show that respondents expect having a family will both prolong and prevent their
career advancement (H1, H2). Support for these findings are found through Karl Marx’s focuses on the
distribution of equal economic and material goods (1848). When characteristics, specifically gender, are taken into
consideration, culturally preconceived notions of whom the primary household caregiver should be seem to have
an effect on students’ assumptions, as well as impact the expected career advancement of women (Berger, et. al.
2006). That is, status characteristics cannot be differentiated from assumptions of economic equality and, in
relation to gender, appear to effect students’ perception of who is presumed to be accorded the responsibilities of
household and familial duties.
Similarly, regardless of race, female respondents are significantly more likely to believe starting a family
will prolong the female vignette’s career advancement. Non-White respondents are more likely to predict starting
a family will prevent the Black vignette from advancing in her career. To support this finding, one of the
theoretical explanations Foley (2002) used to dissect the structure of the glass ceiling is the distributive justice
theory (Maiese, 2013; Foley, 2002). Findings showed that women and racial minorities both believed that White
males were the most favored group in their workforce environment, and the combination of being a racial
minority and female effects perceptions of promotions and high levels of discrimination were perceived.
Perhapswomen and racial minorities may be more realistic about the likelihood their race and gender play on
advancing in their careers (H3, H4).
Interestingly, respondents are significantly more likely to desire to have a Black female, Black male, or
White female as a manager than a White male. Since there were no control variables that significantly affected this
result, further research should focus on explanations for this finding. It may be that respondents who received the
women and minority vignettes feel some pressure to respond in a normatively acceptable manner and to not
respond in a racist or sexist manner. Further research will need to examine this explanation.

20
Next, respondents’ reported that both Black and White vignettes of the female race would exceed
expectations as compared to White Martin if they were working 60-70 hours a week and also raising a family.
This finding agrees with what Glick & Fiske (2007) describe as a “wow” effect, the effect that takes place when
the female or racial minority employee is undermined and stereotyped, allowing minority employees to surpass
presupposed “standards” for women and/or racial minorities . While this “wow” effect may have positive qualities
for the dual career-family raising mother, it also can only be a phenomenon that exist when assuming the typical
woman in our society cannot hold a demanding job as well as raise a family. Had there been an assumption
women can do both, there would be no “wow” effect.
When controlling for race, non-White respondents are more likely to believe the Black, female vignette is
exceeding expectations. This finding shows in interesting relationship between whom non-White individuals
expect to be the primary caregiver in their home, with non-White respondents predicting Black woman to be more
likely within the “out-group” of being a primary caregiver while also working. Whether the hours of work, the
raising of the family, or both contribute to this finding, social identity theory indicates that a significant
assumption about the implicit ideation of what minority women are expected to do is prevalent.
Women are found to be more likely than men to believe the vignette, regardless of race and gender, will
attain higher education a few years into his/her career. John (2013) revealed that, as of 2009, while women with a
college education make 70.9 cents to every dollar a male in the same educational position makes, “ the gender
paygap is largest at the top of the educational spectrum, with professional women earning 57.9 cents for every
dollar earned by professional men” (pg. 2). In addition, even when women were found to have equivalent
backgrounds and significantly more experience in their work positions then men, women were still more likely to
be placed in lower level positions to begin with and were still less likely to advance in their careers (Johnsrud and
Heck, 1994). Again, similar to Foley’s (2002) findings, perhaps women and racial minorities both believe that
White males were the most favored group in their workforce environment. Perchance women are more likely
to attribute the need for higher education for the vignettes, regardless of race or gender, because of the differences
they notice to be true for their female counterparts.
Limitation
One limitation of this study was the design of the study. While pictures displayed the race and gender of

21 the vignette, students may have taken the survey on smaller technology items such as an iPhone. This may have
made it more difficult for students to fully absorb the race and gender of the person shown in the vignette since
the picture would have been small. In addition, an icon of a person may have less of an impact when transmitted
through the superficiality of technology, and respondents may not have focused on the race and gender which
would limit the effects of the vignette. On the same topic, students may have focused on the objective evidence of
educational success on the vignette’s resume instead of who the person is in their entirety. Further research might
want to find ways to highlight the possible effects of race and gender.
Conclusion
While familial duties suggested women are, in general, more likely to find that raising a family will, in
some ways, prolong or prevent their career advancement, interestingly there is no significant effect on the vignette
that focuses on the likelihood of the person in the vignette being the primary caregiver. After a review of the
question, I conclude that the ambiguity of what students understood a “primary caregiver” to mean to them may
have impacted the outcome of this question. That is, respondents’ answers may have been skewed by the meaning
of a primary caregiver referring to an individual in the household who is the breadwinner, and primary
caregiverreferring to what I defines as the primary caretaker of the children (i.e. running the child to practice,
staying home with the child, attending school parent-teacher meetings, and taking care of the child when she/he is
ill). Failure to clarify the definition of “primary caregiver” may have impacted findings.
Interestingly, gender role scales of the respondent were not found to be statistically significant, related to
the dependent variables. This is contrary to my hypothesis that an increase in students’ views towards a feminist
perspective would be positively related to equal expectations for career advancement. It may indicate, however,
other factors play a considerably higher role in students’ perspectives that override gendered expectations.
Similarly, the hypothesis that White males will perceive less discrimination towards women and racial minorities
than their counterparts was not supported, and there were no effects of the gender of the vignette on any of the
students’ responses.
Further, while Black Meredith vignette is expected to be more likely than White Martin to receive
employment in the career she wants, Black Meredith is also perceived to make significantly less money 20 years
into her career than will White Martin. Further research on why getting a job immediately and making money in

22 the long-term differ in terms of race and gender may benefit from explanation, and may further contribute to the
growing body of knowledge, and awareness of, the glass ceiling. Perhaps other factors influence the glass ceiling
beyond race and sex.
Overall, I did find a presence of the glass ceiling in responses to perceived limitations and successes of
each person in the vignette. Although glass ceiling research and policy has existed for decades, it is clear that
these expectations are still present in the social world. This is especially interesting since my research focuses on
a sample of college students who should presumably be more educated about these issues as well as less tolerant
toward any kind of discrimination. While there is ample evidence that there is social change in the roles of men
and women, there is also evidence that equal opportunity based on race and sex is not present in
today’society.Tables
d.
ation
Table 1. Descriptive Statistics for Variables in the
Analysis
Descriptive Statistics
N
Minimum Maximum Me
St
an Devi
First Job 650 1.00 7.00 5 .1862 1.33374
Manager 650 1.00 7.00 4 .4846 1.00411
Higher education 646 1.00 6.00 4 .3127 1.15123
Money make in 20
years
646
1.00
6.00 4
.4226 .78516
Start a family 645 1.00 4.00 2 .6403 .67169
Kids prevent 645 1.00 4.00 2 .1070 .67523
Advance in ten years 645 1.00 5.00 3 .5938 .82241
Black Meredith
Vignette
652
0.00
1.00
.2500 .43335
White Meredith
Vignette
652
0.00
1.00
.2454 .43065
Black Martin Vignette 652 0.00 1.00 .2515 .43423
White Martin Vignette 652 0.00 1.00 .2500 .43335
Sex of Respondent 650 0.00 1.00 .5677 .49578
Gender Roles Scale 644 8.00 40.00 28 .9550 5.46724
Age 652 1 8 3.36 1.387
Mother's education 636 2 9 6.24 1.902
Father's education 617 2 9 6.44 2.013

23
Table 2. Regression of the Independent and Control Variables on the Dependent Variable of Working
with Vignette Person as a Manager, N=609
Model 1 Model 2 Model 3 Model 4
B Beta B Beta B Beta B Beta
Vignette
Se
Vi
Vi
G
A
M
Fa
(
R
*Sig at the .05 level
**Sig at the .01 level
***Sig at the .001 level
White Martin (reference)
White Merdith
.750
.328
***
.761
.333
***
.773
.338
***
.770
.337
***
black meredit .708 .307 *** .711 .308 *** .771 .334 *** .778 .338 ***
black martin .799 .348 *** .805 .351 *** .791 .345 *** .801 .349 ***
x of respondent
Race White (reference)
.217 .108 ** .285 .142 .230 .115
Other race .110 .046 .107 .045 .098 .041
gnette Sex Interaction
White Martin * Sex (reference)
Black Meredith*Sex
-.266
-.093
-.266
-.093
White Meredith*SexR .012 .004 .033 .012 Black Martin*SexR -.014 -.005 -.004 -.002
gnette Race Interaction
White Martin *Race (reference)
Black Meredith*Race
.296
.071
.267
.063
White Meredith* Race -.103 -.022 -.246 -.053 Black Martin * Race -.109 -.025 -.120 -.028
ender Roles Scale .006 .032
ge -.030 -.041
others Education .012 .023 ther's Education -.036 -.074
Constant) 3.929 3.775 3.758 3.874
2 0.111 0.125 0.134 .140

24
Table 3. Regression of the Independent and Control Variables on Dependent Variable of First Job,
N=609.
*Sig at the .05 level
**Sig at the .01 level
***Sig at the .001 level
Vignette
B
Model 1
Beta
B
Model 2
Beta
B
Model 3
Beta
Model 4 B
Beta
White Martin (reference)
White Merdith
.073
.024
.077
.025
.116
.039
.116
.039
black meredit .305 .100 * .307 .101 * .434 .143 .438 .144
black martin .273 .090 .277 .091 .294 .097 .303 .100
Sex of respondent .093 .035 .176 .067 .163 .062
Race White (reference)
Other race .014 .004 -.009 -.003 -.018 -.006
Vignette Sex Interaction
White Martin * Sex (reference)
Black Meredith*Sex -.267 -.071 -.265 -.071
White Meredith*SexR -.083 -.022 -.067 -.018
Black Martin*SexR .008 .002 .014 .004
Vignette Race Interaction
White Martin *Race (reference)
Black Meredith*Race .121 .022 .105 .019
White Meredith* Race .050 .008 .028 .005
Black Martin * Race -.073 -.013 -.072 -.013
Gender Roles Scale -.001 -.005
Age -.021 -.022
Mothers Education .006 .008
Father's Education -.023 -.036
(Constant) 5.058 4.999 4.953 5.181 R2 0.01 0.011 0.013 .015

25
Table 4. Regression of the Independent and Control Variables on Dependent Variable of Higher
Education, N=609.
Vignette
B
Model 1
Beta
B
Model 2
Beta
Model 3
B Beta
B
Model 4
Beta
White Martin (reference)
White Meredith
.121
.046
.133
.051
.165
.063
.200
.076
Black Meredith .176 .066 .178 .067 .188 .071 .178 .067
Black Martin .304 .115 * .308 .116 * .357 .135 .376 .142
Sex of respondent
Race White (reference) .218 .094 * .385 .166 * .434 .187
Other race
Vignette Sex Interaction
.164 .060 -.176 -.064 -.081 -.029
White Martin * Sex (reference)
Black Meredith*Sex
-.161
-.049
-.169
-.051
White Meredith*SexR -.190 -.058 -.257 -.079
Black Martin*SexR
Vignette Race Interaction
-.309 -.094 -.335 -.101
White Martin *Race (reference)
Black Meredith*Race
.393
.081
.411
.085
White Meredith* Race .380 .071 .312 .058
Black Martin * Race .574 .120 .460 .096
Gender Roles Scale -.008 -.039
Age -.027 -.032
Mothers Education .043 .071
Father's Education .034 .060
(Constant) 4.179 4.012 3.986 3.780 R2 0.009 0.022 0.03 .046
*Sig at the .05 level
**Sig at the .01 level
***Sig at the .001 level

26
Table 5. Regression of the Independent and Control Variables on the Dependent Variable of Money
Earned 20 years into Career. N=609.
Model 1 Model 2 Model 3 Model 4
B Beta B Beta B Beta B Beta
Vignette
White Martin (reference)
White Merdith
-.088
-.050
-.096
-.054
.041
.023
.057
.032
black meredit -.177 -.099 * -.181 -.101 * -.270 -.151 -.281 -.157 *
black martin -.089 -.050 -.096 -.054 .017 .009 .022 .012 Sex of respondent
Race White (reference) -.210 -.135 *** -.065 -.042 -.015 -.010
Other race
Vignette Sex Interaction
-.050 -.027
-.247 -.134 -.205 -.111
White Martin * Sex (reference)
Black Meredith*Sex -.008 -.003 -.007 -.003
White Meredith*SexR -.288 -.131 -.320 -.146
Black Martin*SexR
Vignette Race Interaction
-.274 -.123 -.286 -.129
White Martin *Race (reference)
Black Meredith*Race .421 .129 * .434 .133 *
White Meredith* Race .135 .037 .108 .030 Black Martin * Race .215 .067 .167 .052
Gender Roles Scale -.008 -.060 Age .000 .000 Mothers Education .021 .051 Father's Education .014 .037 (Constant) 4.519 4.656 4.612 4.606 R2 0.007 0.026 0.041 .049
*Sig at the .05 level
**Sig at the .01 level
***Sig at the .001 level

27
Table 6. Regression of the Independent and Control Variables on Dependent Variable of “Start Family”,
N=609.
Vignette
B
Model 1
Beta
B
Model 2
Beta
Model 3
B Beta
Model 4
B Beta
White Martin (reference)
White Merdith
.369
.240
***
.361
.235
***
.321
.209
**
.320
.208 **
black meredit .217 .140 ** .214 .138 ** .081 .052 .082 .053
black martin .056 .036 .050 .033 .058 .037 .053 .034
Sex of respondent -.184 -.137 *** -.242 -.179 * -.226 -.168 *
Race White (reference) Other race -.076 -.047 -.112 -.070 -.103 -.064
Vignette Sex Interaction
White Martin * Sex (reference)
Black Meredith*Sex .216 .113 .213 .111
White Meredith*SexR -.002 -.001 -.009 -.005
Black Martin*SexR .011 .006 .007 .003
Vignette Race Interaction
White Martin *Race (reference)
Black Meredith*Race .035 .013 .041 .015
White Meredith* Race .196 .063 .213 .068
Black Martin * Race -.060 -.022 -.062 -.022
Gender Roles Scale .000 -.003
Age .012 .024
Mothers Education -.015 -.043
Father's Education .025 .077
(Constant) 2.481 2.608 2.651 2.547
R2 0.047 0.069 0.077 0.081 *Sig at the .05 level
**Sig at the .01 level
***Sig at the .001 level

28
Table 7. Regression of the Independent and Control Variables on Dependent Variable of “Kids
Prevent”, N=609.
White Martin (reference)
White Merdith
.288
.184
***
.288
.184
***
.308
.197
* .294
.188
*
black meredit .068 .043 .067 .043 .161 .102 .156 .099
black martin .014 .009 .013 .008 .010 .006 -.005 -.003
Sex of respondent -.011 -.008 -.011 -.008 .036 .026
Race White (reference)
Other race .019 .012 .135 .083 .099 .061
Vignette Sex Interaction
White Martin * Sex (reference)
Black Meredith*Sex -.006 -.003 .002 .001
White Meredith*SexR -.062 -.032 -.040 -.021
Black Martin*SexR .058 .030 .065 .033
Vignette Race Interaction
White Martin *Race (reference)
Black Meredith*Race -.387 -.135 * -.384 -.134 *
White Meredith* Race .098 .031 .142 .045 Black Martin * Race -.134 -.047 -.087 -.031
Gender Roles Scale -.007 -.057
Age .039 .079
Mothers Education -.030 -.082
Father's Education .003 .008
(Constant) 2.013 2.015 1.99 2.214 R2 0.029 0.03 0.043 0.059
*Sig at the .05 level
**Sig at the .01 level
***Sig at the .001 level
Model 1 Model 2 Model 3 Model 4
B Beta B Beta B Beta B Beta
Vignette
29
Table 8. Regression of the Independent and Control Variables on the Dependent Variable of “Advance
10 Years”, N=609.
Vignette
B
Model 1
Beta
B
Model 2
Beta
Model 3
B Beta
Model 4
B Beta
White Martin (reference)
White Merdith
.237
.127
**
.235
.126
**
.194
.104
.190
.101
black meredit .336 .178 *** .338 .179 *** .157 .083 .159 .084
black martin .094 .050 .097 .051 -.184 -.098 -.179 -.095
Sex of respondent .017 .010 -.153 -.093 -.139 -.084
Race White (reference)
Other race -.084 -.043 -.173 -.088 -.191 -.098
Vignette Sex Interaction
White Martin * Sex (reference)
Black Meredith*Sex
.314
.134
.319
.137
White Meredith*SexR .106 .045 .129 .055
Black Martin*SexR
Vignette Race Interaction
.285 .122 .292 .124
White Martin *Race (reference)
Black Meredith*Race -.010 -.003 -.025 -.007
White Meredith* Race -.142 -.037 -.149 -.039
Black Martin * Race .472 .139 * .487 .143
Gender Roles Scale -.006 -.038
Age -.007 -.012
Mothers Education -.009 -.021
Father's Education -.018 -.044
(Constant) 3.436 3.444 3.566 3.915 R2 0.025 0.027 0.048 0.052
*Sig at the .05 level
**Sig at the .01 level
***Sig at the .001 level
30
References
Banga, R. (n.d.). Where’s the Diversity in Fortune 500 CEOs? Retrieved from
http://www.diversityinc.com/diversity-facts/wheres-the-diversity-in-fortune-500-ceos/
Barreto, M. C., Ryan, M. K., and Schmitt, M. T. (2009). The Glass
Ceiling in the 21st Century: Understanding Barriers to Gender Equality. Vol. 1. Washington,
DC: American Psychological Association. 1-333. Print.
Beller, A. H. (1984). Trends in Occupational Segregation by Sex and Race, 1960-1981. In Sex Segregation in the Workplace: Trends, Explanations and Remedies, edited by B. F. Reskin,
pp. 9-26. Washington: National Academy Press.
Berger, J. & Webster, M. (2006). Expectations, Status, and Behavior. In Contemporary Social Psychological Theories, edited by: P. J. Burke. Stanford, CA: Stanford
University Press
Cikara, M., & Morrow, J. (May, 2004). Effects of Gender and Dominance on Perceptions of
Overt Sexuality, Sexual Attractiveness, Warmth, and Competence. American Psychological
Society, Chicago, IL.
Coyne, B., Coyne, E., & Lee, M. (2004). Human Resources, Care-Giving, Career Progression
and Gender (1st ed., Vol. 1, p. 160). New York: Routledge, Taylor & Francis Group.
Cohn, S. (1996). ‘Human Capital Theory,’ in Dubeck, P. and Borman, K. Women and Work: A
Handbook, New York: Garland Publishing Inc., p. 107.
Foley, S. (2002). The Perceived Glass Ceiling and Justice Perceptions: An Investigation of
Hispanic Law Associates. Journal of Management, 28(4), 471-496.
Glick, P, & Fiske, S. T. (2007). Sex Discrimination. The Psychological Approach. In F. J. Crosby, M. S. Stockdale, & S. A. Ropp (ed), Sex Discrimination in the Workplace (pg. 155-188).
Malden, MA: Blackwell.
Hannon, L., & Defina, R. (2014). Just skin deep? the impact of interviewer race on the assessment of
african american respondent skin tone. Race and Social Problems, 6(4), 356-364.
doi:http://dx.doi.org/10.1007/s12552-014-9128-z
Hasslette, B., Geis, F., and Carter, M. (1992). Organisational Women: Power and Paradox,
New Jersey: Ablex Publishing Corporation, p. 35.
Johns, M. (2013). Breaking the Glass Ceiling: Structural, Cultural, and Organizational
Barriers Preventing Women from Achieving Senior and Executive Positions. Perspectives in
Health Management, 10(1). Retrieved from
http://www.ncbi.nlm.nih.gov/pmc/articles/PMC3544145/
Johnsrud, L. K., Heck, R. H. (1994). Administrative promotion within a university: The
cumulativ. The Journal of Higher Education, 65(1), 23. Retrieved from
http://search.proquest.com/docview/205311821?accountid=13158

34
Kaplan, R. (2011). African Americans, Americans of color, inequality, racism,
systemic racism. Retrieved from http://www.racismreview.com/blog/2011/04/22/racial-inequality-
and-meritocracy-a-closer-look/
Kossek, E. E., Colquitt, Jason, & Noe, Ray. (2001). Caregiving decisions, well-being and performance:
The effects of place and provider as a function of dependent type and work-family climates,
Academy of Management Journal, 44 (1): 29-44.
Liss, M., Crawford, M., & Popp, D. (2004). Predictors and correlates of collective action. Sex Roles,
50(11), 771-779. Retrieved from http://search.proquest.com/docview/225367193?accountid=13158
Liss, M., O'Connor, C., Morosky, E. and Crawford, M. (2001), What Makes a Feminist?
Predictors and Correlates of Feminist Social Identity in College Women. Psychology of Women
Quarterly, 25: 124–133. doi: 10.1111/1471-6402.00014
Maiese, M. (2013). Distributive Justice (H. Burgess, Ed.). Retrieved December 9,
2014, from http://www.beyondintractability.org/essay/distributive-justice
Marx, K., and Engels, F. (Org: 1848) The Communist Manifesto. Ed. Penguin Books.
Vol. 2. New York: Penguin Classics. 2006. Print.
McLeod, S. (Jan. 2008). Social Identity Theory. SimplePsychology. Web.
<http://www.simplypsychology.org/social-identity-theory.html>.
Ogilvie, S. (n.d.) Status Characteristics Theory. Status Characteristics Theory. Psych It. Web.
<http://www.psych-it.com.au/ScientificResearch/Theses/Honours/sOgilvie/thesis7.asp>.
Part I: CNN/YouTube Democratic Presidential Debate Transcript. (Jan. 2007). CNN. Turner
Broadcasting Systems, Inc., Web.
<http://www.cnn.com/2007/POLITICS/07/23/debate.transcript/>.
Qualtrics: Online Survey Software & Insight Platform (Qualtrics Home Comments)
http://www.qualtrics.com/
Reskin, B. F., & National Research Council (U.S.). Committee on Women's Employment and
Related Social Issues. (1984). Sex segregation in the workplace: Trends, explanations, remedies.
Washington, D.C: National Academy Press.
Ridgeway, C. L. & Correll, S. J. (2006). Consensus and the Creation of Status
Beliefs. Social Forces 85:431-54
Ridgeway, C. L., Backor, K., Li, Y. E., Tinkler, J. E., & Erickson, K. G. (2009). How easily does a social
difference become a status distinction? gender matters. American Sociological Review, 74(1), 44-62.
Retrieved from http://search.proquest.com/docview/218829988?accountid=13158
Singh, B., Winkel, D. E., & Selvarajan, T. T. (2013). Managing diversity at work: Does
psychological safety hold the key to racial differences in employee performance?. Journal Of
Occupational & Organizational Psychology, 86(2), 242-263.

34
Tajfel, H. & Turner, J. C. (1979). An Integrative Theory of Intergroup Conflict. In W. G. Austin & S.
Worchel (Eds.), The Social Psychology of Intergroup Relations. Monterey, CA: Brooks-Cole.

34
Appendix A – Gender Role Scales
Possible Answers: Strongly Agree, Agree, Neutral, Disagree, Strongly Disagree
“It is much better for everyone if the man earns the money and the woman takes care of
the house and the family.”
“If a husband and a wife both work full-time, they should share household tasks equally.”
“I see nothing wrong with giving a little boy a doll to play with.”
“A man who is very emotional and cries is not very masculine.”
“Female bosses are harder to work for than male bosses.”
“It is OK for women to cry in public but it is not OK for men to do so.”
“A person should generally be more polite to a woman than to a man.”
“I think it is OK for a woman to keep her maiden name after she marries.”

39
Appendix B- Survey
How likely is [Meredith/Martin] to get a job in [her/his] field of interest immediately after
college?
1 Very Unlikely
2 Unlikely
3 Somewhat Unlikely
4 Undecided
5 Somewhat Likely
6 Likely
7 Very Likely
31. How willing would you be to work with [Meredith/Martin] as your manager?
1 Very Strongly Avoid
2 Strongly Avoid
3 Avoid
4 Indifferent
5 Prefer
6 Strongly Prefer
7 Very Strongly Prefer
32. What is the likelihood that [Meredith/Martin] will return to school and pursue [her/his]
higher education 1-3 years in the future?
1 Very likely
2 Likely
3 Somewhat Likely
4 Somewhat Unlikely
5 Unlikely
6 Very Unlikely
33. What is the likelihood that [Meredith/Martin] will be already qualified for a managerial
position 1-3 years into [her/his] career (i.e. program coordinator, director, vice president) without
returning to graduate school?
1 Very Likely
2 Likely
3 Somewhat Likely
4 Somewhat Unlikely
5 Unlikely
6 Very Unlikely
34. How much do you expect [Meredith/Martin] to make in 1-3 years into [her/his] career?
1 $0 - $19,999
2 $20,000 - $39,999
3 $40,000 - $59,999
39 4 $60,000 - $99,999
5 $100,000 - $249,999
6 $250,000 or more
35. How much do you expect [Meredith/Martin] to make in 5-10 years into [her/his] career?
1 $0 - $19,999
2 $20,000 - $39,999
3 $40,000 - $59,999
4 $60,000 - $99,999
5 $100,000 - $249,999
6 $250,000 or more
36. How much do you expect [Meredith/Martin] to make in 20 years into [her/his] career?
1 $0 - $19,999
2 $20,000 - $39,999
3 $40,000 - $59,999
4 $60,000 - $99,999
5 $100,000 - $249,999
6 $250,000 or more
37. A few years down the road, [Meredith/Martin] plans on starting a family. Do you believe
that beginning a family (i.e. marriage, kids) will prolong [Meredith/Martin] from advancing in
[her/his] career?
1 Definitely not
2 Probably not
3 Probably yes
4 Definitely yes
38. Do you believe that a family (i.e. marriage, kids) will prevent [Meredith/Martin]
from advancing in [her/his] career?
1 Definitely not
2 Probably not
3 Probably yes
4 Definitely yes
39. 10 years into [Meredith’s/Martin's] career, [she/he] advances to the managerial position (i.e.
program coordinator, director, vice president), working roughly 60-70 hours per week. [She/He]
also has two kids and a [Wife/Husband]. In relation to [her/his] circumstances, [she/he] :
1 Far exceeds expectations
2 Exceeds expectations
3 Equals expectations
4 Short of expectations
5 Far short of expectations

39 40. What is the likelihood that [Meredith/Martin] is the primary caregiver in [her/his] family?
1 Very Likely
2 Likely
3 Somewhat Likely
4 Somewhat Unlikely
5 Unlikely
6 Very Unlikely

39
KIMBERLY J. DONOVAN [email protected]
814-482-0201
EDUCATION The Pennsylvania State University, State College, PA
Schreyer Honors College, Bachelor of Arts, Crime, Law, and Justice
Minor, Human Development and Family Studies
RESEARCH/TEACHING EXPERIENCE
The Pennsylvania State University, Department of Sociology and Crime, Law, and Justice
Teaching Assistant
Responsible for grading papers, conducting review sessions, constructing quizzes,
maintaining office hours, and organizing students’ grades
The Penn State University, Department of HDFS, Dr. Jacobson
Independent Research Study Worked under Lauren Jacobson, Professor of Human Development and Family Studies to
conduct research on adolescents’ attitudes toward population diversity
Constructed presentation poster consisting of abstract, literature review, methods, and
discussion sections
Presented research findings in the National Conference of Undergraduate Research at Weber
University, Utah
Established grant proposal to cover flight, hotel, and meal costs
The Pennsylvania State University, Department of HDFS, course supplement
Strategically developed and executed an eight week educational curriculum on nutrition
tailored to benefit low socio-economic children through an after school program
Evaluated progression and learning outcomes
Constructed a research paper based on findings and previous literature
ABROAD EXPERIENCE
Vietnam and Cambodia Embedded Course Trip
Enrolled in an honors course tailored to the socio-historical aspects of Vietnam and
Cambodia
Traveled to Vietnam and Cambodia and incorporated class material to the abroad experience Specific focus on the Vietnam war, the Khmer Rouge, drug trafficking, and economic
sustainability
Outreach360
Traveled to the Dominican Republic to teach underprivileged children
Developed language curriculum to progress Spanish speaking children’s English skills
VOLUNTEER WORK/LEADERSHIP
University Hearing Board, The Pennsylvania State University
Served as a juror to determine sentencing and sanctions for illicit and disorderly conduct of
students attending the Pennsylvania State University
YMCA, Altoona, PA
Cleaned and filed paperwork at a local YMCA in Altoona area
American Rescue Workers
Enhanced organizational system for donated items

39
Justice Association
Vice President
AWARDS Academic Scholarship
President Freshman Award Sparks Award (cumulative 4.0 GPA)
Schreyer Honors College
COLLEGE ACTIVITIES/ACHIEVMENTS
Justice Association – Vice President
Phi Kappa Phi Honors Society
National Residence Hall Honorary Member
Kappa Omicron Nu National Honors Society
Alpha Lambda Delta Honors Society
University Hearing Board Member
Member of B.U.S.T (Being United for Social Transformation)
Research on adolescent’s views of diversity
Presented at National Conference for Undergraduate Research, 2012
Intramural Soccer
MACUHO ResLife Conference, 2011
WORK EXPERIENCE
Spike’s Stadium, Suite Server June 2013 – September 2013
Responsible for customer service
Research Assistant, The Pennsylvania State University September 2012 – January 2013
ARDA Research Lab
Resident Assistant, The Pennsylvania State University August 2011 – May 2012
Enforced policies and procedures of the June 2013 – August 2013
residence halls with residents
Planned and organized programs for students enrolled in a special living option concentrated
on undergraduate major exploration
Mediated roommate conflicts using effective conflict resolution skills
Mentored students and referred them to resources and services on campus
Port Sky Dining Assistant August 2010 – May 2011
Food service
Denny’s, Williamsport, PA January 2008 – August 2010
Waitress
Consistently maintained at least one part-time job throughout six out of six semesters
REFERENCES
Available upon request