Embed Size (px)
Citation preview
Underpinning the UK Nuclear Design Basis Criterion for Naturally Occurring External Hazards
Final Report
NOT PROTECTIVELY MARKED
NOT PROTECTIVELY MARKED
FNC 62366-49823R Issue 1
Prepared for Office for Nuclear Regulation (ONR)
SYSTEMS AND ENGINEERING TECHNOLOGY
In partnership with
FNC 62366-49823R Issue No. 1
© FNC 2020 Page 2 of 86
NOT PROTECTIVELY MARKED
NOT PROTECTIVELY MARKED
DOCUMENT INFORMATION
Project : Underpinning the UK Nuclear Design Basis Criterion for Naturally Occurring External Hazards
Report Title : Final Report
Client : Office for Nuclear Regulation (ONR)
Client Ref. : ONR409
Classification : NOT PROTECTIVELY MARKED
Report No. : FNC 62366-49823R
Issue No. : 1 Compiled By : Task 1: Frazer-Nash Consultancy
Task 2: Jacobsen Analytics
Date : 31-Jul-2020 Verified By : Task 1: Frazer-Nash Consultancy
Task 2: Jacobsen Analytics
Approved By :
Frazer-Nash Consultancy
DISTRIBUTION
Copy Recipient Organisation
PDF Office for Nuclear Regulation (ONR)
COPYRIGHT
The Copyright in this work is vested in Frazer-Nash Consultancy Limited. The document is issued in confidence solely for the purpose for which it is supplied. Reproduction in whole or in part or use for tendering or manufacturing purposes is prohibited except under an agreement with or with the written consent of Frazer-Nash Consultancy Limited and then only on the condition that this notice is included in any such reproduction.
Originating Office: FRAZER-NASH CONSULTANCY LIMITED 5th Floor Malt Building, Wilderspool Business Park, Greenalls Avenue, Warrington, Cheshire, WA4 6HL
T: +44 (0)1925 404000 F: +44 (0)1925 404001 W: www.fnc.co.uk
FNC 62366-49823R Issue No. 1
© FNC 2020 Page 3 of 86 NOT PROTECTIVELY MARKED
NOT PROTECTIVELY MARKED
SUMMARY
The Office for Nuclear Regulation Safety Assessment Principles set the design basis criterion for naturally
occurring external hazards at a frequency of exceedance of 10-4 per year, which is conservatively evaluated
to establish the magnitude of a particular hazard that the plant and the associated Structures, Systems and
Components should be designed to withstand. The current design basis criterion (10-4 per year) has been
selected on the basis that attempts to characterise natural hazards at frequencies lower than 10-4 per year
yielded results which had the potential to distort the risk picture and lead to a potentially unbalanced plant
design. Historically, the inclusion of hazards down to 10-4 per year (and resilience against those hazards)
have produced plant designs that have not been dominated by nuclear risk associated with external
hazards1.
This report is the output of a research project (ONR-RRR-059) specified, sponsored and overseen by the
Office for Nuclear Regulation (ONR). It covers a comparison of the UK design basis criteria for external
hazards with international practices and an investigation into the relative risk contribution from design basis,
beyond design basis and very low frequency naturally occurring external hazards.
The scope of the first task was focussed around a literature review of a 2019 Nuclear Energy Agency (NEA)
report entitled “Examination of Approaches for Screening External Hazards for Nuclear Power Plants”, which
contains a summary of external hazard screening practices from several countries and international
organisations, and its associated references. A consistent set of questions was first posed for each of the
international regulatory bodies during this review to ensure a meaningful set of findings produced. The
questions posed were as follows:
What are the values of the relevant natural external hazards design basis criteria used (cf. 10-4 per
year conservatively estimated in the UK), and are they generic (like the UK 10-4 per year design basis
criterion applied to all natural external hazards) or specified for individual hazards?
What are the different approaches and method(s) used to generate the identified criteria?
Are the identified international criteria more or less onerous from a design perspective? If more
onerous, could equivalent criteria in the UK lead to a more robust design solution? Conversely, if less
onerous, could equivalent criteria in the UK potentially be more manageable for industry, for example
reducing costs to licensees, whilst maintaining the levels of safety required?
The NEA report demonstrates that “best practices” or commonalities do exist in the international nuclear risk
analysis community – particularly around the screening and grouping of hazards, although care needs to be
taken to account for varying definitions. A common challenge is in establishing physical upper boundaries to
phenomena as, for many hazards, the recorded periods for which observational data are available are
limited.
The review also captures aspects not included in the NEA report that would need to be considered if the
design basis criterion in the UK were to be challenged. This includes the identification of some potentially
useful, additional references. It should be noted that the scope of the NEA report, as the title would suggest,
is limited to approaches for Nuclear Power Plants, and this has in turn bounded the scope of this literature
review. Furthermore, the focus of the NEA report is on screening hazards as opposed to the approach to
setting design basis criteria, and whilst directly relevant, is not wholly aligned to the key objectives of this
project. 1 It is possible that, in more recent years, new plant designs have reduced the risk from internal faults and hazards to the point where external hazards contribute a larger portion of risk. This report has not investigated the cogency of this idea, but it is something that might be considered in the application of external hazards research. Furthermore, emerging and future nuclear power plant designs which are not based on light water reactor technology may also have a greater portion of risk associated with external hazards.
FNC 62366-49823R Issue No. 1
© FNC 2020 Page 4 of 86 NOT PROTECTIVELY MARKED
NOT PROTECTIVELY MARKED
The scope of the second task was to conduct a quantitative investigation into the relative risk contributions
from beyond design basis events. Of particular interest was the balance of risk arising from very low
frequency, high magnitude hazard events compared to within or close to the design basis events.
Three naturally occurring external hazards were selected for these investigations:
Seismic – seismic Probabilistic Safety Assessment (PSA) methodology is well developed and there are
publicly available documents containing hazard curves and fragility data. The risk associated with potential
earthquakes is generally one of the more significant issues associated with the licensing of nuclear facilities.
There is potentially significant risk arising from beyond design basis events; seismic hazard curves tend to
have long upper tails, extending well beyond the design basis level. Seismic events have the characteristic
of being spread across the whole site, rather than being localised, even affecting off-site services.
External flood - external flood PSA methodology is well developed and simple to implement. Like seismic
events, external flood events have the characteristic of being spread across the whole site, rather than being
localised, even affecting off-site services. The response to a flood is a step function; at a certain flooding
level, certain systems, structures or components will fail with high probability, based primarily on the
elevation at which the component is located.
Lightning strike - PSA methodology for lightning strike on nuclear facilities is not very well developed.
Unlike seismic and flooding, lightning strikes are localised events affecting sections (generally, specific
buildings) on a site, though there are also likely to be associated weather conditions that may affect off-site
services concurrently. As in the case of seismic, the capability of systems, structures and components to
withstand lightning strike can be characterised in probabilistic models using a continuous probability model.
PSA models have been constructed for the above hazards, each using conditional core damage probabilities
estimated from the predicted plant damage states. Sensitivity studies have been undertaken to examine the
variability of core damage probability to model assumptions and hazard severity levels.
Ultimately, Tasks 1 and 2 attempt to substantiate the current UK criteria for designing nuclear facilities for
naturally occurring external hazards. This report presents how successful the tasks have been in this regard,
and concludes whether any strong evidence has been found for modification to the current UK design basis
criteria.
FNC 62366-49823R Issue No. 1
© FNC 2020 Page 5 of 86 NOT PROTECTIVELY MARKED
NOT PROTECTIVELY MARKED
ABBREVIATIONS AND ACRONYMS
AC Alternating Current (e.g. supply)
AFW Auxiliary Feed Water
ALARP As Low As Reasonably Practicable
AMR Advanced Modular Reactor
ANS American Nuclear Society
ANSI American National Standards Institute
ASAMPSA Advanced Safety Assessment: Extended PSA (EU project)
ASCE American Society of Civil Engineers
ASME American Society of Mechanical Engineers
CCDP Conditional Core Damage Probability
CDF Core Damage Frequency
CFDP Conditional Fuel Damage Probability
CFR Code of Federal Regulations (NRC code)
CLERP Conditional Large Early Release Probability
CSNI Committee on the Safety of Nuclear Installations
CNSC Canadian Nuclear Safety Commission
CVCS Chemical and Volume Control System
DC Direct Current (e.g. supply)
DG Diesel Generator
DOE (US) Department of Energy
EHs External Hazards
EPR European Pressurised Water Reactor
EPRI Electric Power Research Institute
FDF Fuel Damage Frequency
GDA Generic Design Assessment
GEV Generalized Extreme Value
HEP Human Error Probability
IAEA International Atomic Energy Agency
IEF Initiating Event Frequency
IRWST In-Containment Refuelling Water Storage Tank
KTA Kerntechnischer Ausschuß ((German) Nuclear Standards Commission)
LERF Large Early Release Fraction
LMFW Loss of Main Feed Water
FNC 62366-49823R Issue No. 1
© FNC 2020 Page 6 of 86 NOT PROTECTIVELY MARKED
NOT PROTECTIVELY MARKED
LOCA Loss Of Coolant Accident
LOOP Loss Of Off-site Power
LRF Large Release Frequency
MCR Main Control Room
NEA Nuclear Energy Agency
NRC Nuclear Regulatory Commission (US)
NPP Nuclear Power Plant
NUREG US Nuclear Regulatory Commission Regulation (NRC document)
OBE Operating Basis Earthquake (NRC terminology)
OECD Organisation for Economic Co-operation and Development
ONR Office for Nuclear Regulation
PCSR Pre-Construction Safety Report
PGA Peak Ground Acceleration
PORV Power Operated Relief Valves (AP1000)
PRA Probabilistic Risk Assessment
PSA Probabilistic Safety Assessment
PWR Pressurised Water Reactor
RCS Reactor Coolant System
REGDOC Regulatory Document (CNSC document)
RGP Relevant Good Practice
RMF Radionuclide Mobilisation Frequency
SAPs Safety Assessment Principles
SDS Seismic Damage State
SSCs Structures Systems and Components
SSG Specific Safety Guide (IAEA document)
TAG Technical assessment guides (ONR document)
TECDOC Technical Document (IAEA document)
UHS Uniform Hazard Spectrum
US(A) United States (of America)
WENRA Association of Regulators of Western Europe
FNC 62366-49823R Issue No. 1
© FNC 2020 Page 7 of 86 NOT PROTECTIVELY MARKED
NOT PROTECTIVELY MARKED
CONTENTS
SUMMARY 3
ABBREVIATIONS AND ACRONYMS 5
1. INTRODUCTION 8
2. SCOPE 10
2.1 TASK 1 10
2.2 TASK 2 11
3. TASK 1 – SUMMARY OF NEA REVIEW 12
3.1 SUMMARY OF DESIGN BASIS AND SCREENING CRITERIA 12
3.2 TASK 1 CONCLUSIONS 15
4. TASK 2 – SUMMARY OF QUANTITATIVE RISK ASSESSMENT 19
4.1 INTRODUCTION 19
4.2 PSA MODEL QUANTIFICATION AND SENSITIVITY STUDIES 19
4.3 RESULTS 22
4.4 DISCUSSION 33
5. REFERENCES 38
A.1 APPENDIX 1 – TASK 1 39
A.1.1 METHODOLOGY 39
A.1.2 FINDINGS 39
A.1.4 REFERENCES FOR APPENDIX 1 56
A.2 APPENDIX 2 – PSA MODELLING WORK 58
A.2.1 CONDITIONAL CORE DAMAGE PROBABILITIES 58
A.2.2 SEISMIC MODEL 65
A.2.3 EXTERNAL FLOODING MODEL 75
A.2.4 LIGHTNING MODEL 77
A.2.6 REFERENCES FOR APPENDIX 2 82
A.3 APPENDIX 3 – SUMMARY OF US ANALYSIS ON EXTERNAL FLOODS 83
A.3.1 REVIEW OF UK EPR PCSR INFORMATION SUGGESTED AT 23 APRIL MEETING 83
A.3.2 BLAYAIS NPP 1999 EVENT 84
A.3.3 REFERENCES FOR APPENDIX 3 85
FNC 62366-49823R Issue No. 1
© FNC 2020 Page 8 of 86 NOT PROTECTIVELY MARKED
NOT PROTECTIVELY MARKED
1. INTRODUCTION
The Office for Nuclear Regulation (ONR) Safety Assessment Principles (SAPs) [Ref. 1],
together with the supporting Technical Assessment Guide 13 (TAG 13) [Ref. 2], set the design
basis criterion for naturally occurring External Hazards (EHs) at a frequency of exceedance of
10-4 per year, which should be conservatively evaluated, to establish the magnitude of a
particular hazard that the plant and the associated Structures, Systems and Components
(SSCs) should be designed to withstand. This value should be seen as commensurate with the
10-5 per year value used for discrete hazards and other non-EH initiating events, the difference
being in recognition of the difficulty in defining natural hazards at exceedance frequencies below
10-4 per year.
One of ONR’s objectives potentially supported by this project is to identify a method, or
methods, to substantiate appropriate design basis criteria for naturally occurring external
hazards, and also identify an approach, or approaches, for determining the appropriate levels of
conservatism to be applied within the design basis.
Anecdotal evidence suggests that the current design basis criterion (10-4 per year) may have
been selected on the basis that attempts to characterise natural hazards at frequencies lower
than 10-4 per year could yield results which had the potential to distort the risk picture and lead
to a potentially unbalanced nuclear power plant designs. This is consistent with Revision 3 of
[Ref. 2], (2009), which sets out a basis for the definition of design basis events for natural
hazards as follows: For natural hazards, the uncertainty of data may prevent reasonable
prediction of events for frequencies less than once in 10,000 years. In these cases, facilities
may have a design basis event that conservatively has a predicted frequency of being
exceeded no more than once in 10,000 years. UK experience from the first nuclear power plant
Periodic Safety Reviews in the 1990’s had shown that the inclusion of hazards down to 10-4 per
year (and resilience against those hazards) showed a plant design which was not dominated by
nuclear risk associated with EHs. EHs have been shown to present a potential common cause
source of initiating events that can challenge the safety of a Nuclear Power Plant (NPP).
Modern nuclear installations are designed to withstand all reasonably foreseeable naturally
occurring external hazards without exceeding the relevant dose criteria. The identified set of
reasonably foreseeable events are referred to as Design Basis Events, which includes both
naturally occurring and man-made hazards that originate external to the site – referred to as
EHs.
Understanding of individual hazards and how their magnitude varies with frequency as well as
the methods used for deriving appropriate design criteria and evaluating the magnitude of the
challenge are continually evolving. Providing engineered protection against EHs is a significant
cost driver for nuclear facilities and if the design basis criterion is too onerous, unnecessary
costs may result.
Furthermore, most of the nuclear plant candidate designs for new build in the UK have been
developed overseas. Experience from recent Generic Design Assessments (GDAs) has
highlighted that this can potentially lead to difficulties in establishing where the design lies in
relation to the UK regulatory expectations for natural hazard resilience. Although the current
design basis criterion for EHs has been in place for many years, it has not been established
whether a less or more onerous criterion could be adopted for different hazards whilst retaining
a balanced approach to risk.
The aim of Task 1 was to conduct a full review of the Nuclear Energy Agency (NEA) report titled
NEA/CSNI/R(2018)7 ‘Examination of Approaches for Screening External Hazards for Nuclear
Power Plants’ [Ref. 3]. The aim of the review was to allow benchmarking of where the current
FNC 62366-49823R Issue No. 1
© FNC 2020 Page 9 of 86 NOT PROTECTIVELY MARKED
NOT PROTECTIVELY MARKED
UK 10-4 per year design basis criterion for naturally occurring external hazards lies in relation to
design criteria adopted elsewhere i.e. by other regulators and to provide a view on whether the
approaches adopted in other countries would result in more or less onerous design
requirements and whether they could be considered suitable for adoption in the UK.
The objective of Task 2 is to conduct a quantitative investigation into the relative risk
contributions from beyond design basis and from very low frequency parts of hazard curves for
naturally occurring external hazards and to provide information on the level of conservatism that
would be appropriate to apply within the design basis.
This research project has been delivered in partnership between Frazer-Nash Consultancy,
Jacobsen Analytics and Mott MacDonald, with each company playing a slightly different role as
follows:
Frazer-Nash, as Tier 1 framework supplier, have been responsible for the coordination
of the project and conducting the Task 1 literature review.
Jacobsen Analytics, with their expertise in PSA, have lead and delivered the detailed
quantitative modelling work in Task 2.
Mott MacDonald, with their background in external hazard analysis, have been
consulted on the inputs and outputs of Tasks 1 and 2.
FNC 62366-49823R Issue No. 1
© FNC 2020 Page 10 of 86 NOT PROTECTIVELY MARKED
NOT PROTECTIVELY MARKED
2. SCOPE
Providing engineered protection against external hazards is a significant cost driver for nuclear
facilities and if the design basis criterion is too onerous, unnecessary costs may result.
Although the current design basis criterion for external hazards has been in place for many
years, it has not been established whether a less or more onerous criterion could be adopted for
different hazards whilst retaining a balanced approach to risk. This work is needed to ensure
that the design basis criterion is set at the right level.
It is understood that one of ONR’s objectives is to identify a method, or methods, to substantiate
appropriate design basis criteria for naturally occurring external hazards, and also identify an
approach, or approaches, for determining the appropriate levels of conservatism to be applied
within the design basis. The scope of this particular package of work is to investigate the
feasibility of achieving this objective, and to identify appropriate methods and resource
requirements.
2.1 TASK 1
The scope of Task 1 was to conduct a full review of the NEA report [Ref.3].
The NEA report contains a summary of naturally occurring external hazard screening practices
from several countries including Canada, Germany, Finland, Russia, Switzerland and the United
States, as well as international organisations such as the International Atomic Energy Agency,
the Western Europe Nuclear Regulators Association, the Advanced Safety Assessment
Methodologies: extended PSA project and the Nuclear Energy Agency.
This report attempts to answer a series of questions that will help inform where the UK’s design
basis criterion lies in relation to other countries. The same set of questions were asked for each
of the International regulatory agencies during this review to ensure a consistent review was
carried out and a meaningful set of findings produced. These questions are provided below:
What are the values of the relevant natural external hazards design basis criteria used
(cf. 10-4 per year conservatively estimated in the UK), and are they generic (like the UK
10-4 per year design basis criterion applied to all natural external hazards) or specified for
individual hazards?
What are the different approaches and method(s) used to generate the identified criteria?
Are the identified international criteria more or less onerous from a design perspective? If
more onerous, could equivalent criteria in the UK lead to a more robust design solution?
Conversely, if less onerous, could equivalent criteria in the UK potentially be more
manageable for industry, for example reducing costs to licensees, whilst maintaining the
levels of safety required?
This task has also identified aspects not included in the NEA report that would need to be
considered if the design basis criterion in the UK was to be challenged. It should be noted that
the scope of the NEA report, as the title would suggest, is limited to approaches for Nuclear
Power Plants, and this has in turn bounded the scope of this literature review.
The scope of the NEA report, and therefore also of this review, is limited to the following
naturally occurring external hazards only:
Seismic (this incorporates earthquake, ground rupture, long period ground motion or
liquefaction).
Flooding and Hydrological (includes rainfall, tidal, storm surge, waves, seiche, tsunami,
dam failure, river, ground run-off and groundwater).
FNC 62366-49823R Issue No. 1
© FNC 2020 Page 11 of 86 NOT PROTECTIVELY MARKED
NOT PROTECTIVELY MARKED
Meteorological (includes ambient air temperature, humidity, sea temperature, snow,
icing, hail, fog, lightning, drought and wind (including tornado)).
Biological (includes seaweed, fish / jelly fish, marine growth and corrosion promoter).
Geological (includes settlement, landslide, subsidence, water erosion / deposition and
volcanic ash).
Fire (includes forest fire, wildfire or burning turf / peat).
2.2 TASK 2
The scope of Task 2 was to conduct a quantitative investigation into the relative risk
contributions from beyond design basis events. Of particular interest was the balance of risk
arising from very low frequency, high magnitude hazard events compared to within or close to
the design basis events.
Three naturally occurring external hazards were selected for these investigations (as is
discussed further below). Insights from the investigations can be used to inform regulatory
expectations regarding an appropriate level of conservatism to apply when designing with
reference to a particular design basis hazard.
The hazards selected for analysis were as follows:
Seismic – seismic PSA methodology is well developed and there are publicly available
documents containing hazard curves and fragility data. The risk associated with potential
earthquakes is generally one of the more significant issues associated with the licensing of
nuclear facilities. There is potentially significant risk arising from beyond design basis
events; seismic hazard curves tend to have long upper tails, extending well beyond the
design basis level. Seismic events have the characteristic of being spread across the whole
site, rather than being localised, even affecting off-site services. The capability of systems,
structures and components to withstand a seismic event are usually characterised in
probabilistic models using a continuous probability model as a function of earthquake
magnitude.
External flood - external flood PSA methodology is well developed and simple to implement.
Like seismic events, external flood events have the characteristic of being spread across the
whole site, rather than being localised, even affecting off-site services. On the other hand,
unlike the response of systems, structures and components to seismic events, the response
to flood events is not expected to be characterised by a continuous probability model.
Rather, the response to a flood is a step function; at a certain flooding level, certain systems,
structures or components will fail with high probability, based primarily on the elevation at
which the component is located.
Lightning strike - to the best knowledge of the authors of the present report, PSA
methodology for lightning strike on nuclear facilities is not very well developed. However,
guidance is available in, for example, British Standards (see Appendix 2 for detailed
references) and it was determined that quantification could be performed in a relatively
simple way. Furthermore, data is available on strike frequency and magnitude, as well as
guidance on quantifying damage probabilities. Unlike seismic and flooding, lightning strikes
are localised events affecting sections (generally, specific buildings) on a site, though there
are also likely to be associated weather conditions that may affect off-site services
concurrently. As in the case of seismic, the capability of systems, structures and
components to withstand lightning strike can be characterised in probabilistic models using a
continuous probability model (see Appendix 2).
FNC 62366-49823R Issue No. 1
© FNC 2020 Page 12 of 86 NOT PROTECTIVELY MARKED
NOT PROTECTIVELY MARKED
3. TASK 1 – SUMMARY OF NEA REVIEW
Full details of the NEA review are presented in Appendix 1. A summary of the findings of the
review is presented below.
3.1 SUMMARY OF DESIGN BASIS AND SCREENING CRITERIA
The NEA report [Ref.A1.1] states that information included in this report covers both design
(and associated design basis) and probabilistic risk (or safety) analysis applications. In the
same paragraph it also states that current practice indicates a wide variety of criteria being used
to screen external hazards for further consideration in NPP risk assessments. These two
statements introduce a degree of confusion since criteria applicable to design basis hazards do
not screen external hazards for further consideration in NPP risk assessments. However, in the
context of PSA screening criteria, which are well beyond the design basis, a specific frequency
is selected as a cut-off value for which events that occur at lower frequencies can be excluded
from further consideration in a PSA model. The NEA report could have been much clearer in
making this distinction.
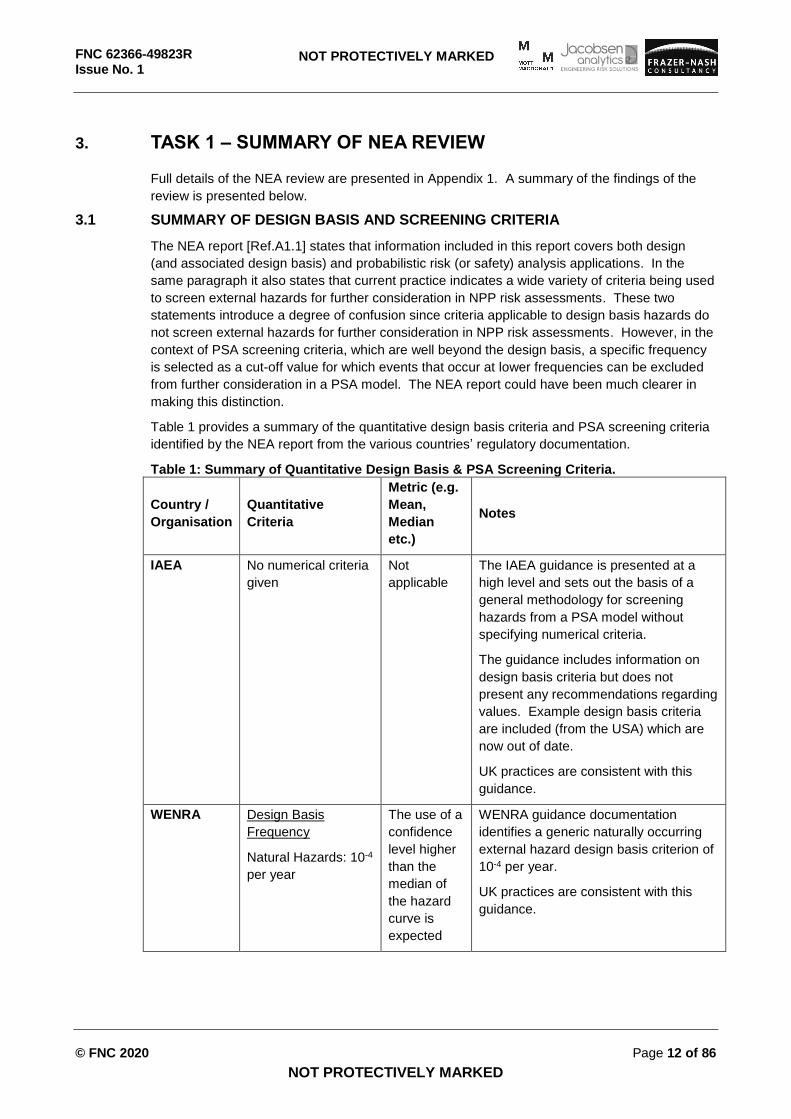
Table 1 provides a summary of the quantitative design basis criteria and PSA screening criteria
identified by the NEA report from the various countries’ regulatory documentation.
Table 1: Summary of Quantitative Design Basis & PSA Screening Criteria.
Country /
Organisation
Quantitative
Criteria
Metric (e.g.
Mean,
Median
etc.)
Notes
IAEA No numerical criteria
given
Not
applicable
The IAEA guidance is presented at a
high level and sets out the basis of a
general methodology for screening
hazards from a PSA model without
specifying numerical criteria.
The guidance includes information on
design basis criteria but does not
present any recommendations regarding
values. Example design basis criteria
are included (from the USA) which are
now out of date.
UK practices are consistent with this
guidance.
WENRA Design Basis
Frequency
Natural Hazards: 10-4
per year
The use of a
confidence
level higher
than the
median of
the hazard
curve is
expected
WENRA guidance documentation
identifies a generic naturally occurring
external hazard design basis criterion of
10-4 per year.
UK practices are consistent with this
guidance.
FNC 62366-49823R Issue No. 1
© FNC 2020 Page 13 of 86 NOT PROTECTIVELY MARKED
NOT PROTECTIVELY MARKED
Country /
Organisation
Quantitative
Criteria
Metric (e.g.
Mean,
Median
etc.)
Notes
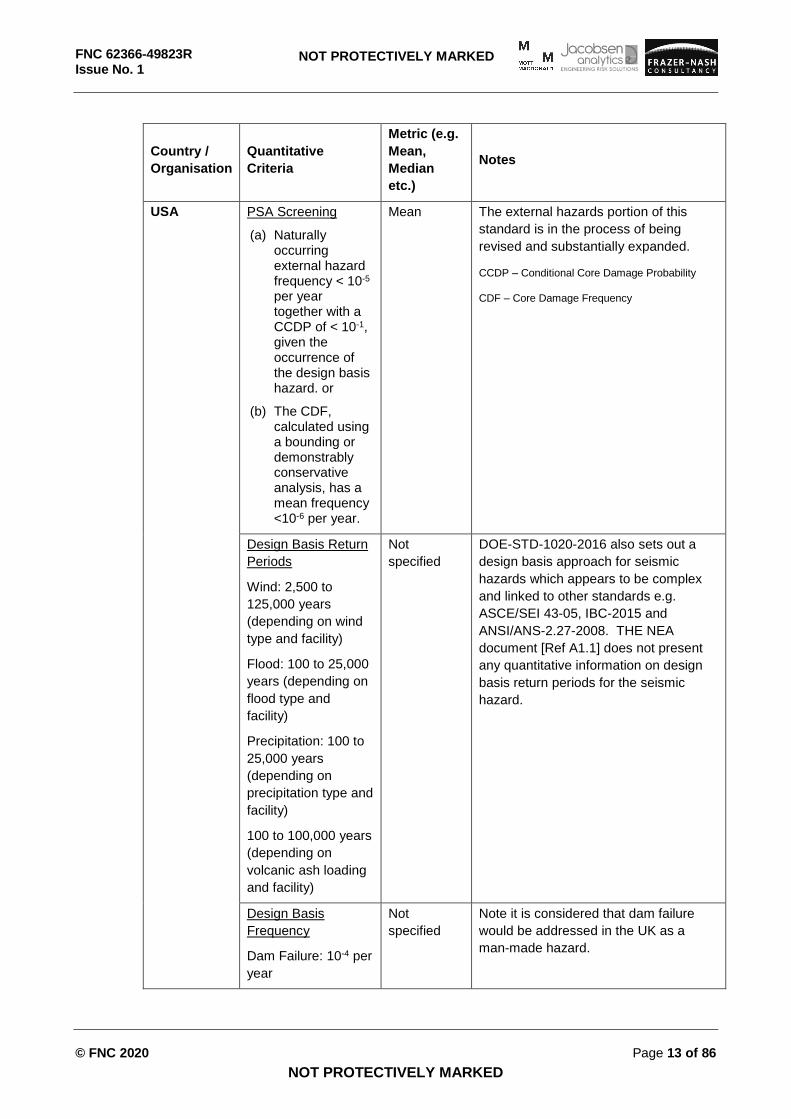
USA PSA Screening
(a) Naturally occurring external hazard frequency < 10-5 per year together with a CCDP of < 10-1, given the occurrence of the design basis hazard. or
(b) The CDF, calculated using a bounding or demonstrably conservative analysis, has a mean frequency <10-6 per year.
Mean The external hazards portion of this
standard is in the process of being
revised and substantially expanded.
CCDP – Conditional Core Damage Probability
CDF – Core Damage Frequency
Design Basis Return
Periods
Wind: 2,500 to
125,000 years
(depending on wind
type and facility)
Flood: 100 to 25,000
years (depending on
flood type and
facility)
Precipitation: 100 to
25,000 years
(depending on
precipitation type and
facility)
100 to 100,000 years
(depending on
volcanic ash loading
and facility)
Not
specified
DOE-STD-1020-2016 also sets out a
design basis approach for seismic
hazards which appears to be complex
and linked to other standards e.g.
ASCE/SEI 43-05, IBC-2015 and
ANSI/ANS-2.27-2008. THE NEA
document [Ref A1.1] does not present
any quantitative information on design
basis return periods for the seismic
hazard.
Design Basis
Frequency
Dam Failure: 10-4 per
year
Not
specified
Note it is considered that dam failure
would be addressed in the UK as a
man-made hazard.
FNC 62366-49823R Issue No. 1
© FNC 2020 Page 14 of 86 NOT PROTECTIVELY MARKED
NOT PROTECTIVELY MARKED
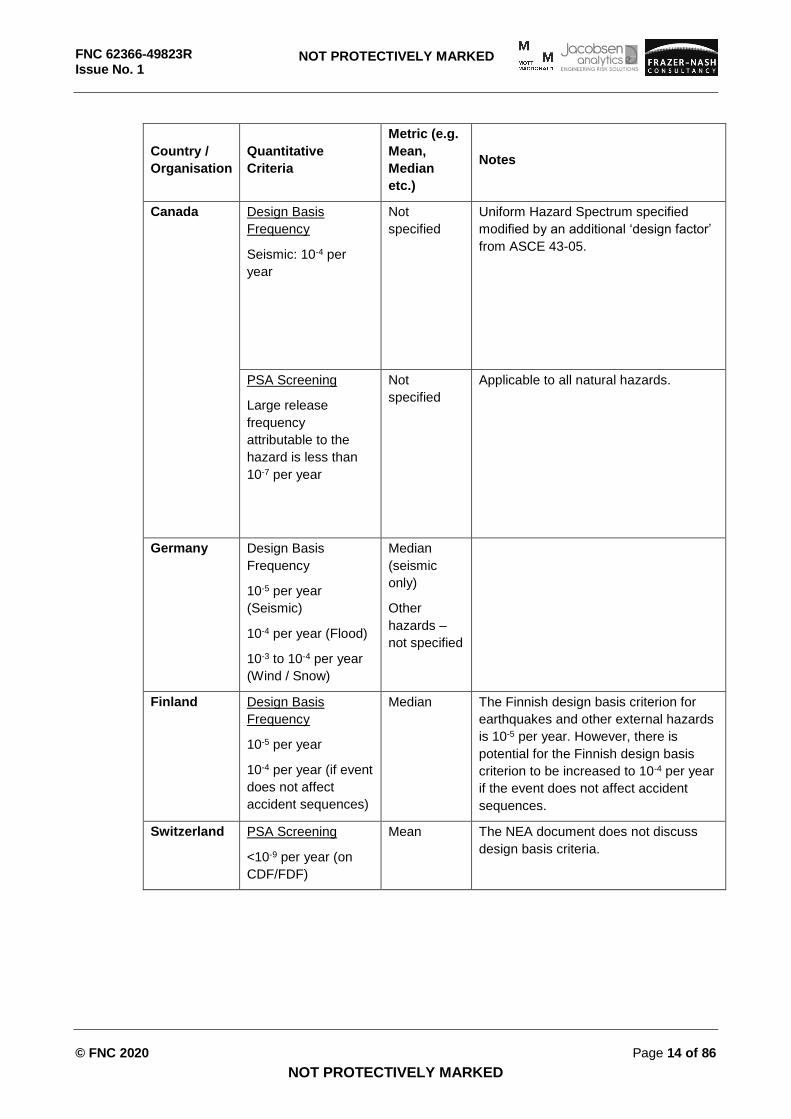
Country /
Organisation
Quantitative
Criteria
Metric (e.g.
Mean,
Median
etc.)
Notes
Canada Design Basis
Frequency
Seismic: 10-4 per
year
Not
specified
Uniform Hazard Spectrum specified
modified by an additional ‘design factor’
from ASCE 43-05.
PSA Screening
Large release
frequency
attributable to the
hazard is less than
10-7 per year
Not
specified
Applicable to all natural hazards.
Germany Design Basis
Frequency
10-5 per year
(Seismic)
10-4 per year (Flood)
10-3 to 10-4 per year
(Wind / Snow)
Median
(seismic
only)
Other
hazards –
not specified
Finland Design Basis
Frequency
10-5 per year
10-4 per year (if event
does not affect
accident sequences)
Median The Finnish design basis criterion for
earthquakes and other external hazards
is 10-5 per year. However, there is
potential for the Finnish design basis
criterion to be increased to 10-4 per year
if the event does not affect accident
sequences.
Switzerland PSA Screening
<10-9 per year (on
CDF/FDF)
Mean The NEA document does not discuss
design basis criteria.
FNC 62366-49823R Issue No. 1
© FNC 2020 Page 15 of 86 NOT PROTECTIVELY MARKED
NOT PROTECTIVELY MARKED
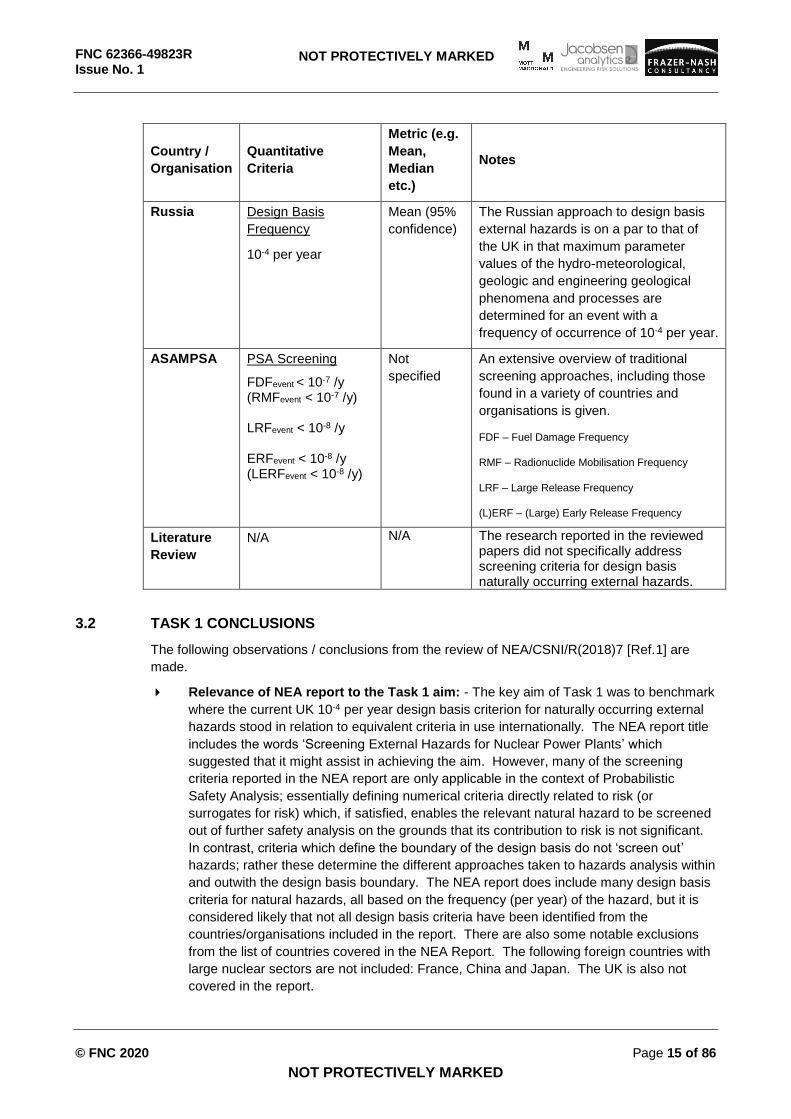
Country /
Organisation
Quantitative
Criteria
Metric (e.g.
Mean,
Median
etc.)
Notes
Russia Design Basis
Frequency
10-4 per year
Mean (95%
confidence)
The Russian approach to design basis
external hazards is on a par to that of
the UK in that maximum parameter
values of the hydro-meteorological,
geologic and engineering geological
phenomena and processes are
determined for an event with a
frequency of occurrence of 10-4 per year.
ASAMPSA PSA Screening
FDFevent < 10-7 /y (RMFevent < 10-7 /y) LRFevent < 10-8 /y ERFevent < 10-8 /y (LERFevent < 10-8 /y)
Not
specified
An extensive overview of traditional
screening approaches, including those
found in a variety of countries and
organisations is given.
FDF – Fuel Damage Frequency
RMF – Radionuclide Mobilisation Frequency
LRF – Large Release Frequency
(L)ERF – (Large) Early Release Frequency
Literature
Review
N/A N/A
The research reported in the reviewed papers did not specifically address screening criteria for design basis naturally occurring external hazards.
3.2 TASK 1 CONCLUSIONS
The following observations / conclusions from the review of NEA/CSNI/R(2018)7 [Ref.1] are
made.
Relevance of NEA report to the Task 1 aim: - The key aim of Task 1 was to benchmark
where the current UK 10-4 per year design basis criterion for naturally occurring external
hazards stood in relation to equivalent criteria in use internationally. The NEA report title
includes the words ‘Screening External Hazards for Nuclear Power Plants’ which
suggested that it might assist in achieving the aim. However, many of the screening
criteria reported in the NEA report are only applicable in the context of Probabilistic
Safety Analysis; essentially defining numerical criteria directly related to risk (or
surrogates for risk) which, if satisfied, enables the relevant natural hazard to be screened
out of further safety analysis on the grounds that its contribution to risk is not significant.
In contrast, criteria which define the boundary of the design basis do not ‘screen out’
hazards; rather these determine the different approaches taken to hazards analysis within
and outwith the design basis boundary. The NEA report does include many design basis
criteria for natural hazards, all based on the frequency (per year) of the hazard, but it is
considered likely that not all design basis criteria have been identified from the
countries/organisations included in the report. There are also some notable exclusions
from the list of countries covered in the NEA Report. The following foreign countries with
large nuclear sectors are not included: France, China and Japan. The UK is also not
covered in the report.
FNC 62366-49823R Issue No. 1
© FNC 2020 Page 16 of 86 NOT PROTECTIVELY MARKED
NOT PROTECTIVELY MARKED
It is considered that Task 1 could be usefully extended by seeking to add further design
basis criteria; those potentially omitted in the NEA report, and those from organisations
not included in the document. This would provide a broader and potentially complete
basis on which to benchmark the UK natural hazards design basis criterion.
Consideration of Uncertainty in the Criteria: - Since many of screening criteria listed in
the NEA report are relevant only to application in a PSA context, it is perhaps
unsurprising that there is little discussion on uncertainty; the assumption being that PSA
analysis would be generally conducted using ‘best-estimate’ data. In respect of natural
hazard severities, these would be expected to be mean values. Although the PSA
screening criterion on core damage frequency (CDF) used in the United States requires
the use of ‘conservative’ analysis, the only guidance presented regarding what might be
considered ‘conservative’ is an example regarding aircraft impact which does not readily
read across to natural hazards for which hazard severity is a continuous function of
frequency.
The design basis frequency criteria presented in the NEA report generally do not specify
whether the hazard(s) should be evaluated as a mean, median, or some “upper bound”.
An exception in the natural hazard design basis criteria addressed in the IAEA report is
Russia; a 95% confidence level is specified. It is also the case that some design basis
criteria (e.g. wind/snow in Germany) are specified in terms on hazard severities based on
a 1 in 50 year return period in Eurocodes which themselves may implicitly or explicitly
incorporate allowances for uncertainty. These are not discussed in the NEA report and
further research would be required to establish the nature of any applied conservatism.
It is noted that there may be little difference between a hazard severity evaluated on a
conservative basis at a particular frequency and the hazard severity evaluated on a non-
conservative basis at a lower frequency. The UK approach of determining the design
basis hazard at a 10-4 per year frequency based on the 84th percentile may, in practice,
yield similar results to the mean value of the same hazard evaluated at a frequency of 10-
5 per year. This may be particularly true for natural hazards whose severity may increase
at a reduced rate as the return period increases.
Generalized extreme value (GEV) models are generally used for these types of
predictions. Most are statistically based (relying on a data gathered over 10’s of years)
and they do not typically take account of the physics of the hazard which may limit its
extreme behaviour. This is an active research area which could remove statistical
uncertainties from extreme hazard characterisation. For those natural hazards whose
severity may be expected to level off at frequencies below 10-3 per year, the difference in
hazard severity between, for example, 10-4 per year and 10-5 per year may be small. In
such circumstances the NPP design and the associated risks may be insensitive to the
chosen value of the natural hazard design basis criterion.
Lack of Supporting Rationale Behind Design Basis and PSA Screening Criteria -
Many of the guidance documents referenced in the NEA review that provide quantitative
design basis and PSA screening criteria do not supplement the guidance with the
rationale (i.e. “the why”) behind the choice of criteria. However, it is clear that there
should be a different rationale behind PSA screening criteria from that applied to setting
design basis criteria.
PSA Screening Criteria: The PSA screening criteria discussed in the NEA document
are all criteria which are effectively designed to screen out hazards from further analysis
on the basis of risk. Metrics such as CDF or LERF may be regarded as surrogates for
risk. The IAEA documentation probably offers the most complete discussion on the
FNC 62366-49823R Issue No. 1
© FNC 2020 Page 17 of 86 NOT PROTECTIVELY MARKED
NOT PROTECTIVELY MARKED
rationale behind PSA screening criteria. However, it stops short of recommending what
values such screening criteria should take. It is suggested that the numerical values of
PSA screening criteria may have been informed, to a large extent, by the results of real
world PSA models. It might be the case that, as reactor designs have progressed over
time and as overall risk levels have reduced, so the screening criteria have been
progressively tightened. Having said that, it may be noted that the Swiss PSA screening
criterion is set at 10-9 per year on CDF, which is much lower than the PSA screening
criteria recommended in other countries, and this criterion comes from guidance
produced in 2009. It is therefore not possible to identify a rationale behind the PSA
screening criteria as presented in the NEA document.
Design Basis Criteria: For the various design basis criteria presented in Table 1, it is
also the case that the NEA report identifies no clear rationale for their selection.
Examination of the detailed guidance from individual countries addressed in the NEA
report has not identified a basis for the criteria either. It may be the case that further
investigation and the inclusion of guidance from countries omitted from the NEA report
may identify some instances of a rationale.
Considerations Regarding the UK Design Basis Criteria – The UK natural hazard
design basis criterion of 10-4 per year has been in place for many years. It is known to
have been the subject of discussions between the UK regulator and licensees around the
time that Torness and Heysham 2 power stations were being completed i.e. the 1980’s.
The rationale for the criterion is highlighted in the ONR’s TAG 13 [Ref.2]. Extreme value
analysis based on an extrapolation of data for a limited time period made the estimation
of the severity of natural hazards beyond 10-4 per year not only subject to considerable
uncertainty, it also delivered hazard severities which, if taken at their upper limits, may
have precluded NNP construction. A pragmatic approach of applying conservatism at the
10-4 per year level was therefore adopted and this continues to apply today.
The NEA report shows that different countries appear to set their design basis criteria at
values above and below the UK although, without guidance relating to conservatism in
the hazards analysis, a detailed comparison with the UK criterion is difficult. In general
terms, it is considered that the UK natural hazard design basis criterion is not out of step
with current international practice.
However, it is worth remarking that a number of countries set specific design basis criteria
for different hazards, notably with the seismic hazard being specified separately from
other natural hazards. It is suggested that hazard-specific design basis criteria should be
considered further, with specific consideration given to natural hazard combinations.
None of the design basis criteria discussed in the NEA report explicitly address hazard
combinations although there is limited consideration of hazards combinations in the
guidance of a few organisations in the context of PSA.
As a final thought, it is appropriate to reconsider the purpose of specifying a design basis.
One possible definition of the design basis is ‘The design basis comprises the set of
conditions and requirements which need to be taken into account in designing a NPP to
ensure an adequate level of safety’. With this definition, consideration of conditions and
requirements outwith the design basis could be argued to be unnecessary. However, this
would require assurance that the design basis not only encompassed nearly all the risk, it
would also be necessary to demonstrate that residual risks were ALARP. Neither of
these requirements can be satisfied without consideration of what lies beyond the design
basis; hence the UK regulatory expectation is for duty holders to include both design
basis and beyond design basis analysis in their safety cases. The design basis for a
NPP should therefore be informed by risk and ideally encompass those conditions and
FNC 62366-49823R Issue No. 1
© FNC 2020 Page 18 of 86 NOT PROTECTIVELY MARKED
NOT PROTECTIVELY MARKED
requirements (including fault and hazard resilience) which present the majority of the risk
in operating the NPP. For discrete faults and hazards, it is suggested that experience
with PSA models of NPPs to date shows that setting a design basis frequency criterion
for initiating events at 10-5 per year results in most of the risk being associated with
events within the design basis. Fault analysis within the design basis would be expected
to adopt conservative methodologies with the result that there would be high confidence
that risk is not over-estimated. For natural hazards (which may result in multiple faults on
a NPP) it would seem logical to set the design basis criterion at the same level as for
discrete events (i.e. 10-5 per year) or even lower.
However, as has been discussed, determination of the severities of natural hazards
associated with a frequency of 10-5 per year on the basis of extreme value analysis
generally yields results with high levels of uncertainty due to the limited datasets on which
to base the analysis. Incorporation of such uncertainties to achieve the confidence levels
generally used in design basis analysis produces hazard severities which are likely too
onerous to accommodate in a NPP design. Possible approaches to setting design basis
criteria include, but are not limited to the following, noting that combinations of the items
below could be considered:
Adopting a natural hazard design basis criterion greater than 10-5 per year to
reduce the uncertainty in extreme value hazard severity and provide
evidence to demonstrate there are no cliff edges beyond the design basis
(i.e. the status quo in the UK);
Adopting a design basis criterion of 10-5 per year on a best estimate basis,
although this could still yield hazard severities that may still not be realistic -
(beyond design basis considerations would still apply);
Adopt a design basis criterion of 10-5 per year but apply physical modelling
of the hazard so that the extreme estimates are not wholly driven by sparse
data - (beyond design basis considerations would still apply but could be
relatively simple should physical hazard limits exist);
Investigate the feasibility of applying probabilistic safety analysis and, if
appropriate, carry out such analysis to characterise the risk profile of various
hazards across the frequency spectrum. The distribution of risk might inform
potential changes to the design basis criterion. This is the focus of Task 2 in
this document.
Adopting different design basis criteria for different hazards
Consideration of specific design basis criteria for hazard combinations
Adopting hazard-specific design basis criteria based on existing national
codes or standards at frequencies well below 10-5 per year supplemented by
hazard-specific additional loadings. (This approach is adopted for some
hazards in Germany.)
FNC 62366-49823R Issue No. 1
© FNC 2020 Page 19 of 86 NOT PROTECTIVELY MARKED
NOT PROTECTIVELY MARKED
4. TASK 2 – SUMMARY OF QUANTITATIVE RISK ASSESSMENT
4.1 INTRODUCTION
The objective of Task 2 is to conduct a quantitative investigation into the relative risk
contributions from beyond design basis and from very low frequency parts of hazard curves for
a selection of naturally occurring external hazards. The aim is to provide information on the
level of conservatism that might be appropriate to apply within the design basis.
Appendix 2 describes the PSA modelling work that was performed for the three selected
hazards, these being seismic events, external floods and lightning strikes. The PSA models
were developed assuming a nuclear power plant with a Pressurised Water Reactor (PWR)
design. The three PSA models differ considerably in their detailed development, but at a high
level have several generic features in common.
Each PSA model uses a hazard curve, which relates the magnitude of the hazard to the
frequency of the hazard. In each case, this relationship is presented as a set of exceedance
frequencies and corresponding hazard magnitudes, i.e., any point of the hazard curve gives the
frequency of occurrence of that level of hazard or a hazard with greater magnitude. The hazard
curves are described in Appendix 2.
All the models use the concept of a damage state, which is a set of impacts of the hazard on the
nuclear power plant. For example, a seismic event may lead to a loss of off-site power together
with damage to safety injection pumps, or it may lead to a loss of off-site power and damage to
the condensate storage tank (implying a loss of secondary cooling capability), or it may lead to
a loss of off-site power only, and so on. In the case of a seismic event, there are multiple
possible damage states for any level of hazard. On the other hand, the flood model and the
lightning model involve one damage state for any particular flood or any particular lightning
strike. As a result, the quantification of the seismic PSA model is more complex than the
quantification of the lightning or external flooding PSA models. More detail is provided in
Appendix 2.
The three PSA models all involve the use of Conditional Core Damage Probabilities (CCDPs).
Once the damage state occurring for any particular hazard has been established, the
corresponding impacts on the plant define the probability that a core damage event will
subsequently occur (i.e., the CCDP) following the hazard and damage state occurrence. In a
typical PSA assessment, the value of this probability would be calculated by a quantification of
the PSA model with a specific initiating event chosen and a specific set of equipment
unavailabilities. However, for the work described here, a full PSA model was not available,
meaning that the CCDP values had to be estimated based on a literature search coupled with
analyst judgment. The development of the CCDP values is described in more detail in Appendix
2.
The model quantification, sensitivity studies and results are described in Section 4.2 and 4.3
with a concluding discussion for Task 2 being presented in Section 4.4. Detailed features of the
models are presented in Appendix 2, which the reader should consult for any clarifications
required.
4.2 PSA MODEL QUANTIFICATION AND SENSITIVITY STUDIES
Table 2 lists the model quantifications and sensitivity studies carried out for seismic events. The
seismic PSA model consists of 203 Seismic Damage States (SDSs) whose frequencies are
evaluated by combining the frequency data contained within the seismic hazard curve with the
system, structure and component withstand capabilities modelled using probabilistic fragility
functions. More detail on this quantification process is provided in Appendix 2. Each damage
FNC 62366-49823R Issue No. 1
© FNC 2020 Page 20 of 86 NOT PROTECTIVELY MARKED
NOT PROTECTIVELY MARKED
state corresponds to a PSA initiating event combined with a set of unavailable systems,
structures and components. A CCDP value is associated with each of these damage states,
representing the likelihood of core damage occurring given the conditions caused by the
seismic event.
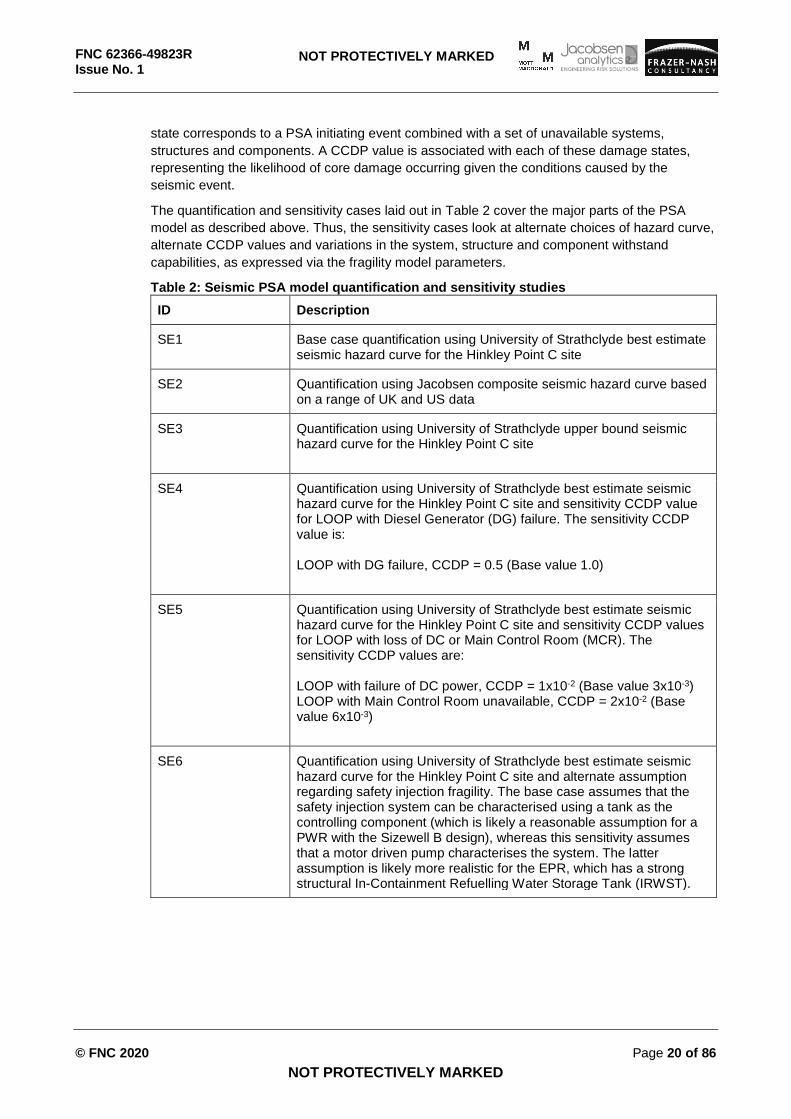
The quantification and sensitivity cases laid out in Table 2 cover the major parts of the PSA
model as described above. Thus, the sensitivity cases look at alternate choices of hazard curve,
alternate CCDP values and variations in the system, structure and component withstand
capabilities, as expressed via the fragility model parameters.
Table 2: Seismic PSA model quantification and sensitivity studies
ID Description
SE1 Base case quantification using University of Strathclyde best estimate seismic hazard curve for the Hinkley Point C site
SE2 Quantification using Jacobsen composite seismic hazard curve based on a range of UK and US data
SE3 Quantification using University of Strathclyde upper bound seismic hazard curve for the Hinkley Point C site
SE4 Quantification using University of Strathclyde best estimate seismic hazard curve for the Hinkley Point C site and sensitivity CCDP value for LOOP with Diesel Generator (DG) failure. The sensitivity CCDP value is: LOOP with DG failure, CCDP = 0.5 (Base value 1.0)
SE5 Quantification using University of Strathclyde best estimate seismic hazard curve for the Hinkley Point C site and sensitivity CCDP values for LOOP with loss of DC or Main Control Room (MCR). The sensitivity CCDP values are: LOOP with failure of DC power, CCDP = 1x10⁻² (Base value 3x10⁻³) LOOP with Main Control Room unavailable, CCDP = 2x10⁻² (Base value 6x10⁻³)
SE6 Quantification using University of Strathclyde best estimate seismic hazard curve for the Hinkley Point C site and alternate assumption regarding safety injection fragility. The base case assumes that the safety injection system can be characterised using a tank as the controlling component (which is likely a reasonable assumption for a PWR with the Sizewell B design), whereas this sensitivity assumes that a motor driven pump characterises the system. The latter assumption is likely more realistic for the EPR, which has a strong structural In-Containment Refuelling Water Storage Tank (IRWST).
FNC 62366-49823R Issue No. 1
© FNC 2020 Page 21 of 86 NOT PROTECTIVELY MARKED
NOT PROTECTIVELY MARKED
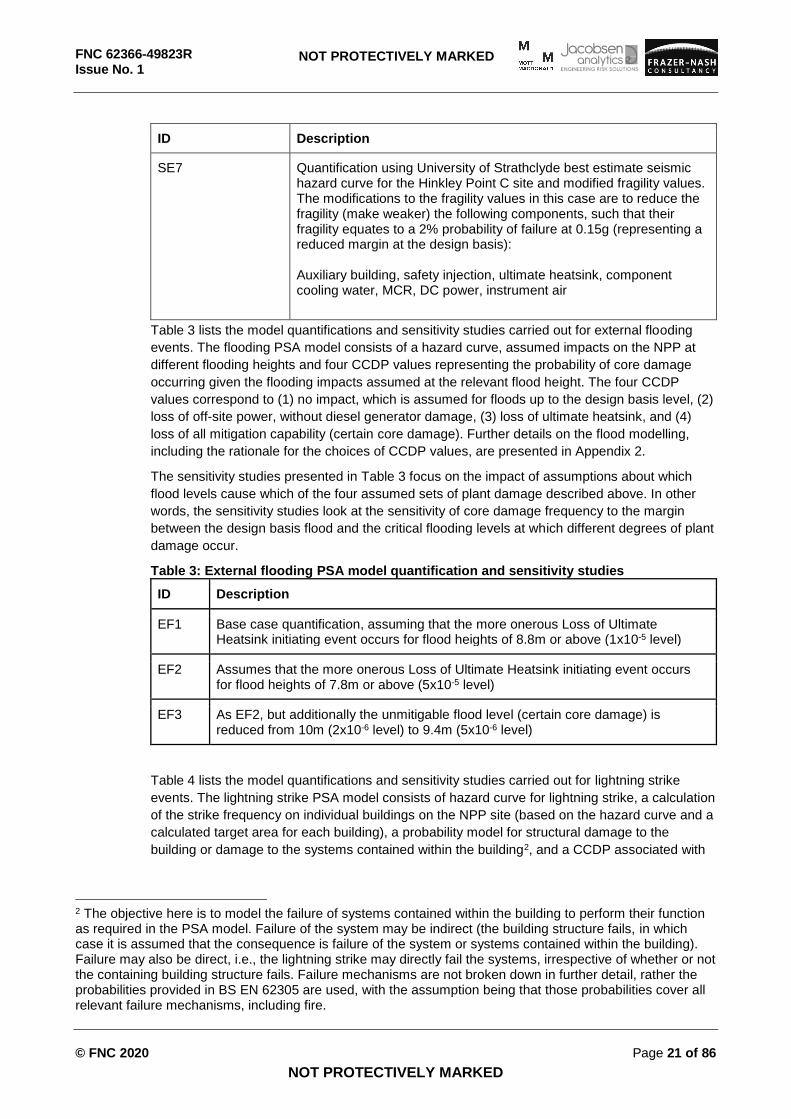
ID Description
SE7 Quantification using University of Strathclyde best estimate seismic hazard curve for the Hinkley Point C site and modified fragility values. The modifications to the fragility values in this case are to reduce the fragility (make weaker) the following components, such that their fragility equates to a 2% probability of failure at 0.15g (representing a reduced margin at the design basis): Auxiliary building, safety injection, ultimate heatsink, component cooling water, MCR, DC power, instrument air
Table 3 lists the model quantifications and sensitivity studies carried out for external flooding
events. The flooding PSA model consists of a hazard curve, assumed impacts on the NPP at
different flooding heights and four CCDP values representing the probability of core damage
occurring given the flooding impacts assumed at the relevant flood height. The four CCDP
values correspond to (1) no impact, which is assumed for floods up to the design basis level, (2)
loss of off-site power, without diesel generator damage, (3) loss of ultimate heatsink, and (4)
loss of all mitigation capability (certain core damage). Further details on the flood modelling,
including the rationale for the choices of CCDP values, are presented in Appendix 2.
The sensitivity studies presented in Table 3 focus on the impact of assumptions about which
flood levels cause which of the four assumed sets of plant damage described above. In other
words, the sensitivity studies look at the sensitivity of core damage frequency to the margin
between the design basis flood and the critical flooding levels at which different degrees of plant
damage occur.
Table 3: External flooding PSA model quantification and sensitivity studies
ID Description
EF1 Base case quantification, assuming that the more onerous Loss of Ultimate Heatsink initiating event occurs for flood heights of 8.8m or above (1x10⁻⁵ level)
EF2 Assumes that the more onerous Loss of Ultimate Heatsink initiating event occurs for flood heights of 7.8m or above (5x10⁻⁵ level)
EF3 As EF2, but additionally the unmitigable flood level (certain core damage) is reduced from 10m (2x10⁻⁶ level) to 9.4m (5x10⁻⁶ level)
Table 4 lists the model quantifications and sensitivity studies carried out for lightning strike
events. The lightning strike PSA model consists of hazard curve for lightning strike, a calculation
of the strike frequency on individual buildings on the NPP site (based on the hazard curve and a
calculated target area for each building), a probability model for structural damage to the
building or damage to the systems contained within the building2, and a CCDP associated with
2 The objective here is to model the failure of systems contained within the building to perform their function as required in the PSA model. Failure of the system may be indirect (the building structure fails, in which case it is assumed that the consequence is failure of the system or systems contained within the building). Failure may also be direct, i.e., the lightning strike may directly fail the systems, irrespective of whether or not the containing building structure fails. Failure mechanisms are not broken down in further detail, rather the probabilities provided in BS EN 62305 are used, with the assumption being that those probabilities cover all relevant failure mechanisms, including fire.
FNC 62366-49823R Issue No. 1
© FNC 2020 Page 22 of 86 NOT PROTECTIVELY MARKED
NOT PROTECTIVELY MARKED
each building given failure of the building or its contained systems. Appendix 2 provides more
details on the lightning strike PSA model.
The buildings included in the lightning strike PSA model are the fuel building, the safeguards
buildings (of which there are four), the diesel buildings (of which there are two) and the turbine
building.
The sensitivity studies listed in Table 4 include a sensitivity to a factor applied in the strike
frequency calculation that represents the effect of shadowing from nearby buildings on the strike
frequency. The other sensitivity study defined for the lightning strike model addresses the
choice of initiating event for lightning strike on each building. The base model assumes that a
loss of off-site power only occurs for a strike on the turbine building, whereas the sensitivity
case (LI2) assumes the loss for a strike on any building (in conjunction with the loss of systems
contained within the building in each case).
Table 4: Lightning strike PSA model quantification and sensitivity studies
ID Description
LI1 Base case quantification assuming loss of off-site power only occurs if the lightning strike is on the turbine building
LI2 Quantification assuming loss of off-site power always accompanies lightning strike is on any building on site
LI3 Quantification without credit for location factors (i.e., all Cd values set = 1.0)
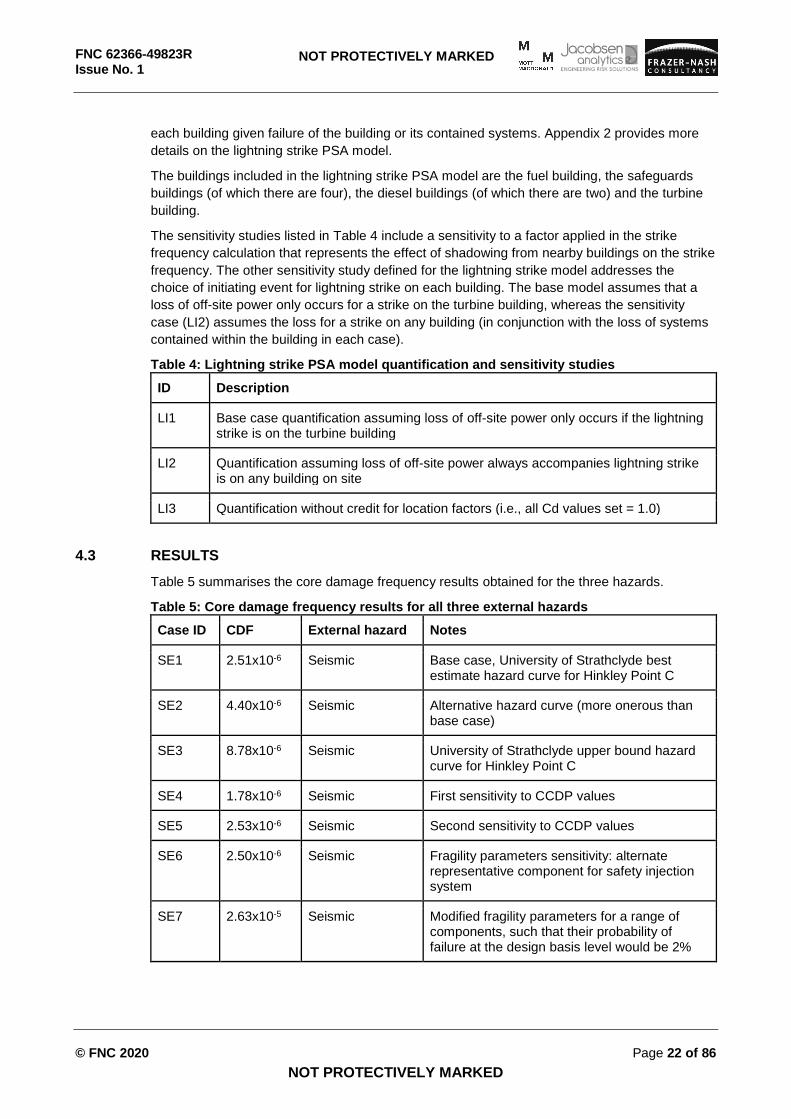
4.3 RESULTS
Table 5 summarises the core damage frequency results obtained for the three hazards.
Table 5: Core damage frequency results for all three external hazards
Case ID CDF External hazard Notes
SE1 2.51x10⁻⁶ Seismic Base case, University of Strathclyde best estimate hazard curve for Hinkley Point C
SE2 4.40x10⁻⁶ Seismic Alternative hazard curve (more onerous than base case)
SE3 8.78x10⁻⁶ Seismic University of Strathclyde upper bound hazard curve for Hinkley Point C
SE4 1.78x10⁻⁶ Seismic First sensitivity to CCDP values
SE5 2.53x10⁻⁶ Seismic Second sensitivity to CCDP values
SE6 2.50x10⁻⁶ Seismic Fragility parameters sensitivity: alternate representative component for safety injection system
SE7 2.63x10⁻⁵ Seismic Modified fragility parameters for a range of components, such that their probability of failure at the design basis level would be 2%
FNC 62366-49823R Issue No. 1
© FNC 2020 Page 23 of 86 NOT PROTECTIVELY MARKED
NOT PROTECTIVELY MARKED
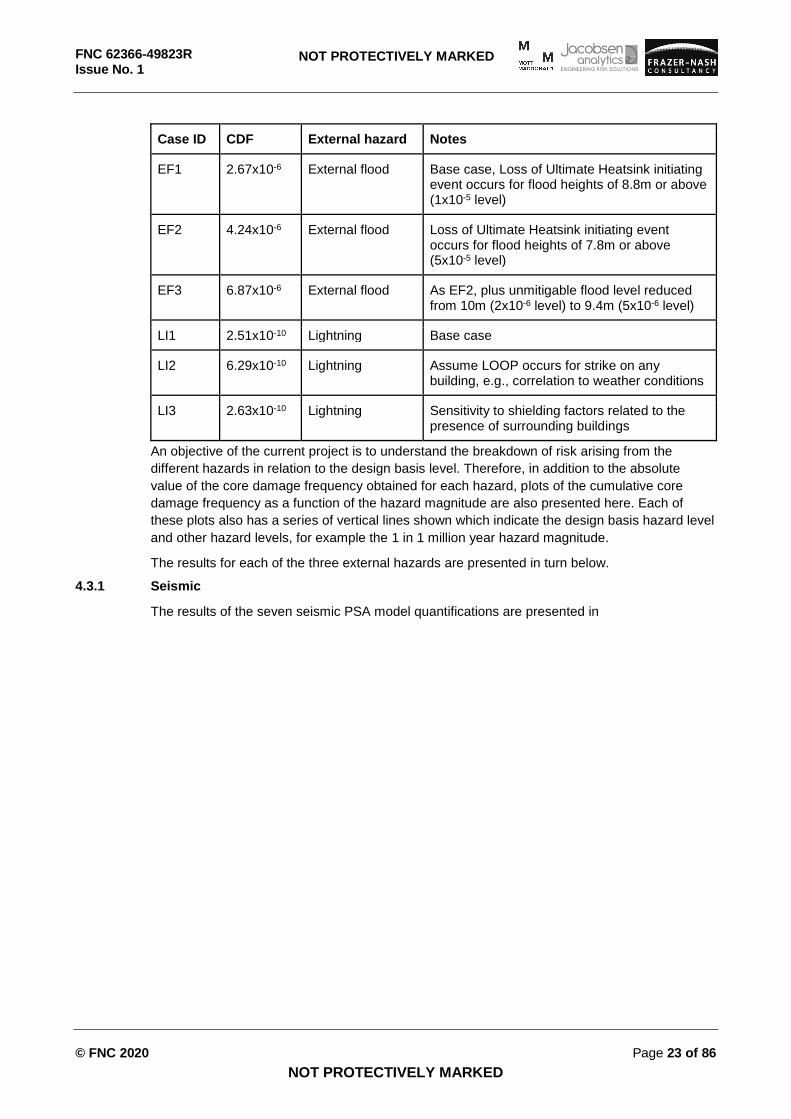
Case ID CDF External hazard Notes
EF1 2.67x10⁻⁶ External flood Base case, Loss of Ultimate Heatsink initiating event occurs for flood heights of 8.8m or above (1x10⁻⁵ level)
EF2 4.24x10⁻⁶ External flood Loss of Ultimate Heatsink initiating event occurs for flood heights of 7.8m or above (5x10⁻⁵ level)
EF3 6.87x10⁻⁶ External flood As EF2, plus unmitigable flood level reduced from 10m (2x10⁻⁶ level) to 9.4m (5x10⁻⁶ level)
LI1 2.51x10⁻¹⁰ Lightning Base case
LI2 6.29x10⁻¹⁰ Lightning Assume LOOP occurs for strike on any building, e.g., correlation to weather conditions
LI3 2.63x10⁻¹⁰ Lightning Sensitivity to shielding factors related to the presence of surrounding buildings
An objective of the current project is to understand the breakdown of risk arising from the
different hazards in relation to the design basis level. Therefore, in addition to the absolute
value of the core damage frequency obtained for each hazard, plots of the cumulative core
damage frequency as a function of the hazard magnitude are also presented here. Each of
these plots also has a series of vertical lines shown which indicate the design basis hazard level
and other hazard levels, for example the 1 in 1 million year hazard magnitude.
The results for each of the three external hazards are presented in turn below.
4.3.1 Seismic
The results of the seven seismic PSA model quantifications are presented in
FNC 62366-49823R Issue No. 1
© FNC 2020 Page 24 of 86 NOT PROTECTIVELY MARKED
NOT PROTECTIVELY MARKED
Table 6, Table 7, Figure 1, Figure 2, and Figure 3.
FNC 62366-49823R Issue No. 1
© FNC 2020 Page 25 of 86 NOT PROTECTIVELY MARKED
NOT PROTECTIVELY MARKED
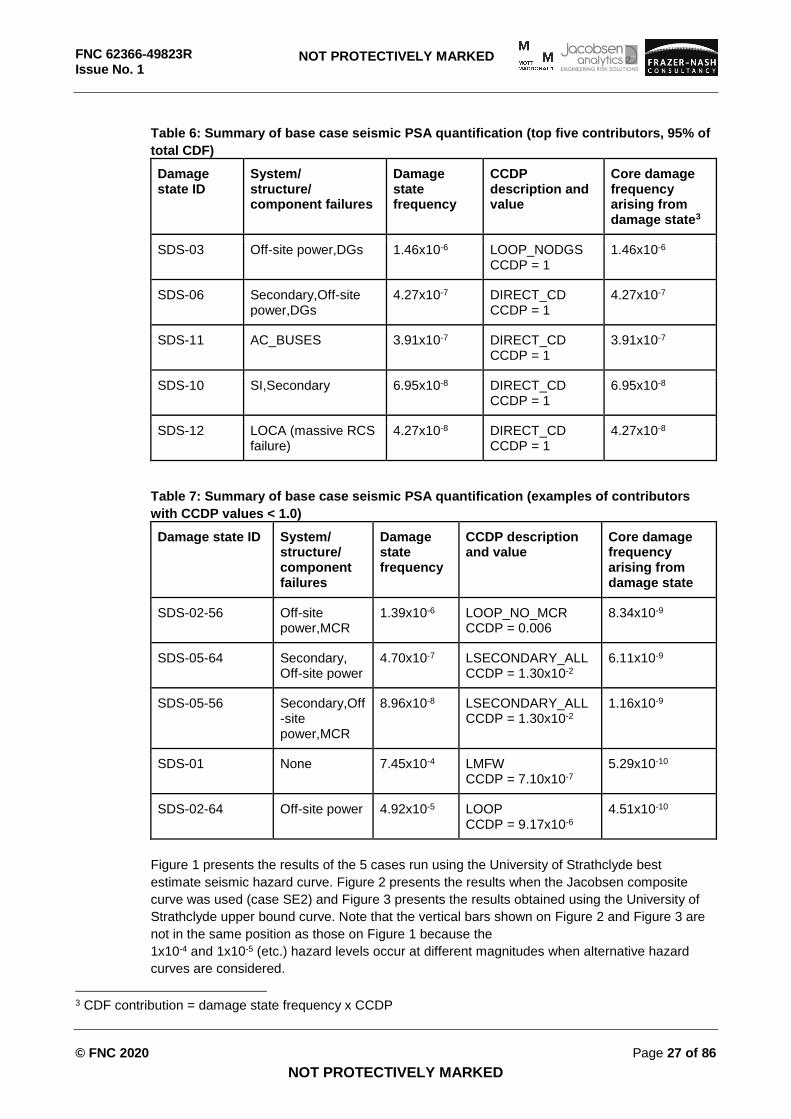
Table 6 presents a summary of the quantification of the top contributing damage states from the
base case quantification SE1. This table is presented in order to provide further clarity on the
quantification methodology used for seismic.
Table 7 is similar to
FNC 62366-49823R Issue No. 1
© FNC 2020 Page 26 of 86 NOT PROTECTIVELY MARKED
NOT PROTECTIVELY MARKED
Table 6 but presents the top five contributors from the remainder of the damage states which
have CCDP values that are less than 1.0.
Table 7 shows the importance of the work carried out to develop CCDP values for damage
states that do not lead directly to core damage; the reader will note that the contribution of these
refined damage states would have been much higher, unrealistically so, if these CCDPs
(documented in more detail in Appendix 2) had not been developed.
FNC 62366-49823R Issue No. 1
© FNC 2020 Page 27 of 86 NOT PROTECTIVELY MARKED
NOT PROTECTIVELY MARKED
Table 6: Summary of base case seismic PSA quantification (top five contributors, 95% of
total CDF)
Damage state ID
System/ structure/ component failures
Damage state frequency
CCDP description and value
Core damage frequency arising from damage state3
SDS-03 Off-site power,DGs 1.46x10⁻⁶ LOOP_NODGS CCDP = 1
1.46x10⁻⁶
SDS-06 Secondary,Off-site power,DGs
4.27x10⁻⁷ DIRECT_CD CCDP = 1
4.27x10⁻⁷
SDS-11 AC_BUSES 3.91x10⁻⁷ DIRECT_CD CCDP = 1
3.91x10⁻⁷
SDS-10 SI,Secondary 6.95x10⁻⁸ DIRECT_CD CCDP = 1
6.95x10⁻⁸
SDS-12 LOCA (massive RCS failure)
4.27x10⁻⁸ DIRECT_CD CCDP = 1
4.27x10⁻⁸
Table 7: Summary of base case seismic PSA quantification (examples of contributors
with CCDP values < 1.0)
Damage state ID System/ structure/ component failures
Damage state frequency
CCDP description and value
Core damage frequency arising from damage state
SDS-02-56 Off-site power,MCR
1.39x10⁻⁶ LOOP_NO_MCR CCDP = 0.006
8.34x10⁻⁹
SDS-05-64 Secondary, Off-site power
4.70x10⁻⁷ LSECONDARY_ALL CCDP = 1.30x10⁻²
6.11x10⁻⁹
SDS-05-56 Secondary,Off-site power,MCR
8.96x10⁻⁸ LSECONDARY_ALL CCDP = 1.30x10⁻²
1.16x10⁻⁹
SDS-01 None 7.45x10⁻⁴ LMFW CCDP = 7.10x10⁻⁷
5.29x10⁻¹⁰
SDS-02-64 Off-site power 4.92x10⁻⁵ LOOP CCDP = 9.17x10⁻⁶
4.51x10⁻¹⁰
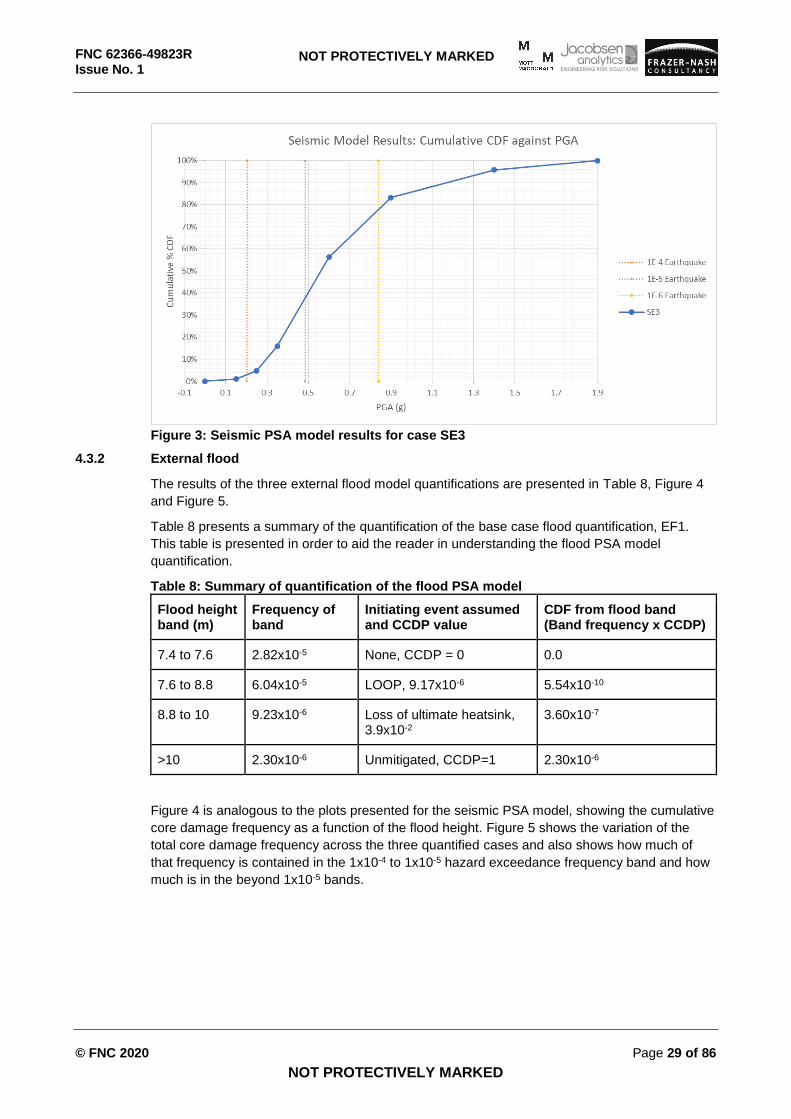
Figure 1 presents the results of the 5 cases run using the University of Strathclyde best
estimate seismic hazard curve. Figure 2 presents the results when the Jacobsen composite
curve was used (case SE2) and Figure 3 presents the results obtained using the University of
Strathclyde upper bound curve. Note that the vertical bars shown on Figure 2 and Figure 3 are
not in the same position as those on Figure 1 because the
1x10⁻⁴ and 1x10⁻⁵ (etc.) hazard levels occur at different magnitudes when alternative hazard
curves are considered.
3 CDF contribution = damage state frequency x CCDP
FNC 62366-49823R Issue No. 1
© FNC 2020 Page 28 of 86 NOT PROTECTIVELY MARKED
NOT PROTECTIVELY MARKED
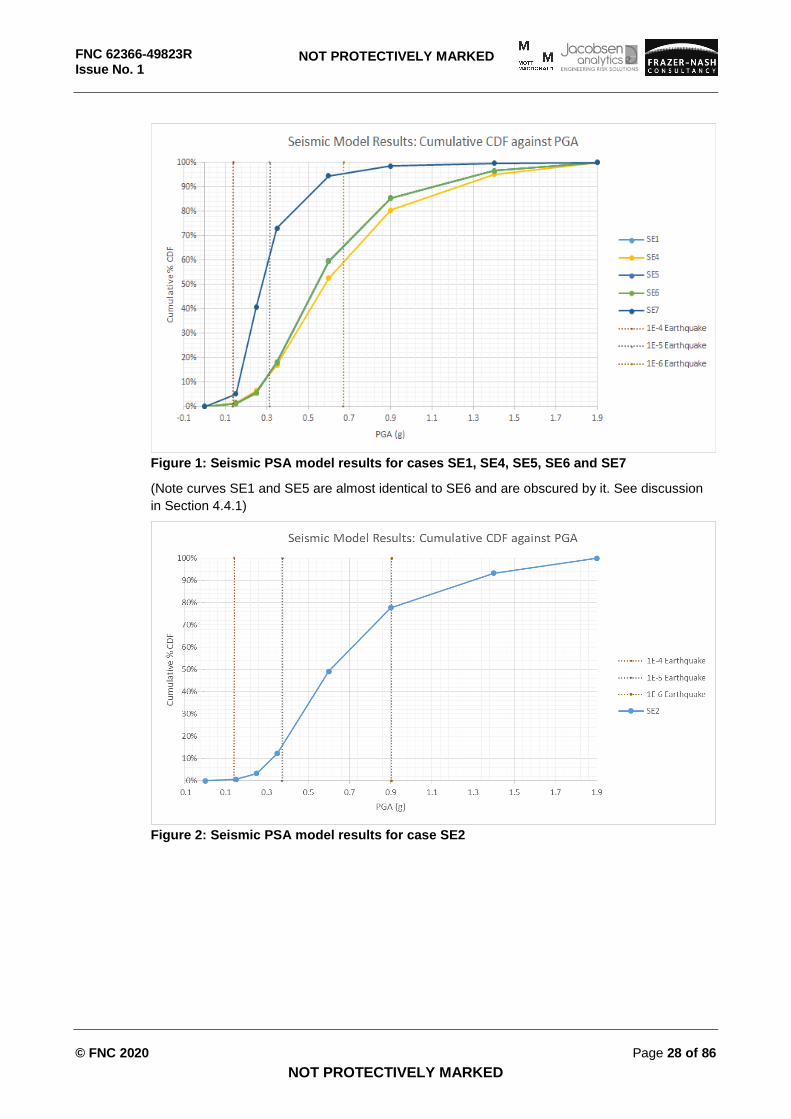
Figure 1: Seismic PSA model results for cases SE1, SE4, SE5, SE6 and SE7
(Note curves SE1 and SE5 are almost identical to SE6 and are obscured by it. See discussion
in Section 4.4.1)
Figure 2: Seismic PSA model results for case SE2
FNC 62366-49823R Issue No. 1
© FNC 2020 Page 29 of 86 NOT PROTECTIVELY MARKED
NOT PROTECTIVELY MARKED
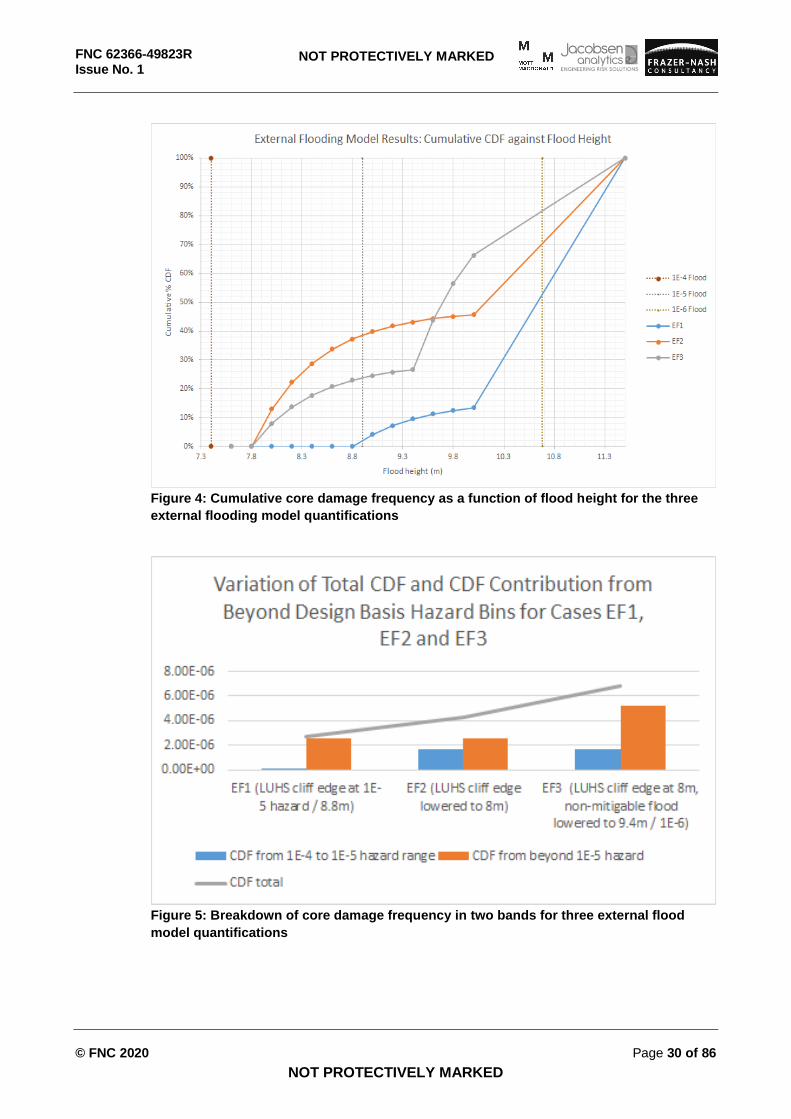
Figure 3: Seismic PSA model results for case SE3
4.3.2 External flood
The results of the three external flood model quantifications are presented in Table 8, Figure 4
and Figure 5.
Table 8 presents a summary of the quantification of the base case flood quantification, EF1.
This table is presented in order to aid the reader in understanding the flood PSA model
quantification.
Table 8: Summary of quantification of the flood PSA model
Flood height band (m)
Frequency of band
Initiating event assumed and CCDP value
CDF from flood band (Band frequency x CCDP)
7.4 to 7.6 2.82x10⁻⁵ None, CCDP = 0 0.0
7.6 to 8.8 6.04x10⁻⁵ LOOP, 9.17x10⁻⁶ 5.54x10⁻¹⁰
8.8 to 10 9.23x10⁻⁶ Loss of ultimate heatsink, 3.9x10⁻²
3.60x10⁻⁷
>10 2.30x10⁻⁶ Unmitigated, CCDP=1 2.30x10⁻⁶
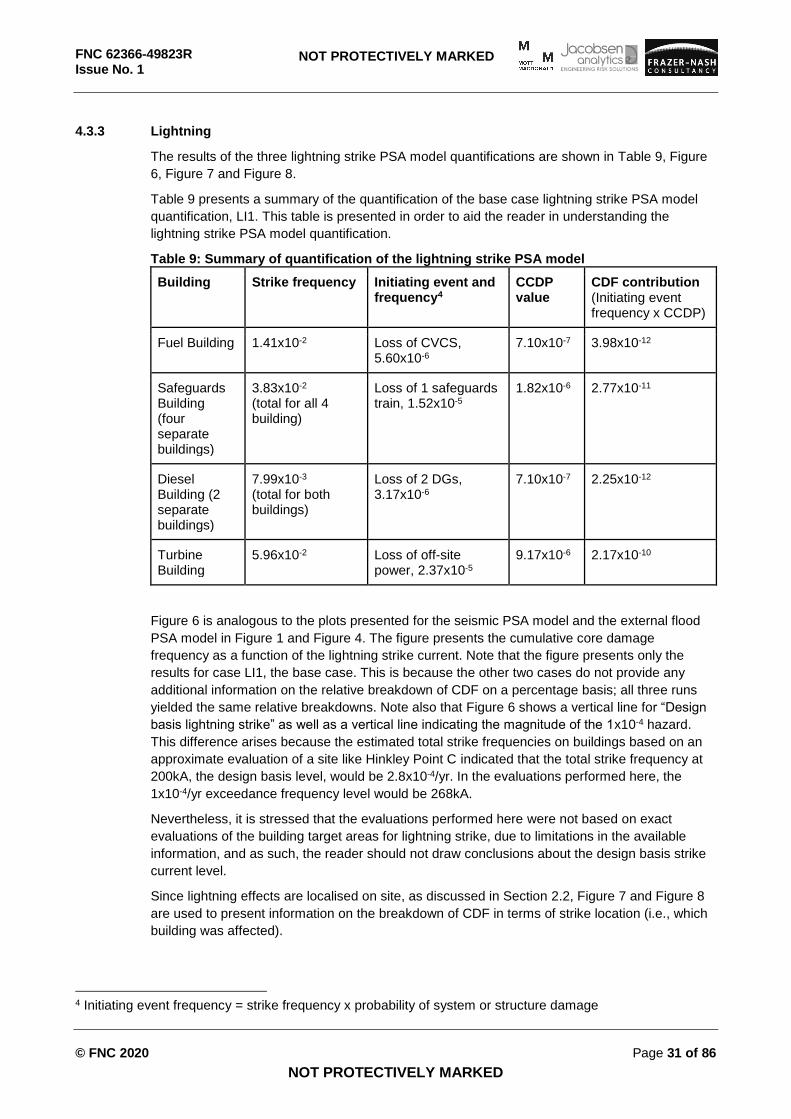
Figure 4 is analogous to the plots presented for the seismic PSA model, showing the cumulative
core damage frequency as a function of the flood height. Figure 5 shows the variation of the
total core damage frequency across the three quantified cases and also shows how much of
that frequency is contained in the 1x10⁻⁴ to 1x10⁻⁵ hazard exceedance frequency band and how
much is in the beyond 1x10⁻⁵ bands.
FNC 62366-49823R Issue No. 1
© FNC 2020 Page 30 of 86 NOT PROTECTIVELY MARKED
NOT PROTECTIVELY MARKED
Figure 4: Cumulative core damage frequency as a function of flood height for the three
external flooding model quantifications
Figure 5: Breakdown of core damage frequency in two bands for three external flood
model quantifications
FNC 62366-49823R Issue No. 1
© FNC 2020 Page 31 of 86 NOT PROTECTIVELY MARKED
NOT PROTECTIVELY MARKED
4.3.3 Lightning
The results of the three lightning strike PSA model quantifications are shown in Table 9, Figure
6, Figure 7 and Figure 8.
Table 9 presents a summary of the quantification of the base case lightning strike PSA model
quantification, LI1. This table is presented in order to aid the reader in understanding the
lightning strike PSA model quantification.
Table 9: Summary of quantification of the lightning strike PSA model
Building Strike frequency Initiating event and frequency4
CCDP value
CDF contribution (Initiating event frequency x CCDP)
Fuel Building 1.41x10⁻² Loss of CVCS, 5.60x10⁻⁶
7.10x10⁻⁷ 3.98x10⁻¹²
Safeguards Building (four separate buildings)
3.83x10⁻² (total for all 4 building)
Loss of 1 safeguards train, 1.52x10⁻⁵
1.82x10⁻⁶ 2.77x10⁻¹¹
Diesel Building (2 separate buildings)
7.99x10⁻³
(total for both buildings)
Loss of 2 DGs, 3.17x10⁻⁶
7.10x10⁻⁷ 2.25x10⁻¹²
Turbine Building
5.96x10⁻² Loss of off-site power, 2.37x10⁻⁵
9.17x10⁻⁶ 2.17x10⁻¹⁰
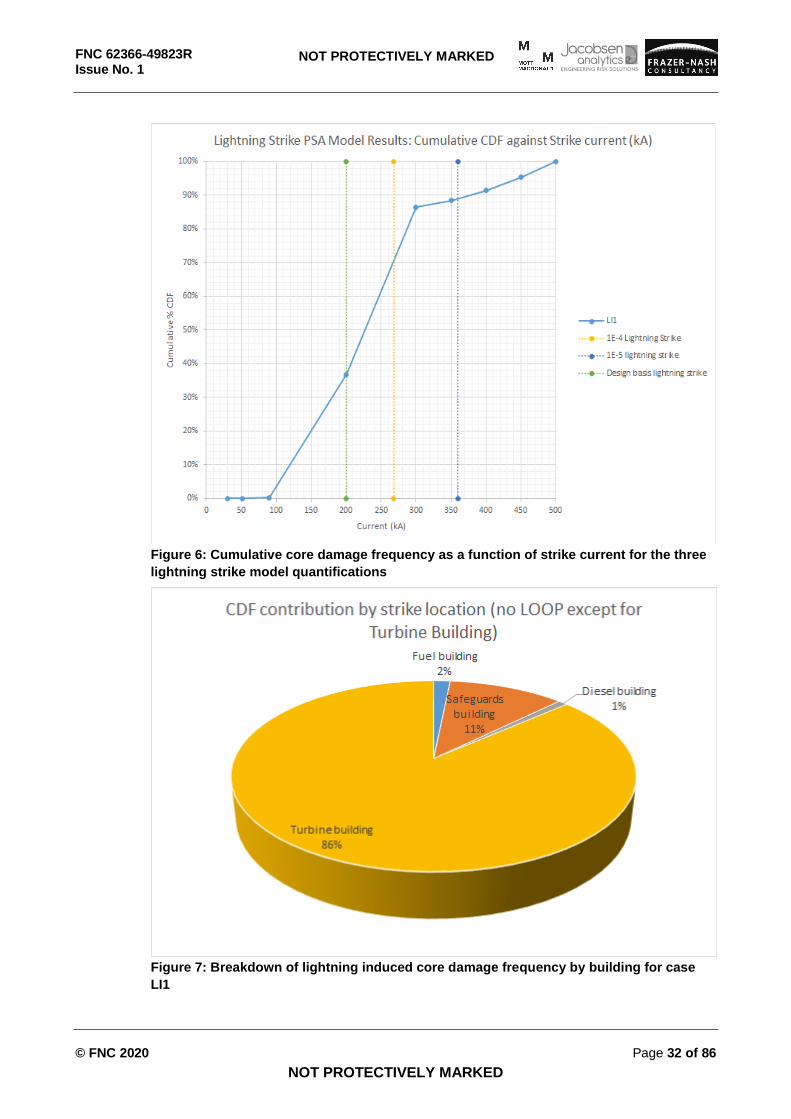
Figure 6 is analogous to the plots presented for the seismic PSA model and the external flood
PSA model in Figure 1 and Figure 4. The figure presents the cumulative core damage
frequency as a function of the lightning strike current. Note that the figure presents only the
results for case LI1, the base case. This is because the other two cases do not provide any
additional information on the relative breakdown of CDF on a percentage basis; all three runs
yielded the same relative breakdowns. Note also that Figure 6 shows a vertical line for “Design
basis lightning strike” as well as a vertical line indicating the magnitude of the 1x10⁻⁴ hazard.
This difference arises because the estimated total strike frequencies on buildings based on an
approximate evaluation of a site like Hinkley Point C indicated that the total strike frequency at
200kA, the design basis level, would be 2.8x10⁻⁴/yr. In the evaluations performed here, the
1x10⁻⁴/yr exceedance frequency level would be 268kA.
Nevertheless, it is stressed that the evaluations performed here were not based on exact
evaluations of the building target areas for lightning strike, due to limitations in the available
information, and as such, the reader should not draw conclusions about the design basis strike
current level.
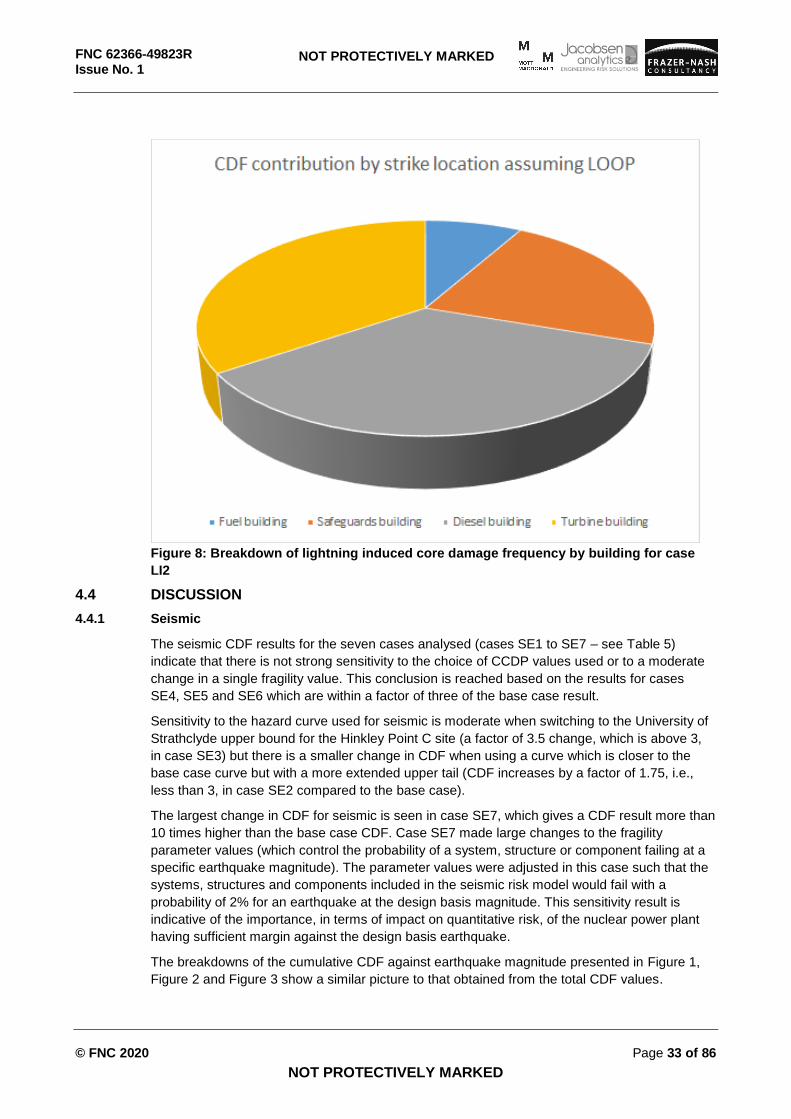
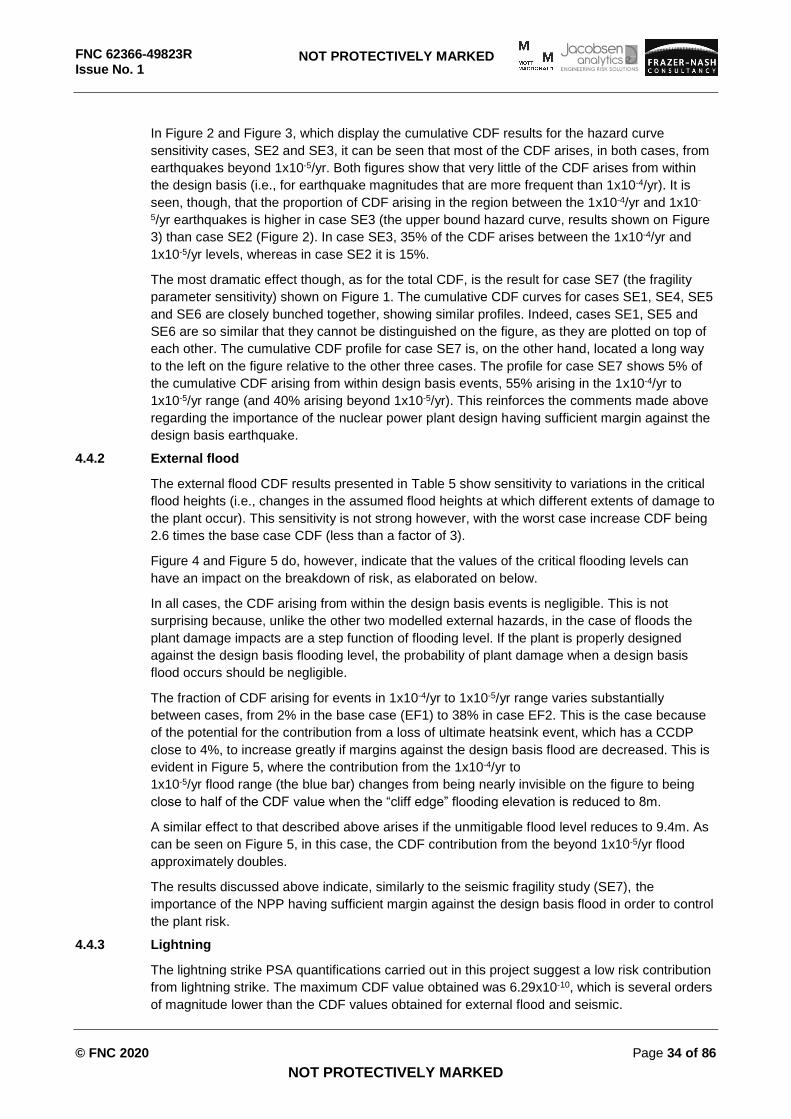
Since lightning effects are localised on site, as discussed in Section 2.2, Figure 7 and Figure 8
are used to present information on the breakdown of CDF in terms of strike location (i.e., which
building was affected).
4 Initiating event frequency = strike frequency x probability of system or structure damage
FNC 62366-49823R Issue No. 1
© FNC 2020 Page 32 of 86 NOT PROTECTIVELY MARKED
NOT PROTECTIVELY MARKED
Figure 6: Cumulative core damage frequency as a function of strike current for the three
lightning strike model quantifications
Figure 7: Breakdown of lightning induced core damage frequency by building for case
LI1
FNC 62366-49823R Issue No. 1
© FNC 2020 Page 33 of 86 NOT PROTECTIVELY MARKED
NOT PROTECTIVELY MARKED
Figure 8: Breakdown of lightning induced core damage frequency by building for case
LI2
4.4 DISCUSSION
4.4.1 Seismic
The seismic CDF results for the seven cases analysed (cases SE1 to SE7 – see Table 5)
indicate that there is not strong sensitivity to the choice of CCDP values used or to a moderate
change in a single fragility value. This conclusion is reached based on the results for cases
SE4, SE5 and SE6 which are within a factor of three of the base case result.
Sensitivity to the hazard curve used for seismic is moderate when switching to the University of
Strathclyde upper bound for the Hinkley Point C site (a factor of 3.5 change, which is above 3,
in case SE3) but there is a smaller change in CDF when using a curve which is closer to the
base case curve but with a more extended upper tail (CDF increases by a factor of 1.75, i.e.,
less than 3, in case SE2 compared to the base case).
The largest change in CDF for seismic is seen in case SE7, which gives a CDF result more than
10 times higher than the base case CDF. Case SE7 made large changes to the fragility
parameter values (which control the probability of a system, structure or component failing at a
specific earthquake magnitude). The parameter values were adjusted in this case such that the
systems, structures and components included in the seismic risk model would fail with a
probability of 2% for an earthquake at the design basis magnitude. This sensitivity result is
indicative of the importance, in terms of impact on quantitative risk, of the nuclear power plant
having sufficient margin against the design basis earthquake.
The breakdowns of the cumulative CDF against earthquake magnitude presented in Figure 1,
Figure 2 and Figure 3 show a similar picture to that obtained from the total CDF values.
FNC 62366-49823R Issue No. 1
© FNC 2020 Page 34 of 86 NOT PROTECTIVELY MARKED
NOT PROTECTIVELY MARKED
In Figure 2 and Figure 3, which display the cumulative CDF results for the hazard curve
sensitivity cases, SE2 and SE3, it can be seen that most of the CDF arises, in both cases, from
earthquakes beyond 1x10⁻⁵/yr. Both figures show that very little of the CDF arises from within
the design basis (i.e., for earthquake magnitudes that are more frequent than 1x10⁻⁴/yr). It is
seen, though, that the proportion of CDF arising in the region between the 1x10⁻⁴/yr and 1x10-
5/yr earthquakes is higher in case SE3 (the upper bound hazard curve, results shown on Figure
3) than case SE2 (Figure 2). In case SE3, 35% of the CDF arises between the 1x10⁻⁴/yr and
1x10⁻⁵/yr levels, whereas in case SE2 it is 15%.
The most dramatic effect though, as for the total CDF, is the result for case SE7 (the fragility
parameter sensitivity) shown on Figure 1. The cumulative CDF curves for cases SE1, SE4, SE5
and SE6 are closely bunched together, showing similar profiles. Indeed, cases SE1, SE5 and
SE6 are so similar that they cannot be distinguished on the figure, as they are plotted on top of
each other. The cumulative CDF profile for case SE7 is, on the other hand, located a long way
to the left on the figure relative to the other three cases. The profile for case SE7 shows 5% of
the cumulative CDF arising from within design basis events, 55% arising in the 1x10⁻⁴/yr to
1x10⁻⁵/yr range (and 40% arising beyond 1x10⁻⁵/yr). This reinforces the comments made above
regarding the importance of the nuclear power plant design having sufficient margin against the
design basis earthquake.
4.4.2 External flood
The external flood CDF results presented in Table 5 show sensitivity to variations in the critical
flood heights (i.e., changes in the assumed flood heights at which different extents of damage to
the plant occur). This sensitivity is not strong however, with the worst case increase CDF being
2.6 times the base case CDF (less than a factor of 3).
Figure 4 and Figure 5 do, however, indicate that the values of the critical flooding levels can
have an impact on the breakdown of risk, as elaborated on below.
In all cases, the CDF arising from within the design basis events is negligible. This is not
surprising because, unlike the other two modelled external hazards, in the case of floods the
plant damage impacts are a step function of flooding level. If the plant is properly designed
against the design basis flooding level, the probability of plant damage when a design basis
flood occurs should be negligible.
The fraction of CDF arising for events in 1x10⁻⁴/yr to 1x10⁻⁵/yr range varies substantially
between cases, from 2% in the base case (EF1) to 38% in case EF2. This is the case because
of the potential for the contribution from a loss of ultimate heatsink event, which has a CCDP
close to 4%, to increase greatly if margins against the design basis flood are decreased. This is
evident in Figure 5, where the contribution from the 1x10⁻⁴/yr to
1x10⁻⁵/yr flood range (the blue bar) changes from being nearly invisible on the figure to being
close to half of the CDF value when the “cliff edge” flooding elevation is reduced to 8m.
A similar effect to that described above arises if the unmitigable flood level reduces to 9.4m. As
can be seen on Figure 5, in this case, the CDF contribution from the beyond 1x10⁻⁵/yr flood
approximately doubles.
The results discussed above indicate, similarly to the seismic fragility study (SE7), the
importance of the NPP having sufficient margin against the design basis flood in order to control
the plant risk.
4.4.3 Lightning
The lightning strike PSA quantifications carried out in this project suggest a low risk contribution
from lightning strike. The maximum CDF value obtained was 6.29x10⁻¹⁰, which is several orders
of magnitude lower than the CDF values obtained for external flood and seismic.
FNC 62366-49823R Issue No. 1
© FNC 2020 Page 35 of 86 NOT PROTECTIVELY MARKED
NOT PROTECTIVELY MARKED
As mentioned in Section 2.2, a characteristic of lightning strike that is different to the other
hazards analysed here is that it has localised impacts rather than whole site impacts, though
there may be correlated events such as loss of off-site power due to weather conditions5. The
quantifications carried out indicate that the largest risk contribution in location terms is from the
turbine building, this being due to the larger collection area arising from the building’s larger
footprint and the presence of connected electric power lines. In the event that weather
conditions lead to a loss of off-site power, a lightning strike affecting a diesel generator building
is also a large relative contributor to CDF.
The breakdown of cumulative CDF as a function of strike magnitude (Figure 6) shows that a
large part of the small CDF risk arises from within design basis events (26%). This is different to
the other external hazards investigated. It is believed that this result is due to the shape of the
lightning hazard curve. The design basis current is 200kA. The range of the hazard curve below
90kA has a negligible probability of structural or system damage and contributes an unimportant
amount to risk. Strikes above 300kA are more important due to a high probability of damage,
despite their lower frequency. However, the most important parts of the curve are the 90kA to
200kA range (below design basis) and the 200kA to 300kA range (above design basis). The
frequency in the 90kA to 200kA range is about 20 times larger than that in the 200kA to 300kA
range, which makes the former significant despite the 30 times lower probability of damage
occurring from a strike in the lower range.
Furthermore, it is noted that (as indicated in Section 4.3) that the calculations performed for this
current report suggest that the 1x10⁻⁴/yr strike magnitude for lightning would be 268kA, rather
than the 200kA used in the EPR Pre-Construction Safety Report (PCSR) (referred to in
Appendix 2); 70% of the small calculated risk from lightning strike comes from strikes below
268kA.
12% of the core damage risk from lightning strike arises from beyond 1x10⁻⁵/yr events.
4.4.4 Observations on the use of 1x10⁻⁴/yr frequency as the design basis level for external hazards
Based on the results generated for external flooding and seismic, the work reported here
indicates that a well-designed plant using a design basis external hazard at the 1x10⁻⁴/yr level
and adequate margins is likely to see the bulk of the risk arising from events well beyond the
design basis, in frequency terms. However, it is also seen that if margins are reduced, then core
damage risk can jump significantly and significant fractions of the risk may arise from closer to
the design basis events.
Based on the above discussion, the 1x10⁻⁴/yr can be seen as a reasonable choice provided
expectations related to close to the design basis events, cliff edges and adequacy of margins
are given similar weight.
A different breakdown of the overall risk relative to the design basis level was seen for lightning
strikes; however, it is believed that less emphasis should be placed on the lightning PSA results
on the basis that the lightning strike risk was estimated to be much lower than for the other two
external hazards.
5 A further limitation is that the model does not consider correlations in strike at multiple locations on site during a single storm. The analysis of such multiple strikes is complicated mainly by the need to make assumptions about given a specific storm and a second strike occurring after the initial strike, to what extent are the strike magnitudes correlated and to what extent are the building and system responses to strike correlated. To the best knowledge of the authors of this report, this is not a well developed area. It is believed that multiple strike scenarios would not be large contributors to risk if magnitudes and building and system responses are independent, but could become more significant if there are strong correlations. This may be an area that could usefully be investigated further.
FNC 62366-49823R Issue No. 1
© FNC 2020 Page 36 of 86 NOT PROTECTIVELY MARKED
NOT PROTECTIVELY MARKED
4.4.5 Limitations and Scope for Further Development
Some limitations of the study performed are also noted, as follows:
All of the models created for this report are simplified PSA models and all rely on a set of
conditional core damage probabilities that were based on a variety of references (as
discussed in Appendix 2) and which involved some judgements.
The seismic hazard curves use peak ground acceleration to characterise the seismic
hazard. Spectral acceleration and UHS curves are not used.
A reasonable effort was made to use seismic hazard curves representative of the UK but
a curve for the Wylfa site (see Appendix 2) was also identified late on in the project but
could not be used. However, the sensitivity studies performed and reported in here and in
Section 4.3 suggest that the sensitivity to the seismic hazard curve is not strong and a
reasonable variation in the curve would not alter the conclusions obtained in the case of
seismic.
In a full seismic PSA, plant specific human reliability analysis would be performed, and
greater attention would be paid to identifying the variation in human reliability values with
earthquake magnitude and a careful evaluation of accessibility issues caused by seismic
damage would be carried out. Whether human factor analysis would significantly impact
on the findings presented here is an area for possible further investigation.
Correlation between the fragilities of systems/structures/components has not been
studied. 100% correlation was assumed within a system but zero correlation between
systems.
In a full seismic PSA, systems would be represented by multiple key components rather
than a single controlling component. The potential impact of these issues on the results
obtained has not been studied for this current project.
The external flooding model is strongly based on assumptions. The main way the model
was used in this current project was as a tool to study the impact of assumptions and
design approaches (extent of margins); as such, it is believed that the flooding model is
nevertheless adequate for the intended objectives of the current project.
The lightning strike model does not consider propagation between buildings or
consequential effects arising from damage to one building impacting another. Rather, it is
assumed that the individual buildings are well isolated from each other to a high standard.
The potential impact of this assumption has not been quantified and the assumption itself
has not been verified. It is judged that the assumption is reasonable, but this is potential
area for further study.
The lightning strike model does not consider multiple strikes during a single storm. The
key area of uncertainty in this respect is the extent to which the magnitudes of multiple
strikes during a single storm might be correlated, as well as the extent of correlation that
should be modelled between responses of buildings and systems to strike. It is believed
that if levels of correlation are low that multiple strikes would not be large risk contributors
but this could change at high levels of correlations. This is a potential area for further
study.
Spalling, the generation of missiles due to lightning strikes, is not modelled. The rationale
for this simplification is that if a lightning strike occurs, the impacts of this on the building
itself are captured in the probabilities of structural damage and of damage to equipment
housed within the building. In other words, it is assumed that the probabilities applied
FNC 62366-49823R Issue No. 1
© FNC 2020 Page 37 of 86 NOT PROTECTIVELY MARKED
NOT PROTECTIVELY MARKED
include or bound this effect on the building itself. Effects on other buildings are not
included due to the limitation identified in the previous bullet point.
Although fragility data is expected to be independent of reactor technology, the PSA
studies carried out here are implicitly based on light water reactors. Further work would
be required to gauge whether the results presented here would be applicable to other
reactor technologies e.g. Gen IV, Advanced Modular Reactors (AMRs).
FNC 62366-49823R Issue No. 1
© FNC 2020 Page 38 of 86 NOT PROTECTIVELY MARKED
NOT PROTECTIVELY MARKED
5. REFERENCES
1. Safety Assessment Principles for Nuclear Facilities, 2014 Edition, ONR, Revision 1 January 2020.
2. NS-TAST-GD-013 Rev 7 – ONR Guide, External Hazards, October 2018.
3. NEA/CSNI/R(2018)7 – Examination of Approaches for Screening External Hazards for Nuclear Power Plants, April 2019.
FNC 62366-49823R Issue No. 1
© FNC 2020 Page 39 of 86 NOT PROTECTIVELY MARKED
NOT PROTECTIVELY MARKED
A.1 APPENDIX 1 – TASK 1
A.1.1 METHODOLOGY
A full review of NEA/CSNI/R(2018)7 ‘Examination of Approaches for Screening External
Hazards for Nuclear Power Plants’ [Ref.A1.1] was conducted to allow benchmarking of where
the current UK 10-4 per year design basis criterion for naturally occurring external hazards lies in
relation to design criteria adopted by other regulators in other countries.
Upon review of the NEA report, many of the documents that had been subject to review within it
were discounted from further consideration within this report. The reasoning behind this was
that no quantitative frequency screening criteria were specified in these documents, therefore
no comparison with the UK’s 10-4 per year natural external hazards design basis criterion could
be easily made. The documents that were not discounted were reviewed to:
Identify any further relevant information that may not have been captured in the NEA report; and
Identify what has been omitted from the NEA report.
A.1.2 FINDINGS
A discussion of the design basis criteria for naturally occurring external hazards from other
countries around the world and how they compare to the UK’s baseline design basis criteria is
given within the following sub-sections:
A.1.2.1 – International Atomic Energy Agency (IAEA);
A.1.2.2 – WENRA;
A.1.2.3 – USA;
A.1.2.4 – Canada;
A.1.2.5 – Germany;
A.1.2.6 – Finland;
A.1.2.7 – Switzerland;
A.1.2.8 – Russia;
A.1.2.9 – Advanced Safety Assessment Methodologies: extended PSA (ASAMPSA);
A.1.2.10 – NEA; and
A.1.2.11 – Literature Review.
Unless specifically noted, the criteria discussed in this report are designed for reactors, not
other nuclear facilities. They cannot simply be applied elsewhere without amendment; unlike a
reactor, some nuclear facility types may have different cycles of operation, affecting time at risk
for external hazards, or a heavier reliance on manual processes rather than automatic safety
systems, for example. Further work would be required to develop similar approaches to those
described herein for other types of facility than power plants.
A.1.2.1 IAEA
A.1.2.1.1 IAEA Documentation Review
The NEA report [Ref.A1.1] provides a summary of a number of IAEA documents that are
applicable to the screening of naturally occurring design basis external hazards. The documents
considered were:
IAEA SSG-35 – Site Survey and Site Selection for Nuclear Installations [Ref.A1.2].
FNC 62366-49823R Issue No. 1
© FNC 2020 Page 40 of 86 NOT PROTECTIVELY MARKED
NOT PROTECTIVELY MARKED
IAEA-TECDOC-719 – Defining initiating events for purposes of probabilistic safety
assessment [Ref. A1.3].
IAEA NS-R-3 – Site Evaluation for Nuclear Installations, Rev 1 [Ref. A1.4].
IAEA-TECDOC-1804 – Attributes of Full Scope Level 1 Probabilistic Safety Assessment
(PSA) for Application in Nuclear Power Plants [Ref. A1.5].
The key document in this list is IAEA-TECDOC-1804 [Ref. A1.5]. This document presents a
methodology for determining quantitative screening criteria and does not provide specific
numerical values. Six criteria in total are presented which are to be used to determine the
screening criteria. There are two based on core damage frequency (CDF) / fuel damage
frequency (FDF) and large early release frequency (LERF), two based on CDF alone and two
related to multi-unit Probabilistic Safety Assessments (PSAs).
It should be noted that the above IAEA documents, while relevant to the topic of screening, do
not appear to contain information relevant to defining design basis criteria. IAEA SSG-18 -
Meteorological and Hydrological Hazards in Site Evaluation for Nuclear Installations [Ref. A1.6]
is potentially more informative regarding the definition of the design basis for natural hazards.
Reference A1.6 is not included in the NEA report. However, its contents are discussed in
section A.1.2.1.3 below.
A.1.2.1.2 IAEA Screening Criteria and Methods
The IAEA guidance documentation does not provide specific numerical values for the
quantitative frequency screening of naturally occurring external hazards. Instead, it provides a
risk based methodology for determining the quantitative screening criteria, with the guiding
principle to ensure that individual and correlated hazards that [are screened] out, if subjected to
detailed realistic assessment, would not make a significant contribution to the total aggregated
risk for the risk metrics used in the PSA. This methodology has been summarised below.
The following criteria are typically applied to all hazards:
Based on design basis hazard event CDF / FDF and LERF:
1. An individual hazard can be screened from further detailed analysis if:
a. the plant has a design basis for the hazard (i.e. there is a defined design basis hazard event) and
b. (frequency of the design basis hazard event) × CCDP / CFDP (CLERP) < % of the internal events CDF/FDF (LERF).
Where CCDP is the conditional core damage probability, CFDP is the conditional fuel damage
probability, CLERP is the conditional large early release probability, CDF is the core damage
frequency, FDF is fuel damage frequency and LERF is the large early release frequency.
CCDP/CFDP (CLERP) is calculated assuming all SSCs that are not designed for the design
basis hazard event fail and is the parameter of the screening criteria representing the
contribution to the overall CDF/FDF (LERF) of the individual hazard.
2. Correlated hazards can be screened from further detailed analysis if:
a. the plant has a design basis for both hazards and
b. (frequency of the correlated design basis hazard events) × CCDP / CFDP (CLERP) < % of the internal events CDF / FDF (LERF).
FNC 62366-49823R Issue No. 1
© FNC 2020 Page 41 of 86 NOT PROTECTIVELY MARKED
NOT PROTECTIVELY MARKED
Where the plant CCDP / CFDP (CLERP) is calculated assuming all SSCs that are not designed
either design basis hazard event fail and β is the parameter of the screening criteria
representing the contribution to the overall CDF / FDF (LERF) of the correlated hazard.
Based on overall CDF / FDF:
3. An individual hazard can be screened from further detailed analysis if a bounding or demonstrably conservative estimate of CDF / FDF (LERF) over the full range of hazard
event severity is less than the % of the internal events CDF / FDF.
4. Correlated hazards can be screened from further detailed analysis if a bounding or demonstrably conservative estimate of CDF / FDF (LERF) over the full range of hazard event severity is less than 10% of the internal events CDF / FDF (LERF).
Criteria 1 and 2 are based on the concept that an SSC designed for a specific design basis
hazard event will not fail when subjected to that specific event severity and that the design
criteria are sufficiently conservative that the SSC has margin above that severity (i.e. the
severity will have to exceed the design basis hazard event severity and there is no “cliff edge to
failure” just above that severity. The numerical screening criteria for correlated hazards is set at
one order of magnitude below that for individual events because the SSCs, while they may be
designed for each event, are not designed for both events at the same time and so the margin
is potentially much lower.
The last two criteria (3 and 4) require more analysis because they can be applied to cases
where there is no specific design basis hazard event for the hazard. The intent in the use of
these criteria is that the screening analysis be sufficiently bounding or conservative to ensure
that if the hazards were subjected to detailed realistic analysis, the contribution to the total
aggregated risk would not be significant. These criteria are somewhat more restrictive in the
analytical sense because in the absence of a design basis for the hazard there can be no
prescribed threshold for the occurrence of damage to an SSC. Either the hazard frequency
must be so low that the design of the SSCs does not really matter or some analysis of plant
response must be performed in order to support a position that the plant can handle the hazard
sufficiently. However, the order of magnitude difference between the criterion for an individual
hazard versus correlated hazards is not required in this case because the CDF estimate is not
just for the design basis hazard event, but rather includes beyond design basis hazard events.
Therefore, the CCDP/CFDP would already account for the impact of the correlated hazards
more thoroughly than under criteria 1 and 2. Therefore, in some cases it may be beneficial to
apply these criteria even where a design basis exists.
If the hazard has the potential to “couple” core / fuel damage to large early release (that is,
increase the probability of a large early release given core / fuel damage significantly above
what it would be for internal events), then the LERF criterion should also be applied.
FNC 62366-49823R Issue No. 1
© FNC 2020 Page 42 of 86 NOT PROTECTIVELY MARKED
NOT PROTECTIVELY MARKED
Based on multiunit PSAs, the screening of hazards meets one of the following:
5. The individual hazards or correlated hazards do not have the potential to cause a multiunit initiating event.
6. An individual hazard or correlated hazards if subjected to detailed realistic analysis would not make a significant contribution to the selected multiunit PSA risk metrics.
It is noted that Loss of Off-site Power is example of an initiating event that has a high potential
for impacting multiple units concurrently. Hence any external hazard that may cause a Loss of
Off-site Power should not be screened out unless Criterion 6 can be applied. It is expected that
individual hazards or correlated hazards that can be screened out from the single reactor PSAs
using Criteria 1 through 4 would also satisfy Criteria 5 or 6 of this special attribute and so could
also be screened out from the multiunit PSA, however the analyst should perform a check to be
sure this is the case.
A.1.2.1.3 Comparison of IAEA Hazard Criteria with UK Practice
As discussed in section A.1.2.1.1 above, the NEA report [Ref.A1.1] considers the IAEA
approach to hazards screening, but does not cover the approach to defining the design bases
for natural hazards. Other IAEA documentation is available which is more informative of the
latter and Reference A1.6 is identified as an example. Additional IAEA guidance may be
relevant for other natural hazards e.g. seismic. It may be noted that the IAEA approach in its
‘Safety Guide’ series of documents is to describe recommended methodologies at a generalised
level and avoid prescribed criteria. However, in Annex I of Reference A1.6, a set of example
criteria for defining design basis parameters for meteorological variables is presented, taken
from the practice in one Member State (USA). Design basis criteria are presented separately
for a number of meteorological hazards; most (including 3 second wind gust and precipitation)
appear to be set at a 100 year return period. However the design basis criterion associated
with tornadoes is stated to be a return period of 10 million years. Methodologies, uncertainties
and confidence levels are not provided in Annex I of Reference A1.6. It is important to note that
these design basis criteria do not appear to be consistent with the information presented in
section A.1.2.3. This is not unexpected, since the NEA review in section A.1.2.3. refers to USA
documentation published many years following the issue of Reference A1.6.
In view of the above, a comparison between the UK design basis criterion for natural hazards
and the information presented in the NEA’s summary of IAEA screening criteria is not
meaningful. Further work would be required to identify whether alternative IAEA guidance
signposts a recommended approach to defining design basis criteria although, based on the
content of Reference A1.6, it is not expected that explicit parameter values would be presented,
other than by examples from practices in one or more member states.
A.1.2.2 Western Europe Nuclear Regulators Association (WENRA)
A.1.2.2.1 WENRA Documentation Review
The NEA report [Ref.A1.1] provides a summary of the WENRA documents that are applicable to
the screening of naturally occurring design basis external hazards. The documents considered
were:
Issue T: Natural Hazards Head Document, April 2015 [Ref.A1.7].
There are also a series of annexes to Reference A1.7 which contain additional information
related to the screening of flood [Ref.A1.8], extreme weather [Ref.A1.9] and seismic [Ref.A1.10]
hazards.
FNC 62366-49823R Issue No. 1
© FNC 2020 Page 43 of 86 NOT PROTECTIVELY MARKED
NOT PROTECTIVELY MARKED
A.1.2.2.2 WENRA Design Basis Criteria and Methods
The Natural Hazards Head Document [Ref.A1.7] states that exceedance frequencies of design
basis events shall be low enough to ensure a high degree of protection with respect to natural
hazards. A common target value of frequency, not higher than 10-4 per year is given for each
naturally occurring design basis external hazard event6.
The quantitative screening criteria given in the annexes do not differ from that presented in the
Head Document. The annexes simply offer further qualitative criteria for screening hazards such
as the specific location of the site and whether these external hazards are physically possible at
the location being considered.
Furthermore, the Head Document goes on to state that the assessment of naturally occurring
external hazards whether by probabilistic or deterministic methods is always reliant on data from
a variety of sources. The sources given include: data recorded from instruments, historical
records, anecdotal evidence and geological records.
A.1.2.2.3 Comparison of WENRA Design Basis Criteria with UK Practice
The WENRA guidance documentation identifies a generic naturally occurring external hazard
screening frequency of 10-4 per year, also estimated on a conservative basis. The ONR design
basis criterion is therefore consistent with this, thus no further conclusions can be made. The
WENRA guidance does not clearly specify a definition of how a conservative basis is defined
across all hazards7, unlike in the UK where Tag 13 [Ref.A1.11] defines conservative as
represented by the 84th percentile, or a standard deviation above the best estimate. It stipulates
due consideration of uncertainties and that the use of a confidence level higher than the median
of the hazard curve is expected.
A.1.2.3 Regulation in the United States of America
A.1.2.3.1 US Documentation Review
The NEA report [Ref.A1.1] provides a summary of a number of United States of America (USA)
regulatory documents that are applicable to the screening of naturally occurring design basis
external hazards. The documents considered were:
ASCE/SEI 7-10 – ASCE Standard – Minimum Design Loads for Buildings and Other
Structures, 2010 [Ref.A1.12].
ASME/ANS RA-Sb-2013 – Standard for Level 1 / Large Early Release Frequency
Probabilistic Risk Assessment for Nuclear Power Plant Applications, 2013 [Ref.A1.13].
DOE-HDBK-1100-2004 – DOE Handbook – Chemical Process Hazards Analysis, August
2004 [Ref.A1.14].
DOE-HDBK-1163-2003 – DOE Handbook – Integration of Multiple Hazard Analysis
Requirements and Activities, October 2003 [Ref.A1.15].
DOE-STD-1020-2016 – DOE Standard – Natural Phenomena Hazards Analysis and
Design Criteria for DOE Facilities, December 2016 [Ref.A1.16].
6 Where it is not possible to calculate the frequency with an acceptable degree of certainty, an event should be chosen and justified to reach an equivalent level of safety. For the specific case of seismic loading, a minimum horizontal peak ground acceleration value of 0.1g should be applied, regardless of whether its exceedance frequency is below 10-4. 7 The general guidance states that the use of a confidence level higher than the median of the hazard curve is expected. Additional detailed guidance for the consideration of seismic and external flooding hazards similarly does not further define conservative
FNC 62366-49823R Issue No. 1
© FNC 2020 Page 44 of 86 NOT PROTECTIVELY MARKED
NOT PROTECTIVELY MARKED
DOE-STD-1027-92 – DOE Standard – Hazard Categorisation and Accident Analysis
Techniques for Compliance with DOE Order 5480.23, December 1992 [Ref.A1.17].
DOE-STD-1628-2013 – DOE Standard - Development of Probabilistic Risk Assessments
for Nuclear Safety Applications, November 2013 [Ref.A1.18].
DOE-STD-3009-2014 – DOE STANDARD Preparation of Non-reactor Nuclear Facility
Documented Safety Analysis, November 2014 [Ref.A1.19].
EPRI 3002005387 – Identification of External Hazards for Analysis in Probabilistic Risk
Assessment – Update of Report 1022997, October 2015 [Ref.A1.20].
INL/EXT-1E-19521 – Next Generation Nuclear Plant Licensing Basis Event Selection
White Paper, September 2010 [Ref.A1.21].
MIL-STD-882E – Department of Defence Standard Practice System Safety, May 2012
[Ref.A1.22].
NUREG/CR-7005 – Technical Basis for Regulatory Guidance on Design-Basis Hurricane
Wind Speeds for Nuclear Power Plants, November 2011 [Ref.A1.23].
NUREG/CR-4661, Rev. 2 – Tornado Climatology of the Contiguous United States,
February 2007 [Ref.A1.24].
Reclamation Managing Water in the West – Dam Safety Public Protection Guidelines – A
Risk Framework to Support Dam Safety Decision-Making, August 2011 [Ref.A1.25].
Reclamation Managing Water in the West – Hydrologic Hazard Curve Estimating
Procedures, Research Report DSO-04-08, June 2004 [Ref.A1.26].
Of these, the primary standards used in the USA for external hazard screening are ASME/ANS
RA-Sb-2013 [Ref.A1.13] and EPRI 3002005287 [Ref.A1.20]. It is important to note that
Reference A1.13 provides hazard screening guidance applicable to probabilistic safety
assessment (PSA) and does not include guidance on where design basis values for hazards
should be set.
In contrast, Reference A1.16 provides guidance on design basis hazard return periods.
The key quantitative criteria from these documents are discussed below in Section A.1.2.3.2.
A.1.2.3.2 US Design Basis and Screening Criteria and Methods
The requirements for screening naturally occurring design basis external hazards are provided
in Section 6 of the ASME/ANS Standard [Ref.A1.13]. This section does not repeat the details of
the methodology, but summarises and describe some of the key areas with respect to external
hazards.
In general, external hazards are evaluated as follows:
HLR-EXT-A - All potential external hazards (i.e. all natural and man-made hazards) that
may affect the site shall be identified.
HLR-EXT-B - Preliminary screening if used, shall be performed using a defined set of
screening criteria.
HLR-EXT-C - A bounding or demonstrably conservative analysis, if used for screening,
shall be performed using defined quantitative screening criteria.
HLR-EXT-D - The basis for the screening out of an external hazard shall be confirmed
through a walkdown of the plant and its surroundings.
FNC 62366-49823R Issue No. 1
© FNC 2020 Page 45 of 86 NOT PROTECTIVELY MARKED
NOT PROTECTIVELY MARKED
HLR-EXT-E - Documentation of the screening out of an external hazard shall be
consistent with the applicable supporting requirements.
The requirements for quantitative screening are given by HLR-EXT-C above. Three
fundamental screening criteria are given within Reference A1.13. These are, an external hazard
can be screened out if either:
Criterion 1 - The NRC’s 1975 Standard Review Plan or later revision criteria are met;
Criterion 2 - The current design basis external hazard event has a mean frequency <10-5
per year and the mean value of the CCDP is assessed to be <10-1 or
Criterion 3 – The CDF, calculated using a bounding or demonstrably conservative
analysis has a mean frequency <10-6 per year.
The NEA report (Criterion 1) does not give a summary or further information on the
criteria given by NRC’s 1975 Standard Review Plan. Identification of criteria appears to
be achieved through diving into the external hazards individually. For example, in Chapter
3 on the Design of Structures, Components, Equipment, and Systems, Section 3.2.1 on
seismic classification defines an ‘operating basis earthquake’ (OBE) against which plant
features are designed. It refers out to the Code of Federal Regulations [Ref.A1.27]8 Part
50, “Earthquake Engineering Criteria for Nuclear Power Plants”. This then defines the
Safe Shutdown Earthquake Ground Motion that must be designed against (e.g. a
horizontal component in the free-field at the foundation level of the structures must be an
appropriate response spectrum with a peak ground acceleration of at least 0.1g).
10 CFR [Ref.A1.27] Part 50, Appendix A, General Design Criterion 2, "Design Bases for
Protection Against Natural Phenomena states:
Criterion 2—Design bases for protection against natural phenomena. Structures,
systems, and components important to safety shall be designed to withstand the effects
of natural phenomena such as earthquakes, tornadoes, hurricanes, floods, tsunami, and
seiches without loss of capability to perform their safety functions. The design bases for
these structures, systems, and components shall reflect: (1) Appropriate consideration of
the most severe of the natural phenomena that have been historically reported for the site
and surrounding area, with sufficient margin for the limited accuracy, quantity, and period
of time in which the historical data have been accumulated, (2) appropriate combinations
of the effects of normal and accident conditions with the effects of the natural phenomena
and (3) the importance of the safety functions to be performed.
Regarding calculation of the core damage frequency (CDF) (Criterion 3), this may be done
using different demonstrably conservative assumptions, as explained by a worked example
regarding risk from aircraft accidents (which although not a naturally occurring external hazard,
can be followed nonetheless). Although this is also highly qualitative, it does refer to eliminating
an external hazard from further study when the frequency is “very low (e.g. 10-7/yr)”.
Key points from the HLR-EXT-C supporting requirements are:
The mean frequency and the other parameters of the hazard should be determined using
hazard modelling and recent data (e.g. annual maximum wind speeds, precipitation etc.).
The CCDP should be determined taking into account the initiating event(s) caused by the
hazard and the SSCs made unavailable by the hazard. Fragility analysis (i.e. the impact
of the hazard on the SSC) may be used as needed.
Models and data used should be “either realistic or demonstrably conservative”.
8 https://www.nrc.gov/reading-rm/doc-collections/cfr/
FNC 62366-49823R Issue No. 1
© FNC 2020 Page 46 of 86 NOT PROTECTIVELY MARKED
NOT PROTECTIVELY MARKED
The NEA report also identifies another design criteria document DOE-STD-1020-2016 – Natural
Phenomena Hazards Analysis and Design Criteria for DOE Facilities [Ref.A1.16] as a useful
standard when it comes to setting design basis criteria to natural hazards phenomena. In
particular, it provides a flood screening analysis (FSA) methodology and implicitly provides
design basis guidelines for high winds, precipitation, and volcanic eruption. It was designed to
replace what had been multiple documents focusing on specific hazards. A high level summary
of the design basis return periods are as follows:
Wind, Tornado, and Hurricane Hazard Analysis – 50,000 to 125,000 years (for tornados),
2,500 to 6,250 years (for straight-line), and 2,500 to 6,250 years (for hurricanes) are
specified depending on the type of facility.
Flood, Seiche and Tsunami Hazard Analysis – 100 to 25,000 years (depending on the
Flood Design Category of the facility and the potential for safety components to be
submerged during a flood)
Precipitation Hazard Analysis – 500 to 25,000 years for precipitation flooding and from
100 to 6,250 years for precipitation loading on structures (depending on facility)
Volcanic Eruption - 100 to 10,000 years (for ashfall loading on structures) and 500 to
100,000 years for other types of ashfall-driven failures, depending on the type of facility.
It may be noted that lightning is included in the list of hazards considered in Reference
A1.16 but a design basis hazard is not defined.
A.1.2.3.3 Comparison of US Design Basis Criteria with UK Practice
The guidance documentation for the USA identifies a generic naturally occurring design basis
external hazard screening frequency of 10-5 per year (for unmitigated consequences9) with a
CCDP of <10-1, given the occurrence of the design basis hazard. Alternatively the hazard may
be screened out if the CDF, calculated using a bounding or demonstrably conservative analysis,
has a mean frequency <10-6 per year (for the total of mitigated sequences following the hazard).
The UK regulator does not prescribe screening criteria for PSA models. In UK licensee
practice, if a PSA model is sufficiently developed to the point where sequence end points have
been quantified, there is little incentive for screening. The benefit of screening is to remove
hazards from the burden of subsequent analysis.
In respect of the US design basis criteria for natural hazards set out in Reference A1.16, it may
be seen that they are presented as a range (e.g. 10-2 per year to 2.5 × 10⁻⁴ per year for flood
and precipitation, 2.5 × 10⁻³ per year to 1.25 × 10⁻⁵ per year for wind/tornado). The selection of
a single value within the range depends on the hazard type and facility. Further investigation
would be required to research the rationale for the allocation of specific design basis criteria.
However, it can be noted that none of the above is inconsistent with the generic design basis
value of 10-4 per year used in the UK for natural hazards.
Table 1 of the NEA report [Ref.A1.1] identifies one area (dam failure) where there is a specific
‘design basis’ criterion (10-4 per year) which arises from a separate reference [Ref. A1.25].
Three observations are made:
1. Dam failure would not be expected to be considered as a natural hazard in the UK, noting that consequential dam failure as a result of another natural hazard (e.g. seismic) would likely be addressed as part of a seismic hazard safety case. Dam failure in the UK would typically be considered as an external ‘Industrial Hazard’ in the same way as, for example, a
9 The benefit of using unmitigated screening criteria is that is straightforward and takes no account of the reliability of any SSCs that may be in place to protect a plant / facility or equipment from a specified hazard.
FNC 62366-49823R Issue No. 1
© FNC 2020 Page 47 of 86 NOT PROTECTIVELY MARKED
NOT PROTECTIVELY MARKED
petrochemical facility close to a nuclear power plant, and would therefore be addressed in a UK safety case with a fixed initiating event frequency.
2. Reference A1.25 – Dam Safety Public Protection Guidelines – proposes a guideline of 1 in 10,000 per year for the accumulation of failure likelihoods from all potential failure modes that would result in life-threatening unintentional release of the reservoir. However, this guideline is applicable only when the consequences are not high. Reference A1.25 goes on to present a set of frequency/consequence f-N curves which suggest that a dam failure frequency of 10-6 per year would be appropriate design basis value if the failure had significant consequences (i.e. 1000 fatalities or greater). This does not appear to be reflected in Table 1 of the NEA report.
3. As indicated above, Reference A1.25 quantifies the consequence as loss of life from the sudden surge of flood water into the surrounding environment; any follow-on fatalities associated with inundation of a NPP are not considered.
Since it is considered that dam failure would be addressed in the UK as a man-made hazard, a
comparison with the UK design basis criterion for natural hazards is not appropriate.
A.1.2.4 Regulation in Canada
A.1.2.4.1 Canadian Documentation Review
The NEA report [Ref.A1.1] provides a summary of a number of Canadian regulatory documents
that are applicable to the screening of naturally occurring design basis external hazards. Our
review of the REGDOC identified a slightly different set of key references (applicable naturally
occurring external hazards) as follows:
REGDOC-2.5.2 – Design of Reactor Facilities: Nuclear Power Plants, May 2014
[Ref.A1.28], which in turn refers out to the rest of the list below.
CNSC, RD-346 – Site Evaluation for New Nuclear Power Plants, 2008 [Reg.A1.29].
ANS 2.3, Estimating Tornado, Hurricane and Extreme Straight Line Wind Characteristics
at Nuclear Facility Sites [Ref.A1.30];
National Research Council (NRC), National Building Code of Canada [Ref.A1.31]; and
The last two documents are not freely available in the public domain and thus further comment
cannot be made.
The NEA report also identifies a standard recently issued by the Canadian Standards
Association Group:
N290.17-17 – Canadian Standards Association, Probabilistic Safety Assessment for
Nuclear Power Plants [Ref.A1.32].
A.1.2.4.2 Canadian Design Basis Criteria and Methods
Note: REGDOC-2.5.2 [Ref.A1.28] discusses Design Basis Accidents (DBAs), where ‘accident’ is
any unintended event, including operating errors, equipment failures or other mishaps, the
consequences or potential consequences of which are significant from the point of view of
protection or safety. With respect to nuclear criticality safety, the term accidents or accident
sequences means events or event sequences, including external events that lead to violation of
the subcriticality margin (that is, to exceeding the upper subcritical limit)10. Design-extension
conditions (DECs) are a subset of beyond-DBAs (BDBAs) that are considered in the design.
10 Online REGDOC-3.6, Glossary of CNSC Terminology - Glossary – A, https://nuclearsafety.gc.ca/eng/acts-and-regulations/regulatory-documents/published/html/regdoc3-6/a.cfm
FNC 62366-49823R Issue No. 1
© FNC 2020 Page 48 of 86 NOT PROTECTIVELY MARKED
NOT PROTECTIVELY MARKED
External hazards which the plant is designed to withstand are selected and classified as DBAs
or DECs.
The requirements for screening design basis external hazards are primarily discussed within
REGDOC-2.5.2 [Ref.A1.28]. It lists the following, qualitative criteria for screening out natural
external hazards:
A phenomenon that occurs slowly or with adequate warning with respect to the time
required to take appropriate protective action;
A phenomenon which in itself has no significant impact on the operation of an NPP and
its design basis;
An individual phenomenon which has an extremely low probability of occurrence;
The NPP is located sufficiently distant from or above the postulated phenomenon (e.g.,
fire, flooding);
A phenomenon that is already included or enveloped by design in another phenomenon
(e.g., storm-surge and seiche included in flooding or accidental small aircraft crash
enveloped by tornado loads).
Reference A1.28 excludes earthquakes from the above screening process. It provides a
separate definition of the design basis earthquake by multiplying the mean site specific uniform
hazard spectrum with a probability of occurrence of 10-4/yr by a design factor, defined in the
standard ASCE 43-05, Seismic Design Criteria for Structures, Systems and Components in
Nuclear Facilities. Beyond-design-basis earthquakes are also to be considered as DECs, under
which successful plant operation needs to be demonstrated (but potentially with less
conservatism). The NEA report appears to have overlooked this design basis definition.
It is interesting to note that combinations of randomly occurring individual events that could
credibly ‘lead’ to DBAs or DECs are required to be considered in the design. Such combinations
shall be identified early in the design phase, and shall be confirmed using a systematic
approach. Events that may result from other events, such as a flood following an earthquake,
shall be considered to be part of the original postulating initiating event.
Three quantitative safety goals are based on aggregate event sequences as follows:
1. Core damage frequency – the sum of frequencies of all event sequences that can lead to significant core degradation shall be less than 10-5 per reactor year.
2. Small release frequency – the sum of frequencies of all event sequences that can lead to a release to the environment of more than 10-15 becquerels of iodine-131 shall be less than 10-5 per reactor year. A greater release may require temporary evacuation of the local population.
3. Large release frequency – the sum of frequencies of all event sequences that can lead to a release to the environment of more than 10-14 becquerels of cesium-137 shall be less than 10-6 per reactor year. A greater release may require long term relocation of the local population.
Although conservatism is broadly applied throughout, it is not defined. Moreover, the regulation
recognises that when the risk metrics for external events are conservatively estimated, their
summation with the risk metrics for internal events can lead to misinterpretation.
A recent addition to the Canadian set of standards is N290.17-17 [Ref.A1.32], which specifies
that a naturally occurring external hazard may be screened out of the PSA for an existing
reactor if it can be shown that the large release frequency attributable to the hazard is less than
10-7 per year.
FNC 62366-49823R Issue No. 1
© FNC 2020 Page 49 of 86 NOT PROTECTIVELY MARKED
NOT PROTECTIVELY MARKED
A.1.2.4.3 Comparison of Canadian Criteria with UK practice
The NEA report concludes that the screening criteria are risk-informed and align with Canadian
regulatory requirements, operating experience of the Canadian nuclear industry, and
international good practices. Application of the screening criteria for new reactors might be
different than the screening criteria for existing reactors.
The Canadian regulatory guidance differs from UK guidance in that it does not provide a generic
design basis frequency for natural external hazards, nor does it define “conservative”. While a
definition of a design basis earthquake is included in the Canadian regulatory guidance, it
specifies the use of the site-specific uniform hazard spectrum together with design factors from
ASCE 43-05, Seismic Design Criteria for Structures, Systems and Components in Nuclear
Facilities. The latter document is not available without payment. Although the return frequency
of 10-4 per year aligns with the generic UK hazard design basis, the specification of site-specific
uniform hazard spectra to define the design basis is not aligned.
Where the Canadian regulation and UK regulation do agree, is on the PSA screening criteria for
existing reactors / sites i.e. both stipulate that an external hazard may be screened from further
assessment if has a frequency less than 10-7 per year.
A.1.2.5 Regulation in Germany
A.1.2.5.1 German Documentation Review
The NEA report [Ref.A1.1] provides a summary of a number of German regulatory documents
that are applicable to the screening of design basis naturally occurring external hazards. The
documents considered were:
KTA 2201.1 – Safety Standards of the Nuclear Safety Standards Commission (KTA),
Design of Nuclear Power Plants against Seismic Events, Part 1: Principles, November
2011 [Ref.A1.33].
KTA 2207 – Safety Standards of the Nuclear Safety Standards Commission, Flood
Protection for Nuclear Power Plants, November 2004 [Ref.A1.34].
Safety Requirements for Nuclear Power Plants Edition 03/15 [Ref.A1.35].
A.1.2.5.2 German Design Basis Criteria and Methods
The German regulations define a design basis accident as an event against which a nuclear
power plant is designed according to established design criteria.
For Germany the NEA document reports that the decision on which external hazards to assess
in detail is generally not based on ‘screening criteria’. Instead, for the individual hazards it is
specified how they have to be taken into account.
The NEA document identifies the following external hazards which are discussed within the
Safety Standards of the Nuclear Safety Standards Commission (KTA):
Seismic hazards, addressed in KTA 2201.1 [Ref.A1.33]: The probabilistic approach to
specifying the characteristics of the design basis earthquake is based on a probability of
exceedance of 10-5 per year. Additionally, a deterministic hazard assessment must be
undertaken.
Flooding hazards, addressed in KTA 2207 [Ref.A1.34]: In accordance with the guidelines
and risk assessment related to large dams, the design basis flood is specified as being a
flood event with a probability of 10-4 per year. The NEA document states that it is not
specified whether this is meant to be mean, median or some other percentile.
FNC 62366-49823R Issue No. 1
© FNC 2020 Page 50 of 86 NOT PROTECTIVELY MARKED
NOT PROTECTIVELY MARKED
Extreme wind / snow hazards: Civil structures have all been designed to comply with the
relevant Engineering Standards i.e. the Eurocodes. The wind snow / loads are based on
so called characteristic values i.e. wind speed and pressure, with exceedance
frequencies of 2 × 10⁻² per year (i.e. 1 in 50 years). The Eurocodes state that for critical
buildings such as Nuclear Power Plants, the characteristic loads must be multiplied by a
factor of 1.5. The resulting loads roughly correspond to design basis events with a
frequency of occurrence of 10-3 to 10-4 per year.
For all other natural external hazards, the guidance (AT 30.03.2015 [Ref.A1.35]) states that they
are to be taken into account but it does not specify how.
A.1.2.5.3 Comparison of German Design Basis Criteria with UK Practice
The German safety standards and UK regulations differ in the way the design basis criteria for
external hazards are defined. The German approach appeals to various hazard-specific safety
standards which set different criteria for the design basis hazards. This is in contrast to
regulation in the UK which gives a generic 10-4 per year design basis criterion for naturally
occurring external hazards.
It is thus concluded that whilst in some areas i.e. for flooding, the German and UK design basis
criteria may generally align, for seismic events the German design basis criterion is set at 10-5
per year compared with 10-4 per year in the UK. Design basis wind loadings, on the other hand,
may be less onerous in Germany, being based on a 1 in 50 years return period hazard with a
multiplicative load factor. Given the above remarks in the NEA document that the German
standards do not appear to specify how uncertainties should be addressed, it is only possible to
state that the design basis criteria are different between the two countries – but not obviously
inconsistent.
A.1.2.6 Regulation in Finland
A.1.2.6.1 Finnish Documentation Review
The NEA report [Ref.A1.1] provides a summary of the following Finnish regulatory documents
that are applicable to the screening of design basis naturally occurring external hazards:
YVL B.7 – Provisions for Internal and External Hazards at a Nuclear Facility [Ref.A1.36].
It is noted that one of the key references, STUK Y/1/2016, within the NEA report is not freely
available in the public domain and is thus not considered within this report.
A.1.2.6.2 Finnish Design Basis Criteria and Methods
Regulation in Finland requires the application of a specific criterion for a design basis
earthquake and generic criteria for other naturally occurring external hazards. The criteria for
both are given as 10-5 per year. However, it is caveated that if it can be reliably demonstrated
that an external event does not affect the probability of occurrence of a postulated accident,
then the design basis criterion can be taken to be 10-4 per year.
Additionally, there is a specific value for flooding due to sea water levels where the guidance
specifies a two metre addition to the 10-2 per year water level (at a median confidence level)
further increased by a site-specific wave margin.
A.1.2.6.3 Comparison of Finnish Design Basis Criteria with UK Practice
The Finnish and UK regulations differ since the Finnish design basis criterion for earthquakes
and other external hazards is 10-5 per year (for unmitigated consequences) compared to the
UK’s 10-4 per year (for unmitigated consequences) for all naturally occurring external hazards.
However, as discussed above, there is potential for the Finnish design basis hazard frequency
to be changedto 10-4 per year provided the probability of an accident would not increase for a
FNC 62366-49823R Issue No. 1
© FNC 2020 Page 51 of 86 NOT PROTECTIVELY MARKED
NOT PROTECTIVELY MARKED
more severe (and less likely) hazard. While this is consistent with the UK design basis criterion,
it carries an additional caveat which is not included in the UK design basis criterion i.e. that the
proportion of risk beyond the design basis is low. This appears to acknowledge that, for a
number of hazards, the Finnish regulatory expectation is that the risk associated with such
hazards may be associated with hazard frequencies more frequent than 10-4 per year.
A.1.2.7 Regulation in Switzerland
A.1.2.7.1 Swiss Documentation Review
The NEA report [Ref.A1.1] provides a summary of the following Swiss regulatory document that
is applicable to the screening of naturally occurring design basis external hazards:
ENSI-A05/e – Guidelines for Swiss Nuclear Installations - Probabilistic Safety Analysis
(PSA): Quality and Scope, March 2009 [Ref.A1.37].
It is important to note that the NEA review quotes only PSA guidance and it appears that only a
limited number of ENSI documents are freely available (and in English). It is not known whether
additional relevant guidance is available regarding deterministic design basis criteria. An
inspection of the guidance available on the ENSI website has identified a document not
included in the NEA review i.e. ENSI-A01/e - Technical Safety Analysis for Existing Nuclear
Installations: Scope, Methodology and Boundary Conditions. This has some additional
information regarding frequencies to be associated with Design Basis Hazards. However, the
information is at a high level but suggests that further investigation might yield useful results.
As a final observation, it is noted that some of the Swiss regulatory documentation refers to
publications of the German regulator so there may commonalities between Swiss and German
regulatory approaches to design basis hazards.
A.1.2.7.2 Swiss Screening Criteria and Methods
The regulation in Switzerland requires the application of a best estimate PSA methodology and
permits screening out of naturally occurring external hazards (excluding earthquakes, extreme
winds, tornadoes and external flooding – which are considered separately below) provided that
the following conditions are met:
A hazard may be screened out if it can be shown based on qualitative arguments that the
hazard has a negligible impact on the CDF/FDF (e.g., if the consequences on the plant
do not require the actuation of front-line systems or the consequences are already
covered by events having a significantly higher frequency of occurrence).
A bounding analysis of the CDF / FDF due to the hazard yields a best estimate result less
than 10-9 per year (for each fault sequence assuming mitigated consequences).
The first of the above conditions is stated to be qualitative – but could be regarded as being
quantitative but without numerical analysis. It also allows a degree of bounding of hazards to be
carried out, presumably with the aim of simplifying the PSA model. The second of these
conditions could be regarded as being less of a screening exercise; rather more an exercise in
identifying (and removing) initiating events whose contribution to risk is extremely small
compared to other initiating events. If the initiating event happened to be a natural hazard, this
would enable the hazard to be screened out from the PSA. However, if the PSA analyst had
already gone to the trouble of modelling the hazard sequences and evaluating the sequence
frequencies, the only incentive for screening would appear to be to increase the speed of PSA
model quantification, or to reduce the model size due to limitations in the PSA model software
or hardware.
The Swiss guidance further discusses different methods for assessing seismic, extreme wind,
tornados and external flooding. A brief summary of for each of these is provided below. Since
FNC 62366-49823R Issue No. 1
© FNC 2020 Page 52 of 86 NOT PROTECTIVELY MARKED
NOT PROTECTIVELY MARKED
the scope of the analysis is PSA it is reasonable to assume that hazard evaluations should be
on a best estimate basis unless otherwise stated.
Seismic
The Seismic PSA includes an evaluation of earthquake hazards, seismic fragilities and an
analysis of accident sequences. A detailed PSA is required for vibratory ground motions caused
by earthquakes. Ground motion levels are to be provided to a level corresponding to an annual
exceedance frequency of 10-7 per year.
Extreme Winds
Reference A1.37 states a maximum wind speed exceedance frequency curve should be
developed based on the long-term site-specific wind data using a Gumbel probability distribution
for the data fit and extrapolation.
Tornados
The mean annual frequencies of tornadoes are assumed to be:
F0 and F1: 2.3 per year
F2: 2.2x10⁻¹ per year
F3 and higher: 6.3x10⁻² per year
Reference A1.37 states that lognormal distribution of the frequencies with an error factor of 10
shall be assumed.
External Floods
A maximum river water level exceedance frequency curve is to be developed based on the site-
specific measured data. If deemed appropriate, a Pearson-III probability distribution shall be
used for the data fit and extrapolation.
It is to be assumed that a dam or weir fails with a mean frequency of 6.4x10⁻⁵per year.
A.1.2.7.3 Comparison of Swiss Design Basis Criteria with the UK
Based on the information presented in the NEA report, this Swiss approach to design basis
external hazards criteria might be very different to that of the UK’s. If an external hazard in
Switzerland has a frequency of occurrence greater than 10-9 per year then it is to be considered
within the facility or plant PSA unless it has been bounded by another initiating event or has
been argued to have no effect on the NPP. The Swiss regulatory guidance in ENSI-A05/e
[Ref.A1.37] does not specify any design basis criteria. However, some discussion of the type of
criteria expected to be applied to design basis hazards is provided for Seismic, Extreme Winds,
Tornados and External Flooding. Specific methodologies are highlighted in the Swiss guidance
(but not discussed in the NEA document) which would not be expected in the goal-setting UK
regulatory regime.
Section A.1.2.7.1 notes that ENSI-A05/e [Ref.A1.37] is a document which relates solely to
probabilistic safety analysis and it is judged likely that there is other Swiss regulatory
documentation which may be relevant to defining design basis criteria for natural hazards and
other initiating events. It is therefore not appropriate to make a comparison between the UK’s
generic design basis criterion for natural hazards and hazard event frequencies included within
a PSA. UK PSA models would also be expected to consider hazards beyond the design basis –
and this is explored further in the Task 2 study reported in this document.
FNC 62366-49823R Issue No. 1
© FNC 2020 Page 53 of 86 NOT PROTECTIVELY MARKED
NOT PROTECTIVELY MARKED
A.1.2.8 Regulation in Russia
A.1.2.8.1 Documentation Review
The NEA report [Ref.A1.1] provides a summary of the following Russian regulatory document
that is applicable to the screening of design basis naturally occurring external hazards:
NP-064-05 – Federal Standards and Rules in the Field of Use of Atomic Energy -
Accounting of External Natural and Man-Induced Impacts on Nuclear Facilities, May 2006
[Ref.A1.38].
A.1.2.8.2 Design Basis Criteria and Methods Used to Identify the Criteria
The Russian regulations define three hazard degrees, which have been established with regard
to the processes, phenomena and factors of natural (and man-induced) origin depending on
impact consequences for the environment. They are defined as follows:
Hazard Degree I - an especially hazardous process (phenomenon, factor), which is
characterised by the maximum possible for the given process values of parameters and
characteristics within a preset period of time and accompanied by natural and/or man-induced
catastrophes;
Hazard Degree II - a hazardous process (phenomenon, factor), which is characterized by
sufficiently high (but not higher than the known maximum value for the given process) values of
parameters and characteristics within a preset period of time and accompanied by tangible
consequences for the environment;
Hazard Degree III - a process (phenomenon, factor), which does not pose any danger and is
characterized by low values of parameters and characteristics within a preset period of time and
is not accompanied by tangible consequences for the environment.
External natural hazards that will affect the nuclear facility or site are determined on the basis of
calculated maximum values of their impact parameters (i.e. intensity and frequency) using the
limiting values presented in Appendix 1 of NP-064-05 [Ref. A1.38].
Maximum parameter values of the hydrometeorological, geologic and engineering geological
phenomena and processes will be determined for the time interval of 10,000 years (10-4 per
year).
A.1.2.8.3 Comparison of Design Basis Criteria with the UK
The Russian approach to design basis external hazards shows some similarity to that of the UK
in that maximum parameter values of the hydro-meteorological, geologic and engineering
geological phenomena and processes are determined for an event with a frequency of
occurrence of 10-4 per year (for unmitigated consequences).
A.1.2.9 ASAMPSA
A.1.2.9.1 ASAMPSA Documentation Review
The NEA report [Ref.A1.1] provides a summary of the following ASAMPSA document which
details the external hazard screening criteria of various countries and organisations around the
world:
ASAMPSA_E/WP30/D30.7/2017-31 Volume 2 – Methodology for Selecting Initiating
Events and Hazards for Consideration in an Extended PSA, December 2016 [Ref.A1.39].
A.1.2.9.2 ASAMPSA Screening Criteria and Methods
The ASAMPSA document provides details on the traditional hazard screening approaches from
a variety of countries and organisations. The report notes that numerical probabilistic safety
FNC 62366-49823R Issue No. 1
© FNC 2020 Page 54 of 86 NOT PROTECTIVELY MARKED
NOT PROTECTIVELY MARKED
targets are applied differently depending on a country’s interpretation of the quantitative
screening criteria. Nevertheless, it recommends the following good practice approach for
defining quantitative external hazard screening criteria for the selection of PSA initiating events:
Based on regulatory acceptance criteria or established international guidance for CDF /
FDF (e.g. 10-5 per year for new reactors) and LRF / LERF, the maximum screening
quantitative criteria shall be set to 1% of that value. This results in the following minimum
criteria:
i. FDFevent < 10-7 /y (Radionuclide Mobilisation Frequency11 < 10-7 /y)
ii. LRFevent < 10-8 /y
iii. ERFevent < 10-8 /y (LERFevent < 10-8 /y)
For hazards that cannot be screened out, ASAMPSA_E/WP30/D30.7/2017-31 Volume 2
[Ref.A1.39] states that a more detailed deterministic impact assessment is to be performed. The
purpose of which is to eliminate all potential external events that do not have the potential to
induce any transient on the plant i.e. the maximum credible impact caused by an external
hazard scenario does not induce any of the internal initiating events of the PSA or any
additional initiating events previously not considered in the internal events PSA.
However, one of the challenges noted is in defining a “maximum” for external hazard processes.
ASAMPSA_E/WP30/D30.7/2017-31 Volume 2 [Ref.A1.39] states that for many natural hazards
screened in as applicable, a maximum impact at the site cannot be determined independent of
the occurrence frequency or exceedance frequency. In these cases, the magnitude of hazard
impact is effectively not bounded by physical effects or site-specific properties (e.g. tsunami
height due to asteroid impact for coastal sites or earthquake magnitude for seismically active
regions). Then, a maximum credible impact needs to be determined with explicit reference to
frequency of exceedance curves with a reasonably small frequency threshold. This threshold
will depend on screening criteria, and might be in the range of 10-7 per annum to 10-8 per annum
or even below for PSA. If the analysts cannot demonstrate that the safety of the plant is not
challenged by using such assumptions, the respective hazard should be treated by bounding
assessment. Often, design basis values are set at exceedance frequencies of 10-4 per annum or
10-5 per annum and the main difficulty for the PSA development is to determine the exceedance
frequency curve in the range 10-4 per annum to 10-8 per annum.
A.1.2.9.3 Comparison of Screening Criteria with UK
Reference A1.39 provides an extensive overview of traditional screening approaches, including
those found in a variety of countries and organisations. However, these screening criteria are
applicable to PSA models and are not informative in respect of design basis criteria. It is thus
not appropriate to make a direct comparison between these screening criteria with the ONR’s
design basis criteria.
A.1.2.10 Nuclear Energy Agency
A.1.2.10.1 NEA Documentation Review
The NEA report [Ref.A1.1] provides a summary of the following, additional NEA document
“Probabilistic Safety Assessment (PSA) of Natural External Hazards Including Earthquakes”
workshop proceedings:
11 Radionuclide Mobilisation Frequency (RMF) is defined as a loss of the design basis confinement for a source of radionuclides, leading to an unintended mobilisation of a significant amount of radionuclides with the potential for internal or external release.
FNC 62366-49823R Issue No. 1
© FNC 2020 Page 55 of 86 NOT PROTECTIVELY MARKED
NOT PROTECTIVELY MARKED
NEA/CNRA/R(2014)9 – Probabilistic Safety Assessment (PSA) of Natural External
Hazards Including Earthquakes, Workshop Proceedings, June 2013 [Ref.A1.40].
A.1.2.10.2 NEA Screening Criteria and Methods
The NEA workshop proceedings present information from the OECD member states on
methods and approaches being used and experience gained in PSA of natural external hazards
from a number of regulators around the world. Frequency screening criteria used in the PRA
models were in the range 10-7 to 10-8 per year.
A.1.2.10.3 Comparison of Screening Criteria with UK Practice
Reference A1.40 addresses PSA screening criteria but not design basis criteria. It is therefore
not appropriate to compare the criteria in Reference A1.40 with the ONR’s design basis criterion
for natural external hazards.
A.1.2.11 Survey of the Research Literature
A.1.2.11.1 Documentation Review
The NEA report [Ref.A1.1] provides a summary of the scientific journals that were reviewed
relevant to the topic of qualitative screening criteria for naturally occurring external hazards.
Those reviewed were:
Annals of Nuclear Energy
Nuclear Engineering and Design
Nuclear Technology
Progress in Nuclear Energy
Reliability Engineering and System Safety
Risk Analysis
Safety Science
The journals that were searched were found not to contain any relevant papers that were
specifically related to the topic of design basis criteria for naturally occurring external hazards
(that added any new information not already presented).
The journals related to risk and safety did contain several papers that were related to the topic
to some degree, the majority of the papers that were identified were related to the broader topic
of risk-informed regulation and the interaction with the specification of appropriate safety goals.
As such, the research reported in these papers did not specifically address criteria for design
basis naturally occurring external hazards.
FNC 62366-49823R Issue No. 1
© FNC 2020 Page 56 of 86 NOT PROTECTIVELY MARKED
NOT PROTECTIVELY MARKED
A.1.4 REFERENCES FOR APPENDIX 1
A1.1. NEA/CSNI/R(2018)7 – Examination of Approaches for Screening External Hazards for Nuclear Power Plants, April 2019.
A1.2. IAEA SSG-35 – Site Survey and Site Selection for Nuclear Installations, 2015.
A1.3. IAEA-TECDOC-719 – Defining initiating events for purposes of probabilistic safety assessment, September 1993.
A1.4. IAEA NS-R-3 – Site Evaluation for Nuclear Installations, Rev 1, 2016.
A1.5. IAEA-TECDOC-1804 – Attributes of Full Scope Level 1 Probabilistic Safety Assessment (PSA) for Application in Nuclear Power Plants, 2016.
A1.6. IAEA SSG-18 - Meteorological and Hydrological Hazards in Site Evaluation for Nuclear Installations, 2011
A1.7. WENRA - Issue T: Natural Hazards Head Document, April 2015.
A1.8. WENRA – Issue T: Natural Hazards Guidance on External Flooding, Annex to the Guidance Head Document on Natural Hazards, October 2016.
A1.9. WENRA – Issue T: Natural Hazards Guidance on Extreme Weather Conditions, Annex to the Guidance Head Document on Natural Hazards, October 2016.
A1.10. WENRA – Issue T: Natural Hazards Guidance on Seismic Events, Annex to the Guidance Head Document on Natural Hazards, October 2016.
A1.11. NS-TAST-GD-013 Rev 7 – ONR Guide, External Hazards, October 2018.
A1.12. ASCE/SEI 7-10 – ASCE Standard – Minimum Design Loads for Buildings and Other Structures, 2010.
A1.13. ASME/ANS RA-Sb-2013 – Addendum B to ASME/ANS RA-S-2008 Standard for Level 1 / Large Early Release Frequency Probabilistic Risk Assessment for Nuclear Power Plant Applications, 2009.
A1.14. DOE-HDBK-1100-2004 – DOE Handbook – Chemical Process Hazards Analysis, August 2004.
A1.15. DOE-HDBK-1163-2003 – DOE Handbook – Integration of Multiple Hazard Analysis Requirements and Activities, October 2003.
A1.16. DOE-STD-1020-2016 – DOE Standard – Natural Phenomena Hazards Analysis and Design Criteria for DOE Facilities, December 2016.
A1.17. DOE-STD-1027-92 – DOE Standard – Hazard Categorisation and Accident Analysis Techniques for Compliance with DOE Order 5480.23, December 1992.
A1.18. DOE-STD-1628-2013 – DOE Standard - Development of Probabilistic Risk Assessments for Nuclear Safety Applications, November 2013.
A1.19. DOE-STD-3009-2014 – DOE STANDARD Preparation of Non-reactor Nuclear Facility Documented Safety Analysis, November 2014.
A1.20. EPRI 3002005287 – Identification of External Hazards for Analysis in Probabilistic Risk Assessment (Update of Report 1022997), October 2015.
A1.21. INL/EXT-1E-19521 – Next Generation Nuclear Plant Licensing Basis Event Selection White Paper, September 2010.
FNC 62366-49823R Issue No. 1
© FNC 2020 Page 57 of 86 NOT PROTECTIVELY MARKED
NOT PROTECTIVELY MARKED
A1.22. MIL-STD-882E – Department of Defence Standard Practice System Safety, May 2012.
A1.23. NUREG/CR-7005 – Technical Basis for Regulatory Guidance on Design-Basis Hurricane Wind Speeds for Nuclear Power Plants, November 2011.
A1.24. NUREG/CR-4661, Rev. 2 – Tornado Climatology of the Contiguous United States, February 2007.
A1.25. Reclamation Managing Water in the West – Dam Safety Public Protection Guidelines – A Risk Framework to Support Dam Safety Decision-Making, August 2011.
A1.26. Reclamation Managing Water in the West – Hydrologic Hazard Curve Estimating Procedures, Research Report DSO-04-08, June 2004.
A1.27. NRC Regulations Title 10, Code of Federal Regulations.
A1.28. REGDOC-2.5.2 – Design of Reactor Facilities: Nuclear Power Plants, May 2014.
A1.29. CNSC, RD-346 – Site Evaluation for New Nuclear Power Plants, 2008.
A1.30. ANS 2.3, Estimating Tornado, Hurricane and Extreme Straight Line Wind Characteristics at Nuclear Facility Sites, 2011.
A1.31. National Research Council (NRC), National Building Code of Canada, 2010.
A1.32. N290.17-17 – Canadian Standards Association, Probabilistic Safety Assessment for Nuclear Power Plants, 2017.
A1.33. KTA 2201.1 – Safety Standards of the Nuclear Safety Standards Commission (KTA), Design of Nuclear Power Plants against Seismic Events, Part 1: Principles, November 2011.
A1.34. KTA 2207 – Safety Standards of the Nuclear Safety Standards Commission, Flood Protection for Nuclear Power Plants, November 2004.
A1.35. Bundesamt für Strahlenschutz – Safety Requirements for Nuclear Power Plants Edition 03/15, Translations – Rules and Regulations for Nuclear Safety and Radiation Protections, March 2015.
A1.36. YVL B.7 – Provisions for Internal and External Hazards at a Nuclear Facility.
A1.37. ENSI-A05/e – Guidelines for Swiss Nuclear Installations - Probabilistic Safety Analysis (PSA): Quality and Scope, March 2009.
A1.38. NP-064-05 – Federal Standards and Rules in the Field of Use of Atomic Energy - Accounting of External Natural and Man-Induced Impacts on Nuclear Facilities, May 2006.
A1.39. ASAMPSA_E/WP30/D30.7/2017-31 volume 2 – Methodology for Selecting Initiating Events and Hazards for Consideration in an Extended PSA, December 2016.
A1.40. NEA/CNRA/R(2014)9 – Probabilistic Safety Assessment (PSA) of Natural External Hazards Including Earthquakes, June 2013.
FNC 62366-49823R Issue No. 1
© FNC 2020 Page 58 of 86 NOT PROTECTIVELY MARKED
NOT PROTECTIVELY MARKED
A.2 APPENDIX 2 – PSA MODELLING WORK
This appendix describes the PSA modelling work that was performed for the three
selected hazards, these being seismic events, external floods and lightning strikes. The
PSA models were developed assuming a nuclear power plant with a PWR design.
The three PSA models have three structural features in common, which are discussed in
turn below.
Firstly, for each model there is a hazard curve, which relates the magnitude of the hazard
to the frequency of the hazard. In each case, this relationship is presented as a set of
exceedance frequencies and corresponding hazard magnitudes, i.e., any point of the
hazard curve gives the frequency of occurrence of that level of hazard or a hazard with
greater magnitude.
Secondly, for any particular hazard occurrence, a single damage state or a set of
multiple damage states is defined. A damage state is a set of impacts of the hazard on
the nuclear power plant. For example, a seismic event may lead to a loss of off-site
power together with damage to safety injection pumps, or it may lead to a loss of off-site
power and damage to the condensate storage tank (implying a loss of secondary cooling
capability), or it may lead to a loss of off-site power only, and so on. In the case of a
seismic event, there are multiple possible damage states for any level of hazard. On the
other hand, the flood model and the lightning model involve one damage state for any
particular flood or any particular lightning strike. As a result, the quantification of the
seismic PSA model is more complex than the quantification of the lightning or external
flooding PSA models.
Thirdly, all three PSA models involve the use of conditional core damage probabilities
(CCDP). Once the damage state occurring for any particular hazard has been
established, the corresponding impacts on the plant define the probability that a core
damage event will subsequently occur (i.e., the CCDP) following the hazard and damage
state occurrence. In a typical PSA assessment, the value of this probability would be
calculated by a quantification of the PSA model with a specific initiating event chosen
and a specific set of equipment unavailabilities. However, for the work described here, a
full PSA model was not available, meaning that the CCDP values had to be estimated
based on a literature search coupled with analyst judgment.
The remaining sections of this appendix describe how the conditional core damage
values are selected (Section 2), then continue to describe the damage state and hazard
curve models for each of the three PSA models (Sections 3, 4 and 5). There is only one
section for conditional core damage probabilities because the values presented in that
section are used in all three PSA models.
Results of model quantification are not presented in this appendix, rather they are
presented and discussed in Section 4 of the main report.
A.2.1 CONDITIONAL CORE DAMAGE PROBABILITIES
Conditional core damage probabilities are developed for each of the damage states.
These probabilities and an explanation of their derivations are presented in Table 10.
Figure 9 presents an event tree taken from [Ref. A2.1]; this event tree is referred to in the
derivations presented in Table 10. The specific items of information taken from Figure 9
are the values of secondary feedwater systems reliability that are shown on two of the
event tree branches.
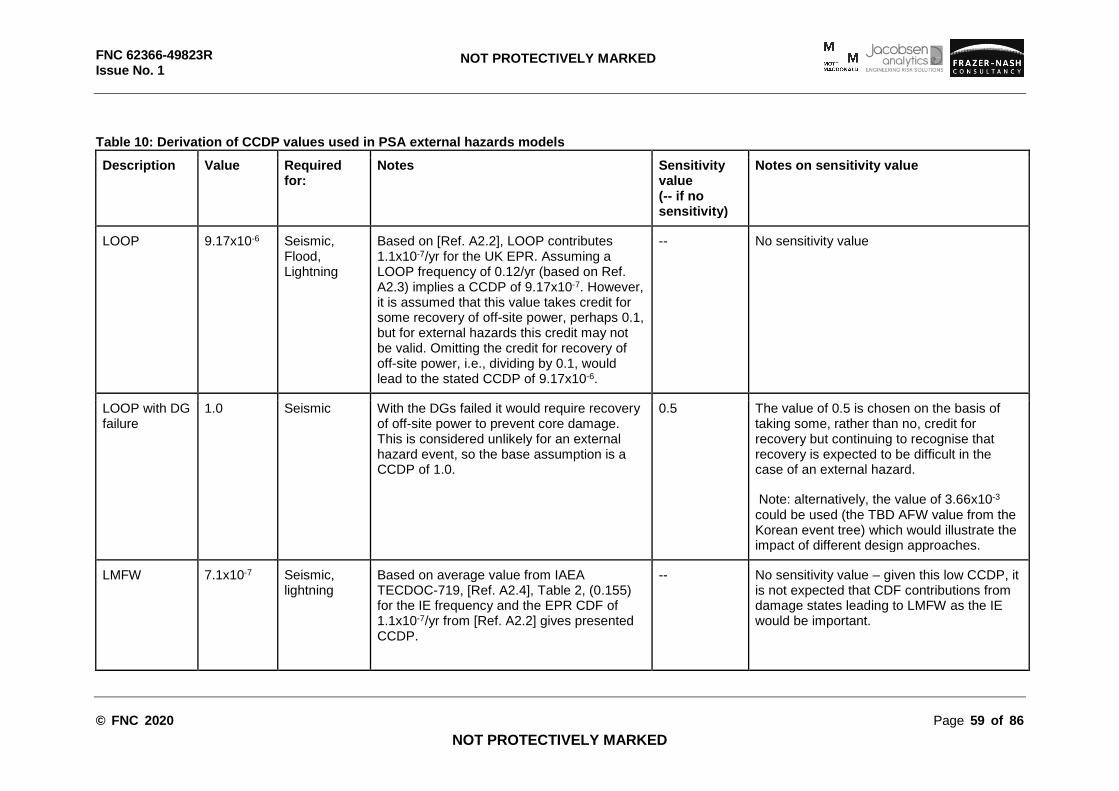
FNC 62366-49823R Issue No. 1
© FNC 2020 Page 59 of 86
NOT PROTECTIVELY MARKED
NOT PROTECTIVELY MARKED
Table 10: Derivation of CCDP values used in PSA external hazards models
Description Value Required for:
Notes Sensitivity value (-- if no sensitivity)
Notes on sensitivity value
LOOP 9.17x10⁻⁶ Seismic, Flood, Lightning
Based on [Ref. A2.2], LOOP contributes 1.1x10⁻⁷/yr for the UK EPR. Assuming a LOOP frequency of 0.12/yr (based on Ref. A2.3) implies a CCDP of 9.17x10⁻⁷. However, it is assumed that this value takes credit for some recovery of off-site power, perhaps 0.1, but for external hazards this credit may not be valid. Omitting the credit for recovery of off-site power, i.e., dividing by 0.1, would lead to the stated CCDP of 9.17x10⁻⁶.
-- No sensitivity value
LOOP with DG failure
1.0 Seismic With the DGs failed it would require recovery of off-site power to prevent core damage. This is considered unlikely for an external hazard event, so the base assumption is a CCDP of 1.0.
0.5 The value of 0.5 is chosen on the basis of taking some, rather than no, credit for recovery but continuing to recognise that recovery is expected to be difficult in the case of an external hazard.
Note: alternatively, the value of 3.66x10⁻³ could be used (the TBD AFW value from the Korean event tree) which would illustrate the impact of different design approaches.
LMFW 7.1x10⁻⁷ Seismic, lightning
Based on average value from IAEA TECDOC-719, [Ref. A2.4], Table 2, (0.155) for the IE frequency and the EPR CDF of 1.1x10⁻⁷/yr from [Ref. A2.2] gives presented CCDP.
-- No sensitivity value – given this low CCDP, it is not expected that CDF contributions from damage states leading to LMFW as the IE would be important.
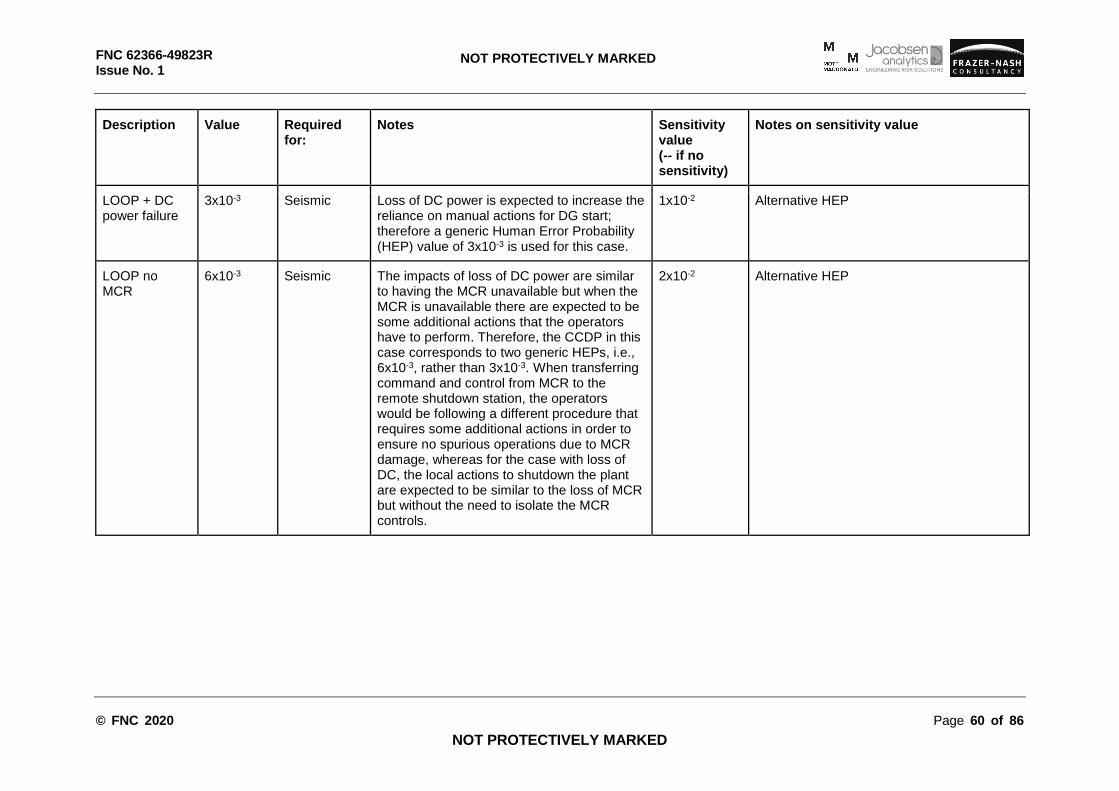
FNC 62366-49823R Issue No. 1
© FNC 2020 Page 60 of 86
NOT PROTECTIVELY MARKED
NOT PROTECTIVELY MARKED
Description Value Required for:
Notes Sensitivity value (-- if no sensitivity)
Notes on sensitivity value
LOOP + DC power failure
3x10⁻³ Seismic Loss of DC power is expected to increase the reliance on manual actions for DG start; therefore a generic Human Error Probability (HEP) value of 3x10⁻³ is used for this case.
1x10⁻² Alternative HEP
LOOP no MCR
6x10⁻³ Seismic The impacts of loss of DC power are similar to having the MCR unavailable but when the MCR is unavailable there are expected to be some additional actions that the operators have to perform. Therefore, the CCDP in this case corresponds to two generic HEPs, i.e., 6x10⁻³, rather than 3x10⁻³. When transferring command and control from MCR to the remote shutdown station, the operators would be following a different procedure that requires some additional actions in order to ensure no spurious operations due to MCR damage, whereas for the case with loss of DC, the local actions to shutdown the plant are expected to be similar to the loss of MCR but without the need to isolate the MCR controls.
2x10⁻² Alternative HEP
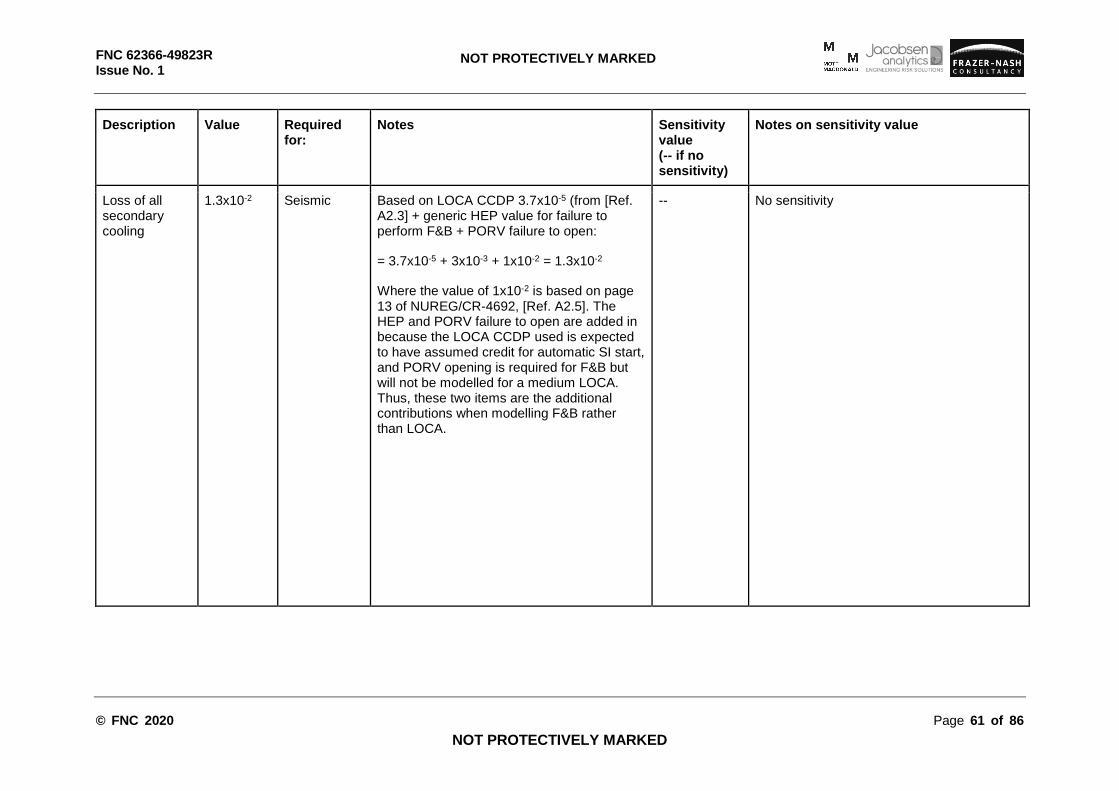
FNC 62366-49823R Issue No. 1
© FNC 2020 Page 61 of 86
NOT PROTECTIVELY MARKED
NOT PROTECTIVELY MARKED
Description Value Required for:
Notes Sensitivity value (-- if no sensitivity)
Notes on sensitivity value
Loss of all secondary cooling
1.3x10⁻² Seismic Based on LOCA CCDP 3.7x10⁻⁵ (from [Ref. A2.3] + generic HEP value for failure to perform F&B + PORV failure to open:
= 3.7x10⁻⁵ + 3x10⁻³ + 1x10-2 = 1.3x10⁻²
Where the value of 1x10⁻² is based on page 13 of NUREG/CR-4692, [Ref. A2.5]. The HEP and PORV failure to open are added in because the LOCA CCDP used is expected to have assumed credit for automatic SI start, and PORV opening is required for F&B but will not be modelled for a medium LOCA. Thus, these two items are the additional contributions when modelling F&B rather than LOCA.
-- No sensitivity
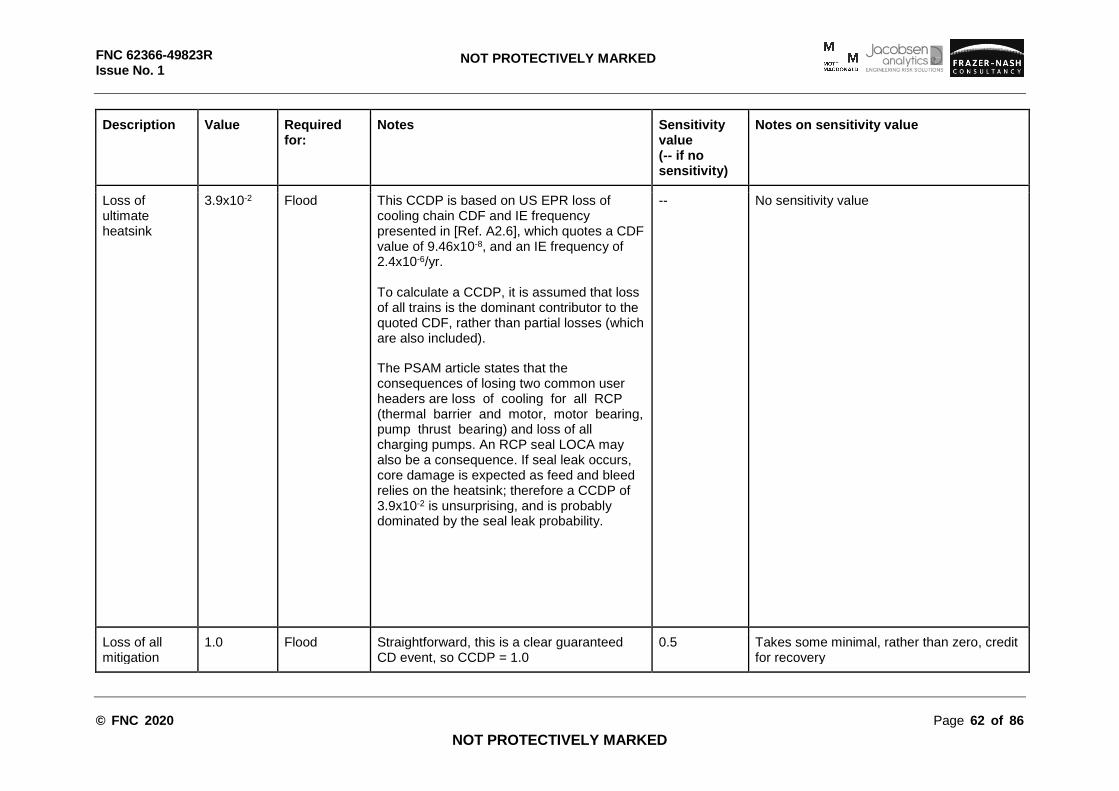
FNC 62366-49823R Issue No. 1
© FNC 2020 Page 62 of 86
NOT PROTECTIVELY MARKED
NOT PROTECTIVELY MARKED
Description Value Required for:
Notes Sensitivity value (-- if no sensitivity)
Notes on sensitivity value
Loss of ultimate heatsink
3.9x10⁻² Flood This CCDP is based on US EPR loss of cooling chain CDF and IE frequency presented in [Ref. A2.6], which quotes a CDF value of 9.46x10⁻⁸, and an IE frequency of 2.4x10⁻⁶/yr. To calculate a CCDP, it is assumed that loss of all trains is the dominant contributor to the quoted CDF, rather than partial losses (which are also included).
The PSAM article states that the consequences of losing two common user headers are loss of cooling for all RCP (thermal barrier and motor, motor bearing, pump thrust bearing) and loss of all charging pumps. An RCP seal LOCA may also be a consequence. If seal leak occurs, core damage is expected as feed and bleed relies on the heatsink; therefore a CCDP of 3.9x10⁻² is unsurprising, and is probably dominated by the seal leak probability.
-- No sensitivity value
Loss of all mitigation
1.0 Flood Straightforward, this is a clear guaranteed CD event, so CCDP = 1.0
0.5 Takes some minimal, rather than zero, credit for recovery
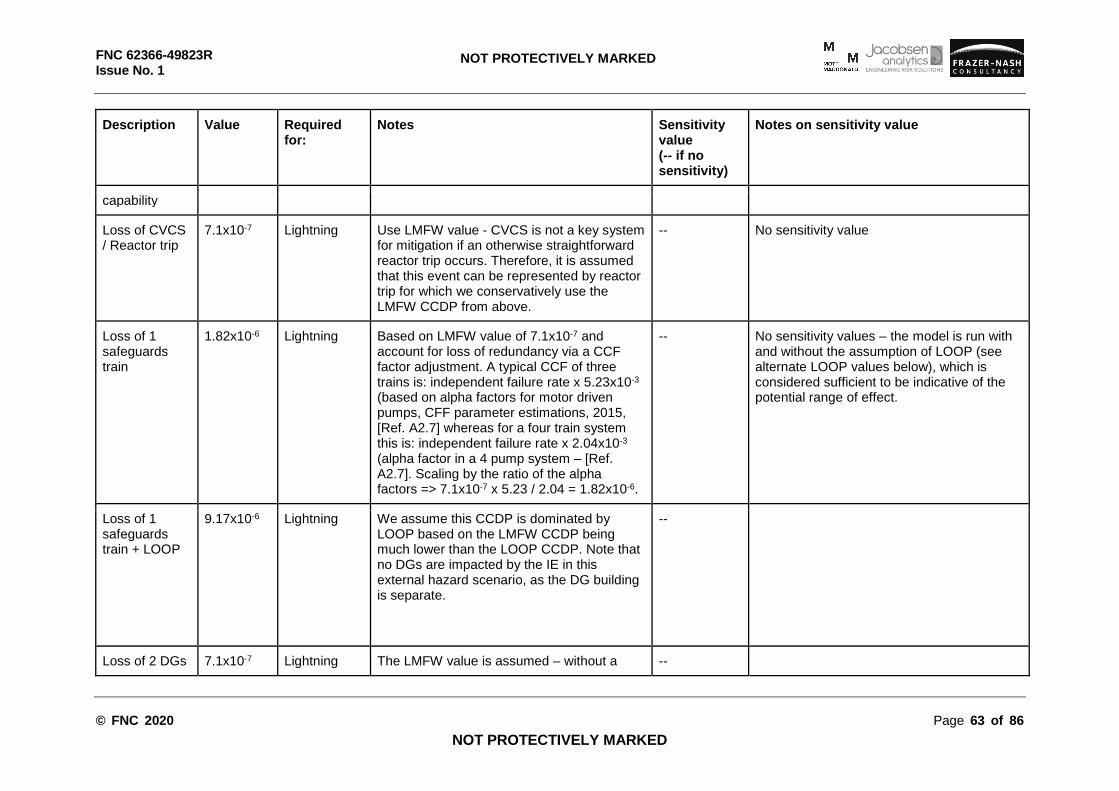
FNC 62366-49823R Issue No. 1
© FNC 2020 Page 63 of 86
NOT PROTECTIVELY MARKED
NOT PROTECTIVELY MARKED
Description Value Required for:
Notes Sensitivity value (-- if no sensitivity)
Notes on sensitivity value
capability
Loss of CVCS / Reactor trip
7.1x10⁻⁷ Lightning Use LMFW value - CVCS is not a key system for mitigation if an otherwise straightforward reactor trip occurs. Therefore, it is assumed that this event can be represented by reactor trip for which we conservatively use the LMFW CCDP from above.
-- No sensitivity value
Loss of 1 safeguards train
1.82x10⁻⁶ Lightning Based on LMFW value of 7.1x10⁻⁷ and account for loss of redundancy via a CCF factor adjustment. A typical CCF of three trains is: independent failure rate x 5.23x10⁻³ (based on alpha factors for motor driven pumps, CFF parameter estimations, 2015, [Ref. A2.7] whereas for a four train system this is: independent failure rate x 2.04x10⁻³ (alpha factor in a 4 pump system – [Ref. A2.7]. Scaling by the ratio of the alpha factors => 7.1x10-7 x 5.23 / 2.04 = 1.82x10⁻⁶.
-- No sensitivity values – the model is run with and without the assumption of LOOP (see alternate LOOP values below), which is considered sufficient to be indicative of the potential range of effect.
Loss of 1 safeguards train + LOOP
9.17x10⁻⁶ Lightning We assume this CCDP is dominated by LOOP based on the LMFW CCDP being much lower than the LOOP CCDP. Note that no DGs are impacted by the IE in this external hazard scenario, as the DG building is separate.
--
Loss of 2 DGs 7.1x10⁻⁷ Lightning The LMFW value is assumed – without a --
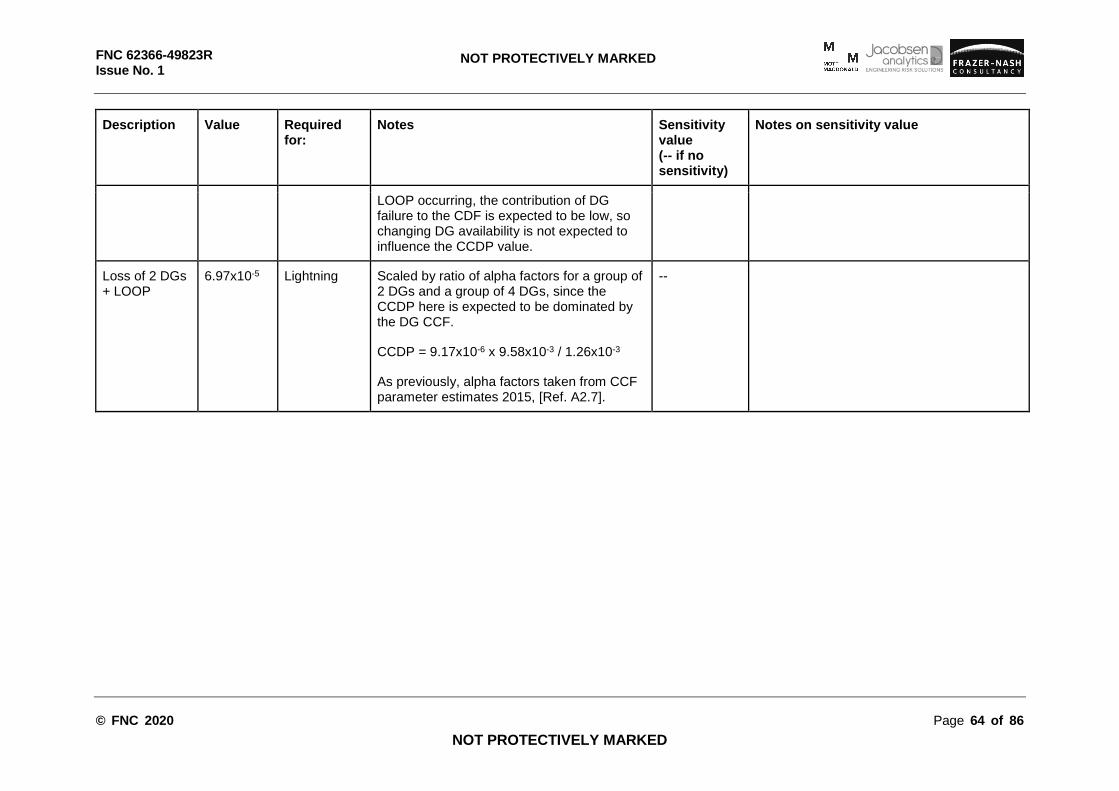
FNC 62366-49823R Issue No. 1
© FNC 2020 Page 64 of 86
NOT PROTECTIVELY MARKED
NOT PROTECTIVELY MARKED
Description Value Required for:
Notes Sensitivity value (-- if no sensitivity)
Notes on sensitivity value
LOOP occurring, the contribution of DG failure to the CDF is expected to be low, so changing DG availability is not expected to influence the CCDP value.
Loss of 2 DGs + LOOP
6.97x10⁻⁵ Lightning Scaled by ratio of alpha factors for a group of 2 DGs and a group of 4 DGs, since the CCDP here is expected to be dominated by the DG CCF.
CCDP = 9.17x10-6 x 9.58x10-3 / 1.26x10⁻³
As previously, alpha factors taken from CCF parameter estimates 2015, [Ref. A2.7].
--
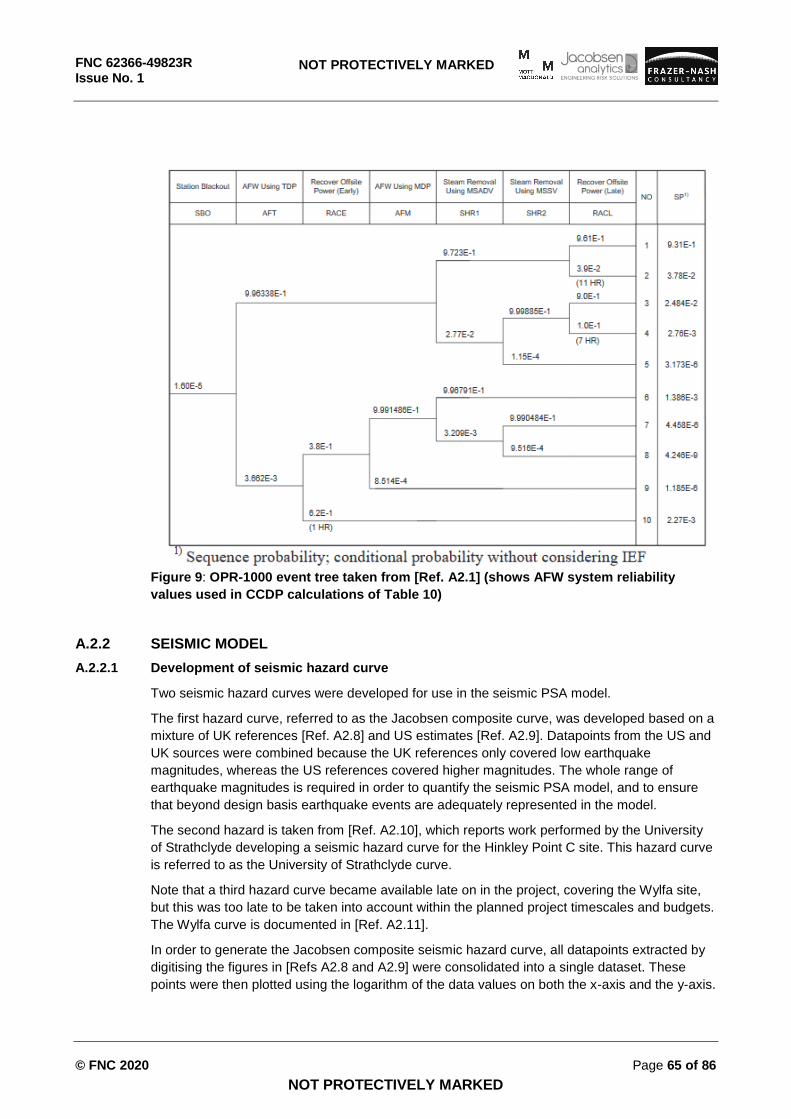
FNC 62366-49823R Issue No. 1
© FNC 2020 Page 65 of 86
NOT PROTECTIVELY MARKED
NOT PROTECTIVELY MARKED
Figure 9: OPR-1000 event tree taken from [Ref. A2.1] (shows AFW system reliability
values used in CCDP calculations of Table 10)
A.2.2 SEISMIC MODEL
A.2.2.1 Development of seismic hazard curve
Two seismic hazard curves were developed for use in the seismic PSA model.
The first hazard curve, referred to as the Jacobsen composite curve, was developed based on a
mixture of UK references [Ref. A2.8] and US estimates [Ref. A2.9]. Datapoints from the US and
UK sources were combined because the UK references only covered low earthquake
magnitudes, whereas the US references covered higher magnitudes. The whole range of
earthquake magnitudes is required in order to quantify the seismic PSA model, and to ensure
that beyond design basis earthquake events are adequately represented in the model.
The second hazard is taken from [Ref. A2.10], which reports work performed by the University
of Strathclyde developing a seismic hazard curve for the Hinkley Point C site. This hazard curve
is referred to as the University of Strathclyde curve.
Note that a third hazard curve became available late on in the project, covering the Wylfa site,
but this was too late to be taken into account within the planned project timescales and budgets.
The Wylfa curve is documented in [Ref. A2.11].
In order to generate the Jacobsen composite seismic hazard curve, all datapoints extracted by
digitising the figures in [Refs A2.8 and A2.9] were consolidated into a single dataset. These
points were then plotted using the logarithm of the data values on both the x-axis and the y-axis.
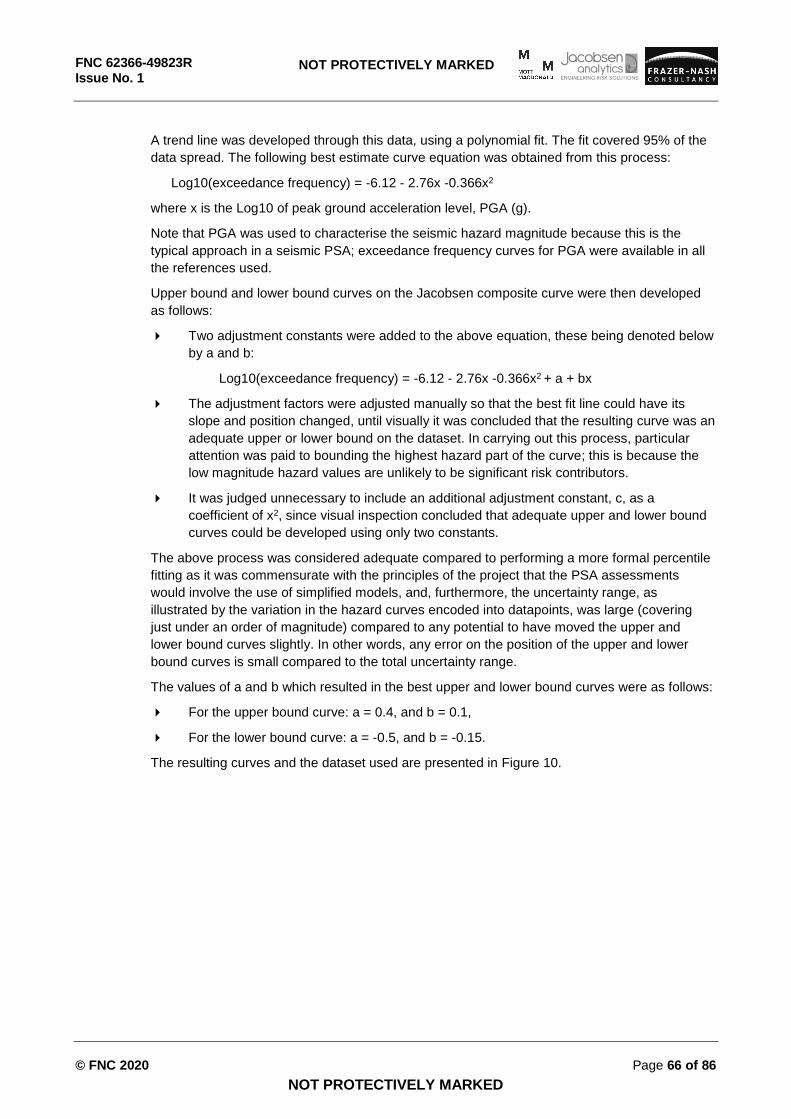
FNC 62366-49823R Issue No. 1
© FNC 2020 Page 66 of 86
NOT PROTECTIVELY MARKED
NOT PROTECTIVELY MARKED
A trend line was developed through this data, using a polynomial fit. The fit covered 95% of the
data spread. The following best estimate curve equation was obtained from this process:
Log10(exceedance frequency) = -6.12 - 2.76x -0.366x2
where x is the Log10 of peak ground acceleration level, PGA (g).
Note that PGA was used to characterise the seismic hazard magnitude because this is the
typical approach in a seismic PSA; exceedance frequency curves for PGA were available in all
the references used.
Upper bound and lower bound curves on the Jacobsen composite curve were then developed
as follows:
Two adjustment constants were added to the above equation, these being denoted below
by a and b:
Log10(exceedance frequency) = -6.12 - 2.76x -0.366x2 + a + bx
The adjustment factors were adjusted manually so that the best fit line could have its
slope and position changed, until visually it was concluded that the resulting curve was an
adequate upper or lower bound on the dataset. In carrying out this process, particular
attention was paid to bounding the highest hazard part of the curve; this is because the
low magnitude hazard values are unlikely to be significant risk contributors.
It was judged unnecessary to include an additional adjustment constant, c, as a
coefficient of x2, since visual inspection concluded that adequate upper and lower bound
curves could be developed using only two constants.
The above process was considered adequate compared to performing a more formal percentile
fitting as it was commensurate with the principles of the project that the PSA assessments
would involve the use of simplified models, and, furthermore, the uncertainty range, as
illustrated by the variation in the hazard curves encoded into datapoints, was large (covering
just under an order of magnitude) compared to any potential to have moved the upper and
lower bound curves slightly. In other words, any error on the position of the upper and lower
bound curves is small compared to the total uncertainty range.
The values of a and b which resulted in the best upper and lower bound curves were as follows:
For the upper bound curve: a = 0.4, and b = 0.1,
For the lower bound curve: a = -0.5, and b = -0.15.
The resulting curves and the dataset used are presented in Figure 10.
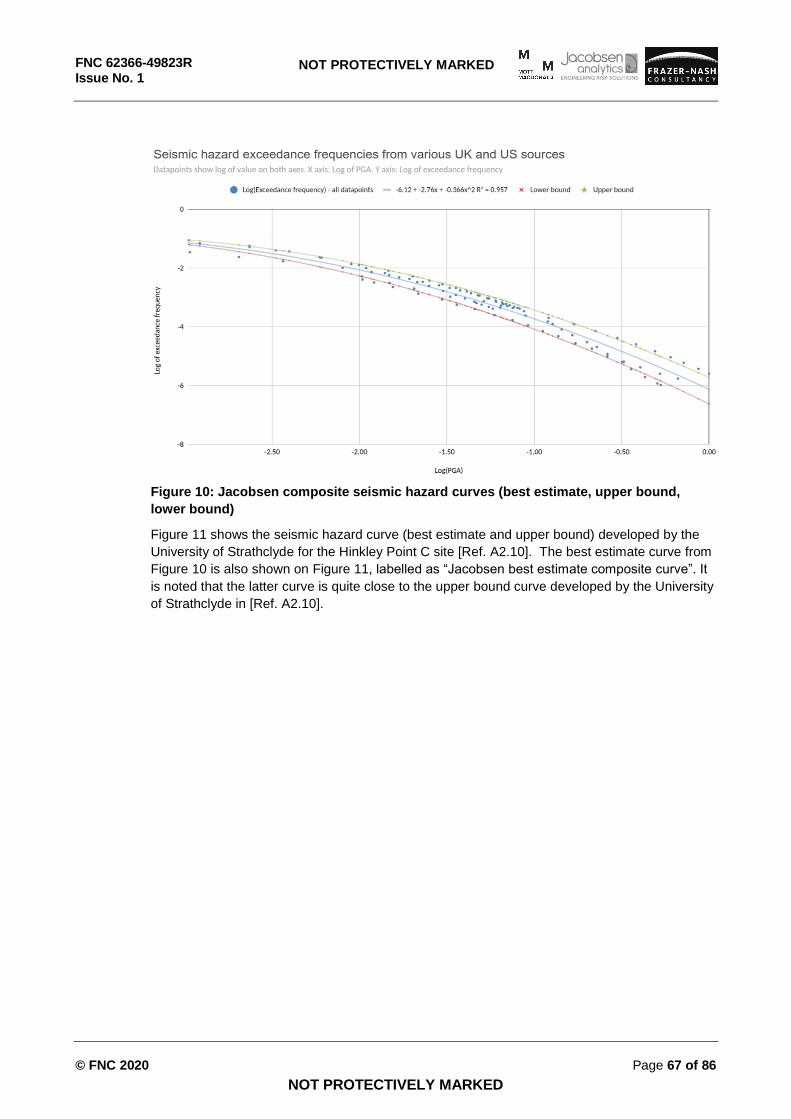
FNC 62366-49823R Issue No. 1
© FNC 2020 Page 67 of 86
NOT PROTECTIVELY MARKED
NOT PROTECTIVELY MARKED
Figure 10: Jacobsen composite seismic hazard curves (best estimate, upper bound,
lower bound)
Figure 11 shows the seismic hazard curve (best estimate and upper bound) developed by the
University of Strathclyde for the Hinkley Point C site [Ref. A2.10]. The best estimate curve from
Figure 10 is also shown on Figure 11, labelled as “Jacobsen best estimate composite curve”. It
is noted that the latter curve is quite close to the upper bound curve developed by the University
of Strathclyde in [Ref. A2.10].
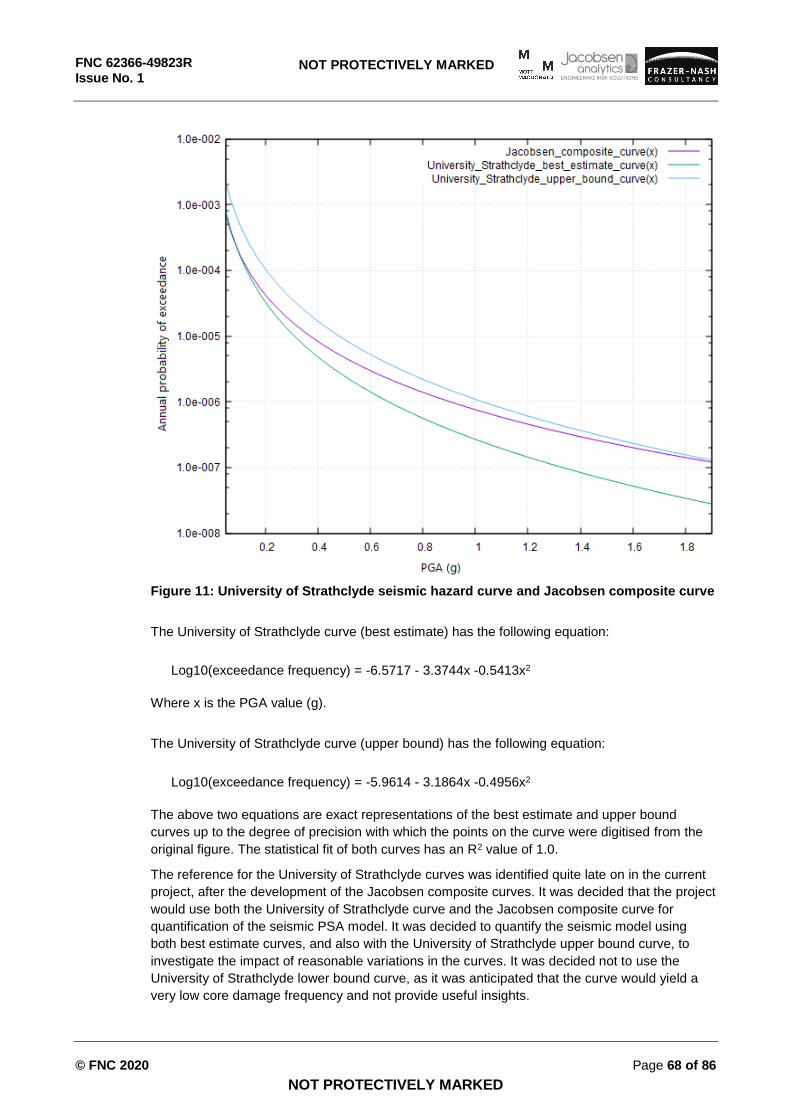
FNC 62366-49823R Issue No. 1
© FNC 2020 Page 68 of 86
NOT PROTECTIVELY MARKED
NOT PROTECTIVELY MARKED
Figure 11: University of Strathclyde seismic hazard curve and Jacobsen composite curve
The University of Strathclyde curve (best estimate) has the following equation:
Log10(exceedance frequency) = -6.5717 - 3.3744x -0.5413x2
Where x is the PGA value (g).
The University of Strathclyde curve (upper bound) has the following equation:
Log10(exceedance frequency) = -5.9614 - 3.1864x -0.4956x2
The above two equations are exact representations of the best estimate and upper bound
curves up to the degree of precision with which the points on the curve were digitised from the
original figure. The statistical fit of both curves has an R2 value of 1.0.
The reference for the University of Strathclyde curves was identified quite late on in the current
project, after the development of the Jacobsen composite curves. It was decided that the project
would use both the University of Strathclyde curve and the Jacobsen composite curve for
quantification of the seismic PSA model. It was decided to quantify the seismic model using
both best estimate curves, and also with the University of Strathclyde upper bound curve, to
investigate the impact of reasonable variations in the curves. It was decided not to use the
University of Strathclyde lower bound curve, as it was anticipated that the curve would yield a
very low core damage frequency and not provide useful insights.
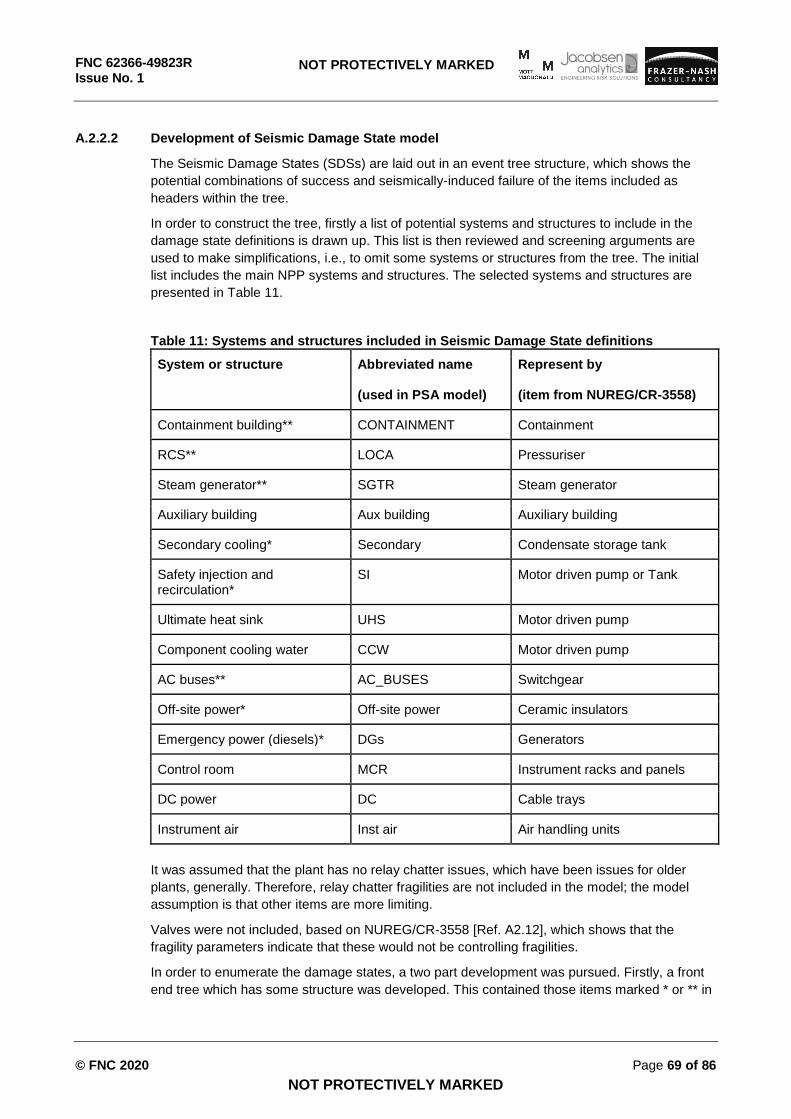
FNC 62366-49823R Issue No. 1
© FNC 2020 Page 69 of 86
NOT PROTECTIVELY MARKED
NOT PROTECTIVELY MARKED
A.2.2.2 Development of Seismic Damage State model
The Seismic Damage States (SDSs) are laid out in an event tree structure, which shows the
potential combinations of success and seismically-induced failure of the items included as
headers within the tree.
In order to construct the tree, firstly a list of potential systems and structures to include in the
damage state definitions is drawn up. This list is then reviewed and screening arguments are
used to make simplifications, i.e., to omit some systems or structures from the tree. The initial
list includes the main NPP systems and structures. The selected systems and structures are
presented in Table 11.
Table 11: Systems and structures included in Seismic Damage State definitions
System or structure Abbreviated name (used in PSA model)
Represent by (item from NUREG/CR-3558)
Containment building** CONTAINMENT Containment
RCS** LOCA Pressuriser
Steam generator** SGTR Steam generator
Auxiliary building Aux building Auxiliary building
Secondary cooling* Secondary Condensate storage tank
Safety injection and recirculation*
SI Motor driven pump or Tank
Ultimate heat sink UHS Motor driven pump
Component cooling water CCW Motor driven pump
AC buses** AC_BUSES Switchgear
Off-site power* Off-site power Ceramic insulators
Emergency power (diesels)* DGs Generators
Control room MCR Instrument racks and panels
DC power DC Cable trays
Instrument air Inst air Air handling units
It was assumed that the plant has no relay chatter issues, which have been issues for older
plants, generally. Therefore, relay chatter fragilities are not included in the model; the model
assumption is that other items are more limiting.
Valves were not included, based on NUREG/CR-3558 [Ref. A2.12], which shows that the
fragility parameters indicate that these would not be controlling fragilities.
In order to enumerate the damage states, a two part development was pursued. Firstly, a front
end tree which has some structure was developed. This contained those items marked * or ** in
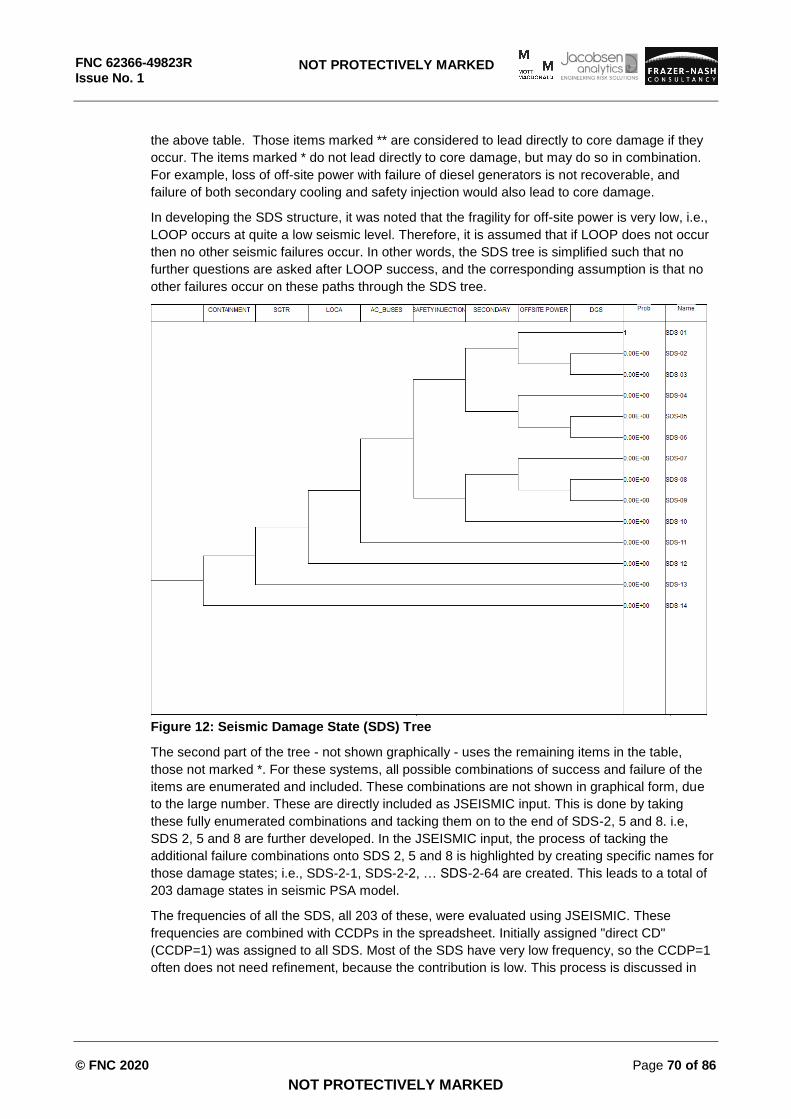
FNC 62366-49823R Issue No. 1
© FNC 2020 Page 70 of 86
NOT PROTECTIVELY MARKED
NOT PROTECTIVELY MARKED
the above table. Those items marked ** are considered to lead directly to core damage if they
occur. The items marked * do not lead directly to core damage, but may do so in combination.
For example, loss of off-site power with failure of diesel generators is not recoverable, and
failure of both secondary cooling and safety injection would also lead to core damage.
In developing the SDS structure, it was noted that the fragility for off-site power is very low, i.e.,
LOOP occurs at quite a low seismic level. Therefore, it is assumed that if LOOP does not occur
then no other seismic failures occur. In other words, the SDS tree is simplified such that no
further questions are asked after LOOP success, and the corresponding assumption is that no
other failures occur on these paths through the SDS tree.
Figure 12: Seismic Damage State (SDS) Tree
The second part of the tree - not shown graphically - uses the remaining items in the table,
those not marked *. For these systems, all possible combinations of success and failure of the
items are enumerated and included. These combinations are not shown in graphical form, due
to the large number. These are directly included as JSEISMIC input. This is done by taking
these fully enumerated combinations and tacking them on to the end of SDS-2, 5 and 8. i.e,
SDS 2, 5 and 8 are further developed. In the JSEISMIC input, the process of tacking the
additional failure combinations onto SDS 2, 5 and 8 is highlighted by creating specific names for
those damage states; i.e., SDS-2-1, SDS-2-2, … SDS-2-64 are created. This leads to a total of
203 damage states in seismic PSA model.
The frequencies of all the SDS, all 203 of these, were evaluated using JSEISMIC. These
frequencies are combined with CCDPs in the spreadsheet. Initially assigned "direct CD"
(CCDP=1) was assigned to all SDS. Most of the SDS have very low frequency, so the CCDP=1
often does not need refinement, because the contribution is low. This process is discussed in
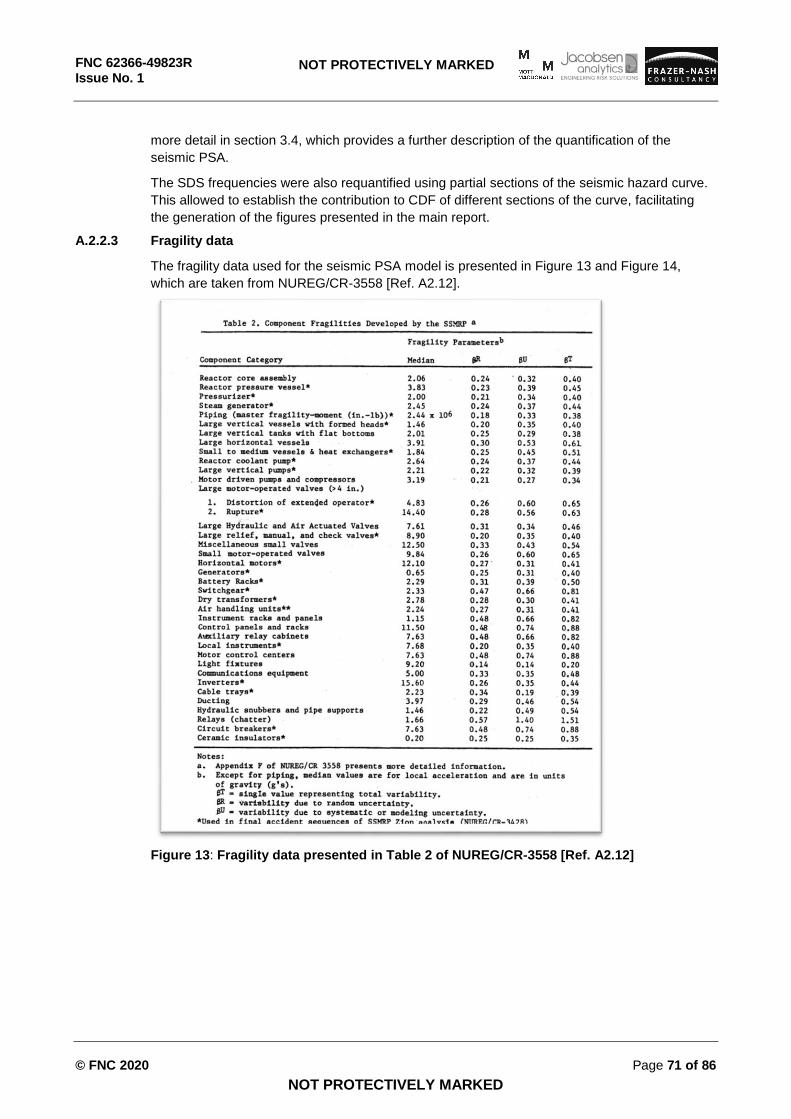
FNC 62366-49823R Issue No. 1
© FNC 2020 Page 71 of 86
NOT PROTECTIVELY MARKED
NOT PROTECTIVELY MARKED
more detail in section 3.4, which provides a further description of the quantification of the
seismic PSA.
The SDS frequencies were also requantified using partial sections of the seismic hazard curve.
This allowed to establish the contribution to CDF of different sections of the curve, facilitating
the generation of the figures presented in the main report.
A.2.2.3 Fragility data
The fragility data used for the seismic PSA model is presented in Figure 13 and Figure 14,
which are taken from NUREG/CR-3558 [Ref. A2.12].
Figure 13: Fragility data presented in Table 2 of NUREG/CR-3558 [Ref. A2.12]
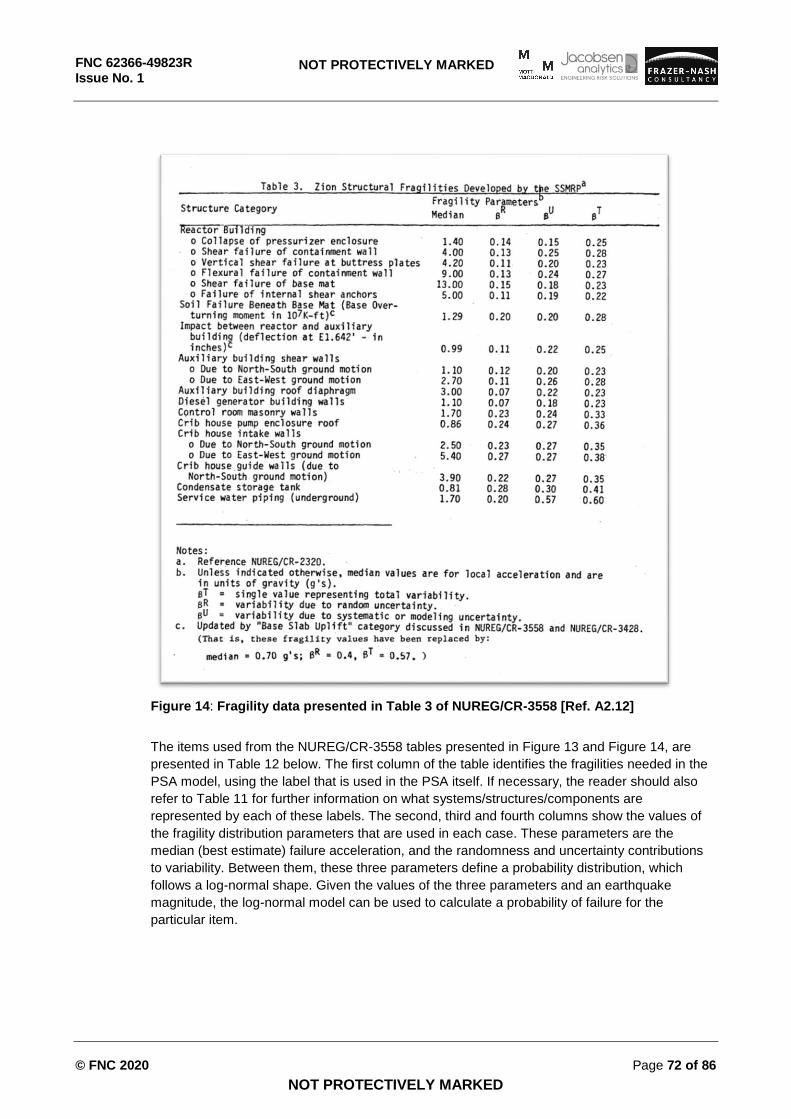
FNC 62366-49823R Issue No. 1
© FNC 2020 Page 72 of 86
NOT PROTECTIVELY MARKED
NOT PROTECTIVELY MARKED
Figure 14: Fragility data presented in Table 3 of NUREG/CR-3558 [Ref. A2.12]
The items used from the NUREG/CR-3558 tables presented in Figure 13 and Figure 14, are
presented in Table 12 below. The first column of the table identifies the fragilities needed in the
PSA model, using the label that is used in the PSA itself. If necessary, the reader should also
refer to Table 11 for further information on what systems/structures/components are
represented by each of these labels. The second, third and fourth columns show the values of
the fragility distribution parameters that are used in each case. These parameters are the
median (best estimate) failure acceleration, and the randomness and uncertainty contributions
to variability. Between them, these three parameters define a probability distribution, which
follows a log-normal shape. Given the values of the three parameters and an earthquake
magnitude, the log-normal model can be used to calculate a probability of failure for the
particular item.
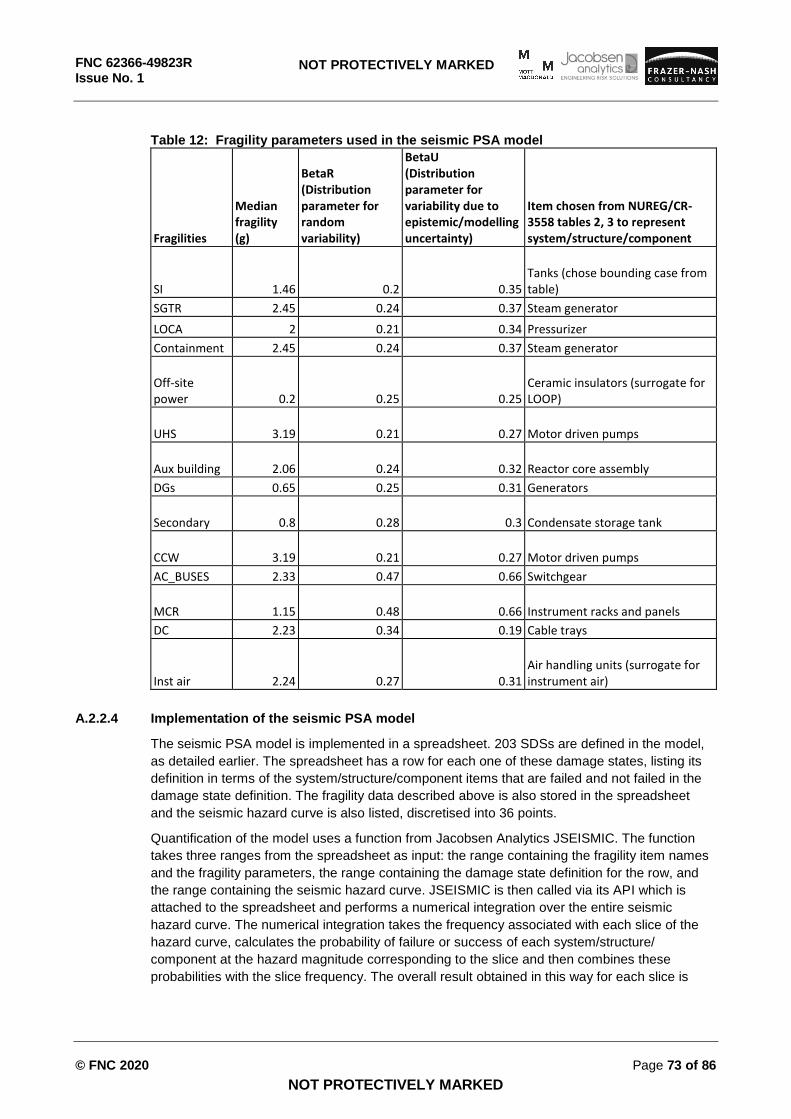
FNC 62366-49823R Issue No. 1
© FNC 2020 Page 73 of 86
NOT PROTECTIVELY MARKED
NOT PROTECTIVELY MARKED
Table 12: Fragility parameters used in the seismic PSA model
Fragilities
Median fragility (g)
BetaR (Distribution parameter for random variability)
BetaU (Distribution parameter for variability due to epistemic/modelling uncertainty)
Item chosen from NUREG/CR-3558 tables 2, 3 to represent system/structure/component
SI 1.46 0.2 0.35 Tanks (chose bounding case from table)
SGTR 2.45 0.24 0.37 Steam generator
LOCA 2 0.21 0.34 Pressurizer
Containment 2.45 0.24 0.37 Steam generator
Off-site power 0.2 0.25 0.25
Ceramic insulators (surrogate for LOOP)
UHS 3.19 0.21 0.27 Motor driven pumps
Aux building 2.06 0.24 0.32 Reactor core assembly
DGs 0.65 0.25 0.31 Generators
Secondary 0.8 0.28 0.3 Condensate storage tank
CCW 3.19 0.21 0.27 Motor driven pumps
AC_BUSES 2.33 0.47 0.66 Switchgear
MCR 1.15 0.48 0.66 Instrument racks and panels
DC 2.23 0.34 0.19 Cable trays
Inst air 2.24 0.27 0.31 Air handling units (surrogate for instrument air)
A.2.2.4 Implementation of the seismic PSA model
The seismic PSA model is implemented in a spreadsheet. 203 SDSs are defined in the model,
as detailed earlier. The spreadsheet has a row for each one of these damage states, listing its
definition in terms of the system/structure/component items that are failed and not failed in the
damage state definition. The fragility data described above is also stored in the spreadsheet
and the seismic hazard curve is also listed, discretised into 36 points.
Quantification of the model uses a function from Jacobsen Analytics JSEISMIC. The function
takes three ranges from the spreadsheet as input: the range containing the fragility item names
and the fragility parameters, the range containing the damage state definition for the row, and
the range containing the seismic hazard curve. JSEISMIC is then called via its API which is
attached to the spreadsheet and performs a numerical integration over the entire seismic
hazard curve. The numerical integration takes the frequency associated with each slice of the
hazard curve, calculates the probability of failure or success of each system/structure/
component at the hazard magnitude corresponding to the slice and then combines these
probabilities with the slice frequency. The overall result obtained in this way for each slice is
FNC 62366-49823R Issue No. 1
© FNC 2020 Page 74 of 86
NOT PROTECTIVELY MARKED
NOT PROTECTIVELY MARKED
then summed with the results of all the other slices, giving an overall frequency, which is the
damage state frequency. JSEISMIC returns this total frequency value to the spreadsheet.
The frequency of each damage state is then multiplied by the relevant CCDP value, which is the
one that corresponds to the probability of core damage occurring given the total set of damaged
items corresponding to the damage state.
Due to the large number of damage states (203) in the seismic model, a prioritisation and
refinement process was carried. The CCDP value for each damage state was initially set to 1.0.
The results were then reviewed, specifically focussing on damage states that contributed more
than 1x10⁻¹⁰/yr or 0.01% to the total calculated CDF value. Those damage states exceeding
these criteria were selected for refinement, i.e., more realistic CCDP values were looked for
these damage states. The rationale for using the values mentioned was that by refining the
treatment of damage states with values exceeding these values, it was possible to be confident
that the overall model would generate a CDF value where further refinement using stricter
criteria would not reduce the CDF value by more than 1%. At this point, any inaccuracy
introduced by the use of conservative CCDP values (of 1.0) on multiple damage states is
considered to be insignificant compared with the uncertainties from other sources. As an
example, if the overall result from the seismic PSA is ~1x10⁻⁶/yr (which is approximately what
the CDF proved to be when the model was quantified), then the use of a conservative CCDP
value of 1.0 on, e.g., 100 damage states with frequencies of 1x10⁻¹⁰/yr each, at most contributes
100 x 1x10-10 = 1x10⁻⁸ or 1% of 1x10⁻⁶, illustrating the rationale given previously.
The following CCDP values were used (for 10 damage states) in the seismic PSA model after
refinement:
LMFW is applied to SDS-01, where there are no seismically caused failures
LOOP is applied to SDS-02-64, where the seismically caused failure is a Loss of Off-site
Power and to SDS-08-64 where there is a loss of off-site power and failure of safety
injection caused by the seismic event. In the latter case, it is judged that the chosen
CCDP is appropriate because the failure probability of the secondary system, even
without feed and bleed backup, is considerably better than the LOOP CCDP value.
LOOP_NO_DC is applied for SDS-02-48 (loss of off-site power and failure of DC power).
LOOP_NO_MCR is applied to SDS-08-56 in which there is a loss of off-site power, failure
of safety injection and the MCR is unavailable. The choice of this CCDP is judged to be
valid because the CCDP value is substantially higher than the unreliability of the
secondary cooling systems, even without safety injection as backup. This CCDP is also
applied for SDS-02-56 in which loss of off-site power occurs and the MCR is not
available.
LOOP_NODGS is applied to SDS-03 in which off-site power is unavailable and the diesel
generators are failed. The CCDP value used exactly matches the damage state
definition.
LSECONDARY_ALL is used for SDS-05-64 in which secondary is failed and there is a
loss of off-site power. In applying this CCDP, it is assumed that the impact of the loss of
off-site power does not have a significant impact compared to the loss of secondary, on
the basis that the CCDP for a loss of secondary is far larger than that for LOOP,
indicating that the probability value is dominated for the former characteristic.
LSECONDARY_ALL is also applied for SDS-05-56 in which the MCR is also unavailable;
this is believed to be reasonable based on similar arguments. The application of
FNC 62366-49823R Issue No. 1
© FNC 2020 Page 75 of 86
NOT PROTECTIVELY MARKED
NOT PROTECTIVELY MARKED
LSECONDARY_ALL to SDS-04 is straightforward, since that damage state exactly
matches the definition of the CCDP value.
The remaining damage states used a CCDP of 1.0; this was judged to be an accurate choice for
7 damage states. Of the remaining 186 damage states, many are judged to be accurately
assigned CCDP values of 1.0, but many have not been reviewed and in a few cases the CCDP
applied is believed to be conservative, but a more accurate value was not available. Any
simplification in this latter set of damage states is considered unimportant because the total
CDF arising from these 186 damage states is <1x10⁻⁸/yr, which is well below 1% of the
calculated total CDF.
A.2.2.5 Seismic PSA model limitations and observations
The seismic hazard curves use peak ground acceleration to characterise the seismic hazard.
Spectral acceleration and UHS curves are not used. A reasonable effort was made to use
hazard curves representative of the UK, but the Wylfa curve reported in [Ref. A2.11] was not
used or compared to the curves that were used.
A full seismic PSA would use plant specific CCDP values generated from quantification of the
plant PSA model. This was not possible in the current effort. However, as described above, the
CCDP values are considered accurate enough to generate meaningful results and every effort
has been made to keep inaccuracies to a minimum.
In a full seismic PSA, plant specific human reliability analysis would be performed, and greater
attention would be paid to identifying the variation in human reliability values with earthquake
magnitude and a careful evaluation of inaccessibility issues caused by seismic damage would
be carried out.
Finally, a full seismic PSA would pay attention to the potential for (or potential for absence of)
correlation between the fragilities of systems/structures/components. Systems would be
represented by multiple key components rather than a single controlling component. The
potential impact of these issues on the results obtained has not been studied for this current
project.
A.2.3 EXTERNAL FLOODING MODEL
A.2.3.1 Hazard curve
Appendix 3 provides a summary of information extracted from NUREG/CR-5042 on external
flooding analysis for US NPPs and from a Wikipedia article on the 1999 Blayais flood (full
references to these items are provided in Appendix 3).
The flooding levels and exceedance frequencies presented in NUREG/CR-5042 (see Appendix
3 for discussion) indicate an approximate relationship between frequency and magnitude of a
20% to 22% increase in flooding level corresponding to a factor of 10 decrease in exceedance
frequency. In order to generate an external flooding hazard curve for us here, estimates of
specific levels and frequencies to use in conjunction with this approximate rule are based on the
Blayais event, which is used together with a reasoned argument. The summary of Appendix 3
suggests that for a French coastal site, a 5.15m (average of 5m to 5.3m range quoted in
Wikipedia article) flood could be a 1 in 100 year event, on the basis that it would seem unlikely
to observe such an event if its frequency was as low as 1 in 10000 years or even 1 in 1000
years. A full hazard curve is extrapolated from this point, as shown below.
Applying the 20% increase / 10x reduction in frequency obtained from NUREG/CR-5042, this
baseline value of a 1 in 100 years flooding being a 5.15m flood, would indicate the following
values:
FNC 62366-49823R Issue No. 1
© FNC 2020 Page 76 of 86
NOT PROTECTIVELY MARKED
NOT PROTECTIVELY MARKED
1x10⁻³/yr frequency for a 6.18m flood (6.18 = 5.15 x 1.2)
1x10⁻⁴/yr frequency for a 7.42m flood (7.42 = 6.18 x 1.2)
1x10⁻⁵/yr frequency for a 8.9m flood (8.9 = 7.42 x 1.2)
Note that the above points would appear broadly consistent with the decision to raise the flood
defences to 8m at Blayais after the experienced event, i.e., the flooding defences were
upgraded to give a margin of protection against design basis 1 in 10,000 year flood (which in
the above curve is a 7.42m flood).
Note also that it is believed that the absolute values used in the flood curve are not critical to the
conclusions of the work reported here, because, as will be discussed in the next section, it is not
in any case easy to match specific levels to specific equipment damage sets. It is however
possible to investigate how the damage levels influence the overall risk and breakdown of that
risk. This topic is mainly discussed in the main report, but is highlighted to the reader here.
A.2.3.2 Damage states for external flooding model
The Blayais event suggests that a flooding just beyond the design level of the plant is likely to
cause extensive system impacts, though not necessarily core damage directly. At risk systems,
based on the Blayais experience, are:
220kV and 400kV electric power (but not emergency diesel generators)
Essential service water system
The review of the EPR PCSR (Chapter 13.1 - see Appendix 3 for more detail and a full
reference) suggests that the following systems may be impacted:
Offsite power (essentially, equivalent to loss of 220kV and 400kV electric power)
Ultimate heatsink (similar impact to loss of ESW)
The above identified impacts are similar to those suggested for US NPPs in NUREG/CR-5042 -
i.e., LOOP and direct core damage at higher flood levels. Depending on the configuration of the
plant, loss of all ESW could be a direct core damage event. However, at Blayais, there was only
a partial loss of ESW.
The external flooding model developed for this current project therefore assumes the following
impacts of a flood with increasing level:
Within design basis - no impact, core damage does not occur;
First critical level - loss of off-site power occurs, but emergency diesels are not affected;
Second critical level - a loss of ultimate heatsink occurs together with the loss of off-site
power (diesels are not affected);
Third critical level - core damage occurs with a probability of 1.0 due to extensive system
damage (e.g., loss of off-site power, loss of heat sink and loss of diesels)
The third critical level is, of course, the highest level of flooding, the second critical level is lower
and so on. CCDP values are taken from Table 10 for implementation and quantification of the
model.
A.2.3.3 Implementation and quantification of the external flooding model
The external flooding model is encoded into a simple spreadsheet which lays out the hazard
curve and associates the different CCDPs, i.e., the different sets of equipment damage, with
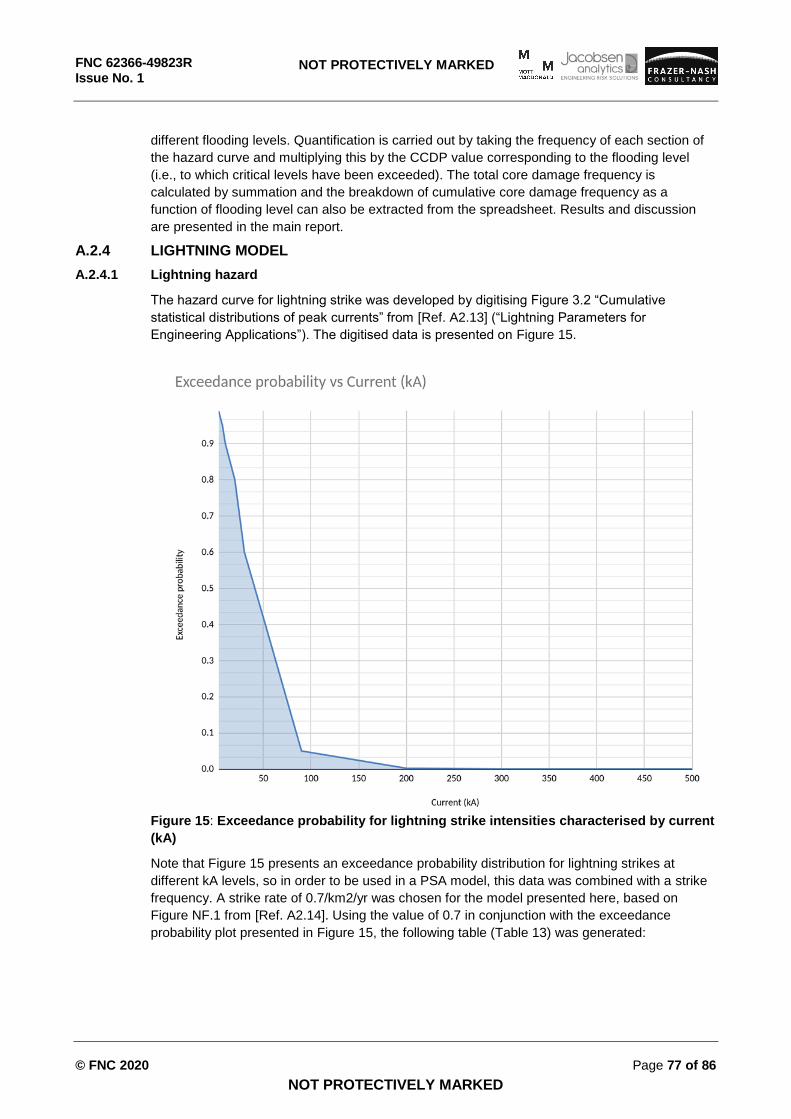
FNC 62366-49823R Issue No. 1
© FNC 2020 Page 77 of 86
NOT PROTECTIVELY MARKED
NOT PROTECTIVELY MARKED
different flooding levels. Quantification is carried out by taking the frequency of each section of
the hazard curve and multiplying this by the CCDP value corresponding to the flooding level
(i.e., to which critical levels have been exceeded). The total core damage frequency is
calculated by summation and the breakdown of cumulative core damage frequency as a
function of flooding level can also be extracted from the spreadsheet. Results and discussion
are presented in the main report.
A.2.4 LIGHTNING MODEL
A.2.4.1 Lightning hazard
The hazard curve for lightning strike was developed by digitising Figure 3.2 “Cumulative
statistical distributions of peak currents” from [Ref. A2.13] (“Lightning Parameters for
Engineering Applications”). The digitised data is presented on Figure 15.
Figure 15: Exceedance probability for lightning strike intensities characterised by current
(kA)
Note that Figure 15 presents an exceedance probability distribution for lightning strikes at
different kA levels, so in order to be used in a PSA model, this data was combined with a strike
frequency. A strike rate of 0.7/km2/yr was chosen for the model presented here, based on
Figure NF.1 from [Ref. A2.14]. Using the value of 0.7 in conjunction with the exceedance
probability plot presented in Figure 15, the following table (Table 13) was generated:
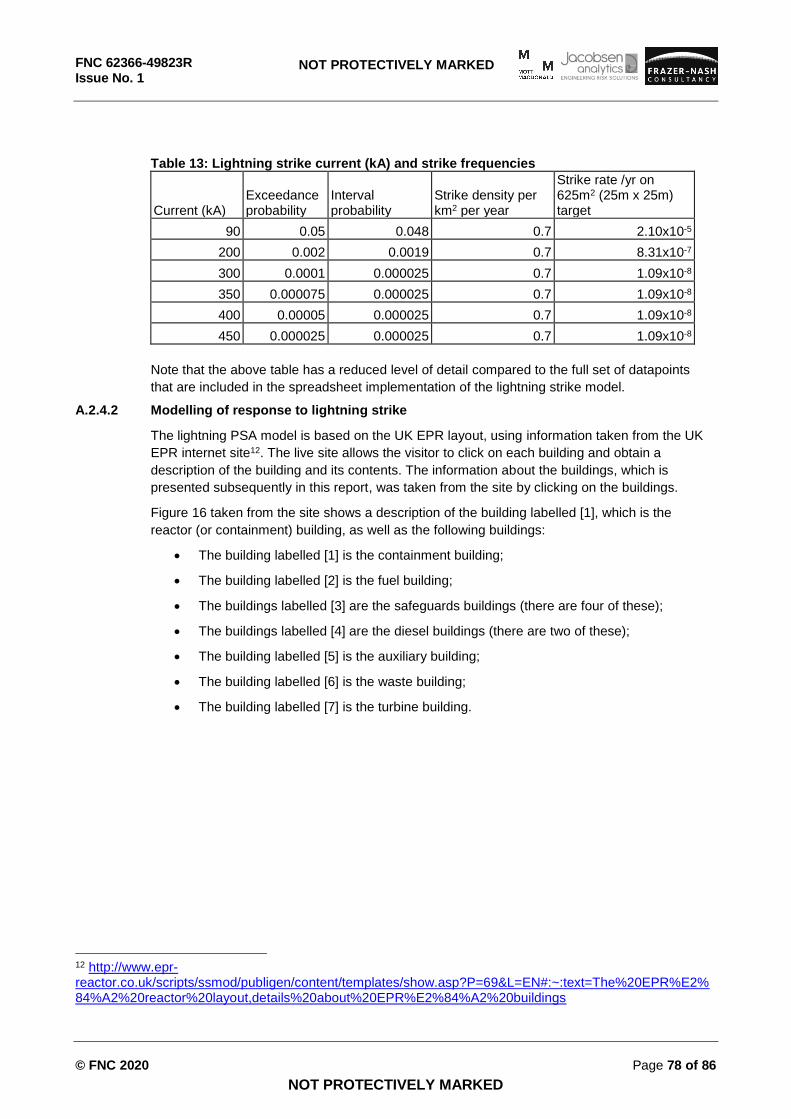
FNC 62366-49823R Issue No. 1
© FNC 2020 Page 78 of 86
NOT PROTECTIVELY MARKED
NOT PROTECTIVELY MARKED
Table 13: Lightning strike current (kA) and strike frequencies
Current (kA) Exceedance probability
Interval probability
Strike density per km2 per year
Strike rate /yr on 625m2 (25m x 25m) target
90 0.05 0.048 0.7 2.10x10⁻⁵
200 0.002 0.0019 0.7 8.31x10⁻⁷
300 0.0001 0.000025 0.7 1.09x10⁻⁸
350 0.000075 0.000025 0.7 1.09x10⁻⁸
400 0.00005 0.000025 0.7 1.09x10⁻⁸
450 0.000025 0.000025 0.7 1.09x10⁻⁸
Note that the above table has a reduced level of detail compared to the full set of datapoints
that are included in the spreadsheet implementation of the lightning strike model.
A.2.4.2 Modelling of response to lightning strike
The lightning PSA model is based on the UK EPR layout, using information taken from the UK
EPR internet site12. The live site allows the visitor to click on each building and obtain a
description of the building and its contents. The information about the buildings, which is
presented subsequently in this report, was taken from the site by clicking on the buildings.
Figure 16 taken from the site shows a description of the building labelled [1], which is the
reactor (or containment) building, as well as the following buildings:
The building labelled [1] is the containment building;
The building labelled [2] is the fuel building;
The buildings labelled [3] are the safeguards buildings (there are four of these);
The buildings labelled [4] are the diesel buildings (there are two of these);
The building labelled [5] is the auxiliary building;
The building labelled [6] is the waste building;
The building labelled [7] is the turbine building.
12 http://www.epr-reactor.co.uk/scripts/ssmod/publigen/content/templates/show.asp?P=69&L=EN#:~:text=The%20EPR%E2%84%A2%20reactor%20layout,details%20about%20EPR%E2%84%A2%20buildings
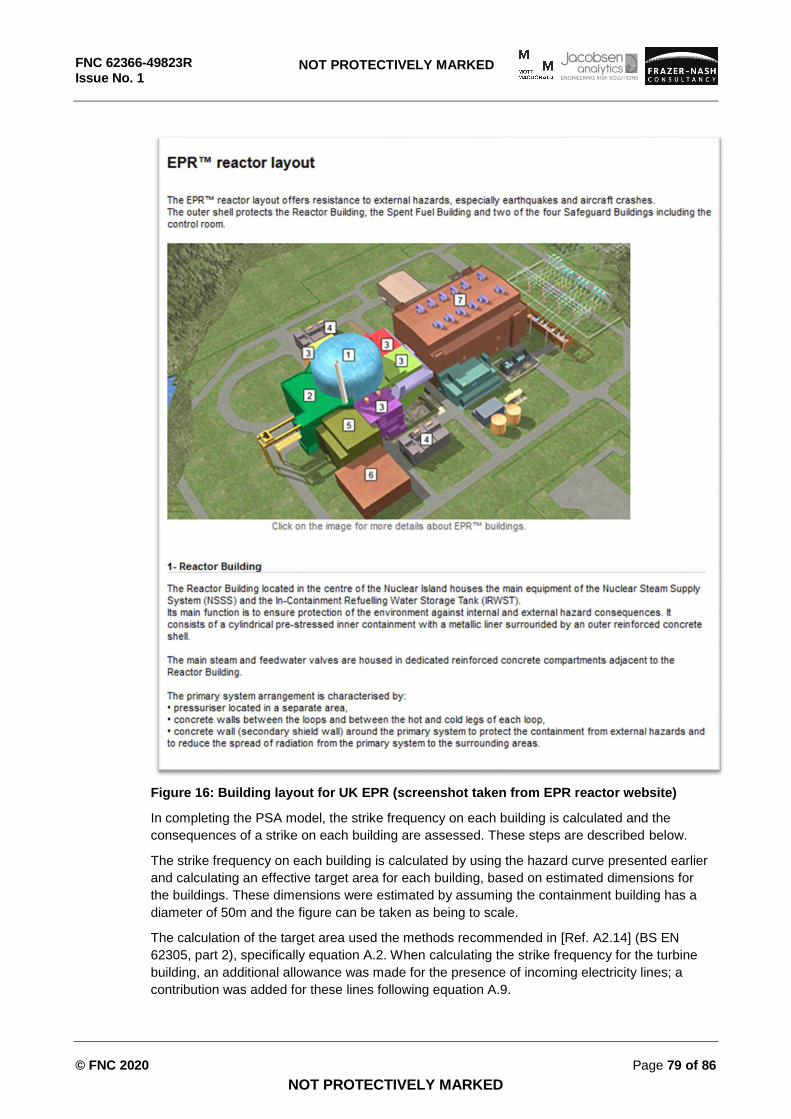
FNC 62366-49823R Issue No. 1
© FNC 2020 Page 79 of 86
NOT PROTECTIVELY MARKED
NOT PROTECTIVELY MARKED
Figure 16: Building layout for UK EPR (screenshot taken from EPR reactor website)
In completing the PSA model, the strike frequency on each building is calculated and the
consequences of a strike on each building are assessed. These steps are described below.
The strike frequency on each building is calculated by using the hazard curve presented earlier
and calculating an effective target area for each building, based on estimated dimensions for
the buildings. These dimensions were estimated by assuming the containment building has a
diameter of 50m and the figure can be taken as being to scale.
The calculation of the target area used the methods recommended in [Ref. A2.14] (BS EN
62305, part 2), specifically equation A.2. When calculating the strike frequency for the turbine
building, an additional allowance was made for the presence of incoming electricity lines; a
contribution was added for these lines following equation A.9.
FNC 62366-49823R Issue No. 1
© FNC 2020 Page 80 of 86
NOT PROTECTIVELY MARKED
NOT PROTECTIVELY MARKED
A factor Cd was applied to account for surrounding buildings. The values used were 0.75 for the
fuel and safeguards buildings, 0.625 for the diesel buildings, and 1.0 for the turbine building
(this being relatively isolated compared to the other buildings).
Strikes to the containment building, waste building and auxiliary building were not included in
the model, due to there being no relevant equipment that could be damaged in those buildings.
The containment building does not contain active safety equipment, rather, it contains pipework
that delivers feedwater, safety injection or other services. The only spurious actuation which
might be considered for the containment building would be opening of a PORV; however
opening of a PORV would be mitigated with relatively high reliability, being equivalent to a
LOCA (expected CCDP 1x10⁻⁴ or less) so it is considered this would not be a significant CDF
contributor. Furthermore, the containment building itself is an extremely robust building that
could be expected to be highly resistant to lightning strike. The containment structure is
reinforced concrete, containing large amounts of rebar, and substantial anchorage into the
ground, providing a conduction route to ground.
A.2.4.3 Equipment fragilities for lightning strike
A review of the UK EPR PCSR Chapter 13 indicated that the project used a 200kA design basis
level for lightning strike. Using the assumption that at the design basis lightning strike level a
0.02 probability of structure damage at the strike site can be applied, consistent with the values
presented in BS EN 63205 [Ref. A2.14] a fragility model for structural failure as a function of
strike magnitude was developed.
The PSA modelling assumes that the structure damage probability can be represented by a
fragility model which is adjusted such that the fragility distribution has a median strike current of
455kA and a log standard deviation of 0.4. Application of these values results in a failure
probability for a structure of 0.02 at the 200kA design level. In other words, it is assumed that if
the site is designed such that systems are conservatively qualified to 200kA, the best estimate
withstand capability would be 455kA, and that a continuous (lognormal) probability model
between those levels can be used. A similar approach was applied for the probability of system
damage as a function of strike magnitude; the log standard deviation value is also 0.4 in this
case but the median capacity is 505kA for the systems, since this calibrates the probability
scale to give a probability of system damage of 0.01 at the design level. This value of 0.01 is
consistent with the values presented for a well-designed, compliant, system in [Ref. A2.14].
A.2.4.4 Model implementation and quantification
In order to quantify the core damage frequency, an initiating event and impacts of lightning
strike were associated with each building considered in the model, based on the equipment
present in each building, as follows:
Lightning strikes on the fuel building potentially cause a reactor trip and loss of the CVCS
system;
Lightning strikes on a single safeguards buildings potentially cause loss of a single
safeguards train;
Lightning strikes on a diesel buildings potentially cause loss of 2 diesel generators;
Lightning strikes on the turbine building potentially cause a loss of off-site power.
According to the descriptions of the buildings taken from
Figure 16, no equipment having safety impacts on the reactor when operating at full power are
present in the auxiliary building or the waste building. The CCDPs applied for the above listed
building when the stated system damage occurs (as modelled using the fragility approach
FNC 62366-49823R Issue No. 1
© FNC 2020 Page 81 of 86
NOT PROTECTIVELY MARKED
NOT PROTECTIVELY MARKED
described in Section 5.3) are taken from Table 10 of Section A.2.1. Note that in each case,
there are two CCDP values, one with loss of off-site power also occurring (postulated due to the
weather conditions likely to accompany a lightning strike) and one without assuming loss of off-
site power (other than for turbine building strikes). The model was quantified twice using these
sets of CCDP values, once with and once without the assumption of loss of off-site power.
The entire model is implemented in a spreadsheet which contains the target area calculation, a
breakdown of the strike frequency into bands corresponding to different strike currents, the
factors for building shadowing, the fragility models for the system and structure damage
probabilities conditional on a lightning strike and the CCDP values applied for each building.
A.2.4.5 Limitations and observations
Propagation effects of building or system damage from one building to another are not
modelled. It is assumed that the individual buildings are well isolated from each other to a high
standard. The potential impact of this assumption has not been quantified.
Spalling, the generation of missiles due to lightning strikes, is not modelled. The rationale for
this simplification is that if a lightning strike occurs, the impacts of this on the building itself are
captured in the probabilities of structural damage and of damage to equipment housed within
the building. In other words, it is assumed that the probabilities applied include or bound this
effect on the building itself. Effects on other buildings are not included due to the limitation
identified in the first paragraph of this section.
FNC 62366-49823R Issue No. 1
© FNC 2020 Page 82 of 86
NOT PROTECTIVELY MARKED
NOT PROTECTIVELY MARKED
A.2.6 REFERENCES FOR APPENDIX 2
A2.1. Dong Gu Kang, Seung-Hoon Ahn (Korea Institute of Nuclear Safety) “Reevaluation of Station Blackout Risk of OPR-1000 Nuclear Power Plant Applying Combined Approach of Deterministic and Probabilistic Method” – Presented at NURETH-16, Chicago, IL, August 30-September 4, 2015.
A2.2. EDF and Areva, “UK EPR PCSR Chapter 15.7 – PSA Discussion and Conclusions”, UKEPR-0002-157 Issue 06, November 2012.
A2.3. AP1000 Design control document (Figure reproduced in hazards modelling spreadsheet, CCDPs worksheet)
A2.4. IAEA, “Defining initiating events for purposes of probabilistic safety assessment”, TECDOC-719, September, 1993.
A2.5. G. A. Murphy, J. W. Cletcher II, "Operating Experience Review of Failures of Power Operated Relief Valves and Block Valves in Nuclear Power Plants", NUREG/CR-4692, October, 1987.
A2.6. Ari Julin, Matti Lehto, Patricia Dupuy, Gabriel Georgescu, Jeanne-Marie Lanore, Shane Turner, Paula Calle Vives, Anne-Marie Grady, Hanh Phan, “Insights from PSA Comparison in Evaluation of EPR Designs”, presented at PSAM-12, Honolulu Hawaiie, June 2014.
A2.7. USNRC, "CCF Parameter Estimations, 2015 Update", October, 2016.
A2.8. RMW Musson and SL Sargeant, “Eurocode 8 seismic hazard zoning maps for the UK”, Seismology and Geomagnitism Programme, Technical Report CR/07/125, Issue 3, 2007.
A2.9. P. Hiland, Memorandum to B W Sheron, “Safety/Risk Assessment Results for Generic Issue 199 - Implications of Updated Probabilistic Seismic Hazard Estimates in Central and Eastern United States on Existing Plants”, Appendix B to Enclosure 1 “Seismic Hazard Estimates”, ML100270691, September 2010.
A2.10. Iain J.Tromansa, Guillermo Aldama-Bustosa ,John Douglasb, Angeliki Lessi-Cheimarioua, Simon Hunt, Manuela Davía, Roger M. W. Mussond, Graham Garrard, Fleur O. Strassere, Colin Robertso, “Probabilistic Seismic Hazard Assessment for a 1New-build Nuclear Power Plant Site in the UK”, manuscript, 2018. (Accessed at https://strathprints.strath.ac.uk/65059/1/Tromans_etal_BEE_2018_Probabilistic_seismic_hazard_assessment_for_a_new_build_nuclear_power_plant.pdf on 1 June 2020)
A2.11. Manuela Villani, Zygmunt Lubkowski, Matthew Free, Roger M. W. Musson, Barbara Polidoro, Rory McCully, Areti Koskosidi, Crispin Oakman, Tim Courtney, Martin Walsh, “A probabilistic seismic hazard assessment for Wylfa Newydd, a new nuclear site in the United Kingdom”, preprint, accepted for publication by Springer Nature, April, 2020.
A2.12. L.E. Cover, M.P. Bohn, R.D. Campbell, D.A. Wesley, “Handbook of Nuclear Power Plant Seismic Fragilities”, NUREG/CR-3558, June, 1985.
A2.13. Working group C4.407, “Lightning Parameters for Engineering Applications”, paper 549, 2013.
A2.14. British Standards Institute, “Protection against lightning - Part 2 Risk Management”, BS EN 63205, May 2012.
FNC 62366-49823R Issue No. 1
© FNC 2020 Page 83 of 86
NOT PROTECTIVELY MARKED
NOT PROTECTIVELY MARKED
A.3 APPENDIX 3 – SUMMARY OF US ANALYSIS ON EXTERNAL FLOODS
NUREG/CR-5042 [Ref.A3.1] has been reviewed and provides some useful information as
summarised below. The NUREG includes discussion of external flooding analysis at a number
of US NPPs, with some specific cases being more useful than others - the most useful cases
are summarised below.
The discussion of an assessment performed for Peach Bottom indicated that the design based
flooding level was 2.57m (the NUREG actually cites levels in imperial units, but the levels have
been converted to SI units for use here). The ground floor level in the turbine and auxiliary
building was cited as being 2.44m.
The discussion for Turkey Point indicates that three scenarios were analysed. This is helpful as
it aligns to the approach discussed for our current project. Two scenarios lead to recoverable
Loss of Off-site Power conditions (with different recovery factors) and a third scenario was
considered to be non-recoverable, i.e., direct core damage. Various statements in the NUREG
indicate a degree of consensus about how external flooding hazard frequencies scale with
flooding level. An indicative figure of 20% increase in flooding level corresponding to a 10x
reduction in frequency is given. This is also reflected in specific numbers given for Turkey Point
(page 5-21 of the NUREG). A frequency of 2x10⁻⁴/yr is given for a 5.49m flood, and a frequency
of 6x10⁻⁵/yr is given for a 6.1m flood. These values imply that a 22% increase in the flood height
would correspond to a factor ten decrease in the exceedance frequency, this being reasonably
consistent with the other values indicated in the NUREG.
A.3.1 REVIEW OF UK EPR PCSR INFORMATION SUGGESTED AT 23 APRIL MEETING
Some information relating to UK new build designs is available online relating to external
hazards, specifically Chapter 13.1 of the UK EPR PCSR, [Ref.A3.2], which covers external
hazards. The information in this UK EPR PCSR chapter is mostly qualitative.
The qualitative information extracted from Chapter 13 of the UK EPR PCSR identifies coastal
flooding (combination of high tide and storm surge/barometric effects/seiche), tsunami, estuary
flooding, high waves, floods arising from structure deterioration, heavy rainfall and groundwater
level changes. The text of the reference suggests that Loss of Off-site Power or Loss of
Ultimate Heatsink are the main initiating events that are considered13. This is in line with the US
analyses listed above.
The protections described for the UK EPR against external flooding are platform level and
volumetric protection, fixed and mobile protection devices, water drainage system, and
embankment or seawall protection. Safety classified equipment is located above the maximum
safety water level plus a margin. It is inferred from this that there is a level of flooding against
which the plant is protected, but beyond that level safety system operation would appear to
degrade quickly. This is suggestive of there being a cliff edge effect for external flooding.
The UK EPR documentation also indicates that planned steps on external flooding are to define
reference levels for safety system damage, develop a hypothetical flooding hazard curve, and to
define bins and bin frequencies based on the previous two items. There is no quantitative
information in the UK EPR online documentation relating to an external flooding hazard curve.
13 The term initiating event is added here - the assessment in Chapter 13 of UK EPR PCSR is not a PSA assessment.
FNC 62366-49823R Issue No. 1
© FNC 2020 Page 84 of 86
NOT PROTECTIVELY MARKED
NOT PROTECTIVELY MARKED
A.3.2 BLAYAIS NPP 1999 EVENT
A (presumably) well known external flooding event occurred at Blayais NPP in France on
December 27, 1999. This event, and issues surrounding it, is described in some detail in a
Wikipedia article, [Ref.A3.3]. Some key points are extracted from that article are as follows:
At the time of the flooding event, Unit 3 was shut down for refuelling; the other three units
were operating at full power.
A combination of the incoming tide and exceptionally high winds produced by Storm
Martin caused a sudden rise of water in the estuary, flooding parts of the plant. This
began at around 7:30 pm, two hours before high tide. At this time, all four units lost their
225 kV power supplies, while units 2 and 4 also lost their 400 kV power supplies.
Runback to self consumption levels failed at units 2 and 4, so they were left without
normal electricity supplies, which led to trip and a demand for diesel backup generator
start.
The diesels supplied Units 2 and 4 until the 400 kV supply was restored at around 10:20
pm.
The water level from the flood ultimately reached between 5.0 m and 5.3 m above NGF
(reference zero level in France - understood to be broadly equivalent to sea level). There
was some damage to the sea wall facing the Gironde. The upper portion of the rock
armour was also washed away.
At unit 1, one pair (out of two pairs) of ESW pumps failed due to flooding.
Following the events at Blayais, the French rules for evaluating external flood were updated: in
addition to river flood, dam failure, tide, storm surge and tsunami, which were already covered
by the rules, a further eight factors added to the rules. These factors were (1) waves caused by
wind on the sea, (2) waves caused by wind on river or channel, (3) swelling due to the operation
of valves or pumps, (4) deterioration of water retaining structures (other than dams), (5) circuit
or equipment failure, (6) brief and intense rainfall on site, (7) regular and continuous rainfall on
site, and (8) rises in groundwater. The rules were also updated to require consideration of
realistic combinations of factors.
A.3.2.1 Sea defences at Blayais
The sea walls were originally 4.75m above NGF at the lowest point. In 1998, an annual review
of plant safety had identified the need for the sea walls to be raised to 5.7 m above NGF14. It is
stated in the Wikipedia article that EDF had postponed the work until 2002.
Following the 1999 event, sea walls were eventually raised to an even higher level, this being
8.0 m above NGF (3.25 m higher than before). Various openings were also sealed to prevent
water ingress.
14 Note that this is a 20% increase in the design level - suggesting that perhaps analysis had established that the design basis flood defence level was wrong by a factor of 10, in frequency terms (i.e., using the approximate 20% height to 10x frequency reduction relation suggested by NUREG/CR-5042).
FNC 62366-49823R Issue No. 1
© FNC 2020 Page 85 of 86
NOT PROTECTIVELY MARKED
NOT PROTECTIVELY MARKED
A.3.3 REFERENCES FOR APPENDIX 3
A3.1. C. Y. Kimura, R. J. Budnitz, “Evaluation of External Hazards to Nuclear Power Plants in the United States”, NUREG/CR-5042, December, 1987.
A3.2. Areva and EDF, “PCSR – Sub-chapter 13.1 – External Hazards Protection”, UKEPR-0002-131 Issue 06, November 2012. Accessed at http://www.epr-reactor.co.uk/ssmod/liblocal/docs/PCSR/Chapter%2013%20-%20Hazards%20Protection/Sub-Chapter%2013.1%20-%20External%20Hazards%20Protection.pdf
A3.3. Wikipedia article on the 1999 Blayais Nuclear Power Plant flood, accessed on 2 June 2020 at https://en.wikipedia.org/wiki/1999 Blayais Nuclear Power Plant flood
NOT PROTECTIVELY MARKED
NOT PROTECTIVELY MARKED
Frazer-Nash Consultancy Ltd 5th Floor Malt Building Wilderspool Business Park Greenalls Avenue Warrington WA4 6HL T +44 (0)1925 404000 F +44 (0)1925 404001 www.fnc.co.uk