Embed Size (px)
Citation preview
Introduction
The essence of sugar refining involves removing the non-sucroseimpurities, which include both particulates and soluble contaminants,followed by crystallization of product from the mother liquor. Whilesolid-liquid separation processes such as filtration and clarificationremove the largest mass of impurities, the final purification is doneby physical adsorption on a carbon-based material. Historically, bonechar provided this final purification. Modern industrial options nowinclude granular activated carbon, powdered activated carbon and ionexchange resin-based processes.
As summarized in the 11th edition of the Cane Sugar Handbook:
Decolorization is the key process in refining sugar. Of all the dif-ferences between raw and refined sugar, color is the one proper-ty that is immediately obvious and can be easily measured. ….
When a sugar chemist says “color” he means “colorant”, thematerial causing the color. ….
The decolorization process actually removes more than colorbecause colorants interact with color precursors, colloidal mate-rials, organic non-sugars, and ash-forming inorganic constituentsso they are taken out with the color. (Carpenter, 1985)
While it often goes under-appreciated, decolorization actuallyencompasses the removal of spurious odor and taste compounds, inaddition to visible color. Decolorization renders the granulatedsucrose stable for long-term storage and reliably reproducible in awide variety of food and cooking applications.
As noted above, the ultimate purification step in sugar refining isphysical adsorption of the color bodies onto a carbon-based adsor-bent, typically activated carbon or ion exchange resin. Physicaladsorption implies that the color bodies transfer from the bulk solu-
Understanding activated carbon reactivation and low-temperature regeneration technology
By Hugh McLaughlin
151 Hill Road, Groton, MA 01450-1609, USA Tel: +1 978-448-6066, Fax: +1 978-448-6414, E-mail: [email protected]
Abstract
Activated carbon is one of the mainstay technologies for the decolorization of raw sugar to produce refined sugar products. Thispaper discusses issues relevant to the application of granular activated carbon in the sugar refining industries. The topics coveredinclude evaluating the performance of recycled adsorbents, the evolution of activated carbon properties during initial activationand reactivation, and a review of analytical methods for measuring adsorption properties. The second half of the paper explores anew lower temperature process being developed for the regeneration of spent sugar decolorization activated carbon. In particular,the features and performance of this regeneration approach are evaluated against “high-temperature reactivation”, which is thedominant practice in the sugar industry today. The paper concludes with a discussion of the energy requirements and capital costsof low-temperature regeneration and high-temperature reactivation.
tion into the internal surfaces of the adsorbent, but the color bodiesremain chemically unchanged. While the effect of the adsorbent onthe sugar solutions is conceptually straightforward, in that unwantedcompounds are removed from the aqueous sucrose solution, theimpacts and consequences of the adsorption step on the adsorbent areconsiderably more complex.
Once the adsorbent has accumulated its capacity for adsorbablecompounds, it is termed “spent” and must be replaced with freshadsorbent. Exiting the adsorption process, after sweetening-off, anyspent adsorbent consists mainly of the original adsorbent and theaccumulated color bodies.
One option for spent adsorbent is disposal after a single adsorp-tion cycle. This is the typical industrial practice when using pow-dered activated carbon. While powdered activated carbon is probablythe least expensive adsorbent to purchase on a unit-weight basis, dis-posal after a single decolorizing cycle generally results in higheroperating costs than other adsorption media that can be regeneratedand reused. Furthermore, the spent powdered media with color bod-ies represents a continuing environmental concern, since the colorbodies are subject to biological degradation, which can lead to odorissues and water contamination concerns.
For granular activated carbon and ion exchange resins, regenera-tion and reuse is the industrial norm. It should be noted that regener-ation speaks to the impact on the adsorbent – recovering some or allof the adsorption capacity – and does not specify the impact on thepreviously adsorbed color bodies.
In the case of ion exchange resins, the regeneration process des-orbs the color bodies into another aqueous solution – and the dispos-al of this “spent regenerant” solution must be addressed. Dependingon the local circumstances, the outlet may be a POTW (PubliclyOwned Treatment Works), a dedicated on-site treatment capability ordischarge untreated into receiving waters. While the last practice maybe exceptionally cost-effective, the deterioration of the local water-
ways is often undeniable and unacceptable over the long term.When granular activated carbon is utilized for color removal, the
subsequent regeneration process typically results in the destruction ofthe color bodies. The most prevalent industrial practice is termed“high-temperature reactivation” and is usually performed in multiplehearth furnaces or rotary kilns. The process is called “reactivation”because the regeneration conditions mirror the original conditionsutilized during the manufacture of the virgin activated carbon in the“activation” step.
Another option for the regeneration of spent granular activatedcarbon is termed “low-temperature regeneration” also referred to as“CarbOxLT” in the literature. This approach is a recently developedoption that appears to have significant advantages over traditional“high-temperature reactivation” and these features will be exploredlater in this paper.
In order to explore the technical and operational considerationsinvolved in the regeneration of spent granular activated carbon, it isnecessary to develop a framework for evaluating the performance ofa regenerable and reusable adsorbent. After establishing this frame-work for the current practice in the real world application of sugardecolorization, the performance advantages of low-temperatureregeneration over high-temperature reactivation will be discussed.
Understanding and evaluating the performance of recycled adsor-bents
Before delving into the specific differences in the regenerationoptions, it is useful to understand the interactions that occur betweenthe effectiveness of the regeneration process and the make up rate ofvirgin activated carbon. The current industrial practice is to add vir-gin carbon to “make up” the amount of carbon in circulation to a con-stant volume, in order to keep the adsorbers full during the decol-orization process. Hence, there is a tendency to consider the rate of
0.00
10.00
20.00
30.00
40.00
50.00
60.00
70.00
80.00
90.00
100.00
0.00% 1.00% 2.00% 3.00% 4.00% 5.00% 6.00% 7.00% 8.00% 9.00% 10.00%
Capacity loss per cycle
Po
ol
ca
pa
cit
y a
s %
of
Vir
gin
GA
C a
ds
orp
tio
n
10.00%
8.00%
6.00%
4.00%
2.00%
Make Upper cycle
10.00%
2.00%
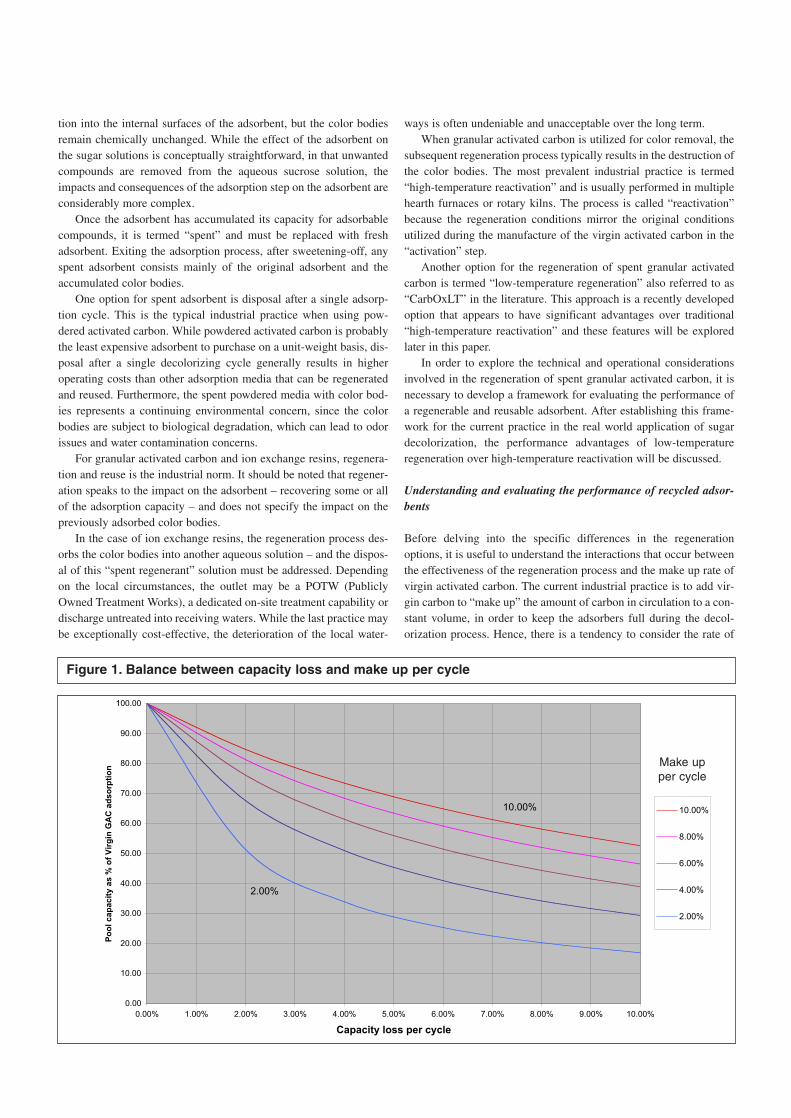
Figure 1. Balance between capacity loss and make up per cycle
Make upper cycle
virgin carbon addition to be a measure of the total losses that occurduring the regeneration process.
Unfortunately, this is misleading. Another significant loss duringregeneration is the loss of adsorption capacity per unit volume of car-bon. This loss is much harder to evaluate and generally is not measuredduring the routine operation of a carbon adsorption system. However, ifthis capacity loss were not occurring, then the “pool” of circulating car-bon would have the same adsorption capacity per unit volume as virginactivated carbon – which is simply not observed in actual practice.
The circulating carbon pool generally exhibits 50% to 75% of vir-gin activated carbon capacity – based on testing of samples of industri-al pool carbons. This loss of capacity phenomenon is not well docu-mented in the literature, although it is discussed by Hutchins (1973) inan article comparing the performance of bituminous coal carbons to lig-nite carbons.
The capacity loss per cycle for an individual carbon particle dependson many variables, as discussed by Hutchins (1973). However, since thepool carbon consists of carbons added as make up over many cycles, theoverall effect is a relatively constant loss of adsorption capacity peradsorption-regeneration cycle (due to the averaging of the different agecarbons present).
This behavior can be modeled for a given circulating pool of acti-vated carbon. One first assumes a prescribed loss of adsorption capaci-ty per regeneration cycle. Then, one reduces the amount of material percycle by the make up rate and then adds back of the same amount of vir-gin carbon. Repeating the process calculates the evolution of the adsorp-tion capacity of the pool carbon for each regeneration cycle. By numer-ically calculating the effect of a large number of iterations, the steady-state properties of the pool carbon can be calculated. The results of sucha simulation are shown in Figure 1.
Figure 1 shows some very interesting trends. For the hypothetical“perfect” regeneration, where the regenerated carbon is returned to vir-gin carbon adsorption capacity or a capacity loss of 0% per cycle, thepool capacity remains at 100% of virgin, independent of make up rate.For any significant capacity losses, 2% per cycle or more, the poolcapacity is significantly less than virgin and very sensitive to make uprate. For any non-zero capacity loss per cycle, the greater the make up,the greater the pool capacity, since the make up carbon is virgin carbon
with 100% capacity.One real world situation that demonstrates how sensitive the pool
capacity is to the combination of capacity loss and make up rate is thecase of under-reactivation in the multiple hearth due to insufficientsteam. The effect is to regenerate with a higher capacity loss, sincechar is left in the carbon (as will be discussed later), but reduces theamount of make up carbon necessary. For the case of low steamingrates, it is possible to have 6% capacity loss per cycle and 4% makeup rate. In contrast, higher steaming rates would likely produce 4%capacity loss per cycle, but require 6% make up rates.
As shown on Figure 1, the lower steaming rate and associated 6%per regeneration capacity loss results in a pool capacity of only 40%of virgin carbon capacity; whereas the higher steaming rate results in60% of virgin capacity. Thus, the higher steaming rate yields regen-erated carbon with 50% higher adsorption capacity per adsorptioncycle, which directly translates into the amount of sugar refinedbefore the carbon becomes spent and must be regenerated.
One straightforward but computationally complex exercise is tooptimize the performance of the pool carbon based on the incrementalcost of reactivation, make up carbon, and operating costs for the adsorp-tion cycle. Such an analysis is unique to each individual industrial site,since the operating costs are site specific, but yields great insight into thepreferred operating practices of both the adsorbers and the reactivationfacilities. It is not unrealistic to identify a 25% reduction in direct oper-ating costs of the combined systems based on revising the operating set-points of an existing high-temperature reactivation facility.
Exploring the high temperature reactivation process
The most prevalent sugar industry practice for regenerating spent gran-ular activated carbon is termed “high-temperature reactivation” and isusually performed in multiple hearth furnaces or rotary kilns. As dis-cussed, the granular activated carbon adsorbent is recycled to “extinc-tion”. As such, the activated carbon “pool” consists of a small percent-age of virgin make up carbon, typically 3 to 5% per cycle, and recycledregenerated carbon. Thus, the key to understanding the properties of thepool carbon lies in understanding the impact of reactivation on the spentactivated carbon.
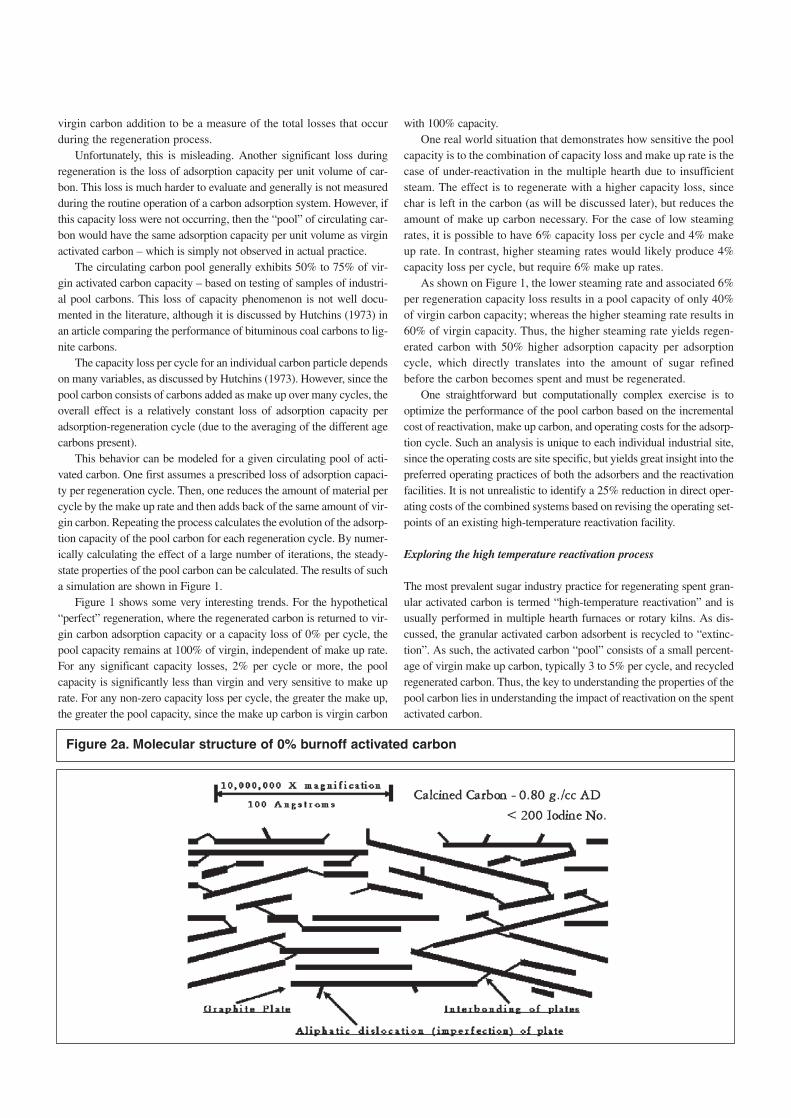
Figure 2a. Molecular structure of 0% burnoff activated carbon
The effect of activation on the internal structure of virgin activatedcarbon
Reactivation shares operating conditions and equipment with the“activation” process originally used to manufacture the virgin adsor-bent. As such, there is merit to briefly reviewing how the activationconditions create activated carbon.
Activated carbon manufacturing involves conditioning a carbon-rich starting material to remove the non-carbon atoms through aseries of steps involving drying, devolatilization and calcining. Thefeed to the activation step is the calcined raw material, meaning thatthe starting material has been heated above 800°C in an oxygen-freeenvironment. These conditions drive off all volatiles, including resid-ual oxygen and hydrogen, and produce graphite plates that form the
internal structure of the activated carbon particles.The key difference between the calcining step and the activation
step is the presence of an oxidizing gas, either steam or carbon diox-ide. The most popular choice is steam, which undergoes the “watergas” reaction with carbon to produce hydrogen and carbon monox-ide. On a molecular level, the oxidizing gas produces a gradual anduniform removal of the graphitic backbone as the activation processprogresses.
Figures 2a (Greenbank, 2002) shows the starting calcined rawmaterial and Figure 2b shows the effect of “activating”, where theinternal adsorption sites are modified by the activation process. Fourmain trends are occurring simultaneously as internal carbon atomsare removed from the individual particle: the particle density isdecreasing; the volume of adsorption sites is increasing; the energy of
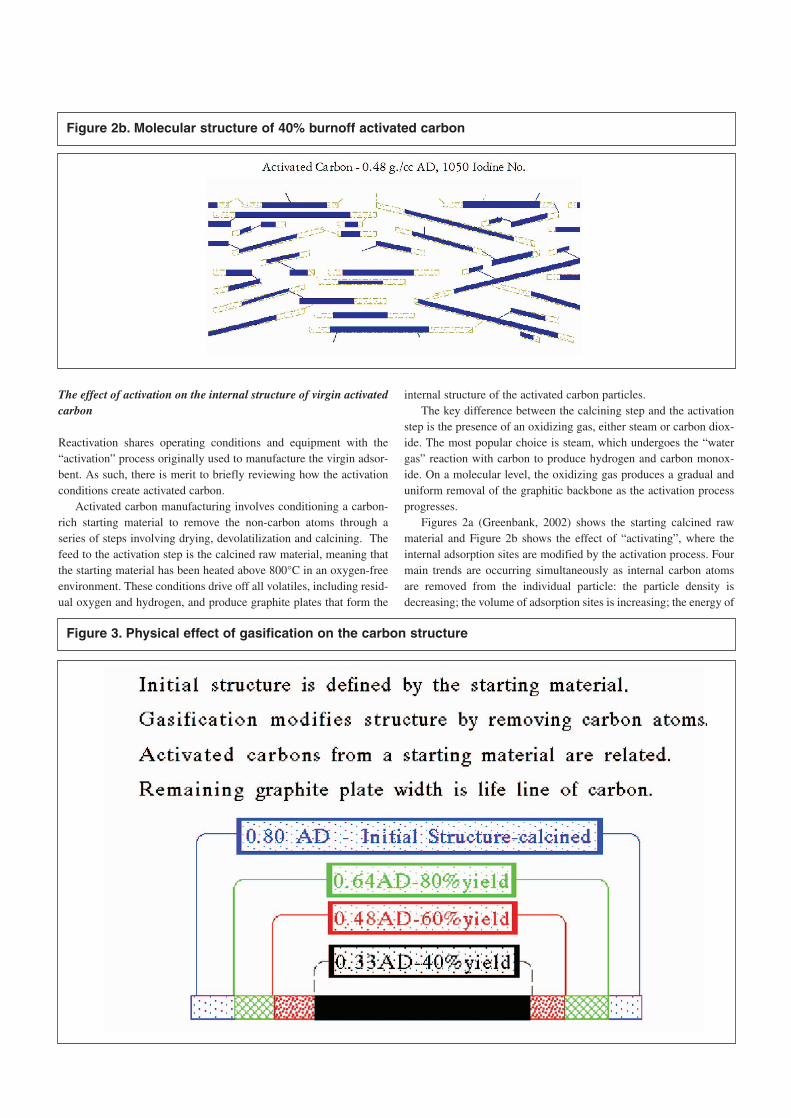
Figure 2b. Molecular structure of 40% burnoff activated carbon
Figure 3. Physical effect of gasification on the carbon structure
the individual adsorption sites is decreasing; and the yield of product,on a weight basis, is decreasing.
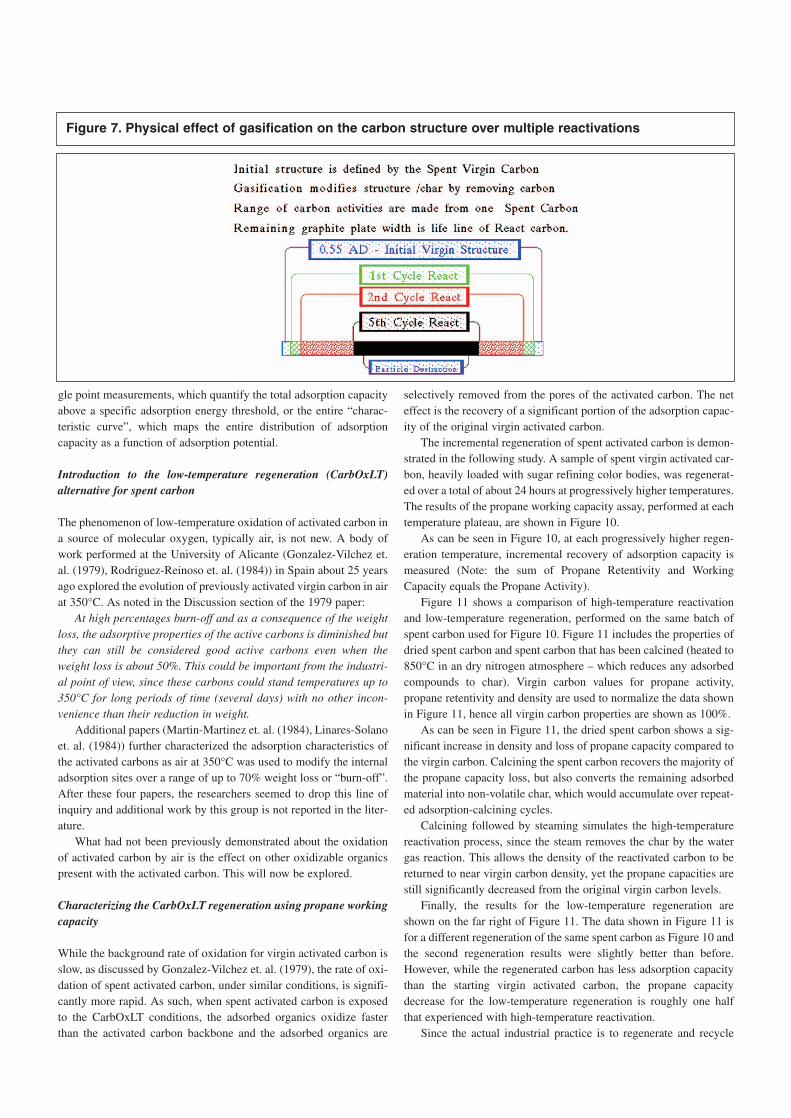
One way of envisioning this progression is shown in Figure 3(Greenbank, 2002), where the effect of the activation process in anindividual graphite plate is depicted. Since the graphite plate is thestructural backbone of the carbon particle, there is a limit to thereduction of the plate width – which is the mechanical failure of theparticle. This concern will reappear during the discussion of high-temperature reactivation that follows.
The effect of reactivation on the internal structure of spent carbon
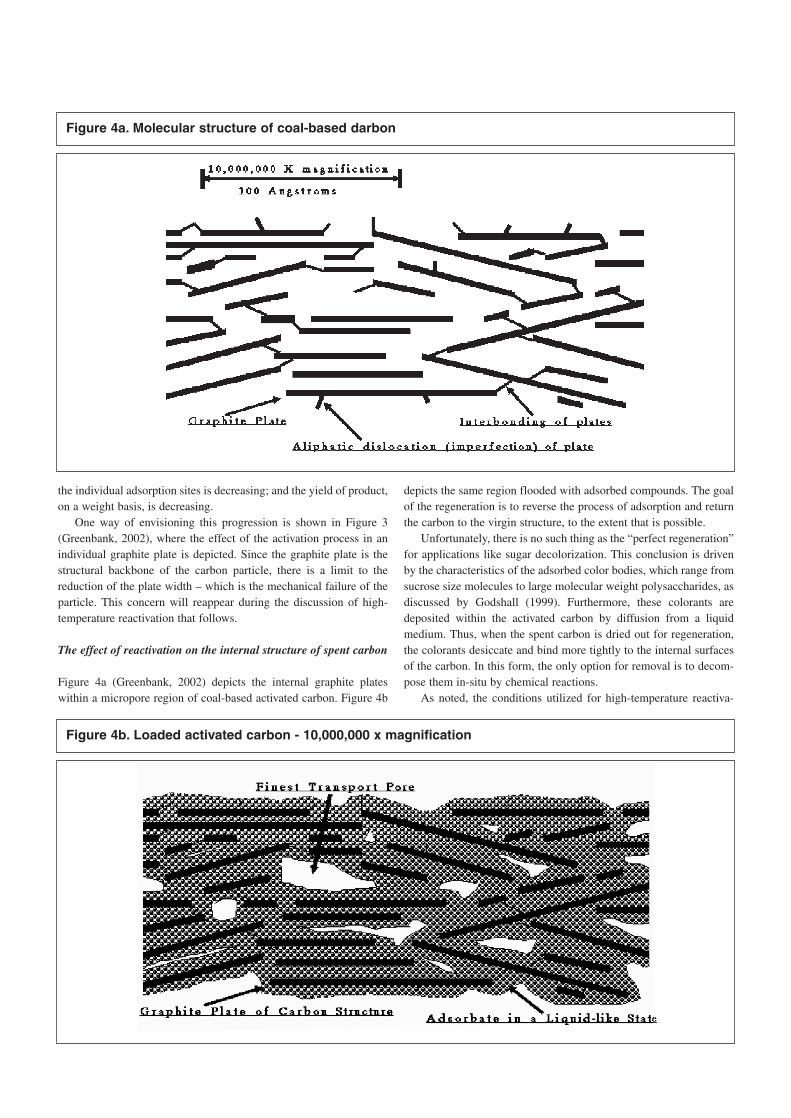
Figure 4a (Greenbank, 2002) depicts the internal graphite plateswithin a micropore region of coal-based activated carbon. Figure 4b
depicts the same region flooded with adsorbed compounds. The goalof the regeneration is to reverse the process of adsorption and returnthe carbon to the virgin structure, to the extent that is possible.
Unfortunately, there is no such thing as the “perfect regeneration”for applications like sugar decolorization. This conclusion is drivenby the characteristics of the adsorbed color bodies, which range fromsucrose size molecules to large molecular weight polysaccharides, asdiscussed by Godshall (1999). Furthermore, these colorants aredeposited within the activated carbon by diffusion from a liquidmedium. Thus, when the spent carbon is dried out for regeneration,the colorants desiccate and bind more tightly to the internal surfacesof the carbon. In this form, the only option for removal is to decom-pose them in-situ by chemical reactions.
As noted, the conditions utilized for high-temperature reactiva-
Figure 4a. Molecular structure of coal-based darbon
Figure 4b. Loaded activated carbon - 10,000,000 x magnification
tion parallel those used for the original activation of the virgin car-bon. However, the starting material is spent carbon, which differsfrom the starting material for activated carbon by the presence of theadsorbed color bodies. As the spent carbon is heated in the absenceof oxygen, the effect on the graphitic backbone of the carbon is neg-ligible, since the original manufacturing process encountered theseconditions previously. The impact on the adsorbed color bodies is adifferent story – they dehydrate, devolatilize and form a residualmaterial that is called “char”.
Char, which results from the thermal decomposition of theadsorbed color bodies, and the graphitic backbone of the activatedcarbon itself are chemically identical but physically very different.Because of this chemical equivalence, char reacts similarly to the
graphitic plates of the activated carbon itself under the gasificationconditions, which is basically the same “water gas” reactions previ-ously encountered during the activation process. As such, duringreactivation, both the char and the graphitic backbone of the carbonare gasified.
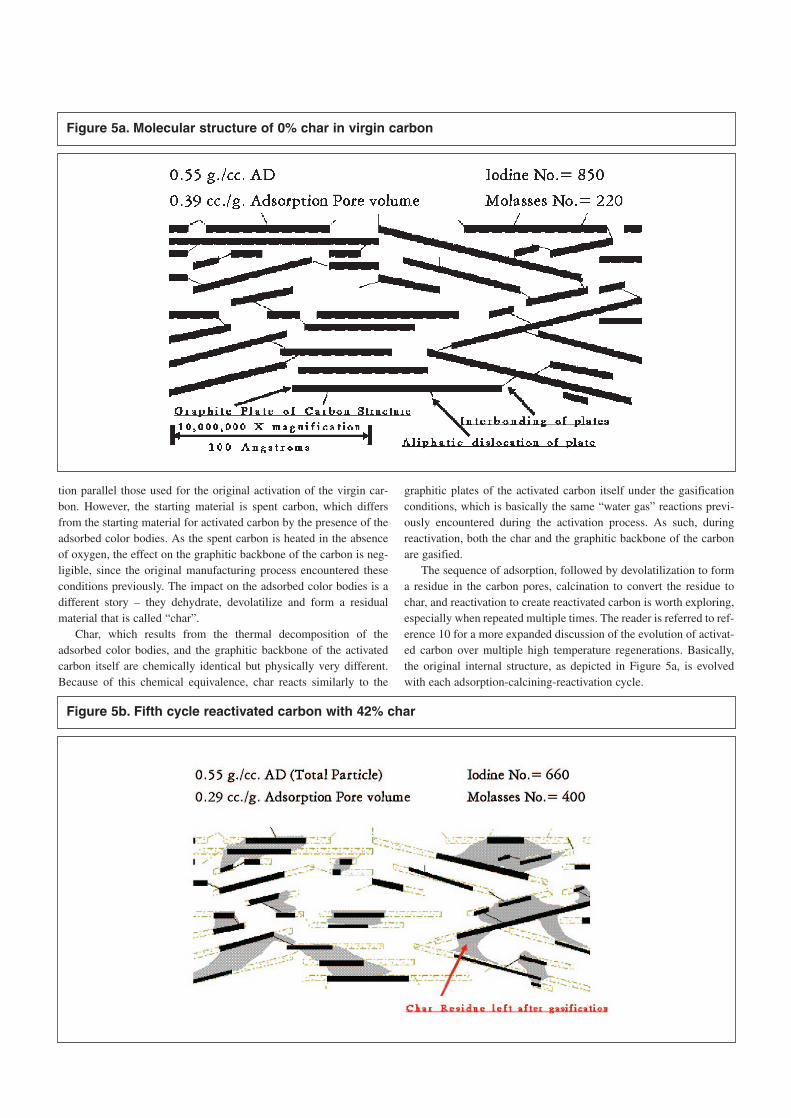
The sequence of adsorption, followed by devolatilization to forma residue in the carbon pores, calcination to convert the residue tochar, and reactivation to create reactivated carbon is worth exploring,especially when repeated multiple times. The reader is referred to ref-erence 10 for a more expanded discussion of the evolution of activat-ed carbon over multiple high temperature regenerations. Basically,the original internal structure, as depicted in Figure 5a, is evolvedwith each adsorption-calcining-reactivation cycle.
Figure 5a. Molecular structure of 0% char in virgin carbon
Figure 5b. Fifth cycle reactivated carbon with 42% char
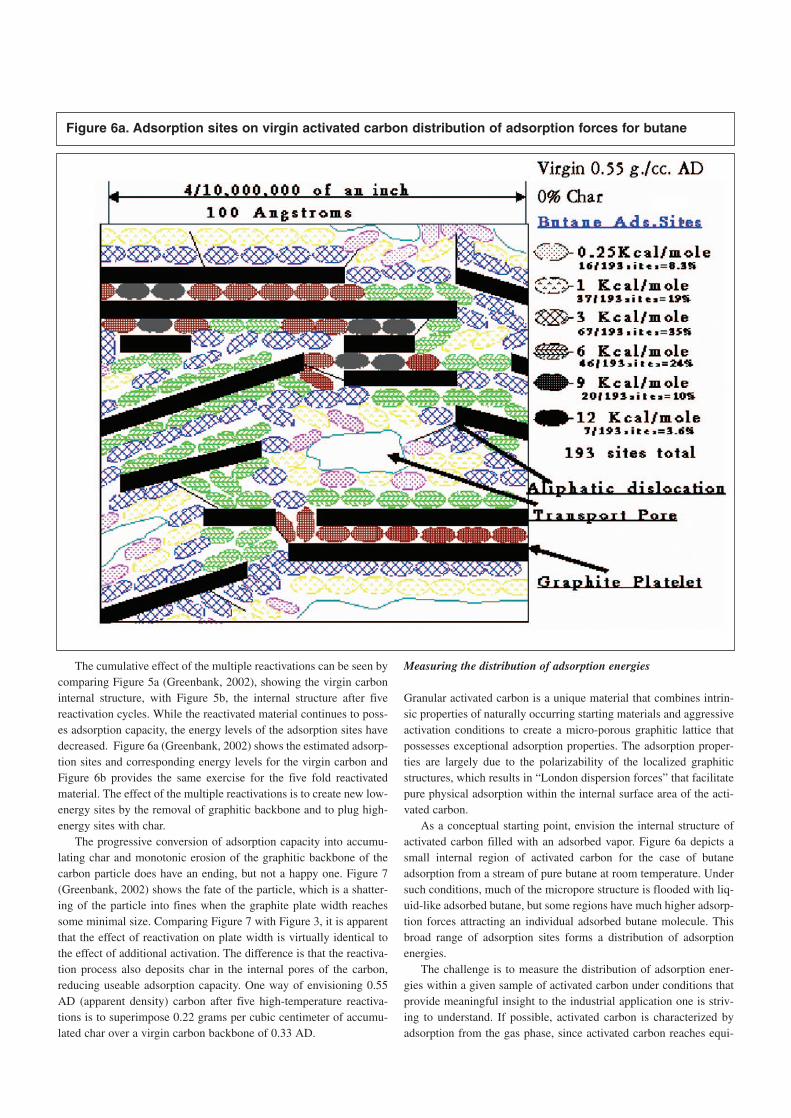
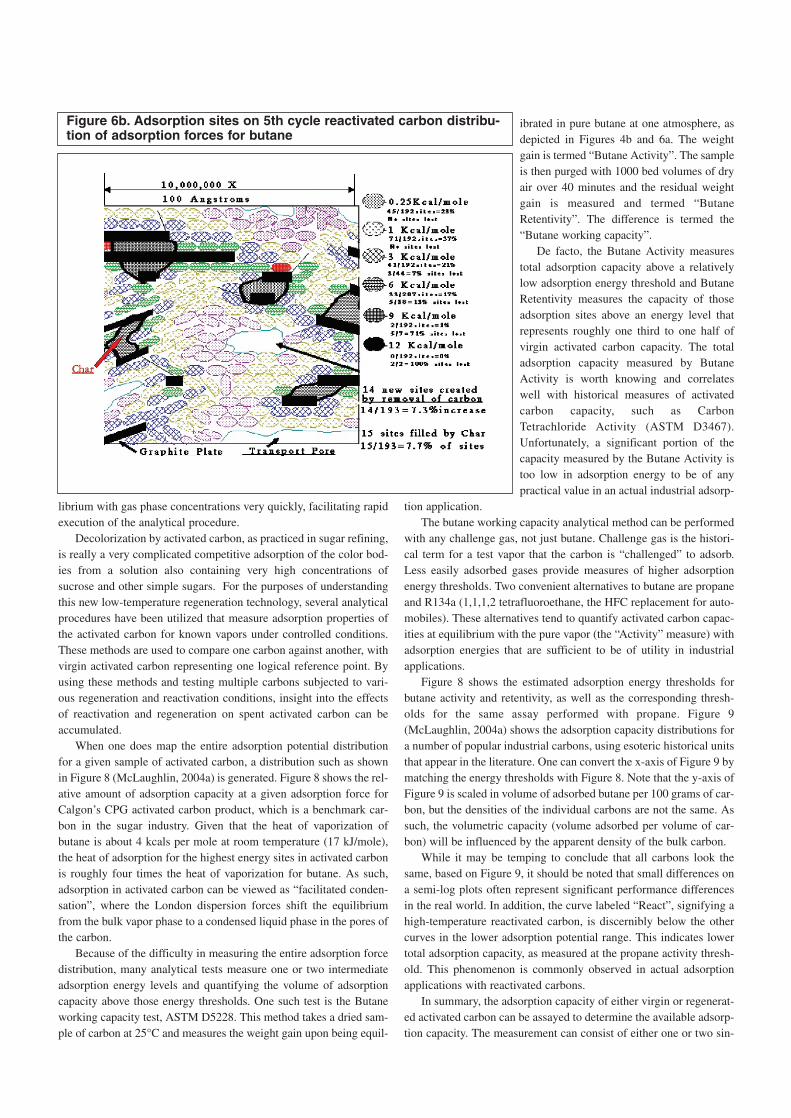
The cumulative effect of the multiple reactivations can be seen bycomparing Figure 5a (Greenbank, 2002), showing the virgin carboninternal structure, with Figure 5b, the internal structure after fivereactivation cycles. While the reactivated material continues to poss-es adsorption capacity, the energy levels of the adsorption sites havedecreased. Figure 6a (Greenbank, 2002) shows the estimated adsorp-tion sites and corresponding energy levels for the virgin carbon andFigure 6b provides the same exercise for the five fold reactivatedmaterial. The effect of the multiple reactivations is to create new low-energy sites by the removal of graphitic backbone and to plug high-energy sites with char.
The progressive conversion of adsorption capacity into accumu-lating char and monotonic erosion of the graphitic backbone of thecarbon particle does have an ending, but not a happy one. Figure 7(Greenbank, 2002) shows the fate of the particle, which is a shatter-ing of the particle into fines when the graphite plate width reachessome minimal size. Comparing Figure 7 with Figure 3, it is apparentthat the effect of reactivation on plate width is virtually identical tothe effect of additional activation. The difference is that the reactiva-tion process also deposits char in the internal pores of the carbon,reducing useable adsorption capacity. One way of envisioning 0.55AD (apparent density) carbon after five high-temperature reactiva-tions is to superimpose 0.22 grams per cubic centimeter of accumu-lated char over a virgin carbon backbone of 0.33 AD.
Measuring the distribution of adsorption energies
Granular activated carbon is a unique material that combines intrin-sic properties of naturally occurring starting materials and aggressiveactivation conditions to create a micro-porous graphitic lattice thatpossesses exceptional adsorption properties. The adsorption proper-ties are largely due to the polarizability of the localized graphiticstructures, which results in “London dispersion forces” that facilitatepure physical adsorption within the internal surface area of the acti-vated carbon.
As a conceptual starting point, envision the internal structure ofactivated carbon filled with an adsorbed vapor. Figure 6a depicts asmall internal region of activated carbon for the case of butaneadsorption from a stream of pure butane at room temperature. Undersuch conditions, much of the micropore structure is flooded with liq-uid-like adsorbed butane, but some regions have much higher adsorp-tion forces attracting an individual adsorbed butane molecule. Thisbroad range of adsorption sites forms a distribution of adsorptionenergies.
The challenge is to measure the distribution of adsorption ener-gies within a given sample of activated carbon under conditions thatprovide meaningful insight to the industrial application one is striv-ing to understand. If possible, activated carbon is characterized byadsorption from the gas phase, since activated carbon reaches equi-
Figure 6a. Adsorption sites on virgin activated carbon distribution of adsorption forces for butane
librium with gas phase concentrations very quickly, facilitating rapidexecution of the analytical procedure.
Decolorization by activated carbon, as practiced in sugar refining,is really a very complicated competitive adsorption of the color bod-ies from a solution also containing very high concentrations ofsucrose and other simple sugars. For the purposes of understandingthis new low-temperature regeneration technology, several analyticalprocedures have been utilized that measure adsorption properties ofthe activated carbon for known vapors under controlled conditions.These methods are used to compare one carbon against another, withvirgin activated carbon representing one logical reference point. Byusing these methods and testing multiple carbons subjected to vari-ous regeneration and reactivation conditions, insight into the effectsof reactivation and regeneration on spent activated carbon can beaccumulated.
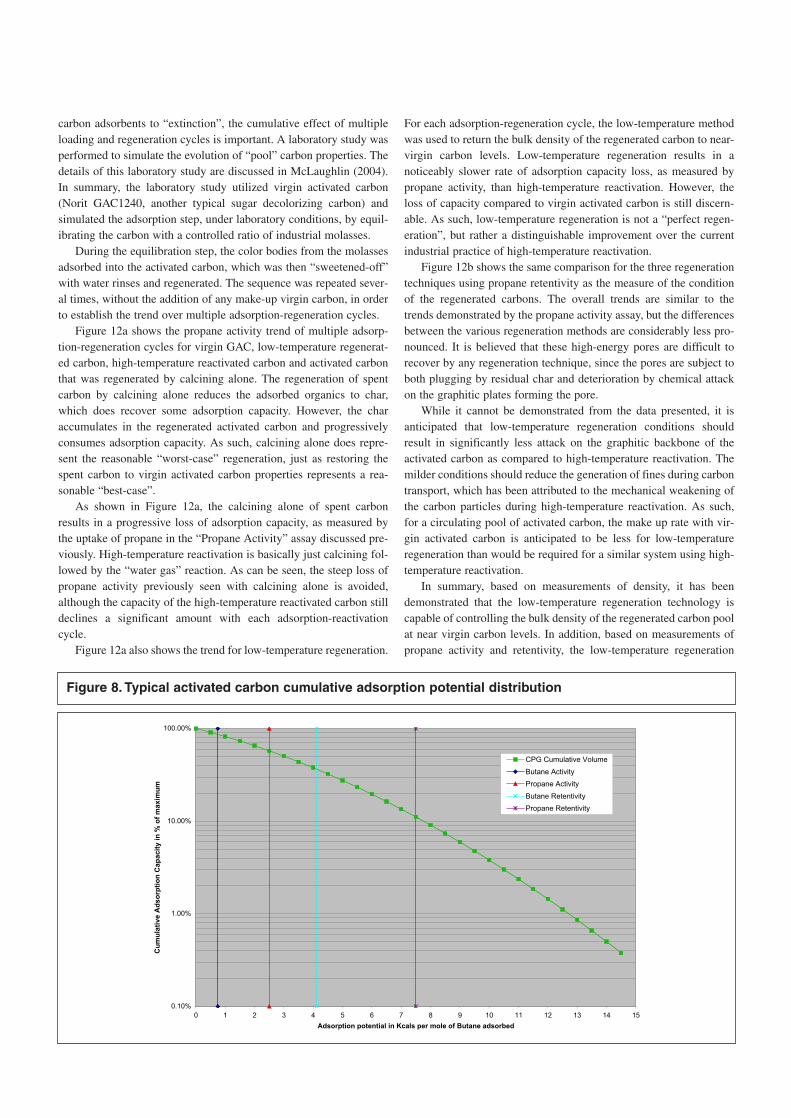
When one does map the entire adsorption potential distributionfor a given sample of activated carbon, a distribution such as shownin Figure 8 (McLaughlin, 2004a) is generated. Figure 8 shows the rel-ative amount of adsorption capacity at a given adsorption force forCalgon’s CPG activated carbon product, which is a benchmark car-bon in the sugar industry. Given that the heat of vaporization ofbutane is about 4 kcals per mole at room temperature (17 kJ/mole),the heat of adsorption for the highest energy sites in activated carbonis roughly four times the heat of vaporization for butane. As such,adsorption in activated carbon can be viewed as “facilitated conden-sation”, where the London dispersion forces shift the equilibriumfrom the bulk vapor phase to a condensed liquid phase in the pores ofthe carbon.
Because of the difficulty in measuring the entire adsorption forcedistribution, many analytical tests measure one or two intermediateadsorption energy levels and quantifying the volume of adsorptioncapacity above those energy thresholds. One such test is the Butaneworking capacity test, ASTM D5228. This method takes a dried sam-ple of carbon at 25°C and measures the weight gain upon being equil-
ibrated in pure butane at one atmosphere, asdepicted in Figures 4b and 6a. The weightgain is termed “Butane Activity”. The sampleis then purged with 1000 bed volumes of dryair over 40 minutes and the residual weightgain is measured and termed “ButaneRetentivity”. The difference is termed the“Butane working capacity”.
De facto, the Butane Activity measurestotal adsorption capacity above a relativelylow adsorption energy threshold and ButaneRetentivity measures the capacity of thoseadsorption sites above an energy level thatrepresents roughly one third to one half ofvirgin activated carbon capacity. The totaladsorption capacity measured by ButaneActivity is worth knowing and correlateswell with historical measures of activatedcarbon capacity, such as CarbonTetrachloride Activity (ASTM D3467).Unfortunately, a significant portion of thecapacity measured by the Butane Activity istoo low in adsorption energy to be of anypractical value in an actual industrial adsorp-
tion application.The butane working capacity analytical method can be performed
with any challenge gas, not just butane. Challenge gas is the histori-cal term for a test vapor that the carbon is “challenged” to adsorb.Less easily adsorbed gases provide measures of higher adsorptionenergy thresholds. Two convenient alternatives to butane are propaneand R134a (1,1,1,2 tetrafluoroethane, the HFC replacement for auto-mobiles). These alternatives tend to quantify activated carbon capac-ities at equilibrium with the pure vapor (the “Activity” measure) withadsorption energies that are sufficient to be of utility in industrialapplications.
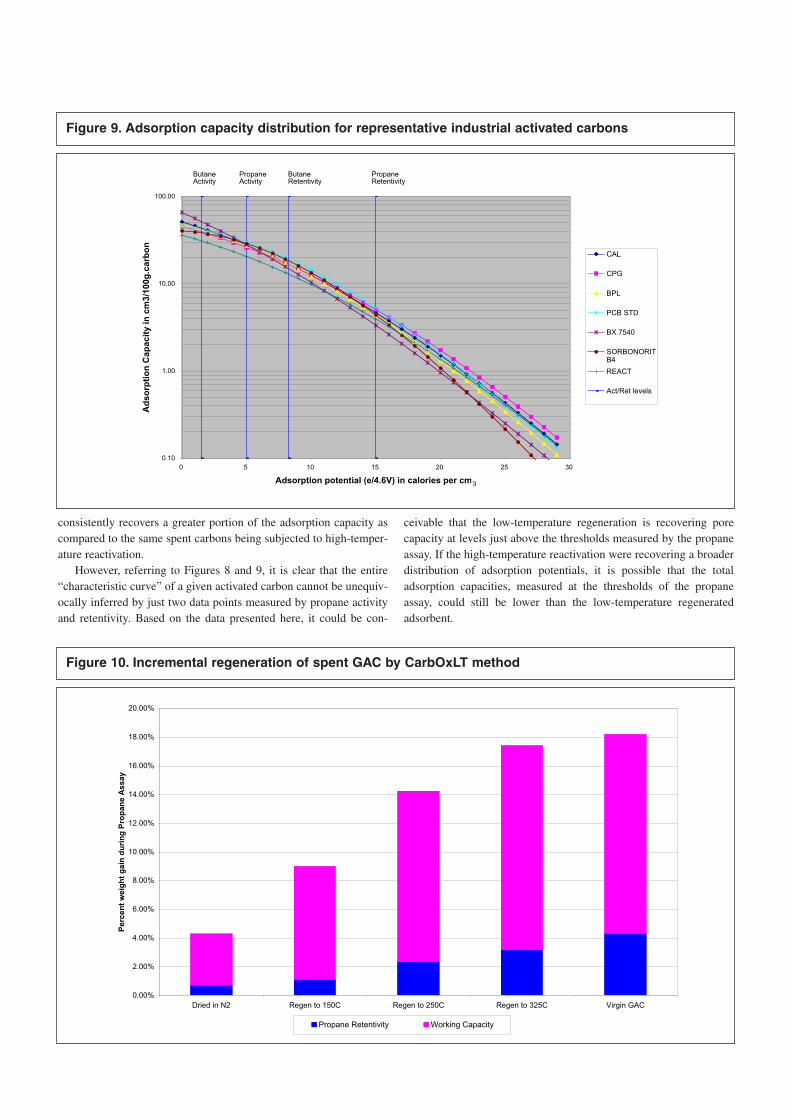
Figure 8 shows the estimated adsorption energy thresholds forbutane activity and retentivity, as well as the corresponding thresh-olds for the same assay performed with propane. Figure 9(McLaughlin, 2004a) shows the adsorption capacity distributions fora number of popular industrial carbons, using esoteric historical unitsthat appear in the literature. One can convert the x-axis of Figure 9 bymatching the energy thresholds with Figure 8. Note that the y-axis ofFigure 9 is scaled in volume of adsorbed butane per 100 grams of car-bon, but the densities of the individual carbons are not the same. Assuch, the volumetric capacity (volume adsorbed per volume of car-bon) will be influenced by the apparent density of the bulk carbon.
While it may be temping to conclude that all carbons look thesame, based on Figure 9, it should be noted that small differences ona semi-log plots often represent significant performance differencesin the real world. In addition, the curve labeled “React”, signifying ahigh-temperature reactivated carbon, is discernibly below the othercurves in the lower adsorption potential range. This indicates lowertotal adsorption capacity, as measured at the propane activity thresh-old. This phenomenon is commonly observed in actual adsorptionapplications with reactivated carbons.
In summary, the adsorption capacity of either virgin or regenerat-ed activated carbon can be assayed to determine the available adsorp-tion capacity. The measurement can consist of either one or two sin-
Figure 6b. Adsorption sites on 5th cycle reactivated carbon distribu-tion of adsorption forces for butane
gle point measurements, which quantify the total adsorption capacityabove a specific adsorption energy threshold, or the entire “charac-teristic curve”, which maps the entire distribution of adsorptioncapacity as a function of adsorption potential.
Introduction to the low-temperature regeneration (CarbOxLT)alternative for spent carbon
The phenomenon of low-temperature oxidation of activated carbon ina source of molecular oxygen, typically air, is not new. A body ofwork performed at the University of Alicante (Gonzalez-Vilchez et.al. (1979), Rodriguez-Reinoso et. al. (1984)) in Spain about 25 yearsago explored the evolution of previously activated virgin carbon in airat 350°C. As noted in the Discussion section of the 1979 paper:
At high percentages burn-off and as a consequence of the weightloss, the adsorptive properties of the active carbons is diminished butthey can still be considered good active carbons even when theweight loss is about 50%. This could be important from the industri-al point of view, since these carbons could stand temperatures up to350°C for long periods of time (several days) with no other incon-venience than their reduction in weight.
Additional papers (Martin-Martinez et. al. (1984), Linares-Solanoet. al. (1984)) further characterized the adsorption characteristics ofthe activated carbons as air at 350°C was used to modify the internaladsorption sites over a range of up to 70% weight loss or “burn-off”.After these four papers, the researchers seemed to drop this line ofinquiry and additional work by this group is not reported in the liter-ature.
What had not been previously demonstrated about the oxidationof activated carbon by air is the effect on other oxidizable organicspresent with the activated carbon. This will now be explored.
Characterizing the CarbOxLT regeneration using propane workingcapacity
While the background rate of oxidation for virgin activated carbon isslow, as discussed by Gonzalez-Vilchez et. al. (1979), the rate of oxi-dation of spent activated carbon, under similar conditions, is signifi-cantly more rapid. As such, when spent activated carbon is exposedto the CarbOxLT conditions, the adsorbed organics oxidize fasterthan the activated carbon backbone and the adsorbed organics are
selectively removed from the pores of the activated carbon. The neteffect is the recovery of a significant portion of the adsorption capac-ity of the original virgin activated carbon.
The incremental regeneration of spent activated carbon is demon-strated in the following study. A sample of spent virgin activated car-bon, heavily loaded with sugar refining color bodies, was regenerat-ed over a total of about 24 hours at progressively higher temperatures.The results of the propane working capacity assay, performed at eachtemperature plateau, are shown in Figure 10.
As can be seen in Figure 10, at each progressively higher regen-eration temperature, incremental recovery of adsorption capacity ismeasured (Note: the sum of Propane Retentivity and WorkingCapacity equals the Propane Activity).
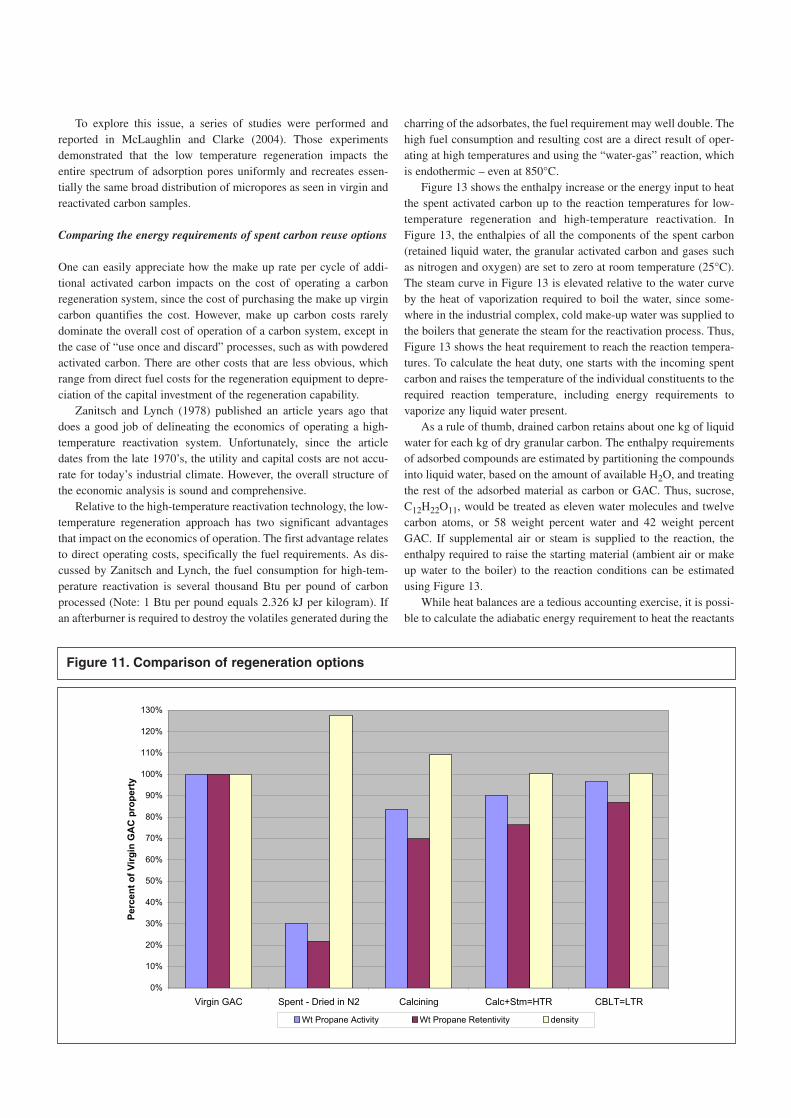
Figure 11 shows a comparison of high-temperature reactivationand low-temperature regeneration, performed on the same batch ofspent carbon used for Figure 10. Figure 11 includes the properties ofdried spent carbon and spent carbon that has been calcined (heated to850°C in an dry nitrogen atmosphere – which reduces any adsorbedcompounds to char). Virgin carbon values for propane activity,propane retentivity and density are used to normalize the data shownin Figure 11, hence all virgin carbon properties are shown as 100%.
As can be seen in Figure 11, the dried spent carbon shows a sig-nificant increase in density and loss of propane capacity compared tothe virgin carbon. Calcining the spent carbon recovers the majority ofthe propane capacity loss, but also converts the remaining adsorbedmaterial into non-volatile char, which would accumulate over repeat-ed adsorption-calcining cycles.
Calcining followed by steaming simulates the high-temperaturereactivation process, since the steam removes the char by the watergas reaction. This allows the density of the reactivated carbon to bereturned to near virgin carbon density, yet the propane capacities arestill significantly decreased from the original virgin carbon levels.
Finally, the results for the low-temperature regeneration areshown on the far right of Figure 11. The data shown in Figure 11 isfor a different regeneration of the same spent carbon as Figure 10 andthe second regeneration results were slightly better than before.However, while the regenerated carbon has less adsorption capacitythan the starting virgin activated carbon, the propane capacitydecrease for the low-temperature regeneration is roughly one halfthat experienced with high-temperature reactivation.
Since the actual industrial practice is to regenerate and recycle
Figure 7. Physical effect of gasification on the carbon structure over multiple reactivations
carbon adsorbents to “extinction”, the cumulative effect of multipleloading and regeneration cycles is important. A laboratory study wasperformed to simulate the evolution of “pool” carbon properties. Thedetails of this laboratory study are discussed in McLaughlin (2004).In summary, the laboratory study utilized virgin activated carbon(Norit GAC1240, another typical sugar decolorizing carbon) andsimulated the adsorption step, under laboratory conditions, by equil-ibrating the carbon with a controlled ratio of industrial molasses.
During the equilibration step, the color bodies from the molassesadsorbed into the activated carbon, which was then “sweetened-off”with water rinses and regenerated. The sequence was repeated sever-al times, without the addition of any make-up virgin carbon, in orderto establish the trend over multiple adsorption-regeneration cycles.
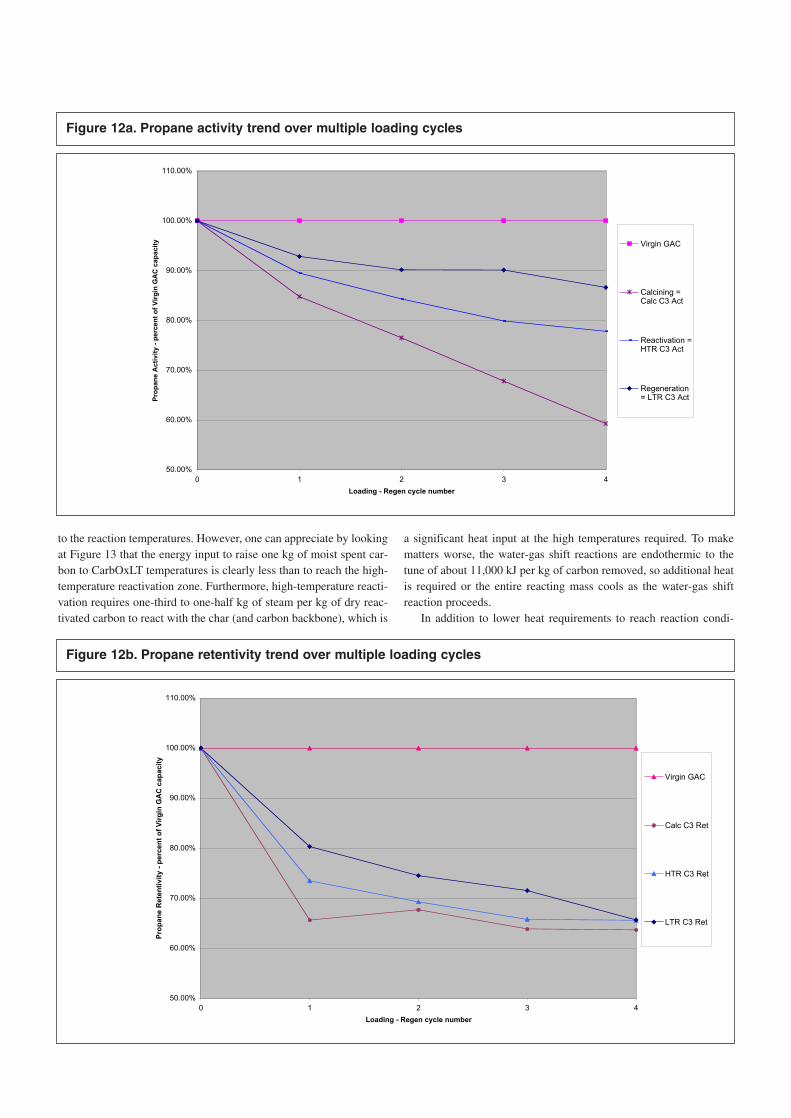
Figure 12a shows the propane activity trend of multiple adsorp-tion-regeneration cycles for virgin GAC, low-temperature regenerat-ed carbon, high-temperature reactivated carbon and activated carbonthat was regenerated by calcining alone. The regeneration of spentcarbon by calcining alone reduces the adsorbed organics to char,which does recover some adsorption capacity. However, the characcumulates in the regenerated activated carbon and progressivelyconsumes adsorption capacity. As such, calcining alone does repre-sent the reasonable “worst-case” regeneration, just as restoring thespent carbon to virgin activated carbon properties represents a rea-sonable “best-case”.
As shown in Figure 12a, the calcining alone of spent carbonresults in a progressive loss of adsorption capacity, as measured bythe uptake of propane in the “Propane Activity” assay discussed pre-viously. High-temperature reactivation is basically just calcining fol-lowed by the “water gas” reaction. As can be seen, the steep loss ofpropane activity previously seen with calcining alone is avoided,although the capacity of the high-temperature reactivated carbon stilldeclines a significant amount with each adsorption-reactivationcycle.
Figure 12a also shows the trend for low-temperature regeneration.
For each adsorption-regeneration cycle, the low-temperature methodwas used to return the bulk density of the regenerated carbon to near-virgin carbon levels. Low-temperature regeneration results in anoticeably slower rate of adsorption capacity loss, as measured bypropane activity, than high-temperature reactivation. However, theloss of capacity compared to virgin activated carbon is still discern-able. As such, low-temperature regeneration is not a “perfect regen-eration”, but rather a distinguishable improvement over the currentindustrial practice of high-temperature reactivation.
Figure 12b shows the same comparison for the three regenerationtechniques using propane retentivity as the measure of the conditionof the regenerated carbons. The overall trends are similar to thetrends demonstrated by the propane activity assay, but the differencesbetween the various regeneration methods are considerably less pro-nounced. It is believed that these high-energy pores are difficult torecover by any regeneration technique, since the pores are subject toboth plugging by residual char and deterioration by chemical attackon the graphitic plates forming the pore.
While it cannot be demonstrated from the data presented, it isanticipated that low-temperature regeneration conditions shouldresult in significantly less attack on the graphitic backbone of theactivated carbon as compared to high-temperature reactivation. Themilder conditions should reduce the generation of fines during carbontransport, which has been attributed to the mechanical weakening ofthe carbon particles during high-temperature reactivation. As such,for a circulating pool of activated carbon, the make up rate with vir-gin activated carbon is anticipated to be less for low-temperatureregeneration than would be required for a similar system using high-temperature reactivation.
In summary, based on measurements of density, it has beendemonstrated that the low-temperature regeneration technology iscapable of controlling the bulk density of the regenerated carbon poolat near virgin carbon levels. In addition, based on measurements ofpropane activity and retentivity, the low-temperature regeneration
0.10%
1.00%
10.00%
100.00%
0 1 2 3 4 5 6 7 8 9 10 11 12 13 14 15
Adsorption potential in Kcals per mole of Butane adsorbed
Cu
mu
lati
ve
Ad
so
rpti
on
Ca
pa
cit
y i
n %
of
ma
xim
um
CPG Cumulative Volume
Butane Activity
Propane Activity
Butane Retentivity
Propane Retentivity
Figure 8. Typical activated carbon cumulative adsorption potential distribution
consistently recovers a greater portion of the adsorption capacity ascompared to the same spent carbons being subjected to high-temper-ature reactivation.
However, referring to Figures 8 and 9, it is clear that the entire“characteristic curve” of a given activated carbon cannot be unequiv-ocally inferred by just two data points measured by propane activityand retentivity. Based on the data presented here, it could be con-
ceivable that the low-temperature regeneration is recovering porecapacity at levels just above the thresholds measured by the propaneassay. If the high-temperature reactivation were recovering a broaderdistribution of adsorption potentials, it is possible that the totaladsorption capacities, measured at the thresholds of the propaneassay, could still be lower than the low-temperature regeneratedadsorbent.
0.00%
2.00%
4.00%
6.00%
8.00%
10.00%
12.00%
14.00%
16.00%
18.00%
20.00%
Dried in N2 Regen to 150C Regen to 250C Regen to 325C Virgin GAC
Perc
en
t w
eig
ht
gain
du
rin
g P
rop
an
e A
ssay
Propane Retentivity Working Capacity
Figure 10. Incremental regeneration of spent GAC by CarbOxLT method
0.10
1.00
10.00
100.00
0 5 10 15 20 25 30
Adsorption potential (e/4.6V) in calories per cm3
Ad
so
rpti
on
Cap
acit
y in
cm
3/1
00g
.carb
on
CAL
CPG
BPL
PCB STD
BX 7540
SORBONORITB4
REACT
Act/Ret levels
ButaneActivity
PropaneActivity
ButaneRetentivity
PropaneRetentivity
Figure 9. Adsorption capacity distribution for representative industrial activated carbons
3
To explore this issue, a series of studies were performed andreported in McLaughlin and Clarke (2004). Those experimentsdemonstrated that the low temperature regeneration impacts theentire spectrum of adsorption pores uniformly and recreates essen-tially the same broad distribution of micropores as seen in virgin andreactivated carbon samples.
Comparing the energy requirements of spent carbon reuse options
One can easily appreciate how the make up rate per cycle of addi-tional activated carbon impacts on the cost of operating a carbonregeneration system, since the cost of purchasing the make up virgincarbon quantifies the cost. However, make up carbon costs rarelydominate the overall cost of operation of a carbon system, except inthe case of “use once and discard” processes, such as with powderedactivated carbon. There are other costs that are less obvious, whichrange from direct fuel costs for the regeneration equipment to depre-ciation of the capital investment of the regeneration capability.
Zanitsch and Lynch (1978) published an article years ago thatdoes a good job of delineating the economics of operating a high-temperature reactivation system. Unfortunately, since the articledates from the late 1970’s, the utility and capital costs are not accu-rate for today’s industrial climate. However, the overall structure ofthe economic analysis is sound and comprehensive.
Relative to the high-temperature reactivation technology, the low-temperature regeneration approach has two significant advantagesthat impact on the economics of operation. The first advantage relatesto direct operating costs, specifically the fuel requirements. As dis-cussed by Zanitsch and Lynch, the fuel consumption for high-tem-perature reactivation is several thousand Btu per pound of carbonprocessed (Note: 1 Btu per pound equals 2.326 kJ per kilogram). Ifan afterburner is required to destroy the volatiles generated during the
charring of the adsorbates, the fuel requirement may well double. Thehigh fuel consumption and resulting cost are a direct result of oper-ating at high temperatures and using the “water-gas” reaction, whichis endothermic – even at 850°C.
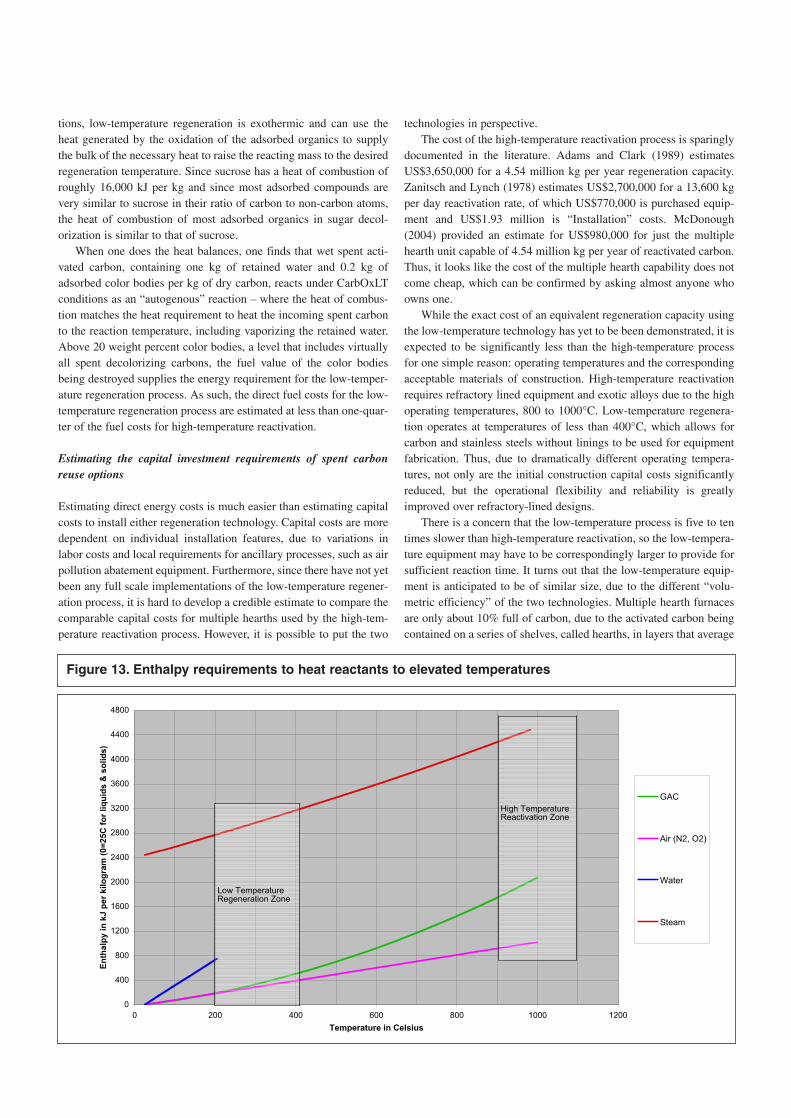
Figure 13 shows the enthalpy increase or the energy input to heatthe spent activated carbon up to the reaction temperatures for low-temperature regeneration and high-temperature reactivation. InFigure 13, the enthalpies of all the components of the spent carbon(retained liquid water, the granular activated carbon and gases suchas nitrogen and oxygen) are set to zero at room temperature (25°C).The steam curve in Figure 13 is elevated relative to the water curveby the heat of vaporization required to boil the water, since some-where in the industrial complex, cold make-up water was supplied tothe boilers that generate the steam for the reactivation process. Thus,Figure 13 shows the heat requirement to reach the reaction tempera-tures. To calculate the heat duty, one starts with the incoming spentcarbon and raises the temperature of the individual constituents to therequired reaction temperature, including energy requirements tovaporize any liquid water present.
As a rule of thumb, drained carbon retains about one kg of liquidwater for each kg of dry granular carbon. The enthalpy requirementsof adsorbed compounds are estimated by partitioning the compoundsinto liquid water, based on the amount of available H2O, and treatingthe rest of the adsorbed material as carbon or GAC. Thus, sucrose,C12H22O11, would be treated as eleven water molecules and twelvecarbon atoms, or 58 weight percent water and 42 weight percentGAC. If supplemental air or steam is supplied to the reaction, theenthalpy required to raise the starting material (ambient air or makeup water to the boiler) to the reaction conditions can be estimatedusing Figure 13.
While heat balances are a tedious accounting exercise, it is possi-ble to calculate the adiabatic energy requirement to heat the reactants
0%
10%
20%
30%
40%
50%
60%
70%
80%
90%
100%
110%
120%
130%
Virgin GAC Spent - Dried in N2 Calcining Calc+Stm=HTR CBLT=LTR
Pe
rce
nt
of
Vir
gin
GA
C p
rop
ert
y
Wt Propane Activity Wt Propane Retentivity density
Figure 11. Comparison of regeneration options
to the reaction temperatures. However, one can appreciate by lookingat Figure 13 that the energy input to raise one kg of moist spent car-bon to CarbOxLT temperatures is clearly less than to reach the high-temperature reactivation zone. Furthermore, high-temperature reacti-vation requires one-third to one-half kg of steam per kg of dry reac-tivated carbon to react with the char (and carbon backbone), which is
a significant heat input at the high temperatures required. To makematters worse, the water-gas shift reactions are endothermic to thetune of about 11,000 kJ per kg of carbon removed, so additional heatis required or the entire reacting mass cools as the water-gas shiftreaction proceeds.
In addition to lower heat requirements to reach reaction condi-
50.00%
60.00%
70.00%
80.00%
90.00%
100.00%
110.00%
0 1 2 3 4
Loading - Regen cycle number
Pro
pa
ne
Re
ten
tiv
ity
- p
erc
en
t o
f V
irg
in G
AC
ca
pa
cit
y
Virgin GAC
Calc C3 Ret
HTR C3 Ret
LTR C3 Ret
Figure 12b. Propane retentivity trend over multiple loading cycles
50.00%
60.00%
70.00%
80.00%
90.00%
100.00%
110.00%
0 1 2 3 4
Loading - Regen cycle number
Pro
pa
ne
Ac
tiv
ity
- p
erc
en
t o
f V
irg
in G
AC
ca
pa
cit
y Virgin GAC
Calcining =Calc C3 Act
Reactivation =HTR C3 Act
Regeneration= LTR C3 Act
Figure 12a. Propane activity trend over multiple loading cycles
tions, low-temperature regeneration is exothermic and can use theheat generated by the oxidation of the adsorbed organics to supplythe bulk of the necessary heat to raise the reacting mass to the desiredregeneration temperature. Since sucrose has a heat of combustion ofroughly 16,000 kJ per kg and since most adsorbed compounds arevery similar to sucrose in their ratio of carbon to non-carbon atoms,the heat of combustion of most adsorbed organics in sugar decol-orization is similar to that of sucrose.
When one does the heat balances, one finds that wet spent acti-vated carbon, containing one kg of retained water and 0.2 kg ofadsorbed color bodies per kg of dry carbon, reacts under CarbOxLTconditions as an “autogenous” reaction – where the heat of combus-tion matches the heat requirement to heat the incoming spent carbonto the reaction temperature, including vaporizing the retained water.Above 20 weight percent color bodies, a level that includes virtuallyall spent decolorizing carbons, the fuel value of the color bodiesbeing destroyed supplies the energy requirement for the low-temper-ature regeneration process. As such, the direct fuel costs for the low-temperature regeneration process are estimated at less than one-quar-ter of the fuel costs for high-temperature reactivation.
Estimating the capital investment requirements of spent carbonreuse options
Estimating direct energy costs is much easier than estimating capitalcosts to install either regeneration technology. Capital costs are moredependent on individual installation features, due to variations inlabor costs and local requirements for ancillary processes, such as airpollution abatement equipment. Furthermore, since there have not yetbeen any full scale implementations of the low-temperature regener-ation process, it is hard to develop a credible estimate to compare thecomparable capital costs for multiple hearths used by the high-tem-perature reactivation process. However, it is possible to put the two
technologies in perspective.The cost of the high-temperature reactivation process is sparingly
documented in the literature. Adams and Clark (1989) estimatesUS$3,650,000 for a 4.54 million kg per year regeneration capacity.Zanitsch and Lynch (1978) estimates US$2,700,000 for a 13,600 kgper day reactivation rate, of which US$770,000 is purchased equip-ment and US$1.93 million is “Installation” costs. McDonough(2004) provided an estimate for US$980,000 for just the multiplehearth unit capable of 4.54 million kg per year of reactivated carbon.Thus, it looks like the cost of the multiple hearth capability does notcome cheap, which can be confirmed by asking almost anyone whoowns one.
While the exact cost of an equivalent regeneration capacity usingthe low-temperature technology has yet to be been demonstrated, it isexpected to be significantly less than the high-temperature processfor one simple reason: operating temperatures and the correspondingacceptable materials of construction. High-temperature reactivationrequires refractory lined equipment and exotic alloys due to the highoperating temperatures, 800 to 1000°C. Low-temperature regenera-tion operates at temperatures of less than 400°C, which allows forcarbon and stainless steels without linings to be used for equipmentfabrication. Thus, due to dramatically different operating tempera-tures, not only are the initial construction capital costs significantlyreduced, but the operational flexibility and reliability is greatlyimproved over refractory-lined designs.
There is a concern that the low-temperature process is five to tentimes slower than high-temperature reactivation, so the low-tempera-ture equipment may have to be correspondingly larger to provide forsufficient reaction time. It turns out that the low-temperature equip-ment is anticipated to be of similar size, due to the different “volu-metric efficiency” of the two technologies. Multiple hearth furnacesare only about 10% full of carbon, due to the activated carbon beingcontained on a series of shelves, called hearths, in layers that average
0
400
800
1200
1600
2000
2400
2800
3200
3600
4000
4400
4800
0 200 400 600 800 1000 1200
Temperature in Celsius
En
tha
lpy
in
kJ
pe
r k
ilo
gra
m (
0=
25
C f
or
liq
uid
s &
so
lid
s)
GAC
Air (N2, O2)
Water
Steam
Low TemperatureRegeneration Zone
High TemperatureReactivation Zone
Figure 13. Enthalpy requirements to heat reactants to elevated temperatures
only about 10 cm deep. In contrast, the low-temperature process uti-lizes free-flowing “dense beds” of carbon, meaning that the reactorvolume is more completely filled with carbon, which is mixed to con-trol the temperature of the reacting mass and avoid hot spots.
There are additional unanswered concerns relating to the con-struction and operation of a full-scale low-temperature regenerationfacility, which fall in the general category of “fear of the not-yet-known”. However, as Mick Greenbank of Calgon has noted:
The only unanswered question is with reliability and mainte-nance, but that cannot be proven till the first systems are installed.However I would be surprised if the CarbOxLT regeneration systemswere not more reliable than existing high-temperature reactivationtechnology. (Greenbank, personal communication)
In summary, it appears that the adopters of the low-temperatureregeneration technology may save a significant amount of moneywhen building the facility and will save a significant amount ofmoney while operating the facility. At that point, it comes down tothe individual organization’s engineering capabilities, tolerance forrisk, and propensity for saving money.
Summarizing the low-temperature regeneration process
While both low-temperature regeneration, (CarbOxLT) and high-temperature reactivation allow the recycling of spent activated carbonadsorbent, they are really two entirely different approaches to thesame application.
The core technical differences between the current high-tempera-ture reactivation process and the low temperature regeneration tech-nology comes down to time, temperature, and reaction conditions.The high temperature reaction conditions first convert all theadsorbed organics into residual char in the carbon pores. Then, thehigh temperature process uses steam to react with the char (and theactivated carbon itself). This reaction occurs above 850°C andadsorbs heat (endothermic). The high temperature reaction is con-trolled by adding heat to maintain a temperature setpoint and meter-ing the steam supply.
The low temperature reaction occurs at between 150 and 350°C,reacts oxygen (from air) directly with the adsorbed organics, and gen-erates heat (exothermic). The reaction is also relatively slow, sincethe temperature is controlled to prevent the development of hot spots.The low-temperature reaction is controlled primarily by removingheat to control at a temperature setpoint and, to a lesser extent, bymetering the air input.
Another important difference is the dominant vapor atmospherepresent within each process. The low-temperature process has excessoxygen present at all times and the predominant off-gases are carbondioxide and water vapor, with lesser amounts of carbon monoxide. Incontrast, high-temperature reactivation uses the water-gas shift reac-tion and generates an atmosphere containing principally carbonmonoxide and hydrogen. These compounds require subsequentdestruction, typically with an afterburner. In addition, due to the pres-ence of hydrogen, there are safety concerns and the risks of furtherreactions with reactive vapors present in the furnace off-gas, such asthe formation of hydrogen cyanide.
In closing, it is acknowledged that the actual specifics of a low-temperature regeneration operation will not be known until one ormore full-scale units are constructed and operated for a period oftime. However, it is clear that the low-temperature regeneration
process enjoys several pivotal technical advantages over the high-temperature reactivation technology currently utilized by sugar refin-ing operations worldwide.
References
Adams, JQ and Clark, RM (1989). “Cost estimates for GAC treatment
systems”, Journal AWWA, pp. 35-42 (January issue).
Carpenter, FG (1985). Introduction to Chapter 17: Cane Sugar Refining II.
Decolorization, Cane Sugar Handbook, 11th Ed., pp. 571 John Wiley & Sons,
NY.
Greenbank, M (2002). Slide from a course titled “Selecting the best acti-
vated carbon for a specific application”, presented in September 2002, while
in the employment of PACS, a specialty activated carbon service firm located
in the greater Pittsburgh area.
Godshall, MA (1999). Removal of colorants and polysaccharides and the
quality of white sugar”, Association AVH – 6th Symposium – Reims (1999)
(Available online at www.univ-reims.fr/Externes/AVH/Godshall.pdf).
Gonzalez-Vilchez, P, Linares-Solano, A, de D. Lopez-Gonzalez, J and F.
Rodriguez-Reinoso, F (1979). The controlled reaction of active carbons with
air at 350°C – I: Reactivity and changes in surface area. Carbon, 17 (6): 441-
446.
Hutchins, RA (1973). Activated carbon – economic factors in granular
carbon thermal regeneration, Chemical Engineering Progress, 69 (11): 48-55.
Linares-Solano, A, Rodriguez-Reinoso, F, Martin-Martinez, JM and de D.
Lopez-Gonzalez, J (1984). Adsorption of hydrocarbons on air-reacted acti-
vated carbons. II. High and low pressure hysteresis, Adsorption Science &
Technology, 1: 317-327
Martin-Martinez, JM, Linares-Solano, A, Rodriguez-Reinoso, F and J. D.
Lopez-Gonzalez, JD (1984). Adsorption of hydrocarbons on air-reacted acti-
vated carbons. I. Adsorption isotherms, Adsorption Science & Technology, 1:
195-204.
McDonough, S (2004). Private communication, Vice President, Sales and
Marketing, Hankin Environmental Systems Inc. (www.hankinenv.com).
McLaughlin, HS (2004). A new technology for regenerating sugar decol-
orizing activated carbon, presented at SPRI 2004 - Sugar Processing Research
Conference, April 4-7, 2004, Atlanta, Georgia, USA.
McLaughlin, HS and Clarke, SJ (2004). Exploring the subtleties of low-
temperature regeneration of sugar decolorization activated carbon, presented
at the Annual SIT Conference, May 16-19, 2004, Vancouver, B.C., Canada.
See proceedings of this conference.
Rodriguez-Reinoso, F, Linares-Solano, A and Martin-Martinez, JM
(1984). The controlled reaction of active carbons with air at 350∞C – II:
Evolution of microporosity”, Carbon Vol. 22, No. 2, pp. 123-130.
Zanitsch, RH and Lynch, RT (1978). Selecting a thermal regeneration sys-
tem for activated carbon, Chemical Engineering, January 2 issue.