Embed Size (px)
Citation preview
7/29/2019 Understanding and Designing New Server Architectures for Emerging Warehouse-Computing Environments
http://slidepdf.com/reader/full/understanding-and-designing-new-server-architectures-for-emerging-warehouse-computing 1/12
Understanding and Designing New Server Architectures
for Emerging Warehouse-Computing Environments
Kevin Lim*, Parthasarathy Ranganathan+, Jichuan Chang+,Chandrakant Patel+, Trevor Mudge*, Steven Reinhardt*†
* University of Michigan, Ann Arbor +
Hewlett-Packard Labs † Reservoir Labs
{ktlim,tnm,stever}@eecs.umich.edu, {partha.ranganathan, jichuan.chang, chandrakant.patel}@hp.com
Abstract
This paper seeks to understand and design next-
generation servers for emerging “warehouse-
computing” environments. We make two key
contributions. First, we put together a detailed
evaluation infrastructure including a new benchmark
suite for warehouse-computing workloads, and detailed performance, cost, and power models, to
quantitatively characterize bottlenecks. Second, we
study a new solution that incorporates volume non-
server-class components in novel packaging solutions,
with memory sharing and flash-based disk caching.
Our results show that this approach has promise, with
a 2X improvement on average in performance-per-
dollar for our benchmark suite.
1. Introduction
The server market is facing an interesting inflection
point. Recent market data identifies the “internetsector” as the fastest growing segment of the overall
server market, growing by 40-65% every year, andaccounting for more than 65% of low-end server
revenue growth last year. By contrast, the rest of the
server market is not growing. Indeed, several recentkeynotes [3,6,19,25,26,33,36] point to growing
recognition of the importance of this area.
However, the design of servers for this market posesseveral challenges. Internet sector infrastructures have
millions of users often running on hundreds of
thousands of servers, and consequently, scale-out is akey design constraint. This has been likened to the
design of a large warehouse-style computer [3], withthe programs being distributed applications like mail,search, etc. The datacenter infrastructure is often the
largest capital and operating expense. Additionally, asignificant fraction of the operating costs is power and
cooling.
These constraints, in turn, lead to several designdecisions specific to internet sector infrastructures. The
focus on costs motivates leveraging the “sweet spot” of
commodity pricing and energy efficiency, and also
reflects in decisions to move high-end hardwarefeatures into the application stack (e.g., high-
availability, manageability). Additionally, the high
volume in this market and the relative dominance of afew key players – e.g., Google, Yahoo, eBay, MSN
(Microsoft), Amazon – allow for exploring options likecustom-designed servers in “green-field” datacenters
built from scratch. Indeed, Google and MSN’s
purchase of real estate near the internet backbone or
power grid for this purpose has received a lot of recent press [19].
All these trends motivate the need for research in
understanding these workloads, and on new systemarchitectures targeted at this market with compelling
cost/performance advantages. This paper seeks to
address this challenge. In particular, we make thefollowing contributions. We put together a detailed
evaluation infrastructure including the first-ever
benchmark suite for warehouse-computing workloads,along with detailed performance, cost, and power
models and metrics. Using these tools, we identify four
key areas for improvement (CPU, packaging, memory,disk) and study a new system architecture that takes a
holistic approach at addressing these bottlenecks. Our
proposed solution has novel features including the useof low-cost, low-power components from the high-
volume embedded/mobile space and novel packaging
solutions, along with memory sharing and flash-baseddisk caching. Our results are promising, combining to
provide a two-fold improvement in performance-per-
dollar, for our benchmark suite. More importantly, they
point to the strong potential of cost-efficient ensemble-level design for this class of workloads.
2. Evaluation Environment
A challenge in studying new architectures for
warehouse-computing environments has been the lack
of access to internet-sector workloads. The proprietarynature and the large scale of deployment are key
International Symposium on Computer Architecture
1063-6897/08 $25.00 © 2008 IEEE
DOI 10.1109/ISCA.2008.37
315
International Symposium on Computer Architecture
1063-6897/08 $25.00 © 2008 IEEE
DOI 10.1109/ISCA.2008.37
315
7/29/2019 Understanding and Designing New Server Architectures for Emerging Warehouse-Computing Environments
http://slidepdf.com/reader/full/understanding-and-designing-new-server-architectures-for-emerging-warehouse-computing 2/12
impediments in duplicating these environments. These
environments have a strong focus on cost and power
efficiency, but there are currently no complete system-level cost or power models publicly available, further
exacerbating the difficulties.
2.1 A benchmark suite for the internet sector
In order to perform this study we have created a new benchmark suite with four workloads representative of
the different services in internet sector datacenters.
Websearch: We choose this to be representative of
unstructured data processing in internet sector
workloads. The goal is to service requests to searchlarge amounts of data within sub-seconds. Our
benchmark uses the Nutch search engine [21] running
on the Tomcat application server and Apache webserver. We study a 20GB dataset with a 1.3GB index of
parts of www.dmoz.org and Wikipedia. The keywords
in the queries are based on a Zipf distribution of thefrequency of indexed words, and the number of
keywords is based on observed real-world query
patterns [40]. Performance is measured as the number of requests per second (RPS) for comparable Quality of
Service (QoS) guarantees. This benchmark emphasizes
high throughput with reasonable amounts of data processing per request.
Webmail: This benchmark seeks to represent
interactive internet services seen in web2.0applications. It uses PHP-based SquirrelMail server
running on top of Apache. The IMAP and SMTP
servers are installed on a separate machine using
courier-imap and exim. The clients interact with theservers in sessions, each consisting of a sequence of
actions (e.g., login, read email and attachments,reply/forward/delete/move, compose and send). The
size distributions are based on statistics collected
internally within the University of Michigan, and theclient actions are modeled after MS Exchange Server
LoadSim “heavy-usage” profile [35]. Performance is
measured as the number of RPS for comparable QoSguarantees. Our benchmark includes a lot of network
activity to interact with the backend server.
Ytube: This benchmark is representative of web2.0
trends of using rich media types and models mediaservers servicing requests for video files. Our
benchmark consists of a heavily modified
SPECweb2005 Support workload driven with
Youtube™
traffic characteristics observed in edgeservers by [14]. We modify the pages, files, and
download sizes to reflect the distributions seen in [14],and extend the QoS requirement to model streaming
behavior. Usage patterns are modeled after a Zipf
distribution. Performance is measured as the number of requests per second, while ensuring that the QoS
violations are similar across runs. The workload
behavior is predominantly IO-bounded.
Mapreduce: This benchmark is representative of
workloads that use the web as a platform. We model acluster running offline batch jobs of the kind amenable
to the MapReduce [7] style of computation, consisting
of a series of “map” and “reduce” functions performedon key/value pairs stored in a distributed file system.
We use the open-source Hadoop implementation [13]
and run two applications – (1) mapreduce-wc that performs a word count over a large corpus (5 GB), and
(2) mapreduce-write that populates the file system with
randomly-generated words. Performance is measuredas the amount of time to perform the task. The
workload involves both CPU and I/O activity.
For websearch and webmail , the servers areexercised by a Perl-based client driver, which generates
and dispatches requests (with user-defined think time),
and reports transaction rate and QoS results. The client
driver can also adapt the number of simultaneousclients according to recently observed QoS results, to
achieve the highest level of throughput withoutoverloading the servers. For ytube we use a modified
SPECweb2005 client driver, which has similar
functionality to the other client drivers.We believe that our benchmark suite is a good
representative of internet sector workloads for this
study. However, this suite is a work in progress, andSection 4 discusses further extensions to model our
Table 1: Summary details of the new benchmark suite to represent internet sector workloads.
Workload Emphasize Description Perf metric
websearch the role of
unstructureddata
Open source Nutch-0.9, Tomcat 6 with clustering, and Apache2. 1.3GB index
corresponding to 1.3 million indexed documents, 25% of index terms cached inmemory. 2GB Java heap size. QoS requires >95% queries take <0.5 seconds.
Request-per-
sec (RPS) w/QoS
webmail interactiveinternetservices
Squirrelmail v1.4.9 with Apache2 and PHP4, Courier-IMAP v4.2 and Exim4.5.1000 virtual users with 7GB of mail stored. Email/attachment sizes and usagepatterns modeled after MS Exchange 2003 LoadSim heavy users. QoS requires>95% requests take <0.8 second.
RPS w/ QoS
ytube the use of rich media
Modified SPECweb2005 Support workload with Youtube traffic characteristics. Apache2/Tomcat6 with Rock httpd server.
RPS w/ QoS
mapreduce web as aplatform
Hadoop v0.14 with 4 threads per CPU and 1.5GB Java heap size. We study twoworkloads - distributed file write (mapred-wr) and word count (mapred-wc)
Executiontime
316316
7/29/2019 Understanding and Designing New Server Architectures for Emerging Warehouse-Computing Environments
http://slidepdf.com/reader/full/understanding-and-designing-new-server-architectures-for-emerging-warehouse-computing 3/12
target workloads even more accurately.
2.2 Metrics and models
Metrics: The key performance/price metric for internet sector environments is the sustainable
performance (Perf) divided by total cost of ownership
(abbreviated as TCO-$). For performance, we use thedefinition specific to each workload in Table 1. For
total lifecycle cost, we assume a three-year
depreciation cycle and consider costs associated with base hardware, burdened power and cooling, and real-
estate. In our discussion of specific trends, we also
consider other metrics like Performance-per-Watt(Perf/W) and performance per specific cost
components such as infrastructure only (Perf/inf-$) and power and cooling (Perf/P&C-$).
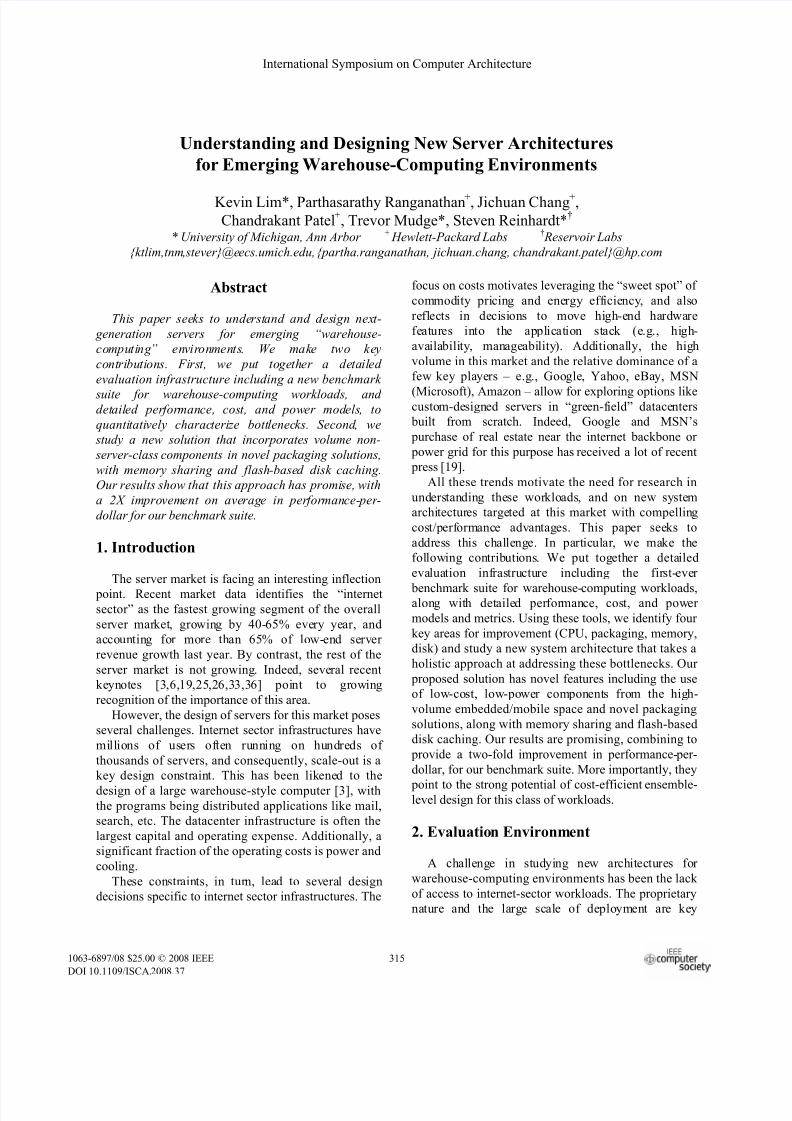
Cost model: The two main components of our cost
model are (1) the base hardware costs, and (2) the
burdened power and cooling costs. For the basehardware costs, we collect the costs of the individual
components – CPU, memory, disk, board, power and
cooling (P&C) components such as power supplies,fans, etc. – at a per-server level. We cumulate these
costs at the rack level, and consider additional switch
and enclosure costs at that level. We use a variety of sources to obtain our cost data, including publicly-
available data from various vendors (newegg, Micron,
Seagate, Western Digital, etc.) and industry-proprietarycost information through personal communications
with individuals at HP, Intel/AMD, ARM, etc.
Wherever possible, we also validated the consistencyof the overall costs and the breakdowns with prior
publications from internet-sector companies [3]. For
example, our total server costs were similar to thatlisted from Silicon Mechanics [16].
For the power and cooling costs, we have two
subcomponents. We first compute the rack-level power
consumption ( P_consumed ). This is computed as a sumof power at the CPU, memory, disk, power-and-
cooling, and the rest of the board, at the per-server
level, and additional switch power at the rack level.
Given that nameplate power is often overrated [11], wetried to obtain the maximum operational power
consumption of various components from spec sheets, power calculators available from vendors
[1,8,17,18,24,30,32], or personal communications with
vendors. This still suffers from some inaccuracies sinceactual power consumption has been documented to be
lower than worst-case power consumption [27]. We use
an “activity factor” of 0.75 to address this discrepancy.As validation, we compared the output of our model to
systems that we had access to and our model was
relatively close to the actual consumption. (We alsostudied a range of activity factors from 0.5 to 1.0 and
our results are qualitatively similar, so we don’t presentthem.)Second, we use P_consumed as input to determine
the burdened cost of power using the methodology
discussed by Patel et al. [27,28].
consumedgrids,1211 P*U*)L*K LK (1ostPowerCoolC
This model considers the burdened power and coolingcosts to consist of electricity costs at the rack level, the
amortized infrastructure costs for power delivery (K1),
the electricity costs for cooling (L1) and the amortizedcapital expenditure for the cooling infrastructure (K2).
For our default configuration, we use published data on
default values for K1, L1, and K2 [28]. There is a wide
variation possible in the electricity tariff rate (from$50/MWHr to $170/MWhr), but in this paper, we use a
default electricity tariff rate of $100/MWhr [27].Figure 1 illustrates our cost model.
Performance evaluation: To evaluate performance, we used HP Labs' COTSon simulator
[10], which is based on AMD's SimNow™ [5]
infrastructure. It is a validated full-system x86/x86-64simulator that can boot an unmodified Linux OS and
execute complex applications. The simulator guest runs
64-bit Debian Linux with the 2.6.15 kernel. The benchmarks were compiled directly in the simulated
machines where applicable. Most of the benchmarks
use Java, and were run using Sun’s Linux Java SDK 5.0 update 12. C/C++ code was compiled with gcc
4.1.2 and g++ 4.0.4. We also developed an offline
model using the simulation traces to evaluate memorysharing; this is discussed more in Section 3.4.
$3,249$5,758Total costs ($)
$1,561$2,4643-yr power & cooling
1.33 / 0.8 / 0.667K1 / L1 / K2
0.750.75 Activity factor
4040Server qty per rack
4040Switch/rack power
3540Power + fans
4050Board + mgmt
1015Disk
2525Memory
105210CPU
215340Server power (Watt)
$2,750$2,750Switch/rack cost
$250$500Power + fans
$250$400Board + mgmt
$120$275Disk
$350$350Memory
$650$1,700CPU
$1,620$3,225Per-server cost ($)
Srvr2Srvr1Details
DiskP&C2%
BoardP&C9%
Rack P&C 0%
MemP&C6%
BoardHW 8%
MemHW
11%
DiskHW 4%
RackHW 2%
CPUP&C22% Fan
HW 8%
CPUHW20%
Fans P&C 8%
Srv2 Costs Breakdown
(a) (b)
Figure 1: Cost models and breakdowns.
317317
7/29/2019 Understanding and Designing New Server Architectures for Emerging Warehouse-Computing Environments
http://slidepdf.com/reader/full/understanding-and-designing-new-server-architectures-for-emerging-warehouse-computing 4/12
3. A New Server Architecture
3.1 Cost Analysis and Approach Taken
Figure 1(a) lists the hardware component costs, the
baseline power consumption, and the burdened costs of power and cooling for two existing server configurations ( srvr1 and srvr2). Figure 1(b) presents a
pie-chart breakdown of the total costs for srvr2
separated as infrastructure (HW) and burdened power and cooling (P&C). Our data shows several interesting
trends. First, power and cooling costs are comparable
to hardware costs. This is consistent with recent studiesfrom internet sector workloads that highlight the same
trend [11]. Furthermore, the CPU hardware and CPU
power and cooling are the two largest components of total costs (contributing 20% and 22% respectively).
However, it can be seen that a number of other
components together contribute equally to the overallcosts. Consequently, to achieve truly compelling
performance/$ advantages, solutions need to
holistically address multiple components.Below, we examine one such holistic solution.
Specifically, we consider four key issues: (1) Can we
reduce overall costs from the CPU (hardware and power) by using high-volume lower-cost lower-power
(but also lower-performance) non-server processors?
(2) Can we reduce the burdened costs of power bynovel packaging solutions? (3) Can we reduce the
overall costs for memory by sharing memory across a
cluster/ensemble? (4) Can we reduce the overall costs
for the disk component by using lower-power (butlower performance) disks, possibly with emerging non-
volatile memory?Answering each of these questions in detail is not
possible within the space constraints of this paper. Our
goal here is to evaluate first, if considerable gains are possible in each of these areas when the architecture is
viewed from the ensemble perspective rather than as a
collection of individual systems, and second, if the
combination of the improvements in each of these areas
can lead to an overall design that improvessignificantly on the current state of the art.
Below, we evaluate each of these ideas in isolation
(3.2-3.5), and then consider the net benefits when these
solutions are used together (3.6).
3.2 Low-power low-cost CPUs
Whereas servers for databases or HPC have
traditionally focused on obtaining the highest performance per server, the scale-out nature of the
internet sector allows for a focus on performance/$ by
utilizing systems that offer a superior performance/$.Indeed, publications by large internet sector companies
such as Google [4] exhibit the usefulness of buildingservers using commodity desktop PC parts. The
intuition is that volume drives cost; compared to
servers that have a limited market and higher pricemargins, commodity PCs have a much larger market
that allows for lower prices. Additionally, these
processors do not include cost premiums for featureslike multiprocessor support and advanced ECC that are
made redundant by reliability support in the software
stack for internet sector workloads.In this section, we quantitatively evaluate the
benefits of such an approach studying the effectiveness
of low-end servers and desktops for this market. Wetake this focus on performance/$ one step further,
exploring an alternative commodity market – the
embedded/mobile segment. Trends in transistor scaling
and embedded processor design have brought powerful, general purpose processors to the embedded
space, many of which are multicore processors.Devices using embedded CPUs are shipped in even
more volume than desktops – leading to even better
cost savings. They are often designed for minimal power consumption due to their use in mobile systems.
Power is a large portion of the total lifecycle costs, so
greater power-efficiency can help reduce costs. Thekey open question, of course, is whether these cost and
power benefits can offset the performance degradation
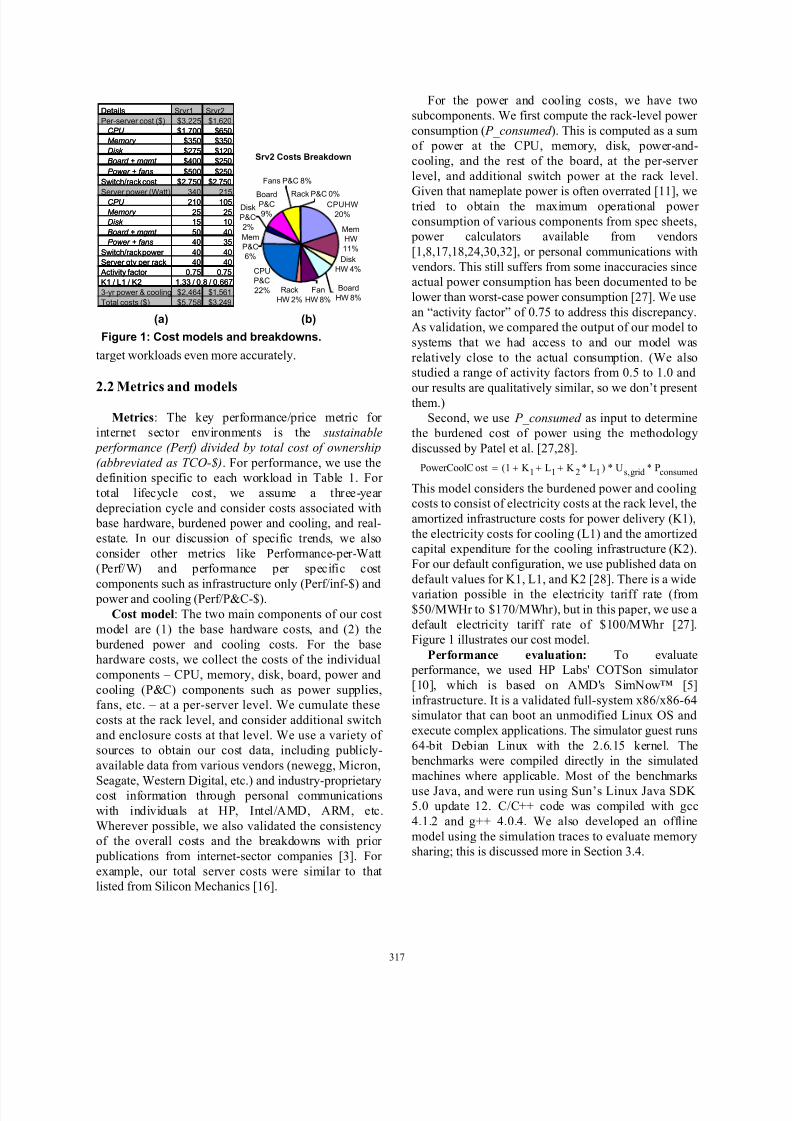
relative to the baseline server.In this section, we consider six different system
configurations (Table 2). Srvr1 and srvr2 representmid-range and low-end server systems; desk representsdesktop systems, mobl represents mobile systems, and
emb1 and emb2 represent a mid-range and low-end
embedded system respectively. All servers have 4 GBof memory, using FB-DIMM ( srvr1, srvr2), DDR2
(desk, mobl, emb1) or DDR1 (emb2) technologies.
Srvr1 has a 15k RPM disk and a 10 Gigabit NIC, while
Table 2: Summary of systems considered.
System "Similar to" System Features Watt Inf-$
Srvr1 Xeon MP,Opteron MP
2p x 4 cores, 2.6 GHz,OoO, 64K/8MB L1/L2
340 3,294
Srvr2 Xeon, Opteron 1p x 4 cores, 2.6 GHz,OoO, 64K/8MB L1/L2
215 1,689
Desk Core 2, Athlon
64
1p x 2 cores, 2.2 GHz,
OoO, 32K/2MB L1/L2
135 849
Mobl Core 2 Mobile,Turion
1p x 2 cores, 2.0 GHz,OoO, 32K/2MB L1/L2
78 989
Emb1 PA Semi,Emb. Athlon64
1p x 2 cores, 1.2 GHz,OoO, 32K/1MB L1/L2
52 499
Emb2 AMD Geode,VIA Eden-N
1p x 1 cores, 600MHz,inord.,32K/128K L1/L2
35 379
318318
7/29/2019 Understanding and Designing New Server Architectures for Emerging Warehouse-Computing Environments
http://slidepdf.com/reader/full/understanding-and-designing-new-server-architectures-for-emerging-warehouse-computing 5/12
all others have a 7.2k RPM disk and a 1 Gigabit NIC. Note that the lower-end systems are not balanced from
a memory provisioning point of view (reflected in the
higher costs and power for the lower-end systems thanone would intuitively expect). However, our goal is to
isolate the effect of the processor type, so we keep
memory and disk capacity constant (but in the differenttechnologies specific to the platform). Later sections
examine changing this assumption.
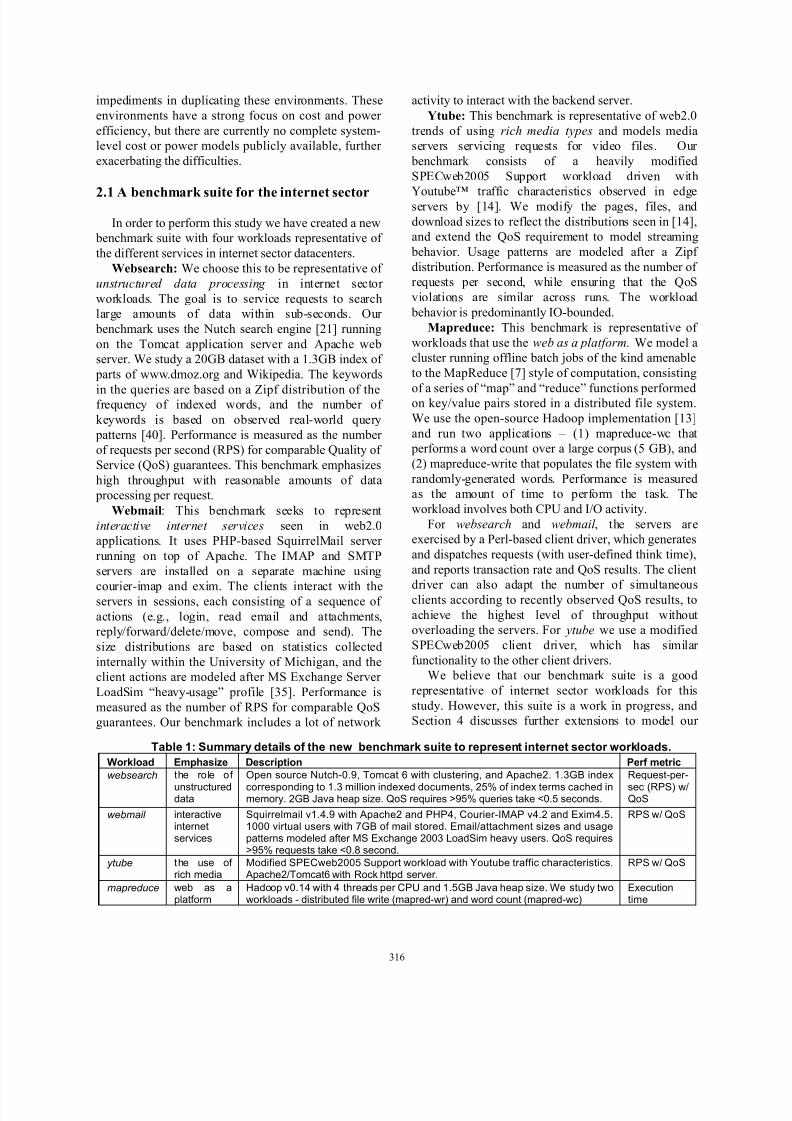
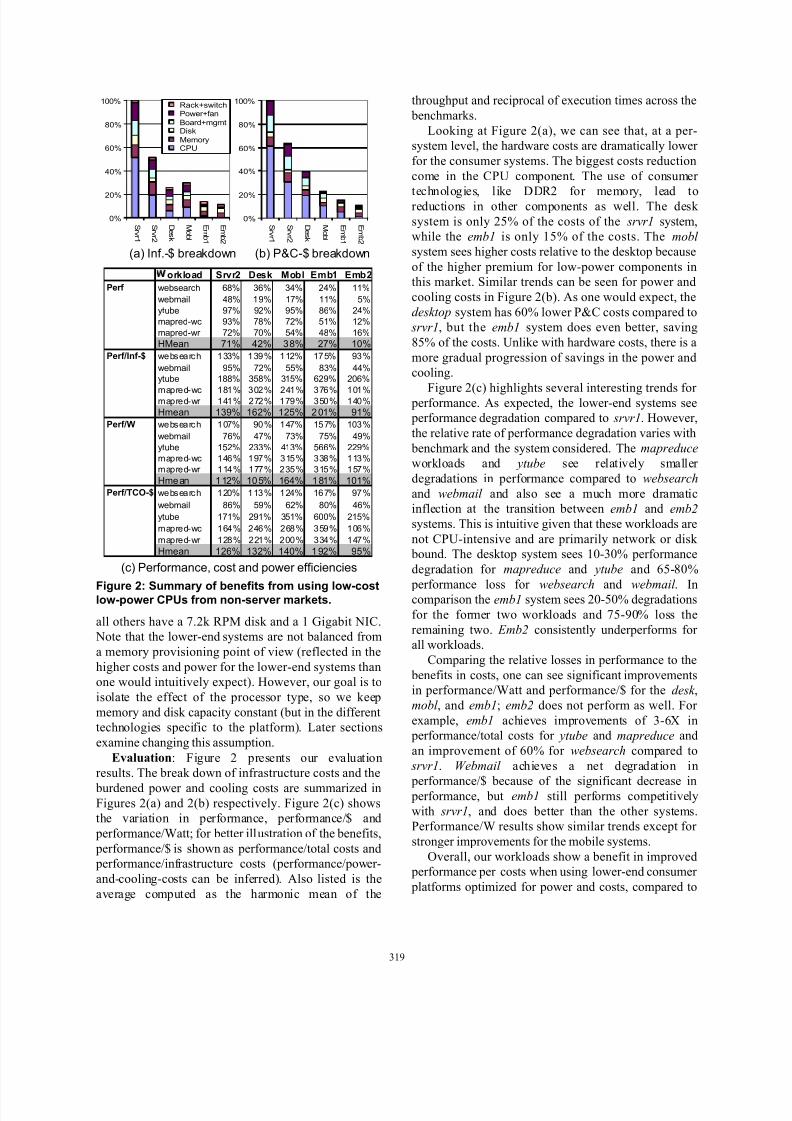
Evaluation: Figure 2 presents our evaluationresults. The break down of infrastructure costs and the
burdened power and cooling costs are summarized inFigures 2(a) and 2(b) respectively. Figure 2(c) showsthe variation in performance, performance/$ and
performance/Watt; for better illustration of the benefits,
performance/$ is shown as performance/total costs and performance/infrastructure costs (performance/power-
and-cooling-costs can be inferred). Also listed is the
average computed as the harmonic mean of the
throughput and reciprocal of execution times across the
benchmarks.
Looking at Figure 2(a), we can see that, at a per-system level, the hardware costs are dramatically lower
for the consumer systems. The biggest costs reduction
come in the CPU component. The use of consumer
technologies, like DDR2 for memory, lead toreductions in other components as well. The desk
system is only 25% of the costs of the srvr1 system,while the emb1 is only 15% of the costs. The mobl
system sees higher costs relative to the desktop because
of the higher premium for low-power components inthis market. Similar trends can be seen for power and
cooling costs in Figure 2(b). As one would expect, the
desktop system has 60% lower P&C costs compared to
srvr1, but the emb1 system does even better, saving
85% of the costs. Unlike with hardware costs, there is a
more gradual progression of savings in the power andcooling.
Figure 2(c) highlights several interesting trends for performance. As expected, the lower-end systems see performance degradation compared to srvr1. However,
the relative rate of performance degradation varies with
benchmark and the system considered. The mapreduce
workloads and ytube see relatively smaller
degradations in performance compared to websearch
and webmail and also see a much more dramaticinflection at the transition between emb1 and emb2
systems. This is intuitive given that these workloads are
not CPU-intensive and are primarily network or disk bound. The desktop system sees 10-30% performance
degradation for mapreduce and ytube and 65-80%
performance loss for websearch and webmail . Incomparison the emb1 system sees 20-50% degradations
for the former two workloads and 75-90% loss the
remaining two. Emb2 consistently underperforms for all workloads.
Comparing the relative losses in performance to the
benefits in costs, one can see significant improvementsin performance/Watt and performance/$ for the desk ,
mobl , and emb1; emb2 does not perform as well. For
example, emb1 achieves improvements of 3-6X in performance/total costs for ytube and mapreduce and
an improvement of 60% for websearch compared to
srvr1. Webmail achieves a net degradation in
performance/$ because of the significant decrease in performance, but emb1 still performs competitively
with srvr1, and does better than the other systems.Performance/W results show similar trends except for
stronger improvements for the mobile systems.
Overall, our workloads show a benefit in improved performance per costs when using lower-end consumer
platforms optimized for power and costs, compared to
orkload Srvr2 Desk Mobl Emb1 Emb2
Perf websearch 68% 36% 34% 24% 11%
webmail 48% 19% 17% 11% 5%
ytube 97% 92% 95% 86% 24%mapred-wc 93% 78% 72% 51% 12%
mapred-wr 72% 70% 54% 48% 16%
HMean 71% 42% 38% 27% 10%Perf/Inf-$ we bs ea rc h 1 33% 1 39 % 1 12% 17 5% 93 %
webmail 95% 72% 55% 83% 44%ytube 188% 358% 315% 629% 206%
mapred-wc 181% 302% 241% 376% 101%mapred-wr 141% 272% 179% 350% 140%
Hmean 139% 162% 125% 2 01% 91%Perf/W we bs ea rc h 1 07% 90 % 1 47% 15 7% 103 %
webmail 76% 47% 73% 75% 49%
ytube 152% 233% 413% 566% 229%mapred-wc 146% 197% 315% 338% 113%mapred-wr 114% 177% 235% 315% 157%
Hme an 1 12% 10 5% 164% 1 81% 101%Perf/TCO-$ we bs ea rc h 1 20% 1 13 % 1 24% 16 7% 97 %
webmail 86% 59% 62% 80% 46%
ytube 171% 291% 351% 600% 215%
mapred-wc 164% 246% 268% 359% 106%
mapred-wr 128% 221% 200% 334% 147%
Hmean 126% 132% 140% 1 92% 95%
(a) Inf.-$ breakdown (b) P&C-$ breakdown
(c) Performance, cost and power efficiencies
0%
20%
40%
60%
80%
100%
S r vr 1
S r vr 2
D e sk
M o b l
Em b 1
Em b 2
0%
20%
40%
60%
80%
100%
S r vr 1
S r vr 2
D e sk
M o b l
E m b 1
E m b 2
Rack+switchPower+fan
Board+mgmtDisk
MemoryCPU
Figure 2: Summary of benefits from using low-costlow-power CPUs from non-server markets.
319319
7/29/2019 Understanding and Designing New Server Architectures for Emerging Warehouse-Computing Environments
http://slidepdf.com/reader/full/understanding-and-designing-new-server-architectures-for-emerging-warehouse-computing 6/12
servers such as srvr1 and srvr2. Our desk configuration
performs better than srvr1 and srvr2 validating current
practices to use commodity desktops [4]. However, akey new interesting result for our benchmark study is
that going to embedded systems has the potential tooffer more cost savings at the same performance; but
the choice of embedded platform is important (e.g.
emb1 versus emb2). It must be noted that these resultshold true for our workloads, but more study is needed
before we can generalize these results to all variations
of internet sector workloads.Studying embedded platforms with larger amounts
of memory and disk added non-commodity costs to our
model that can be further optimized (the memory blade proposed in Section 3.4 addresses this). Additionally,
srvr1 consumes 13.6KW/rack while emb1 consumes
only 2.7KW/rack (for a standard 42U rack). We do notfactor this in our results, but this difference can either
translate into simpler cooling solutions, or smaller
form-factors and greater compaction. The next sectionaddresses the latter.
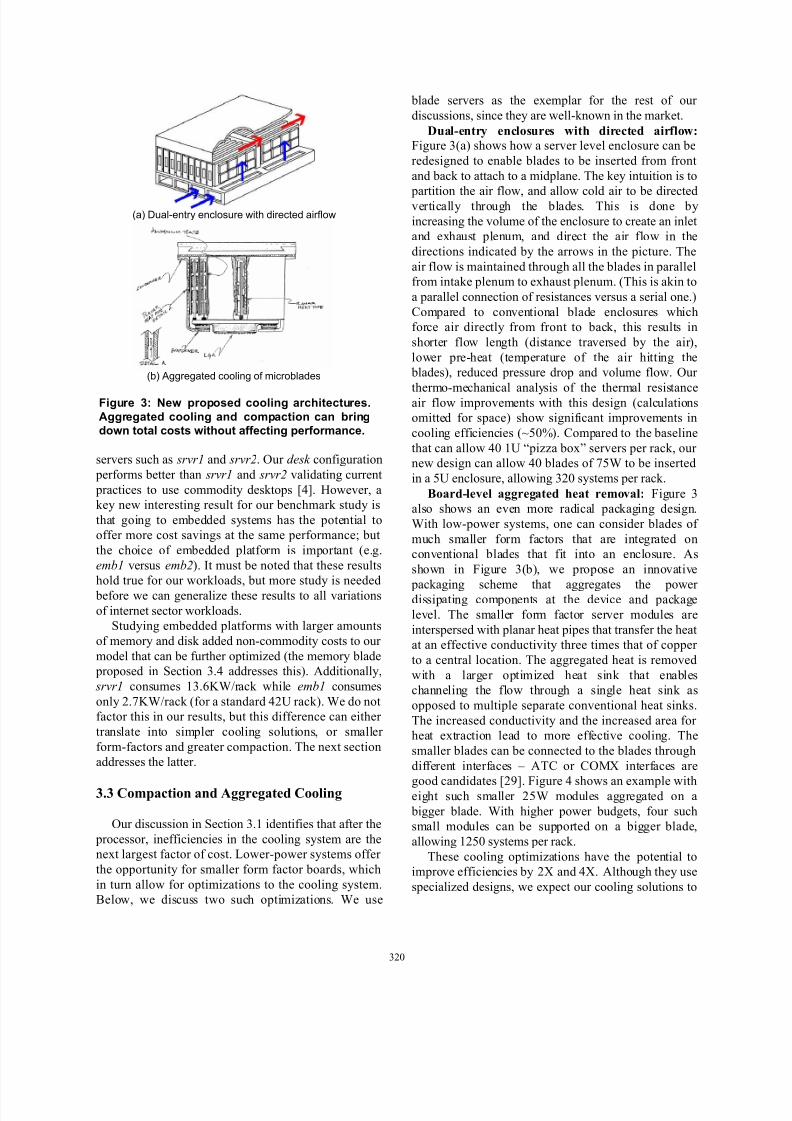
3.3 Compaction and Aggregated Cooling
Our discussion in Section 3.1 identifies that after the
processor, inefficiencies in the cooling system are thenext largest factor of cost. Lower-power systems offer
the opportunity for smaller form factor boards, which
in turn allow for optimizations to the cooling system.Below, we discuss two such optimizations. We use
blade servers as the exemplar for the rest of our
discussions, since they are well-known in the market.
Dual-entry enclosures with directed airflow:
Figure 3(a) shows how a server level enclosure can be
redesigned to enable blades to be inserted from front
and back to attach to a midplane. The key intuition is to
partition the air flow, and allow cold air to be directedvertically through the blades. This is done by
increasing the volume of the enclosure to create an inletand exhaust plenum, and direct the air flow in the
directions indicated by the arrows in the picture. The
air flow is maintained through all the blades in parallelfrom intake plenum to exhaust plenum. (This is akin to
a parallel connection of resistances versus a serial one.)
Compared to conventional blade enclosures whichforce air directly from front to back, this results in
shorter flow length (distance traversed by the air),
lower pre-heat (temperature of the air hitting the blades), reduced pressure drop and volume flow. Our
thermo-mechanical analysis of the thermal resistanceair flow improvements with this design (calculationsomitted for space) show significant improvements in
cooling efficiencies (~50%). Compared to the baseline
that can allow 40 1U “pizza box” servers per rack, our new design can allow 40 blades of 75W to be inserted
in a 5U enclosure, allowing 320 systems per rack.
Board-level aggregated heat removal: Figure 3also shows an even more radical packaging design.
With low-power systems, one can consider blades of
much smaller form factors that are integrated onconventional blades that fit into an enclosure. As
shown in Figure 3(b), we propose an innovative
packaging scheme that aggregates the power dissipating components at the device and package
level. The smaller form factor server modules are
interspersed with planar heat pipes that transfer the heatat an effective conductivity three times that of copper
to a central location. The aggregated heat is removed
with a larger optimized heat sink that enableschanneling the flow through a single heat sink as
opposed to multiple separate conventional heat sinks.
The increased conductivity and the increased area for heat extraction lead to more effective cooling. The
smaller blades can be connected to the blades through
different interfaces – ATC or COMX interfaces are
good candidates [29]. Figure 4 shows an example witheight such smaller 25W modules aggregated on a
bigger blade. With higher power budgets, four suchsmall modules can be supported on a bigger blade,
allowing 1250 systems per rack.
These cooling optimizations have the potential toimprove efficiencies by 2X and 4X. Although they use
specialized designs, we expect our cooling solutions to
(a) Dual-entry enclosure with directed airflow
(b) Aggregated cooling of microblades
Figure 3: New proposed cooling architectures.Aggregated cooling and compaction can bringdown total costs without affecting performance.
320320
7/29/2019 Understanding and Designing New Server Architectures for Emerging Warehouse-Computing Environments
http://slidepdf.com/reader/full/understanding-and-designing-new-server-architectures-for-emerging-warehouse-computing 7/12
be effective in other enterprise environments. When
combined with the significant and growing fraction of
the market represented by warehouse computingenvironments, these designs should have enough
volume to drive commoditization.
3.4 Memory Sharing
Memory costs and power are an important part of the system level picture, especially as the cost and
power of other components are reduced. Yet at a
datacenter level, it can be difficult to properly choosethe amount of memory in each server. The memory
demands across workloads vary widely, and past
studies have shown that per-server sizing for peak loads can lead to significant ensemble-level
overprovisioning [11,31]. To address memoryoverprovisioning, we provision memory at a coarser
granularity (e.g., per blade chassis), sizing each larger
unit to meet the expected aggregate peak demand. Our design provides a remote memory pool which is
divided among all the attached servers. This allows us
to provision memory more accurately across servers,and allows the attached servers to have smaller local
memories by exploiting locality to maintain high
performance. By right provisioning memory in such ahierarchical environment, we obtain power and costs
savings and enable further optimizations.
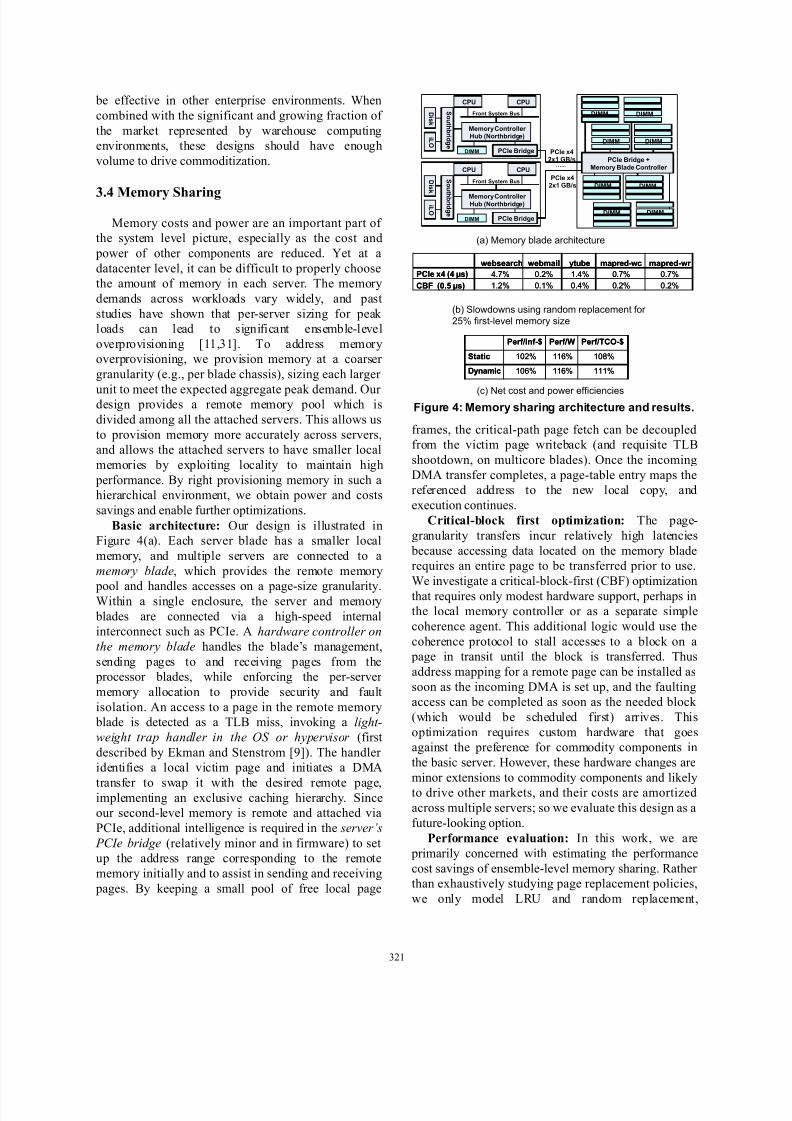
Basic architecture: Our design is illustrated inFigure 4(a). Each server blade has a smaller local
memory, and multiple servers are connected to a
memory blade, which provides the remote memory
pool and handles accesses on a page-size granularity.Within a single enclosure, the server and memory
blades are connected via a high-speed internalinterconnect such as PCIe. A hardware controller on
the memory blade handles the blade’s management,
sending pages to and receiving pages from the processor blades, while enforcing the per-server
memory allocation to provide security and fault
isolation. An access to a page in the remote memory blade is detected as a TLB miss, invoking a light-
weight trap handler in the OS or hypervisor (first
described by Ekman and Stenstrom [9]). The handler identifies a local victim page and initiates a DMA
transfer to swap it with the desired remote page,implementing an exclusive caching hierarchy. Sinceour second-level memory is remote and attached via
PCIe, additional intelligence is required in the server’s
PCIe bridge (relatively minor and in firmware) to setup the address range corresponding to the remote
memory initially and to assist in sending and receiving
pages. By keeping a small pool of free local page
frames, the critical-path page fetch can be decoupledfrom the victim page writeback (and requisite TLB
shootdown, on multicore blades). Once the incoming
DMA transfer completes, a page-table entry maps thereferenced address to the new local copy, and
execution continues.
Critical-block first optimization: The page-
granularity transfers incur relatively high latencies
because accessing data located on the memory bladerequires an entire page to be transferred prior to use.
We investigate a critical-block-first (CBF) optimization
that requires only modest hardware support, perhaps inthe local memory controller or as a separate simple
coherence agent. This additional logic would use the
coherence protocol to stall accesses to a block on a page in transit until the block is transferred. Thus
address mapping for a remote page can be installed as
soon as the incoming DMA is set up, and the faultingaccess can be completed as soon as the needed block
(which would be scheduled first) arrives. This
optimization requires custom hardware that goesagainst the preference for commodity components in
the basic server. However, these hardware changes are
minor extensions to commodity components and likelyto drive other markets, and their costs are amortized
across multiple servers; so we evaluate this design as a
future-looking option.
Performance evaluation: In this work, we are
primarily concerned with estimating the performance
cost savings of ensemble-level memory sharing. Rather than exhaustively studying page replacement policies,
we only model LRU and random replacement,
111%116%106%Dynamic
108%116%102%Static
Perf/TCO-$Perf/WPerf/Inf-$
111%116%106%Dynamic
108%116%102%Static
Perf/TCO-$Perf/WPerf/Inf-$
(a) Memory blade architecture
0.2%0.2%0.4%0.1%1.2%CBF (0.5 µs)
0.7%0.7%1.4%0.2%4.7%PCIe x4 (4 µs)
mapred-wr mapred-wcytubewebmailwebsearch
0.2%0.2%0.4%0.1%1.2%CBF (0.5 µs)
0.7%0.7%1.4%0.2%4.7%PCIe x4 (4 µs)
mapred-wr mapred-wcytubewebmailwebsearch
(b) Slowdowns using random replacement for 25% first-level memory size
(c) Net cost and power efficiencies
PCIe x42x1 GB/s
CPU CPU
Memory Controller Hub (Northbridge)
Front System Bus
PCIe Bridge
Di sk
S o u t h b r i d g e
DIMM
PCIe Bridge +Memory Blade Controller
DIMM
DIMM DIMM
DIMM
DIMM
DIMM DIMM
DIMM
PCIe x42x1 GB/s
…...CPU CPU
Memory Controller Hub (Northbridge)
Front System Bus
PCIe Bridge
i L O
Di sk
S o u t h b r i d g e
DIMM
i L O
Figure 4: Memory sharing architecture and results.
321321
7/29/2019 Understanding and Designing New Server Architectures for Emerging Warehouse-Computing Environments
http://slidepdf.com/reader/full/understanding-and-designing-new-server-architectures-for-emerging-warehouse-computing 8/12
expecting that an implementable policy would have
performance between these points. Due to the large
memory capacities involved, we use trace-drivensimulation for performance evaluation. We gather
traces on our benchmark suite using the emb1
processor model. We then use the traces with a simple
simulator to determine the number of misses to thesecond-level memory by modeling various first-level
memory sizes and replacement policies. The latenciesof such misses are estimated based on published PCIe
round-trip times [15] plus DRAM and bus-transfer
latencies, and then factored into the final performanceresults. We arrive at latencies of 4 µs for 4KB pages on
a PCIe 2.0 x4 link, and 0.75µs for the critical-block-
first (CBF) optimization. While our trace-basedmethodology cannot account for the second-order
impact of PCIe link contention or consecutive accesses
to the missing page in the CBF case, it includes enoughdetails to provide good estimates for our evaluation.
Using the baseline of emb1 (our deployment targetin Section 3), Figure 4(b) shows the relative performance of our two-level configuration using
random replacement. We studied baselines of both 4
GB and 2 GB, but report only 2 GB results to beconservative about our scaled down workloads. We
study two scenarios, one having 25% of memory be
local, and the other having 12.5% of the memory belocal. Our results show that baseline memory sharing
can cause slowdowns of up to 5% for 25%, and 10%
for 12.5% local-remote split. But the CPF optimizationcan bring these numbers down to ~1% for 25% and
2.5% for 12.5% local-remote split. The workloads
with larger memory usage, websearch and ytube, havethe largest slowdown, as we would expect. The CBF
optimization has a greater impact than increasing the
local memory capacity. LRU results (not shown) arenearly the same as Figure 4(b); random performs as
well as LRU on the benchmarks with high miss rates,
while the benchmarks where LRU outperforms randomhave low absolute miss rates and thus the performance
impact is minimal. These initial results indicate that a
two-level memory hierarchy with a first-level memoryof 25% of the baseline would likely have minimal
performance impact even on larger workloads. We
expect these trends to hold into the future as well, as
workload sizes and memory densities both increase.Cost evaluation: Our shared multi-level memoryarchitecture reduces hardware cost in two ways. First,
the total DRAM capacity of each blade enclosure may
be reduced relative to a conventional system in whicheach processor blade is provisioned for peak memory
requirements. Second, the reduced density and
performance requirements of the second-level memory
enable the use of lower-cost low-density DRAM
devices. Thus the memory blade can use devices at the
“sweet spot” of the commodity DRAM market, at asignificant cost savings relative to devices of the
highest available density.
This new memory architecture reduces power
consumption in two ways: by reducing the total amountof DRAM, and correspondingly the power, but by also
enabling the extended use of lower-power DRAMcomponents and modes on the memory blades.
Accesses to the memory blades are less frequent, are
always at page granularity, and their latency isdominated by transfer time across the PCIe link. As a
result, we can leave all of the memory-blade DRAM in
active power-down mode, which reduces power bymore than 90% in DDR2 [24], paying a relatively
minor latency penalty (6 DRAM cycles) to wake the
necessary devices and banks once on each access tofetch an entire page worth of data.
The memory blade does incur cost and power overheads, mainly due to the custom PCIe memorycontroller. However, this overhead is amortized over
multiple servers. We use a per-server (x4 lane) cost of
$10 and power consumption of 1.45W in our estimates, based on analysis of commercially available PCIe
switches [30] and memory controllers [18].
We calculate the cost and power saving for twoscenarios, both assuming that the processor blades have
25% of the baseline’s local memory, while remote
memory blades use devices that are slower but 24%cheaper [8]. The static partitioning scheme uses the
same total amount of DRAM as the baseline, with the
remaining capacity (75%) on the memory blades. Thedynamic provisioning scheme assumes that 20% of the
blades use only their local memory, allowing the total
system memory to be 85% of the baseline (25% local,60% on memory blades). We assume 2% slowdown
across all benchmarks. Figure 4(c) shows that both
schemes provide good benefits (16%) in system-level perf/P&C-$. The static scheme provides a negligible
(2%) improvement system perf/Inf-$, since it uses the
same total amount of DRAM, but the dynamic schemegains an additional 6% improvement there. These
figures combine to give 8% (static) and 11% (dynamic)
benefits in perf/TCO-$. Additionally, we expect
memory sharing to pay off in other ways, for example by enabling the use of commodity embedded
processors/boards with limited support for memoryexpansion, allowing greater compaction of processor
blades due to the reduced DRAM physical and power
footprints, and opening up the possibility of other optimizations such as memory compression [37],
content-based page sharing across blades [38], and
322322
7/29/2019 Understanding and Designing New Server Architectures for Emerging Warehouse-Computing Environments
http://slidepdf.com/reader/full/understanding-and-designing-new-server-architectures-for-emerging-warehouse-computing 9/12
DRAM/flash hybrid memory organizations. Overall,
though our current results indicate only modest benefits, we believe additional effort in this area will
yield further substantial gains.
3.5 Flash as disk-cache with low-power disks
Continuing our theme of using lower-power components and optimizing for the ensemble, this
section addresses the benefits from using lower-power
laptop disks. In addition to lower power, these have the benefit of a smaller form factor allowing greater
compaction for aggregated cooling (like in Section
3.3), but come with the tradeoffs of lower performanceand higher price. We consider using the laptop disks
moved to a basic Storage Area Network (SAN)
interfaced through the SATA interface. By utilizing aSAN, individual server blades do not have to be
physically sized to fit a disk, allowing the small module
form factor in Section 3.3 to be used.Additionally, we also examine the use of non-
volatile flash technology. As seen in Table 3(a), Flashhas desirable power, performance, and cost
characteristics well aligned with our goals. However,
one of the limitations of using flash is that it “wearsout” after 100,000 writes (assuming current
technology). While this is an important drawback,
predicted future technology and software fixes [20],along with the typical 3-year depreciation cycles and
software-failure tolerance in internet workloads still
argue for examining flash in these environments. In this paper, we explore using a flash-based disk caching
mechanism [20], with the flash being located on the
server board itself. The flash holds any recentlyaccessed pages from disk. Any time a page is not found
in the OS’s page cache, the flash cache is searched by
looking up in a software hash table to see if the flashholds the desired page.
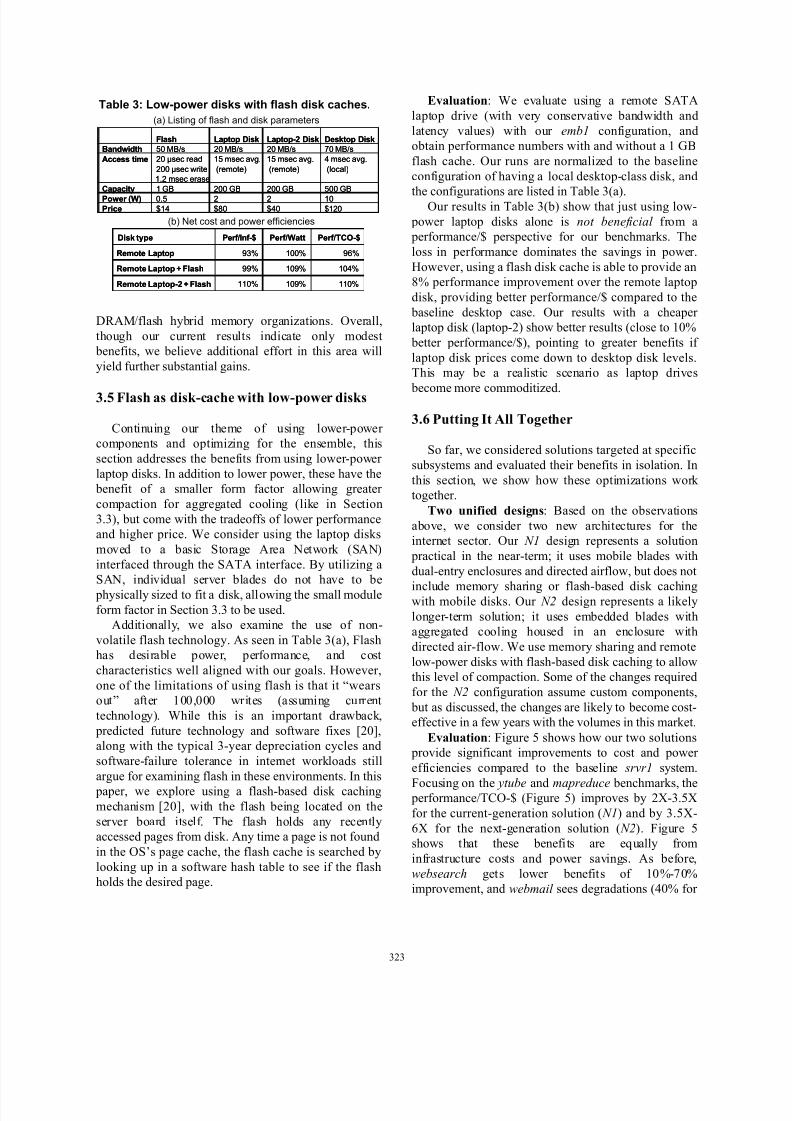
Evaluation: We evaluate using a remote SATA
laptop drive (with very conservative bandwidth and
latency values) with our emb1 configuration, andobtain performance numbers with and without a 1 GB
flash cache. Our runs are normalized to the baseline
configuration of having a local desktop-class disk, and
the configurations are listed in Table 3(a).Our results in Table 3(b) show that just using low-
power laptop disks alone is not beneficial from a performance/$ perspective for our benchmarks. The
loss in performance dominates the savings in power.
However, using a flash disk cache is able to provide an8% performance improvement over the remote laptop
disk, providing better performance/$ compared to the
baseline desktop case. Our results with a cheaper laptop disk (laptop-2) show better results (close to 10%
better performance/$), pointing to greater benefits if
laptop disk prices come down to desktop disk levels.This may be a realistic scenario as laptop drives
become more commoditized.
3.6 Putting It All Together
So far, we considered solutions targeted at specific
subsystems and evaluated their benefits in isolation. In
this section, we show how these optimizations work together.
Two unified designs: Based on the observations
above, we consider two new architectures for theinternet sector. Our N1 design represents a solution
practical in the near-term; it uses mobile blades with
dual-entry enclosures and directed airflow, but does not
include memory sharing or flash-based disk cachingwith mobile disks. Our N2 design represents a likely
longer-term solution; it uses embedded blades withaggregated cooling housed in an enclosure with
directed air-flow. We use memory sharing and remote
low-power disks with flash-based disk caching to allowthis level of compaction. Some of the changes required
for the N2 configuration assume custom components,
but as discussed, the changes are likely to become cost-effective in a few years with the volumes in this market.
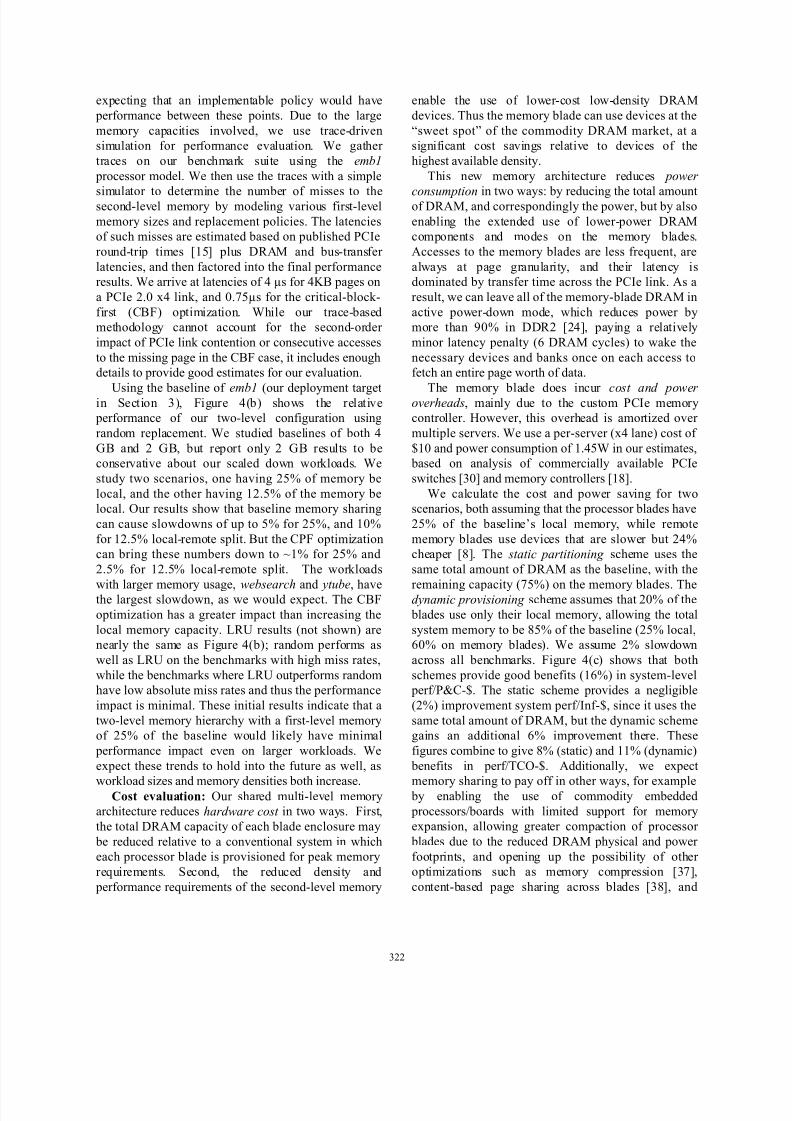
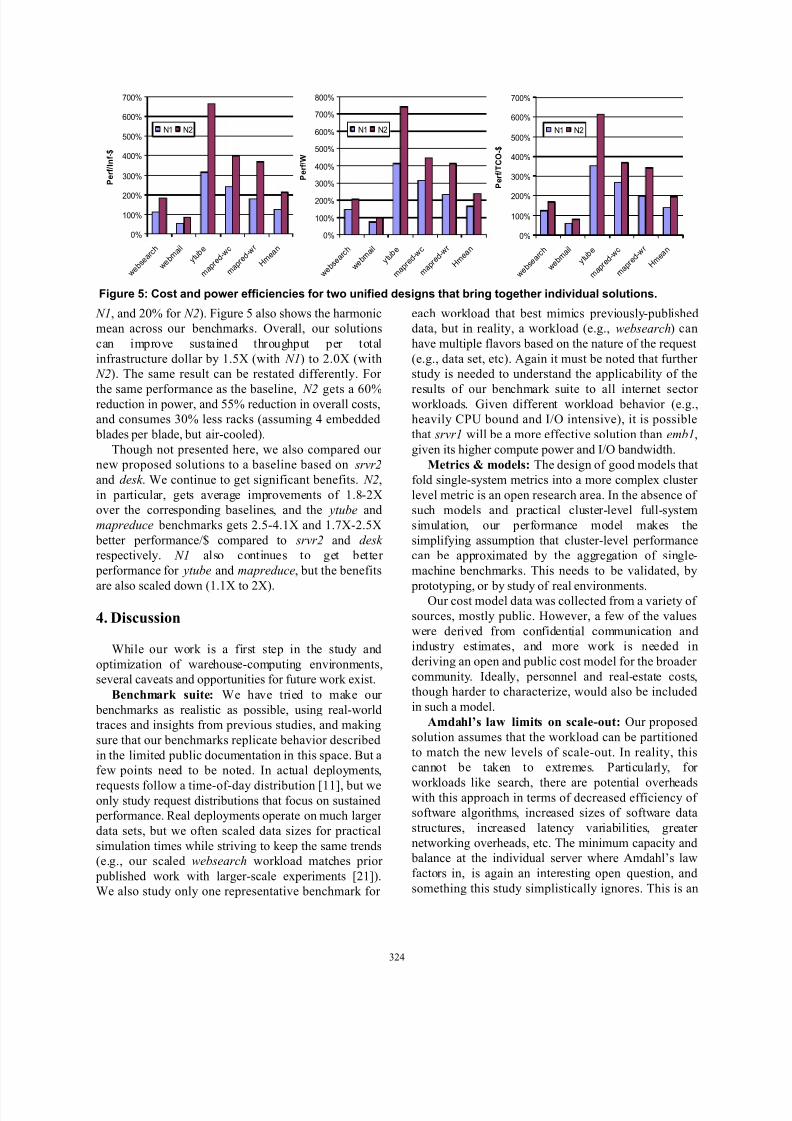
Evaluation: Figure 5 shows how our two solutions provide significant improvements to cost and power
efficiencies compared to the baseline srvr1 system.
Focusing on the ytube and mapreduce benchmarks, the performance/TCO-$ (Figure 5) improves by 2X-3.5X
for the current-generation solution ( N1) and by 3.5X-
6X for the next-generation solution ( N2). Figure 5shows that these benefits are equally from
infrastructure costs and power savings. As before,
websearch gets lower benefits of 10%-70%improvement, and webmail sees degradations (40% for
Table 3: Low-power disks with flash disk caches.
110%109%110%Remote Laptop-2 + Flash
104%109%99%Remote Laptop + Flash
96%100%93%Remote Laptop
Perf/TCO-$Perf/WattPerf/Inf-$Disk type
110%109%110%Remote Laptop-2 + Flash
104%109%99%Remote Laptop + Flash
96%100%93%Remote Laptop
Perf/TCO-$Perf/WattPerf/Inf-$Disk type
(a) Listing of flash and disk parameters
(b) Net cost and power efficiencies
$120$40$80$14Price10220.5Power (W)
500 GB200 GB200 GB1 GBCapacity1.2 msec erase
(local)(remote)(remote)200 µsec write
4 msec avg.15 msec avg.15 msec avg.20 µsec readAccess time
70 MB/s20 MB/s20 MB/s50 MB/sBandwidthDesktop DiskLaptop-2 DiskLaptop DiskFlash
$120$40$80$14Price10220.5Power (W)
500 GB200 GB200 GB1 GBCapacity1.2 msec erase
(local)(remote)(remote)200 µsec write
4 msec avg.15 msec avg.15 msec avg.20 µsec readAccess time
70 MB/s20 MB/s20 MB/s50 MB/sBandwidthDesktop DiskLaptop-2 DiskLaptop DiskFlash
323323
7/29/2019 Understanding and Designing New Server Architectures for Emerging Warehouse-Computing Environments
http://slidepdf.com/reader/full/understanding-and-designing-new-server-architectures-for-emerging-warehouse-computing 10/12
N1, and 20% for N2). Figure 5 also shows the harmonicmean across our benchmarks. Overall, our solutions
can improve sustained throughput per total
infrastructure dollar by 1.5X (with N1) to 2.0X (with
N2). The same result can be restated differently. For
the same performance as the baseline, N2 gets a 60%reduction in power, and 55% reduction in overall costs,and consumes 30% less racks (assuming 4 embedded
blades per blade, but air-cooled).
Though not presented here, we also compared our new proposed solutions to a baseline based on srvr2
and desk . We continue to get significant benefits. N2,
in particular, gets average improvements of 1.8-2Xover the corresponding baselines, and the ytube and
mapreduce benchmarks gets 2.5-4.1X and 1.7X-2.5X
better performance/$ compared to srvr2 and desk
respectively. N1 also continues to get better
performance for ytube and mapreduce, but the benefits
are also scaled down (1.1X to 2X).
4. Discussion
While our work is a first step in the study and
optimization of warehouse-computing environments,several caveats and opportunities for future work exist.
Benchmark suite: We have tried to make our
benchmarks as realistic as possible, using real-worldtraces and insights from previous studies, and making
sure that our benchmarks replicate behavior described
in the limited public documentation in this space. But afew points need to be noted. In actual deployments,
requests follow a time-of-day distribution [11], but weonly study request distributions that focus on sustained
performance. Real deployments operate on much larger
data sets, but we often scaled data sizes for practical
simulation times while striving to keep the same trends(e.g., our scaled websearch workload matches prior
published work with larger-scale experiments [21]).We also study only one representative benchmark for
each workload that best mimics previously-publisheddata, but in reality, a workload (e.g., websearch) can
have multiple flavors based on the nature of the request
(e.g., data set, etc). Again it must be noted that further study is needed to understand the applicability of the
results of our benchmark suite to all internet sector workloads. Given different workload behavior (e.g.,heavily CPU bound and I/O intensive), it is possible
that srvr1 will be a more effective solution than emb1,
given its higher compute power and I/O bandwidth.
Metrics & models: The design of good models that
fold single-system metrics into a more complex cluster
level metric is an open research area. In the absence of such models and practical cluster-level full-system
simulation, our performance model makes the
simplifying assumption that cluster-level performancecan be approximated by the aggregation of single-
machine benchmarks. This needs to be validated, by
prototyping, or by study of real environments.Our cost model data was collected from a variety of
sources, mostly public. However, a few of the values
were derived from confidential communication andindustry estimates, and more work is needed in
deriving an open and public cost model for the broader
community. Ideally, personnel and real-estate costs,though harder to characterize, would also be included
in such a model.
Amdahl’s law limits on scale-out: Our proposed
solution assumes that the workload can be partitioned
to match the new levels of scale-out. In reality, thiscannot be taken to extremes. Particularly, for
workloads like search, there are potential overheadswith this approach in terms of decreased efficiency of software algorithms, increased sizes of software data
structures, increased latency variabilities, greater
networking overheads, etc. The minimum capacity and balance at the individual server where Amdahl’s law
factors in, is again an interesting open question, and
something this study simplistically ignores. This is an
0%
100%
200%
300%
400%
500%
600%
700%
w e b s
e a r c h
w e b m
a i l
y t u b
e
m a p
r e d - w c
m a p
r e d - w r
H m e a
n
P e r f / I n f - $
N1 N2
0%
100%
200%
300%
400%
500%
600%
700%
800%
w e b s
e a r c h
w e b m
a i l
y t u b
e
m a p
r e d - w c
m a p
r e d - w r
H m e a
n
P e r f / W
N1 N2
0%
100%
200%
300%
400%
500%
600%
700%
w e b s
e a r c h
w e b m
a i l
y t u b
e
m a p
r e d - w c
m a p
r e d - w r
H m e a
n
P e r f / T C O - $
N1 N2
Figure 5: Cost and power efficiencies for two unified designs that bring together individual solutions.
324324
7/29/2019 Understanding and Designing New Server Architectures for Emerging Warehouse-Computing Environments
http://slidepdf.com/reader/full/understanding-and-designing-new-server-architectures-for-emerging-warehouse-computing 11/12
important caveat since it can bias the conclusions
towards overestimating benefits for smaller platforms
for some workloads. Similarly, we only address latencyto the extent our individual benchmark definitions have
QoS constraints on query response times (websearch,
webmail ), but primarily focus on throughput. More
aggressive simplification of the platform can haveimplications on single-system performance.
Architectural enhancements: Architecturally, aninteresting extension to our work is to consider minimal
changes to commodity manycore processors that can
further improve the performance, but without addingtoo much costs. Our memory sharing design can be
further improved by having DMA I/O going directly to
the second-level memory; other interestingarchitectures to support critical-block-first and
hardware TLB handlers are also possible. Our
packaging solutions also offer new opportunities for extensions at the datacenter level. More study is needed
of the use of flash memory at other levels of thememory hierarchy, as well as a disk replacement.
5. Related work
To the best of our knowledge, we are the first study
to perform a detailed quantitative analysis of tradeoffsin system architectures and evaluate new design
alternatives for the emerging internet-sector workloads.
We are not aware of any work that has looked atembedded processors in this space. Similarly, we are
not aware of prior work on the dual-entry blade designor the aggregated cooling with naked packages that we
discuss. Other approaches for multi-level memory have been proposed for compressed memory (such as IBMMXT [37]), memory banks in power-down mode [22]
or cooperative file caching [12]. We use similar
mechanisms to support two-level memory as Ekmanand Stenstrom [9]. Previously NOR Flash was
proposed as a replacement or supplement to disk [39].
The use of NAND flash as a disk buffer was proposed by Kgil and Mudge [20]; our approach uses similar
methodology but aimed at internet sector workloads.
Sun, APC, and HP have all discussed the notion of a“datacenter in a container” [2,26,28]. Our approaches
are orthogonal to this design philosophy. Some internet
companies are designing Greenfield datacenters, butthere is limited technical information on these, mainly
on Google [3,4,11]. Our desk system probably comes
closest to modeling some of these approaches, butacross our benchmarks, our solutions can achieve better
cost-performance efficiency.
Fan et al. discuss webmail, websearch, andmapreduce as three representative workloads for the
Google datacenter [11]. Our benchmark suite addresses
these three workloads and adds an additional workload
to model Youtube™-like behavior. A recent proposalfrom Sun discusses Web20Bench [34] focusing on one
interactive benchmark. We are in touch with the
developers and hope to use it when it becomes publicly
available.
6. Conclusions
Emerging internet sector companies using"warehouse scale" computing systems represent a large
growth market. Their large volume and willingness to
try custom solutions offer an interesting opportunity toconsider new server architectures with a strong
emphasis on cost, power and cooling, and scale-out. In
this paper, we seek to develop benchmarks and metricsto better understand this space and to leverage this
understanding to design solutions targeted at these
environments.We make several contributions. We put together a
new benchmark suite intended to model workloads and
behavior common to this sector. We also develop costmodels and evaluation metrics relevant to this space,
including an overall metric of performance per unit
total cost of ownership (Perf/TCO-$). We identify four key areas for improvement from the Perf/TCO-$
perspective (CPU, packaging, memory, and disk), and
study initial solutions that provide benefits relative tothe status quo in each of these areas. We show that
using embedded processors and flash memory can
provide significant Perf/TCO-$ advantages for our
benchmarks. We also propose and evaluate novelensemble-level Perf/TCO-$ optimizations in packaging
and cooling, and in the main memory/disk system. Our simulation results show that these techniques are
beneficial individually, but together, they demonstrate
the potential for significant improvements: 2X better performance/$ on average, and 3.5-6X on many of our
benchmarks.
These proposed techniques are not intended to bethe final word on warehouse-computing designs, but
merely to provide evidence for the substantial
improvements achievable when system architects takean ensemble-level view. Key next steps in our future
work are to expand our benchmark suite to address thecaveats discussed in Section 4 and to validate our
benchmarks against real-world warehouse
environments. These steps will allow us to determine
with confidence how broadly our techniques apply inthis sector. We also plan to study additional
optimizations and possibly prototype our designs.
325325
7/29/2019 Understanding and Designing New Server Architectures for Emerging Warehouse-Computing Environments
http://slidepdf.com/reader/full/understanding-and-designing-new-server-architectures-for-emerging-warehouse-computing 12/12
Further out, there are other interesting open areas of
research for the storage and network architectures
supporting our solution. For example, I/Oconsolidation and improved switch design make natural
fits to our architecture [23]. We are also examining the
applicability of our solutions for conventional
enterprise server workloads. Overall, as enterprisesgravitate towards ever more cost-conscious and
datacenter-level solutions, we believe that holisticapproaches like the ones used in this paper are likely to
be a key part of future system designs.
7. Acknowledgements
We would like to thank Luiz Barroso, Manas
Chaliha, and Dean Cookson for their encouragement
and useful comments. We would also like toacknowledge Reza Bacchus, Gary Campbell, Thomas
Flynn, Rich Friedrich, Mike Schlansker, John Sontag,
Niraj Tolia, Robert Van Cleve, Tom Wenisch, and theanonymous reviewers for their feedback.
8. References
[1] AMD. AMD Geode LX™ Processor Family.http://www.amd.com/geodelx900.
[2] APC. InfraStruXure® Express On-demand Mobile Data
Center. http://www.apc.com.
[3] L. Barroso. Warehouse-scale Computers. Invited talk at the
USENIX Annual Technical Conference, Santa Clara, CA, June
2007.
[4] L. Barroso, J. Dean, and U. Holzle. Web Search for a Planet:The Google Cluster Architecture. IEEE Micro, 23(2), March/April
2003.
[5] R. Bedichek. SimNow™: Fast Platform Simulation Purely inSoftware. In HotChips 16, 2004.
[6] R. Bryant. Data Intensive Super Computing. In FCRC, 2007.
Keynote.
[7] J. Dean and S. Ghemawat. MapReduce: Simplified Data
Processing on Large Clusters. In OSDI-6, 2004.[8] DRAMeXchange. DRAM Price Quotes.
http://www.dramexchange.com.
[9] M. Ekman and P. Stenstrom. A Cost-Effective Main Memory
Organization for Future Servers. In PDPS, 2005.
[10] A. Falcon, P. Faraboschi, and D. Ortega. Combining
Simulation and Virtualization through Dynamic Sampling. In
ISPASS, 2007.[11] X. Fan, W. Weber, and L. Barroso. Power Provisioning for a
Warehouse-sized Computer. In ISCA-34, 2007.
[12] W. Felter, T. Keller, M. Kistler, C. Lefurgy, K. Rajamani, R.
Rajamony, F. Rawson, B. Smith, and E. Van Hensbergen. On thePerformance and Use of Dense Servers. IBM Journal of Rearch and
Development, 47(5/6), 2003.
[13] Apache Software Foundation. Hadoop.http://lucene.apache.org/hadoop/index.html.
[14] P. Gill, M. Arlitt, Z. Li, and A. Mahanti. YouTube Traffic
Characterization: A View From the Edge. In Internet Measurement
Conference, 2007.
[15] B. Holden. Latency Comparison Between HyperTransport and
PCI-Express in Communication Systems. Technical report,
HyperTransport Consortium White Paper, November 2006.
[16] Silicon Mechanics Inc. Xeon 3000 1U Server.
http://www.siliconmechanics.com/i7573/xeon-3000-server.php.
[17] Intel. Intel Microprocessor Family Quick Reference Guide.http://www.intel.com/pressroom/kits/quickreffam.htm.
[18] Intel. Intel Server/Workstation Chipsets Comparison Chart.
http://developer.intel.com/products/chipsets/index.htm.[19] R. Katz. Research Directions in Internet-Scale Computing.
Keynote presentation, 3rd International Week on Management of
Networks and Services, 2007.
[20] T. Kgil and T. Mudge. FlashCache: a NAND Flash Memory
File Cache for Low Power Web Servers. In CASES'06, 2006.[21] R. Khare, D. Cutting, K. Sitaker, and A. Rifkin. Nutch: A
Flexible and Scalable Open-Source Web Search Engine. Technical
Report CN-TR-04-04, CommerceNet Labs, November 2004.
[22] A.R. Lebeck, X. Fan, H. Zeng, and C. Ellis. Power Aware
Page Allocation. In ASPLOX-IX, 2000.
[23] K. Leigh, P. Ranganathan, and J. Subhlok. Fabric
Convergence Implications on Systems Architecture. In HPCA 14,2008.
[24] Micron. DDR2 Memory Power Calculator.
http://download.micron.com/downloads/misc/ddr2_power_calc_web
.xls.[25] C. Moore. A Framework for Innovation. Keynote, FCRC,
2007.
[26] G. Papadopoulos. Redshift: The Explosion of Massive ScaleSystems. Analyst Summit, 2007.
[27] C. Patel and P. Ranganathan. Enterprise Power and Cooling:
A Chip-to-DataCenter Perspective. In HotChips 19, August 2007.
Tutorial.
[28] C. Patel and A. Shah. Cost Model for Planning, Development
and Operation of a Data Center. Technical Report HPL-2005-
107R1, Hewlett Packard Technical Report, 2005.[29] PCIMG. Advanced TCA Specification.
http://www.picmg.org/pdf/PICMG_3_0_Shortform.pdf.
[30] PLX. PLX PCIe Switch Power Consumption. http://
www.plxtech.com/pdf/technical/expresslane/Power_Consumption_E
xplained.pdf.
[31] P. Ranganathan, P. Leech, D. Irwin, and J. Chase. Ensemble-level Power Management for Dense Blade Servers. In ISCA-33,2006.
[32] Seagate. Barracuda 7200.10 Data Sheet.
http://www.seagate.com/docs/pdf/datasheet/disc/ds_barracuda_7200
_10.pdf.
[33] H. Simon. Energy Efficiency and Computing. In Lawrence
Berkeley National Laboratory, 2007. Keynote.
[34] A. Sucharitakul. Benchmarking in the Web 2.0 Era. In IISWC
2007, 2007. Panel Session.[35] Microsoft Technet. Tools for Performance Stressing Exchange
2003 Servers. 2003, http://technet.microsoft.com/en-
us/library/aa996207.aspx.
[36] C. Thacker. Rethinking Data Centers. Invited talk at Stanford
University Networking Seminar, October 2007.
[37] R. Tremaine, P. Franaszek, J. Robinson, C. Schulz, T, Smith,
M. Wazlowski, and P. Bland. IBM Memory Expansion Technology(MXT). IBM Journal of Rearch and Development, 45(2), 2001.
[38] C.A. Waldspurger. Memory Resource Management in
VMware ESX Server. In OSDI-4, 2002.
[39] M. Wu and W. Zwaenepoel. eNVy: A Non-Volatile, Main
Memory Storage System. In ASPLOS, 1994.
[40] Y. Xie and D. O'Hallaron. Locality in Search Engine Queries
and Its Implications for Caching. In Infocomm, 2002.
326326