Embed Size (px)
Citation preview
UNDERSTANDING AND MODELLING OF RESIDENTIAL WATER
USE BEHAVIOUR
YANG FU
A thesis submitted in partial fulfilment of the requirement of Staffordshire University
for the degree of Doctor of Philosophy
May 2018
Abstract
There is an increasingly water scarcity issue, both for developed and
developing countries. Water authorities are facing the challenges to secure the
need of consumers and water saving due to the climate change and the
population increase. To manage this water scarcity threat, water conservation
projects are gaining overall attendances by water utilities and government.
From the management perspective, it is desirable to investigate and
understand how consumers use water and their water use behaviours. The
main objective of this study is to develop a comprehensive understanding of
residential household water use behaviour through theoretical and modelling
perspectives.
This study is based on the Theory of Planned Behaviour (TPB) and proposed
an extended version of the Theory of Planned Behaviour (TPB) for
understanding the behaviour intervention mechanism. A survey of residential
water use behaviour in China was designed and conducted in 2014 and the
data was used to evaluate the extended theory. The theoretical evaluation has
proved that the ETPB could increase the predictive power compared to
original version of TPB, and also provide empirical evidence for the
correlations among ETPB variables.
Traditionally, static behaviour intervention models are widely utilised to
simulate behaviour intervention process. These static methods can predict
targeted human behaviour reasonably well, but they lack capabilities on
understanding and responding behaviour change process with concerned time
changes. Using the proposed ETPB theory, a dynamic behaviour intervention
model for household water use behaviour prediction is presented to introduce
the dynamic behavioural modelling solution. This model is based on adopted
Structure Equation Model approach and Control Engineering Concept. A case
study for household water consumption model using Artificial Neural
Network (ANN) is proposed to explore the link between behaviour value and
the water consumption amount, moreover, for evaluation of intervention trend
of proposed ETPB dynamic behaviour model with system parameter
identification.
This research findings demonstrated that household water consumption could
be saved by using proper behaviour change management strategies. The
significance of these findings about behaviour intervention modelling in water
end use areas is discussed. Also, potential applications of the ETPB-ANN
dynamic integrated modelling method for other research purpose are also
presented.
Understanding and Modelling of Residential Water Use Behaviour Yang Fu
I
Content
List of Figures ......................................................................................... iv
List of Tables .......................................................................................... vi
Glossary ................................................................................................ vii
Acknowledgements .............................................................................. viii
Publications ........................................................................................... ix
1 Introduction ......................................................................................... 1
1.1 Water Shortage and Conservation ................................................. 1
1.2 Household Water Conservation ..................................................... 3
1.3 Behaviour Change .......................................................................... 5
1.4 Behaviour Intervention Modelling ................................................. 7
1.5 Behaviour and Water Use ............................................................ 10
1.6 Aims and Objectives .................................................................... 11
1.7 Research Questions ..................................................................... 12
1.8 Application to Address the Research Questions .......................... 13
1.9 Research Highlights ...................................................................... 14
2 Literature Review ............................................................................... 16
2.1 Behaviour Change Theories ......................................................... 16
2.2 Behaviour Change for Water Conservation ................................. 19
2.3 Theory of Planned Behaviour ...................................................... 21
2.4 Behaviour Change Modelling ....................................................... 23
2.5 Household Water Use Behaviour Modelling ............................... 26
2.6 Research Gap ............................................................................... 28
2.7 Summary ...................................................................................... 30
3 Methodology...................................................................................... 32
3.1 Introduction ................................................................................. 32
3.2 Development of Expanded Theory of Planned Behaviour .......... 33
3.3 Questionnaire and Data Collection .............................................. 35
3.3.1 ETPB Questionnaire .......................................................... 36
3.3.2 Survey Method ................................................................. 39
3.3.3 Pre-testing Questionnaire ................................................. 40
3.3.4 Study Population ............................................................... 41
Understanding and Modelling of Residential Water Use Behaviour Yang Fu
II
3.4 Behaviour Intervention ................................................................ 45
3.5 Data Analysis ................................................................................ 46
3.5.1 Descriptive Statistics ......................................................... 46
3.5.2 Statistical Analysis ............................................................. 47
3.6 Dynamic Behaviour Intervention Modelling ................................ 55
3.7 Water Use Modelling ................................................................... 59
3.8 Summary ...................................................................................... 61
4. Data and Statistical Analysis .............................................................. 63
4.1 Introduction ................................................................................. 63
4.2 Sampling ...................................................................................... 63
4.3 Social-demographics Characteristics ........................................... 66
4.4 Mean Scores for ETPB Scales ....................................................... 69
4.5 Reliability ..................................................................................... 74
4.6 Validity and Factor Analysis ......................................................... 77
4.6.1 Initial Preliminary Analysis ................................................ 77
4.6.2 Initial Factor Extraction ..................................................... 78
4.6.3 Initial Factor Rotation ....................................................... 79
4.6.4 Validity and Factor Analysis without INT 4 ....................... 81
4.7 Confirmatory Factor Analysis ....................................................... 85
4.8 Summary ...................................................................................... 87
5. Expanded Theory of Planned Behaviour ............................................. 88
5.1 ETPB Architecture ........................................................................ 88
5.2 ETPB Evaluation ........................................................................... 91
5.3 The Role of Self-efficacy and PBC ................................................ 94
5.4 The Role of Past Behaviour .......................................................... 96
5.5 Summary ...................................................................................... 98
6. ETPB Dynamic Behaviour Intervention Modelling............................. 101
6.1 ETPB Structural Equation Model................................................ 101
6.2 Dynamic Fluid Analogy for ETPB ................................................ 103
6.3 Illustrative Simulations .............................................................. 108
6.4 ETPB Dynamic Model Estimation and Validation ...................... 111
6.5 Summary .................................................................................... 116
7 Behaviour and Water Use ................................................................. 117
7.1 Overview .................................................................................... 117
Understanding and Modelling of Residential Water Use Behaviour Yang Fu
III
7.2 ETPB-ANN Model Architecture .................................................. 118
7.3 ETPB-ANN Input Parameter ....................................................... 120
7.3.1 Influence Factors for Water Use Behaviour .................... 120
7.3.2 Subjective and Objective Parameters ............................. 123
7.4 ANN Water Use Model .............................................................. 124
7.5 ETPB-ANN Evaluation ................................................................. 129
7.6 Summary .................................................................................... 132
8 Conclusions and Future Work ........................................................... 136
8.1 Introduction ............................................................................... 136
8.2 Achievement of this Research ................................................... 136
8.3 Research Questions ................................................................... 137
8.4 Recommendations for Future Work .......................................... 142
8.5 Summary .................................................................................... 146
Bibliography ........................................................................................ 148
Appendix 1 Questionnaire Content (English Version) ........................... 159
Appendix 2 ETPB Model Simulink Structure ......................................... 170
Understanding and Modelling of Residential Water Use Behaviour Yang Fu
IV
List of Figures
Figure 1. Theory of Planned Action .............................................................. 22
Figure 2. Location of research area ............................................................... 65
Figure 3. Expanded TPB model for residential water conservation behaviour
based on TRA and TPB .................................................................................. 90
Figure 4. TPB (Model 1) Structural Equality Model explaining water
conservation behaviour (Standardized Solution Values) .............................. 92
Figure 5. TPB with self-efficacy (Model 2) Structural Equality Model
explaining water conservation behaviour (Standardized Solution Values) .. 93
Figure 6. Proposed ETPB (Model 3) Structural Equality Model explaining
water conservation behaviour (Standardized Solution Values) .................... 93
Figure 7. ETPB path diagram with five exogenous variables ξi seven
endogenous variables ηi regression weights βij and γij and disturbance
ζi. ................................................................................................................. 103
Figure 8. Flow Analogy of Behaviour Intervention Process ........................ 106
Figure 9. Behaviour change curve with variable attitude input (time unit is
“day”) .......................................................................................................... 110
Figure 10. Behaviour change curve with variable time delay (time unit is “day”)
..................................................................................................................... 111
Figure 11. Averaged behaviour observation scoring for a subset of ten
households .................................................................................................. 112
Figure 12. ETPB model semi physical subsystem ........................................ 113
Figure 13. Behaviour observation data (Solid Line) against behaviour
simulation result from the ETPB model (Dotted Line) ................................ 115
Understanding and Modelling of Residential Water Use Behaviour Yang Fu
V
Figure 14. ETPB-ANN model ....................................................................... 120
Figure 15. Typical three-layer back propagation neural network ............... 125
Figure 16. Basic Sigmoid transfer function ................................................. 126
Figure 17. Prediction error test of ETPB-ANN model: the error for prediction
(a) and the prediction error in percentage (b). ........................................... 129
Figure 18. Behaviour intervention of ETPB and ANN water consumption
model .......................................................................................................... 132
Understanding and Modelling of Residential Water Use Behaviour Yang Fu
VI
List of Tables
Table 1. Summary of the research methodology.......................................... 62
Table 2. Survey questions reliability and validity test results ...................... 70
Table 3. Reliability analysis for ETPB constructs ........................................... 76
Table 4. Initial KMO and Bartlett's test ......................................................... 78
Table 5. Initial Factor Extraction ................................................................... 79
Table 6. Initial Rotated Factor Matrix ........................................................... 80
Table 7. KMO and Bartlett's test without INT 4 ............................................ 82
Table 8. Factor Extraction without INT 4 ...................................................... 82
Table 9. Rotated Factor Matrix without INT 4 .............................................. 83
Table 10. AVE value for latent variables after rotation ................................. 84
Table 11. Distinguishing self-efficacy in TPB: rotated factor matrix for
principal components analysis ...................................................................... 95
Table 12. Indirect effects analysis ................................................................. 97
Table 13. Drivers for household water use ................................................. 122
Table 14. Subjective and objective parameter for household water use ... 124
Table 15. Statistical evaluation result of ETPB-ANN ................................... 129
Understanding and Modelling of Residential Water Use Behaviour Yang Fu
VII
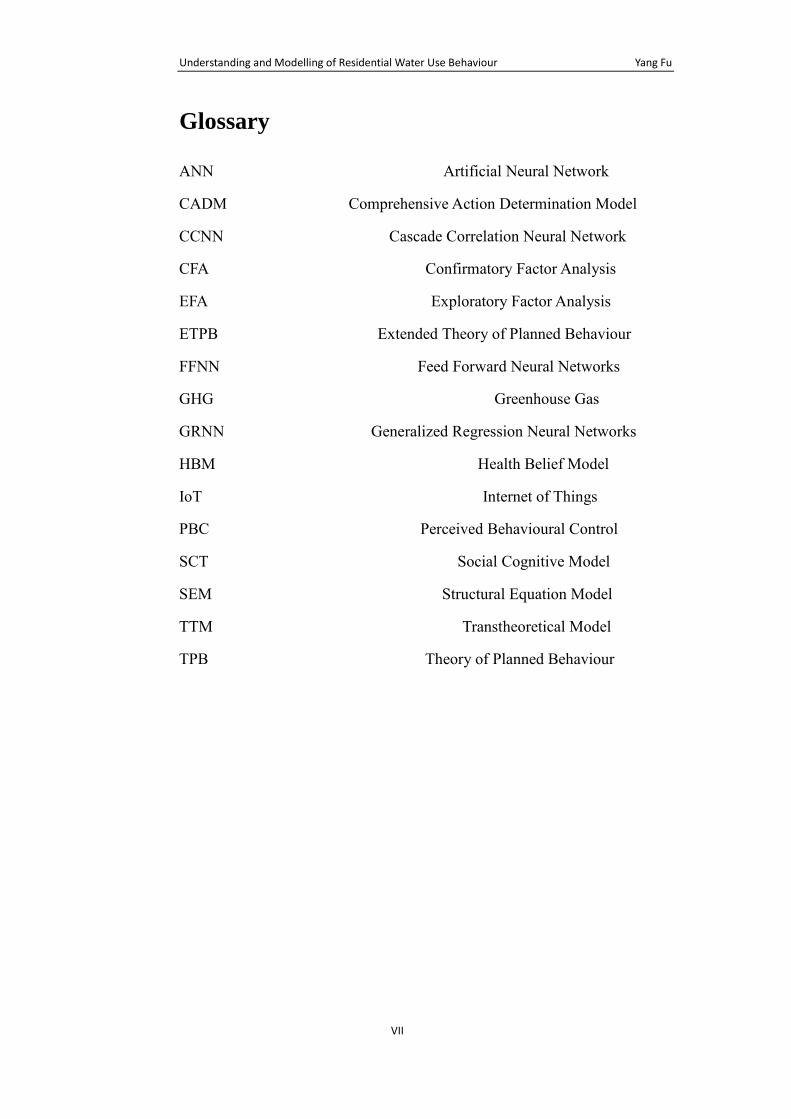
Glossary
ANN Artificial Neural Network
CADM Comprehensive Action Determination Model
CCNN Cascade Correlation Neural Network
CFA Confirmatory Factor Analysis
EFA Exploratory Factor Analysis
ETPB Extended Theory of Planned Behaviour
FFNN Feed Forward Neural Networks
GHG Greenhouse Gas
GRNN Generalized Regression Neural Networks
HBM Health Belief Model
IoT Internet of Things
PBC Perceived Behavioural Control
SCT Social Cognitive Model
SEM Structural Equation Model
TTM Transtheoretical Model
TPB Theory of Planned Behaviour
Understanding and Modelling of Residential Water Use Behaviour Yang Fu
VIII
Acknowledgements
My PhD study was made possible thanks to the help of my supervisors, friends,
family and colleagues. Special thanks go to my principal supervisor Professor
Wenyan Wu for her valuable advice, guidance, and generous support during
all the stages of my PhD study. I also thank my advisers Professor David Webb
and Dr Jinliang Gao for their helps. I must say thanks to my mother and other
family members who supported my study and cared a lot for my life in UK.
My great appreciation also gives to my wife Kitty Zilin Wang who has
encouraged, accompanied and supported me in the final two years’ study. She
did not measure efforts to help me and cope with difficulties in our family. I
appreciate the help from my colleagues and friends, who in one way or another
way made this project possible. Thanks to Ambreen Hussain, Chen Chen and
Liang Zhao. I acknowledge all supports received from Wei Zhou from SZ
water company and all the participants who took part in different data
collection phases of this research.
I also would like to acknowledge the generous PhD scholarship support from
Staffordshire University, the European the Seventh Framework Program (FP7)
WatERP (318603) and FP7 Marie Curie Actions - SmartWater (PIRSES-GA-
2012-318985).
Understanding and Modelling of Residential Water Use Behaviour Yang Fu
IX
Publications
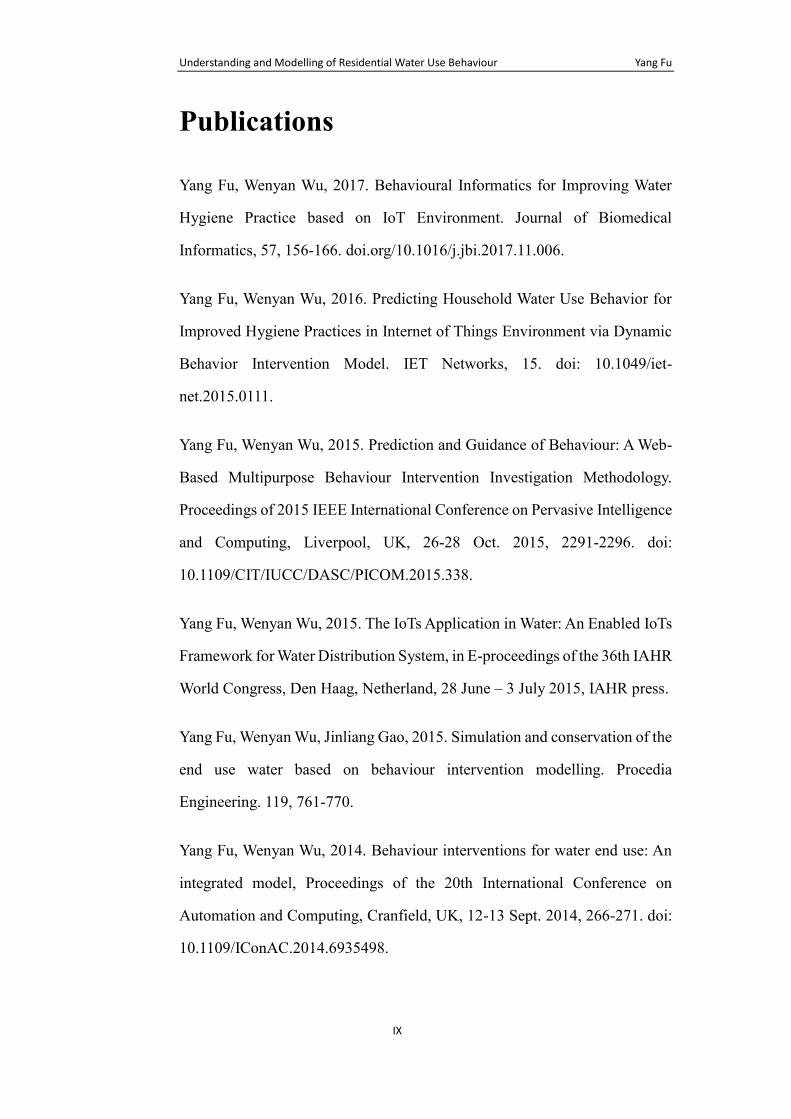
Yang Fu, Wenyan Wu, 2017. Behavioural Informatics for Improving Water
Hygiene Practice based on IoT Environment. Journal of Biomedical
Informatics, 57, 156-166. doi.org/10.1016/j.jbi.2017.11.006.
Yang Fu, Wenyan Wu, 2016. Predicting Household Water Use Behavior for
Improved Hygiene Practices in Internet of Things Environment via Dynamic
Behavior Intervention Model. IET Networks, 15. doi: 10.1049/iet-
net.2015.0111.
Yang Fu, Wenyan Wu, 2015. Prediction and Guidance of Behaviour: A Web-
Based Multipurpose Behaviour Intervention Investigation Methodology.
Proceedings of 2015 IEEE International Conference on Pervasive Intelligence
and Computing, Liverpool, UK, 26-28 Oct. 2015, 2291-2296. doi:
10.1109/CIT/IUCC/DASC/PICOM.2015.338.
Yang Fu, Wenyan Wu, 2015. The IoTs Application in Water: An Enabled IoTs
Framework for Water Distribution System, in E-proceedings of the 36th IAHR
World Congress, Den Haag, Netherland, 28 June – 3 July 2015, IAHR press.
Yang Fu, Wenyan Wu, Jinliang Gao, 2015. Simulation and conservation of the
end use water based on behaviour intervention modelling. Procedia
Engineering. 119, 761-770.
Yang Fu, Wenyan Wu, 2014. Behaviour interventions for water end use: An
integrated model, Proceedings of the 20th International Conference on
Automation and Computing, Cranfield, UK, 12-13 Sept. 2014, 266-271. doi:
10.1109/IConAC.2014.6935498.

Chapter 1: Introduction Yang Fu
1
1 Introduction
This chapter gives an overview of research this PhD thesis. It starts with a
description of the background, definitions of the aims and objectives for this
study, by the research questions and the approach to address these questions,
and structure of this thesis
1.1 Water Shortage and Conservation
Considering the climate change and the increase of human population, the
resources of drinking water are considered as a precious part of nature which
needs to be conserved and effectively used. There is evidence that almost 80%
of the world’s population is exposed to high threats of water scarcity
(Vörösmarty et al., 2010). Human activities are placing unsustainable
demands on the water resources with over-extracted ground water supplies
and inadequate water flows. In the next decades, water resources will be under
more pressure by urbanisation, population growth and economic development.
By 2050, around 2 billion people will be living in countries with absolute
water scarcity, and two-thirds of the world’s population could be living under
water stressed conditions (Vörösmarty et al., 2010). In the meantime, climate
change is likely to exacerbate existing stressors on water resources. Almost
half of the world’s population will be living under high water stress of water
scarcity by 2030, including around 180 million people in Africa (Vörösmarty
Chapter 1: Introduction Yang Fu
2
et al., 2010). In addition, 24 – 700 million people in semi-arid places will face
water scarcity.
Addressing water scarcity will require a range of adaptive approaches enacted
at different levels (individual, community, area, country or international).
Reducing demand by improving the efficiency of water use necessities is
essential for water scarcity issues and understanding how water is used and in
what ways water savings can be realized (Bradley Jorgensen et al., 2009). A
comprehensive review by Inman and Jaffrey (2016) showed that demand
management could reduce residential water consumption by 10-20% for a
decade period. With water conservation promotion, demand management is
an appropriate approach for improving water efficiency. In their review, they
concluded that relatively moderate reduction could be achieved via modest
price increase and voluntary alternative demand management tools but larger
reductions in demand requires stringent mandatory policy instruments. In line
with this finding, Renwick and colleagues (2000) made a comparison of the
efficacy for different demand management methods, and found voluntary
measures reduce less water demand compared to mandatory water restrictions
or allocations. However, even achieved higher reduction in water remand,
pricing mechanisms and mandatory approaches have drawbacks in their
implementation, and limits to price elasticity of demands, and research
evidence showed that mandatory approaches do not necessarily result in long-
Chapter 1: Introduction Yang Fu
3
term intervention (Duke et al., 2000). On the contrary, research (Bradley
Jorgensen et al., 2009) suggested voluntary approaches involving behaviour
intervention are critical for long-term water use habit shifts, and these shifts
can be complied with other management approaches. Moreover, different
from supply-side management, demand management involves more attention
on the amount and water use pattern by consumers. In this way, demand
management approaches paid as much attention to behaviour study as it did
to infrastructure (Brooks, 2006).
1.2 Household Water Conservation
By concerned climate change and the increase of human population, the
resource of drinking water is considered as a precious part of the nature which
needs to be conserved and effectivly used. About 65% of the total water use
in the most cities of developing countries (including industrial consumption
etc.) is from household level, which are responsible for a big share of water
consumption (Geoffrey J. Syme et al., 2004). These situations decide that
water conservation and management at the household level should be regard
as an increasingly important issue for urban utilities and governments (Tingyi
Liu, 2007). The governments have been trying to promote projects to conserve
household water use with different strategies such as Chinese step water price,
grey water reuse promotion, educational water saving dissemination, low-
Chapter 1: Introduction Yang Fu
4
interest loans and the adoption of water conservation technologies (Blanke et
al., 2007; Liu et al., 2008). However, studies show that greater understanding
of water conservation behaviour and how behavioural intervention can be
influenced, are supposed to play crucial role to meet the water saving targets
(Yazdanpanah, 2014).
The researches for reducing household water consumption have potential to
achieve significant water savings. Tradition solutions for residential water
saving promotion include upgrading the network, adjusting and optimizing
the water use pattern (Bates B. Kudzewics et al., 2008). It cannot be denied
that water conservation in community or city level from engineering
perspective could make a difference. However, these engineering solutions
paid fewer attentions to the household level and cannot effectively increase
the residential water conservation awareness. Behavioural change depends on
encouraging residents’ agreement within a broader environment of
appropriate policy, information and awareness raising (Blanke et al., 2007),
this has won success in the past decade for improving water conservation
efficiency.
This study brings together behavioural change theory with behavioural
intervention modelling to understand the household water conservation
behaviour intervention process. Using these combinations, this research,
therefore, offers theoretical basis of water conservation behaviour
Chapter 1: Introduction Yang Fu
5
intervention and the understanding of behavioural intervention process for
residential water conservation projects.
1.3 Behaviour Change
The behaviour change science is designed to target people or community with
a design and implement programs (‘interventionists’) that produce a desired
behaviour (Chen Y et al., 2005). For household water conservation, more
researches have been done to change users’ behaviour or specific water –
relevant behaviours (Kenney D. et al., 2008). Specifically, the behaviour
science can be used to understand users’ attitude and reactions towards
different intervention of water business like billing change. Technically, more
research on behaviour change is mainly based on the development of BCM
(behaviour change model) level and application of BCM level (Bates B.
Kudzewics et al., 2008). The definition for the development of BCM is
investigated to specify BCM framework for water use. Applications of the
BCM researches mainly are focused on the mature theory of BCM for water
use likes “water is money” concept by Australia States and Territories in 1996
(Marshen J et al., 2006).
Water related behaviour varies differently by areas, also, many water use
related to behavioural interventions have not yet been empirically investigated
because they do not lead themselves to study under existing research paradigm
Chapter 1: Introduction Yang Fu
6
(Australia Psychological Society, 2010). Models including the Theory of
Planned Behaviour (Ajzen, 1991), the Theory of Reasoned Action (TRA) and
Schwartz’s norm activation model etc., have been applied to investigate the
conserving water issues during water scarcity period in many developed
countries, such as USA (Pirie et al., 2004), UK (Gilg and Barr, 2006),
Australia (Hurlimann et al., 2009) and Greece (Jones et al., 2011). However,
there is lack of evidences for explaining residential water conservation
behaviour via theoretical viewpoints in different background, especially using
a multi-purpose methodology to generate empirical model. One of the few
exceptions is Zhang and Brown (Zhang and Brown, 2005) who found that
with using habits and behaviour (physical behavioural pattern) as well as a
household’ willingness to respond to water related strategies, this had positive
influence on water consumption amount. Chen et al. studied the relationship
between social-psychological and residential characters of water scarcity on
the one hand and drinking water choices on the other. His research found that
personal health belief and other factors (income, education etc.) affected
domestic drinking water choices in Shanghai (Chen et al., 2012). These
researches do not, however, address how water use behaviour change can be
influenced and what the adaptability for a psychological theory is in diverse
cultural background. Therefore, there is a need to develop understanding of
Chapter 1: Introduction Yang Fu
7
the residential water conservation behaviour intervention mechanisms. This
research thus tries to fill the research gaps
This research therefore is to provide empirical evidences about the intentions
of resident toward water conservation strategies, as well as water conservation
behaviour change with respect to it. This study proposed the Expanded Theory
of Planned Behaviour (ETPB) as a behaviour change theory basis and tested
the past behaviour and self-efficacy as predictor in the whole theory which
will be different from the original TPB (Theory of Planned Behaviour) model.
This provides a first knowledge base for public water conservation strategies
and policy development that aims to increase water conservation engagement
among residents.
1.4 Behaviour Intervention Modelling
Despite its importance for scientific research and policy making, stumbling
blocks to investigate water conservation behaviour are apparent in the
economic research on water demand and consumption. First, standard
economic models have disadvantage with neglecting psychological and
sociological factors, even behaviour (Jianjun Tang et al., 2013). Also,
economic drivers and characteristic of water demand gain more attention
rather than social psychological determinants of water conservation behaviour
(Bradley et al., 2009).
Chapter 1: Introduction Yang Fu
8
Moreover, despite the social significance of water end use research, no studies
have examined the relationship between household water use and the users’
behaviour intervention process, even the interactions of different influence
factors. Studies in the past correlated on modelling attitude of household water
use and other behaviour change variables with the total water consumption,
rather than understanding the process of the behaviour intervention. It has
disadvantages of not having a clear understanding about the influences by the
process of behaviour change in the water use areas. Taking the social and
economic models for examples, these models have high accuracy for
prediction, however, their models cannot be used to supervise the behaviour
change without considering the significance and understanding of behaviour
intervention process (Bradley et al., 2009).
The internet supported behaviour change research has been extensively
researched previously. For example, Thomas L Webb al. etc. (2010) reviewed
85 studies published coding frames for assessing use of theory and behaviour
change models to promote online health behaviour change. Most commonly
used methods for conducting behaviour change are theories which support to
delineate the key determinants of behaviour, followed by statistical methods
to analyse the factor relationship or linkages. Models and Theories are widely
applied include Theory of Reasoned Action (TRA), Theory of Planned
Behaviour (TPB), Transtheoretical model (TTM), Health belief Model (HBM)
Chapter 1: Introduction Yang Fu
9
and Social cognitive model (SCT) etc. As the technology support for analysis
of behaviour change model, statistics methods are accepted by researchers
(Andria and Carl, 2011). Multiple Linear Regression and Structure Equation
Model (SEM) are the commonly used statistical techniques in behaviour
science. Interestingly, statistic approach using SEM is still valuable to
simulate behaviour change but showed less capability to simulate intervention
system over time. Engineering control principles showed its applicability to
areas in the behavioural science which involve dynamical systems, such as
time-varying adaptive intervention (Daniel and Michael, 2007). Fundamental
control engineering and adaptive intervention terminology such as dynamic
system (refer to multivariate time-varying process), tailoring variables and
process analysis could benefit to current behaviour change modelling research.
Using Expanded Theory of Planned Behaviour (ETPB), a dynamic behaviour
intervention model for household water user behaviour prediction is presented
to introduce the dynamic behavioural modelling solution. This model is based
on adopted Structure Equation Model approach and Control Engineering
Concept. A case study for household water consumption model using Artificial
Neural Networks (ANN) is proposed to explore the link between behaviour
intervention process and the predicted water consumption amount, moreover,
evaluate intervention trend of proposed ETPB dynamic behaviour model with
system parameter identification.
Chapter 1: Introduction Yang Fu
10
1.5 Behaviour and Water Use
Reducing water demand by improving the efficiency of water use necessitates
an understanding of how the water is used and in what ways water
conservation can be realized. Stumbling blocks to achieving this goal are
obverse in economic and social research on water management and demand
control (Jorgensen et al., 2009). Economic researches have gained more
attention than the social or psychological determinants of water conservation,
but it lacks evidence to integrate economic and social viewpoints from
literature. The implementation and outcomes of water conservation from
economic and social researches are tended to be context. Generalizations, for
example, are hard to draw by using these solutions. Moreover, constrained by
site and issue specific factor, economic and social theoretical and application
underpinnings are derived from general theories of consumer behaviour
developed in non-water domains (e.g., energy conservation, goods
consumption or waste recycling, etc.). Thus, the development of integrated
water conservation model is sorely necessary (Jorgensen et al., 2009).
A few studies have proposed conceptual models concerned behaviour change
factors could contribute to the understanding of water conservation activities.
Jorgensen et al., (Jorgensen et al., 2009) has systematically reviewed these
models in his research and proposed a global social and economic household
water consumption model, however, these research outcomes do not show
Chapter 1: Introduction Yang Fu
11
enough evidences to reveal the relationship between water use and behaviour
intervention process which is foundation to guide behaviour change in practise.
1.6 Aims and Objectives
The aim of this research is to develop an Expanded Theory of Planned
Behaviour (ETPB) and propose corresponding dynamic water intervention
model by concerned time changes. Within this overall aim, specific objectives
were developed, providing a breakdown of the main research aim. The
specific objectives of this research are as follows:
⚫ To review the literature of the behavioural change models/frameworks
for water use, the way to simulate water end use process and better
understand the individual’s attitude towards the conservation of
household water by different data collection methods.
⚫ To review the theory of planned behaviour and identify the method to
improve the predictive power of this theory for household water use
behaviour.
⚫ To design the questionnaire for household water use behaviour
investigation.
⚫ To evaluate the extended version theory of planned behaviour and test the
predictive power.
Chapter 1: Introduction Yang Fu
12
⚫ To generate the behaviour change suggestions for improve intervention
project efficiency via ETPB
⚫ To develop a dynamic psychological model (behaviour change model)
for simulating household water consumption.
⚫ To implement the model for understanding human behavioural for
predicting water end use consumption.
⚫ To evaluate model and improve the accuracy of the stimulation results.
1.7 Research Questions
The following research question are to be answered during the course of this
PhD:
1. What is the current background of research related to household water use,
and what is the background for current water saving behavioural
intervention projects?
2. What are the models or theories for predicting water related behaviours
and have these models showed good enough prediction power?
3. What are the drawbacks of theory of planned behaviour for predicting
household water use behaviours and how to improve the theory?
4. What is the survey method for household water use behaviour and how to
evaluate the prediction power?
Chapter 1: Introduction Yang Fu
13
5. What are the roles for past behaviour and self-efficacy in theory of planned
behaviour and how their introductions affect the original TPB model?
6. How to use extended theory of planned behaviour to guide the computer
simulation for dynamic behaviour intervention?
7. How to link the psychological behaviour value to the real water
consumption?
1.8 Application to Address the Research Questions
To answer these research questions, a range of methods were developed. An
extensive literature review took place to answer the first three research
questions.
This report has set out a clear method of approach for the simulation and
conservation of end use water based on behaviour intervention modelling
(Chapter 1). The investigation of water end use modelling and its behaviour
understanding proved that current water use models have drawbacks in the
areas of: behaviour change pattern, behaviour change understanding,
modelling supports for water end use by concerned behaviour change
(Chapter 2). Methodology of this study for solving the problems above has
been presented in Chapter 3. In the ETPB-ANN model, the identification of
four key issues has showed the text as model architecture (Section 3.3.1),
methodology (including sampling, questionnaire and measurement in Section
Chapter 1: Introduction Yang Fu
14
3.1, data analysis in Section 3.2, behaviour change modelling (Section 3.3.2)
and the ANN water end use model (Section 3.3.3). The statistical analysis is
outlined in Chapter 4. Assessment for ETPB theory and prediction ability is
presented in Chapter 5. Chapter 6 provides dynamic solutions for ETPB
behavioural modelling and system identification conclusion. Chapter 7 is
presented to explore the link between behavioural change and water use
amount. Chapter 8 is the summary of this PhD research project.
1.9 Research Highlights
The overall contribution from this research is to develop both theoretical and
computational modelling solution for understanding household water
conservation behaviour. This study proposed an extended version of TPB with
empirical evidence support for improving behaviour intervention
understanding in water conservation domain and investigated the novel
modelling solution by concerned time serials. The linkage and application for
behavioural intervention theory and model have also been explored in this
research by using ANN modelling method. Contributions to the knowledge in
this research can be summarised as below:
1. Develop an extended theory of planned behaviour for understanding the
water conservation behaviour change and improve the TPB behaviour
prediction ability.
Chapter 1: Introduction Yang Fu
15
2. Explore the direct and indirect effects for introduction of Past Behaviour
and Self-efficacy in TPB and test the notion difference between Self-
efficacy and PBC (Perceived Behavioural Control) is the water
conservation domain.
3. Analyse and evaluate the empirical ETPB model for understanding
current Chinese water conservation behaviour intervention situation.
4. Use control engineering concept and system identification method to
simulate behaviour intervention process and introduce time serials in the
dynamic modelling system.
5. Propose a water consumption model (ETPB-ANN) considering
behaviour intervention process and explore the link between behaviour
intervention process and water consumption amount.
Chapter 2: Literature Review Yang Fu
16
2 Literature Review
The argument set out in this chapter comprehensively reviews the area of
research and describes the technological approaches that have been adopted
in this area of research. This chapter is set out as follows. Section 2.1 reviews
the behaviour change theories and researches, followed by section 2.2 which
descripts the water use behaviour literature review. Section 2.3 is about the
Theory of Planned Behaviour and its application. Section 2.4 is about the
water use behaviour modelling. In section 2.5, water end use modelling
technologies review is presented. Section 2.6 discusses the research gap of
this study and Section 2.7 is the summary of this chapter.
2.1 Behaviour Change Theories
Human behaviour is generally complicated and determined by massive factors
such as sociographic, psychological, personal, situational factors. Ajzen (1985)
argued that “people approach various kinds of behaviour in much the same
way and that the same limited set of constructs can be applied to predict and
understand any behaviour of interest”. Ajzen and Fishbein starts to investigate
attitudes and social norms and determines the behaviour which was
formulated as Theory of Reasoned Action (TRA). From 1980’s onwards
Ajzen added another element to the original TRA: external factors such as
Perceived Behaviour Control to contribute the capacity to perform behaviour.
Chapter 2: Literature Review Yang Fu
17
The theory then afterwards was named as Theory of Planned Behaviour (TPB)
and explains the consequence of available alternatives, weight the normative
expectations when people are faced with a situation to decide a course of
action. In the model, Ajzen (1991) stated intentions can be predicted from
attitude toward behaviour, Subjective Norm (SN) and Perceived Behaviour
Change (PBC). This theory provided the understanding of the psychological
and non-psychological influences on behaviour. Schwartz (Kaiser et al, 2005)
proposed Norm Activation Model (NAM) that the precondition for
conducting a behaviour is based on the awareness of consequences and
understanding of responsibility. Value-Beliefs Norm (VBN) is another theory
for predicting environmental behaviour based on TPB and NAM comprising
contextual factors such as regulations and costs.
Recently, Klockner and Blobaum (2010) designed the Comprehensive Action
Determination Model (CADM) to explain ecological behaviour via an
updated framework from TPB and NAM with adding more complicated
measurement of objective and perceived control. Both NAM and CADM
proved a higher explanatory ability than TPB in travelling behaviour
prediction, however, more research is needed to household water use field and
there is a need to develop and validate a higher predictive model. Kaiser et al.
(1999) proved that about 40% of the variance of ecological behaviour
intention could be explained by environmental values based on the analysis of
Chapter 2: Literature Review Yang Fu
18
the relation between attitude and behaviour. Enhanced understanding of the
stages of behaviour change, the transtheoretical model of behaviour change
adds the complexity of human reasoning decision making processes.
Davies et al. (2015) reviewed all theories which considered individual
behaviour as outcome and found out there are 82 theories reported in the
literature. The fitness of different behaviour theories is the subject of many
studies (Davies et al., 2015), and about 36 studies applied TPB as theoretical
basis which proved a stronger explanatory power than other theories.
However, there is no straightforward evidence about the universality of these
behaviour theories in literature. TPB has been applied in considerable number
of studies on theoretical sustainability and the environmental behaviours such
as paying water utility bills promptly, water recycling, irrigation management
and residential saving water behaviour (Lam,1999; Lam, 2006; Clark and
Finley, 2007; Dolnicar et al., 2012; Gilg and Barr, 2006).
Even behaviour change theories and models have been used widely in many
environmental research. Current behaviour change evaluation method is still
limited to quantitative and qualitative evaluation methods. Damien Sweeney
(2009) noted that the literature of measuring success of environmental
behaviour change programs is very limited and that many programs lack
adequate measures of evaluation. A systematic review of point-of-use water
related intervention by Fiebelkorn et al. (2012) found that most behaviour
Chapter 2: Literature Review Yang Fu
19
change projects use statisctics analysis method to investigate the intervention
process, leading to a result that cannot effectivly shows the relationship
between time and the behaviour value change. As modelling and feeding back
real-time behaviour intervention result has very significant meaning for
behaviour intervention research, it allows the possibility of understanding for
different behaviour change pattern and visibility of real time behaviour change
outcome in any online or IoT platform.
2.2 Behaviour Change for Water Conservation
Water use and conservation behaviour recognition are critical aspects of water
demand management highlighting the needs for understanding of
psychological processes that underline residential water demand (Russell, S.
and Fielding, k, 2010). In research, they concluded that only through
identifying the key psychological and social drivers of water conservation, can
effective policy be developed to address urban water demand management.
Despite a clear need for development in this area, scant researches have been
paid to the psychology in understanding and promoting water conservation
behaviour change projects (Trumbo et al, 1999).
For the household water conservation, current researches are mainly focused
on the development of the behaviour change model (BCM) and application of
the BCM. The application level for BCM the mature theory of BCM and apply
Chapter 2: Literature Review Yang Fu
20
it for water use research. There are a lot of researches to change people’s water
use behaviour or specific water-relevant behaviours (Ezra M. Markowitz et
al., 2009) in this level. Specifically, the behaviour science can be used to
understand users’ attitude and reactions towards different intervention of the
water related business. For example, advertising campaigns conducted by
Australia States and Territories in 1996 were centred on a “water is money”
concept and followed a price increase for water billing. Moreover, research in
the water use field is to reduce the water consumption for household,
community and individual. A study by Kurz and Donaghue used combination
information leaflets, labels and feedback to change water use behaviour and
they have achieved about 23% reduction in 2005 (Kenney D. et al., 2008).
The development of BCM level means studies make it into BCM more
specific framework for water use. The behaviour change method used for the
water research is based on the original and the modern psychological research
and use it to develop a new framework for water use research. Like the
UKWIR project CU02 in 2012, the research team applied the new
MINDSPACE behaviour change framework to encourage greater use of “self-
service” facilities.
The application of BCM in the water conservation area applied social and
economic model to simulate the human behaviour influence on the water
consumption. Inevitably, this method has its limitation. It has been introduced
Chapter 2: Literature Review Yang Fu
21
as a signal or few behavioural parameters in the modelling process which is
not sufficient offer a clear understanding for the intervention process. Even
though many researchers have presented the models of water use stimulation
and prediction (Bradley Jorgensen et al., 2009; Luaky-Froukh, M., 2001;
Pblebitski, A. et al., 2010), they are still not sufficient to address the issues
about how customer’ behaviours changed and what is the relationship between
psychological behaviour and real water consumption.
2.3 Theory of Planned Behaviour
Theory of Planned Behaviour (TPB) is a widely-applied expectancy-value of
attitude-behaviour relationships which met some success in predicting
behaviour. This theory is an extension of the theory of reasoned action (TRA),
developed by Ajzen in 1988. Both models were designed to provide
parsimonious information and motivational influences on behaviour. The
TRA suggests that people’ intention to engage in that behaviour is the
proximal determinant. Intention represents the motivation in the sense of
her/his conscious plan to exert effort to act the behaviour. In suggesting that
behaviour is only under the control of intention, the TRA model limits itself
to volitional behaviours. Ajzen proposed an extension version for the TRA to
cover the limitations of TRA. In TPB theory, the underlying assumption is
that humans are rational and make systematic use of available information
Chapter 2: Literature Review Yang Fu
22
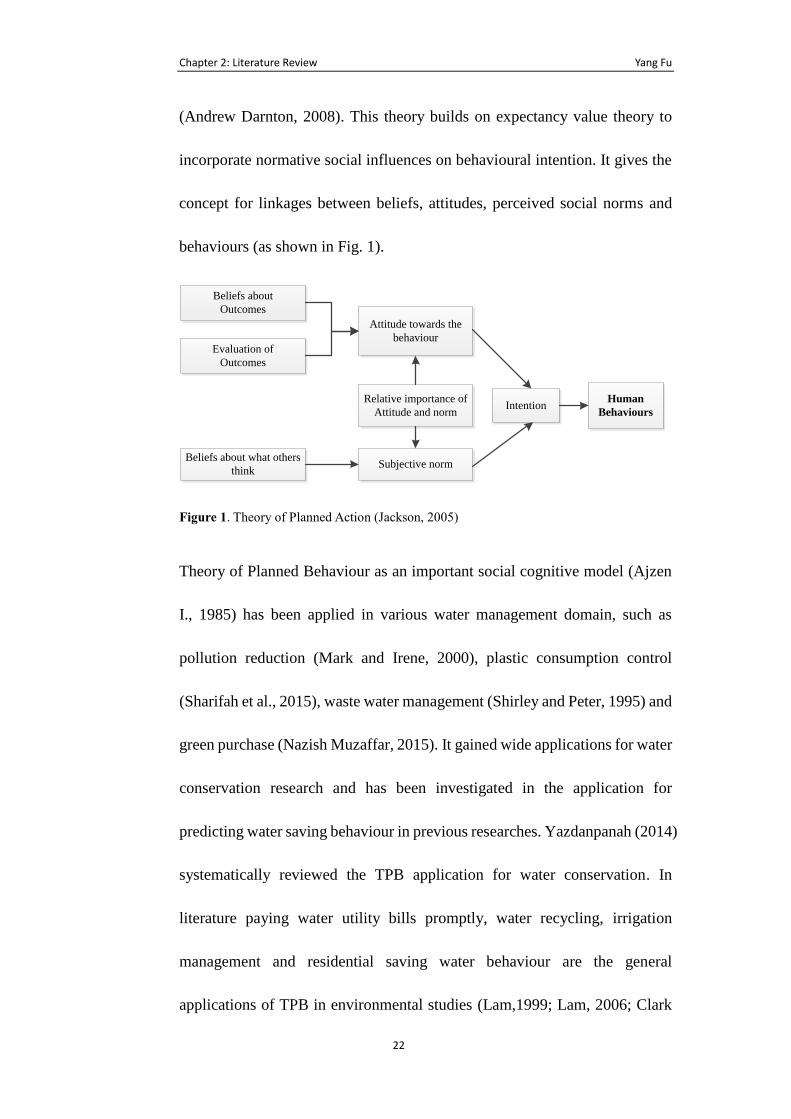
(Andrew Darnton, 2008). This theory builds on expectancy value theory to
incorporate normative social influences on behavioural intention. It gives the
concept for linkages between beliefs, attitudes, perceived social norms and
behaviours (as shown in Fig. 1).
Beliefs about
Outcomes
Evaluation of
Outcomes
Beliefs about what others
think
Relative importance of
Attitude and norm
Attitude towards the
behaviour
Subjective norm
IntentionHuman
Behaviours
Figure 1. Theory of Planned Action (Jackson, 2005)
Theory of Planned Behaviour as an important social cognitive model (Ajzen
I., 1985) has been applied in various water management domain, such as
pollution reduction (Mark and Irene, 2000), plastic consumption control
(Sharifah et al., 2015), waste water management (Shirley and Peter, 1995) and
green purchase (Nazish Muzaffar, 2015). It gained wide applications for water
conservation research and has been investigated in the application for
predicting water saving behaviour in previous researches. Yazdanpanah (2014)
systematically reviewed the TPB application for water conservation. In
literature paying water utility bills promptly, water recycling, irrigation
management and residential saving water behaviour are the general
applications of TPB in environmental studies (Lam,1999; Lam, 2006; Clark
Chapter 2: Literature Review Yang Fu
23
and Finley, 2007; Dolnicar et al., 2012; Gilg and Barr, 2006).
Despite its significance in environmental research, the TPB research became
more controversial about its sufficiency and the need for external variables
which assist to the improvement of intention prediction (see examples Conner,
1999; Norazlan Hasbullah et al., 2014). Research findings above have
proposed additional predictors to improve the TPB prediction power in
intention and behaviour (Conner, 1999; Hagger et al., 2001a). Interestingly,
on conceptual level, various divergent water conservation frameworks also
exist on adding external determinants (or predictors) to specific behaviour (see
examples Bradley et al., 2009; Leviston et al., 2005; Gregory and Di, 2003).
Acknowledging TPB’s limitation, Ajzen (1991) summarized that the TPB is
open to further expansion if a theoretical justification for additional predictors
is provided. Lam (2006) also argued that TPB alone is not sufficient as a basis
for understanding people’ intention to conserve water. Consequently, some
other constructs to TPB will need to be added to increase the utility and
predictive power for water conservation behaviour. In this study, an Expanded
version of Theory of Planned Behaviour will be proposed to enhance the
prediction ability of water conservation behaviour.
2.4 Behaviour Change Modelling
The internet supported behaviour change research has been extensively
Chapter 2: Literature Review Yang Fu
24
researched previously. For example, Thomas L Webb al. etc. (2010) reviewed
85 studies published coding frames for assessing use of theory and behaviour
change models to promote online health behaviour change. Most commonly
used method for conducting behaviour change are theories which support to
delineate the key determinants of behaviour, followed by statistical methods
to analyse the factor relationship or linkages. Models and Theories widely
applied include Theory of reasoned action/planned behaviour (TPB),
Transtheoretical model (TTM), Health belief Model (HBM) and Social
cognitive model (SCT) etc. As a support technology for analysis of behaviour
change model, statistics methods are accepted by researchers. Multiple Linear
Regression and Structure Equation Model (SEM) are the commonly used
statistical techniques in behaviour science. Most of models applied for
modelling behaviour change are only based on static data analysis such as
structure equation model (Munro et al., 2007; Chris et al., 2007). Even these
static methods showed their capabilities for predicting targeted issue, however,
they did not demonstrate enough understanding of human behaviour change
process and knowledge of behaviour intervention modelling.
In Bollen’s study (Bollen, 1989), an attitude-behaviour theory testing research
was conducted using standard multiple regression to illustrate TPB timeline
and path diagrams. Jacob et al. (2002) systematically analysed the applied
multiple regression/correlation for the behaviour sciences with behaviour data
Chapter 2: Literature Review Yang Fu
25
visualization, exploration and assumption checking methods. Belmon et al.
(2015) utilized multiple binary logistic regression analyses to estimate the
association between different personality characteristics (self-efficacy, self-
identity etc.). However, even a lot of research used this method, as a static
statistic approach, multiple linear regression shows few its capability to
analyse complicated system, especially simulate system change over time.
Canfield (2012) presented a method by using SEM to analyse the mediating
conceptual framework (physical activity and sedentary behaviour).
Interestingly, statistic approach using SEM is still valuable to simulate
behaviour change but showed less capability to simulate intervention system
over time. Engineering control principles showed its applicability in areas of
the behavioural science which involve dynamical systems, such as time-
varying adaptive intervention (Daniel et al., 2007). Fundamental control
engineering and adaptive intervention terminology such as dynamic system
(refer to multivariate time-varying process), tailoring variable and process
analysis could benefit current behaviour change modelling research. Even
Mohamed et al. (2014) and Yunwen et al. (2013) have successfully simulated
behaviour change by introducing control engineering concept such as time
delay, resistance etc. and proved this cross-discipline method can benefit
behaviour change simulation research somehow, however, none of them
provide a comprehensive and generic framework for behaviour change data
Chapter 2: Literature Review Yang Fu
26
collection and dynamic process modelling. In addition, there is lack of
performance evaluation of dynamic modelling and its effects on the result
prediction performance.
2.5 Household Water Use Behaviour Modelling
Social models for water use behaviour are used for predicting household water
consumption by considering the social and human behavioural factors. Syme
et al. (1992) investigated the house owners’ attitudes against their water
consumption result for a whole year in Perth, Australia. His model showed
that effective demand management strategies could change the users’
behaviours in combination with water price adjusts. The other example about
the social model is to use the alternative water sources and technologies to
investigate the receptivity of community by Clark Brown (Clark Brown et al.,
2006). Thus, all the water saving ability and reuse power rely on the condition
of behaviour change capacity.
Economic models are techniques indicate that price setting, price structuring
and use restrictions have a direct influence on household water use (Bradley
Jorgensen et al., 2009). Some researchers suggest that household
characteristics play a key role in the determination of the water use, and
behaviours need to be informed by local information about how to use and
save water in the house. Moreover, researchers such as Kenney et al.’s
Chapter 2: Literature Review Yang Fu
27
research (Kenney D. et al., 2008) pointed out that residential demand depends
on a lot of factors like price. Therefore, the non-price demand management
programs (rebates or water smart meters etc.) can be effective for water
conservation.
However, despite of the accuracy of all the various kinds of models, current
water use models take no differences between the objective and subjective
parameters for simulation. All the parameters are selected to input the model
and calculated by the model itself. Taking the social model of household
outdoor water consumption as example (Geoffrey J. Syme et al., 2004), their
model analyse and use some social factors concerned with attitude and
behaviour details for calculation, but it did not give any information about
behavioural intervention. Some economic models like Hoffmann et al.’s
model (Hoffmann, M. et al., 2006) and Kenney et al.’s (Kenney D. et al., 2008)
model, considered economic and social factors, even involved in behavioural
parameters (subjective parameters), however, most of those models only
regard behaviour formation factors as a single or multi parameters in the
models but not considered in the behaviour intervention. The development of
behaviour model as an initial calculation model should play a role for
understanding the behaviour process.
Chapter 2: Literature Review Yang Fu
28
2.6 Research Gap
Previous studies indicated that there is still need for research in the following
aspects:
• The water shortage status indicates that more research is needed on
practical methods and comprehensive understanding for the water use.
• Addressing water scarcity will require a range of adaptive approaches
enacted at different level (individual, community, area, country or
international). There is a growing need for individual level approaches
regarding water conservation.
• Reducing demand by improving the efficiency of water use necessities is
essential for water scarcity issues and understanding how water is used and in
what ways water savings can be realized. Even this study method paid more
attention on the water use behaviour than other approaches, other studies on
household water use behaviour change (either provide a picture of water use,
or design of water use behaviour intervention) and demonstrating all steps
from understanding, design and testing are not common.
• Most behaviour change theories evaluate the application of a theory such
as TPB in different case. There is to understand the process of how to develop
and extend behaviour change theories in further studies.
• There is not robust evidence that the TPB theory would be efficient and
Chapter 2: Literature Review Yang Fu
29
acceptable for investigating household water use behaviour, hence the need
for testing.
• Self-efficacy and past behaviour have been pointed out in the literature as
good predictors for people behaviour, however, studies either provide a test
of self-efficacy, or the application of past behaviour in TPB framework.
Studies involved two constructs introduction in TPB, and the influence of the
introduction to the other constructs and TPB model are not common.
• There is different opinion in the notion difference between self-efficacy
or PBC, hence the need to clarify and test these two constructs in water use
behaviour practise.
• Most studies on water use behaviour change took behaviour as a static
variable, indicating the need for research on understanding the linkage
between behaviour intervention process and water consumption.
• Studies on behaviour intervention are focusing on the outcome behaviour
change but rarely specify the behaviour change process and don’t give robust
evidence on how to simulate behaviour intervention process over time.
• Due to the uncertainty of introducing the behavioural process simulation
into the water consumption prediction procedure, water consumption model
concerned with behaviour intervention process will be a black box model.
Relative studies on this field is not common.
Chapter 2: Literature Review Yang Fu
30
• No studies were found attempting to clarify the linkage between
behaviour value and the water consumption amount in water use modelling
environment.
2.7 Summary
The aim of this literature review was to present the research background that
guided this PhD research. It indicated the need for developing a household
water use behaviour change theory to better understanding the behaviour
intervention. Previous studies from diverse perspectives provided the basis
and starting point for this work. The background was built to understand the
water shortage and conservation, what is the key in this process, the potential
for developing extended TPB model, how other studies linked behaviour to
water consumption, and what possible modelling method can be applied to
test the linkage during this research.
This literature review demonstrated examples of previous research related to
water use behaviour change including challenges presented in the attempt to
promote water demand management and understanding water use behaviour.
It has verified the need for more research in specific areas, and these areas
where this PhD research is positioned. This chapter also indicated the
theoretical basis that can be used for the household water use behaviour
change study. The studies presented in this literature review demonstrate the

Chapter 2: Literature Review Yang Fu
31
two constructs which may increase the predictive power of TPB. Also, it
revels the need for developing real-time dynamic behaviour intervention
model, and corresponding linkage between behaviour intervention process
and water consumption amount in water use model.
Chapter 3: Methodology Yang Fu
32
3 Methodology
3.1 Introduction
This chapter presents the methodology adopted to address the research aim
and objectives. The aim of this research is to test and examine the Extended
Theory of Planned Behaviour (ETPB), simulating the dynamic behavioural
intervention process and modelling the linkage between behaviour change and
water consumption. Thus, there will be four main parts for this research: 1,
Behavioural survey to capture data concerning household water use behaviour
and corresponding water consumption condition; 2, Data analysis,
Development and evaluation of Extended Theory of Planned Behaviour; 3,
Dynamic behaviour intervention modelling; 4, Household water use
modelling concerned with behaviour intervention.
The structure of this chapter is as follows. Section 3.2 is about the ETPB
model development and evaluation methodology. This is followed in section
3.3 with an explanation of the data analysis methodology including the
reliability and confirmatory factor analysis methods. Section 3.4 is the
development of questionnaire for behavioural and water consumption data
collection. Section 3.5 depicts the behaviour intervention background of this
research. Section 3.6 discusses the data analysis method applied in this study.
Section 3.7 and section 3.8 depicts methodology for two model development
Chapter 3: Methodology Yang Fu
33
and evaluation.
3.2 Development of Expanded Theory of Planned
Behaviour
There is growing evidence for the inclusion of self-efficacy as a predictor of
behavioural intention (see review Bandura, 1997; Hagger et al., 2001a),
behaviour (Conner and Armitage, 1999), or both intention and behaviour (Ryn
et al., 1996). Self-efficacy reflects a person’s internal confidence and ability
to perform a behaviour (Bandura, 1997), and been regarded widely as a sub-
dimensional construct of PBC as advocated by social learning theory (Terry
and O’Leary, 1995). This notion overtly aligned the PBC with self-efficacy
has been adopted and tested by Ajzen (1991) in many occasions. However,
Charles and Michael (1998) argued that the interchangeable use of PBC and
self-efficacy is inconsistent with theory. Conceptually, Terry and O’Leary
(1995) made their distinction by stating that PBC reflects barriers (external
aspects of control) towards certain behaviour and self-efficacy reflects the
abilities (internal aspects of control). Conner (1999) and Hagger (2001b)
further supported this distinction by providing a review of extending TPB and
tighter different definitions based on empirical evidence. However, no
research tested this distinguishing of PBC and self-efficacy in water use
domain. The fact that people’s water conservation behaviour is an activity
Chapter 3: Methodology Yang Fu
34
with the needs of awareness, motivation and self-control ability (Syme et al.,
2000), and low self-control ability to conserve water will block the promotion
of a conservation strategy (Trumbo and O’Keefe, 2001). As low water
conservation technologies and strategy adoption rate are the reality for many
water conservation projects, based on findings above, residents will have
greater intention if a higher level of internal confidence or belief is achieved,
thus, self-efficacy is added in the original TPB model as a predictor for
residential water conservation intention alongside a measure of perceived
behavioural control.
Water conservation regarding water shortage, should not only depend on local
condition, but also be influenced by historical water use background and
freshwater availability in the past (Hoekestra,2000). Additionally, another
widely discussed factor called past behaviour, past action, pro-environmental
behaviour, self-reported past behaviour or habit, has been added in TPB for
improving the explanation of environmental behaviour in several studies
(Lutz Sommer, 2011; Hagger et al., 2001b; Norazlan Hasbullah et al., 2014;
Dolnicar, 2012). Ouellete (1998) argue that our actions are not determined by
reasoning but by habitual and automatic processes. And in literature, habit and
historical water use background are usually measured by assessing extent to
which a past action was engaged. Terry and O’Leary (1995) proposed that
past behaviour has significant co-influence on intention with TPB variables.
Chapter 3: Methodology Yang Fu
35
Continuing in this line, Hagger et al. (2001b) proposed that the controlling for
past behaviour as a predictor of all TPB variables could result in positively
influencing the attitude, subjective norms, PBC and self-efficacy on intention.
Other authors, by the contrast, have been sceptical of the influence of all
independent variables in TPB on intention (Norman et al., 2000; Terry,1995;
Yordy, 1993). As residential water conservation habit is very likely to be kept,
and affect the influence of attitude, subjective norms and PBC on intention,
however, whether the affect is attenuation remains unknown. Thus, in this
research, external constructs are added to enhance the prediction ability and
understand the construct influence in TPB.
3.3 Questionnaire and Data Collection
There are three technical parts in this research which required data for testing
the outcomes and all the three parts will have different requirement for data
volume and quality. For testing the ETPB theory and variables’ correlation
relationship, a large scale TPB psychological behaviour data will be needed.
For testing the dynamic behaviour intervention modelling result, a small scale
long-term behaviour observation data will be needed to support this research.
As for household water use model calibration, there is a need for both
psychological behavioural and household water consumption record. Thus,
there are two types of data should be collected to support the modelling in this
Chapter 3: Methodology Yang Fu
36
study: ETPB/TPB behavioural and household water consumption data.
3.3.1 ETPB Questionnaire
A questionnaire is a research instrument consisting of a series of questions
and other prompts for the information gathering purpose. Questionnaires are
typically designed for the statistical analysis, and identified as a formalised
question set and framework design. This data collection method has
advantages over some other types of surveys in that they are more cost
effective, less effort than verbal or telephone survey, and provide standardised
answers for interpreting data (Hair et al., 2003, p.256). The main function of
the questionnaire is to capture the main reaction to the investigated issue,
however, as a type of survey, this method is still limited in the demographic
variety.
The questionnaire in this research contains three parts: the first part is the ethic
content form for using data, the second part is for the ETPB questions and the
third part is designed to collect residential information. The construction of
the ETPB questionnaire generally followed the procedures in Ajzen’s
discussion (2009) and the guidance for constructing TPB questionnaires
(Francis et al., 2004). The construction of a questionnaire to measure the
variables in the TPB model proceeds can be divided into seven phases:
1) Define the population of interest and decide how best to select a
Chapter 3: Methodology Yang Fu
37
representative sample from this population.
2) Carefully define the behaviour in water use area and use this definition to
construct general introductory statement for the start of the questionnaire.
3) Decide how best to measure intentions
4) Determine the most frequently perceived advantages and disadvantages
for performing the behaviour, the most important people or groups of
people who would approve or disapprove of the behaviour and the
perceived barriers or facilitating factors which could make it easier or
difficult to adopt the behaviour.
5) Include items to measure all constructs in the first draft questionnaire.
6) Pilot test for the draft and reword items if necessary.
7) Assess the reliability of questionnaire
TPB 7-point Likert scales (1 = strongly disagree to 7 = strongly agree) have
been applied previously in water conservation behaviour research with similar
research purpose, and they have established an acceptable reliability (Dolniar
et al., 2012; Yazdanpanah et al., 2014). In current study, intention to perform
water conservation behaviour was directly accessed by three items: (1) “I
expect I will engage in everyday actions to save water around my property in
the next few months” ;(2) “I intend to engage in water conservation activities
in the future” ;(3)” I plan to conserve water around my property in the near
Chapter 3: Methodology Yang Fu
38
future”. Six items with a 7-point Likert scale ranging from very false (1) to
very true (7) for measures of environmental attitude (e.g., “I think engage in
water conservation activities is beneficial”) and extremely unlikely (1) to
extremely likely (7) for measures of PBC (e.g., For me to conserve water
around my living place is easy) was utilized with four item questions.
Additionally, a three-item measurement with 7-point Likert scale was used to
assess Subjective norms (e.g., I feel like there is social pressure to conduct
water conservation activities around my property), ranging from strongly
disagree (1) to strongly agree (7).
Self-efficacy. Previous studies examined the self-efficacy influence on
environmental intention by 7-point Likert scale questions (Carmen Tabernero,
2011). The measurement of self-efficacy was designed following the guide
instructions of constructing self-efficacy scales (Bandura, 2006). The three
most frequent responses to the level of confidence on the questionnaire was
administered as follow: (1)” To what extent do you feel capable of conserving
water in your property?”; (2)” To what extent do you feel capable of
conserving water when you are in a rush?”; (3) “To what extent do you feel
capable of conserving water when it is inconvenient?”, where response scores
ranged from not at all confident (1) to totally confident (7).
Past behaviour. Frequency of past water conservation behaviour was assessed
using the following six items questionnaire. It was firstly used by Dolnicar
Chapter 3: Methodology Yang Fu
39
and Leisch (2008) for pre-environmental behaviour and his following research
about water conservation behaviour in Australia (Dolnicar, 2012). These were
“check and fix leaking tap”, “use minimal water in kitchen”, “collect rainwater
to use”, “turn off taps when brushing teeth”, “have shorter showers (4 min or
less)” and “only run washing machine if it is full”. Items to measure past
behaviour was stated as “In the last six months, how often did you do specific
action”, response were given on a 7-point scale representing hardly ever (1)
to very often (7).
3.3.2 Survey Method
Associated with descriptive and causal research situations, survey method has
been applied in many social researches. Depending on the topic, goal and
budget, different survey methods are being used to collect customer data for
research in the behaviour change study. Szolnoki and Hoffmann (2013)
compared face-to-face, telephone and online survey methods and concluded
that online survey methods have advantages in lower cost and higher speed.
The online survey method provides visual, interactive and flexible sampling
solutions without requiring any presence from interviewer. Relying on such
modes will likely lead to selective samples, raising concerns about
nonresponse bias.
Taylor et al. (2009) investigated the effects of modes, such as online survey
Chapter 3: Methodology Yang Fu
40
versus telephone by conducting a national survey about air quality in national
parks. The results showed that telephone survey response rate was higher than
online survey. Therefore, conducting online survey for sampling purpose will
need a higher sampling volume even it is easier to handle than telephone
surveying method. Unlike face-to-face survey, online studies may also have
disadvantages in not being representative of the entire population. The online
surveying method has potentials to miss the users who do not use internet very
often.
In this study, an online survey method is used to collect customer behaviour
intervention data with an initial big volume sampling. Also, to increase honest
responses, the internet survey was designed to offer an anonymous feeling
with a preamble advising (Babbie, 2013). Before the respondents start to
complete questionnaire, introduction of preamble advising which mentions
the importance of this research and asks for faithful reply to be given. Two
criteria were set before the questionnaire was being processed: the
respondents should be over 18 years old and know very well about daily water
use activity in their property. This setting could somehow locate the targeted
group interviewer and bring up reliability rate.
3.3.3 Pre-testing Questionnaire
As the questionnaire is designed in the UK, the questionnaire was pre-tested
Chapter 3: Methodology Yang Fu
41
by sampling Chinese students 18 – 28 years participants who had fully
understanding of their household water use behaviour in China. Scale
response categories were altered as respondents felt more comfortable with
seven-point answer setting than five-point responses. Corresponding
perceived barriers or pressures for water conservation activities were also
tested via face-to-face interview. The barriers then were applied in the initial
version of the questionnaire for street face-to-face survey on SZ high street in
2014. The official version of the questionnaire was evaluated in terms of
instructions, ease of use, reading level, clarity, item wording and response
formats, and was judged to possess face and context validity (Hair, 2006).
3.3.4 Study Population
The population for this research comprises residents living in China,
specifically in SZ city. A few advantages can be listed from this approach.
Firstly, China has been facing increasing critical water scarcity and
conservation issues and urge for water conservation solutions. Greater
challenges occurred in ensuring water supply and quality for residential and
industrial purposes in urban areas due to the high economic growth and
increasing urbanised population. As a result of urbanization, by 2030, it is
estimated that over 50% of Chinese population will be living in urban areas
which will give existing limited water resource more stress (Gavan
Chapter 3: Methodology Yang Fu
42
McCormack, 2001). The north of China, which account for half of the total
area of China is using around 20% of the total water resource, has already
experienced a serious water crisis in the past few decades (Zhou H. et al., 2012;
Xi-Peng Deng et al., 2006). Meanwhile, the south China with abundant water
resource, its gross water availability per capita decreased from 5015 cubic
meters in 1980 to 3702 cubic meters in 2005, and this situation will be more
critical because of the exacerbation of severe droughts in 2004, 2007 and 2010
(Guan and Klaus, 2007; Xie Jian et al., 2008; OECD, 2007). China is also
experiencing water resource overexploitation and water pollution, which is
leading to serious socio-economic and environmental impacts (Yong Jiang,
2009). This water scarcity background in China urges water conservation
research support for its current situation.
Secondly, the country is conducting water conservation promotion projects
causing corresponding water use behaviour intervention. To decrease the
substantial risk of water shortages, water conservation strategies are gaining
attentions and importance. Despite the fact that Chinese government has been
actively conducting water saving projects such as step water price, grey water
reuse promotion, educational water saving dissemination, low-interest loans
and the adoption of water conservation technologies (Blanke et al., 2007; Liu
et al., 2008), most of these programs are still limited in the North and North-
east China with a low adoption rate (Jianjun Tang et al., 2013), and only a few
Chapter 3: Methodology Yang Fu
43
middle and southern city councils have raised the awareness of saving water
in the past decade such as SZ. Moreover, typical Chinese water conservation
programmes focus on technological rather than behavioural interventions,
which leads to a fail to develop authoritative figures capable of teaching and
enforcing water saving behaviour (Yujiu Xiong et al., 2016). Hurlimann et al.
(2009) argued that the normative information on specific interactions is
essential for the development of policy, and the reason of low adoption rate is
lacking appropriate public willingness (Blanke et al., 2007). Yazdanpanah
(2014) argued that the understanding of water conservation behaviour and
how behavioural intervention can be influenced, are supposed to play crucial
role in the decision-making process of water conservation promotion. Hence,
to comprehend and influence residential responses to current water scarcity
situation, insight into residential water conservation behaviour and how the
behaviour change can be influenced are prerequisites for the development of
adequate and effective water conservation strategy handles in China.
According to the data from China Ministry of Water Resources in 2014, SZ
local water resource can only afford about 20% water consumption for the
whole city. The annual average drinking water amount per person in SZ city
is only 180 square meters (1/11 to the whole country’s average data) in 2013.
Due to the special location of SZ, there is no big water resource such as
reservoirs around this area. More than 70% to drinking water should be draw
Chapter 3: Methodology Yang Fu
44
from East River far away from the city. Moreover, the rainfall response rate
for this city is extremely low. The government statistic data showed that there
are about 140 days’ rainfall annually in the city and the whole year rainfall
volume is 3 billion square meters, however, only 500 million square meters’
waters have been reused. All the factors make SZ one of the most water
lacking cities in China. To ensure the water demand of SZ city, government
authorities have imposed a number of water restrictions and water saving
measures. Decentralized rainfall collection systems are built all around the
city to reuse rainfall for watering flowers or flushing toilets after simply
treated. Take the town centre of Nanshan district as an example, the rainfall
collection system saved 1.44 million tons water in 2011. Also, the government
is planning to develop 13 new reservoirs to reserve water for increasing huge
population. Moreover, due to the promotion of ascending water price,
residential social awareness, behaviour and attitudes toward saving water have
changed a lot, thus requiring further understanding of the link between these
factors and water end use in this area.
The targeted community, which is named as Crape Myrtle Garden, sampled
in this study is in the town centre of LG district, SZ, China. It was developed
by Crape Myrtle Estate in 2002. This is a typical Chinese urban mature
community with 1480 households and all the buildings are designed as seven
floors apartment.
Chapter 3: Methodology Yang Fu
45
3.4 Behaviour Intervention
Since March 2014, the Survey City founded an association named SAPW (SZ
Association for Promoting Water-saving) for promoting water conservation
technologies and projects. The initial project was conducted in the city centre
in 2013. Main methods for water conservation promotion from SAPW are
educational course, water conservation technology show and long-term water-
saving promotions (leaflet or advertisement on social media). In May 2014,
the community surveyed in this study has no yet been promoted with any
water conservation project which has very good preservation of old water use
habit. Since August 2014, SAPW had launched a long-term water
conservation project in LG district. The project is started from educational
course in all school and promoted ideas as “Save Water in LG”. Until July
2015, the SAPW has successfully many activities for water conservation
education and technology promotions. In July 2015, 83.2% applicants of
water conservation survey in sampling community claimed the water
conservation projects promoted by SAPW has positive influence on their
water use behaviour. The survey period for this study covered the beginning
and middle of local water conservation project which we assumed the water
conservation project has triggered behaviour change in our sampling
community.
Chapter 3: Methodology Yang Fu
46
3.5 Data Analysis
This section discusses the use of statistical techniques in this study.
Descriptive statistics is explained in the first part followed by the statistical
analysis section. Three methods are used for statistical analysis which are
factor analysis, Confirmatory Factor Analysis (CFA) and Structural Equation
Model (SEM). The software used for the statistical analysis are Statistical
Package for Social Sciences (SPSS) and AMOS 21 program.
3.5.1 Descriptive Statistics
Descriptive statistics could be categorised into two groups. The first group
contains the central tendency of the variable represented by the mean, median
or mode (Mazzocchi, 2008). The mean value is the average calculated as the
sum of the sample values divided by the value number in the data set. The
major characteristic of the mean is the mean computation based on all values
of a data set. The median is the middle item value where in the magnitude
order. The mode is the value that occurs most frequently in the data set. The
second part of the descriptive statistics represents dispersion which is
estimated by using the range, variation and coefficient. The range is the
difference between the lowest and highest values in the data set. Standard
deviation and variation serve as measures for data variability.
Chapter 3: Methodology Yang Fu
47
3.5.2 Statistical Analysis
The statistical analysis methods applied in this study includes factor analysis,
confirmatory factor analysis and structural equation modelling.
3.5.2.1 Reliability
The importance of measuring accuracy for research instruments are known
well as reliability, have been conducted in several studies. Reliability
expresses the degree to a measurement what it purports to measure. Reliability
tests should be assessed before using SEM for exploring construct relationship
(Shook et al, 2004). Reliability is normally expressed by correlations,
however, in practice, the assessment for reliability is conducted based on three
variables: stability, internal consistency and equivalency. There are many
practical strategies have been developed to provide workable methods of
estimating reliability. Four methods have been most commonly used in
literature.
Test-retest reliability is a method which directly assesses the degree to which
test scores are consistent from one test administration to the next. This method
involves group test administration, re-administration for the same group at
later time and calculating the two groups’ correlation. This correlation
between two test scores is used then to estimate the reliability using Person
product-moment correlation coefficient. The higher of the Person product-
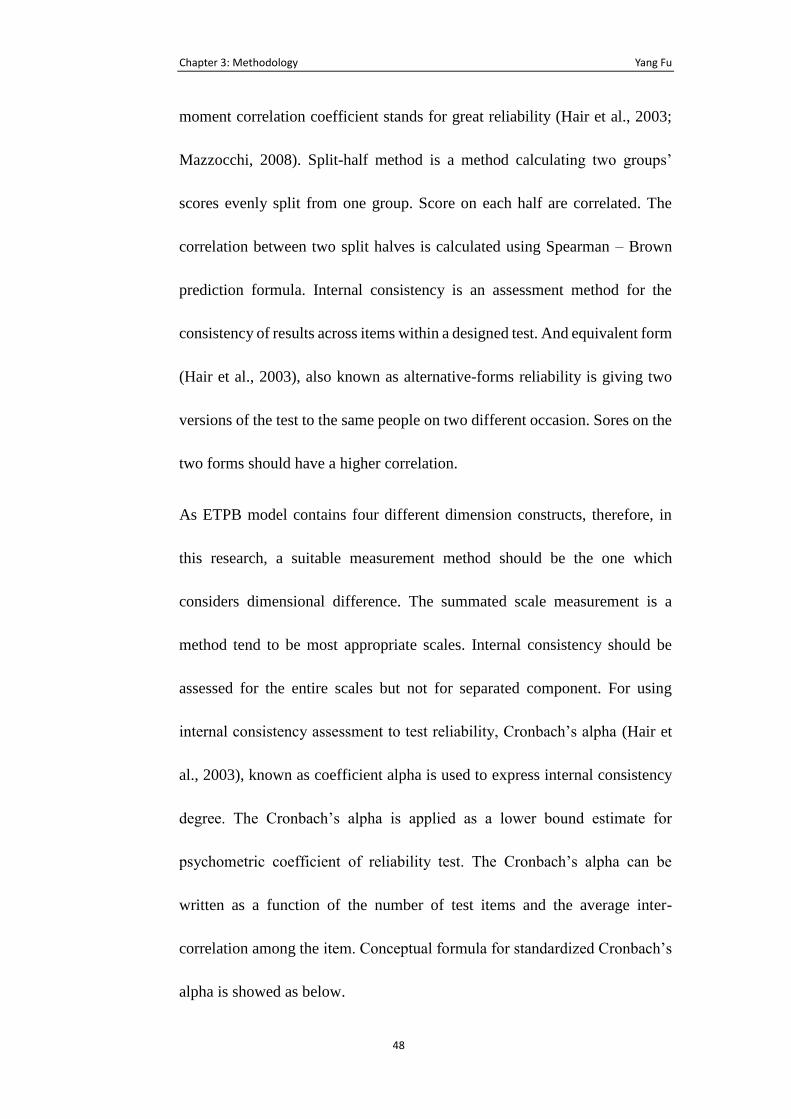
Chapter 3: Methodology Yang Fu
48
moment correlation coefficient stands for great reliability (Hair et al., 2003;
Mazzocchi, 2008). Split-half method is a method calculating two groups’
scores evenly split from one group. Score on each half are correlated. The
correlation between two split halves is calculated using Spearman – Brown
prediction formula. Internal consistency is an assessment method for the
consistency of results across items within a designed test. And equivalent form
(Hair et al., 2003), also known as alternative-forms reliability is giving two
versions of the test to the same people on two different occasion. Sores on the
two forms should have a higher correlation.
As ETPB model contains four different dimension constructs, therefore, in
this research, a suitable measurement method should be the one which
considers dimensional difference. The summated scale measurement is a
method tend to be most appropriate scales. Internal consistency should be
assessed for the entire scales but not for separated component. For using
internal consistency assessment to test reliability, Cronbach’s alpha (Hair et
al., 2003), known as coefficient alpha is used to express internal consistency
degree. The Cronbach’s alpha is applied as a lower bound estimate for
psychometric coefficient of reliability test. The Cronbach’s alpha can be
written as a function of the number of test items and the average inter-
correlation among the item. Conceptual formula for standardized Cronbach’s
alpha is showed as below.
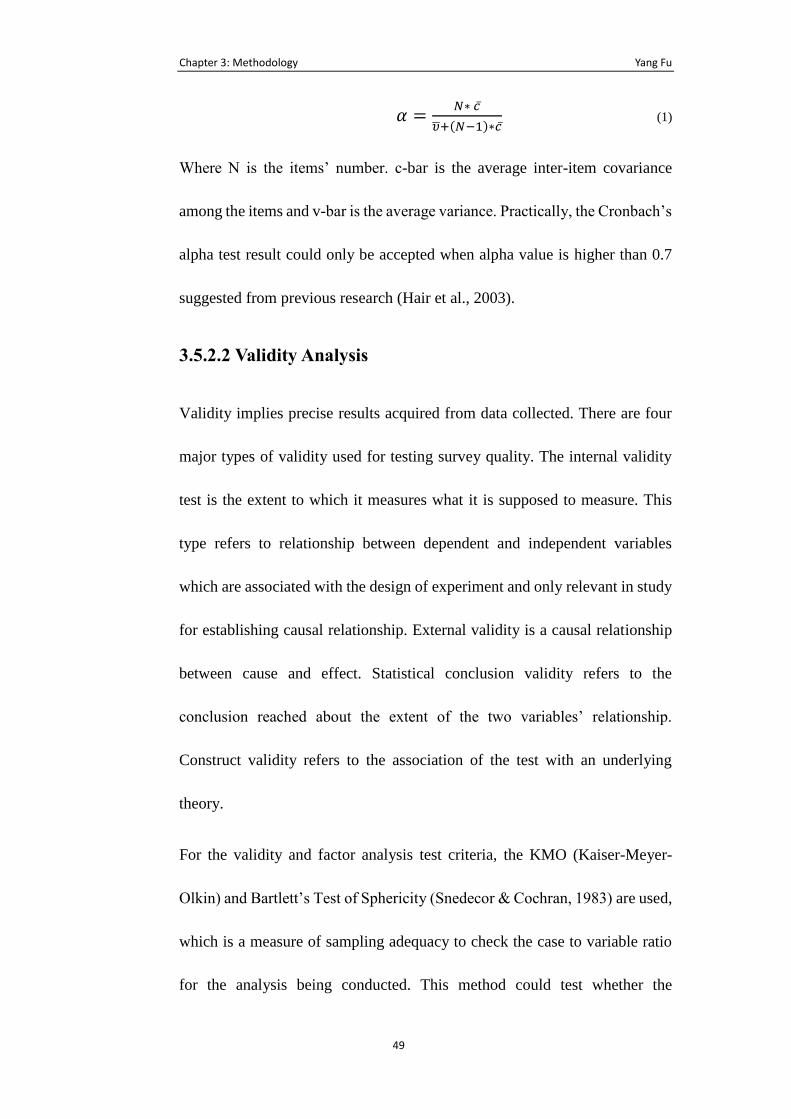
Chapter 3: Methodology Yang Fu
49
𝛼 =𝑁∗ 𝑐̅
𝜐+(𝑁−1)∗𝑐̅ (1)
Where N is the items’ number. c-bar is the average inter-item covariance
among the items and v-bar is the average variance. Practically, the Cronbach’s
alpha test result could only be accepted when alpha value is higher than 0.7
suggested from previous research (Hair et al., 2003).
3.5.2.2 Validity Analysis
Validity implies precise results acquired from data collected. There are four
major types of validity used for testing survey quality. The internal validity
test is the extent to which it measures what it is supposed to measure. This
type refers to relationship between dependent and independent variables
which are associated with the design of experiment and only relevant in study
for establishing causal relationship. External validity is a causal relationship
between cause and effect. Statistical conclusion validity refers to the
conclusion reached about the extent of the two variables’ relationship.
Construct validity refers to the association of the test with an underlying
theory.
For the validity and factor analysis test criteria, the KMO (Kaiser-Meyer-
Olkin) and Bartlett’s Test of Sphericity (Snedecor & Cochran, 1983) are used,
which is a measure of sampling adequacy to check the case to variable ratio
for the analysis being conducted. This method could test whether the
Chapter 3: Methodology Yang Fu
50
correlation matrix is an identity matrix and show the validity and suitability
of the responses collected to the water saving issue in this research. The
accepted index for KMO is over 0.6 (KMO ranges from 0 to 1). And for
recommended suitable factor analysis, the Bartlett’s Test of Sphericity must
be less than 0.05. All the validity test is done by SPSS software. Another
aspect needed for factor analysis is to test whether a variable might relate to
more than one factor. In this study, rotated component matrix is used to decide
this point. Rotation maximizes high term loading and minimizes long item
loading, therefore producing an interpretable and simplified solution.
3.5.2.3 Factor Analysis
Factor analysis as an interdependence technique defines the underlying
structure among variables in the analysis (Mazzocchi, 2008). It is a process to
identify the potential causes for several observed data for finding out which
are the most important (Hair et al., 2003; Mazzzocchi, 2008). This method
also has been used as a foundation of structural equation modelling in the
multiple regression analysis. Moreover, it serves as multivariate technique for
identifying the observed items’ dimensions with broad aims to identify the
number of factors and what the factors represent.
The expanded theory of planned behaviour framework is a new factor model
which explains the original variable observation and its covariance between
Chapter 3: Methodology Yang Fu
51
other variables. In the ETPB, variables are determined by a liner combination
of factors which therefore consist the proposed series of assumptions. In this
study, factor analysis is applied to confirm the dimensionality of constructs
and establish the discriminant validity.
3.5.2.4 Structural Equation Model
Structural equation modelling (SEM) is a complex and powerful analytical
technique for measuring relationship among unobserved variables since early
20th century (Shook et al., 2004). It is a statistical model that explains the
relationships among multiple variables and examines the interrelationship
structure by a series equation (Hair et al., 2006). As a combination of
interdependence and dependence techniques, SEM is useful in giving rise to
the interdependent nature of structural model when any dependent variable
turned into independent variable (Hair et al., 2006).
SEM is a combination of two statistical methods: confirmatory factor analysis
and path analysis. Path analysis begins with biometrics and aims to find
relationship among variables by creating path diagram. The path diagram is
created by Wright in 1920 for illustrating and test direct, indirect and total
effects among observed variables. The combination of factor and path analysis
is based on the general structural equation model outline which consisted of
measurement models and structural models.
Chapter 3: Methodology Yang Fu
52
With nearly a century’s development, the SEM became a very well-known
and easy-use technique. Published literatures (e.g. Shook et al., 2004; Hair et
al., 2006) have already summarised many different software packages (such
as AMOS, LISREL, EQS) which could be used for computing SEM analysis.
AMOS was used in this study due to its easy-learning and high-speed
computation ability.
The one aim of this study is to develop a structural model of household water
use behaviour change and explain the relationships between constructs in the
intervention process. Another aim is to develop scales for each of the
constructs in the ETPB and evaluate all constructs’ reliability and validity,
therefore, SEM was chosen as the main statistical technique for ETPB
modelling.
The relationship between objective parameters and behaviour change
mechanic was investigated using a Structural Equation Model with latent
variables. SEM is widely used in psychology and other social sciences,
although its properties are not clear when the model structure is complicated
(Syme GJ et al., 2003; Bollen, K.A., 1989; Lohmoller, J.B., 1989; T. Raykov
et al., 2006).
In SEM, the path analysis is a straightforward extension of multiple regression.
It is an approach to simulate explanatory relationships between observed
variables aiming to provide estimates of the magnitude. The multiple
Chapter 3: Methodology Yang Fu
53
regression equation basis in SEM could be expressed by math equation which
offers the possibility of behaviour simulation. Main characteristics for this
method is that the path analysis does not contain any latent variables in which
all simulated variables could be observed, and the independent variables are
assumed to have no measurement error. Navarro-Barriento et al. (2011) noted
that this path analysis simulation method could be effectively applied to
simulate TPB behaviour change process. The mathematic expression of
behaviour intervention theory in literature offers the fundamental modelling
basis of dynamic behaviour intervention modelling.
A typical SME model consists of measurement and structural models. A new
model should always be proposed based on some underlying theories. There
are two types of relationships which could possibly exist among constructs:
dependence relationship and correlation relationship. Dependence
relationship is descripted by straight one-way arrows connected to exogenous
and endogenous constructs. Correlation relationship is depicted by two-way
arrow only connected among exogenous constructs.
SEM goodness-to-fit is assessed with various measures as below: x^2 (chi-
square), goodness of fit index (GFI), root mean square error of approximation
(RMSEA, ideal value is 0 and acceptable value is less than 0.8), comparative
fit index (CFI, ranges from 0 to 1 with suggested scores less than 0.9),
incremental fit index (IFI, also known as DELTA2), and Tucker-Lewis index
Chapter 3: Methodology Yang Fu
54
(TLI, also known as NNFI with ideal value 1 and the other value which close
to this value indicates a good fit). The good-of-fit x^2 is very sensitive to
sample size and the large chi-square value of CFA reveals a high degree of
freedom. Cronbach alpha reliability coefficient is applied for testing construct
reliability which ideal value is 1 and acceptable value is higher than 0.5.
Validity test in CFA analysis stage using maximum likelihood method was
conducted to test construct validity for proposed latent variables.
In this study, three SEM models were developed and tested which are original
TPB model, TPB model with self-efficacy and ETPB model. The comparison
of these three modelling results could be applied to test the predictive ability
of different and the influence of introducing new construct in the TPB.
3.5.2.5 Mediation Analysis
In this study, mediation analysis is performed to understand two models exist:
one is corresponding to unobservable relations among variables, and other is
to investigate corresponding to statistical analyses of sampling data
(MacCorquodale and Meehl, 1948). The Sobel test and bootstrapping method
(with default N=1000 bootstrap resamples) were used to calculate the indirect
effects. The Sobel test describes the mediator potency by creating the
asymptotic standard error using multivariate delta method (Natalia López-
Mosquera, 2014). Analysis process is performed by a SPSS-micro which
Chapter 3: Methodology Yang Fu
55
offers an estimation of indirect effect and 95% Monte Carlo confidence
interval with effect size measures (Hayes, 2013).
It has been widely discussed in previous researches about the limitations of
standardized regression coefficient and raw correlation in analysing the
indirect effect (see MacKinnon, 2008). Kristopher (2011) argued that effect
size, “degree to which the phenomenon is present in the population or the
degree to which the null hypothesis is false”, is capable to measure the full
meaning of an indirect effect and amenable to the construction of confidence
intervals. Therefore, to test the indirect influence in our proposed model, all
indirect effect size from past behaviour to four variables (attitude, PBC,
Subjective norms and self-efficacy) were measured instead of using standard
regression coefficients in previous research (Natalia López-Mosquera et al.,
2014).
3.6 Dynamic Behaviour Intervention Modelling
Behaviour intervention can be defined as a program aiming to adjust
behaviour for treating disease, promoting healthy lifestyle and enhancing
well-being. The last decade has witnessed an increasing interest in applying
statistical and computing modelling methods for problems in behavioural
health, and using these to guide the design and implementation of intervention.
To understand the dynamic intervention effect of behaviour change, Daniel et
Chapter 3: Methodology Yang Fu
56
al. (2012) has stated control engineering concept could work as a new solution
for simulating behaviour invention process. In current research, there are three
main technologies and concepts from system identification and control system
engineering which have been successfully applied in the behaviour
intervention research, including: optimizing interventions by personalizing
treatment through adaptation; access to longitudinal data through computing
and mobile technologies, and behavioural theories modelling providing
insights for strategy development.
Control engineering is a broadly applicable field which refers to the
examination mechanism on how to influence a dynamical system to achieve
desirable outcomes. Dynamical system could represent the time-varying
process and lead the output changes. Access to intensive behaviour change
data in the control system engineering solution enables the application of
system identification with black-box model to input and output simulation
result (Daniel et al., 2012). This has greatly improved the simulation ability
of the behaviour intervention process. Engineering control principles also are
applicable in the behaviour sciences that involve dynamic time-varying
adaptive intervention. Control systems elements such as control error,
controller and disturbance variable applied in the control design algorithms
and computer simulations benefits the outcome optimization (Daniel et al.,
2007). Examples for successful behavioural intervention in healthcare and
Chapter 3: Methodology Yang Fu
57
well-being enhancement have proved control engineering concept could
improve the dynamic simulation ability of the intervention (Daniel et al, 2007;
Daniel et al., 2012). This research will use the control engineering concept as
modelling basis to supervise dynamic behaviour intervention model
development.
Rivera (2012) stated that control engineering and system identification could
assist behavioural intervention optimization. Control systems engineering
examines how to influence multivariate, time-varying and nonlinear dynamic
systems to achieve a desired outcome. This control engineering could provide
the dynamic system modelling solution needed to transform current behaviour
intervention theories into the dynamic theories for time-intensive, interactive,
and adaptive behaviour interventions. In serval behaviour intervention cases,
the behavioural intervention based on TPB could be presentative by control
engineering analogy such as “switch” or electricity flow (Rivera, 2012).
Schwartz et al., 2006 proposed that fluid analogy could be solutions for
simulating supply chain and solving modelling issues with inventory
management and time change introductions. Navarro-Barrientos et al. (2011)
applied this concept in their research for dynamic behavioural intervention
modelling in the weight control area, and successfully introduced time series
for behaviour modelling process. To capture the behavioural intervention over
time, this study applied fluid analogy (Navarro-Barrientos et al., 2011) to
Chapter 3: Methodology Yang Fu
58
understand the behaviour intervention process with concerned time change.
In the article reviewed by Daniel (2007), despite most dynamic control
engineering modelling applications in behaviour intervention are on the
healthcare domain, the methodology for developing dynamic model could still
be used in water conservation behaviour research which summarised as below:
(1) Model identification. Depending on the modelling basis, the model
identification is a procedure to identify the basic model element (output
and input), model structure and model type.
(2) System identification. The system identification is to identify the
mathematical expression and variables of the dynamic model. If the
behavioural model is developed based on theory or models have clear
structure and input/output, Structural Equation Model (SEM) is a very
commonly used method to generate mathematical model expression.
(3) Dynamic system design. Using the control engineering method, the
dynamic system has been transferred and understood as different
processing unit in the modelling system. Through the control of
different control units and the add/delete of fundamental control
engineering terminals (such as control loop, black diagram or step point),
the dynamic system could simulate the adaptive intervention process of
behaviour change.
Chapter 3: Methodology Yang Fu
59
(4) Model evaluation. This is the process to identify the model prediction
accuracy and efficiency.
3.7 Water Use Modelling
The water use modelling requires the application of analytical techniques,
(likes the stochastic modelling, multi-variable regression and Bayesian
networks) and household water use database for supporting that modelling
work (Christopher Bennett et al., 2013). A lot of researches have presented
that models for water use simulation and prediction are capable (Bradley
Jorgensen et al., 2009; Corral-Verdugo, V. et al., 2002; Gregor, G. et al., 2003).
Stochastic water use model for end-use studies are based on category
frequency of use, demographics, event occurrence likelihood and flow
duration to simulate water demand patterns have been developed by Blokker,
Vreebury and Dijk (M. Blokker et al., 2010). Blokker used a Poisson
rectangular pulse model derived from metering studies and surveys. This final
model has achieved up to 93% accuracy compared to the truly metering data.
Bayesian conditional framework and ANNs (Artificial neutral networks) have
also been applied massively for the water end use modelling. Hsiao et al.
(1995) used the Bayesian framework to develop a forecasting model for
heating water and the residential water demand uses. The dummy variables
and the transforming variables in this model are combined with aggregated
Chapter 3: Methodology Yang Fu
60
loads, appliance ownership and demographic information. This study was
applied to 396 households and with acceptable relative errors ranging from
0.081 to 0.298. Christopher Bennett and Rodney A. Stewart (Christopher
Bennett et al., 2013) used the data from SEQ (South-east Queensland) in
Australia (over 250 households’ water end-use data) to build an ANNs model.
The ANNs provide the technique for aligning the databases to extract the key
determinants for different end-use category. Finally, their model had
averaging error values of 0.52 for a household water demand.
Due to the uncertainty for introducing the behavioural process simulation into
the water consumption prediction procedure, water consumption model
concerned with behaviour intervention process will be a black box model. Cho
(2003) compares ANN method, exponential smoothing, and autoregressive
integrated moving average (ARIMA) to predict travel demand, i.e. number of
arrivals. He concluded that ANN seems to be the best method for forecasting
visitor’s arrivals without obvious pattern. ANN method has advantages in
requiring less formal statistical training data, ability to implicitly detect
complex nonlinear relationships between dependent and independent
variables, and the availability of multiple training algorithms (Tu, 1996).
ANN evaluation result may be influenced by different model settings, such as
node number and learning rate. However, for investigating a possible solution
to integrate behaviour change process into water consumption prediction,
Chapter 3: Methodology Yang Fu
61
ANN method has been proved capable for exploring the unknown relationship
in practices.
3.8 Summary
By reviewing the literature, this Chapter so far has outlined several aspects to
be considered when end use consumption studies are designed for behaviour
change. The current water end use model cannot clearly understand behaviour
change pattern and management strategies for behaviour intervention. The
water end use model in this research by concerned behaviour change has also
identified influence factors in literature are not sufficient to point out all
subjective and objective parameters. Therefore, a water end use model based
on behaviour intervention should consider behaviour intervention pattern and
behaviour change parameters.
In the second part of this chapter, technological basis is discussed. TPB is
applied as the theory support for behaviour simulation of water end use. With
enough data training, ANN could generate the water end use consumption
results by concerned behaviour interventions. Table 1 presents a summary of
the methodology described in this chapter, indicates the approach chosen and
justifies it with examples from the studies undertaken during this PhD
research.
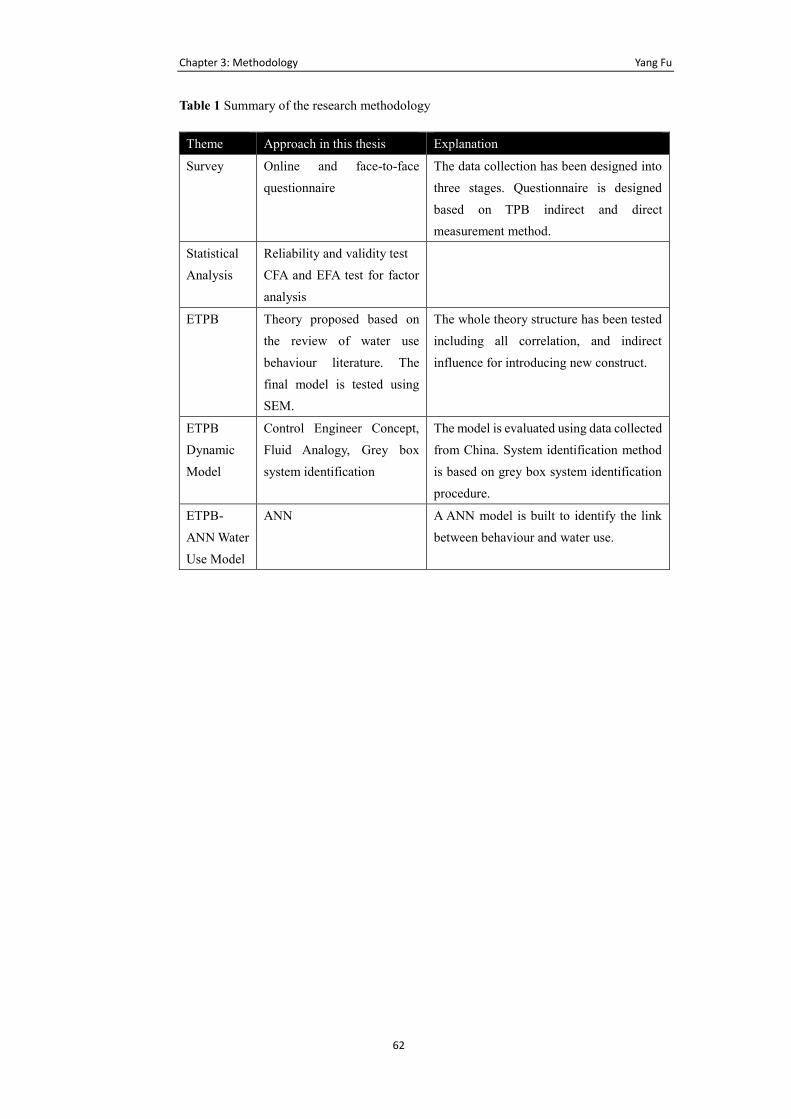
Chapter 3: Methodology Yang Fu
62
Table 1 Summary of the research methodology
Theme Approach in this thesis Explanation
Survey Online and face-to-face
questionnaire
The data collection has been designed into
three stages. Questionnaire is designed
based on TPB indirect and direct
measurement method.
Statistical
Analysis
Reliability and validity test
CFA and EFA test for factor
analysis
ETPB Theory proposed based on
the review of water use
behaviour literature. The
final model is tested using
SEM.
The whole theory structure has been tested
including all correlation, and indirect
influence for introducing new construct.
ETPB
Dynamic
Model
Control Engineer Concept,
Fluid Analogy, Grey box
system identification
The model is evaluated using data collected
from China. System identification method
is based on grey box system identification
procedure.
ETPB-
ANN Water
Use Model
ANN A ANN model is built to identify the link
between behaviour and water use.
Chapter 4: Data and Statistical Analysis Yang Fu
63
4. Data and Statistical Analysis
4.1 Introduction
Behavioural and water use data collection is the critical and fundamental part
in this research. The data offers the first-hand evidence for all the theoretical
and modelling test. The aim of this chapter is to present the statistical analysis
results using the methods presented in Chapter 3 from data collected in China.
The results are presented in association with different data quality and
analytical themes concerned with sample characteristics, water use behaviour,
reliability and validity analysis.
4.2 Sampling
This study has conducted three phases of sampling due to the different
research needs. In 2014, a water use behaviour questionnaire and water usage
survey have been conducted in LG district, SZ city for supporting the water
consumption modelling. Out of 200 apartment households sampled in this
study in SZ, China in 2013, only 128 apartments which had the monthly water
consumption and sent back the fulfilled questionnaire. The questionnaire
response rate for this research is 64%. Nine samples have been eliminated
after being known collected from a short term or unstable living condition
residents in the sampling year. In 2015, a national wide large scale online
Chapter 4: Data and Statistical Analysis Yang Fu
64
water use behaviour survey was conducted to collect water behaviour
intervention modelling data for ETPB structure equation modelling use. From
June 2014 - June 2015, ten households’ annual water use data and long-term
behaviour intervention data were collected to evaluate dynamic behaviour
intervention model. Every three months, the ten households were invited to
fulfil the indirect and direct measurement ETPB questionnaire. And monthly
water consumption and direct measurement of ETPB variables were
monitored for modelling use.
Prior to the survey, a pilot study based on face-to-face interview, was carried
out on a sample of 23 subjects to ensure the validity of the questionnaire
setting. This pilot study was refined through water conservation experts and
residents' reviews to guarantee the validity and readability. SZ, which is facing
critical water shortage and has high population mobility, was finally being
chosen as a representative location for conducting pilot study. 84 face-to-face
interviews with equal male and female quotas, carried out with respondents
who have voluntarily chosen to complete questionnaire in the town centre. 13
questionnaires had to be removed due to the inconsistencies and incomplete
data. On average, respondents took 8-17 minutes to complete the
questionnaire with fully understanding of the content.
The afterwards face-to-face survey is conducted in Crape Myrtle Garden,
sampled in this study is in the town centre of LG District, SZ, China. It was
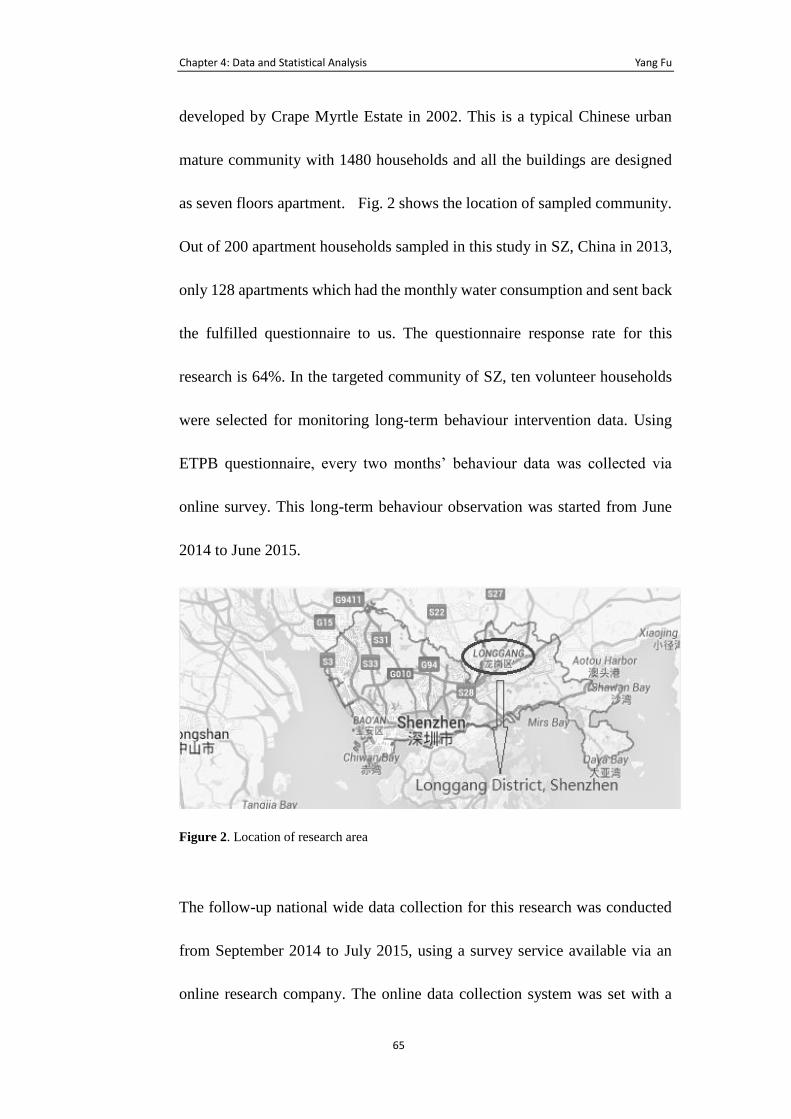
Chapter 4: Data and Statistical Analysis Yang Fu
65
developed by Crape Myrtle Estate in 2002. This is a typical Chinese urban
mature community with 1480 households and all the buildings are designed
as seven floors apartment. Fig. 2 shows the location of sampled community.
Out of 200 apartment households sampled in this study in SZ, China in 2013,
only 128 apartments which had the monthly water consumption and sent back
the fulfilled questionnaire to us. The questionnaire response rate for this
research is 64%. In the targeted community of SZ, ten volunteer households
were selected for monitoring long-term behaviour intervention data. Using
ETPB questionnaire, every two months’ behaviour data was collected via
online survey. This long-term behaviour observation was started from June
2014 to June 2015.
Figure 2. Location of research area
The follow-up national wide data collection for this research was conducted
from September 2014 to July 2015, using a survey service available via an
online research company. The online data collection system was set with a
Chapter 4: Data and Statistical Analysis Yang Fu
66
submission decline which indicates uncompleted questions, thus, missing
values will not occur in the dataset. Also, to increase honest responses, the
internet survey was designed to offer an anonymous feeling with a preamble
advising (Babbie, 2013). Before the respondents start to complete
questionnaire, introduction of preamble advising which is mentioned the
importance of this research and faithful reply, was given. Two criteria were
set before the questionnaire being processed: the respondents should be over
18 years old and know very well about daily water use activity in their
property. Evenly, 3,000 participants from four different regions list of China
(East coast, Central China, Northeast China, Western China, excluding Hong
Kong and Taiwan) represent, somewhat, to the of Chinese population, being
sent invitations to fulfil questionnaire thorough the link via social media and
email, leading to a final sample size with 417 respondents (13.9% response
rate).
4.3 Social-demographics Characteristics
There are two scales data collection designed in this research due to the needs
of modelling and theory test. The first scale data which contains water
consumption and behavioural data is designed and used for water use model
evaluation. And the second scale data which only has behavioural data is for
ETPB theory evaluation and dynamic behavioural intervention model
Chapter 4: Data and Statistical Analysis Yang Fu
67
parameter identification. In this section, social-demographic characteristics
for both two scales data are presented. The second scale data were used for
water use behaviour understanding as it covers a much wider range of
respondents.
The first scale data collection is done in an urban community in China. Out of
200 apartment households sampled in this study in SZ, China in 2013, only
128 apartments which had the monthly water consumption and sent back the
fulfilled questionnaire to us. The questionnaire response rate for this research
is 64%. Nine samples have been eliminated after been known collected from
short time or unstable living condition residents in the sampling year. Analysis
shows gender groups are evenly represented with 51% male and 49% female.
The modal age group is 36-45 years old (30%) with 29% in the range of 25-
35 years old, 22% in the range of 18 – 24 years old, 16% in the range of 46-
55 years old and 3% older than 55 years old. With respect to level of education,
27% of respondents had attended senior high school, 52% had achieved and
college or undergraduate education, 11% were from postgraduate background
and 10% were from primary school background. There are 64 % responses are
from 30K – 100K RMB/Y income range, 25% from 100K – 200K RMB/Y
income range, 9% from 200K – 500K RMB/Y income range and 2% with
income higher than 500K RMB/Y. As for the number of resident from survey
family, there are 55% from house with three residents, 27% from house with
Chapter 4: Data and Statistical Analysis Yang Fu
68
four residents, 10% from house with five residents and 8% from house with
less than three residents. As a typical family only has three residents, three
household which participate long-term behaviour observation is from three
residents’ family with income level at 30K-100K RMB/Y. All three families
are very positive for attending any environmental friendly activities and
willing to conserve water from face-to-face interview result.
For the second internet survey, 3000 participants from different regions of
China have been invited to complete the questionnaire for water use behaviour
study. There are 417 responses have been used to test ETPB model. The
sample results have showed almost equivalent numbers of male and female
participants: 47.2% male respondents and 50.6% female respondents. The
mean age is 37 years (standard deviation 18) with 39.7% high school
education background responses. 71% respondents are from 30K – 100K
RMB/Y income range, 13% from 100K – 200K RMB/Y income range, 8%
from 200K – 500K RMB/Y income range and 3% with income higher than
500K RMB/Y (and 5% respondents preferred not to say anything about their
income level). As for the number of resident per house participated the survey,
there are 63% from household with three residents, 19% from household with
four residents, 11% from household with five residents and 7% from
household with less than three residents.
Chapter 4: Data and Statistical Analysis Yang Fu
69
4.4 Mean Scores for ETPB Scales
In this section, mean scores are presented for the ETPB scale items. The mean
score values are all from the second stage data collection.
General intention mean score is 2.450 with standard deviation value 1.313,
which suggests that the general intention for Chinese residents attending water
conservation activity is slightly positive (2 is the neutral value) but still there
are some residents who showed good intention for the water conservation
activities. The question for “I intend to engage in water conservation activities
in the near future” score the highest mean point out of three intention questions
is 2.793 (standard deviation 1.102). On the contrary, the item “I expect I will
engage in everyday actions to save water around my property” scored the
lowest point out of three questions which is 2.261 with standard deviation
value 1.095. This suggests that even most residents willing to attend water
conservation activity in the future but their intention for everyday water
conservation actions is low which means everyday water conservation
engagement may not very be welcomed in the study group.
The attitude mean score showed a relative high score than intention which is
2.458 with standard deviation value 1.029. This suggests there is a large
number of respondents who think the water conservation activities are
positively contribute to their life or environment. In the six attitude items, the
question “Water
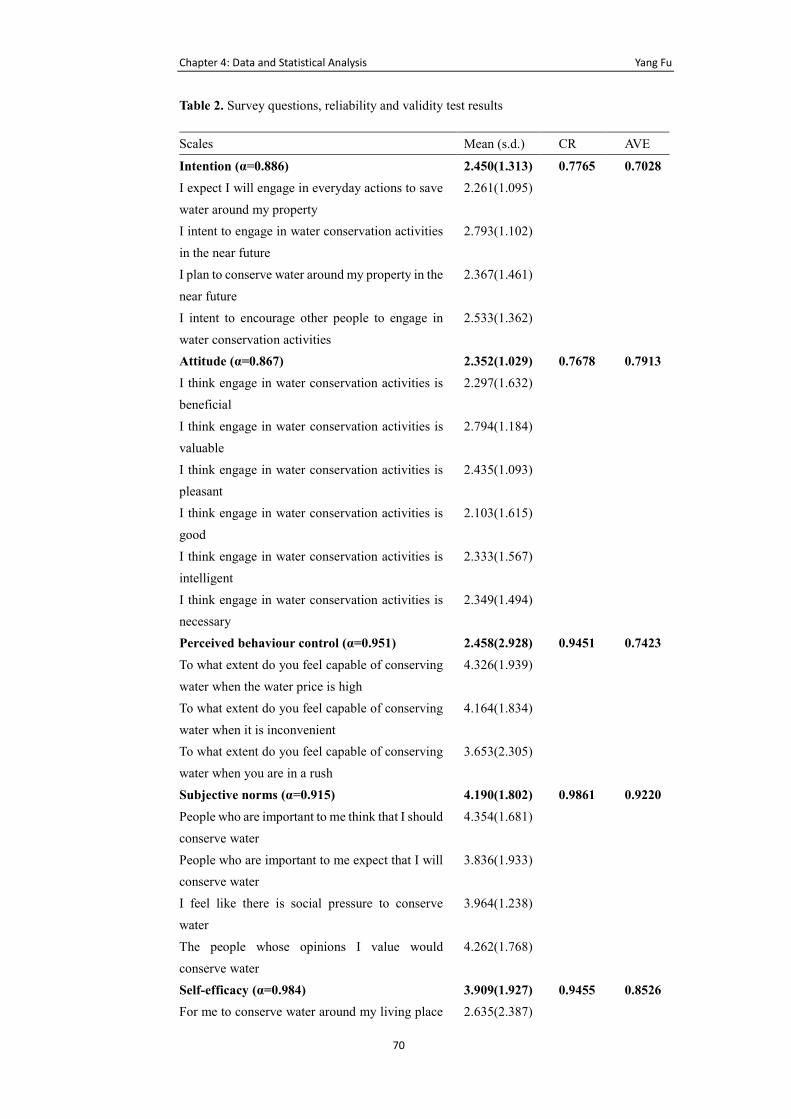
Chapter 4: Data and Statistical Analysis Yang Fu
70
Table 2. Survey questions, reliability and validity test results
Scales Mean (s.d.) CR AVE
Intention (α=0.886) 2.450(1.313) 0.7765 0.7028
I expect I will engage in everyday actions to save
water around my property
2.261(1.095)
I intent to engage in water conservation activities
in the near future
2.793(1.102)
I plan to conserve water around my property in the
near future
I intent to encourage other people to engage in
water conservation activities
2.367(1.461)
2.533(1.362)
Attitude (α=0.867) 2.352(1.029) 0.7678 0.7913
I think engage in water conservation activities is
beneficial
2.297(1.632)
I think engage in water conservation activities is
valuable
2.794(1.184)
I think engage in water conservation activities is
pleasant
2.435(1.093)
I think engage in water conservation activities is
good
2.103(1.615)
I think engage in water conservation activities is
intelligent
2.333(1.567)
I think engage in water conservation activities is
necessary
2.349(1.494)
Perceived behaviour control (α=0.951) 2.458(2.928) 0.9451 0.7423
To what extent do you feel capable of conserving
water when the water price is high
4.326(1.939)
To what extent do you feel capable of conserving
water when it is inconvenient
4.164(1.834)
To what extent do you feel capable of conserving
water when you are in a rush
3.653(2.305)
Subjective norms (α=0.915) 4.190(1.802) 0.9861 0.9220
People who are important to me think that I should
conserve water
4.354(1.681)
People who are important to me expect that I will
conserve water
3.836(1.933)
I feel like there is social pressure to conserve
water
3.964(1.238)
The people whose opinions I value would
conserve water
4.262(1.768)
Self-efficacy (α=0.984) 3.909(1.927) 0.9455 0.8526
For me to conserve water around my living place 2.635(2.387)
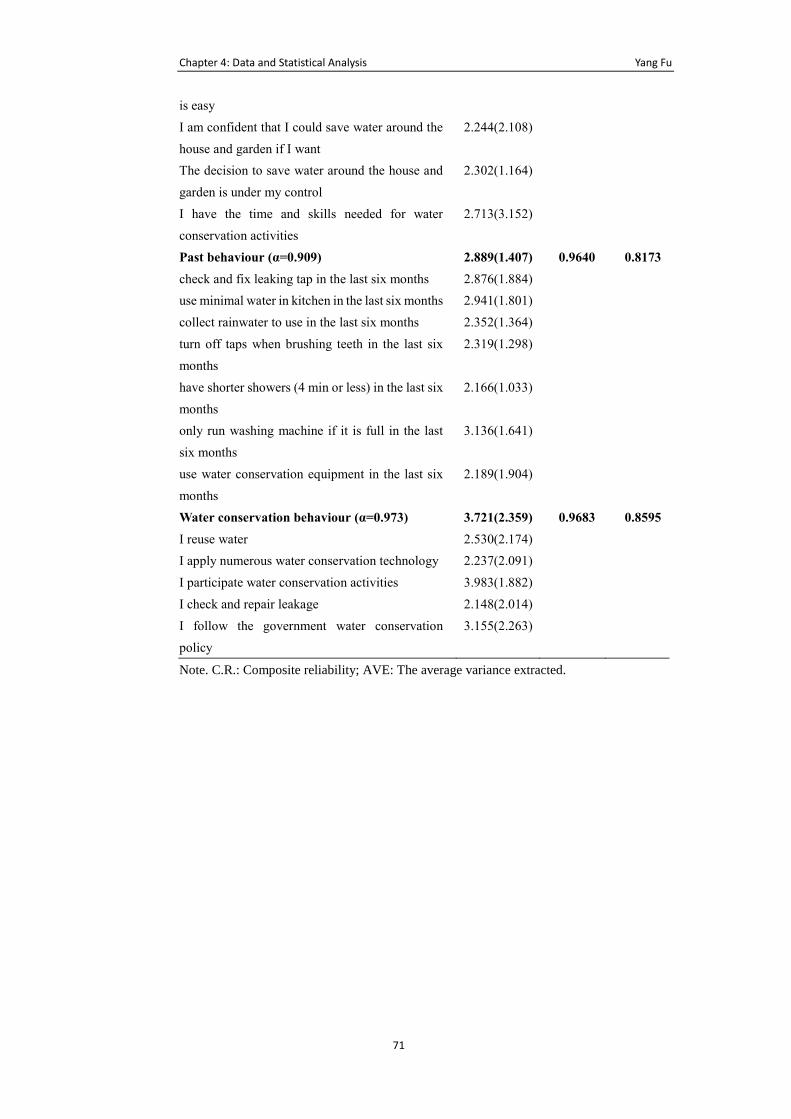
Chapter 4: Data and Statistical Analysis Yang Fu
71
is easy
I am confident that I could save water around the
house and garden if I want
2.244(2.108)
The decision to save water around the house and
garden is under my control
2.302(1.164)
I have the time and skills needed for water
conservation activities
2.713(3.152)
Past behaviour (α=0.909) 2.889(1.407) 0.9640 0.8173
check and fix leaking tap in the last six months 2.876(1.884)
use minimal water in kitchen in the last six months 2.941(1.801)
collect rainwater to use in the last six months 2.352(1.364)
turn off taps when brushing teeth in the last six
months
2.319(1.298)
have shorter showers (4 min or less) in the last six
months
2.166(1.033)
only run washing machine if it is full in the last
six months
use water conservation equipment in the last six
months
3.136(1.641)
2.189(1.904)
Water conservation behaviour (α=0.973) 3.721(2.359) 0.9683 0.8595
I reuse water 2.530(2.174)
I apply numerous water conservation technology 2.237(2.091)
I participate water conservation activities 3.983(1.882)
I check and repair leakage 2.148(2.014)
I follow the government water conservation
policy
3.155(2.263)
Note. C.R.: Composite reliability; AVE: The average variance extracted.
Chapter 4: Data and Statistical Analysis Yang Fu
72
conservation activities are valuable” scored the highest point which is 2.794
which means most respondents slightly agreed with this statement. On the
contrary, the item “water conservation activities are good” has the lowest
mean score which is 2.103 with standard deviation value 1.615. All the mean
scores for six attitude items are in a very close value and higher than 2 means
that stands most participants have a positive attitude about the current water
conservation activities and think engaging for these activities is positive.
Perceived behaviour control has a 2.458 mean score value with standard
deviation value 2.928. It is the highest standard deviation score for ETPB
items. The three PBC items mean scores varies from 3.653 (capability to
conserve water in a rush) to 4.326 (capability to conserve water when water
price is high). This suggests residents have different capabilities to conserve
water in different situation. The water price is a good trigger for promoting
water conservation projects which could potentially bring more participants
to the water conservation activities. And the capability score is smaller when
the residents are in an inconvenient and rush situation. To boot the water
conservation project promotion, solutions or technologies which have abilities
to control water use in these situations will be needed.
In case of the subjective norm, the four items all showed a mean score.
Average mean score for subjective norm is 4.190 with standard deviation
value 1.802. The biggest mean score for four subjective norm items is “people
Chapter 4: Data and Statistical Analysis Yang Fu
73
who are important to me think I should conserve water” suggesting the main
subjective barrier for Chinese residential water conservation activities is from
close people (family, friend or partner).
Mean score for self-efficacy is 3.909 with standard deviation value 1.927.
Confidence value for saving water around house or garden is the lowest mean
score out of four self-efficacy items which is 2.244 with standard deviation
2.108. Most respondents believe they have time and skills needed for water
conservation and the mean score for this item is 2.713 with standard deviation
3.152 which is the highest mean score for all self-efficacy questions. This
suggests the conflict of the water conservation skill and real application
around property. Corresponding support from local authority for increasing
the residential water conservation practical ability will be needed.
Past behaviour mean score achieved 2.889 with standard deviation value
1.407. In the survey result, we raised questions about six different water
conservation behaviour in the past half year including collect rainwater,
shorter shower, only run washing machine when it is full, turn off tap when
brushing teeth, check and fix leaking tap and use minimal water in kitchen.
Responses for the shorter shower took the smallest mean score out of six past
behaviour questions which is 2.166 with standard deviation value 1.033
suggesting residents did not have very good habit to take shorter shower in
water conservation purpose. On the contrary, the item “run washing machine
Chapter 4: Data and Statistical Analysis Yang Fu
74
if it is full” has the highest mean score which is 3.136 with standard deviation
1.641.
This study also directly measured the water conservation behaviour by five
different water conservation items. Response from “I participate in water
conservation activities” achieved the highest mean score which is 3.983 with
standard deviation value 1.882 suggesting many residents have participated in
water conservation projects. And the smallest mean score is “I apply numerous
water conservation technology” which is 2.237 with standard deviation 2.091.
This result is in line with the literature review in Chapter 2 and showed the
current water conservation projects have a low adaption rate in the water
conservation technologies. General average mean score for water
conservation behaviour is 3.721 with standard deviation value 2.359
suggesting the respondents are positively involving water conservation
activities.
4.5 Reliability
A reliable measurement gives the same measurements when the study is
repeated either the objects or events unchanged. If a measuring instrument
were reliable, it could have a positive correlation with the true scores. In this
study, the internal consistency for all the ETPB constructs are measured by
SPSS, the extent to which the items correlate will with one another. In SPSS,
Chapter 4: Data and Statistical Analysis Yang Fu
75
the scale if item deleted descriptive analysis is introduced to identify if delete
any item could increase the reliability value to a tolerated level. From the
reliability analysis result, all the reliability values for ETPB model are higher
than 0.7 which reaches an acceptable level with good reliability. When testing
the reliability, the corrected item-total correlation for PB7 (seventh item for
past behaviour) showed a very low value which is 0.083 (less than 0.5). Scale
variance if item is deleted increased to 0.968 and the reliability for past
behaviour increased to an acceptable level, thus, the PB7 should be excluded
in further analysis to pass reliability test. A summary for all the reliability test
of ETPB model constructs is presented in Table 3.
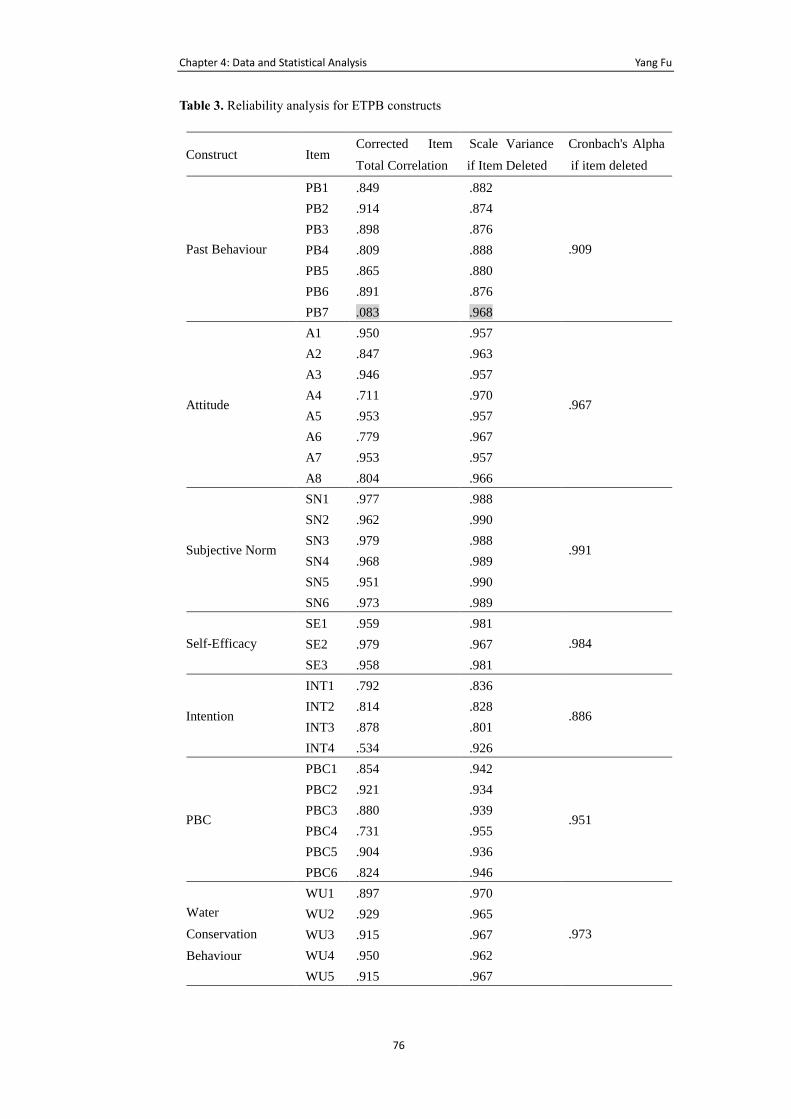
Chapter 4: Data and Statistical Analysis Yang Fu
76
Table 3. Reliability analysis for ETPB constructs
Construct Item Corrected Item
Total Correlation
Scale Variance
if Item Deleted
Cronbach's Alpha
if item deleted
Past Behaviour
PB1 .849 .882
.909
PB2 .914 .874
PB3 .898 .876
PB4 .809 .888
PB5 .865 .880
PB6 .891 .876
PB7 .083 .968
Attitude
A1 .950 .957
.967
A2 .847 .963
A3 .946 .957
A4 .711 .970
A5 .953 .957
A6 .779 .967
A7 .953 .957
A8 .804 .966
Subjective Norm
SN1 .977 .988
.991
SN2 .962 .990
SN3 .979 .988
SN4 .968 .989
SN5 .951 .990
SN6 .973 .989
Self-Efficacy
SE1 .959 .981
.984 SE2 .979 .967
SE3 .958 .981
Intention
INT1 .792 .836
.886 INT2 .814 .828
INT3 .878 .801
INT4 .534 .926
PBC
PBC1 .854 .942
.951
PBC2 .921 .934
PBC3 .880 .939
PBC4 .731 .955
PBC5 .904 .936
PBC6 .824 .946
Water
Conservation
Behaviour
WU1 .897 .970
.973
WU2 .929 .965
WU3 .915 .967
WU4 .950 .962
WU5 .915 .967
Chapter 4: Data and Statistical Analysis Yang Fu
77
4.6 Validity and Factor Analysis
There are three components for validity and factor analysis in SPSS. They are
preliminary analysis for testing whether the parameters are suitable for factor
analysis (validity test) or not. In this part, the SPSS could provide validity test
result, significance value and degree of freedom information. The second part
is the factor extraction. In this part, the SPSS provides extraction analysis
information about the extent of what level the seven parameters explain the
relationship. The third part dealing with information offered on SPSS is about
the rotated component matrix analysis (also known as rotated factor matrix)
which is a matrix of the factor loadings for each variable onto each factor. In
three information, if any test cannot pass, the error item will be eliminated
until all the three tests pass and fits factor analysis requirement.
4.6.1 Initial Preliminary Analysis
The construct validity of an operationalization is an extent to which it really
manipulates. For the validity and factor analysis, the KMO (Kaiser-Meyer-
Olkin) and Bartlett’s Test of Sphericity (Snedecor & Cochran, 1983), which
is a measure of sampling adequacy to check the case to variable ratio for the
analysis being conducted. This method could test whether the correlation
matrix is an identity matrix and show the validity and suitability of the
responses collected to the water saving issue in this research. The accepted
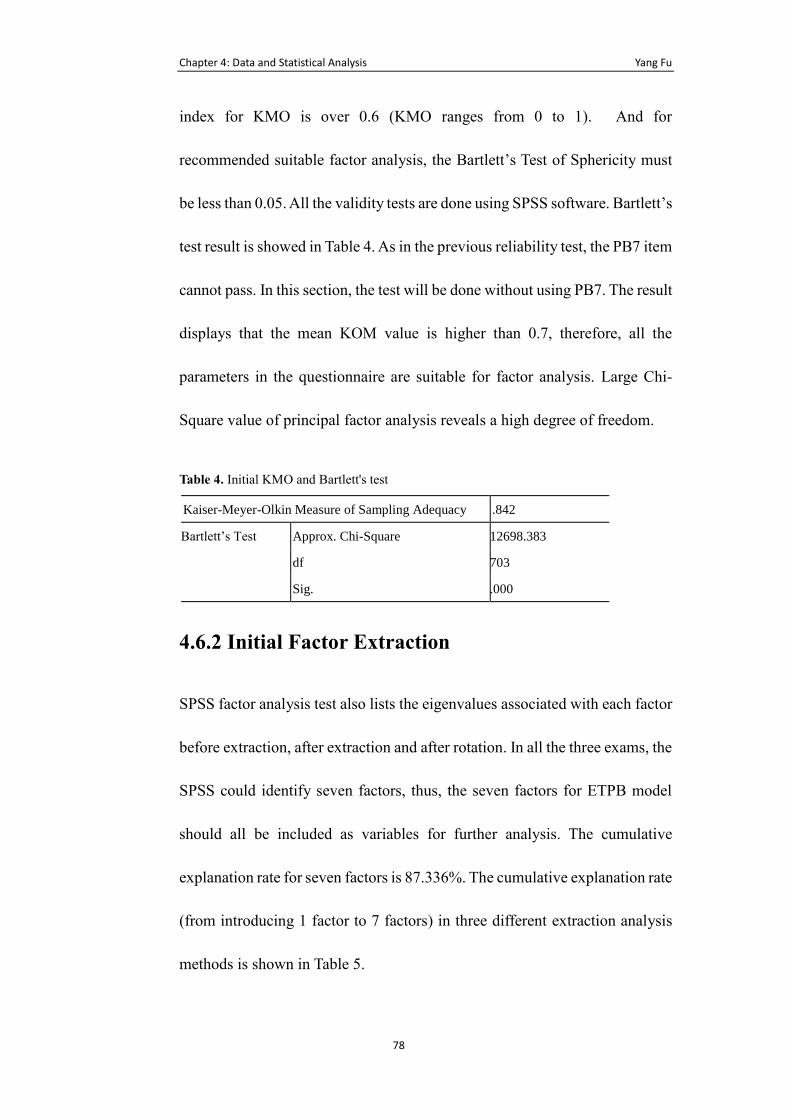
Chapter 4: Data and Statistical Analysis Yang Fu
78
index for KMO is over 0.6 (KMO ranges from 0 to 1). And for
recommended suitable factor analysis, the Bartlett’s Test of Sphericity must
be less than 0.05. All the validity tests are done using SPSS software. Bartlett’s
test result is showed in Table 4. As in the previous reliability test, the PB7 item
cannot pass. In this section, the test will be done without using PB7. The result
displays that the mean KOM value is higher than 0.7, therefore, all the
parameters in the questionnaire are suitable for factor analysis. Large Chi-
Square value of principal factor analysis reveals a high degree of freedom.
Table 4. Initial KMO and Bartlett's test
Kaiser-Meyer-Olkin Measure of Sampling Adequacy .842
Bartlett’s Test Approx. Chi-Square 12698.383
df 703
Sig. .000
4.6.2 Initial Factor Extraction
SPSS factor analysis test also lists the eigenvalues associated with each factor
before extraction, after extraction and after rotation. In all the three exams, the
SPSS could identify seven factors, thus, the seven factors for ETPB model
should all be included as variables for further analysis. The cumulative
explanation rate for seven factors is 87.336%. The cumulative explanation rate
(from introducing 1 factor to 7 factors) in three different extraction analysis
methods is shown in Table 5.
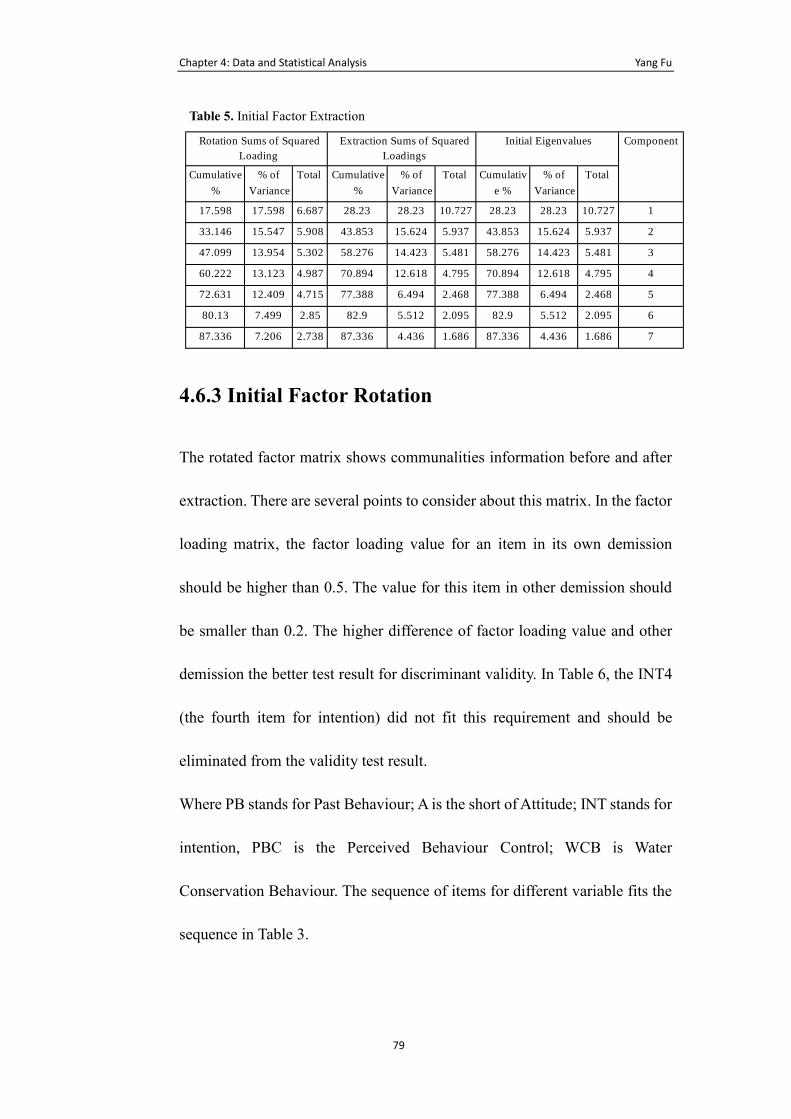
Chapter 4: Data and Statistical Analysis Yang Fu
79
4.6.3 Initial Factor Rotation
The rotated factor matrix shows communalities information before and after
extraction. There are several points to consider about this matrix. In the factor
loading matrix, the factor loading value for an item in its own demission
should be higher than 0.5. The value for this item in other demission should
be smaller than 0.2. The higher difference of factor loading value and other
demission the better test result for discriminant validity. In Table 6, the INT4
(the fourth item for intention) did not fit this requirement and should be
eliminated from the validity test result.
Where PB stands for Past Behaviour; A is the short of Attitude; INT stands for
intention, PBC is the Perceived Behaviour Control; WCB is Water
Conservation Behaviour. The sequence of items for different variable fits the
sequence in Table 3.
Table 5. Initial Factor Extraction
1
2
3
4
5
6
7
Total
10.727
5.937
5.481
4.795
2.468
2.095
1.686
% of
Variance
28.23
15.624
14.423
12.618
6.494
5.512
4.436
Cumulativ
e %
28.23
43.853
58.276
70.894
77.388
82.9
87.336
Total
10.727
5.937
5.481
4.795
2.468
2.095
1.686
% of
Variance
28.23
15.624
14.423
12.618
6.494
5.512
4.436
Cumulative
%
28.23
43.853
58.276
70.894
77.388
82.9
87.336
Total
6.687
5.908
5.302
4.987
4.715
2.85
2.738
% of
Variance
17.598
15.547
13.954
13.123
12.409
7.499
7.206
Cumulative
%
17.598
33.146
47.099
60.222
72.631
80.13
87.336
Extraction Sums of Squared
Loadings
Rotation Sums of Squared
Loading
ComponentInitial Eigenvalues
Chapter 4: Data and Statistical Analysis Yang Fu
80
Table 6. Initial Rotated Factor Matrix
Component
1 2 3 4 5 6 7
PB1 .893
PB2 .952
PB3 .913
PB4 .847
PB5 .878
PB6 .938
A1 .950
A2 .883
A3 .947
A4 .739
A5 .953
A6 .805
A7 .955
A8 .851
SN1 .966
SN2 .954
SN3 .967
SN4 .962
SN5 .944
SN6 .967
SE1 .923
SE2 .929
SE3 .918
INT1 .810
INT2 .816
INT3 .873
INT4 .362 .403 .508
PBC1 .847
PBC2 .914
PBC3 .893
PBC4 .761
PBC5 .885
PBC6 .845
WCB1 .882
WCB2 .948
WCB3 .899
WCB4 .961
WCB5 .938
Chapter 4: Data and Statistical Analysis Yang Fu
81
4.6.4 Validity and Factor Analysis without INT 4
As the INT4 cannot pass the test in rotated factor matrix, the three tests then
should be redone to check all the validity and factor analysis information
without INT 4. Still, without INT 4, the KMO test value is higher than 0.6
which suggests all the items and variables are suitable for performing factor
analysis. The KMO and Bartlett’s test without INT 4 is showed in Table 7.
The cumulative explanation rate for seven factors is 88.178%. The cumulative
explanation rate (from introducing 1 factor to 7 factors (without INT 4)) in
three different extraction analysis methods are showed in Table 8. The rotated
factor matrix without INT 4 is showed in Table 9 which suggests all the items
passed the validity test with factor loading value higher than 0.5.
Again, after the rotation, the AVE (Average Variance Extracted) and C.R.
(Composite Reliability) were tested to confirm the validity test outcome. Table
10 presents the AVE and C.R. test results. The test result indicated all
reliability values were greater than suggested threshold of 0.60. As an
assessment of the validity of the measures, factor loading within all the
indicators, AVE (average variance extracted), and construct correlation were
calculated. The result indicated an adequate convergent validity with all factor
loading values, AVE, CR were above 0.5, 0.6 and 0.7 respectively. All the tests
showed the data has passed the reliability and validity tests, and is suitable for
structure equation modelling analysis.
Chapter 4: Data and Statistical Analysis Yang Fu
82
The factor analysis (Exploratory Factor Analysis) has tested the correlations
for different variable in the ETPB model. And through the test, two question
items have been eliminated to meet the model validity requirement.
Table 7. KMO and Bartlett's test without INT 4
Kaiser-Meyer-Olkin Measure of Sampling Adequacy .845
Bartlett’s Test Approx. Chi-Square 12492.597
df 666
Sig. .000
Ta
ble
8. Factor Extraction without INT 4
1 2 3 4 5 6 7
To
tal
10
.46
6
5.9
18
5.4
61
4.6
19
2.4
6
2.0
88
1.6
15
% o
f
Vari
an
ce
28
.28
6
15
.99
4
14
.75
9
12
.48
3
6.6
48
5.6
43
4.3
64
Cu
mu
lati
ve %
28
.28
6
44
.28
1
59
.04
71
.52
3
78
.17
1
83
.81
4
88
.17
8
To
tal
10
.46
6
5.9
18
5.4
61
4.6
19
2.4
6
2.0
88
1.6
15
% o
f
Vari
an
ce
28
.28
6
15
.99
4
14
.75
9
12
.48
3
6.6
48
5.6
43
4.3
64
Cu
mu
lati
ve %
28
.28
6
44
.28
1
59
.04
71
.52
3
78
.17
1
83
.81
4
88
.17
8
To
tal
6.6
64
5.9
06
5.2
71
4.9
4.5
68
2.8
42
2.4
75
% o
f
Vari
an
ce
18
.01
1
15
.96
3
14
.24
5
13
.24
2
12
.34
5
7.6
82
6.6
9
Cu
mu
lat
ive %
18
.01
1
33
.97
4
48
.21
9
61
.46
1
73
.80
6
81
.48
8
88
.17
8
Ex
tracti
on
Su
ms
of
Sq
uare
d
Lo
ad
ing
s
Ro
tati
on
Su
ms
of
Sq
uare
d
Lo
ad
ing
Co
mp
on
en
tIn
itia
l E
igen
valu
es
Chapter 4: Data and Statistical Analysis Yang Fu
83
Table 9. Rotated Factor Matrix without INT 4
Rotated Factor Matrix
Component
1 2 3 4 5 6 7
PB1 .892
PB2 .952
PB3 .914
PB4 .848
PB5 .876
PB6 .938
A1 .951
A2 .883
A3 .949
A4 .741
A5 .954
A6 .805
A7 .956
A8 .851
SN1 .966
SN2 .955
SN3 .967
SN4 .962
SN5 .944
SN6 .967
SE1 .923
SE2 .929
SE3 .918
INT1 .832
INT2 .836
INT3 .847
PBC1 .849
PBC2 .917
PBC3 .897
PBC4 .759
PBC5 .890
PBC6 .848
WCB1 .883
WCB2 .948
WCB3 .901
WCB4 .962
WCB5 .939
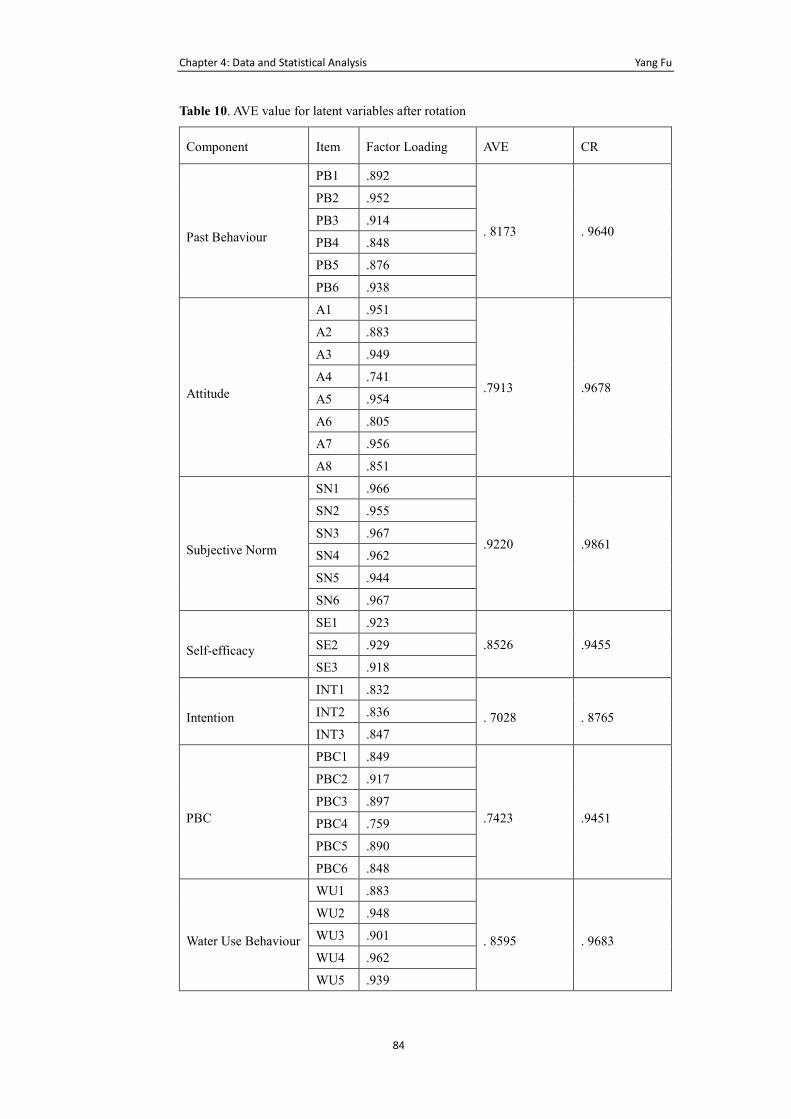
Chapter 4: Data and Statistical Analysis Yang Fu
84
Table 10. AVE value for latent variables after rotation
Component Item Factor Loading AVE CR
Past Behaviour
PB1 .892
. 8173 . 9640
PB2 .952
PB3 .914
PB4 .848
PB5 .876
PB6 .938
Attitude
A1 .951
.7913 .9678
A2 .883
A3 .949
A4 .741
A5 .954
A6 .805
A7 .956
A8 .851
Subjective Norm
SN1 .966
.9220 .9861
SN2 .955
SN3 .967
SN4 .962
SN5 .944
SN6 .967
Self-efficacy
SE1 .923
.8526 .9455 SE2 .929
SE3 .918
Intention
INT1 .832
. 7028 . 8765 INT2 .836
INT3 .847
PBC
PBC1 .849
.7423 .9451
PBC2 .917
PBC3 .897
PBC4 .759
PBC5 .890
PBC6 .848
Water Use Behaviour
WU1 .883
. 8595 . 9683
WU2 .948
WU3 .901
WU4 .962
WU5 .939
Chapter 4: Data and Statistical Analysis Yang Fu
85
4.7 Confirmatory Factor Analysis
Confirmatory Factor Analysis (CFA) is a statistical technique applied to verify
factor structure. Confirmatory factor analysis is a tool that is used to confirm
or reject the measurement theory. Hair et al. (2003) noted that factor analysis
can be computed via either an exploratory or confirmatory perspective. But in
the Exploratory Factor Analysis (EFA), data is simply explored and it provides
information about the numbers of factors needed to represent data, and all
measured variables are related to latent variable. Hair et al (2003) defined the
usage of six-stage decision making process when applying SEM in research
use. According to this six-stage theory, CFA is commonly used to cover all the
fundamental construct statistical analysis from construct definition to model
validity assessment.
CFA is a way for testing how well measured variables represent a smaller
number of constructs (Hair et al., 2006). Using CFA must specify the number
of factors within set variables and the factors will load highly before results
are computed. Hair et al. (2003) noted that CFA is a tool which could identify
how well the factor fits real data and has been used massively for testing
preconceived theory. The measurement for preconceived theory is to specify
how well the measured items match the construct sets. CFA provides solutions
to estimate those relationships between constructs to variables and
Chapter 4: Data and Statistical Analysis Yang Fu
86
relationship among construct (Hair et al., 2006) therefore, CFA could be
applied for testing theoretical foundation when needed.
After the screening of the above factor analysis, a CFA test is conducted to
cross-validate the current structure and test the ETPB model fitness. As the
ETPB model is based on the empirical study and published theories, a
confirmatory factor analysis using maximum likelihood method was
conducted to confirm and test the proposed theory and structure.
A CFA test for the original TPB model (model 1) with attitude, PBC and
subjective norms was initially conducted. The first CFA showed a good fit of
the structural equation modelling (x^2= 837.347, df=335, GFI=0.768,
RMSEA=0.089, IFI= 0.950, TLI= 0.943, CFI= 0.949). Another CFA test for
TPB model with external construct – self-efficacy (model 2) also exhibited
good psychometric properties (x^2= 957.463, df=414, GFI=0.763,
RMSEA=0.083, IFI= 0.951, TLI= 0.944, CFI= 0.951), followed by a good
CFA fit test result from the proposed ETPB (model 3) which contains past
behaviour and self-efficacy as external constructs (x^2= 1310.423, df=603,
GFI=0.735, RMSEA=0.079, IFI= 0.945, TLI= 0.939, CFI= 0.945).
Chapter 4: Data and Statistical Analysis Yang Fu
87
4.8 Summary
In this Chapter, the sampling data has been tested regarding reliability and
validity. And the test was successful by eliminating the two question items
from the survey. Exploratory Factor Analysis (EFA) (section 4.5) and
Confirmatory Factor Analysis (CFA) are also presented to test the model
structure and confirm if there is any confliction between different constructs.
The test result has showed that current questionnaire and data are suitable for
SEM analysis and there is no conflict in the construct settings in this pre-
model evaluation process. The processed data is ready for further model test
use.
Chapter 5: Expanded Theory of Planned Behaviour Yang Fu
88
5. Expanded Theory of Planned
Behaviour
Based on the data analysis result in Chapter 4, the ETPB model and its internal
relationship are tested and presented in this section. Three models (Model 1:
original TPB; Model 2: TPB with self-efficacy; model 3: ETPB) have been
developed using structure equation modelling method. And the finding
suggested adding two additional constructs in the TPB structure could
improve the prediction power of this behaviour intervention theory. Also, the
role of self-efficacy and PBC, the role of past behaviour and the indirect
effects of past behaviour are presented and analysed in this chapter to identify
what is the influence for introducing external constructs to the TPB structure.
5.1 ETPB Architecture
As discussed in Chapter 3, the Past Behaviour and Self-efficacy should be
included in the TPB for improving the prediction ability. Taking into account
the original TPB predictor variables: a) attitude which reflects individual’s
positive/negative appraisal towards a target behaviour; b) subjective norm, the
perceived external/social pressure to engage or not in a behaviour; c)
Perceived Behavioural Control (PBC) reflects perceived ease/difficulty for
target behaviour performance, this research added d) past behaviour which
Chapter 5: Expanded Theory of Planned Behaviour Yang Fu
89
refers to the degree to value the former behaviour towards precise purpose;
and e) self-efficacy, the extent or strength to people’s belief in their abilities
to perform a behaviour, in TPB framework as an extension version to
understand how Chinese residential water conservation behaviour changes.
Fig. 2 depicts the proposed Expanded Theory of Planned Behaviour (ETPB).
By following the general rule of TPB behavioural hypothesis, with more
positive attitude, greater PBC and subjective norm will strengthen the
individual’ intention to perform a behaviour, thus, hypothesis of ETPB were
as follows:
H1. As attitudes towards water conservation became more positive, the
residential intention to save water and adopt conservation activity
increased.
H2. As subjective norm towards water conservation increased, the residential
intention to save water and adopt conservation activity increased.
H3. As PBC towards water conservation increased, the residential intention
to save water and adopt conservation activity increased.
H4. As self-efficacy about water conservation became more positive, a
residential intention to save water and adopt conservation activity
increased.
H5. As past behaviour towards water conservation became more positive, the
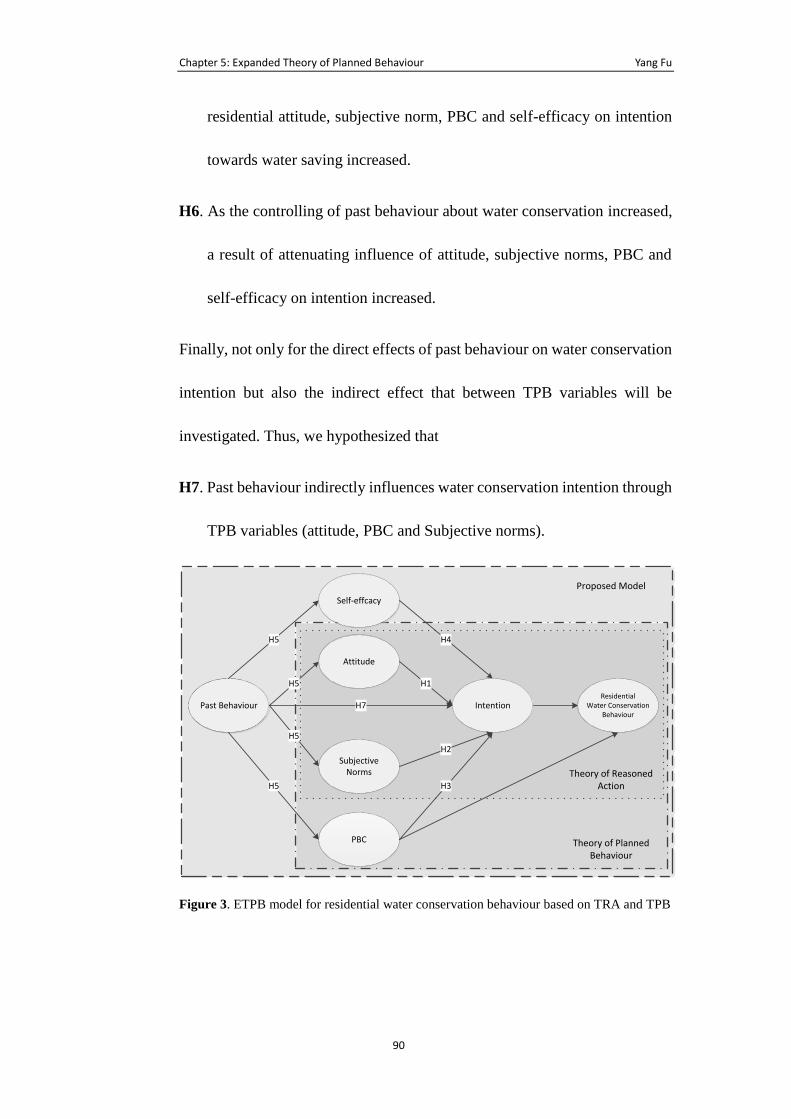
Chapter 5: Expanded Theory of Planned Behaviour Yang Fu
90
residential attitude, subjective norm, PBC and self-efficacy on intention
towards water saving increased.
H6. As the controlling of past behaviour about water conservation increased,
a result of attenuating influence of attitude, subjective norms, PBC and
self-efficacy on intention increased.
Finally, not only for the direct effects of past behaviour on water conservation
intention but also the indirect effect that between TPB variables will be
investigated. Thus, we hypothesized that
H7. Past behaviour indirectly influences water conservation intention through
TPB variables (attitude, PBC and Subjective norms).
Self-effcacy
Attitude
Subjective Norms
PBC
Past Behaviour IntentionResidential
Water ConservationBehaviour
H5 H1
H2
H3
H4H5
H5
H5
H7
Theory of Reasoned Action
Theory of Planned Behaviour
Proposed Model
Figure 3. ETPB model for residential water conservation behaviour based on TRA and TPB
Chapter 5: Expanded Theory of Planned Behaviour Yang Fu
91
5.2 ETPB Evaluation
The hypotheses 1, 2 and 3 were initially tested by original TPB structural
model (model 1, see Fig. 4) which has a satisfactory model fit (x2= 844.867,
df=340, GFI=0.766, RMSEA=0.088, IFI= 0.949, TLI= 0.943, CFI= 0.949)
and all standardized regression coefficients were significant at 0.01 level.
Based on the coefficients in the equation, the three antecedent variables (see
Fig. 4) explained about 28% variance of intention and the four TPB variables
(including intention) contributed 39% variance percentage for predicting
water conservation behaviour. The regression paths from PBC (β=0.273,
t=4.319, p< 0.01), subjective norms (β=0.235, t=3.710, p< 0.01) and attitude
(β=0.293, t=4.600, p< 0.01) to intention were significant, therefore, H1, H2
and H3 are accepted. The finding aligned with previous studies (Lam,1999;
Lam, 2006; Clark and Finley, 2007; Hurlimann, 2009; Gilg and Barr, 2006)
indicating that an increase in water conservation attitude, subjective norms
and PBC will result in an increase in the residential willingness to conserve
more water.
An augmented version of the TPB was tested by model 2 to determine the
influence of self-efficacy as a predictor of residential water conservation
behaviour. The TPB model with external construct self-efficacy (model 2, see
Fig. 5.) has a good model fit as well (x2 = 1005.723, df=423, GFI=0.753,
RMSEA=0.085, IFI= 0.947, TLI= 0.942, CFI= 0.947). All the structural
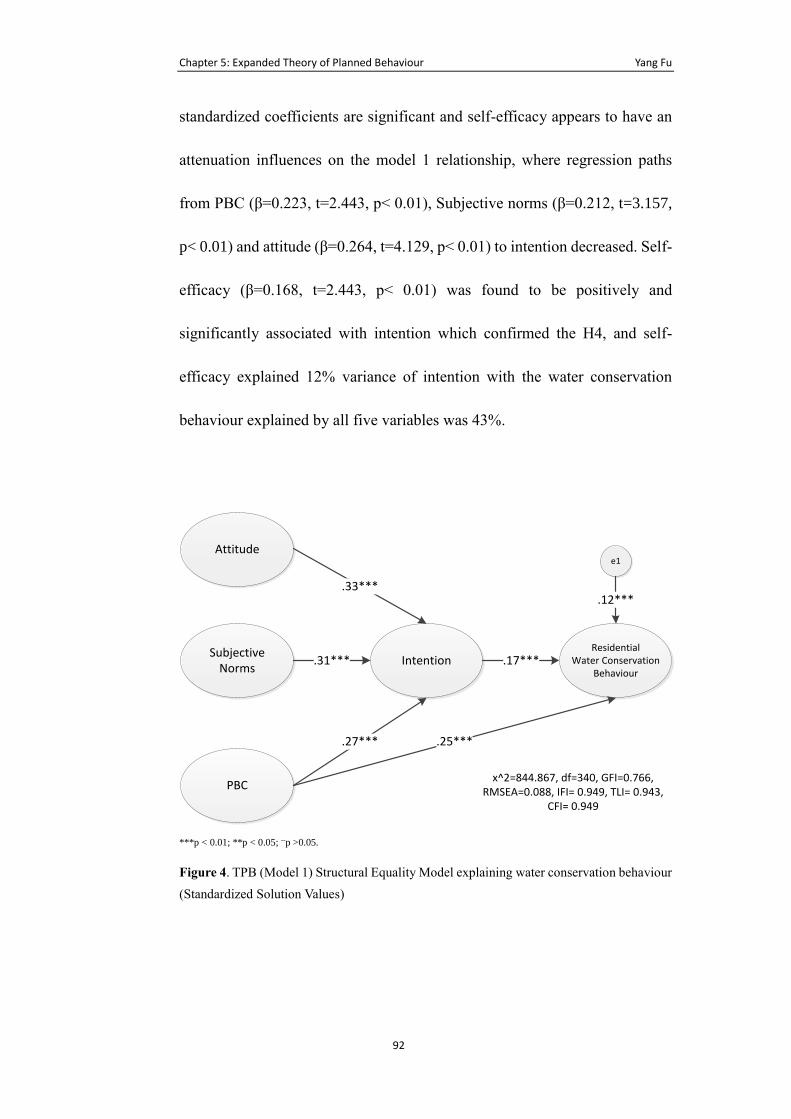
Chapter 5: Expanded Theory of Planned Behaviour Yang Fu
92
standardized coefficients are significant and self-efficacy appears to have an
attenuation influences on the model 1 relationship, where regression paths
from PBC (β=0.223, t=2.443, p< 0.01), Subjective norms (β=0.212, t=3.157,
p< 0.01) and attitude (β=0.264, t=4.129, p< 0.01) to intention decreased. Self-
efficacy (β=0.168, t=2.443, p< 0.01) was found to be positively and
significantly associated with intention which confirmed the H4, and self-
efficacy explained 12% variance of intention with the water conservation
behaviour explained by all five variables was 43%.
Attitude
Subjective Norms
PBC
IntentionResidential
Water ConservationBehaviour
.33***
.17***.31***
.27*** .25***
e1
.12***
x^2=844.867, df=340, GFI=0.766, RMSEA=0.088, IFI= 0.949, TLI= 0.943,
CFI= 0.949
***p < 0.01; **p < 0.05; --p >0.05.
Figure 4. TPB (Model 1) Structural Equality Model explaining water conservation behaviour
(Standardized Solution Values)
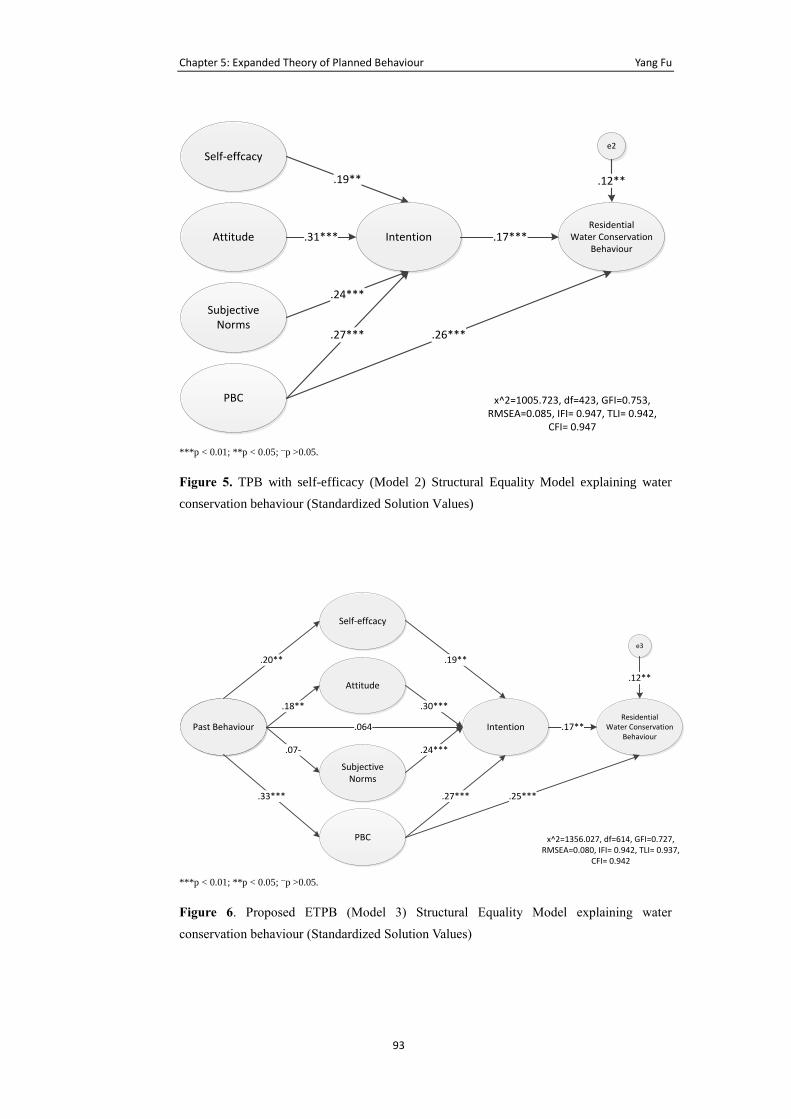
Chapter 5: Expanded Theory of Planned Behaviour Yang Fu
93
Self-effcacy
Attitude
Subjective Norms
PBC
IntentionResidential
Water ConservationBehaviour
.31*** .17***
.24***
.27*** .26***
.19**
e2
.12**
x^2=1005.723, df=423, GFI=0.753, RMSEA=0.085, IFI= 0.947, TLI= 0.942,
CFI= 0.947 ***p < 0.01; **p < 0.05; --p >0.05.
Figure 5. TPB with self-efficacy (Model 2) Structural Equality Model explaining water
conservation behaviour (Standardized Solution Values)
Self-effcacy
Attitude
Subjective Norms
PBC
Past Behaviour IntentionResidential
Water ConservationBehaviour
.18** .30***
.17**
.24***
.27*** .25***
.19**.20**
.07-
.33***
.064-
e3
.12**
x^2=1356.027, df=614, GFI=0.727, RMSEA=0.080, IFI= 0.942, TLI= 0.937,
CFI= 0.942 ***p < 0.01; **p < 0.05; --p >0.05.
Figure 6. Proposed ETPB (Model 3) Structural Equality Model explaining water
conservation behaviour (Standardized Solution Values)
Chapter 5: Expanded Theory of Planned Behaviour Yang Fu
94
The proposed model (model 3, see Fig. 6) provided a satisfactory fit (x2 =
1356.027, df=614, GFI=0.727, RMSEA=0.080, IFI= 0.942, TLI= 0.937, CFI=
0.942). The majority of the structural regression coefficients are again
significant (p<0.01), apart from the past behaviour to subjective norms
(p>0.05). H5 was tested. Results showed that past behaviour has a positive
influence on water conservation intention (β=0.196, t=2.757, p< 0.01),
attitude (β=0.179, t=2.502, p< 0.05), PBC (β=0.380, t=5.468, p< 0.01), self-
efficacy (β=0.302, t=3.104, p< 0.01) and subjective norms (β=0.076, t=1.053,
p> 0.05), thus, H5 was partially confirmed. In order to examine H6, the 95%
confidence intervals (𝐶𝐼0.95 ) for standardized coefficients (Hagger et al.,
2001a) was performed in model 2 and model 3. An overlap occurred for the
confidence intervals in model 2 and model 3, and no significant attenuation of
model relationships was showed as a result of the past behaviour inclusion,
therefore H7 is rejected. In the proposed model, all the variables (past
behaviour, subjective norm, PBC, intention and attitude) accounted for 49%
of the variance in water conservation behaviour.
5.3 The Role of Self-efficacy and PBC
In previous research, studies have already pointed out that using principal
components factor analysis method could identify the distinction between
PBC and Self-efficacy. In this research, the principal components analysis
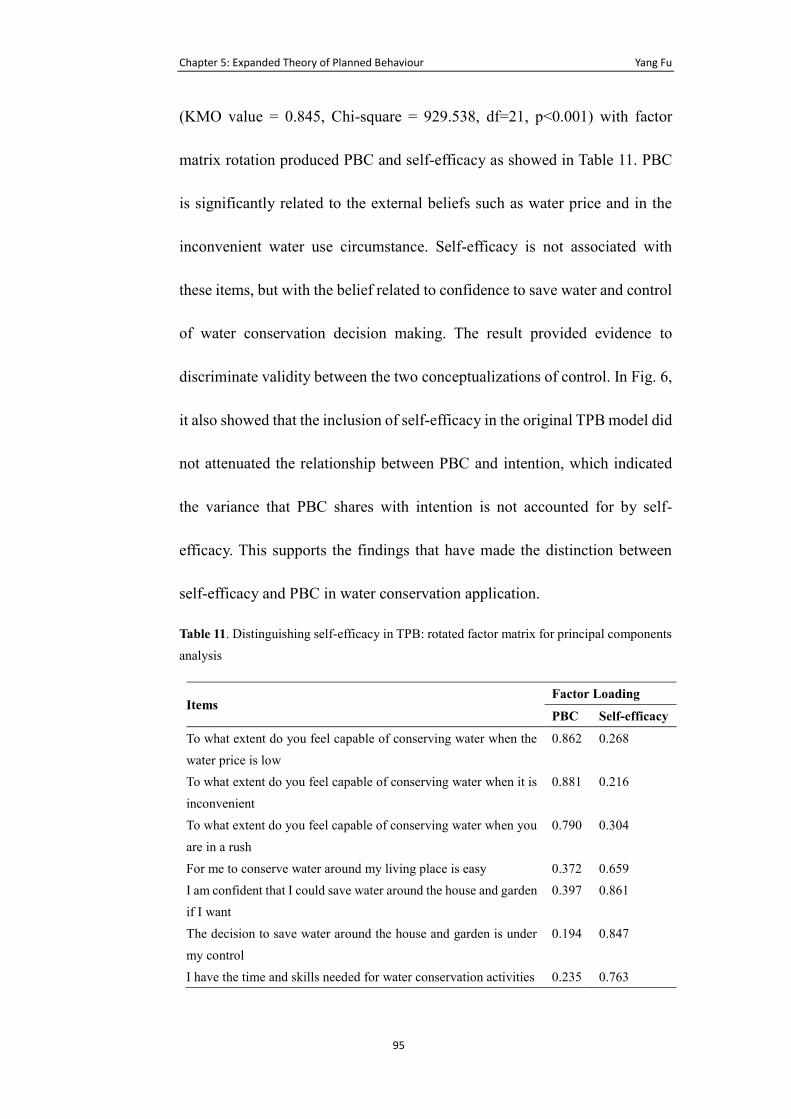
Chapter 5: Expanded Theory of Planned Behaviour Yang Fu
95
(KMO value = 0.845, Chi-square = 929.538, df=21, p<0.001) with factor
matrix rotation produced PBC and self-efficacy as showed in Table 11. PBC
is significantly related to the external beliefs such as water price and in the
inconvenient water use circumstance. Self-efficacy is not associated with
these items, but with the belief related to confidence to save water and control
of water conservation decision making. The result provided evidence to
discriminate validity between the two conceptualizations of control. In Fig. 6,
it also showed that the inclusion of self-efficacy in the original TPB model did
not attenuated the relationship between PBC and intention, which indicated
the variance that PBC shares with intention is not accounted for by self-
efficacy. This supports the findings that have made the distinction between
self-efficacy and PBC in water conservation application.
Table 11. Distinguishing self-efficacy in TPB: rotated factor matrix for principal components
analysis
Items Factor Loading
PBC Self-efficacy
To what extent do you feel capable of conserving water when the
water price is low
0.862 0.268
To what extent do you feel capable of conserving water when it is
inconvenient
0.881 0.216
To what extent do you feel capable of conserving water when you
are in a rush
0.790 0.304
For me to conserve water around my living place is easy 0.372 0.659
I am confident that I could save water around the house and garden
if I want
0.397 0.861
The decision to save water around the house and garden is under
my control
0.194 0.847
I have the time and skills needed for water conservation activities 0.235 0.763
Chapter 5: Expanded Theory of Planned Behaviour Yang Fu
96
5.4 The Role of Past Behaviour
In this study, mediation analysis is performed to understand two models: one
is corresponding to unobservable relations among variables, and other is to
corresponding to statistical analyses of sampling data (MacCorquodale and
Meehl, 1948). The Sobel test and bootstrapping method (with default N=1000
bootstrap resamples) were used to calculate the indirect effects. The Sobel test
describes the mediator potency by creating the asymptotic standard error using
multivariate delta method (Natalia López-Mosquera, 2014). Analysis process
is performed by a SPSS-micro which offers an estimation of indirect effect
and 95% Monte Carlo confidence interval with effect size measures (Hayes,
2013).
It has been widely discussed in previous researches about the limitations of
standardized regression coefficient and raw correlation in analysis of the
indirect effect (see MacKinnon, 2008). Kristopher (2011) argued that effect
size, “degree to which the phenomenon is present in the population or the
degree to which the null hypothesis is false”, is capable of measuring the full
meaning of an indirect effect and amenable to the construction of confidence
intervals. Therefore, to test the indirect influence in our proposed model, all
indirect effect size from past behaviour to four variables (attitude, PBC,
Subjective norms and self-efficacy) were measured instead of using standard
regression coefficients in previous research (Natalia López-Mosquera et al.,
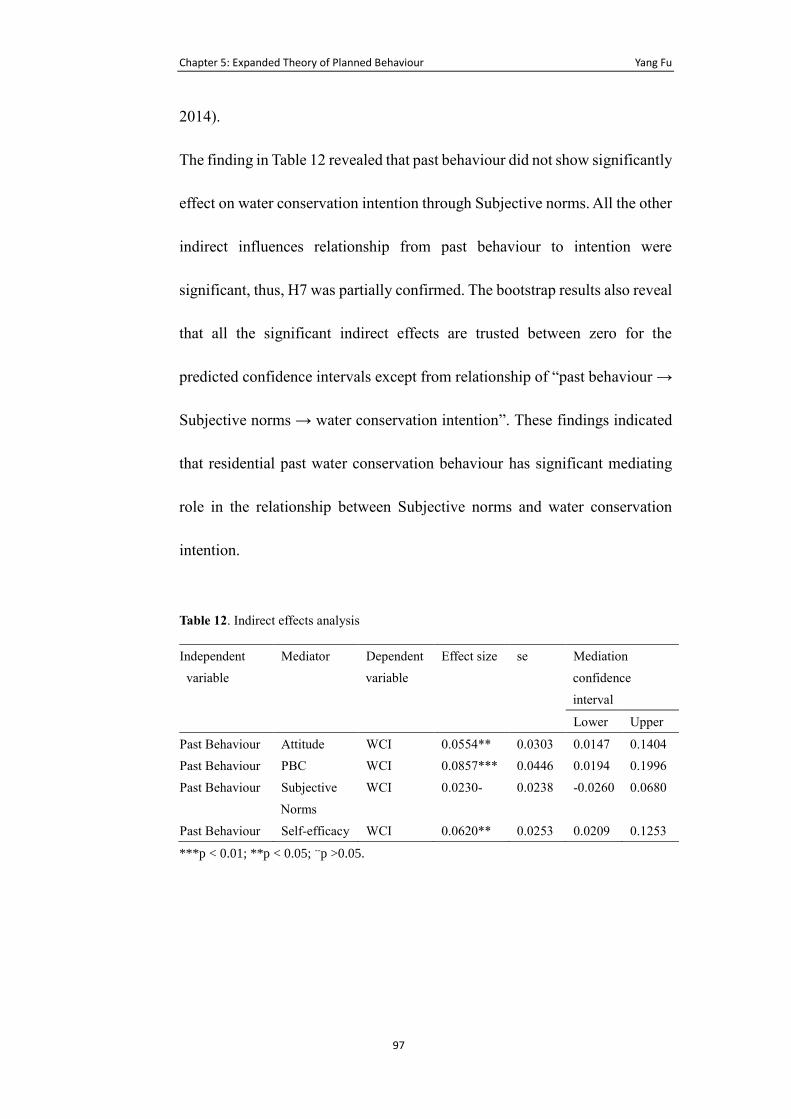
Chapter 5: Expanded Theory of Planned Behaviour Yang Fu
97
2014).
The finding in Table 12 revealed that past behaviour did not show significantly
effect on water conservation intention through Subjective norms. All the other
indirect influences relationship from past behaviour to intention were
significant, thus, H7 was partially confirmed. The bootstrap results also reveal
that all the significant indirect effects are trusted between zero for the
predicted confidence intervals except from relationship of “past behaviour →
Subjective norms → water conservation intention”. These findings indicated
that residential past water conservation behaviour has significant mediating
role in the relationship between Subjective norms and water conservation
intention.
Table 12. Indirect effects analysis
Independent
variable
Mediator Dependent
variable
Effect size se Mediation
confidence
interval
Lower Upper
Past Behaviour Attitude WCI 0.0554** 0.0303 0.0147 0.1404
Past Behaviour PBC WCI 0.0857*** 0.0446 0.0194 0.1996
Past Behaviour Subjective
Norms
WCI 0.0230- 0.0238 -0.0260 0.0680
Past Behaviour Self-efficacy WCI 0.0620** 0.0253 0.0209 0.1253
***p < 0.01; **p < 0.05; --p >0.05.
Chapter 5: Expanded Theory of Planned Behaviour Yang Fu
98
5.5 Summary
Little research has focused on development of residential water conservation
decision-making process. The current study provided an understanding of
residential water conservation intention to perform a conservation behaviour
by incorporating two constructs: frequency of past water conservation
behaviour and self-efficacy into the original TPB model. The proposed
Expanded Theory of Planned Behaviour (ETPB) was tested using three SEMs,
which showed that this model could offer a useful and effective framework to
analyse the inter-relationship existing between TPB variables (attitude,
intention, subjective norm and PBC), past behaviour and self-efficacy. In the
same way, the proposed model benefits in the identification of how these two
new constructs (past behaviour and self-efficacy) influence on original TPB
relationship. This study represents, for the first time, the analysis of indirect
influence of past behaviour on residential water conservation intention in the
ETPB framework, therefore, may be helpful for related water conservation
research and public decision-making process.
The study findings hold both theoretical and practical implications. First, the
finding indicated that the proposed model supports the prediction of Chinese
residential water conservation intention. The modelling comparisons showed
that the proposed model represents a substantial improvement over the TPB
(model 1) and TPB with self-efficacy (model 2). Second, this study found that
Chapter 5: Expanded Theory of Planned Behaviour Yang Fu
99
past water conservation behaviour and self-efficacy have a significant positive
association with water conservation intention. Also, it is the internal aspects
of control in the face of barriers (self-efficacy) with PBC that reflects external
barriers control that affect Chinese residential water conservation intentions.
The findings suggested that governments should provide a good education and
environment for residents to participate the water conservation activities
involved in policy promotion, which will foster personal improvement and
competence. With regard to PBC, Blanke et al. (2007) argued that policy
supporting institutions should provide in some case financial assistance and
coordination to help resident conquer external barriers.
Third, as showed in Table 12, this study indicated that among the four
mediator variables in proposed model, only subjective norms cannot
significantly mediate the impact of past behaviour on water conservation
intention. This finding implied that past behaviour shapes attitude, self-
efficacy and PBC towards a behaviour, and these enhance residential water
conservation decision. Accordingly, water conservation project managers
should consider the residential water conservation background areas before
starting to promote and install water conservation technologies. It is suggested
that water conservation technologies should fit past residential water
conservation background (behaviour). For example, if residents in an area
have a long-term habit to take short shower, the corresponding technologies
Chapter 5: Expanded Theory of Planned Behaviour Yang Fu
100
to enhance shorter shower time will be easier to gain success in the case. And
the development of more effective water conservation strategies is essential to
improve their residential experiences while participating in a project.
Fourth, the present study is, the first to examine the past behaviour influence
on residential water conservation intention, attitude, PBC, subjective norms
and self-efficacy. The Control of past water conservation behaviour did not
attenuate the influence of TPB relationship and self-efficacy which is
consistent with Hagger et al.’s (2001a, 2001b) finding, but contrary to the
previous studies (see examples Yordy, 1993; Norman et al., 2000). The lack
of social cognitive attenuation influence by past behaviour suggests that past
water conservation behavioural engagement does not have the similar
cognitive-reducing influences on residential water conservation intentions
that reported in literature. One of the reason may be that most Chinese
residents do not have organized past behavioural patterns as developed
countries.
Chapter 7: Behaviour and Water Use Yang Fu
101
6. ETPB Dynamic Behaviour
Intervention Modelling
In statistics, mathematic and computational modelling, a grey box model is a
model combines partial theoretical structure with data to complete the model.
The theoretical structure varies from information, theory or only parameters
from literature. In this study, the theoretical structure is based on validated
ETPB model. It is opposed to the black box model where no model or structure
is assumed and different from white box model which is purely theoretical.
In this chapter, the dynamic ETPB model based on ETPB theory is simulated
and tested using data from ten voluntary households. As a grey box model, the
inputs of ETPB dynamic behaviour intervention model were replicated, and
the internal model parameters were estimated via a grey-box system
identification procedure in MATLAB.
6.1 ETPB Structural Equation Model
Based on the proposed ETPB theory, the behavioural intervention process is
simulated via dynamic behaviour intervention modelling technique. In this
section, the extrapolation details for dynamic behaviour intervention model
will present which include SEM expression and dynamic model.
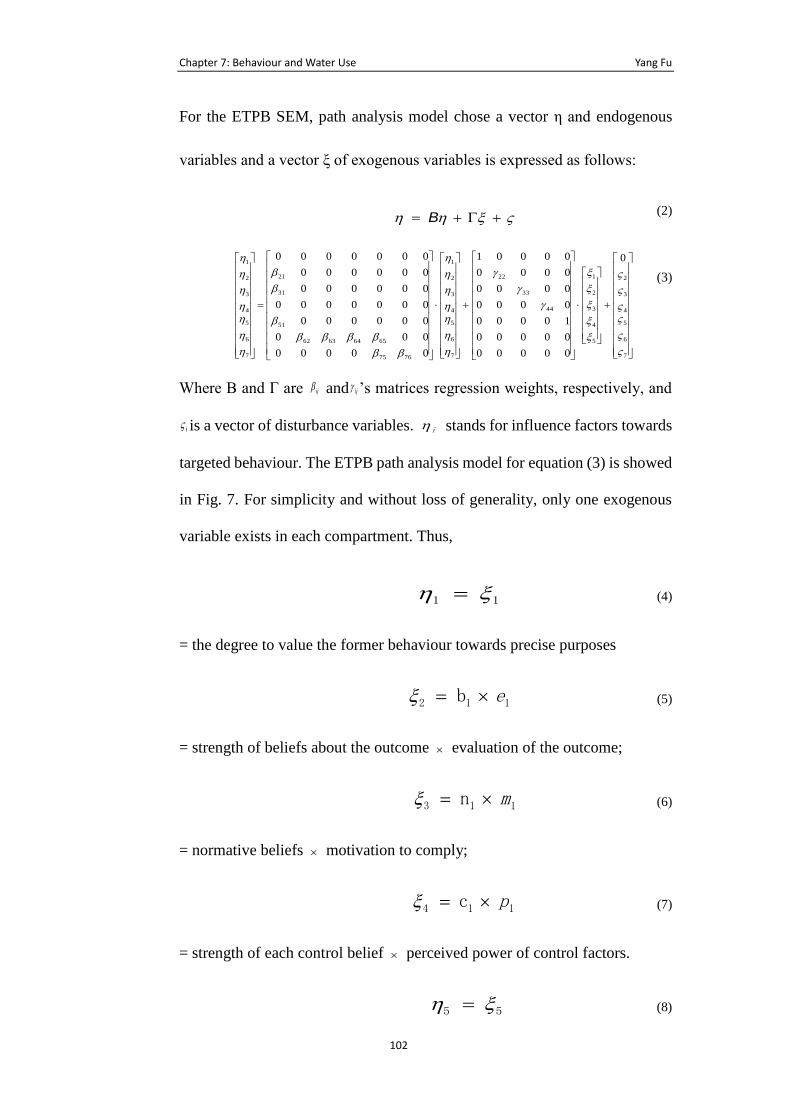
Chapter 7: Behaviour and Water Use Yang Fu
102
For the ETPB SEM, path analysis model chose a vector η and endogenous
variables and a vector ξ of exogenous variables is expressed as follows:
B = + +
(2)
+
+
=
7
6
5
4
3
2
5
4
3
2
1
44
33
22
7
6
5
4
3
2
1
7675
65646362
51
31
21
7
6
5
4
3
2
1 0
00000
00000
10000
0000
0000
0000
00001
00000
000
000000
0000000
000000
000000
0000000
(3)
Where B and Γ are ij and ij ’s matrices regression weights, respectively, and
i is a vector of disturbance variables. i stands for influence factors towards
targeted behaviour. The ETPB path analysis model for equation (3) is showed
in Fig. 7. For simplicity and without loss of generality, only one exogenous
variable exists in each compartment. Thus,
11 = (4)
= the degree to value the former behaviour towards precise purposes
112 b e= (5)
= strength of beliefs about the outcome evaluation of the outcome;
113 n m= (6)
= normative beliefs motivation to comply;
114 c p= (7)
= strength of each control belief perceived power of control factors.
55 = (8)
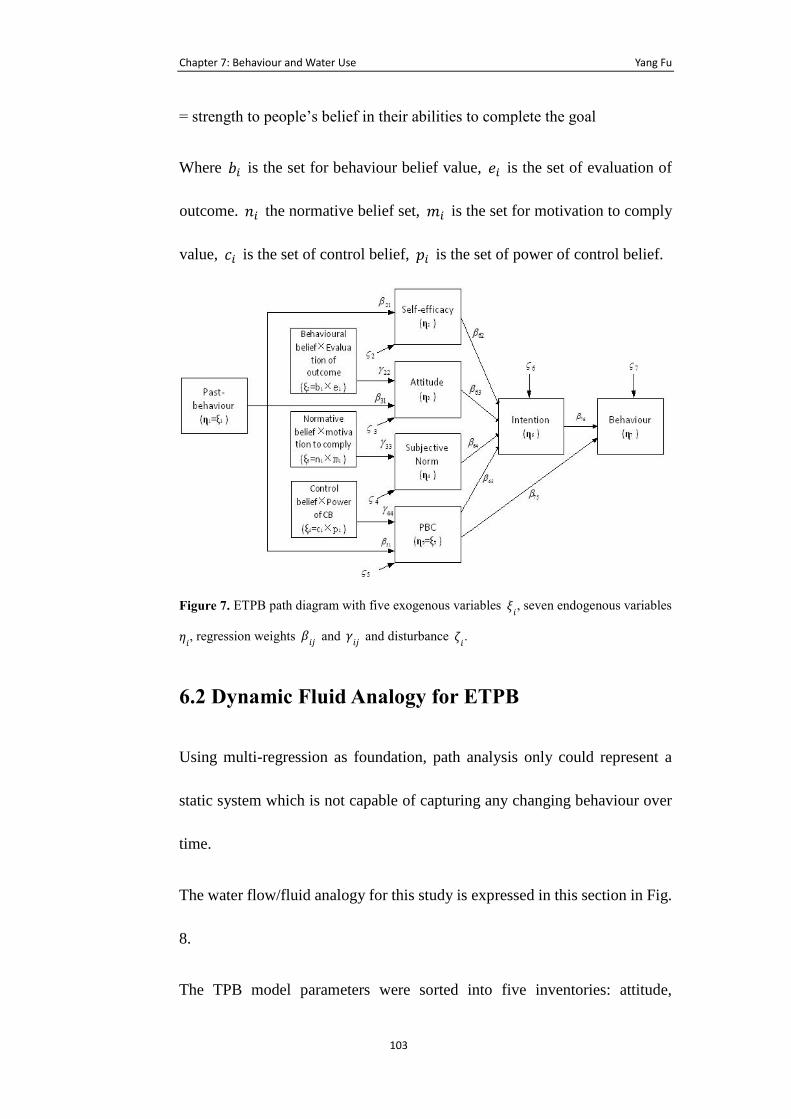
Chapter 7: Behaviour and Water Use Yang Fu
103
= strength to people’s belief in their abilities to complete the goal
Where 𝑏𝑖 is the set for behaviour belief value, 𝑒𝑖 is the set of evaluation of
outcome. 𝑛𝑖 the normative belief set, 𝑚𝑖 is the set for motivation to comply
value, 𝑐𝑖 is the set of control belief, 𝑝𝑖 is the set of power of control belief.
Figure 7. ETPB path diagram with five exogenous variables 𝜉𝑖, seven endogenous variables
𝜂𝑖, regression weights 𝛽
𝑖𝑗 and 𝛾
𝑖𝑗 and disturbance 𝜁
𝑖.
6.2 Dynamic Fluid Analogy for ETPB
Using multi-regression as foundation, path analysis only could represent a
static system which is not capable of capturing any changing behaviour over
time.
The water flow/fluid analogy for this study is expressed in this section in Fig.
8.
The TPB model parameters were sorted into five inventories: attitude,
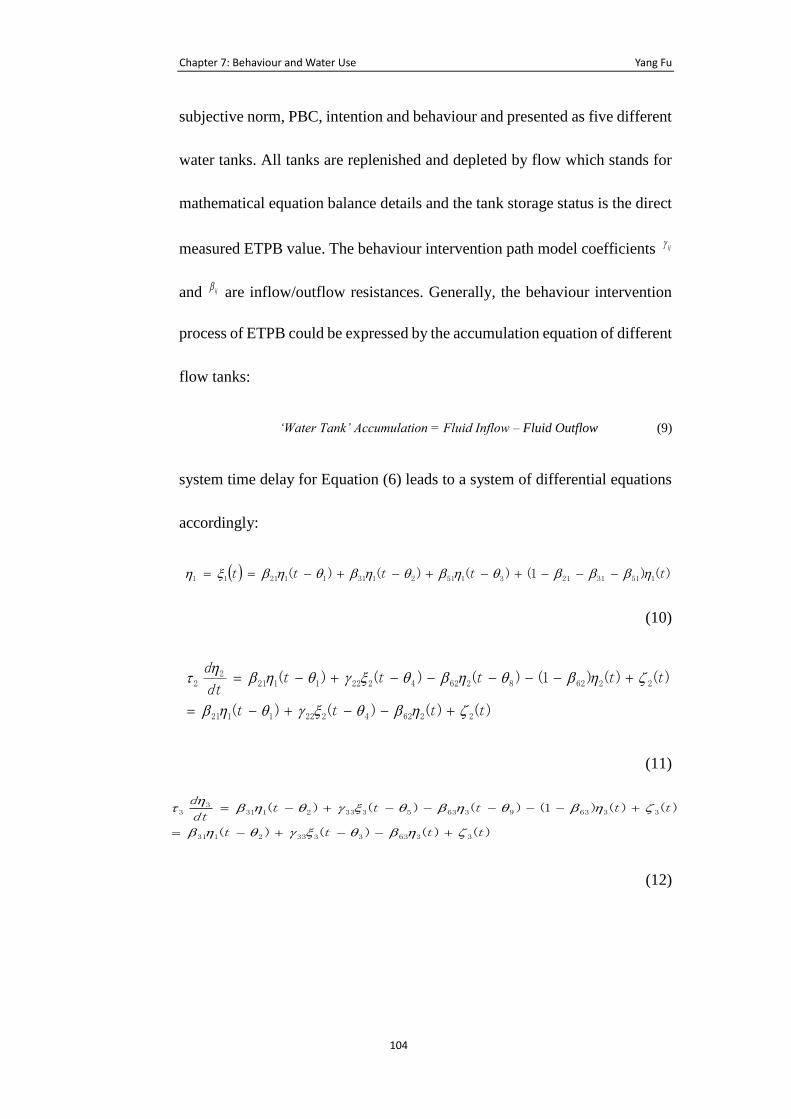
Chapter 7: Behaviour and Water Use Yang Fu
104
subjective norm, PBC, intention and behaviour and presented as five different
water tanks. All tanks are replenished and depleted by flow which stands for
mathematical equation balance details and the tank storage status is the direct
measured ETPB value. The behaviour intervention path model coefficients ij
and ij are inflow/outflow resistances. Generally, the behaviour intervention
process of ETPB could be expressed by the accumulation equation of different
flow tanks:
‘Water Tank’ Accumulation = Fluid Inflow – Fluid Outflow (9)
system time delay for Equation (6) leads to a system of differential equations
accordingly:
( ) )()1()()()( 151312131512131112111 ttttt −−−+−+−+−==
(10)
)()()()(
)()()1()()()(
226242221121
22628262422211212
2
tttt
tttttdt
d
+−−+−=
+−−−−−+−=
(11)
)()()()(
)()()1()()()(
336333332131
33639363533321313
3
tttt
tttttdt
d
+−−+−=
+−−−−−+−=
(12)
Chapter 7: Behaviour and Water Use Yang Fu
105
)()()(
)()()1()()(
44646444
44641046464444
4
ttt
ttttdt
d
+−−=
+−−−−−=
(13)
)()()()(
)()()1()()()()(
5575553151
5575651347511565755531515
5
tttt
ttttttdt
d
+−−+−=
+−−−−−−−−+−=
(14)
)()()()()()(
)()()1()()()()()(
66115651046493638262
6676126761156510464936382626
6
tttttt
tttttttdt
d
+−−+−+−+−=
+−−−−−+−+−+−=
(15)
)()()()( 4713575126767
7 ttttdt
d
+−−+−=
(16)
Chapter 7: Behaviour and Water Use Yang Fu
106
Self-efficacy(ɳ2 )
Attitude(ɳ3 ) Subjective
Norm(ɳ4 )
Intention(ɳ6 )
Behaviour(ɳ7 )
100%
0
100%
0
100%
0
100%
0
100%
0
Past-behaviour(ɳ1)
100%
0
PBC(ɳ5 )
262 )1( −
363)1( −
464 )1( −
57565 )1( −−
)( 1121 −t
1513121 )1( −−−
)( 2131 −t
)( 3151 −t
)( 4222 −t
)( 5333 −t)( 6444 −t )( 7555 −t
)(2 t
)(6 t
)(3 t
)(4 t
)(5 t
)(7 t
)(2 t
)(3 t)(4 t )(5 t
)(1 t
)( 10464 −t
)( 13575 −t)( 12676 −t
)( 8262 −t
)( 9363 −t
)( 11565 −t
676 )1( −
Figure 8. Flow Analogy of Behaviour Intervention Process
Where, ( ) ( )tt 11 = , ( ) ( ) ( )tett 112 b = , ( ) ( ) ( )tmtt 113 n = , ( ) ( ) ( )tptt 114 c = ,
( ) ( )tt 55 = ,i is time delay and
i is constants to capture the capacity of
each tack. The other factors are defined as above. A number of important
considerations of Equations (10) - (16) are as below:
• When d𝜂𝑖
dt= 0, the behavioural intervention became steady. Equations
(10) – (16) reduce to the SEM model without approximation.
• Coefficients 𝛾𝑖𝑗 and 𝛽𝑖𝑗 correspond directly to gains in the system.
Chapter 7: Behaviour and Water Use Yang Fu
107
• In the system, the outflow resistances from PBC are subject to 𝛽65 +
𝛽75 ≤ 1.
• The initial level of all inventories are determined by Equations (10) –
(16) at steady state.
• The past behaviour is formed from a long-time water use habit. In this
study, the past behaviour gives constant input to the dynamic system
and is assumed no changes during the intervention procedure.
• The water end use conservation behaviour change marking strategies
normally have no negative influence on consumers and the water
conservation behaviour intervention process cannot cause any apparent
uncomfortable and inconvenient influences. In this study, we assumed
that there is no reverse response in tanks and the fluid flowing process.
Behavioural response habituation as a result of repeated simulation is a well-
known phenomenon that could be observed in many behavioural situations.
Considered one of the simplest forms of learning, habituation is complex and
covers many processes including spontaneous recovery of the response when
the stimulus is withheld, more rapid habituation following prior series of
habituation and recovery, effects of frequency. Most basic habituation
processes have been simulated from machine learning perspective in literature
(Marsland, 2009). Marsland (2009) proposed many modelling methods for
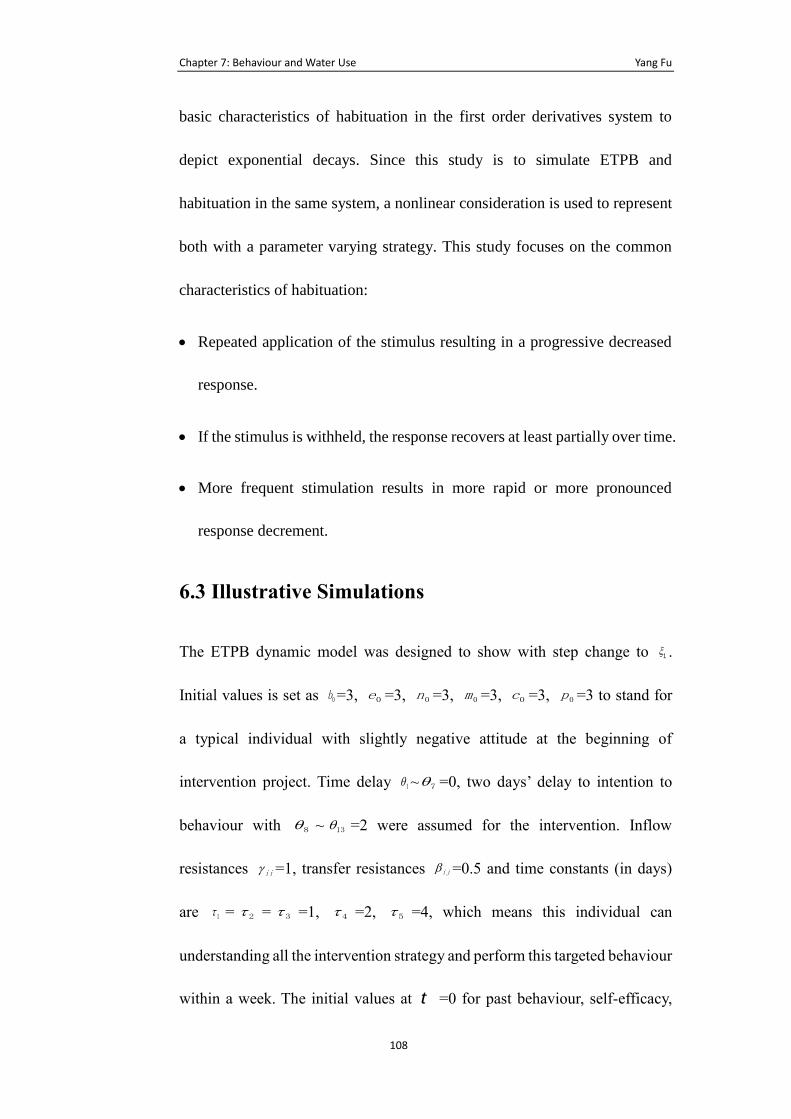
Chapter 7: Behaviour and Water Use Yang Fu
108
basic characteristics of habituation in the first order derivatives system to
depict exponential decays. Since this study is to simulate ETPB and
habituation in the same system, a nonlinear consideration is used to represent
both with a parameter varying strategy. This study focuses on the common
characteristics of habituation:
• Repeated application of the stimulus resulting in a progressive decreased
response.
• If the stimulus is withheld, the response recovers at least partially over time.
• More frequent stimulation results in more rapid or more pronounced
response decrement.
6.3 Illustrative Simulations
The ETPB dynamic model was designed to show with step change to 1 .
Initial values is set as 0b =3, 0e =3, 0n =3, 0m =3, 0c =3, 0p =3 to stand for
a typical individual with slightly negative attitude at the beginning of
intervention project. Time delay 1 7 =0, two days’ delay to intention to
behaviour with 8 13 =2 were assumed for the intervention. Inflow
resistances ii =1, transfer resistances ij =0.5 and time constants (in days)
are 1 = 2 = 3 =1, 4 =2, 5 =4, which means this individual can
understanding all the intervention strategy and perform this targeted behaviour
within a week. The initial values at t =0 for past behaviour, self-efficacy,
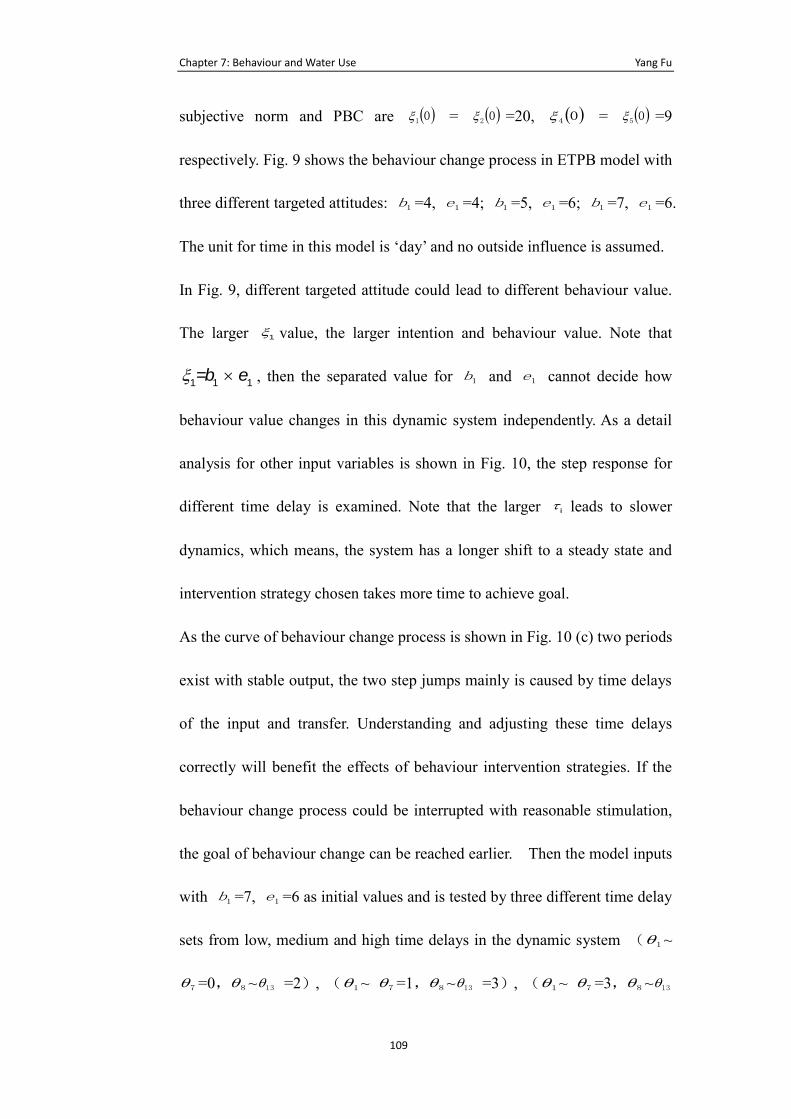
Chapter 7: Behaviour and Water Use Yang Fu
109
subjective norm and PBC are ( )01 = ( )02 =20, ( )04 = ( )05 =9
respectively. Fig. 9 shows the behaviour change process in ETPB model with
three different targeted attitudes: 1b =4, 1e =4; 1b =5, 1e =6; 1b =7, 1e =6.
The unit for time in this model is ‘day’ and no outside influence is assumed.
In Fig. 9, different targeted attitude could lead to different behaviour value.
The larger 1 value, the larger intention and behaviour value. Note that
1 1 1=b e , then the separated value for 1b and 1e cannot decide how
behaviour value changes in this dynamic system independently. As a detail
analysis for other input variables is shown in Fig. 10, the step response for
different time delay is examined. Note that the larger i leads to slower
dynamics, which means, the system has a longer shift to a steady state and
intervention strategy chosen takes more time to achieve goal.
As the curve of behaviour change process is shown in Fig. 10 (c) two periods
exist with stable output, the two step jumps mainly is caused by time delays
of the input and transfer. Understanding and adjusting these time delays
correctly will benefit the effects of behaviour intervention strategies. If the
behaviour change process could be interrupted with reasonable stimulation,
the goal of behaviour change can be reached earlier. Then the model inputs
with 1b =7, 1e =6 as initial values and is tested by three different time delay
sets from low, medium and high time delays in the dynamic system ( 1
7 =0, 8 13 =2), ( 1 7 =1, 8 13 =3), ( 1 7 =3, 8 13
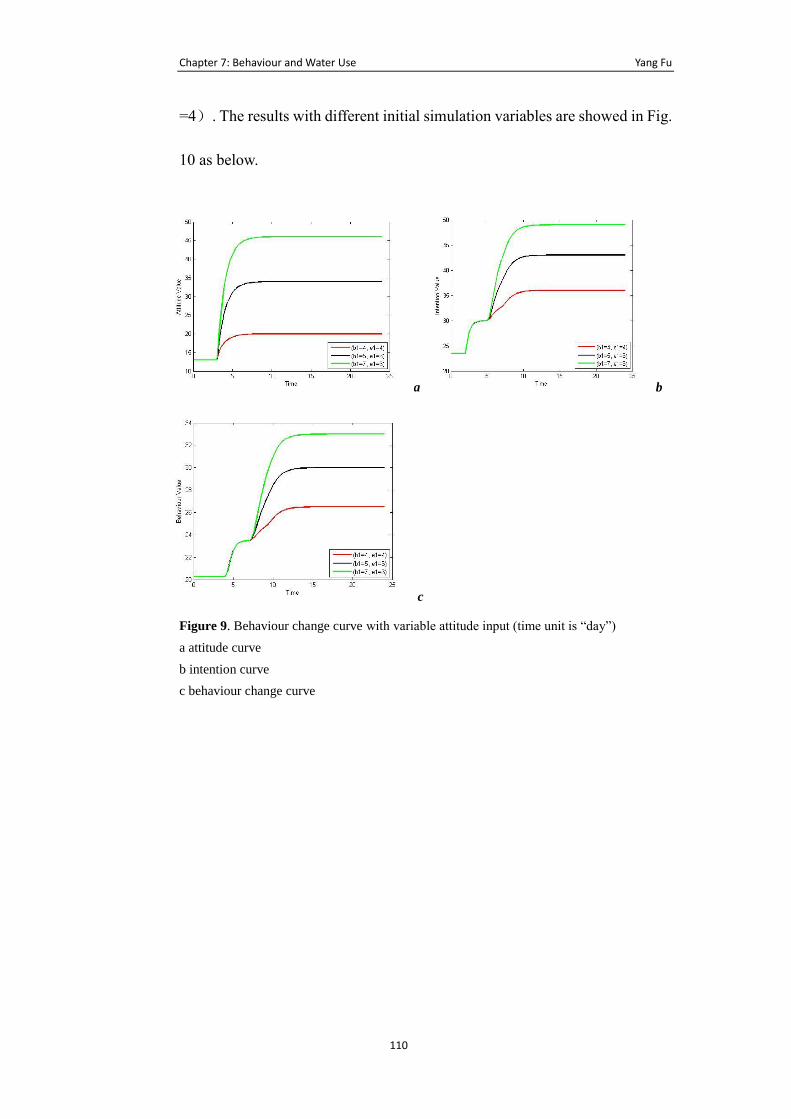
Chapter 7: Behaviour and Water Use Yang Fu
110
=4). The results with different initial simulation variables are showed in Fig.
10 as below.
a b
c
Figure 9. Behaviour change curve with variable attitude input (time unit is “day”)
a attitude curve
b intention curve
c behaviour change curve
Chapter 7: Behaviour and Water Use Yang Fu
111
a b
c
Figure 10. Behaviour change curve with variable time delay (time unit is “day”)
a 1 ~ 7 =0, 8 ~ 13 =2
b 1 ~ 7 =1, 8 ~ 13 =3
c 1 ~ 7 =3, 8 ~ 13 =4
6.4 ETPB Dynamic Model Estimation and Validation
In this section, grey-box modelling strategies used for ETPB model are
outlined, and results from fitting Auto Regressive with exogenous input (ARX)
parametric models are presented (Ljung, 1999).
Monthly directly measured ETPB data from ten households in the sampled
community is used to obtain model parameters from the proposed structure
using semi-physical identification techniques (Ljung, 1995). Fig. 11 illustrates
the averaged direct-measured ETPB data from ten household. Every three
months, the ten households were invited to fulfil complete ETPB indirect
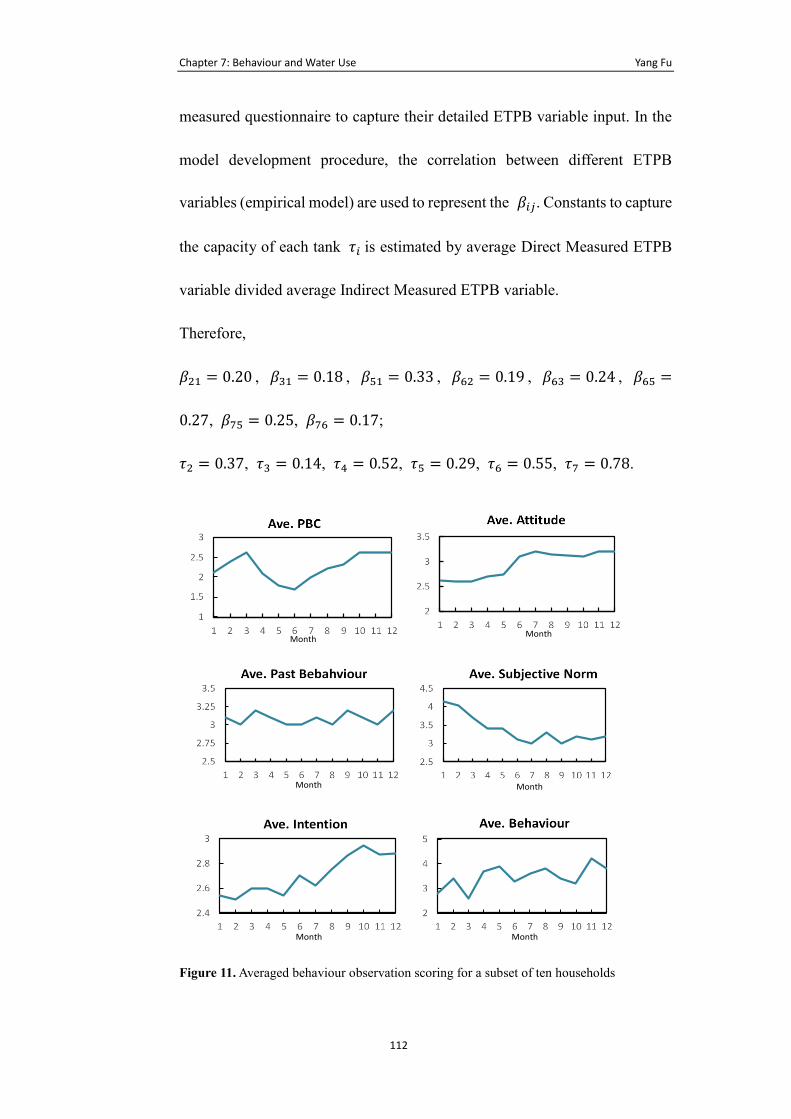
Chapter 7: Behaviour and Water Use Yang Fu
112
measured questionnaire to capture their detailed ETPB variable input. In the
model development procedure, the correlation between different ETPB
variables (empirical model) are used to represent the 𝛽𝑖𝑗. Constants to capture
the capacity of each tank 𝜏𝑖 is estimated by average Direct Measured ETPB
variable divided average Indirect Measured ETPB variable.
Therefore,
𝛽21 = 0.20 , 𝛽31 = 0.18 , 𝛽51 = 0.33 , 𝛽62 = 0.19 , 𝛽63 = 0.24 , 𝛽65 =
0.27, 𝛽75 = 0.25, 𝛽76 = 0.17;
𝜏2 = 0.37, 𝜏3 = 0.14, 𝜏4 = 0.52, 𝜏5 = 0.29, 𝜏6 = 0.55, 𝜏7 = 0.78.
Figure 11. Averaged behaviour observation scoring for a subset of ten households
Month Month
Month Month
Month Month
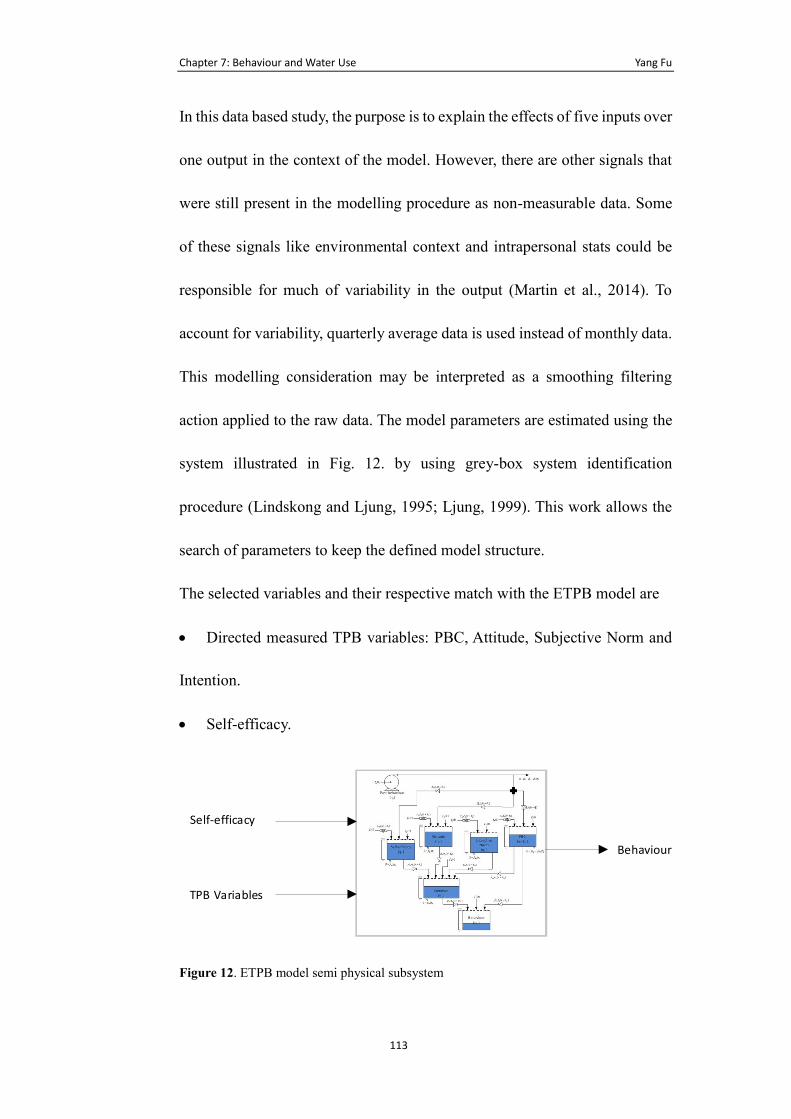
Chapter 7: Behaviour and Water Use Yang Fu
113
In this data based study, the purpose is to explain the effects of five inputs over
one output in the context of the model. However, there are other signals that
were still present in the modelling procedure as non-measurable data. Some
of these signals like environmental context and intrapersonal stats could be
responsible for much of variability in the output (Martin et al., 2014). To
account for variability, quarterly average data is used instead of monthly data.
This modelling consideration may be interpreted as a smoothing filtering
action applied to the raw data. The model parameters are estimated using the
system illustrated in Fig. 12. by using grey-box system identification
procedure (Lindskong and Ljung, 1995; Ljung, 1999). This work allows the
search of parameters to keep the defined model structure.
The selected variables and their respective match with the ETPB model are
• Directed measured TPB variables: PBC, Attitude, Subjective Norm and
Intention.
• Self-efficacy.
Behaviour
Self-efficacy
TPB Variables
Figure 12. ETPB model semi physical subsystem
Chapter 7: Behaviour and Water Use Yang Fu
114
Grey-box parameter estimation relies on two sources of information to
estimate the required parameters: prior knowledge of the system (i.e, the
ETPB dynamic model) and experimental data (long-term water conservation
behaviour observation). The state space representation of the grey-box system
has the structure:
�̇�𝑝(𝑡) = 𝐴(𝜃𝑝)𝑥𝑝(𝑡) + 𝐵(𝜃𝑃)𝑢𝑃(𝑡) + 𝐾𝑒(𝑡) (17)
𝑦𝑝(𝑡) = 𝐶𝑥𝑃(𝑡) + 𝜈(𝑡) (18)
Where:
𝑥𝑝 = [𝜂1 … 𝜂7] donates a vector of n=7 state variables,
𝑢𝑝 = [𝜂2 𝜂3 𝜂4 𝜂5 𝜂6] donates a vector of m=5 input variables,
𝑦𝑝 = [𝜂7] donates a vector of p=1 output variable,
𝐴 ∈ 𝑅𝑛×𝑛, 𝐵 ∈ 𝑅𝑛×𝑚, 𝐶 ∈ 𝑅𝑝×𝑛 are the state matrices,
𝜃𝑝 ∈ 𝑅𝑛𝑝 donates a vector of 𝑛𝑝 = 4 unknown model parameters,
𝑒(𝑡) and 𝑣(𝑡) are uncertainties associated to each one of the states and
output,
According to the structure of ETPB, the unknown model parameters are
𝜃𝑝 = [𝛾22 𝛾33 𝛾44 𝛾55]𝑇 (19)
The prediction-error identification methods (PEM) (Ljung, 1999; Martin et al.,
2014) are used to estimate 𝜃 . The one-step ahead prediction error of the
system is
𝜀(𝑡, 𝜃𝑝) = 𝑦𝑝(𝑡) − �̂�𝑝(𝑡|𝑡 − 1, 𝜃𝑝) (20)
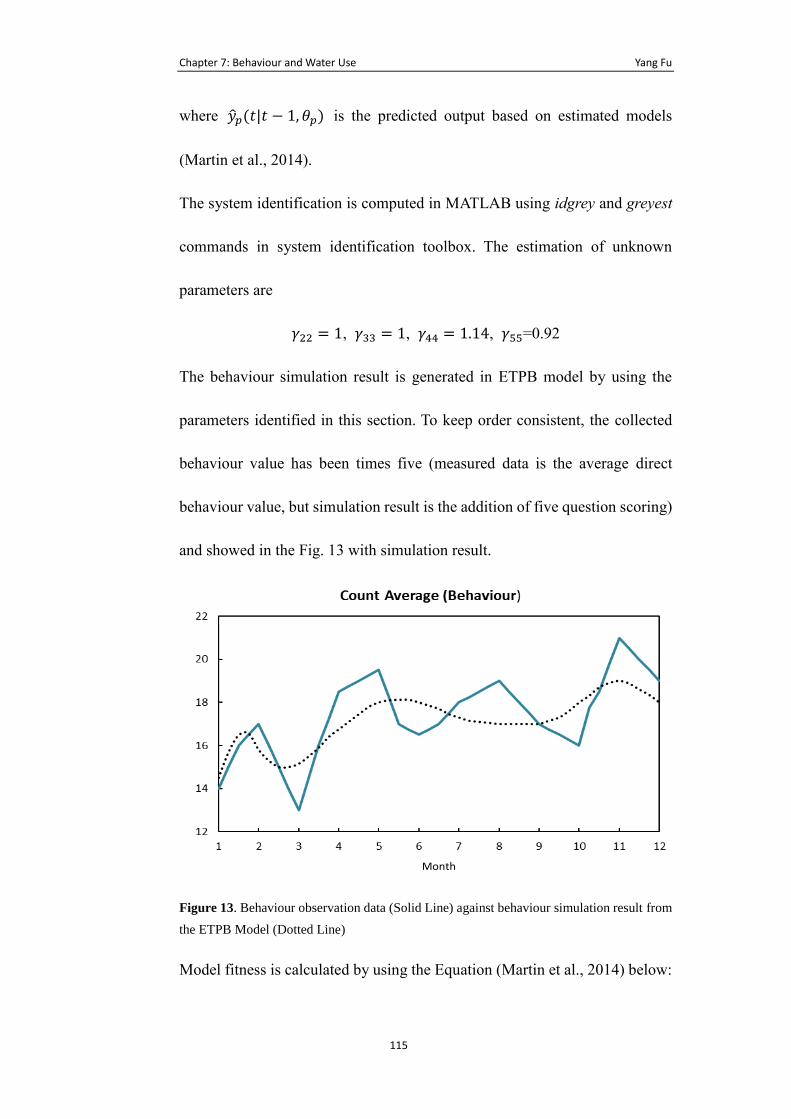
Chapter 7: Behaviour and Water Use Yang Fu
115
where �̂�𝑝(𝑡|𝑡 − 1, 𝜃𝑝) is the predicted output based on estimated models
(Martin et al., 2014).
The system identification is computed in MATLAB using idgrey and greyest
commands in system identification toolbox. The estimation of unknown
parameters are
𝛾22 = 1, 𝛾33 = 1, 𝛾44 = 1.14, 𝛾55=0.92
The behaviour simulation result is generated in ETPB model by using the
parameters identified in this section. To keep order consistent, the collected
behaviour value has been times five (measured data is the average direct
behaviour value, but simulation result is the addition of five question scoring)
and showed in the Fig. 13 with simulation result.
Figure 13. Behaviour observation data (Solid Line) against behaviour simulation result from
the ETPB Model (Dotted Line)
Model fitness is calculated by using the Equation (Martin et al., 2014) below:
Month
Chapter 7: Behaviour and Water Use Yang Fu
116
𝑓𝑖𝑡 % = 100% ∗ (1 − ‖𝑦𝑝−�̂�𝑝‖
‖𝑦𝑝−𝑀𝑒𝑎𝑛(𝑦𝑝)‖) (21)
where ‖… ‖ is two-norm (i.e. for a vector α is equal to ‖𝛼‖ = √𝛼𝑇𝛼. The
fitness for the ETPB model is
𝐵𝑒ℎ𝑎𝑣𝑖𝑜𝑢𝑟(𝜂7) = 46.94%
6.5 Summary
Compared to the researches who used the similar modelling methods in
literature (Martin et al., 2014), the fitness of ETPB model showed about
around 47% understanding of the behaviour intervention process and the
simulation result could generally match the trend of change from observation.
However, there are still some mismatches between the data and model
simulation result due to the unmeasured dynamics, disturbances and unknown
external signals. And from the theoretical perspective, even the ETPB has
improved the prediction and explanation ability of water conservation
behaviour, still, the theory cannot reveal all the behaviour intervention
processes which might need further research supports in this aspect. Inevitably,
the questionnaire data collection method could bring the disturbance of
matches in this model evaluation study. But it is observable that the simulation
result showed the same shape of response could be predicted from ETPB
model.
Chapter 7: Behaviour and Water Use Yang Fu
117
7 Behaviour and Water Use
7.1 Overview
To qualify and link the behaviour intervention process to the actual water
consumption amount, it is necessary to build a theoretical water use model
concerned behaviour change factor. In Chapter 3, many indirect and direct
drivers for water consumption have reviewed. Different from Jorgensen’s
integrated water conservation model, all the psychological variables such as
attitude, intention and subjective norm are processed in the ETPB model to
support the understanding of behaviour intervention process. All the
psychological factors are represented as behaviour value according to the
ETPB theory.
Due to the uncertainty for introducing a behavioural change model into the
water consumption prediction procedure, the final water consumption model
will be a black box model. To identify the relationship between behaviour
change and water consumption, in this study, the Artificial Neural Networks
(ANN) is applied to support the modelling process. In the first part of this
chapter, an ETPB-ANN model is presented to understand the behavioural
change intervention and its relationship to water use. This model will consider
how important system variables respond to changes in input variables
overtime. The second part of this chapter is about the ANN model architecture
Chapter 7: Behaviour and Water Use Yang Fu
118
and the third part is the simulation result. The modelling of this chapter is
conducted via Matlab software.
7.2 ETPB-ANN Model Architecture
Researches already pointed out that integrated model can be applied to give
answers to dynamic systems about what variables to measured, its measure
frequency, speed for intervention and the functional form of the outcome
responses (Navarro-Barrientos et al., 2011; Jorgensen et al., 2009). This
dynamic ETPB-ANN model contains the behavioural intervention simulation
model and the water use ANN model. It considered the importance of system
variables respond to interactions between input parameters overtime. In the
behavioural intervention model, intervention acts towards end use were
measured and inputted to TPB mathematic expression (SEM). At the same
time, with the objective parameters and water use data, ANNs based water use
model can output the results of the water consumption.
In the model, we believe the behaviour change model should exist
dependently as a part for better understanding the behaviour intervention. The
significant meaning for the dependent dynamic behaviour model is to
calculate the behaviour intervention process in an isolated model and this
could fix the disadvantages of traditional water use models especially for
guiding proper behaviours for saving water.
Chapter 7: Behaviour and Water Use Yang Fu
119
This dynamic ETPB-ANN model contains the behavioural intervention
simulation model and the end use ANN model. It considered the importance
of system variables respond to interactions between input parameters overtime.
In the behavioural intervention model, intervention acts toward end use were
measured and inputted to TPB mathematic expression (SEM). At the same
time, with the objective parameters and water use data, ANNs based end use
model can output the results of the water consumption. Fig. 14 shows the
general conceptual diagram for the intelligent integrated philosophy of
household water use model.
Influence factors of water consumption in this model will be separated into
two kinds by reviewing the former researches about water use behavioural
change in Chapter 3. The criterion of selection for those two kinds of
parameters is based on TPB and the social and economic model reviewed
above. This paper suggests using ETPB model as an independent model and
integrated with ANNs end use model for simulation. Behavioural change
model exists as a separated part in ETPB-ANN model for better understanding
the behavioural interventions. This ETPB-ANN model could not only have a
better understanding of behavioural intervention, but also can be used to fix
the weak points of former end use modelling, especially for guiding proper
behaviours for saving water.
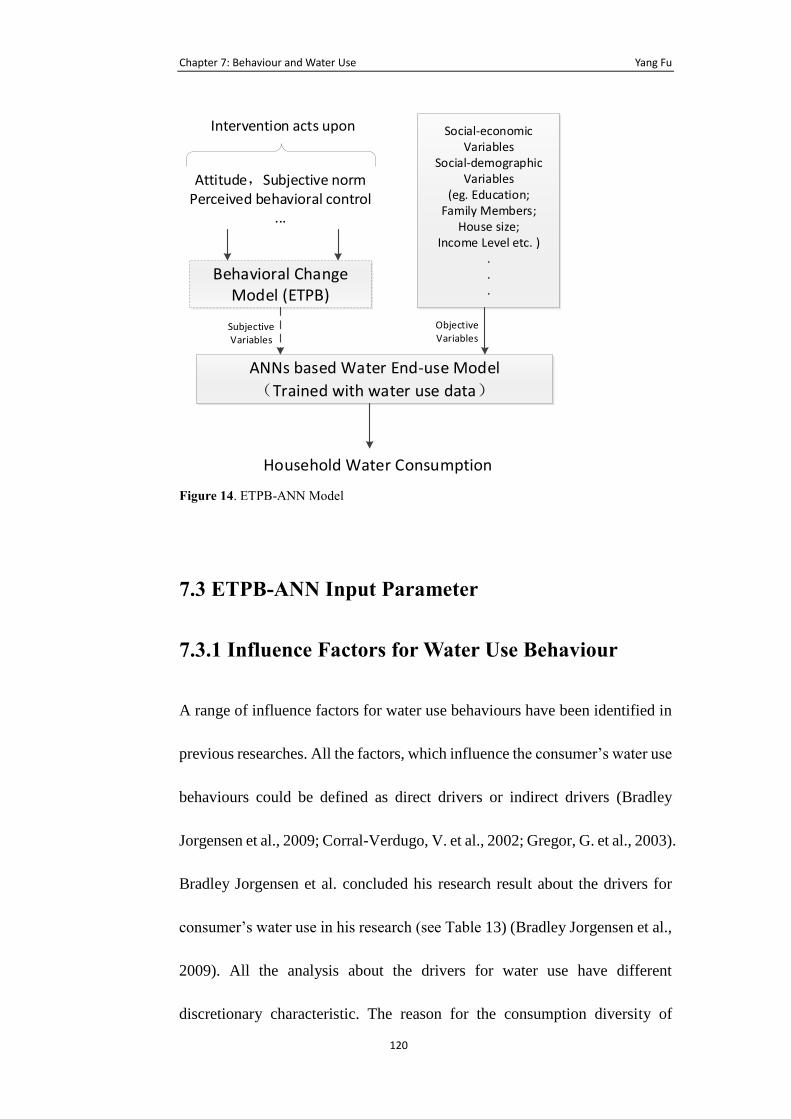
Chapter 7: Behaviour and Water Use Yang Fu
120
Behavioral Change Model (ETPB)
Attitude,Subjective normPerceived behavioral control
...
Social-economic Variables
Social-demographic Variables
(eg. Education; Family Members;
House size; Income Level etc. )
.
.
.
ANNs based Water End-use Model
(Trained with water use data)
Intervention acts upon
Subjective Variables
Objective Variables
Household Water Consumption
Figure 14. ETPB-ANN Model
7.3 ETPB-ANN Input Parameter
7.3.1 Influence Factors for Water Use Behaviour
A range of influence factors for water use behaviours have been identified in
previous researches. All the factors, which influence the consumer’s water use
behaviours could be defined as direct drivers or indirect drivers (Bradley
Jorgensen et al., 2009; Corral-Verdugo, V. et al., 2002; Gregor, G. et al., 2003).
Bradley Jorgensen et al. concluded his research result about the drivers for
consumer’s water use in his research (see Table 13) (Bradley Jorgensen et al.,
2009). All the analysis about the drivers for water use have different
discretionary characteristic. The reason for the consumption diversity of
Chapter 7: Behaviour and Water Use Yang Fu
121
outdoor use is due to the habit of people using their outdoor facilities and the
condition (size and kinds) of them. Indoor water use situation could be more
stable compared with outdoor use. The influence factors for indoor water use
include house condition, regulatory environment and personal characteristics.
Moreover, the behaviours are more likely to be influenced by consumers’
mind. Using Stern (2000) as a guide, the determinants of psychological
behaviour can be categorized into five underlying causes: attitudinal factors,
beliefs, habits or routines, personal capabilities, and contextual forces.
Specifically, behavioural belief, normative belief and control belief are the
main factors, which could alter what consumers are thinking about their water
use behaviours. Those factors are rely more on the education standard and the
responsibility consumers could feel about their water use condition etc. And
those factors are directly or indirectly influenced by water management
strategies and policy from Water unities and authorities.
The drivers of water use and saving are used to choose our input for modelling
especially for TPB model. However, this is still not sufficient to meet all
simulation requirements. Cara Beal et al. (2011) concluded with a discussion
of the typical characteristics including the social perspectives of water
consumption, socio-demographic trends, gender and education; household
water appliances. All the factors could affect the household water use from
residents in Australia. The analysis conclusion showed which factors could
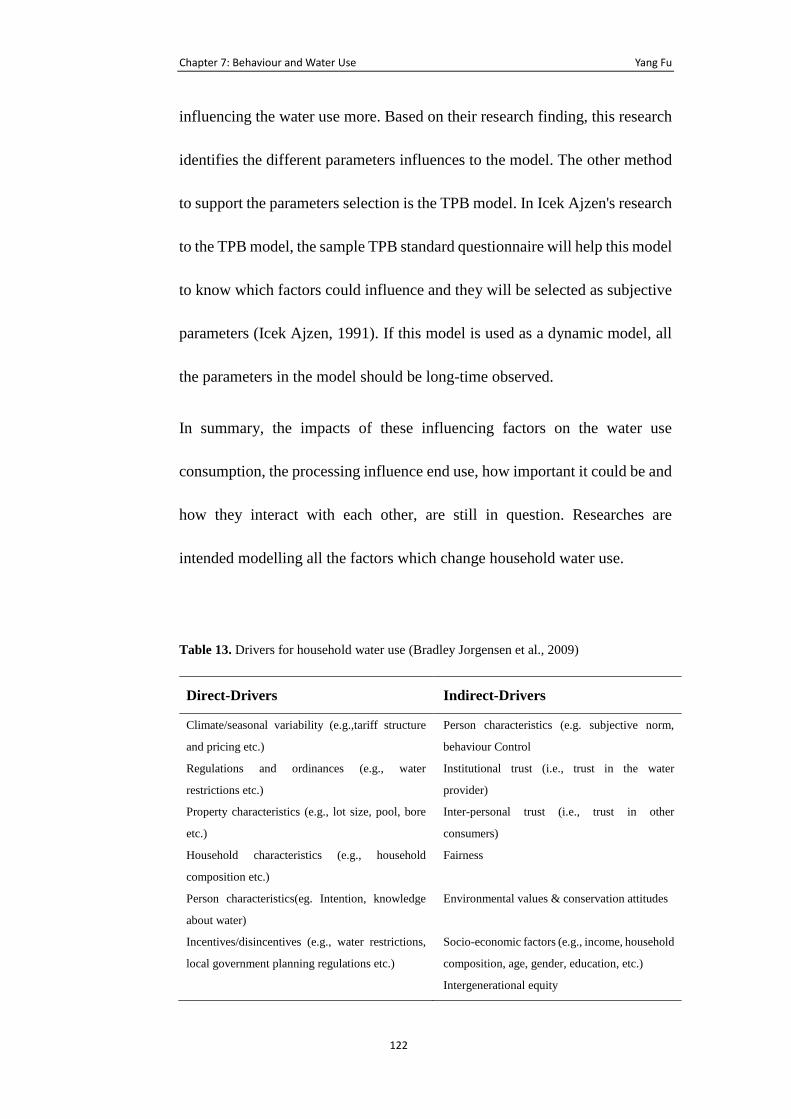
Chapter 7: Behaviour and Water Use Yang Fu
122
influencing the water use more. Based on their research finding, this research
identifies the different parameters influences to the model. The other method
to support the parameters selection is the TPB model. In Icek Ajzen's research
to the TPB model, the sample TPB standard questionnaire will help this model
to know which factors could influence and they will be selected as subjective
parameters (Icek Ajzen, 1991). If this model is used as a dynamic model, all
the parameters in the model should be long-time observed.
In summary, the impacts of these influencing factors on the water use
consumption, the processing influence end use, how important it could be and
how they interact with each other, are still in question. Researches are
intended modelling all the factors which change household water use.
Table 13. Drivers for household water use (Bradley Jorgensen et al., 2009)
Direct-Drivers Indirect-Drivers
Climate/seasonal variability (e.g.,tariff structure
and pricing etc.)
Person characteristics (e.g. subjective norm,
behaviour Control
Regulations and ordinances (e.g., water
restrictions etc.)
Institutional trust (i.e., trust in the water
provider)
Property characteristics (e.g., lot size, pool, bore
etc.)
Inter-personal trust (i.e., trust in other
consumers)
Household characteristics (e.g., household
composition etc.)
Fairness
Person characteristics(eg. Intention, knowledge
about water)
Environmental values & conservation attitudes
Incentives/disincentives (e.g., water restrictions,
local government planning regulations etc.)
Socio-economic factors (e.g., income, household
composition, age, gender, education, etc.)
Intergenerational equity
Chapter 7: Behaviour and Water Use Yang Fu
123
7.3.2 Subjective and Objective Parameters
There are a lot studies have identified a range of direct and indirect drivers of
water behaviour (Jorgensen et al., 2009). However, the direct and indirect
driver classification method is based on the parameter influence strength to
the water use amount which cannot offer clear picture for how the
psychologically behavioural change works in the water use prediction process.
To clarify the psychological influence on water use, this study classified the
direct and indirect driver by using the TPB behaviour change theory and
defined the subjective and objective parameters as below:
• The subjective parameters are those parameters that could be influenced
by human mind, such as attitude, attention to the different household
water use behaviour which could only exist in the TPB/ psychological
model.
• The objective parameters are the those that already exist and could not be
changed easily or at all, such as education level, house size and whether
located in rural area or not.
Therefore, the subjective and objective parameter for ETPB-ANN model are
as presented in Table 14.
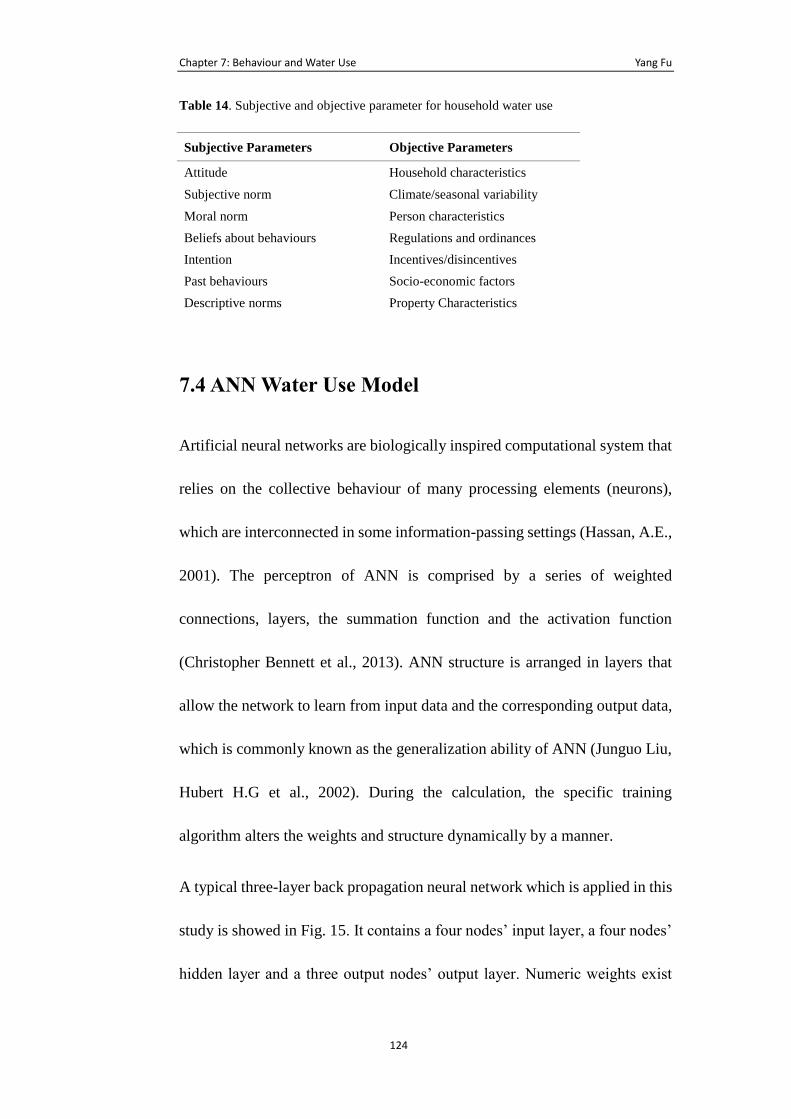
Chapter 7: Behaviour and Water Use Yang Fu
124
Table 14. Subjective and objective parameter for household water use
7.4 ANN Water Use Model
Artificial neural networks are biologically inspired computational system that
relies on the collective behaviour of many processing elements (neurons),
which are interconnected in some information-passing settings (Hassan, A.E.,
2001). The perceptron of ANN is comprised by a series of weighted
connections, layers, the summation function and the activation function
(Christopher Bennett et al., 2013). ANN structure is arranged in layers that
allow the network to learn from input data and the corresponding output data,
which is commonly known as the generalization ability of ANN (Junguo Liu,
Hubert H.G et al., 2002). During the calculation, the specific training
algorithm alters the weights and structure dynamically by a manner.
A typical three-layer back propagation neural network which is applied in this
study is showed in Fig. 15. It contains a four nodes’ input layer, a four nodes’
hidden layer and a three output nodes’ output layer. Numeric weights exist
Subjective Parameters Objective Parameters
Attitude Household characteristics
Subjective norm Climate/seasonal variability
Moral norm Person characteristics
Beliefs about behaviours Regulations and ordinances
Intention Incentives/disincentives
Past behaviours Socio-economic factors
Descriptive norms Property Characteristics
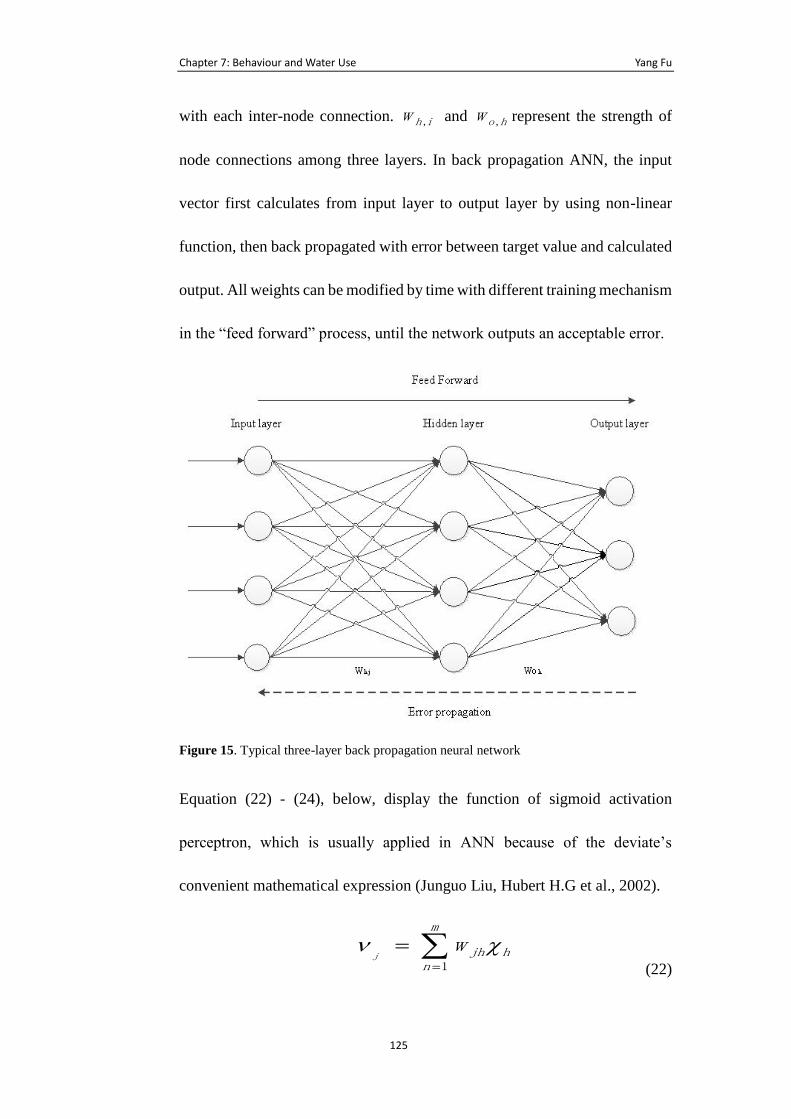
Chapter 7: Behaviour and Water Use Yang Fu
125
with each inter-node connection. ihw , and how , represent the strength of
node connections among three layers. In back propagation ANN, the input
vector first calculates from input layer to output layer by using non-linear
function, then back propagated with error between target value and calculated
output. All weights can be modified by time with different training mechanism
in the “feed forward” process, until the network outputs an acceptable error.
Figure 15. Typical three-layer back propagation neural network
Equation (22) - (24), below, display the function of sigmoid activation
perceptron, which is usually applied in ANN because of the deviate’s
convenient mathematical expression (Junguo Liu, Hubert H.G et al., 2002).
=
=m
nhjhwj
1
(22)
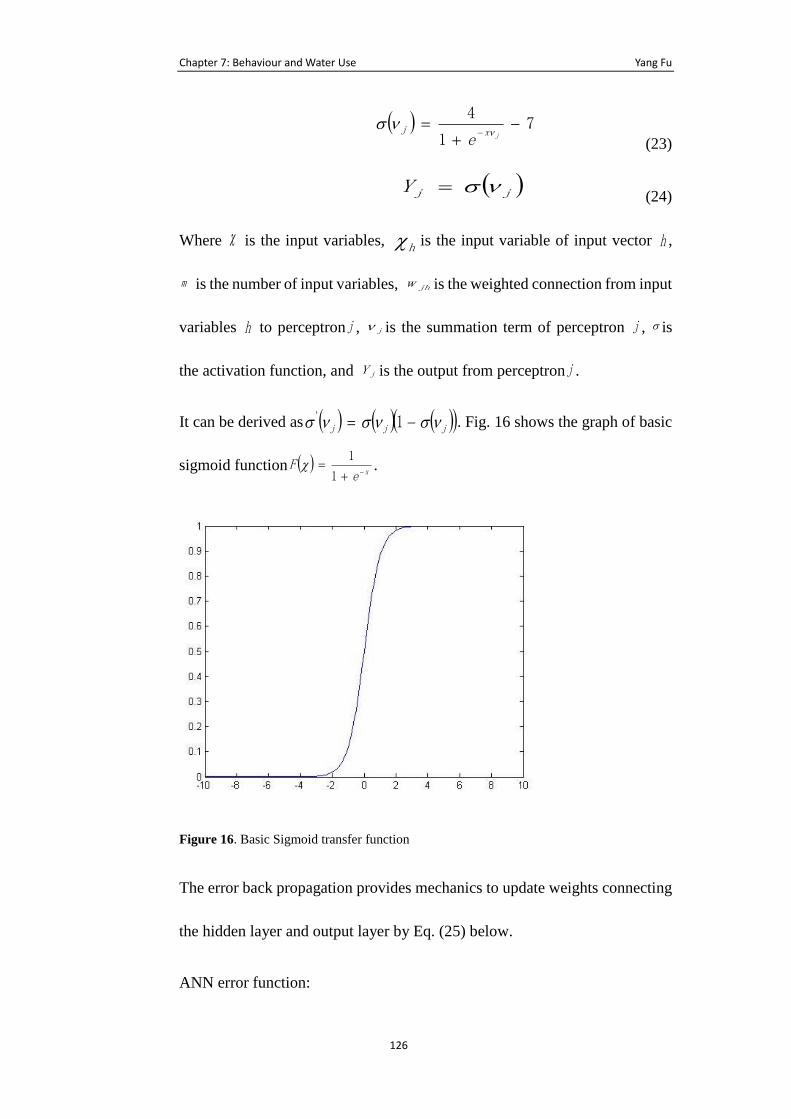
Chapter 7: Behaviour and Water Use Yang Fu
126
( ) 71
4−
+=
− jxje
(23)
( )jjY = (24)
Where is the input variables, h is the input variable of input vector h ,
m is the number of input variables, jhw is the weighted connection from input
variables h to perceptronj , j is the summation term of perceptron j , is
the activation function, and jY is the output from perceptronj .
It can be derived as ( ) ( ) ( )( )jjj −= 1' . Fig. 16 shows the graph of basic
sigmoid function ( )xe
F−+
=1
1 .
Figure 16. Basic Sigmoid transfer function
The error back propagation provides mechanics to update weights connecting
the hidden layer and output layer by Eq. (25) below.
ANN error function:
Chapter 7: Behaviour and Water Use Yang Fu
127
( ) ( )( )= −
−=M
i
N
iii jtjeE
1 1 (25)
( ) ( )1−+
= nw
w
Enw ij
ij
ij
(26)
Where M , N are the number of input and output nodes, ( )nw ij and
( )1−nw ij are weights between node i and j during the adjacent
interaction n and ( )1−n ; and , are momentum factor and learning rate.
The structure of ANN model in this study is a multiple-layer networks. This
multi-layer networks consist of an input layer of value consisting of house size
(HS), number of resident (NOR), month (M), education level (EL), income
level (IL) and ETPB Questionnaire Calculated behaviour value (BV), two
hidden layers of perceptron and an output layer for outputting the Water
Consumption Data (WCD with a unit of Ton/month). Numbers of nodes in
hidden layer is set as two. BV (Questionnaire Calculated Behaviour Value) is
calculated according to findings of regression equation in literature about
water saving behaviour change in Chapter 5. The behaviour calculated from
ETPB questionnaire record is followed by Equation as below.
𝐵𝑉 = (𝑂𝑏𝑠𝑒𝑟𝑣𝑒𝑑 𝐼𝑛𝑡𝑒𝑛𝑡𝑖𝑜𝑛 × 0.17) + (𝑂𝑏𝑠𝑒𝑟𝑣𝑒𝑑 𝑃𝐵𝑆 × 0.25) (27)
The model development was limited to predict internal demand component
especially for those houses which are apartments, and this is one kind of the
most common houses in Chinese main cities with public sharing garden in the
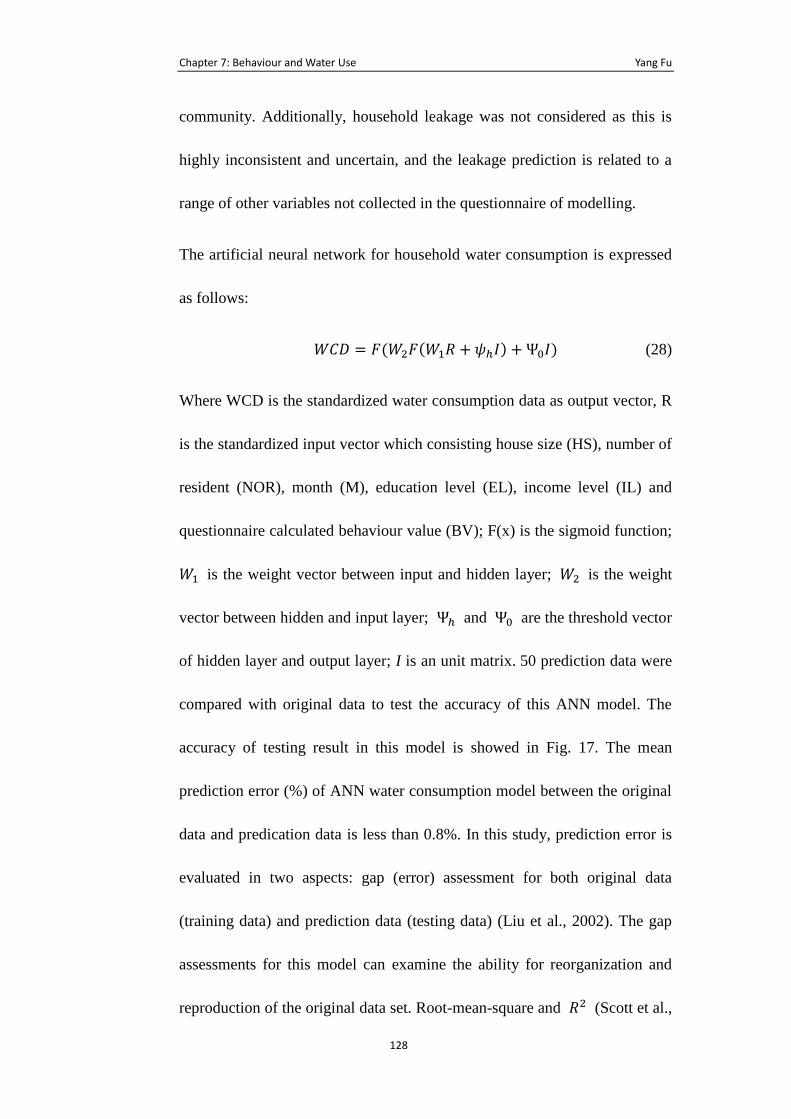
Chapter 7: Behaviour and Water Use Yang Fu
128
community. Additionally, household leakage was not considered as this is
highly inconsistent and uncertain, and the leakage prediction is related to a
range of other variables not collected in the questionnaire of modelling.
The artificial neural network for household water consumption is expressed
as follows:
𝑊𝐶𝐷 = 𝐹(𝑊2𝐹(𝑊1𝑅 + 𝜓ℎ𝐼) + Ψ0𝐼) (28)
Where WCD is the standardized water consumption data as output vector, R
is the standardized input vector which consisting house size (HS), number of
resident (NOR), month (M), education level (EL), income level (IL) and
questionnaire calculated behaviour value (BV); F(x) is the sigmoid function;
𝑊1 is the weight vector between input and hidden layer; 𝑊2 is the weight
vector between hidden and input layer; Ψℎ and Ψ0 are the threshold vector
of hidden layer and output layer; I is an unit matrix. 50 prediction data were
compared with original data to test the accuracy of this ANN model. The
accuracy of testing result in this model is showed in Fig. 17. The mean
prediction error (%) of ANN water consumption model between the original
data and predication data is less than 0.8%. In this study, prediction error is
evaluated in two aspects: gap (error) assessment for both original data
(training data) and prediction data (testing data) (Liu et al., 2002). The gap
assessments for this model can examine the ability for reorganization and
reproduction of the original data set. Root-mean-square and 𝑅2 (Scott et al.,
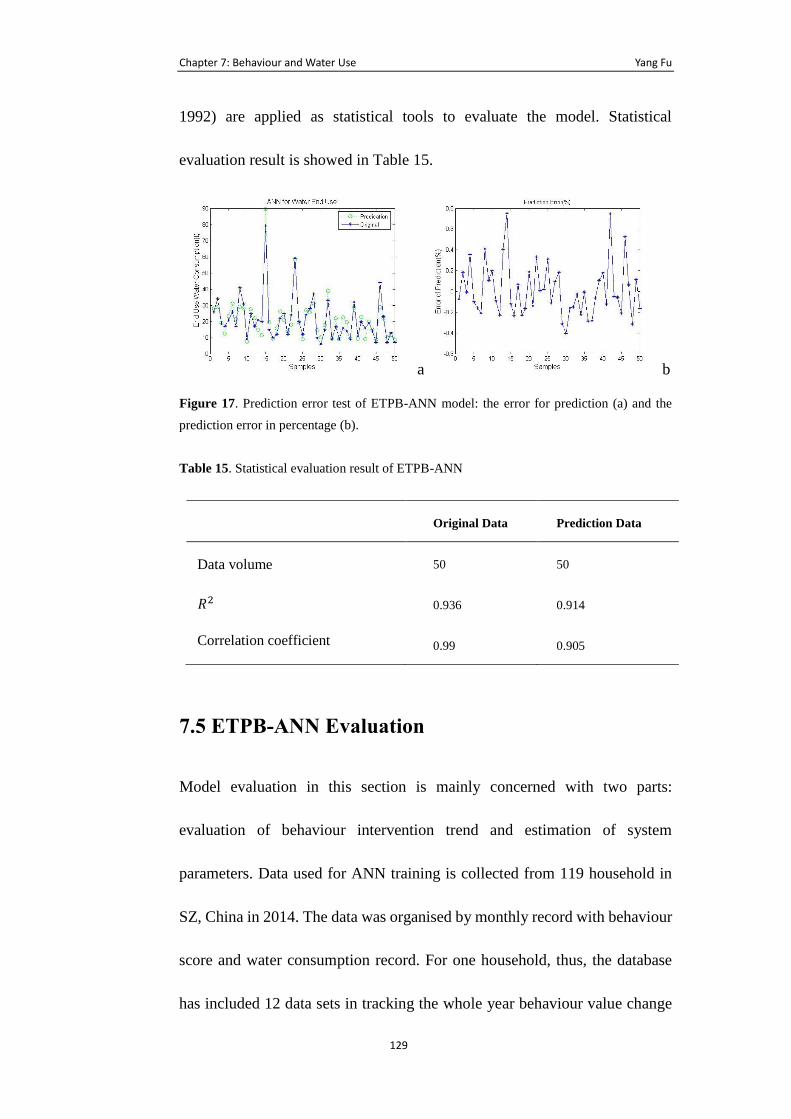
Chapter 7: Behaviour and Water Use Yang Fu
129
1992) are applied as statistical tools to evaluate the model. Statistical
evaluation result is showed in Table 15.
a b
Figure 17. Prediction error test of ETPB-ANN model: the error for prediction (a) and the
prediction error in percentage (b).
Table 15. Statistical evaluation result of ETPB-ANN
Original Data Prediction Data
Data volume 50 50
𝑅2 0.936 0.914
Correlation coefficient 0.99 0.905
7.5 ETPB-ANN Evaluation
Model evaluation in this section is mainly concerned with two parts:
evaluation of behaviour intervention trend and estimation of system
parameters. Data used for ANN training is collected from 119 household in
SZ, China in 2014. The data was organised by monthly record with behaviour
score and water consumption record. For one household, thus, the database
has included 12 data sets in tracking the whole year behaviour value change
Chapter 7: Behaviour and Water Use Yang Fu
130
and consumption change. The database applied for modelling evaluation has
been tested with reality and validity. PB7 and INT 4 which have not passed
the tests, are not been used for any further calculation.
To identify the effectiveness of dynamic ETPB model, this study compared
the results generated from ANN water consumption model with the results
generated from ETPB behaviour change model by giving a setting of
household, such as EL, NOR etc. to both models, the different household
settings might lead to different water consumption trend, namely, different
household water end use behaviour.
In this case study, all inventory values are directly measured by ETPB
questionnaire, inflow resistances of each inventory could be calculated as
𝛾22 = 1, 𝛾33 = 1, 𝛾44 = 1.14, 𝛾55 = 0.92. Thus, inventory output transfer
resistances could be interpreted by inventory coefficients. Mechanism for
setting transfer resistances variables is referred to TPB parameter coefficients
and regression equation analysis outcomes in Chapter 5 and Chapter 6 which
offers a mega analysis of behaviour change parameters’ correlation and
regression, thus, transfer resistances are set as 𝛽21 = 0.20 , 𝛽31 = 0.18 ,
𝛽51 = 0.33 , 𝛽62 = 0.19 , 𝛽63 = 0.24 , 𝛽65 = 0.27 , 𝛽75 = 0.25 , 𝛽76 =
0.17. In order to present a typical reporter, initial mass input of each inventory
is set by using mean variable value with 0b =3,
0e =3, 0n =1,
0m =5,
0c =5, 0p =1. Time constant i is the mean rate of initial indirect
Chapter 7: Behaviour and Water Use Yang Fu
131
measurement of inventory to direct measurement of inventory (ETPB
questionnaire score), thus, time constant in this case are 𝜏2 = 0.37 , 𝜏3 =
0.14 , 𝜏4 = 0.52 , 𝜏5 = 0.29 , 𝜏6 = 0.55 , 𝜏7 = 0.78 .. Three intervention
strategy is simulated with dynamic expression of system time delay
parameters (𝜃1 ∼ 𝜃7 = 0, 𝜃8 ∼ 𝜃13 = 2), (𝜃1 ∼ 𝜃7 = 1, 𝜃8 ∼ 𝜃13 = 3),
(𝜃1 ∼ 𝜃7 = 3, 𝜃8 ∼ 𝜃13 = 4) (units of delay is in “month”), by which
means, this intervention strategy could influence reporter’s attitude, PBC, SN
and Self-efficacy immediately. Fig 17 (a) showed the ETPB behaviour
intervention process simulation with variable intervention designs and outside
influence (white noise signal 𝜍𝑖 = N(0,5) ).
Water consumption prediction result of ANN is generated for behaviour
intervention trend in comparison to ETPB dynamic model. ANN initial inputs
are set as HS (House Size) = 2, NOR (Number of Resident) =3, EL (Education
Level) =3, IL (Income Level) =2, which stands for a 87 m*m apartment with
three residents older than 12 years old, education level for this
reporter/representative (normally represent the landlord’s education level) is
bachelor degree and household annual income is 100K-200K RMBs.
The output of behaviour from ETPB should be interpreted as amount of water
saved in this case. Because the BV and ETPB behaviour (amount of water
saved) have first order relationship, therefore, if the increase of amount of
water saved in Fig. 17 (a) could match water consumption decrease trend in
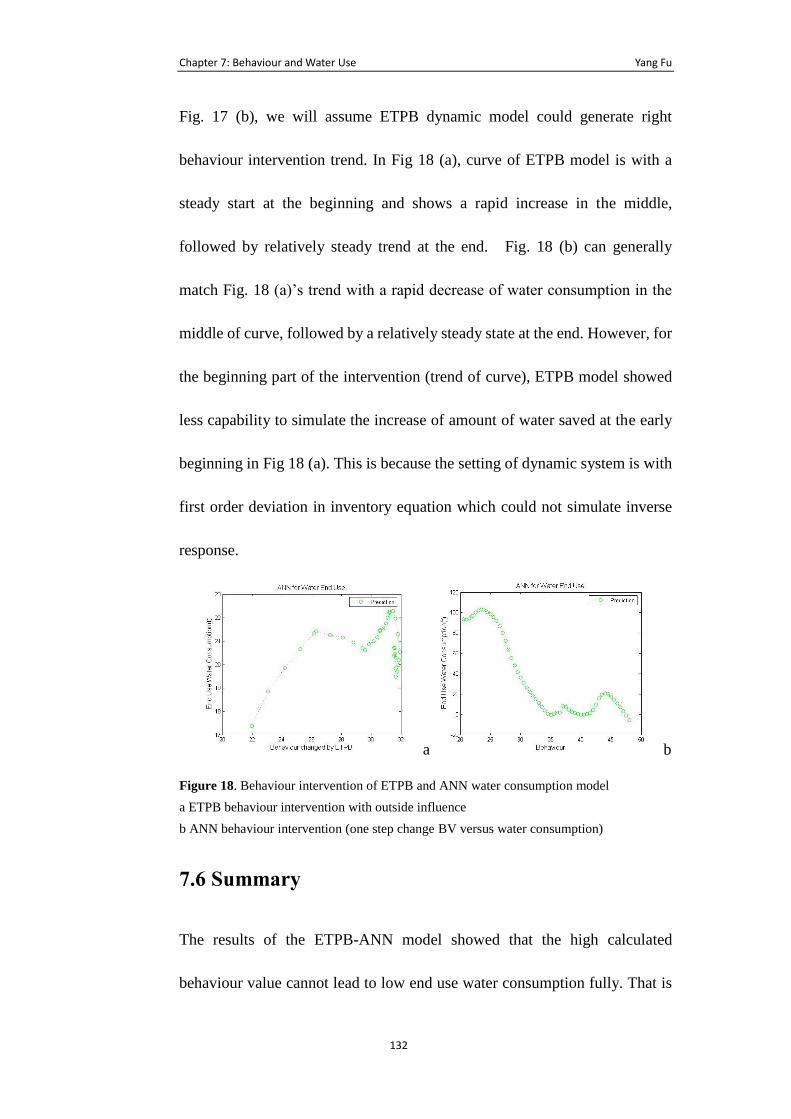
Chapter 7: Behaviour and Water Use Yang Fu
132
Fig. 17 (b), we will assume ETPB dynamic model could generate right
behaviour intervention trend. In Fig 18 (a), curve of ETPB model is with a
steady start at the beginning and shows a rapid increase in the middle,
followed by relatively steady trend at the end. Fig. 18 (b) can generally
match Fig. 18 (a)’s trend with a rapid decrease of water consumption in the
middle of curve, followed by a relatively steady state at the end. However, for
the beginning part of the intervention (trend of curve), ETPB model showed
less capability to simulate the increase of amount of water saved at the early
beginning in Fig 18 (a). This is because the setting of dynamic system is with
first order deviation in inventory equation which could not simulate inverse
response.
a b
Figure 18. Behaviour intervention of ETPB and ANN water consumption model
a ETPB behaviour intervention with outside influence
b ANN behaviour intervention (one step change BV versus water consumption)
7.6 Summary
The results of the ETPB-ANN model showed that the high calculated
behaviour value cannot lead to low end use water consumption fully. That is
Chapter 7: Behaviour and Water Use Yang Fu
133
because the end use water consumption condition for consumers are not just
influenced by behaviour, but also can be impacted by weather change or other
factors. When the behaviour value is increased by changed from ETPB, the
end use water consumption has a rapid jump in the beginning then followed
by a fall in the middle term of the year. At the end of the year, the water
consumption seems to be descending and showed no clear liner relationship
towards behaviour increase. The reason for the jump of curve of water end use
at the beginning and the middle-end of the year was due to the increase of
water use with weather change or other influences. And it can be proved in
Fig. 14, when the month is set as 6, with higher behaviour change value, the
end use water consumption value became lower except the periods behaviour
value smaller than 23 and higher than 42. This is caused by that the data
volume at these two input zones ([20, 23] and [43, 50]) are insufficiently to
support ANN training and generation of correct prediction. Without enough
data from low behaviour and high behaviour value zones, the ANN model
cannot generate current result effectively. But for the common behaviour
value zone [23-43], the ANN can work with high accuracy.
For generating a smaller end use water consumption results, water utilities
need promote strategies which could lead consumers to have a high attitude,
PBC, Subjective Norm, self-efficacy values and smaller time delays in the
strategies of promotion process. It can be achieved by giving consumers’ right
Chapter 7: Behaviour and Water Use Yang Fu
134
concept for saving water (advertisement or leaflet), increasing the social
pressure for saving water (education or increase the water bill), guidance for
how to achieve the saving goals step by step, and encouragement of
achievement. To minimalize the period for achieving targeted behaviour,
efficient positive stimulation strategies are developed in the stages of
understanding and forming the right water saving habits through education or
marketing strategies.
Apparently, the ETPB-ANN model can be used to simulate any communities
or consumers for saving water with enough data training the ANN. In addition,
the modelling methods for understanding the behaviour intervention process
have potentials, which can be applied in fields about targeted behaviour like
energy saving, GHG control, water footprint research, body weight control or
quit smoking.
Moreover, the limitation for this study is argued as follows. Firstly, the ETPB
model cannot cover all the information of the mechanism of behaviour change.
It can be improved by further psychological research and other methods, like
multivariate modelling method and time extrapolation method etc. to employ
for simulation comparison. Moreover, other ANN technologies like GRNN
(Generalized Regression Neural Networks), CCNN (Cascade Correlation
Neural Network) and FFNN (Feed Forward Neural Networks) are suggested

Chapter 7: Behaviour and Water Use Yang Fu
135
to be applied in the modelling process. Further research can be deployed in
the above fields to overcome the limitations.
Chapter 8: Conclusions and Future Work Yang Fu
136
8 Conclusions and Future Work
8.1 Introduction
This chapter presents the research conclusion of this PhD research. It
describes how the aims were met and objectives accomplished, indicating the
outcomes that leaded to these conclusions. The seven research questions are
placed here with the corresponding answer extracted from the individual
chapters. The further research for this study is also presented in this chapter.
8.2 Achievement of this Research
The overall aim of this study was to develop a behavioural change theory and
corresponding modelling methods to understand household water
conservation behavioural intervention process. The literature review for TPB,
behavioural intervention and water use modelling provided the knowledge
that informed the design of this research. The three stages data collection
involved the development of ETPB questionnaire and data analysis
methodology, which contribute the data basis for all the evaluations. Using
these data, the theory of ETPB and dynamic behavioural model are tested and
proved to be used in water conservation behaviour domain. Special objectives
were developed to understand the link between behaviour and water use
amount to provide a possibility for ETPB further application in water use area.
Chapter 8: Conclusions and Future Work Yang Fu
137
In general, all the aims for this study has been achieved.
These objectives are described below, following each research question that
guided this project.
8.3 Research Questions
The following research questions were answered during this PhD study:
1. What is the current background of research related to household water use,
and what is the background for current water saving behavioural intervention
projects.
Chapter two answered the first research question by presenting a
comprehensive literature review. It demonstrated the current research
background in water conservation, TPB, statistical analysis, behaviour
modelling and water use modelling. It presented the importance of
understanding behaviour intervention process in water use, and the exiting
challenges to develop new behavioural theory and modelling solutions. A
number of studies mentioned the universality of TPB theory, also
demonstrated the existence of a gap in the literature, where studies involving
improvement of behavioural model prediction ability, behavioural
intervention modelling and the link of water use and behaviour could be
merged into one research project.
Chapter 8: Conclusions and Future Work Yang Fu
138
2. What are the models or theories for predicting water related behaviours
and are these models showed good enough prediction power?
In order to provide answer to this research question, the chapter 3 is designed
to explore solutions for this study. A detailed review has been conducted in
that section. Combination of methods was used to provide these results,
including data collection, quesionnaire design, statistical analysis, SEM for
ETPB, dynamic behaviour modelling and ANN model. The detailed methods
were identified as follows:
• ETPB development
• Influence factor identification for water use behaviour
• Questionaire and Data Collection, including quesionnaire and survey
design
• Pre-suvery design
• Behaviour intervention
• Statistical Analysis, including reliability, validity, EFA and CFA analysis.
• Behaviour modelling, including control theory concept, fuild analogy and
system design.
• Water use modelling, including model structure and ANN modelling.
3. What is the drawbacks of theory of planned behaviour for predicting
household water use behaviours and how to improve the theory?
Chapter 8: Conclusions and Future Work Yang Fu
139
Through the review, TPB research became more controversial about its
sufficiency and the need for external variables which assist to the improvement
of intention prediction. A lot of researches mentioned TPB prediction ability
changes when used in different research domain or different cultural
background. However, no research has tried to improve TPB prediction and
understanding ability in water use behaviour domain, which means no enough
evidence of development for TPB model has been addressed in literature.
Moreover, as a typical developing country, very limited research addressed the
Chinese residential water use behaviour issue from literature. Beside, as Ajzen
metioned in his publications, the TPB cannot offer fully understanding of
behavioural intervention process, therefore, a new theory which could provide
more profund understanding of behaviour and the prediction ability is needed.
All the above findings are presented in Chapter 2.
4. What is the survey method for household water use behaviour and how to
evaluate the prediction power?
The suvery method has been presented in Chapter 3, including a
comprehensive analysis of sampling area, population and water conservation
background analysis. The survey has been conducted into three stages: stage
one is a pre-suvery test which is a face-to-face test for the questionnare in the
city centre of SZ; stage two is a face-to-face survey in a targeted community
which involves a lot of behaviour change promotion activities in the city; stage
Chapter 8: Conclusions and Future Work Yang Fu
140
three is the online survey in a nationaly wide which could provide the database
for development of the empricial ETPB model. This research also observed ten
households for a year’s length with their behaviour and water use information.
The evaluation method is presented in Chapter 5. EPA and CFA provided the
intitial test for the conflition of different construct settings in ETPB. Using
SEM and corresponding fitness test could evaluate the ETPB empricial model
fitness. In this study, the mediation analysis is also presented to test the
relationship between PBC and self-efficacy and the indirect effect for
introducing the new constructs.
5. What are the roles for past behaviour and self-efficacy in theory of planned
behaviour and how their introductions affects the original TPB model?
In Chapter 2, the TPB model and the positions for past behaviour and sef-
efficacy have been reviewed and proposed in content. The ETPB suggested the
past behaviour and self-efficacy should play a role in TPB behaviour
understanding as the follows:
As self-efficacy about water conservation became more positive, a residential
intention to save water and adopt conservation activity increase. As past
behaviour towards water conservation became more positive, a residential
attitude, subjective norm, PBC and self-efficacy on intention towards water
saving increase. As the controlling of past behaviour about water conservation
Chapter 8: Conclusions and Future Work Yang Fu
141
increased, a result of attenuating influence of attitude, subjective norms, PBC
and self-efficacy on intention increase. Past behaviour indirectly influences
water conservation intention through TPB variables (attitude, PBC and
Subjective norms). Finally, not only for the direct effects of past behaviour on
water conservation intention but also the indirect effect or TPB variables will
be investigated. Moreover, the self-efficacy has been provided to be different
in the application of TPB in water use area compared to PBC in Chapter 5.
6. How to use extended theory of planned behaviour guide the computer
simulation for dynamic behaviour intervention?
The dynamic behaviour intervention model is developed by using the empricial
findings in Chapter 5. This research used the ETPB as simulation basis offering
the structure knowledge of model system and particially understanding system
parameter identification.This part of work is showed in Chapter 5 and Chapter
6.
7. How to link the psychological behaviour value to the real water
consumption?
A ETPB-ANN model is developed to explore the link of behaviour value to
the water consumption. The findings suggested the behaviour could be a very
important variable for predicting water consumption and an index to
understand the water conservation project progression. The ETPB-ANN also
Chapter 8: Conclusions and Future Work Yang Fu
142
provide the solution to link these two variables in a dynamic modelling system
with high prediction accuracy.
8.4 Recommendations for Future Work
This research proposed a behavioural model for understanding the water
conservation behaviour and two models. By incorporating two constructs in
TPB: frequency of past water conservation behaviour and self-efficacy as
significant predictors of residential water conservation behaviour, the proposed
system explained 49% of the variance in the extended TPB model. These
findings are comparable to previous studies of water conservation behaviour
in the USA, UK, Australia and Greece demonstrating the universality of the
TPB to predict residential water conservation behaviour.
Different from individualistic cultures (e.g. UK or US), people in our research
area emphasize shared values and are relative loyal to the collective “we”, have
their unique cultural background, according to Hofstede’s individualism-
collectivism dimension. High power distance, which refers to the high extent
of individuals’ acceptance that government of organization is distributed
equally, as another label for Chinese culture also makes Chinese residents
perceive lower internal control focus with a belief that certain behaviour is
more influenced through their own decision and evaluation. Louise et al.
argued that the effect of subjective norm on intention would be stronger in
Chapter 8: Conclusions and Future Work Yang Fu
143
countries high in collectivism and power distance. Our findings support this
argument, having a larger correlation (standard solution value 0.31 in model 1)
for the relation subjective norms (SN) to intention. In the TPB theoretical
application perspective, these findings about Chinese culture differences have
important practical implications for water conservation project managers in
understanding drivers of residential water conservation behaviour and when
starting marketing promotions across nation. The impact of subjective norm on
conservation intention is greater in China, thus, promotion messages should
likely be more effective in persuading residents to participate in the water
conservation activities compared to individualistic and low power distance
countries.
Moreover, apart from research findings, several limitations of this study should
be pointed out. Firstly, due to the complexity of the behavioural information
format, this study did not address the translation method for other behavioural
information such as image and video. Further research, therefore, will
investigate more detailed solutions for translating behavioural information
from other channels. Secondly, this system only showed capability to study
individual’s behavioural intervention process, however, for a community and
city level, the modelling method in the system cannot work very effectively
due to the theory basis we applied in this research. There will be a need apply
a community based behavioural intervention model in the system to simulate
Chapter 8: Conclusions and Future Work Yang Fu
144
large population’s behaviour in the future research. Adding the populated
information in the consumption modelling process could ideally offer a
solution for this limitation. Thirdly, some other analysis and machine learning
technologies such as cluster analysis and decision tree are also suggested for
digging more information of behaviour, this should be considered in the future
research.
As for the behavioural change model, using the more advanced control system
solutions to improve the behaviour intervention modelling ability should be
one of the aims in the future work. A few studies from psychological research
have mentioned that there is a self-judgement action in self-cognitive theory
could guide the acceptance of behaviour change promotion. This will require
more profound understanding for the control engineer in the close loop control
unit area. Future research should address this point as well. The results of the
ETPB-ANN model showed that the high calculated behaviour value cannot
lead to low end use water consumption fully. That is because the end use water
consumption condition for consumers is not just inflected by behaviour, but
also can be impacted by weather change or other factors. When the behaviour
value is increased by changed from ETPB, the end use water consumption had
a rapid jump in the beginning then followed by a fall in the middle term of the
year. According to the ANN model, in order to generate a lower end use water
consumption results, water utilities need promote strategies which could lead
Chapter 8: Conclusions and Future Work Yang Fu
145
consumers to have a high attitude, PBC, Subjective Norm, self-efficacy values
and smaller time delays in the strategies of promotion process. It can be
achieved by giving consumers’ right concept for saving water (advertisement
or leaflet), increasing the social pressure to form the saving water (education
or increase the water bill), guidance for how to achieve the saving goals step
by step, and encouragement of achievement. In order to minimalize the period
for achieving targeted behaviour, efficient positive stimulation strategies are
developed in the stages of understanding and forming the right water saving
habits through education or marketing strategies.
Extensions of this model include implementing work with practical application
and modification of model. A long-term goal is to develop a dynamic water
end use model which is based on this theoretical model and could be used for
guiding consumers to lead to proper water conservation behaviours and saving
energy, but not just water. The extension of ETPB-ANN model for behaviour
guidance should be done with the support of control engineering concept and
behaviour change simulation analysis.
The strategy for using ETPB-ANN model to guide behaviour change is to test
all the influence factors, including parameters present in the model, and
propose the mathematical methods for behaviour change simulation. Also, the
existing mature marking or behaviour change strategies are evaluated via
ETPB-ANN by considering the potential outcome of the model prediction
Chapter 8: Conclusions and Future Work Yang Fu
146
result. Moreover, by classification the different behaviour use pattern through
hidden Markov model, different solutions for behaviour guidance could be
investigated to guide further research.
8.5 Summary
It is possible to draw some conclusions from the results presented in this
section. Firstly, the ETPB model or other advanced behaviour theory could be
developed to provide more detailed understanding of behaviour intervention
in water use. The ETPB model is the new try for exploring the behaviour
theory in the application of this domain. ETPB model and its empirical model
can be used to guide the Chinese residential water conservation project
promotion and understand the limitation of current water conservation
strategies. The outcome could be translated into more practical guidance by
merging in IoT or other informatics system. To apply the control engineering
in the modelling of a psychological theory is the new trend for behavioural
change result. And the survey method could be improved if there is more way
to improve the engagement of users. Participants felt bored if the behavioural
questionnaire has been repeatedly fulfilled for a long time. Through increased
engagement in the survey, they generally took the time to follow the guidance
to complete the questionnaire. Therefore, this research concludes that an
integrated behavioural monitoring platform with proper engagement

Chapter 8: Conclusions and Future Work Yang Fu
147
encourage setting can be one of the solutions to promote the sustainable
behaviours change for water conservation.
Bibliography Yang Fu
148
Bibliography
Ajzen, I., 1985. From Intentions to Actions: a Theory of Planned Behavior, in:
Julius Kuhl, Jurgen Beckmann. (Eds.), Action Control. Springer, Berlin, pp.
12-39.
Ajzen, I., 1991. The Theory of Planned Behavior. Organizational Behavior
and Human Decision Process, 50, pp. 179-211.
Andrew Darnton, Practical Guide: An overview of behaviour change models
and their uses, Government Social Research Unit, UK, 2008.
Andria, H., Carl, T., et al.: Statistical synthesis of contextual knowledge to
increase the effectiveness of theory-based behaviour change interventions. J
Health Serv Res Policy, 2011, 16, (3), pp. 167-171.
Australia Psychological Society, Evidence-based Psychological Interventions
in the Treatment of Mental Disorder: A Literature Review, Australia
Psychological Society,
https://www.psychology.org.au/Assets/Files/Evidence-Based-Psychological-
Interventions.pdf , 2010 (accessed 02/01/2017).
Babbie E., 2013. The Basics of Social Research, Sixth ed. Wadsworth
Publishing, Belmont.
Bandura A., 2006. Guide to the construction of self-efficacy scales. in: F.
Pajares., T. Urdan. (Eds.), Self-efficacy beliefs of adolescents. Information
Age Publishing, Greenwich, pp. 307-337.
Bandura, A., 1997. Self-efficacy: The exercise of control, First ed. Freeman,
New York.
Bates, B., Kundzewics, Z.W., Wu, S. and Palutikof, J., 2008. Climate Change
and Water; IPCC Technical Report VI, IPCC Secretariat, Geneva.
Beal. C, Stewart, RA., Fielding, K., 2011. A novel mixed method smart
metering approach to reconciling differences between perceived and actual
residential end use water consumption. Journal of Cleaner Production, 2011,
doi: 10.1016/j/jclepro.2011.09.007.
Belmon LS., Middelweerd A., et al.: Dutch Young Adults Ratings of Behavior
Change Techniques Applied in Mobile Phone Apps to Promote Physical
Activity: A Cross-Sectional Survey, JMIR mHealth uHealth, 2015, 3, (4),
e103.
Blanke A. et al., 2007. Water saving technology and saving water in China.
Agr. Water Manage. 87. 139-150.
Bollen, K. A., 1989, Structural Equations with Latent Variables, New York:
Bibliography Yang Fu
149
John Wiley & Sons.
Bradley Jorgensen et al., 2009. Household water use behaviour: An integrated
model. Journal of Environmental Management. 91, 227-236.
Brooks, D. B., 2006, An operational definition of water demand management,
Water Resour. Dev., 22(4), 521–528, doi:10.1080/07900620600779699.
C. A. Mart´ın, D. E. Rivera, W. T. Riley, E. B. Hekler, M. P. Buman, M. A.
Adams, and A. C. King, “A dynamical systems model of Social Cognitive
Theory,” in Proceedings of the American Control Conference, 2014, pp.
2407–2412.
Campbell, H.E., Johnson, R.M., Larson, E.H., 2004. Prices, devices, people,
or rules: the relative effectiveness of policy instruments in water conservation.
Review of Policy Research 21, 637-662.
Canfield, J. Models of Physical Activity and Sedentary Behavior Child and
Family Studies. PhD thesis, Syracuse University, 2012.
Carment Tabernero, Bernardo Hernandez, 2011. Self-efficacy and intrinsic
motivation guiding environmental behavior. Environment and Behaviour. 43
(5), 658-675.
Cary J.W., 2008. Influencing attitudes and changing consumers’ household
water consumption behavior. Water Sci. Technol. Water Suppl. 8 (3), 325-330.
Charles.S. C. and Michael. F. S. On the Self-Regulation of Behavior.
Cambridge University Press, 1998.
Chatterton, T.:An introduction to Thinking about Energy Behaviour: a Multi
Model Approach (Department for Energy and Climate Change, 2011), pp. 9-
15.
Chen, H., Zhang, Y., Ma L., Liu, F., Zheng, W., 2012. Change of water
consumption and its potential influential factors in Shanghai: a cross-sectional
study. BMC Public Health. 12:450.
Chen, Y., Zhang, D., Sun, Y., Liu, X., Wang, N., Savenije, H.H.G., 2005. Water
demand management: a case study of the Heibe River Basin in China. Physics
and Chemistry of the Earth, Parts A/B/C 30. 408-419.
Cho, V. (2003) A comparison of three different approaches tor tourist arrival
forecasting, Tourism Management, 24 (3), pp. 323-330.
Chris, F., Paschal, S., and Paul, N.:Simulating behaviour change interventions
based on the theory of planned behaviour: Impacts on intention and action,
British Journal of Social Psychology, 2007, 46, (1), pp. 43-68.
Christopher Bennett, Rodney A.Stewart, Cara D. Beal., 2013. ANN-based
residential water end-use demand forecasting model. Expert Systems with
Applications 40, 1014-1023.
Bibliography Yang Fu
150
Cialdini, R.B., Reno, R.R. and Kallgren, C.A., 1990. A focus theory of
normative conduct: Recycling the concept of norms to reduce littering in
public places. Journal of Personality and Social Psychology, 58(6), 1015-1026.
Clark, J.M., Brown, R.R, 2006. Understanding the factors that influence
domestic water consumption within Melbourne. Australian Journal of Water
Resources 10, 251-258.
Corral-Verdugo, V., Frias-Armenta, M., Perez-Urias, F., Orduna-Cabrera, V.
and Espionza-Gallego, N., 2002. Residential water consumption, motivation
for conserving water and the continuing Tragedy of the Commons.
Environmental Management 30, 527-535.
Craig W. et al., 2001. Intention to Conserve Water: Environmental Values,
Planned Behavior, and Information Effects. A Comparison of Three
Communities Sharing a Watershed. Society and Natural Resources. 14, 889-
899.
Daniel. E. Rivera. Optimized behavioural interventions: what does system
identification and control engineering have to offer?, 16th IFAC Symposium
on System Identification (SYSID 2012), Brussels, Belgium, 882-893. 2012.
Damien Sweeney. Show me the change: A review of evaluation methods for
residential sustainability behaviour change projects. Swinburne: National
Centre for Sustainablilty at Swinburne University, 2009. Accessed February
11,2014.https://www.google.co.uk/url?sa=t&rct=j&q=&esrc=s&source=web
&cd=1&cad=rja&uact=8&ved=0ahUKEwj9jcmbo-
DTAhVsL8AKHdKYDe8QFggnMAA&url=http%3A%2F%2Fevaluationtoo
lbox.net.au%2Findex.php%3Foption%3Dcom_rubberdoc%26view%3Ddoc
%26id%3D35%26format%3Draw%26Itemid%3D139&usg=AFQjCNGdMc
U0foizt6mG7djb01IlgLY3Xg&sig2=0AHs4-x6Th05VijDAFCdhg.
Daniel, R., Michael, P. et al.: Using engineering control principles to inform
the design of adaptive interventions: A conceptual introduction, Drug and
Alcohol Dependence, 2007, 88, pp. 31-40.
Dolnicar S., Leisch F., 2008. An investigation of tourists’ patterns of
obligation to protect the environment. Journal of Travel Research. 46, 381-
391.
Duke, J. M., R. W. Ehemann, and J. MacKenzie, 2002, The distributional
effects of water quantity management strategies: A spatial analysis, The
Review of Regional Studies, 32(1), 19-35.
Ezra M. Markowitz and Bob Doppelt, 2009. Report: Reducing Greenhouse
Gas Emissions through Behavioural Change: An Assessment of Past Research
on Energy Use, Transportation and Water Consumption, January 2009.
Fishbein M., Ajzen I., 2009, Predicting and Changing Behavior: The
Reasoned Action Approach, First ed. Psychology Press, New York.
Francis, J., Eccles, M. P., Johnston, M., Walker, A. E., Grimshaw, J. M., Foy,
Bibliography Yang Fu
151
R., Kaner, E. F. S., Smith, L. & Bonetti, D., 2004. Constructing questionnaires
based on the theory of planned
Gavan McCormack, 2001. Water Margins: Competing Paradigms in China.
Critical Asian Studies. 33(1), 5-30.
Geoffrey J. Syme et al., 2000. The evaluation of information campaigns to
promote voluntary household water conservation. Eval. Rev. 24(6), 539-578.
Geoffrey J. Syme, Quanxi Shao, 2004. Predicting and understanding home
garden water use. Presence: Land and Urban Planning, 68, 121-128.
Gergely Szolnoki, Dieter Hoffmann. 2013. Online, face-to-face and telephone
surveys – comparing different sampling methods in wine consumer research.
Wine Economics and Policy, 2 (2), 57-66.
Gilg A., Barr S., 2006. Behavioural attitudes towards water saving? Evidence
from a study of environmental actions. Ecol. Econ. 57 (3), 400e414.
Gregory G.D., Di Leo M., 2003. Repeated behavior and environmental
psychology: the role of personal involvement and habit formation in
explaining water consumption1. Journal of Applied Social Psychology. 33,
1261–1296.
Grima, A. P., 1972. Residential water demand: Alternative for management.
The University of Toronto Press, Toronto.
Guan Debo, Klaus Hubacek, 2007. Assessment of Regional Trade and Virtual
Water Flows in China. Ecological Economics. 61(1): 159-170.
Zhou H., et al., 2012. Influences of climate change and human activities on
Tarim River runoffs in China over the past half century, Environmental Earth
Sciences. 67 (1), 231-241.
Hagger M. S. et al., 2001. Antecedents of children’s physical activity
intentions and behaviour: Predictive validity and longitudinal effects.
Psychology & Health. 16, 391–407.
Hagger M. S. et al., 2001. The influence of self-efficacy and past behaviour
on the physical activity intentions of young people. Journal of Sports Sciences.
19, 711-725.
Hair J. F., Bush R. P., and Ortinau D. J., 2003. Marketing Research Within a
Changing Information Environment. 2nd Edition. McGraw-Hill Companies.
Hassan, A.E., 2001. Predication of plume migration in heterogeneous media
using artificial neural networks. Water Resources Research 37(3), 605-623.
Hayes A. F., 2013. Introduction to Mediation, Moderation and Conditional
Process Analysis, First ed. Guilford Press, New York.
Henry H. Zhang, David F. Brown, 2005. Understanding urban residential
Bibliography Yang Fu
152
water use in Beijing and Tianjin, China. Habitat International. 29, 469-491.
Hoekstra A.Y., 2000. Appreciation of water: four perspectives. Water Policy.
1(6), 605-622.
Hoffmann, M., Worthington, A., Higgs, H., 2006. Urban water demand with
fixed volumetric changing in a large municipality: the case of Brisbane,
Australia. The Australian Journal of Agricultureal and Resource Economics
50, 347-359.
Hsiao, C., Mountain, D., & Illman, K., 1995. A Beyesian integration of end-
use metering and conditional-demand analysis. Journal of Business &
Economic Statistics, 13(3), 315-326.
Hurlimann A., Dolnicar S., Meyer P., 2009. Understanding behaviour to
inform water supply management in developed nations-a review of literature,
conceptual model and research agenda. J. Environ. Manag. 91 (1), 47-56.
Inman, D., and P. Jeffrey, 2006. A review of residential water conservation
tool performance and influences on implementation effectiveness, Urban
Water Journal, 3(3), 127-143.
J. D. Schwartz, W. Wang, and D. E. Rivera. Optimal tuning of process control-
based decision
J. Scott, and Collopy, Fred, 1992. “Error measures for generalizing about
forecasting methods: Empirical comparisons,” International Journal of
Forecasting, 8, 69-80.
Jacob, C., Patricia, C., et al.: Applied Multiple Regression/Correlation
Analysis for Behavioural Science (Lawrence Erlabaum Associates, 3nd edn,
2002).
Jianjun Tang, et al., 2013. Estimation of awareness and perception of water
scarcity among farmers in the Guanzhong Plain, China, by means of a
structural equation model, Journal of Environmental Management. 126, 55-
62.
Jones, N., Evangelinos, K., Gaganis, P., Polyzou, E., 2011. Citizens’
perceptions on water conservation policies and the role of social capital. Water
Resour. Manag. 25 (2), pp. 509-522.
Junguo L., Hubert H.G. Sacenige, Jianxin Xu, 2002. Forecast of water demand
in Weinan City in China using WDF-ANN model. Physics and Chemistry of
the Earth, 28 (2003), 219-224.
K. Rathnayaka, H. Malano., 2011. Review of residential urban water end-use
modelling: 19th International Congress on Modelling and Simulation, Perth,
Australia, 12-16 December 2011.
Kaiser, F.G., Hubner, G. and Bogner, F.X., 2005. Contrasting the Theory of
Planned Behavior with the value-belief-norm model in explaining
Bibliography Yang Fu
153
conservation behavior. Journal of Applied Social Psychology, 35, pp. 2150-
2170.
Kaiser, F.G., Wolfing, S. and Fuhrer, U., 1999. Environmental attitude and
ecological behaviour, Journal of Environmental Psychology, 19(1), pp. 1-19.
Karayiannis, Nicolaos, Venetsanopoulos, Anastasios N, 1993. Artificial
Neural Networks, The Springer International Series in Engineering and
Computer Science, Vol. 209, XV, 440 p.
Kenney, D., Goemans, C., Klein, R., Lowery, J., Reidy, K., 2008. Residential
water demand management: lesions from Aurora, Colorado. Journal of
American Water Resources Association 44, 192-207.
Klöckner, C. A., Blöbaum, A. (2010). A comprehensive action determination
model: Toward a broader understanding of ecological behaviour using the
example of travel mode choice. Journal of Environmental Psychology, 30(4),
pp. 574–586.
Kristopher J. Preacher, Ken Kelley, 2011. Effect size measures for mediation
models: quantitative strategies for communicating indirect effects.
Psychological Methods. 16(2), 93-115.
L. Ljung, System Identification: Theory for the User, 2nd ed. Upper Saddle
River, NJ: Prentice Hall PTR, 1999.
Lam S.P., 1999. Predicting intention to conserve water from the theory of
planned behavior, perceived moral obligation, and perceived water right. J.
Appl. Sco. Psychol. 29(5), 1058-1071.
Lam S.P., 2006. Predicting intention to save water: theory of planned behaver,
response efficacy, vulnerability, and perceived efficiency of alternative
solution1. J. Appl. Sco. Psychol. 36(11), 2803-2824.
Leviston Z. et al., 2005. Towards Sustainable Irrigation Practices:
Understanding the Irrigator. A Case Study in the Riverland, South Australia.
CSIRO, Dickson.
Liu Y., et al., 2008. Determinants of agricultural water saving technology
adoption: an empirical study of 10 provinces of China. Ecol. Econ. 4, 462-472.
Lohmöller, J.B., 1989. Latent Variables Path Modeling with Partial Least
Squares. Physica-Verlag: Heidelberg.
Luaky-Froukh, M., 2001. Decision Support System for Domestic Water
Demand Forecasting and Management. Water Resources Management, 15,
363-382.
Lustria, A., Noar, M., et al.: A meta-analysis of web-delivered tailored health
behaviour change interventions. Journal of Health Communication, 2013, 18,
(9), pp. 1039-1069.
Bibliography Yang Fu
154
Lutz Sommer, 2011. The theory of planned behaviour and the impact of past
behaviour. International Business and Economic Research Journal, 10(1), 91-
110.
M.Blokker, E., Vreeburg, J., Dijk, J., 2010. Simulating residential water
demand with a stochastic end-use model. Journal of Water Resources Planning
and Management, 136(19), 19–26.
MacCorquodale K, Meehl PE., 1948. Operational validity of intervening
constructs. Psychol. Rev. 55, 95–107.
MacKinnon D. P., 2008. Introduction to statistical mediation analysis, First ed.
Erlbaum, Mahwah.
Manstead, A.S.R. and Parker, D., 1995. Evaluating and extending the theory
of planned behaviour. In W.Stroebe and M. Hewstone (Eds), European
Review of Social Psychology Bulletin, 34, 913-923.
Mark Conner, Christopher J. Armitage, 1999.Extending the Theory of Planned
Behavior: A Review and Avenues for Further Research. Journal of Applied
Social Psychology. 28, 1429-1464.
Mark Cordano, Irene Hanson Frieze, 2000. Pollution Reduction Preferences
of U.S. Environmental Mangers: Applying Ajzen’s Theory of Planned
Behavior. The Academy of Management Journal, 43(4), 627-641.
Marshen, J. and Pickering, P. 2006. Securing Australia’s urban water supplies:
opportunities and impediments. A discussion paper prepared for the
Department of the Prime Minister and Cabinet, Marsden Jacob Associates,
Camberwell.
Martin S.Hagger, Nikos Chatzisarantis, Stuart J.H., 2001, The influence of
self-efficacy and past behaviour on the physical activity intentions of young
people, Journal of sports sciences, volume 19, Issue 9, 711-725.
Masound Yazdanpanah, D. Hayati, S. Hochrainer-Stigler, G. H. Zamani, 2014.
Understanding farmers’ intention and behaviour regarding to water
conservation in the Middle-East and North Africa: A case study in Iran.
Journal of Environmental Management. 135, 63-72.
Mazzocchi, M., 2008. Statistics for marketing and consumer research. 1st edn.
SAGE publications Ltd.
Mohamed, H., Hajer, B., et al.: A predictive model for recurrent consumption
behaviour: An application on phone calls, Knowledge-Based Systems., 2014,
64, pp. 32-43.
Munro, S., Lewin, S., et al.: A review of health behaviour theories: how useful
are these for developing interventions to promote long-term medication
adherence for TB and HIV/AIDS?, Bmc Public Health, 2007, 7, (1), pp. 104.
Nancarrow, B.E., Po, M. and Porter, N.B. 2004. Why Doesn’t it work? The
Bibliography Yang Fu
155
Incorporation of Community Culture in the Evaluation of Water Sensitive
Urban Designs. In cities as Catchments – WSUD 2004; 2004 International
Conference on Water Sensitive Urban Design, Adelaide, Australia.
Natalia López-Mosquera et al., 2014. An extension of the Theory of Planned
Behavior to predict willingness to pay for the conservation of an urban park.
Journal of Environmental Management. 135, 91-99.
Nazish Muzaffar, 2015. Developing and Extended Model of Theory of
Planned Behavior to Explore Green Purchase Behaviour of Pakistani
Consumers. American Journal of Business and Management. 4(2), 85-101.
Norazlan Hasbullah, et al., 2014. Extending the theory of planned behavior:
Evidence of the arguments of its sufficiency. International Journal of
Humanities and Social Science. 4(14), 101-105.
Norman P. et al., 2000. The Theory of Planned Behaviour and exercise:
Evidence for the moderating role of past behaviour. British Journal of Health
& Psychology. 5, 249-261.
Organisation for Economic Cooperation and Development (OECD), 2007.
Environmental Performance Review of China. OECD, Paris.
Ouellette J.A., Wood W., 1998. Habit and intention in everyday life: The
multiple processes by which past behaviour predicts future behaviour.
Psychological Bulletin. 124, 54-74.
Parker Fiebelkorn A, Person B, Quick RE, Vindigni SM, Jhung M, Bowen A,
Riley PL: Systematic review of behavior change research on point-of-use
water treatment interventions in countries categorized as low- to medium-
development on the human development index. Soc Sci Med. 2012, 75 (4):
622-633. 10.1016/j.socscimed.2012.02.011.
Peter W.Meyer et al., 1999. Residential End Uses of Water, American Water
Works Association.
Pirie, R.L., de Loë, R.C., Kreutzwiser, R., 2004. Drought planning and water
allocation: an assessment of local capacity in Minnesota. J. Environ. Manag.
73 (1), pp. 25-38.
Po, M., Nancarrow, B., Levistion, Z., Porter, N., Syme, G., Kaercher, J.,
2005. Predicting Community Behaviour in Relation to Wastewater Reuse:
What Drives Decisions to Accept or Reject? Melourne: CSIRO.
Polebitski, A. and Palmer, R., 2010.” Seasonal Residential Water Demand
Forecasting for Census Tracts.” J. Water Resource Plan and Manage. 136(1),
27–36.
Rachel Davis, Rona Campbell, Zoe Hildon, Lorna Hobbs Susan Michie, 2015.
Theories of behaviour and behaviour change across the social and behavioural
sciences: a scoping review, Health Psychology Review, 9:3, 323-344.
Bibliography Yang Fu
156
Renwick, M. E., and R. D. Green, 2000. Do residential water demand side
management policies measure up? An analysis of eight California water
agencies, Journal of Environmental Economics and Management, 40, 37-55.
Russell, S., Fielding, K., 2010. Water demand management research: A
psychological perspective. Water Resources Research, 46, W0253502,
doi:10.1029/2009WR 008408.
S. J. Kantola, S. J., Syme, G. J., Campbell, N. A., 1982. The Role of Individual
Differences and External Variables in a Test of the Sufficiency of Fishbein's
Model to Explain Behavioral Intentions to Conserve Water. Journal of Applied
Psychology, 12, 70-83. Doi: 10.1111/j.1559-1816. 1982.tb00850.x
S. J. Kantola, Syme, G. J., A. R. Nesdale, 1993. The Effects of Appraised
Severity and Efficacy in Promoting Water Conservation: An Informational
Analysis. Journal of Applied Social Psychology, 12, 164-182. Doi:
10.1111/j.1559-1816. 1983.tb02328.x
S. Marsland, 2009. “Using habituation in machine learning,” Neurobiology of
Learning and Memory, vol. 92, no. 2, pp. 260–266.
Sara Dolnicar et al., 2012. Water conservation behaviour in Australia. Journal
of Environmental Management. 105, 44-52.
Sharifah N. M. S. Hasan et al., 2015. Application of Theory of Planned
Behavior in Measuring the Behavior to Reduce Plastic Consumption Among
Students at Universiti Putra Malaysia, Malaysia. Procedia Environmental
Science. 30, 195-200.
Shirley Taylor, Peter Todd, 1995. An Integrated Model of Waste Management
Behaviour: A Test of Household Recycling and Composting intentions,
Environment and Behaviour. 27(5), 603-630.
Shiyuan Shen, 24th April 2015, Do you think SZ lack of Water? It is one of
most water lacking cities in China according to data from CMWR.
http://city.shenchuang.com/szms/20150424/174891_3.shtml
Shook, C. L., Ketchen Jr, D. J., Hult, G. T., Kacmar, K. M. 2004. An
assessment of the use of structural equation modelling in strategic
management research, Strategic management journal, 25 (4), 397-404.
Snedecor, George W. and Cochran, William G., 1989. Statistical Methods,
Eighth Edition, Iow State University Press.
Spinks, A., Fielding, K. Russell, S., Mankad, A. and Price, J., 2011. Water
Demand Management Study: Baseline Survey of Household Water Use (Part
A). Urban Water Security Research Alliance Technical Report. No. 40.
Stephen, S., 2002. Testing attitude-behaviour theories using non-experimental
data: An examination of some hidden assumptions. European Review of
Social Psychology, 13, pp. 293-323.
Bibliography Yang Fu
157
Stern, P. C., 2000, Toward a coherent theory of environmentally significant
behavior, J. Soc. Issues, 56(3), 407–424, doi:10.1111/0022-4537.00175.
Syme G. J., Nancarrow B. E., 1992. Predicting public involvement in urban
water management and planning. Environment and Behavior, 24(6), 738–758.
Syme G. J., 2003, 'Essay 1: Planning, social justice research, and socially
acceptable decision making, in stakeholder involvement in options assessment:
promoting dialogue in meeting water and energy needs', A Sourcebook, The
World Bank, Washington, DC, Report 264/03, pp.18-25.
T. Raykov and G.A. Marcoulides, A First Course in Structural Equation
Modeling, 2nd ed. Erlbaum, Mahwah, NJ, 2006.
T. Kurz, N. Donaghue, I. Walker, 2005. Utilizing a Social‐Ecological
Framework to Promote Water and Energy Conservation: A Field Experiment
Journal of Applied Social Psychology 35 (62005), 1281-1300
Terry D.J., O’Leary, J.E., 1995. The Theory of Planned Behaviour: The effects
of perceived behavioral control and self-efficacy. British Journal of Social
Psychology. 34, 403-415.
Thomas, W., Judith, J., et al., 2012. Using the Internet to Promote Health
Behaviour Change: A Systematic Review and Meta-analysis of the Impact of
Theoretical Basis, Use of Behaviour Change Techniques, and Mode of
Delivery on Efficacy, Journal of Medical Internet Research, 12 (1), e4.
Tingyi Lu, 2007. Research of domestic water consumption: a field study in
Harbing, China. Master of Science thesis, Loughborough University,
September 2007.
Trost S. et al., 2002. Determinants of physical activity in middle school
children. American Journal of Health Behavior. 26(2), 95–102.
Trumbo, C. W., N. L. Markee, G. J. O’Keefe, and E. Park, 1999. Antecedent
precipitation as a methodological concern in attitude surveys on water
conservation, Water Resour. Res., 35(4), 1269–1273,
doi:10.1029/1998WR900123.
Tu, JV. 1996. Advantages and disadvantages of using artificial neural
networks versus logistic regression for predicting medical outcomes, J Clin
Epidemiol, 49(11), 1225-1231.
Van Ryn et al., 1996. A test of the Theory of Planned Behavior for two health
related practices. Journal of Applied Social Psychology, 26(10), 871-883.
Vörösmarty, C. J., et al., 2010, Global threats to human water security and
river biodiversity, Nature, 467(7315), 555-561.
Xie Jian, et al., 2008. Addressing Chinas water scarcity: recommendations for
selected water resource management issues. World Bank, Washington, DC.
Bibliography Yang Fu
158
Xi-Peng Deng, et al., 2006. Improving agricultural water use efficiency in arid
and semiarid areas of China, Agricultural Water Management. 80, 23-40.
Yong Jiang, 2009. Chinas water scarcity, Journal of environmental
management. 90, 3185-3196.
Yordy G.A., Lent R.W., 1993. Predicting aerobic exercise participation: Social
cognitive, reasoned action, and planned behaviour models. Journal of Sport
and Exercise Psychology. 15, 363-374.
Yujiu Xiong et al., 2016. Relationship between water-conservation behaviour
and education in Guangzhou, China. Environ Earth Sci., 75:1.
Yuwen, D., Daniel, R., et al.: Hybrid Model Predictive Control for Optimizing
Gestational Weight Gain Behavioural Intervention. Porc. Am. Control. Conf,
Washington, American, 2013, pp. 1970-1975.
Zhang, H.H., Brown, D.F., 2005. Understanding urban residential water use
in Beijing and Tianjin, China. Habitat International. 29, pp. 469-491.
Appendix 1: Questionnaire Content (English Version) Yang Fu
159
Appendix 1 Questionnaire Content (English Version)
Appendix 1: Questionnaire Content (English Version) Yang Fu
160
Appendix 1: Questionnaire Content (English Version) Yang Fu
161
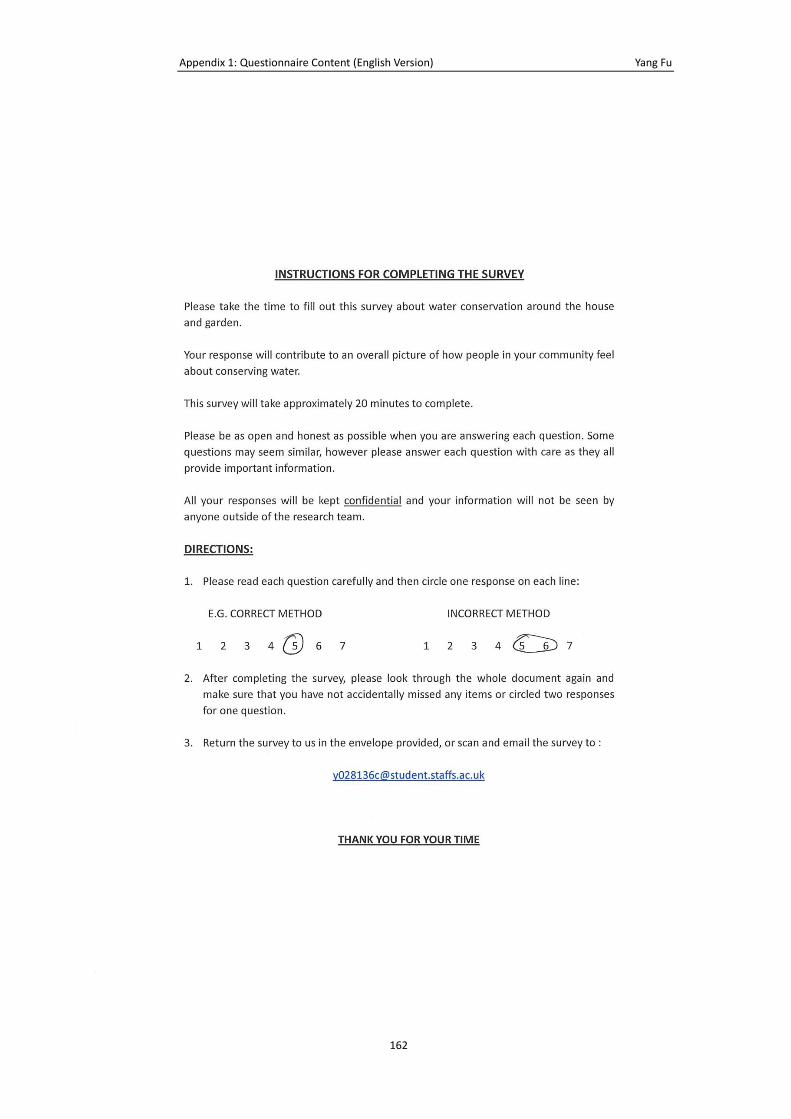
Appendix 1: Questionnaire Content (English Version) Yang Fu
162
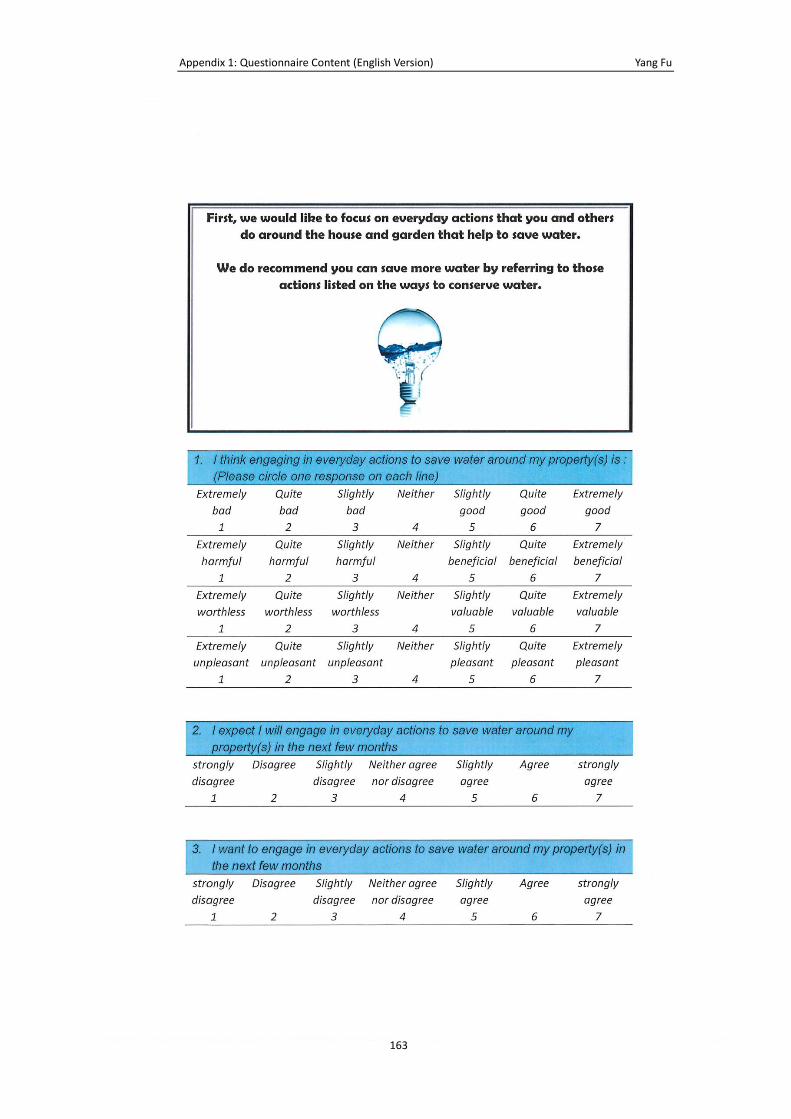
Appendix 1: Questionnaire Content (English Version) Yang Fu
163
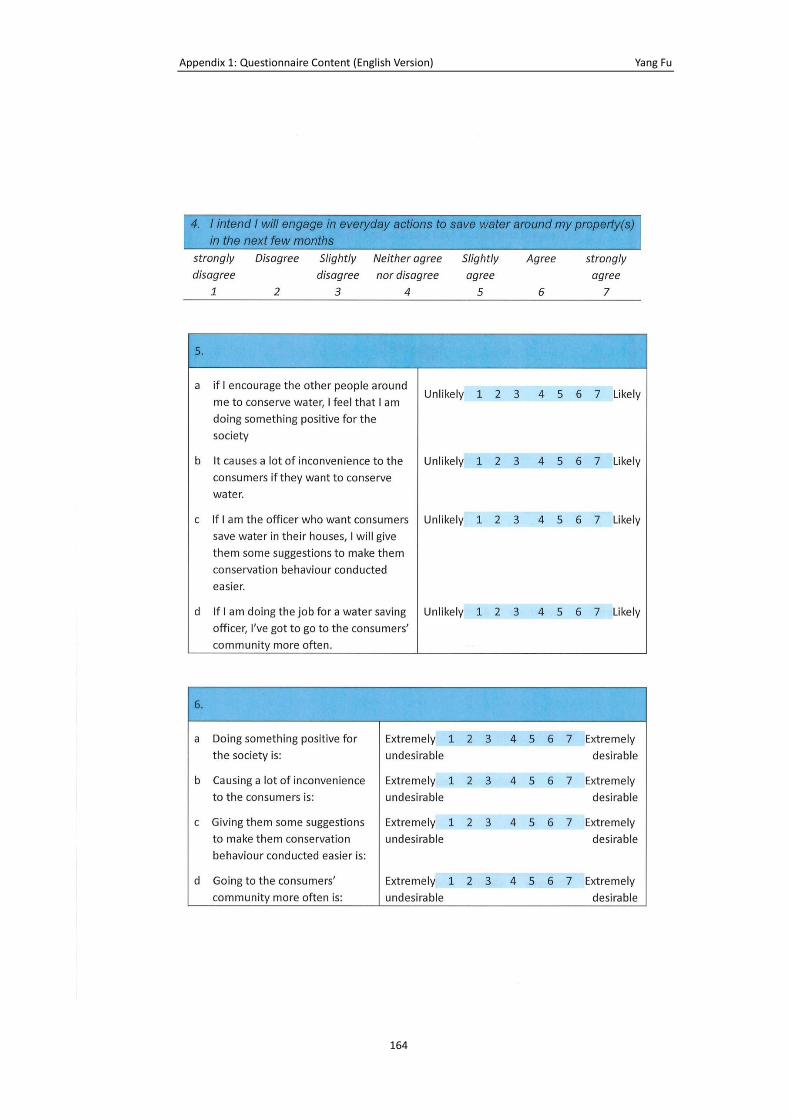
Appendix 1: Questionnaire Content (English Version) Yang Fu
164
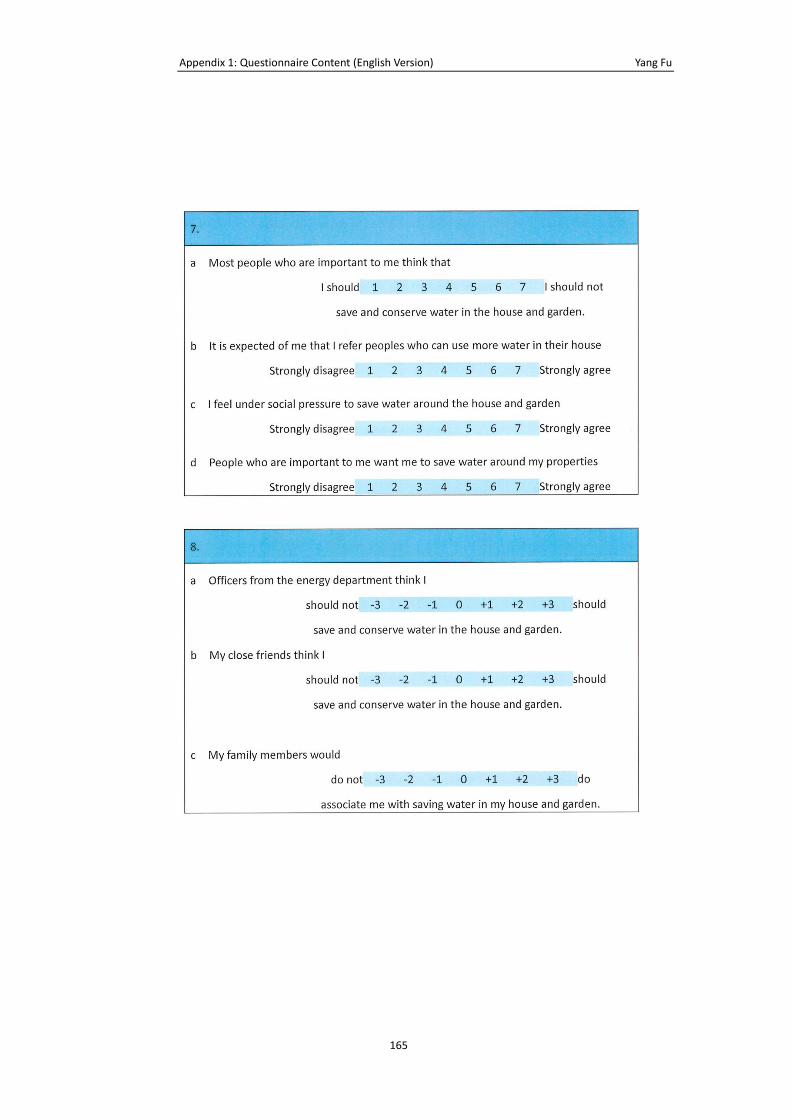
Appendix 1: Questionnaire Content (English Version) Yang Fu
165
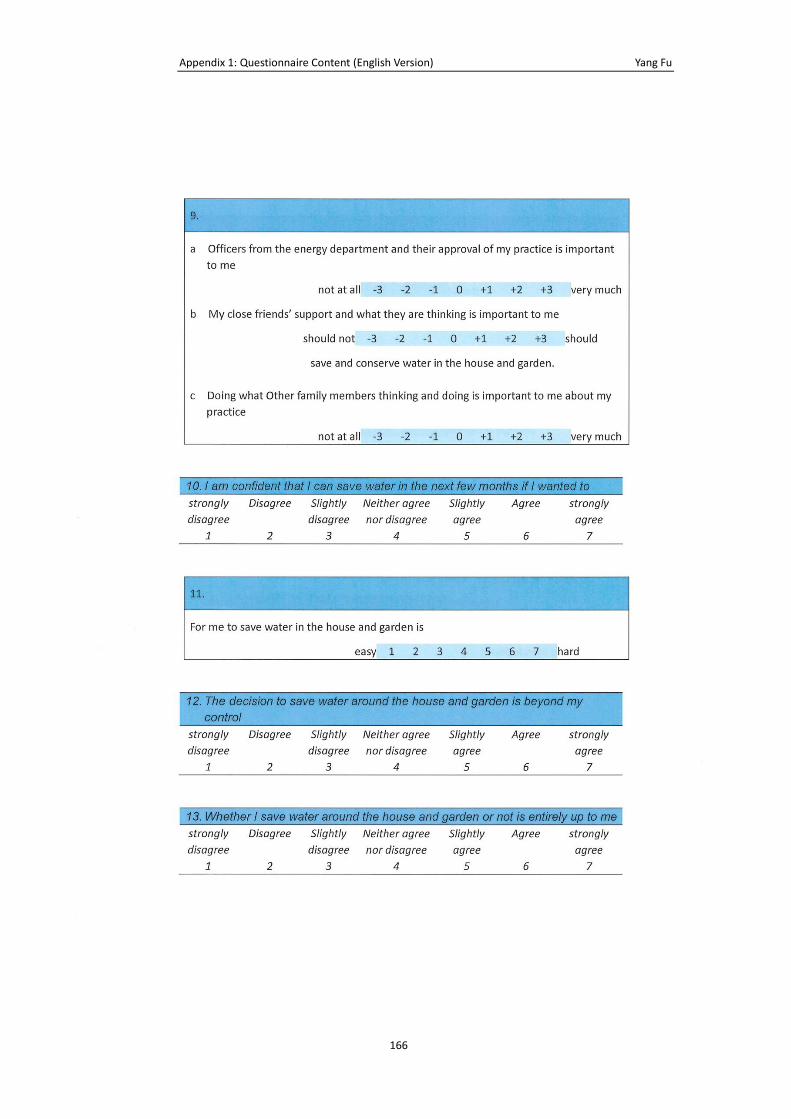
Appendix 1: Questionnaire Content (English Version) Yang Fu
166
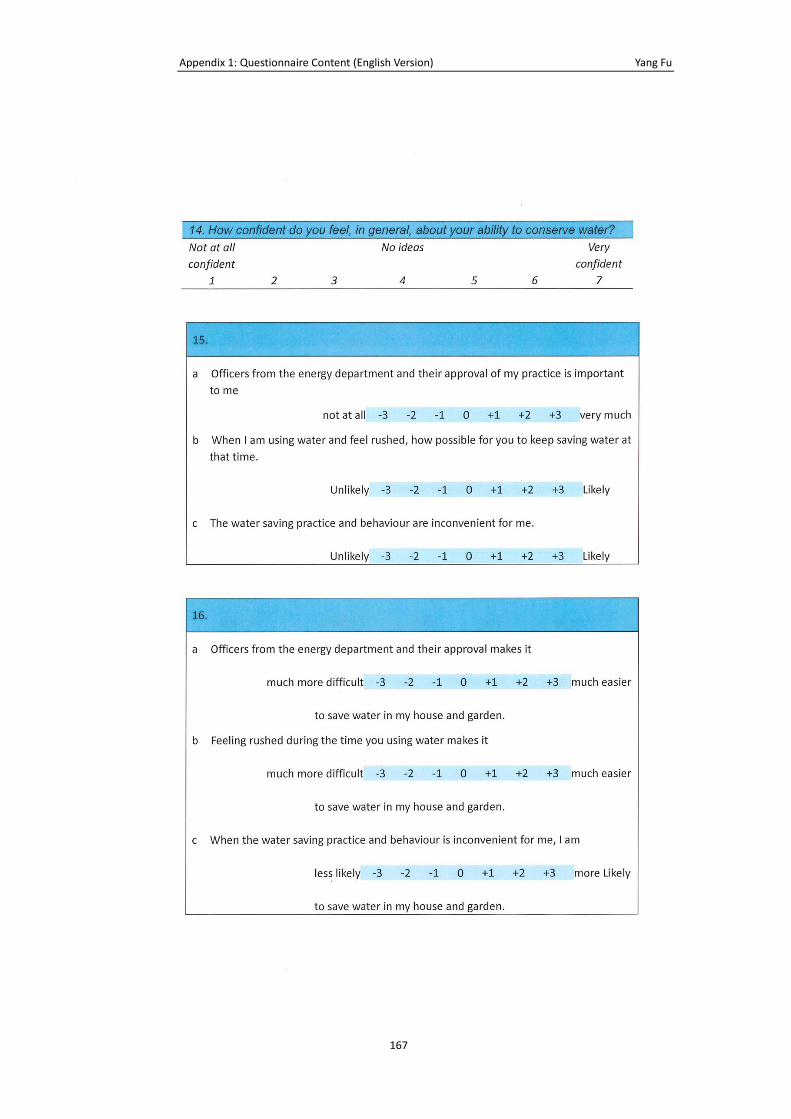
Appendix 1: Questionnaire Content (English Version) Yang Fu
167
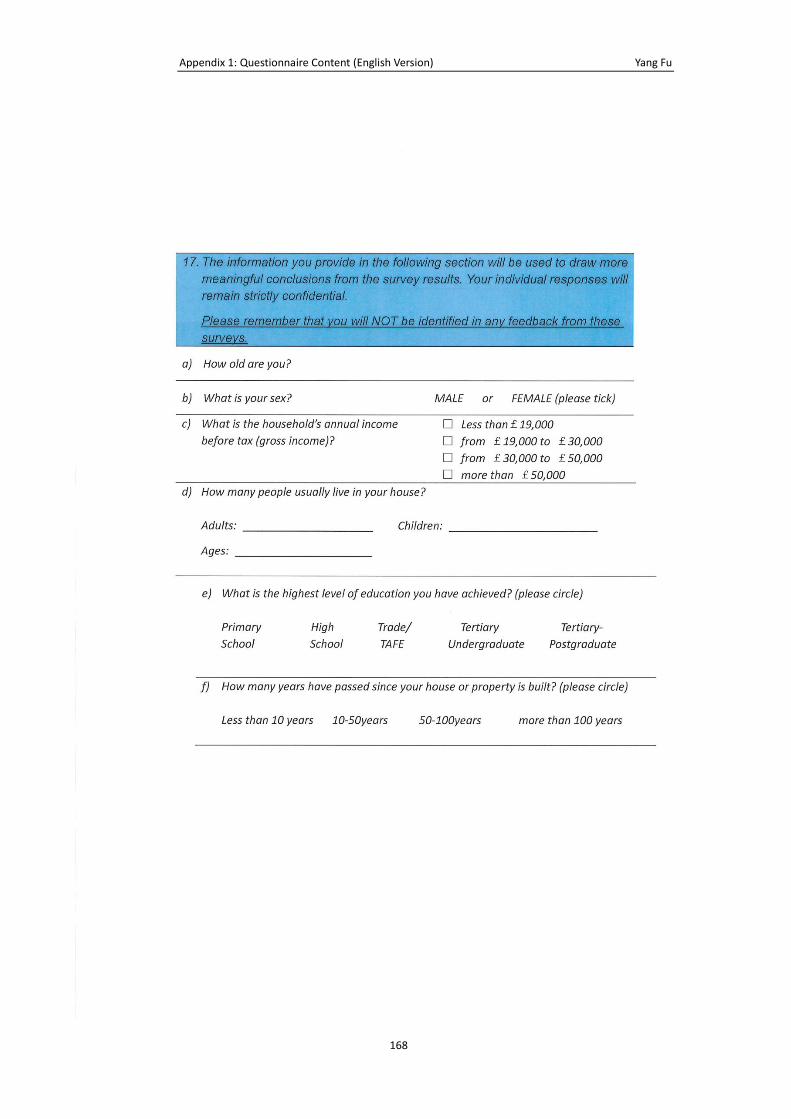
Appendix 1: Questionnaire Content (English Version) Yang Fu
168
Appendix 1: Questionnaire Content (English Version) Yang Fu
169
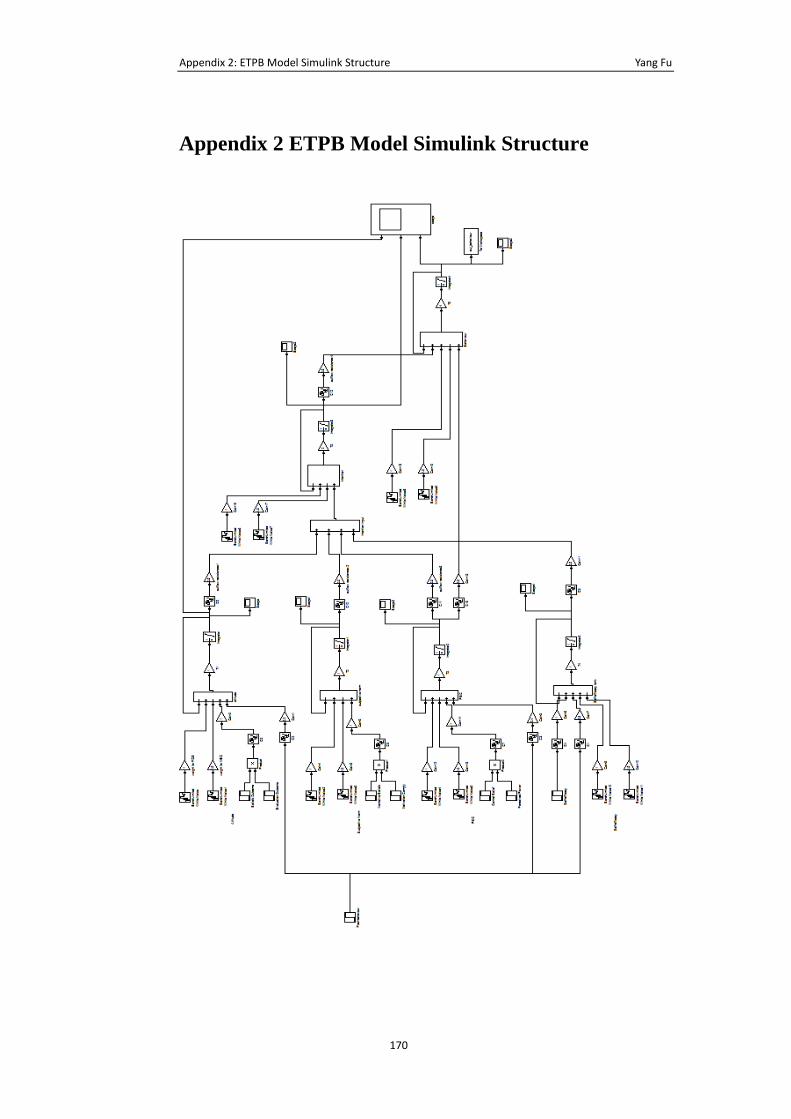
Appendix 2: ETPB Model Simulink Structure Yang Fu
170
Appendix 2 ETPB Model Simulink Structure