Embed Size (px)
Citation preview
UNDERSTANDING AND TREATING EYE DISEASES: MECHANICAL CHARACTERIZATION AND PHOTOCHEMICAL MODIFICATION OF THE
CORNEA AND SCLERA
Thesis by
Matthew Sanford Mattson
In Partial Fulfillment of the Requirements for the
degree of
Doctor of Philosophy
CALIFORNIA INSTITUTE OF TECHNOLOGY
Pasadena, California
2008
(Defended May 7, 2008)

ii
© 2008
Matthew Sanford Mattson
All Rights Reserved

iiiACKNOWLEDGEMENTS
I would like to thank my mom and dad for all their support. Really without them, I never
would have made it this far. I’d like to thank my brother and sister for their interest and
fascination in what I am doing, and for always being a part of my life. I thank my relatives
who always ask questions regarding my work and the progress we are making.
I thank those people who convinced me to apply to Caltech. You were right, California is
fun. Caltech’s a good school. I have enjoyed myself.
I extend a special thanks to everyone in the Kornfield group without whom I could not
have completed this work. In addition I thank you for the wonderful conversations that
make working in the lab more enjoyable.
I thank my friends, here in California, as well as in West Virginia and Virginia who remind
me that I need to keep it real and relax.
I thank all of the collaborators who have made this work possible, and who have truly been
fun to work with.
This project has continually been guided by the hands of my advisor, Julie Kornfield, and
very close co-workers, Dan Schwartz, Scott Fraser, Bob Grubbs, CJ Yu, and Yang. Having
regular interactions with you has been an eye opening experience.
I thank my friends at Church for all your helpful prayers and kindness. You are a blessing
in my life.

ivI thank God for getting me through this ordeal and keeping me company no matter how
things went.
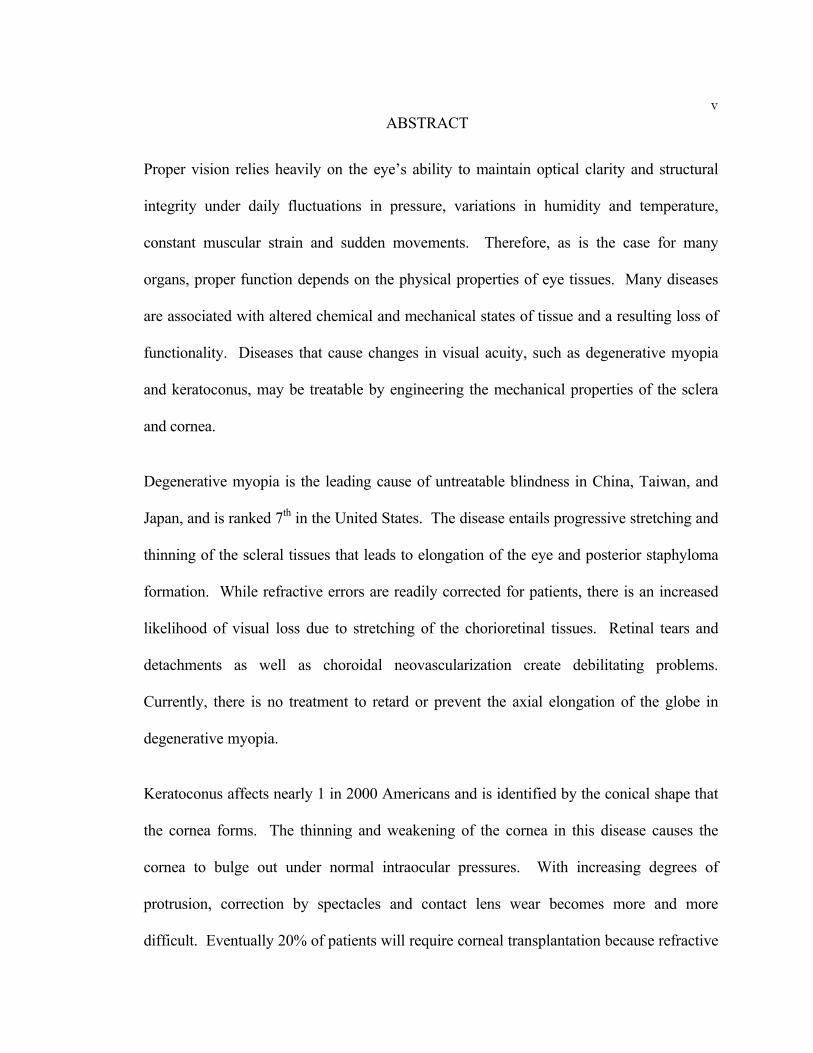
vABSTRACT
Proper vision relies heavily on the eye’s ability to maintain optical clarity and structural
integrity under daily fluctuations in pressure, variations in humidity and temperature,
constant muscular strain and sudden movements. Therefore, as is the case for many
organs, proper function depends on the physical properties of eye tissues. Many diseases
are associated with altered chemical and mechanical states of tissue and a resulting loss of
functionality. Diseases that cause changes in visual acuity, such as degenerative myopia
and keratoconus, may be treatable by engineering the mechanical properties of the sclera
and cornea.
Degenerative myopia is the leading cause of untreatable blindness in China, Taiwan, and
Japan, and is ranked 7th in the United States. The disease entails progressive stretching and
thinning of the scleral tissues that leads to elongation of the eye and posterior staphyloma
formation. While refractive errors are readily corrected for patients, there is an increased
likelihood of visual loss due to stretching of the chorioretinal tissues. Retinal tears and
detachments as well as choroidal neovascularization create debilitating problems.
Currently, there is no treatment to retard or prevent the axial elongation of the globe in
degenerative myopia.
Keratoconus affects nearly 1 in 2000 Americans and is identified by the conical shape that
the cornea forms. The thinning and weakening of the cornea in this disease causes the
cornea to bulge out under normal intraocular pressures. With increasing degrees of
protrusion, correction by spectacles and contact lens wear becomes more and more
difficult. Eventually 20% of patients will require corneal transplantation because refractive
vicorrection is no longer possible. Further, patients with thin corneas are at high risk for
complications after LASIK and similar refractive surgeries. Early clinical data supports the
efficacy of ultraviolet light activation of topically applied riboflavin to increase the corneal
modulus and prevent progression of the disease.
The use of riboflavin activated by ultraviolet light and the use of crosslinkers to treat tissue
works on the presupposition that by increasing the strength and mechanical stability of the
tissue, the disease progression may be halted. Our studies in vitro indicate that crosslinking
can improve tissue mechanical stability and resistance to deformation.
Mechanical characterization of tissue has relied heavily on the use of the intact globe
expansion method which we have developed. While other measurement techniques
(uniaxial tensile tests, shear rheology) are used in the field of eye biomechanics, our
evaluation of the testing methods and variability of the results indicates that considerable
effort is required to achieve reliable results. The intact globe expansion test provides
reliable measurements, with relatively few samples, and mimics the type and distribution of
stresses inherent in the natural boundary conditions of the eye. Furthermore, application of
high intraocular pressures provides a way to study shape changes of the sclera and cornea
which are similar to those exhibited in myopia and keratoconus. Potential treatments that
show an ability to prevent ocular distension in this method have a chance of preventing the
deformations that occur in vivo in the diseases. Therefore, this method has been used to
evaluate treatments developed in the course of this thesis.
viiOur treatment development has gained direction from the previous example of
Wollensak and Speorl who pioneered the use of riboflavin and ultraviolet-light-induced
crosslinking of tissue. Light activated crosslinking provides spatial and temporal control of
treatments. The choice of different photoinitiator systems, such as Eosin Y (EY) and
triethanolamine (TEOA) allows the use of visible light (525 ± 16 nm), and at the irradiation
doses necessary to achieve stabilization of the eye mechanical properties in vitro (6–8
mW/cm2), calculations indicate that treatments will be more than a factor of 6 under the
thresholds set by ANSI guidelines.
Eye stabilization in vitro has been demonstrated through treatment of either the sclera or
the cornea with the use of EY and TEOA. For myopia treatment, drug delivery in vitro
used low concentrations (0.0289 mM EY, 90 mM TEOA) , while the switch to in vivo drug
delivery by subconjunctival injection required the use of higher concentrations (0.298 mM
EY, 90 mM TEOA) to achieve the same stabilization during in vitro expansion.
Keratoconus treatments comparing the protocols for riboflavin that are used in the clinic to
treatment with EY/TEOA demonstrate similar capabilities of eye stabilization. Further,
penetration studies of EY/TEOA show the possibility of delivering drug to the stroma
without removal of the epithelium. In combination with the reduced treatment time of the
visible light treatment (10 minutes as opposed to 35 for the riboflavin/UV treatment), this
could vastly improve the current treatment techniques.
Biocompatibility studies of the treatments indicate excellent tolerance to the light and drug
in both rabbits and guinea pigs. Although we discovered that treatment with 0.09 mM
EY/90 mM TEOA was not able to prevent development of form deprivation myopia in a
viiiguinea pig model, there were no ill effects of the treatment seen during the life of the
animals. Tests on normal growth of guinea pig eyes indicate that treatment with a higher
dose (0.289 mM EY/90 mM EY) causes substantial changes to eye shape without toxicity.
These changes are manifested in shifts in the refractive error and ocular length that persist
for the duration over which the animals are monitored.
In summary, the mechanical measurement technique developed in this work has usefulness
as a tool to characterize tissue strength and as a tool for screening and comparing treatment
efficacy. The visible light system designed for the purposes of treating degenerative
myopia and keratoconus shows an ability to stabilize eye shape in vitro, demonstrates
biocompatibility, and does so with light doses that are deemed safe levels for clinical
applications.
ixTABLE OF CONTENTS
Acknowledgements ............................................................................................iii Abstract ................................................................................................................ v Table of Contents................................................................................................ ix List of Illustrations and Tables ...........................................................................xi Symbols and Abbreviations..............................................................................xiv Chapter I: Introduction
1.1 Importance of Vision............................................................................ I-1 1.2 Diseases of the Eye—Myopia & Keratoconus.................................... I-3 1.2.1 Degenerative Myopia ........................................................................ I-5 1.2.2 Keratoconus....................................................................................... I-6 1.2.3 Corneal and Scleral Structure .......................................................... I-7 1.3 Importance of Mechanical Properties—Diseases & Measurements .. I-9 1.4 Potential Treatments........................................................................... I-10 1.4.1 Crosslinking..................................................................................... I-10 1.4.2 Photoactivated Crosslinking ........................................................... I-13 1.5 Outline of Thesis ................................................................................ I-13 Bibliography ............................................................................................. I-15
Chapter II: Mechanical Measurements 2.1 Introduction to the Field of Biomechanics ......................................... II-1 2.2 Principles Behind Measurements........................................................ II-3 2.3 Techniques in the Field ....................................................................... II-5 2.4 Strengths and Limitations of Alternative Techniques: Illustration in Cornea and Sclera..................................................... II-9 2.4.1 Uniaxial Tensile Tests .................................................................... II-10 2.4.2 Oscillatory Shear Rheology ........................................................... II-21 2.4.3 Intact Globe Expansion Test .......................................................... II-35 Bibliography ............................................................................................ II-46
Chapter III: Photoactivated Treatment Using Visible Light 3.1 Introduction ........................................................................................III-1 3.2 Photoinitiator Systems........................................................................III-3 3.3 Temporal and Spatial Control of Treatments ....................................III-6 3.3.1 Temporal Control of Treatments ....................................................III-6 3.3.2 Spatial Control of Treatments.........................................................III-8 3.4 Light Safety and Clinical Relevance ...............................................III-10 Bibliography ...........................................................................................III-14
Chapter IV: Interpenetrating Polymer and Tissue Networks 4.1 Tissue Engineering ............................................................................ IV-1 4.2 Concentration and Oxygen Dependence of Increases in Scleral Modulus ......................................................................................... IV-3
x4.3 Crosslinking Without PEGDM......................................................... IV-7 4.4 In Vivo Treatment Comparison With and Without PEGDM......... IV-10 Bibliography .......................................................................................... IV-14
Chapter V: Treatment of Myopia 5.1 Introduction .........................................................................................V-2 5.2 Materials and Methods ........................................................................V-6 5.2.1 In Vitro Application & In-Vitro Expansion..................................... V-6 5.2.2 Biocompatibility ............................................................................... V-8 5.2.3 In Vivo Application & In-Vitro Expansion ..................................... V-9 5.2.4 Animal Model of Myopia................................................................ V-12 5.3 Results................................................................................................V-17 5.3.1 In Vitro Application & In-Vitro Expansion................................... V-17 5.3.2 Biocompatibility ............................................................................. V-20 5.3.3 In Vivo Application & In-Vitro Expansion ................................... V-23 5.3.4 Animal Model of Myopia................................................................ V-24 5.4 Summary............................................................................................V-31 Bibliography ............................................................................................V-32
Chapter VI: Treatment of Keratoconus 6.1 Introduction ....................................................................................... VI-1 6.2 Materials and Methods ...................................................................... VI-3 6.2.1 Penetration of Molecules—Epithelial Barrier...............................VI-3 6.2.2 In Vitro Application and In Vitro Expansion .................................VI-6 6.3 Results................................................................................................ VI-9 6.3.1 Penetration of Molecules—Epithelial Barrier...............................VI-9 6.3.2 In Vitro Application and In Vitro Expansion ...............................VI-10 6.4 Summary.......................................................................................... VI-14 Bibliography .......................................................................................... VI-16

xiLIST OF ILLUSTRATIONS AND TABLES
Page Chapter 1
Figure 1.1 Anatomy of the Eye ................................................................. I-3
Figure 1.2 Emmetropia, Hyperopia and Myopia...................................... I-4
Figure 1.3 Degenerative Myopia and Keratoconus.................................. I-6
Figure 1.4 Maillard Reaction .................................................................. I-12
Chapter 2 Figure 2.1 Ideal Materials ........................................................................ II-3
Figure 2.2 Methods in Biomechanics ...................................................... II-6
Figure 2.3 Young-Laplace Equation ....................................................... II-7
Figure 2.4 Oscillatory Shear Measurement ............................................. II-9
Figure 2.5 Stress-Strain Curves of Human Cornea ............................... II-11
Figure 2.6 Tissue Preparation for Tensile Measurements..................... II-14
Figure 2.7 Clamping for Tensile Tests .................................................. II-15
Figure 2.8 Stress-Strain Curves of Porcine Sclera ................................ II-17
Figure 2.9 Stress-Strain of GA Treated Porcine Sclera......................... II-18
Figure 2.10 Stress-Strain Curves of Porcine Cornea............................. II-20
Figure 2.11 Log Plot of Porcine Cornea Stress-Strain Curve ............... II-20
Figure 2.12 Association of Modulus Values to Prestress...................... II-21
Figure 2.13 Straightening Tissue for Loading....................................... II-23
Figure 2.14 Rheometry System for Biological Specimens ................... II-25
Figure 2.15 Percent Compression During Loading............................... II-25
Figure 2.16 GA Crosslinked Sclera ....................................................... II-28
Figure 2.17 NaCl-Concentration-Dependent Modulus ......................... II-30
Figure 2.18 In Situ NaCl-Concentration Dependence........................... II-30
Figure 2.19 In Situ pH-Dependent Modulus ......................................... II-32
Figure 2.20 In Situ pH-Reversible Effects............................................. II-33
xiiFigure 2.21 In Situ Temperature-Dependent Modulus ......................... II-34
Figure 2.22 Button and Whole Eye Expansion ..................................... II-36
Figure 2.23 Intact Globe Expansion Setup ............................................ II-39
Figure 2.24 Variability from Initial Loading ......................................... II-41
Figure 2.25 High- and Low-Pressure Expansion................................... II-43
Figure 2.26 GA Crosslinking Prevents Expansion................................ II-44
Table 2.1 Incubations in Different pH Solutions ................................. II-31
Table 2.2 Rabbit Eye Initial Dimensions ............................................. II-41
Chapter 3 Figure 3.1 Photoinitiators ........................................................................III-5
Figure 3.2 Photorheology Setup..............................................................III-7
Figure 3.3 Gelatin Modulus Change During Irradiation ........................III-8
Figure 3.4 Spatial Control of Light-Activated Crosslinking................III-10
Figure 3.5 Safe Light Doses for Posterior Illumination .......................III-13
Table 3.1 Biocompatibility of Eosin Y .................................................III-5
Table 3.2 Light Absorption Values for Posterior Illumination ..........III-12
Chapter 4 Figure 4.1 Concentration- and Oxygen-Dependent Polymerizations ... IV-6
Figure 4.2 Crosslinking With or Without PEGDM............................... IV-9
Figure 4.3 Effect of PEGDM Crosslinking on Eye Expansion........... IV-11
Figure 4.4 Penetration of Fluorescein-PEGM Within Sclera.............. IV-13
Table 4.1 Solutions for In Vivo Testing of PEGDM .......................... IV-10
Chapter 5 Figure 5.1 Setups for In Vitro Light Delivery .........................................V-7
Figure 5.2 In Vivo Drug and Light Delivery..........................................V-11
xiiiFigure 5.3 Controlled Subconjunctival Injection of Eosin Y................V-14
Figure 5.4 Guinea Pig Irradiation Procedures .......................................V-15
Figure 5.5 Guinea Pig Form Deprivation Model...................................V-16
Figure 5.6 Measurement of Ocular Dimensions....................................V-18
Figure 5.7 Effect of 1x EY Treatment on Eye Expansion ....................V-19
Figure 5.8 Effect of Light Source on Eye Expansion............................V-20
Figure 5.9 Rabbit Sclera Histology........................................................V-22
Figure 5.10 Effect of In Vivo Treatment on Eye Expansion .................V-24
Figure 5.11 Guinea Pig Sclera Histology ..............................................V-25
Figure 5.12 Effect of 3x EY Treatment on Form Deprivation..............V-26
Figure 5.13 Effect of 10x EY on Normal Eye Growth .........................V-28
Figure 5.14 Effect of 10x EY on Individual Ocular Components ........V-30
Table 5.1 In Vivo Rabbit Treatment Variables ....................................V-11
Table 5.2 In Vivo Guinea Pig Treatment Variables.............................V-13
Chapter 6 Figure 6.1 Slit Lamp Apparatus for Fluorescent Imaging..................... VI-4
Figure 6.2 Slit Lamp Images of Fluorescent Profiles............................ VI-5
Figure 6.3 Penetration With or Without Intact Epithelium ................ VI-10
Figure 6.4 Effect of Epithelium on Perimeters of Expanding Eyes.... VI-11
Figure 6.5 Effect of Epithelium on 1x EY Treated Eyes .................... VI-12
Figure 6.6 Effect of Various Treatments on Eye Expansion............... VI-14
Table 6.1 Solutions for Penetration Studies......................................... VI-5
Table 6.2 Treatment Mixtures for Corneal Stability............................ VI-7
Table 6.3 Keratoconus Treatment Results ......................................... VI-14

xivSYMBOLS AND ABBREVIATIONS
AGE Advanced Glycation Endproduct
CD Corneal Diameter
CL Corneal Length
CP Corneal Perimeter
DPBS Dulbecco’s Phosphate-Buffered Saline
ED Equatorial Diameter
EY Eosin Y
G′ Storage Modulus
G″ Loss Modulus
GA Glyceraldehyde
GAG Glycosaminoglycan
HA Hyaluronic acid
I2959 Irgacure 2959
PBS Phosphate-Buffered Saline
SL Scleral Length
SP Scleral Perimeter
TEOA Triethanolamine
η Viscosity
σ Shear Stress
γ Shear Strain
γ& Strain Rate
I-1C h a p t e r 1
INTRODUCTION
1.1 Importance of Vision............................................................................ I-1 1.2 Diseases of the Eye—Myopia & Keratoconus.................................... I-3 1.2.1 Degenerative Myopia ........................................................................ I-5 1.2.2 Keratoconus....................................................................................... I-6 1.2.3 Corneal and Scleral Structure .......................................................... I-7 1.3 Importance of Mechanical Properties—Diseases & Measurements .. I-9 1.4 Potential Treatments........................................................................... I-10 1.4.1 Crosslinking..................................................................................... I-10 1.4.2 Photoactivated Crosslinking........................................................... I-13 1.5 Outline of Thesis ................................................................................ I-13 Bibliography ............................................................................................. I-15
"There is no better way to thank God for your sight than by giving a helping hand to someone in the dark."—Helen Keller
1.1 Importance of Vision
Our culture recognizes the importance of vision, and it is an integral part of our lives and
language. Vision allows processing of large amounts of information in a short period of
time: “A picture is worth a thousand words.” We associate the loss of sight with an
inability to cope in the world: “Like the blind leading the blind.” Our reluctance to lose
the ability to see has driven the creation of a world of research, medicine, and business
focused on restoring sight. Americans spend approximately $15 billion a year on eyewear,1
and the National Eye Institute estimates that the economic cost associated with visual
I-2disabilities in 2003 was nearly $63 billion.3 Our research, like many other peoples’
research, delves into the treatment of eye diseases in order to prevent eventual blindness.
To understand the nature of the two diseases we study (keratoconus and degenerative
myopia), it is important to understand the role that individual ocular components play in
allowing the eye to see. The eye is an amazing organ whose function is to collect light and
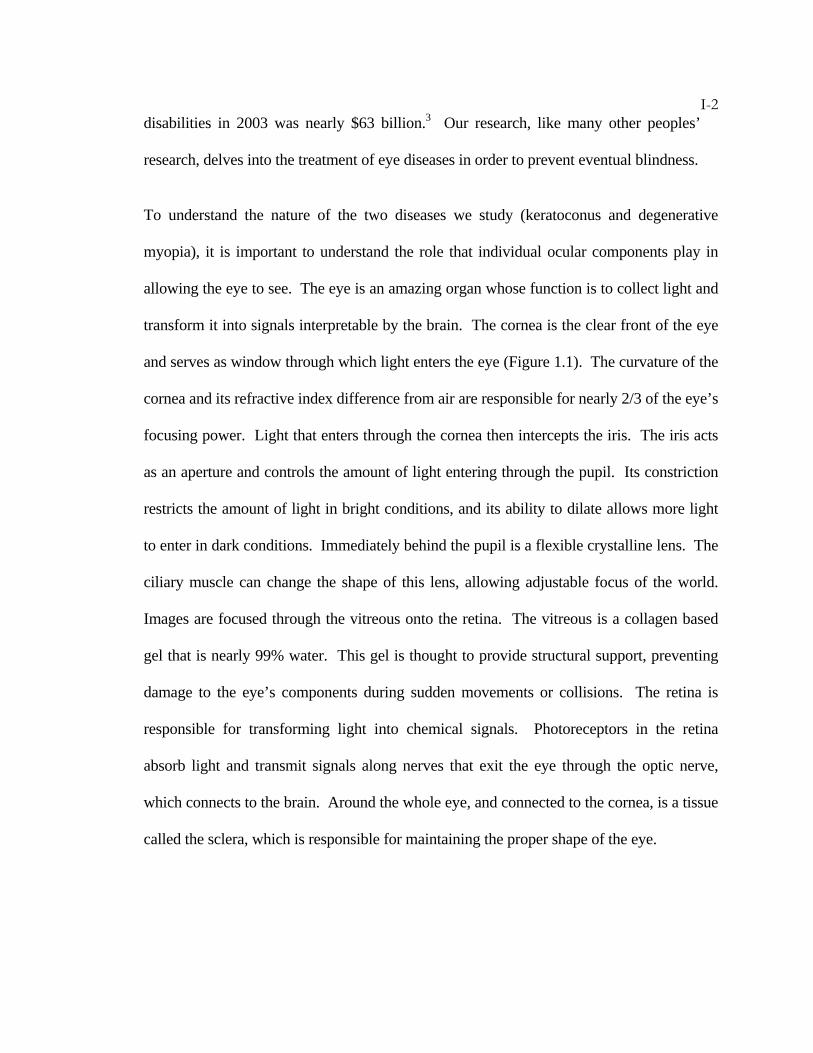
transform it into signals interpretable by the brain. The cornea is the clear front of the eye
and serves as window through which light enters the eye (Figure 1.1). The curvature of the
cornea and its refractive index difference from air are responsible for nearly 2/3 of the eye’s
focusing power. Light that enters through the cornea then intercepts the iris. The iris acts
as an aperture and controls the amount of light entering through the pupil. Its constriction
restricts the amount of light in bright conditions, and its ability to dilate allows more light
to enter in dark conditions. Immediately behind the pupil is a flexible crystalline lens. The
ciliary muscle can change the shape of this lens, allowing adjustable focus of the world.
Images are focused through the vitreous onto the retina. The vitreous is a collagen based
gel that is nearly 99% water. This gel is thought to provide structural support, preventing
damage to the eye’s components during sudden movements or collisions. The retina is
responsible for transforming light into chemical signals. Photoreceptors in the retina
absorb light and transmit signals along nerves that exit the eye through the optic nerve,
which connects to the brain. Around the whole eye, and connected to the cornea, is a tissue
called the sclera, which is responsible for maintaining the proper shape of the eye.
I-3
1.2 Diseases of the Eye—Myopia and Keratoconus
If any one of the ocular components does not function properly, vision is impaired and in
some cases, uncorrectable. The shape of the eye defined by the cornea and sclera plays a
great role in the ability to see clearly. In the proper shape, incoming light is bent by the
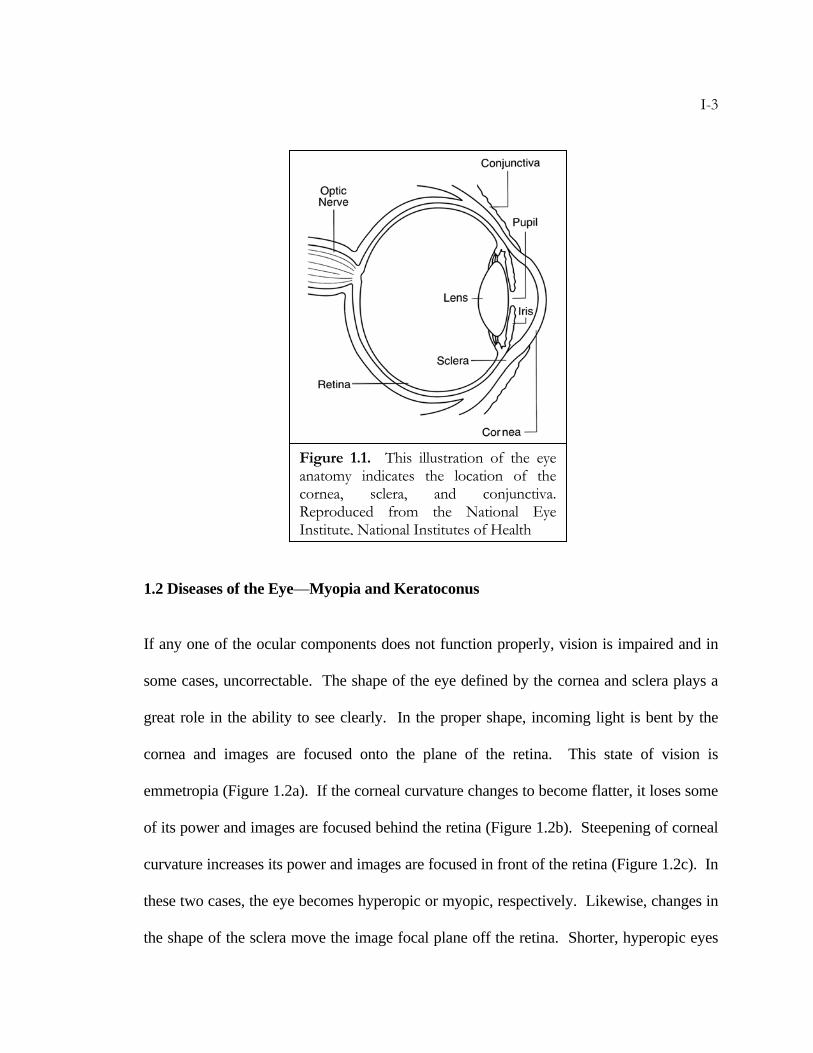
cornea and images are focused onto the plane of the retina. This state of vision is
emmetropia (Figure 1.2a). If the corneal curvature changes to become flatter, it loses some
of its power and images are focused behind the retina (Figure 1.2b). Steepening of corneal
curvature increases its power and images are focused in front of the retina (Figure 1.2c). In
these two cases, the eye becomes hyperopic or myopic, respectively. Likewise, changes in
the shape of the sclera move the image focal plane off the retina. Shorter, hyperopic eyes
Figure 1.1. This illustration of the eye anatomy indicates the location of the cornea, sclera, and conjunctiva. Reproduced from the National Eye Institute, National Institutes of Health
I-4have light focused behind the retina, while longer myopic eyes have light focused in
front of the retina. Without correction from spectacles, contacts, or surgery, vision is
impaired resulting in farsightedness (hyperopia) or nearsightedness (myopia) (Figure 2.1.g,
h).
Figure 1.2. A) In the emmetropic state, images are focused onto the plane of the retina. In hyperopia, images are focused behind the plane of the retina, and in myopia they are focused in front of the retina. B) A flatter cornea focuses images behind the retina, while C) a steeper cornea focuses light in front of the retina. D) A shorter eye moves the retina in front of the focal plane and E) a longer eye moves the retina behind the focal plane. Images from the National Eye Institute, National Institutes of Health depict eyesight with F) emmetropia, G) hyperopia, and H) myopia.
F) G) H)
I-5Diseases that create shape changes in either the sclera or the cornea are bound to effect
vision. Two diseases that we have studied in particular are degenerative myopia, which
creates an elongated eye through the thinning and stretching of the sclera, and keratoconus,
which creates a cone shaped cornea that bulges outward.
1.2.1 Degenerative myopia
Myopia affects 30% of the population in the U.S. and Europe, and 70–90% of the
population in some Asian countries.4-6 High myopia of greater than 8 diopters affects 0.2–
0.4% of the US population and up to 1% of the population in Asian countries.7-13
Degenerative myopia is classically defined as the form of myopia characterized by
progressive stretching and thinning of scleral tissues leading to globe elongation and to
posterior staphyloma formation (Figure 1.3a).12 As scleral tissues stretch and thin, there is
associated stretching of retinal and choroidal tissues that promotes visual loss. While
visual loss from macular atrophy and choroidal neovascularization are most common in
degenerative myopia, patients with this disease are also more prone to retinal detachment
and macular hole formation. Although a large population is affected by this disease
worldwide, there is currently no effective method to arrest progression and reduce the rate
of visual loss.
The excessive axial enlargement of the globe that occurs in degenerative myopia occurs
preferentially in the posterior pole. The causes of scleral thinning and stretching that occur
during this elongation are incompletely understood, but reduction of collagen fibril
diameter, enhanced turnover of scleral collagen, and alteration of scleral
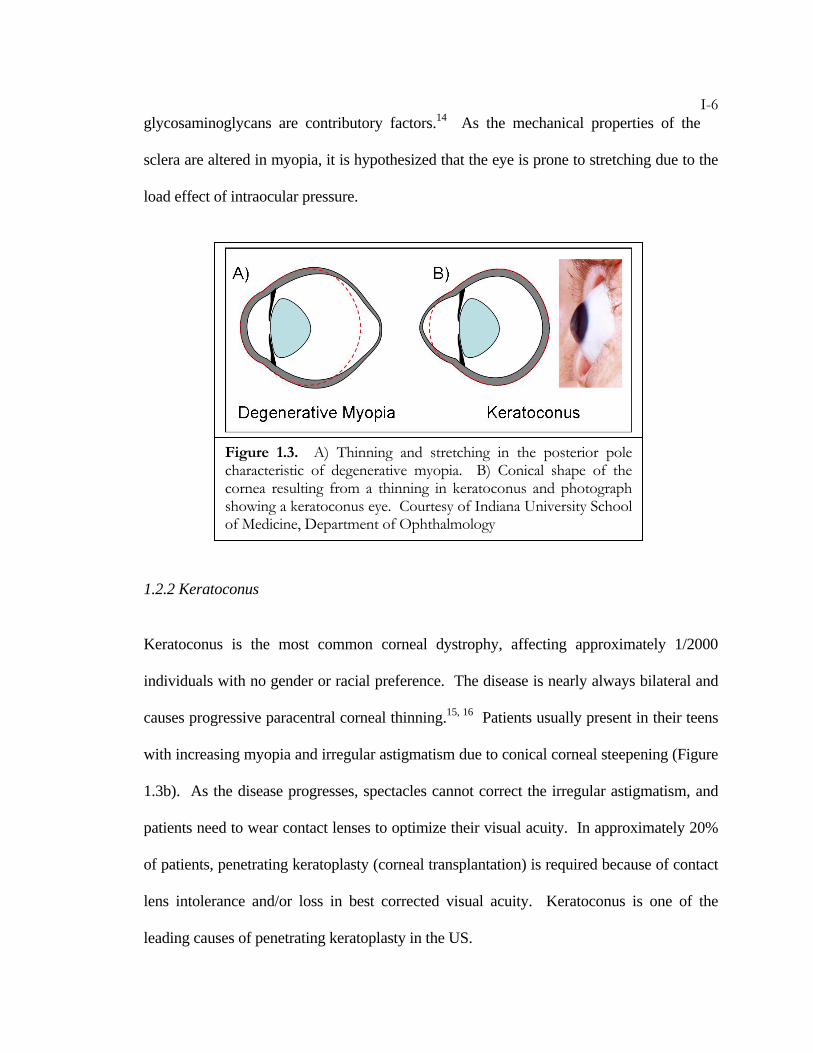
I-6glycosaminoglycans are contributory factors.14 As the mechanical properties of the
sclera are altered in myopia, it is hypothesized that the eye is prone to stretching due to the
load effect of intraocular pressure.
1.2.2 Keratoconus
Keratoconus is the most common corneal dystrophy, affecting approximately 1/2000
individuals with no gender or racial preference. The disease is nearly always bilateral and
causes progressive paracentral corneal thinning.15, 16 Patients usually present in their teens
with increasing myopia and irregular astigmatism due to conical corneal steepening (Figure
1.3b). As the disease progresses, spectacles cannot correct the irregular astigmatism, and
patients need to wear contact lenses to optimize their visual acuity. In approximately 20%
of patients, penetrating keratoplasty (corneal transplantation) is required because of contact
lens intolerance and/or loss in best corrected visual acuity. Keratoconus is one of the
leading causes of penetrating keratoplasty in the US.
Figure 1.3. A) Thinning and stretching in the posterior pole characteristic of degenerative myopia. B) Conical shape of the cornea resulting from a thinning in keratoconus and photograph showing a keratoconus eye. Courtesy of Indiana University School of Medicine, Department of Ophthalmology
I-7Clinical diagnosis of keratoconus is generally straightforward. In addition to
progressive myopia and astigmatism, various changes are evident at the slit lamp including
apical corneal thinning, iron line formation (Fleischer ring) at the base of the “cone”,
stromal scarring, and in some cases, corneal hydrops due to rupture of Descemet’s
membrane. Corneal topographical analysis has made it easier to quantify progression of
keratoconus as well as to detect subclinical disease (forme fruste keratoconus).17-19 The
latter has come into increasing focus because patients with forme fruste keratoconus who
undergo corneal refractive procedures, such as LASIK, can develop post-LASIK ectasia
requiring corneal transplantation.20-23 Given the growing frequency of corneal refractive
surgery, forme fruste keratoconus is increasingly recognized as an important
contraindication to excimer laser ablative procedures.
The genetic and molecular abnormalities underlying keratoconus are unknown. Increased
extracellular matrix degradative enzyme activity has been reported,24, 25 as has a mutation
in superoxide dismutase (SOD1) that might increase oxidative damage to the cornea.26
1.2.3 Corneal and Scleral Structure
In keratoconus and myopia, changes to the extracellular matrix and thinning of the tissue
result in a reduction of tissue strength and misshapen eyes. The corneal and scleral
extracellular matrices are composed of very similar components. Both tissues are 75–78%
water and the remaining mass consists mostly of collagen and glycosaminoglycans
(GAGs).27, 28 The majority of the dry mass is type I collagen. Collagen is a triple helix
molecule with glycine located at every third position along the protein. Collagen self
I-8assembles to form fibers of stacked molecules linked end to end, and these fibers
aggregate to form fibrils which can be arranged in lamellae. In addition to collagen, the
cornea and sclera also have GAGs, which are highly charged molecules formed of
dissacharide subunits. These GAGs can also connect to protein cores forming very large,
highly charged species—proteoglycans. These highly charged species attract water to the
tissue. The collagen and proteoglycans interact to form the extracellular matrix.
While the basic components are similar, differences in fibril arrangement give the cornea
and sclera distinct properties. The collagen fibers in the cornea have regular spacing
between them, and have a very narrow distribution of fiber diameters. The fibrils are
organized into layers with fibrils running parallel within the layer. Stacks of layers are
arranged with sequential layers having orthogonal fibers. Such carefully controlled
arrangement of the fibers creates the optically clear cornea. In the sclera, the fibers have a
large distribution of diameters, have irregular spacing, and although organizing into ribbons
of fibers, these ribbons interweave instead of stacking like in the cornea. All these
differences contribute to the scattering properties of the sclera that make it white instead of
clear.
Despite the differences in structure, the cornea and sclera are made of essentially the same
components, and a treatment for one tissue could possibly work for the other. Based on the
weakening of tissue in degenerative myopia and keratoconus, a way to alter the tissue and
restore mechanical stability could be a suitable treatment.
I-91.3 Importance of Mechanical Properties—Diseases and Measurements
As discussed in the previous section, changes to the cornea and sclera during keratoconus
and degenerative myopia result in changes of the mechanical properties of these tissues.
With the disease, they are more susceptible to stresses, and undergo deformations that
affect vision. The association of tissue mechanical state with proper function is seen in
other areas of the eye and other parts of the body as well. A stiff lens prevents adjustable
focus; a weakened lamina cribrosa contributes to pinching of the optic nerve in glaucoma.
In other parts of the body, stiffening of collagen and elastin in the skin causes wrinkles,
weakening of blood vessel walls can result in aneurysms, weakness of containing
membranes can result in hernia, and weakened bones in osteoporosis can increase risk of
bone fracture. While the healthy tissue has a mechanical state that allows proper function,
diseased tissue with an altered mechanical state is susceptible to failure. Treatments can be
developed with the goal of restoring proper mechanical state or replacing tissue with
something that matches the natural tissue mechanics.
In order to characterize the healthy, diseased, and treated tissue, it is necessary to quantify
the mechanical properties in each state. Ideally, tests on mechanical properties would be
done in vivo without altering the tissue. Unfortunately this is often difficult and testing
methods must be designed to mimic the types of stresses and strains experienced in vivo.
Furthermore, it may be necessary to exaggerate the stresses and strains in order to obtain
results that show a quantifiable difference between tissues within time limits imposed on
laboratory work. Reliable methods would maintain a tissue’s original condition as much as
possible and provide repeatable results. In Chapter 2, we compare tensile, shear, and
I-10expansion tests in order to evaluate variability of the methods and determine their
usefulness for characterizing cornea and sclera. In addition, intact globe expansion tests
provide a method of evaluating the treatments developed for keratoconus and myopia.
1.4 Potential Treatments
In our understanding of the disease state of keratoconus and degenerative myopia, we see
that a loss of the mechanical stability of the tissue leads to deformations that cause visual
problems. If however, there were methods of preventing the deformations, reinforcing the
tissue, and restoring mechanical stability, then there would be the possibility of treating
these diseases. Increasing the strength, or modulus, of the cornea and sclera might prevent
ocular distension and reduce progression of keratoconus and degenerative myopia.
This section discusses the use of crosslinkers as viable treatment options and, in particular,
discusses the merits of photoactivated systems. Such systems increase the ability to tailor
treatments to individual patients by providing spatial localization and temporal control of
crosslinking.
1.4.1 Crosslinking
Crosslinking in tissues occurs naturally with aging and is normally associated with
undesirable changes.2, 29-38 It causes stiffening of the skin, cartilage, heart, cornea, lens,
lung, arteries, and nearly every tissue with an abundance of extracellular matrix. This
stiffening is associated with wrinkling, osteoarthritis, cardiovascular disease, and vision
I-11problems. Many of the crosslinks are advanced glycation end-products (AGEs) that
result from the reaction of sugars with amine groups in proteins (Figure 3.1).39-44
An increased amount of AGEs is common in diabetics as a result of the inability to
properly control sugar levels in the body. This predisposes diabetics to many problems, but
interestingly, there is evidence that crosslinking of corneal collagen that occurs in diabetes
provides protection against keratoconus.45 Further, studies using common collagen
crosslinkers such as glyceraldehyde, methylglyoxal, and glutaraldehyde within the cornea
and sclera indicate that strength of the tissue is increased after crosslinking.46-50 Our
experiments with glyceraldehyde crosslinking show a greater than 300% increase in shear
modulus after crosslinking of sclera (Figure 2.16), and demonstrate the ability of
crosslinked eyes (cornea and sclera) to resist expansion at elevated intraocular pressures
(Figure 2.26).
The ability to use crosslinking agents to strengthen ocular tissues and prevent expansion is
not attractive clinically. The extent of crosslinking produced by a given dose of crosslinker
using the “Maillard reaction” (Figure 1.4) may prove difficult to control and monitor. The
initial reaction is reversible and does not necessarily lead to the formation of crosslinks:
the Schiff base undergoes modification, typically forming more stable Amadori products,
which tend to accumulate over time and through further modification may form crosslinks
or stable pendant adducts. The transition from Amadori product to AGE can take from
minutes to days, so that even after removal of excess sugars, continued crosslinking of
tissue occurs. This effect is evident in the additional 50% increase of the shear modulus
observed over the first 24 hours after rinsing excess glyceraldehyde from the sclera (Figure
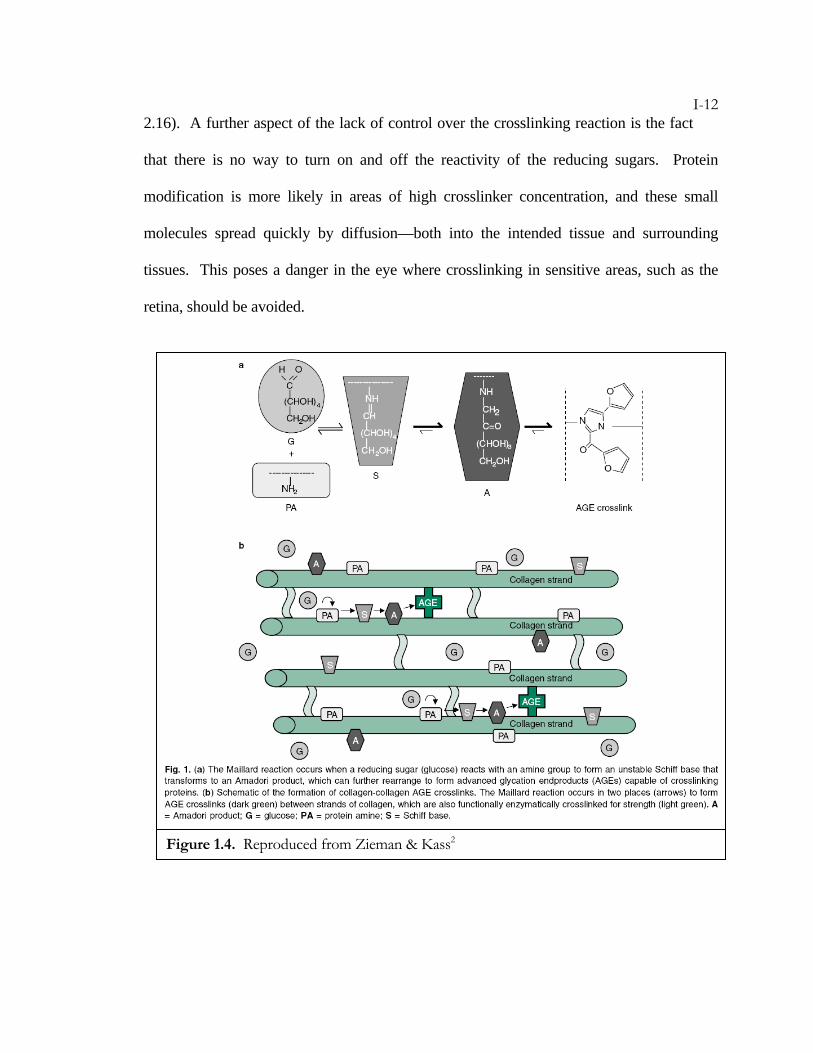
I-122.16). A further aspect of the lack of control over the crosslinking reaction is the fact
that there is no way to turn on and off the reactivity of the reducing sugars. Protein
modification is more likely in areas of high crosslinker concentration, and these small
molecules spread quickly by diffusion—both into the intended tissue and surrounding
tissues. This poses a danger in the eye where crosslinking in sensitive areas, such as the
retina, should be avoided.
Figure 1.4. Reproduced from Zieman & Kass2
I-131.4.2 Photoactivated Crosslinking
Photoactivated crosslinking provides a high degree of control that enables precise
treatments to avoid damaging sensitive areas of the eye, or even surrounding tissues.
Light-activated compounds could be delivered in the dark and allowed to diffuse to the
correct locations in tissue. Those locations could be selectively exposed to irradiation,
inducing crosslinking locally while adjacent tissue is unexposed and safe from
crosslinking. Further, the use of light activation could provide the ability to start
crosslinking with light exposure, and after achieving the desired level of crosslinks, stop
further reactions by turning off the light. Treatment location and strength could be
customized specifically for individual patients.
1.5 Outline of Thesis
The measurement techniques typically used for mechanical characterization of the cornea
and sclera have individual advantages and disadvantages that we evaluate in Chapter 2.
Our work has led to an improved intact globe expansion method that uses relatively simple
loading procedures, has low variability, and provides the ability to discriminate between
treatments that are developed specifically for keratoconus and degenerative myopia.
Chapters 3 and 4 discuss the treatment development process. Chapter 3 discusses
advantages of photoactivated systems including temporal and spatial control of the
reaction. The search for a biocompatible system that uses safe levels of light led to the
choice of a visible light-activated system using Eosin Y and triethanolamine. Chapter 4
presents the use of interpenetrating polymer networks to enhance mechanical properties of
I-14the tissue. Surprisingly, results show that polymer interpenetrating networks are not
necessary because crosslinking with initiator alone achieves comparable degrees of tissue
stabilization.
Chapters 5 and 6 illustrate the strengthening of sclera and cornea for the treatment of
myopia and keratoconus respectively. In Chapter 5, intact globe expansion tests are used to
determine the potential for treatments to stabilize eye shape in vivo and animal testing
provides biocompatibility as well as in vivo treatment responses. In Chapter 6, penetration
studies are used to demonstrate that treatment without removal of the epithelium may be
possible, and intact globe expansion tests show the visible-light-activated treatment
produces equivalent stabilization of the cornea compared to methods that are currently in
clinical trials.
I-15BIBLIOGRAPHY
1. Shoemaker, J.A. Vision Problems in the U.S. Prevalence of Adult Vision
Impairment and Age-Related Eye Disease in America. (Prevent Blindness
America, 2002).
2. Zieman, S.J., Kass, D.A. Advanced glycation endproduct crosslinking in the
cardiovascular system - Potential therapeutic target for cardiovascular disease.
Drugs 64, 459-470 (2004).
3. Ellwein, L.B. Updating the Hu 1981 Estimates of the Economic Costs of Visual
Disorders and Disabilities. (National Eye Institute, 2004).
4. Chow, Y.C., Dhillon, B.B., Chew, P.T., Chew, S.J. Refractive errors in
Singapore medical students. Singapore Medical Journal 45, 470-474 (1990).
5. Lin, L.L.K., Shih, Y.F., Hsiao, C.K., Chen, C.J., Lee, L.A., Hung, P.T.
Epidemiologic study of the prevalence and severity of myopia among school
children in Taiwan in 2000. Journal of the Formosan Medical Association 100, 684-
691 (2001).
6. Wong, T.Y., Foster, P.J., Hee, J.J., Ng, T.P., Tielsch, J.M., Chew, S.J., Johnson,
G.J., Seah, S.K. Prevalence and risk factors for refractive errors in adult
Chinese in Singapore. Investigative Ophthalmology & Visual Science 41, 2486-2494
(2000).
7. Tokoro, T. On the definition of pathologic myopia in group studies. Acta
Opthalmol Suppl 185, 107-108 (1998).
I-168. Sperduto, R.D., Seigel, D.D., Roberts, J.J., Rowland, M.M. Prevalence of
myopia in the United States. Archives of Ophthalmology, 405-407 (1983).
9. Tano, Y. Lix Edward Jackson memorial lecture - Pathologic myopia: Where
are we now? American Journal of Ophthalmology 134, 645-660 (2002).
10. Xu, L., Wang, Y.X., Li, Y.B., Wang, Y., Cui, T.T., Li, J.J., Jonas, J.B. Causes of
blindness and visual impairment in urban and rural areas in Beijing - The
Beijing eye study. Ophthalmology 113, 1134-1141 (2006).
11. Hsu, W.M., Cheng, C.Y., Liu, J.H., Tsai, S.Y., Chou, P. Prevalence and causes
of visual impairment in an elderly Chinese population in Taiwan - The Shihpai
Eye Study. Ophthalmology 111, 62-69 (2004).
12. Curtin, B.J. The myopias : basic science and clinical management. (Lippincott Williams
& Wilkins, 1985).
13. Iwase, A., Araie, M., Tomidokoro, A., Yamamoto, T., Shimizu, H., Kitazawa,
Y., Grp, T.S. Prevalence and causes of low vision and blindness in a Japanese
adult population - The Tajimi Study. Ophthalmology 113, 1354-1362 (2006).
14. McBrien, N.A., Gentle, A. Role of the sclera in the development and
pathological complications of myopia. Progress In Retinal And Eye Research 22,
307-338 (2003).
15. Krachmer, J.H., Feder, R.S., Belin, M.W. Keratoconus And Related
Noninflammatory Corneal Thinning Disorders. Survey Of Ophthalmology 28, 293-
322 (1984).
16. Rabinowitz, Y.S. Keratoconus. Survey Of Ophthalmology 42, 297-319 (1998).
I-1717. Buhren, J., Kuhne, C., Kohnen, T. Defining subclinical keratoconus using
corneal first-surface higher-order aberrations. American Journal of Ophthalmology
143, 381-389 (2007).
18. Rabinowitz, Y.S., Garbus, J., Mcdonnell, P.J. Computer-Assisted Corneal
Topography in Family Members of Patients with Keratoconus. Archives of
Ophthalmology 108, 365-371 (1990).
19. Salabert, D., Cochener, B., Mage, F., Colin, J. Keratoconus and Corneal
Familial Topographic Abnormalities. Journal Francais D Ophtalmologie 17, 646-
656 (1994).
20. Binder, P.S., Lindstrom, R.L., Stulting, R.D., Donnenfeld, E., Wu, H.,
McDonnell, P., Rabinowitz, Y. Keratoconus and corneal ectasia after LASIK.
Journal of Cataract and Refractive Surgery 31, 2035-2038 (2005).
21. Faraj, H.G., Gatinel, D., Chastang, P.J., Thanh, H.X. Corneal ectasia after
LASIK. Journal of Cataract and Refractive Surgery 29, 220 (2003).
22. Randleman, J.B. Post-laser in-situ keratomileusis ectasia: current understanding
and future directions. Current Opinion in Ophthalmology 17, 406-412 (2006).
23. Randleman, J.B., Russell, B., Ward, M.A., Thompson, K.P., Stulting, R.D. Risk
factors and prognosis for corneal ectasia after LASIK. Ophthalmology 110, 267-
275 (2003).
24. Smith, V.A., Easty, D.L. Matrix metalloproteinase 2: involvement in
keratoconus. European Journal of Ophthalmology 10, 215-226 (2000).
25. Smith, V.A., Hoh, H.B., Littleton, M., Easty, D.L. Over-Expression of a
Gelatinase a Activity in Keratoconus. Eye 9, 429-433 (1995).
I-1826. Udar, N., Atilano, S.R., Brown, D.J., Holguin, B., Small, K., Nesburn, A.B.,
Kenney, M.C. SOD1: A candidate gene for keratoconus. Investigative
Ophthalmology & Visual Science 47, 3345-3351 (2006).
27. Oyster, C.W. The Human Eye: Structure and Function. (Sinauer Associates, Inc.,
Sunderland, Massachusetts, 1999).
28. Watson, P.G., Young, R.D. Scleral structure, organisation and disease. A
review. Experimental Eye Research 78, 609-623 (2004).
29. Bailey, A.J. Molecular mechanisms of ageing in connective tissues. Mechanisms
of Ageing and Development 122, 735-755 (2001).
30. Forrester, J.V. Aging and vision. British Journal of Ophthalmology 81, 809-810
(1997).
31. Monnier, V.M., Mustata, G.T., Biemel, K.L., Reihl, O., Lederer, M.O., Dai,
Z.Y., Sell, D.R. Cross-linking of the extracellular matrix by the Maillard
reaction in aging and diabetes - An update on "a puzzle nearing resolution".
Maillard Reaction: Chemistry at the Interface of Nutrition, Aging, and Disease 1043, 533-
544 (2005).
32. Peppa, M., Uribarri, J., Vlassara, H. Advanced glycoxidation. A new risk factor
for cardiovascular disease? Cardiovasc Toxicol 2, 275-87 (2002).
33. Singh, R., Barden, A., Mori, T., Beilin, L. Advanced glycation end-products: a
review. Diabetologia 44, 129-146 (2001).
34. Singh, R., Barden, A., Mori, T., Beilin, L. Advanced glycation end-products: a
review (vol 44, pg 129, 2001). Diabetologia 45, 293 (2002).
35. Stitt, A.W. Advanced glycation: an important pathological event in diabetic and
age related ocular disease. British Journal of Ophthalmology 85, 746-753 (2001).
I-1936. Verzijl, N., DeGroot, J., Ben Zaken, C., Braun-Benjamin, O., Maroudas, A.,
Bank, R.A., Mizrahi, J., Schalkwijk, C.G., Thorpe, S.R., Baynes, J.W., Bijlsma,
J.W.J., Lafeber, F.P.J.G., TeKoppele, J.M. Crosslinking by advanced glycation
end products increases the stiffness of the collagen network in human articular
cartilage - A possible mechanism through which age is a risk factor for
osteoarthritis. Arthritis and Rheumatism 46, 114-123 (2002).
37. Wautier, J.L., Guillausseau, P.J. Advanced glycation end products, their
receptors and diabetic angiopathy. Diabetes & Metabolism 27, 535-542 (2001).
38. Cai, W.J., Zhu, L., Chen, X., Uribarri, J., Peppa, M. Association of advanced
glycoxidation end products and inflammation markers with thrombosis of
arteriovenous grafts in hemodialysis patients. American Journal of Nephrology 26,
181-185 (2006).
39. Booth, A.A., Khalifah, R.G., Todd, P., Hudson, B.G. In vitro kinetic studies of
formation of antigenic advanced glycation end products (AGEs) - Novel
inhibition of post-Amadori glycation pathways. Journal of Biological Chemistry
272, 5430-5437 (1997).
40. Cho, S.J., Roman, G., Yeboah, F., Konishi, Y. The road to advanced glycation
end products: A mechanistic perspective. Current Medicinal Chemistry 14, 1653-
1671 (2007).
41. Price, D.L., Rhett, P.M., Thorpe, S.R., Baynes, J.W. Chelating activity of
advanced glycation end-product inhibitors. Journal of Biological Chemistry 276,
48967-48972 (2001).
I-2042. Reihsner, R., Pfeiler, W., Menzel, E.J. Comparison of normal and in vitro aging
by non-enzymatic glycation as verified by differential scanning calorimetry.
Gerontology 44, 85-90 (1998).
43. Shangari, N., Chan, T.S., Chan, K., Wu, S.H., O'Brien, P.J. Copper-catalyzed
ascorbate oxidation results in glyoxal/AGE formation and cytotoxicity.
Molecular Nutrition & Food Research 51, 445-455 (2007).
44. Tessier, F.J., Monnier, V.M., Sayre, L.M., Kornfield, J.A. Triosidines: novel
Maillard reaction products and cross-links from the reaction of triose sugars
with lysine and arginine residues. Biochemical Journal 369, 705-719 (2003).
45. Seiler, T., Huhle, S., Spoerl, E., Kunath, H. Manifest diabetes and keratoconus:
A retrospective case-control study. Graefes Archive For Clinical And Experimental
Ophthalmology 238, 822-825 (2000).
46. Mattson, M., Schwartz, D.M., Kornfield, J.A. Mechanical measurements of
sclera for screening myopia treatments. Investigative Ophthalmology & Visual
Science 46 (2005).
47. Spoerl, E., Boehm, A.G., Pillunat, L.E. The influence of various substances on
the biomechanical behavior of lamina cribrosa and peripapillary sclera.
Investigative Ophthalmology & Visual Science 46, 1286-1290 (2005).
48. Spoerl, E., Boehm, A.G., Valtink, M., Pillunat, L.E. Changes of biomechanical
properties of lamina cribrosa and of peripapillary sclera by glyceraldehyde.
Investigative Ophthalmology & Visual Science 45, U789 (2004).
49. Tessier, F.J., Tae, G., Monnier, V.M., Kornfield, J.A. Rigidification of corneas
treated in vitro with glyceraldehyde characterization of two novel crosslinks
I-21and two chromophores. Investigative Ophthalmology & Visual Science 43, U892
(2002).
50. Tae, G., Dickinson, M.E., Louie, A., Kornfield, J.A., Park, J.Y., Lambert, R.W.,
Rich, K.A., Karageozian, H.L. Crosslinking effects of glycerose on rabbit and
human corneas: Rheological and microscopical studies. Investigative
Ophthalmology & Visual Science 41, S693 (2000).
II-1C h a p t e r 2
MECHANICAL MEASUREMENTS
2.1 Introduction to the Field of Biomechanics ......................................... II-1 2.2 Principles Behind Measurements........................................................ II-3 2.3 Techniques in the Field ....................................................................... II-5 2.4 Strengths and Limitations of Alternative Techniques: Illustration in Cornea and Sclera..................................................... II-9 2.4.1 Uniaxial Tensile Tests .................................................................... II-10 2.4.2 Oscillatory Shear Rheology ........................................................... II-21 2.4.3 Intact Globe Expansion Test .......................................................... II-35 Bibliography ............................................................................................ II-46
This work includes contributions from Joyce Huynh, Muzhou Wang, and Meredith
Wiseman. Undergraduates Muzhou Wang and Meredith Wiseman contributed to the
method development necessary for tensile tests and intact globe expansion, respectively.
Graduate student Joyce Huynh assisted with intact globe expansion experiments during her
first year.
2.1 Introduction to the Field of Biomechanics
The field of biomechanics has arisen from a desire to understand how living things work.
One of the earliest texts relating to biomechanics came from Aristotle’s writing “On the
Parts of Animals” (394–322 B.C.). Other contributors to the field include Galileo Galilei,
Robert Hooke, Isaac Newton, and Thomas Young. Contributions from them and many
others help us understand things ranging from blood flow and respiration to locomotion and
talking.
II-2Findings related to the human body have greatly advanced medicine. Respirators assist
with breathing, artificial heart valves replace faulty ones, and bones and joints are replaced
with prosthetic devices. Advances within medicine have relied on methodology of
engineering and biomechanics to understand problems associated with diseased, injured, or
broken systems in relation to healthy working systems. Characterization of bones has lead
to earlier detection of osteoporosis, better joint materials, and even injectable materials to
fill the holes and gaps in damaged bones.
In relation to the eye, there are obvious mechanical changes of the sclera and cornea
associated with degenerative myopia and keratoconus (Chapters 1, 5, & 6).
Characterization of these changes could be useful for understanding and diagnosing the
diseases. Understanding the changes that occur could also lead to new insights for treating
or preventing the diseases. In addition, clinical treatments aimed at modifying the
mechanical properties of the cornea and sclera can be evaluated using methods of
biomechanics.
In this chapter we present methods used for the characterization of the cornea and sclera,
and we evaluate the reliability of the methods based on the variability of results and the
relationship to in vivo conditions. Our findings indicate that results are often method-
dependent, and for studies related to keratoconus and degenerative myopia, there are
advantages in using an intact globe method that maintains an almost natural configuration
of the tissue.
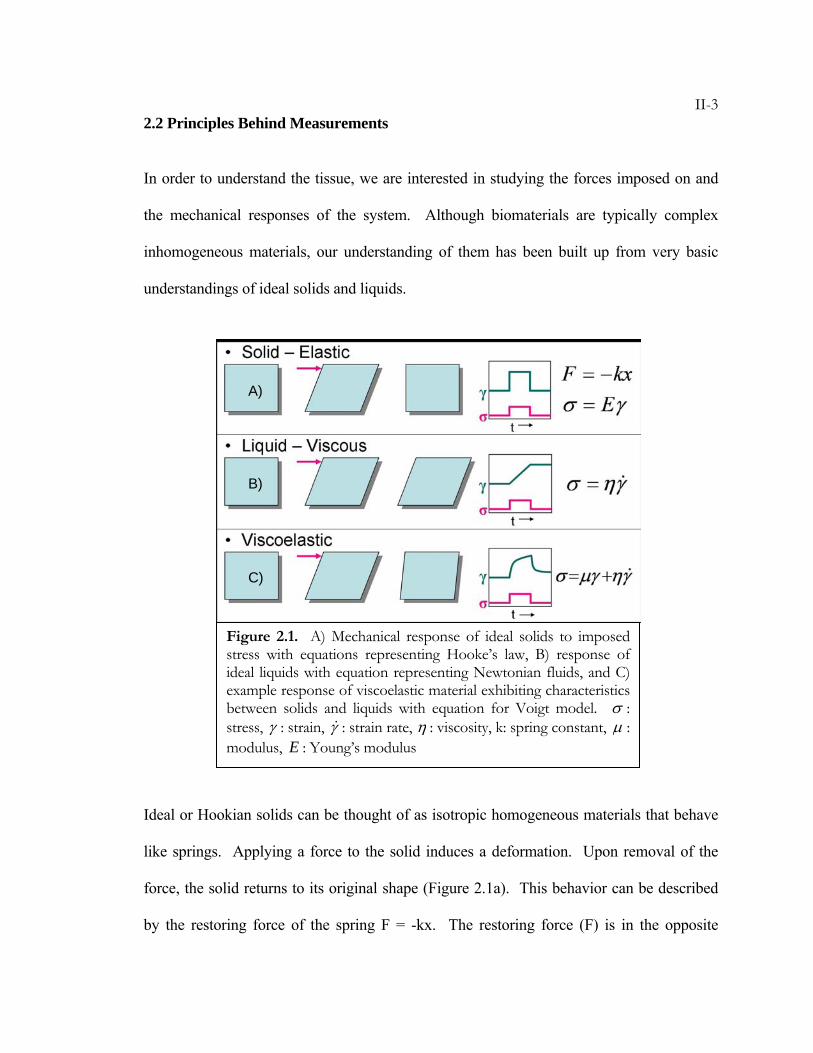
II-32.2 Principles Behind Measurements
In order to understand the tissue, we are interested in studying the forces imposed on and
the mechanical responses of the system. Although biomaterials are typically complex
inhomogeneous materials, our understanding of them has been built up from very basic
understandings of ideal solids and liquids.
Ideal or Hookian solids can be thought of as isotropic homogeneous materials that behave
like springs. Applying a force to the solid induces a deformation. Upon removal of the
force, the solid returns to its original shape (Figure 2.1a). This behavior can be described
by the restoring force of the spring F = -kx. The restoring force (F) is in the opposite
Figure 2.1. A) Mechanical response of ideal solids to imposed stress with equations representing Hooke’s law, B) response of ideal liquids with equation representing Newtonian fluids, and C) example response of viscoelastic material exhibiting characteristics between solids and liquids with equation for Voigt model. σ : stress, γ : strain, γ& : strain rate, η : viscosity, k: spring constant, μ : modulus, E : Young’s modulus
A)
B)
C)
II-4direction of the imposed deformation (x) and the magnitude of the force depends on
material properties of the spring, which are defined by the spring constant (k). Because
samples are often different sizes, it is essential to look at the forces relative to sample size
in order to isolate the material properties. For this, we examine the stress (σ, force per unit
cross-sectional area) that is proportional to strain (γ, a dimensionless measure of
deformation). Higher strains create higher stress in the material, or application of higher
stresses creates larger strains. The proportionality of stress and strain contains information
regarding the material properties and is named Young’s modulus, or the elastic modulus
(E).
For ideal or Newtonian liquids, it is helpful to think of water flowing through a pipe. If
you apply a force to it, water flows along the pipe. If you stop applying a force, then flow
stops. There is no restoring force causing the water to return through the pipe (Figure
2.1b). In this case, the amount of deformation is dependent on how long the force is
applied; the force is proportional to the deformation rate. As we increase the stress on the
liquid, it deforms at a higher strain rate (γ& ), or if we increase the strain rate, we increase
the stress in the liquid. The material properties governing this relation are defined in η,
which is the viscosity of the liquid. Under the same stress, a more viscous liquid (honey)
flows slower than a less viscous liquid (water).
Most materials cannot be accurately described by either the ideal solid or ideal liquid, but
are more appropriately described by a combination of these. Silly Putty™ demonstrates the
combination of elastic and viscous properties. If you throw a ball of Silly Putty against the
floor it will bounce up retaining its normal shape. During the interaction with the floor, it
II-5acts like a solid, deforming as it hits, but using a restoring force to bounce back. If you
slowly pull on Silly Putty it will stretch and elongate. When you stop pulling, the Silly
Putty has flowed or creeped and will not return to its original shape. Materials such as Silly
Putty, which behave like solids under some conditions and liquids under others, are
classified as viscoelastic.
The cornea and sclera are viscoelastic materials that typically exhibit elastic behavior while
under physiological stresses. However, under normal intraocular pressures, the cornea and
sclera creep in keratoconus and degenerative myopia. This creep is what results in the
corneal bulging and axial elongation characteristic of the diseases. Characterization of the
elastic and viscous properties of the tissues is essential for understanding the diseases and
developing appropriate treatments.
2.3 Techniques in the Field
The ability to characterize the mechanical properties of biomaterials lies in the ability to
make measurements of the material response to stress and strain. Typically, this is done by
applying one (e.g., stress) and recording the other (e.g., strain or strain rate). The way in
which this is done depends in large part on the type of behavior that is being analyzed. The
bones and spinal column bear compressive forces due to the weight of the body, tendons
are subjected to cyclic tensile stresses, the skin is stretched over the body, blood vessels
expand and contract with the pumping of blood, and bones shear past one another in the
joints. Because of the variety of forces and deformations to study, there are many
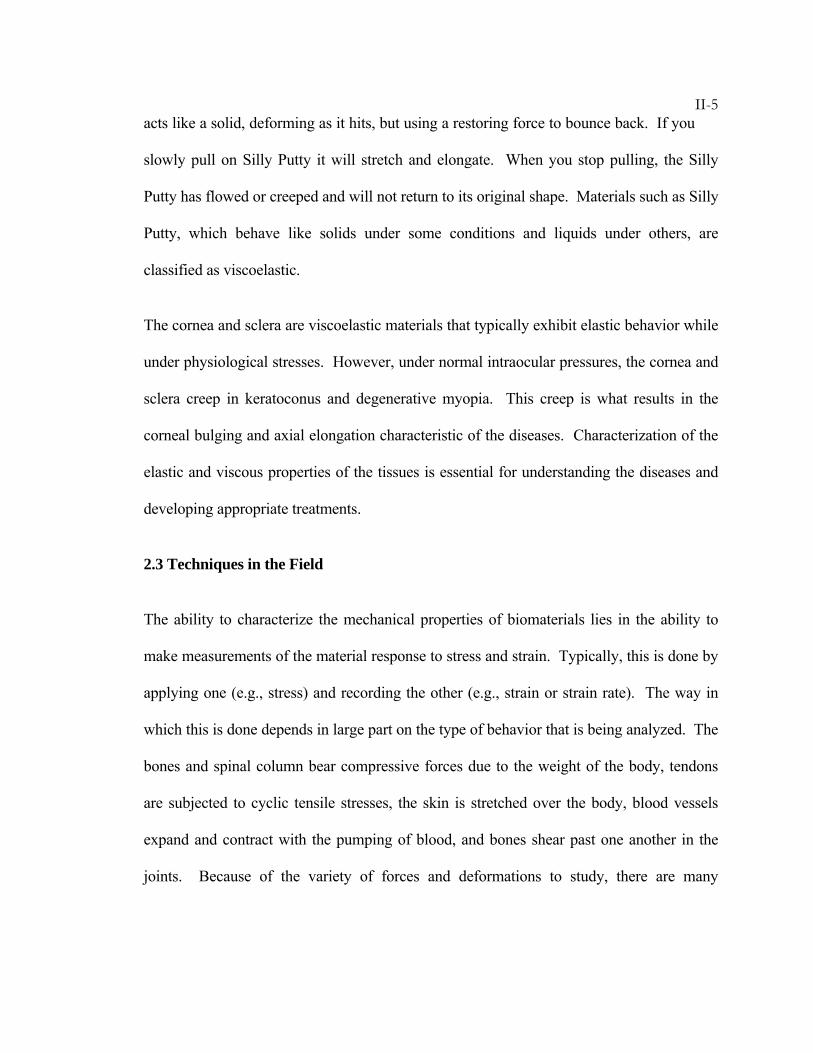
II-6techniques used in biomechanics (Figure 2.2). Also, some testing techniques are
developed specifically to replicate the in vivo conditions.
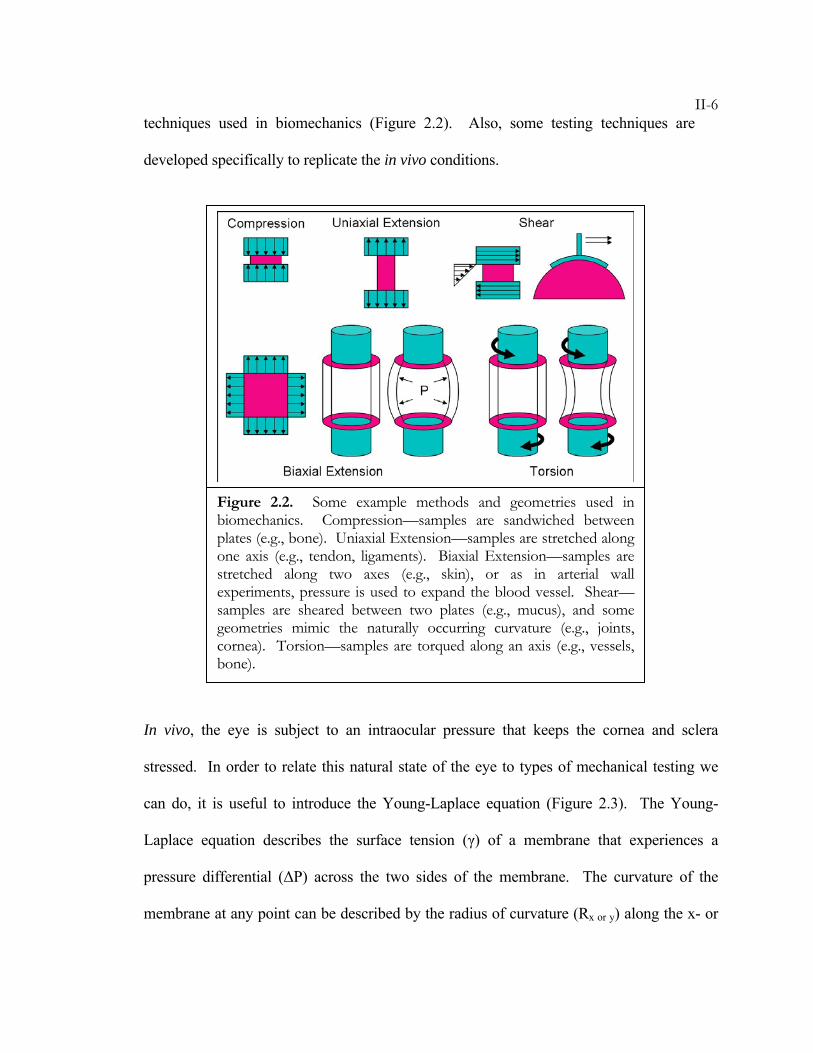
In vivo, the eye is subject to an intraocular pressure that keeps the cornea and sclera
stressed. In order to relate this natural state of the eye to types of mechanical testing we
can do, it is useful to introduce the Young-Laplace equation (Figure 2.3). The Young-
Laplace equation describes the surface tension (γ) of a membrane that experiences a
pressure differential (ΔP) across the two sides of the membrane. The curvature of the
membrane at any point can be described by the radius of curvature (Rx or y) along the x- or
Figure 2.2. Some example methods and geometries used in biomechanics. Compression—samples are sandwiched between plates (e.g., bone). Uniaxial Extension—samples are stretched along one axis (e.g., tendon, ligaments). Biaxial Extension—samples are stretched along two axes (e.g., skin), or as in arterial wall experiments, pressure is used to expand the blood vessel. Shear—samples are sheared between two plates (e.g., mucus), and some geometries mimic the naturally occurring curvature (e.g., joints, cornea). Torsion—samples are torqued along an axis (e.g., vessels, bone).
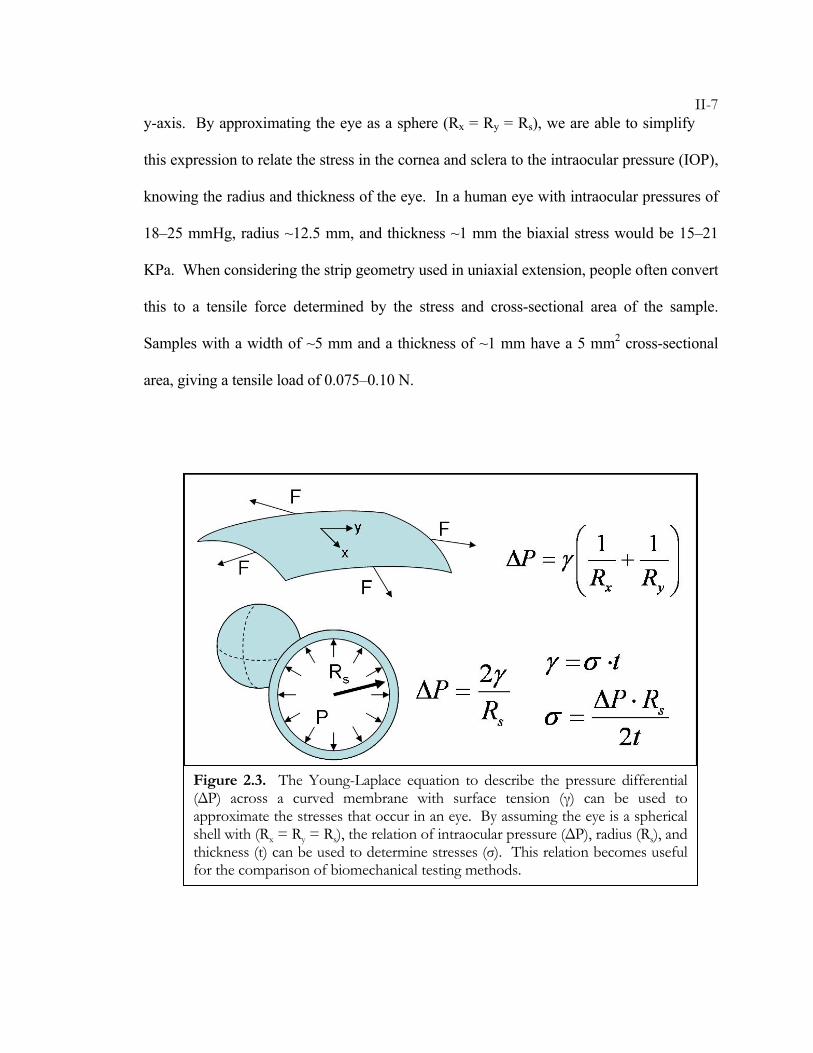
II-7y-axis. By approximating the eye as a sphere (Rx = Ry = Rs), we are able to simplify
this expression to relate the stress in the cornea and sclera to the intraocular pressure (IOP),
knowing the radius and thickness of the eye. In a human eye with intraocular pressures of
18–25 mmHg, radius ~12.5 mm, and thickness ~1 mm the biaxial stress would be 15–21
KPa. When considering the strip geometry used in uniaxial extension, people often convert
this to a tensile force determined by the stress and cross-sectional area of the sample.
Samples with a width of ~5 mm and a thickness of ~1 mm have a 5 mm2 cross-sectional
area, giving a tensile load of 0.075–0.10 N.
Figure 2.3. The Young-Laplace equation to describe the pressure differential (ΔP) across a curved membrane with surface tension (γ) can be used to approximate the stresses that occur in an eye. By assuming the eye is a spherical shell with (Rx = Ry = Rs), the relation of intraocular pressure (ΔP), radius (Rs), and thickness (t) can be used to determine stresses (σ). This relation becomes useful for the comparison of biomechanical testing methods.
II-8Cutting tissue samples for biomechanical testing removes the intraocular pressure and
natural stress from the specimen. Groups often condition samples to restore the specimen
to a state similar to in vivo. For example, application of a pre-stress equivalent to that
calculated using the Young-Laplace equation is used as a physiological starting point for
measurements. A load (e.g., ~0.1 N) is applied for a specified time and the tissue extends
under this stress. Unfortunately, the stress distribution in uniaxial tension (where this
method is often used) is different than that in biaxial tension and cannot properly simulate
in vivo conditions. Another method of conditioning the specimens is the application of
cyclic stresses to realign molecules within the sample, and in tensile tests it is often
repeated until the hysteresis in the stress-strain curves disappears. Removal of hysteresis
implies that the stresses are large enough to cause structural changes in the specimen.
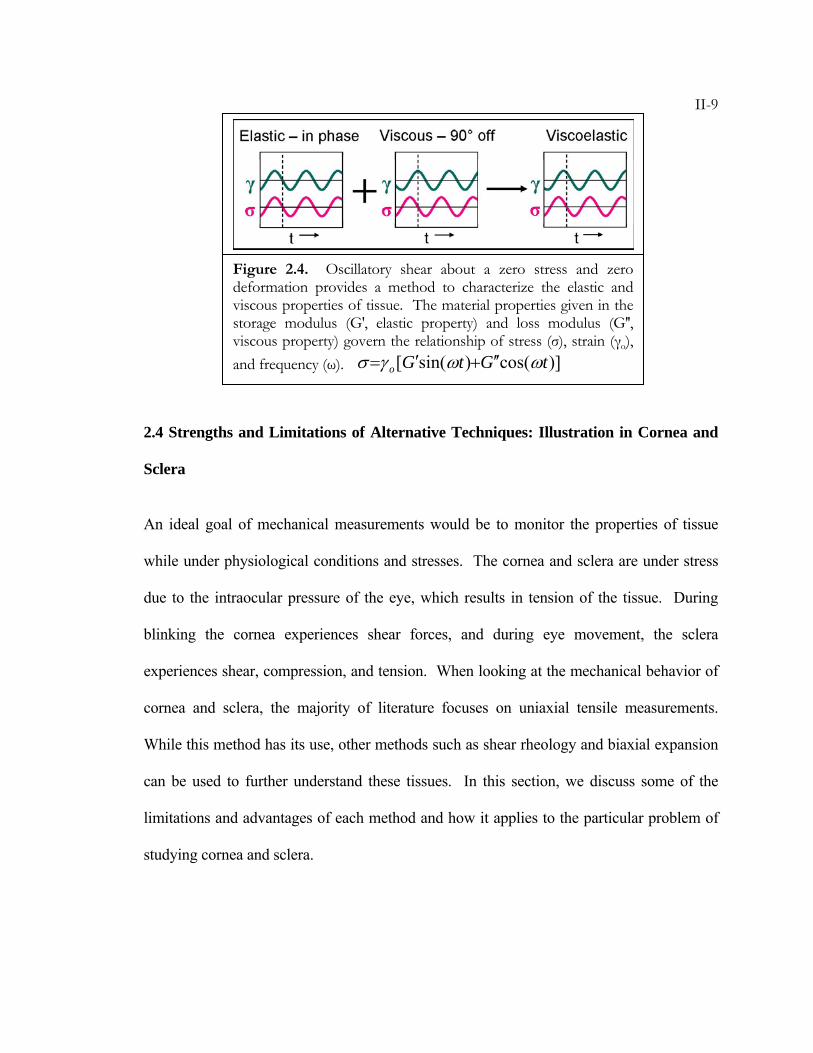
While the application of cyclic stresses is used to precondition tissue, application of small
oscillatory stresses can be used to probe the tissue without generating structural changes.
Small deformation oscillatory shear rheology oscillates the tissue around zero stress and
zero deformation (Figure 2.4). The components of the measured shear stress and strain that
are in phase contribute to the magnitude of the storage modulus (G′), which is related to the
elastic properties of the tissue. The components that are out of phase contribute to the
magnitude of the loss modulus (G′′), which is related to the viscous properties of the tissue.
If the stress and strain were large, it would be possible to monitor the structural changes of
the specimen, however the use of small stresses and deformations allows gentle probing of
the tissue.
II-9
2.4 Strengths and Limitations of Alternative Techniques: Illustration in Cornea and
Sclera
An ideal goal of mechanical measurements would be to monitor the properties of tissue
while under physiological conditions and stresses. The cornea and sclera are under stress
due to the intraocular pressure of the eye, which results in tension of the tissue. During
blinking the cornea experiences shear forces, and during eye movement, the sclera
experiences shear, compression, and tension. When looking at the mechanical behavior of
cornea and sclera, the majority of literature focuses on uniaxial tensile measurements.
While this method has its use, other methods such as shear rheology and biaxial expansion
can be used to further understand these tissues. In this section, we discuss some of the
limitations and advantages of each method and how it applies to the particular problem of
studying cornea and sclera.
Figure 2.4. Oscillatory shear about a zero stress and zero deformation provides a method to characterize the elastic and viscous properties of tissue. The material properties given in the storage modulus (G′, elastic property) and loss modulus (G′′, viscous property) govern the relationship of stress (σ), strain (γo), and frequency (ω). )]cos()sin([ tGtGo ωωγσ ′′+′=
II-102.4.1 Uniaxial Tensile Tests
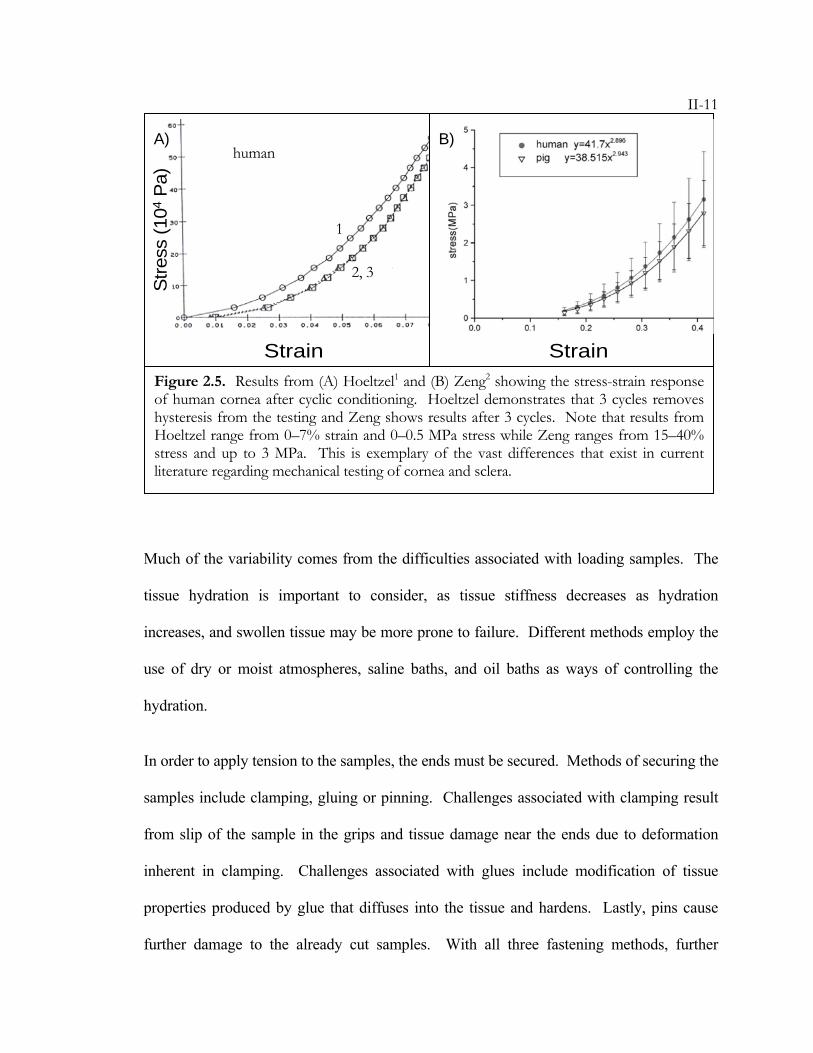
Extensive literature on tensile tests of cornea and sclera provides the majority of knowledge
regarding the mechanical properties of these tissues.1-23 However, there are surprising
differences between research groups’ reported stress-strain curves and modulus values
(e.g., Figure 2.5). Modulus values for human cornea were reported from 3.81±0.40 MPa
by Zeng2, up to 57±4.1 MPa by Andreassen.3 Friberg has reported values for human sclera
that differ from 2.9±1.4 MPa for anterior sclera and 1.8±1.1 MPa for posterior sclera7, and
Wollensak reported values as high as 22 MPa.22 The differences in modulus values are due
to differences in the particular measurement techniques and protocols used. While tensile
measurements appear straightforward—cut a rectangular strip of tissue and apply tension—
the variations in the sample preparation, clamping, pulling, stress history, and hydration all
play a role in the experimental outcome.
II-11
Much of the variability comes from the difficulties associated with loading samples. The
tissue hydration is important to consider, as tissue stiffness decreases as hydration
increases, and swollen tissue may be more prone to failure. Different methods employ the
use of dry or moist atmospheres, saline baths, and oil baths as ways of controlling the
hydration.
In order to apply tension to the samples, the ends must be secured. Methods of securing the
samples include clamping, gluing or pinning. Challenges associated with clamping result
from slip of the sample in the grips and tissue damage near the ends due to deformation
inherent in clamping. Challenges associated with glues include modification of tissue
properties produced by glue that diffuses into the tissue and hardens. Lastly, pins cause
further damage to the already cut samples. With all three fastening methods, further
Figure 2.5. Results from (A) Hoeltzel1 and (B) Zeng2 showing the stress-strain response of human cornea after cyclic conditioning. Hoeltzel demonstrates that 3 cycles removes hysteresis from the testing and Zeng shows results after 3 cycles. Note that results from Hoeltzel range from 0–7% strain and 0–0.5 MPa stress while Zeng ranges from 15–40% stress and up to 3 MPa. This is exemplary of the vast differences that exist in current literature regarding mechanical testing of cornea and sclera.
Strain Strain
human
1
2, 3
Stre
ss (1
04P
a)A) B)
II-12uncertainty in the measurement results from variability in configuration of the tissue
between the fixtures. Ideally, the sample should be parallel to the direction of tension, and
neither slack nor taut at the point of zero extension.
Unfortunately, samples are often slack upon loading, so there is uncertainty of the true
length of the tissue. Several methods have been used to provide a self-consistent zero
extension point for a set of measurements. For example, common practices include 1)
alignment of data, 2) pre-stressing, and 3) minimal initial stress. Alignment of data uses
features in the stress-strain curve (such as the elbow region) as registration points among a
data set to shift individual curves on top of each other. After the curves are aligned, a zero-
extension point is selected. Pre-stressing a sample involves imposing a specific, small
stress for a specified time, after which the desired test condition is imposed (typically a
specified crosshead speed or a specified load that is greater than the pre-stress load). The
length at the end of the “pre-stress period” is taken to be zero extension and calculations of
strain during the experiment relative to that length. The “minimal initial stress” method
uses the extension at which the stress reaches a small, specific value during tension as the
zero-extension point. In the experiments below, the minimal initial stress method was
used.
The variability in loading methods, tissue preparation, and testing procedures all add to the
uncertainty of results. The following experiments examine the variability of data that is
seen under conditions that minimize the variability, namely low stress (< 1 MPa) and low
strain (< 20%). To place the observed uncertainty in context, we compare two groups of
specimens: sclera specimens held for 12 hours in saline (making them somewhat softer
II-13than their initial state) and specimens held for 12 hours in glyceraldehyde solution
(making them much stiffer than their initial state). The experiments demonstrate the
inability of this method to characterize the changes that result from fairly extreme
crosslinking with glyceraldehyde.
Method: Eyes from 3–4 month old swine were ordered from Sierra for Medical Science
and stored in saline on ice until use within 72 hours post mortem. Orbital tissues were
removed and strips of either 3 or 5 mm width and approximately 20 mm length were cut
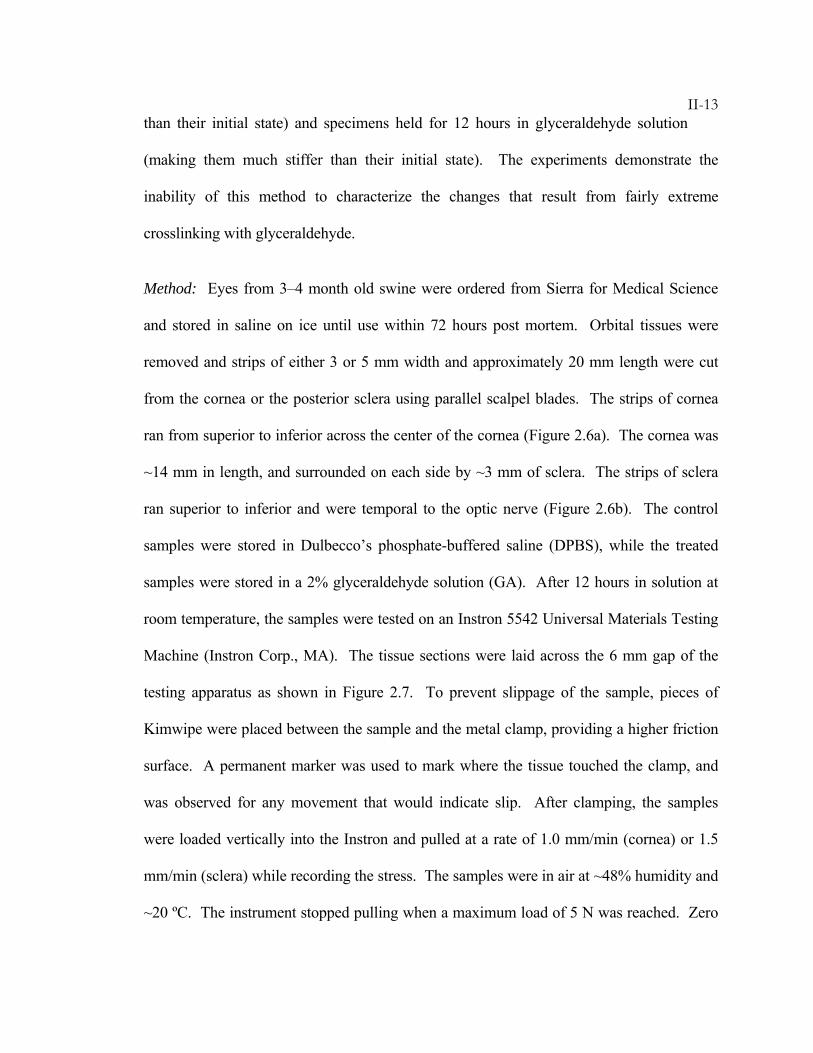
from the cornea or the posterior sclera using parallel scalpel blades. The strips of cornea
ran from superior to inferior across the center of the cornea (Figure 2.6a). The cornea was
~14 mm in length, and surrounded on each side by ~3 mm of sclera. The strips of sclera
ran superior to inferior and were temporal to the optic nerve (Figure 2.6b). The control
samples were stored in Dulbecco’s phosphate-buffered saline (DPBS), while the treated
samples were stored in a 2% glyceraldehyde solution (GA). After 12 hours in solution at
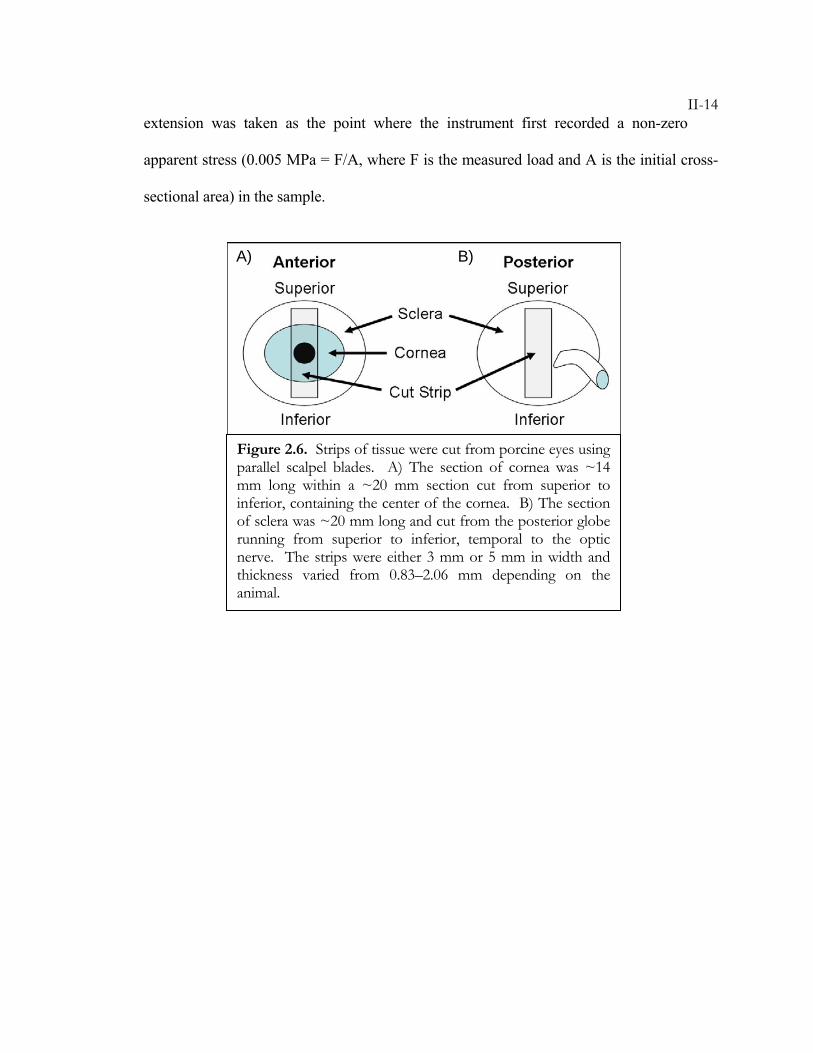
room temperature, the samples were tested on an Instron 5542 Universal Materials Testing
Machine (Instron Corp., MA). The tissue sections were laid across the 6 mm gap of the
testing apparatus as shown in Figure 2.7. To prevent slippage of the sample, pieces of
Kimwipe were placed between the sample and the metal clamp, providing a higher friction
surface. A permanent marker was used to mark where the tissue touched the clamp, and
was observed for any movement that would indicate slip. After clamping, the samples
were loaded vertically into the Instron and pulled at a rate of 1.0 mm/min (cornea) or 1.5
mm/min (sclera) while recording the stress. The samples were in air at ~48% humidity and
~20 ºC. The instrument stopped pulling when a maximum load of 5 N was reached. Zero
II-14extension was taken as the point where the instrument first recorded a non-zero
apparent stress (0.005 MPa = F/A, where F is the measured load and A is the initial cross-
sectional area) in the sample.
Figure 2.6. Strips of tissue were cut from porcine eyes using parallel scalpel blades. A) The section of cornea was ~14 mm long within a ~20 mm section cut from superior to inferior, containing the center of the cornea. B) The section of sclera was ~20 mm long and cut from the posterior globe running from superior to inferior, temporal to the optic nerve. The strips were either 3 mm or 5 mm in width and thickness varied from 0.83–2.06 mm depending on the animal.
A) B)
II-15
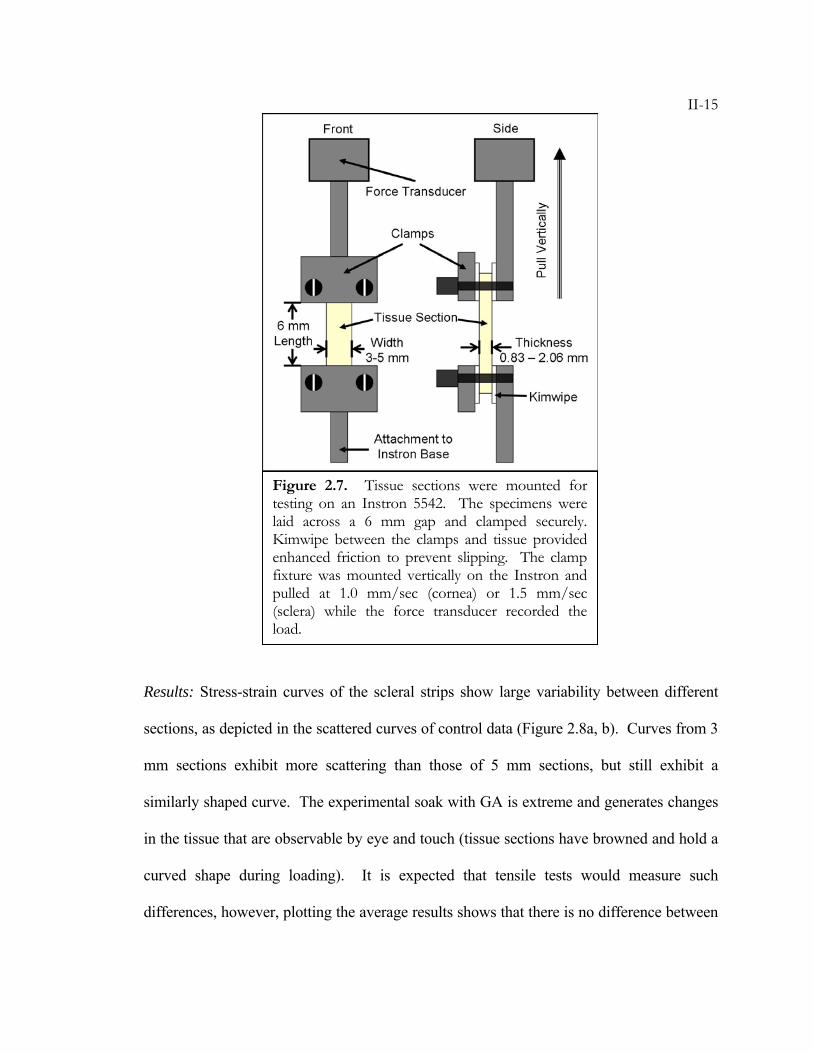
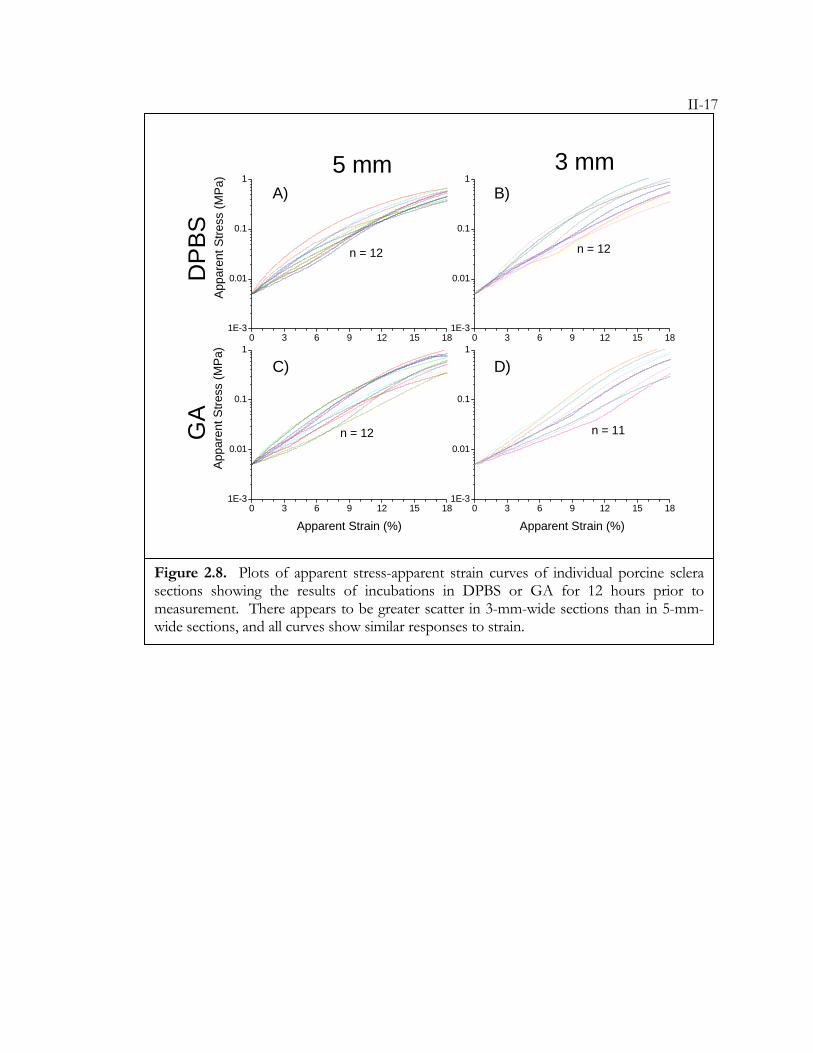
Results: Stress-strain curves of the scleral strips show large variability between different
sections, as depicted in the scattered curves of control data (Figure 2.8a, b). Curves from 3
mm sections exhibit more scattering than those of 5 mm sections, but still exhibit a
similarly shaped curve. The experimental soak with GA is extreme and generates changes
in the tissue that are observable by eye and touch (tissue sections have browned and hold a
curved shape during loading). It is expected that tensile tests would measure such
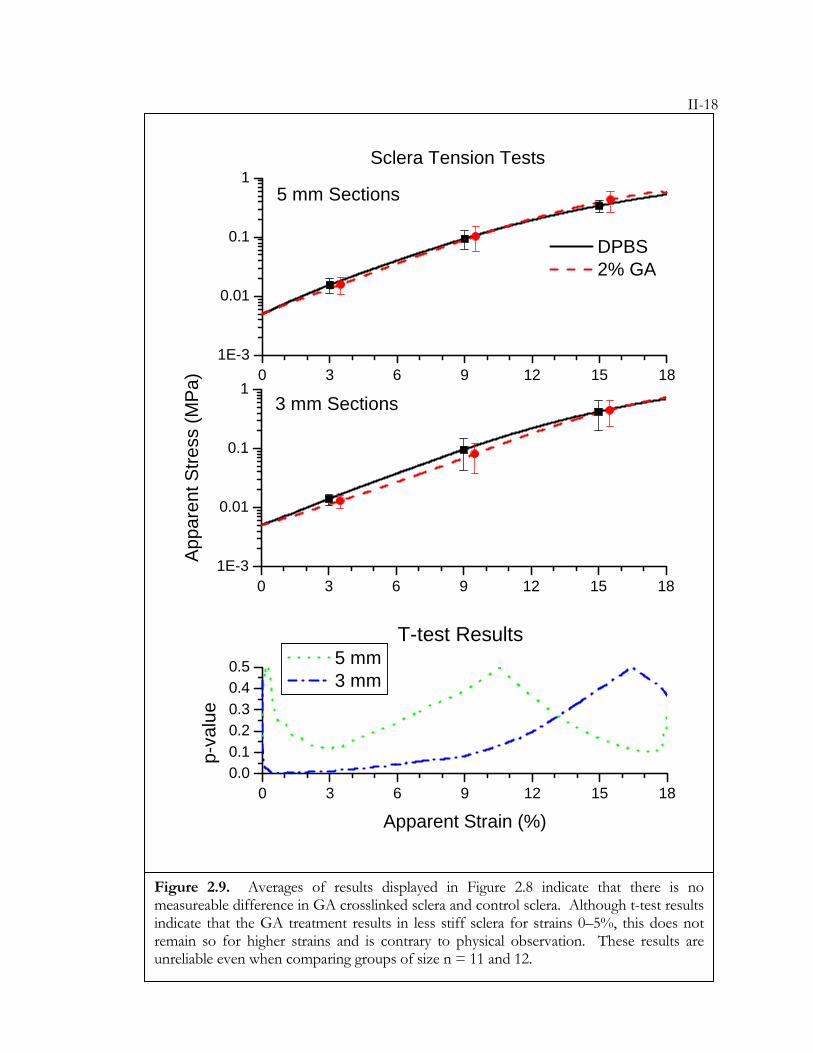
differences, however, plotting the average results shows that there is no difference between
Figure 2.7. Tissue sections were mounted for testing on an Instron 5542. The specimens were laid across a 6 mm gap and clamped securely. Kimwipe between the clamps and tissue provided enhanced friction to prevent slipping. The clamp fixture was mounted vertically on the Instron and pulled at 1.0 mm/sec (cornea) or 1.5 mm/sec (sclera) while the force transducer recorded the load.
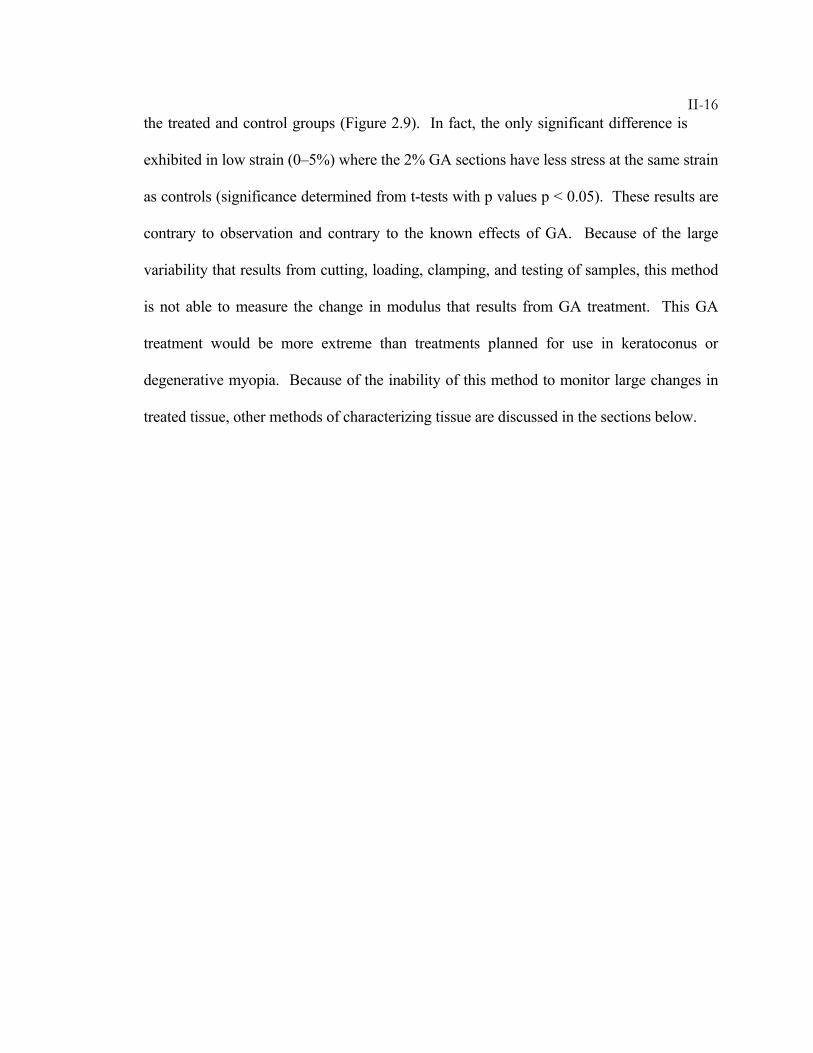
II-16the treated and control groups (Figure 2.9). In fact, the only significant difference is
exhibited in low strain (0–5%) where the 2% GA sections have less stress at the same strain
as controls (significance determined from t-tests with p values p < 0.05). These results are
contrary to observation and contrary to the known effects of GA. Because of the large
variability that results from cutting, loading, clamping, and testing of samples, this method
is not able to measure the change in modulus that results from GA treatment. This GA
treatment would be more extreme than treatments planned for use in keratoconus or
degenerative myopia. Because of the inability of this method to monitor large changes in
treated tissue, other methods of characterizing tissue are discussed in the sections below.
II-17
0 3 6 9 12 15 181E-3
0.01
0.1
1
0 3 6 9 12 15 181E-3
0.01
0.1
1
0 3 6 9 12 15 181E-3
0.01
0.1
1
0 3 6 9 12 15 181E-3
0.01
0.1
1
n = 12
Appa
rent
Stre
ss (M
Pa)
GA
DPB
S3 mm5 mm
n = 12
n = 12
App
aren
t Stre
ss (M
Pa)
Apparent Strain (%)
n = 11
Apparent Strain (%)
Figure 2.8. Plots of apparent stress-apparent strain curves of individual porcine sclera sections showing the results of incubations in DPBS or GA for 12 hours prior to measurement. There appears to be greater scatter in 3-mm-wide sections than in 5-mm-wide sections, and all curves show similar responses to strain.
A) B)
C) D)
II-18
0 3 6 9 12 15 181E-3
0.01
0.1
1
0 3 6 9 12 15 181E-3
0.01
0.1
1
0 3 6 9 12 15 180.00.10.20.30.40.5
DPBS 2% GA
5 mm SectionsA
ppar
ent S
tress
(MP
a)
3 mm Sections
Sclera Tension Tests
T-test Results
Apparent Strain (%)
p-va
lue
5 mm 3 mm
Figure 2.9. Averages of results displayed in Figure 2.8 indicate that there is no measureable difference in GA crosslinked sclera and control sclera. Although t-test results indicate that the GA treatment results in less stiff sclera for strains 0–5%, this does not remain so for higher strains and is contrary to physical observation. These results are unreliable even when comparing groups of size n = 11 and 12.
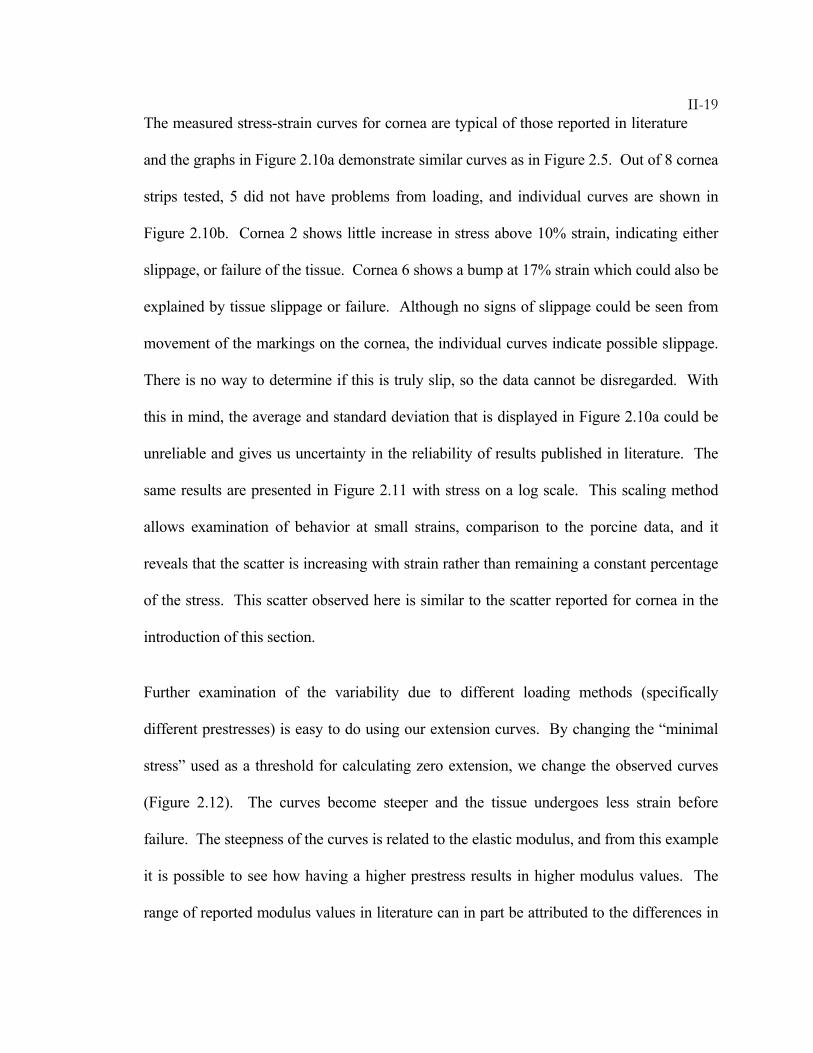
II-19The measured stress-strain curves for cornea are typical of those reported in literature
and the graphs in Figure 2.10a demonstrate similar curves as in Figure 2.5. Out of 8 cornea
strips tested, 5 did not have problems from loading, and individual curves are shown in
Figure 2.10b. Cornea 2 shows little increase in stress above 10% strain, indicating either
slippage, or failure of the tissue. Cornea 6 shows a bump at 17% strain which could also be
explained by tissue slippage or failure. Although no signs of slippage could be seen from
movement of the markings on the cornea, the individual curves indicate possible slippage.
There is no way to determine if this is truly slip, so the data cannot be disregarded. With
this in mind, the average and standard deviation that is displayed in Figure 2.10a could be
unreliable and gives us uncertainty in the reliability of results published in literature. The
same results are presented in Figure 2.11 with stress on a log scale. This scaling method
allows examination of behavior at small strains, comparison to the porcine data, and it
reveals that the scatter is increasing with strain rather than remaining a constant percentage
of the stress. This scatter observed here is similar to the scatter reported for cornea in the
introduction of this section.
Further examination of the variability due to different loading methods (specifically
different prestresses) is easy to do using our extension curves. By changing the “minimal
stress” used as a threshold for calculating zero extension, we change the observed curves
(Figure 2.12). The curves become steeper and the tissue undergoes less strain before
failure. The steepness of the curves is related to the elastic modulus, and from this example
it is possible to see how having a higher prestress results in higher modulus values. The
range of reported modulus values in literature can in part be attributed to the differences in
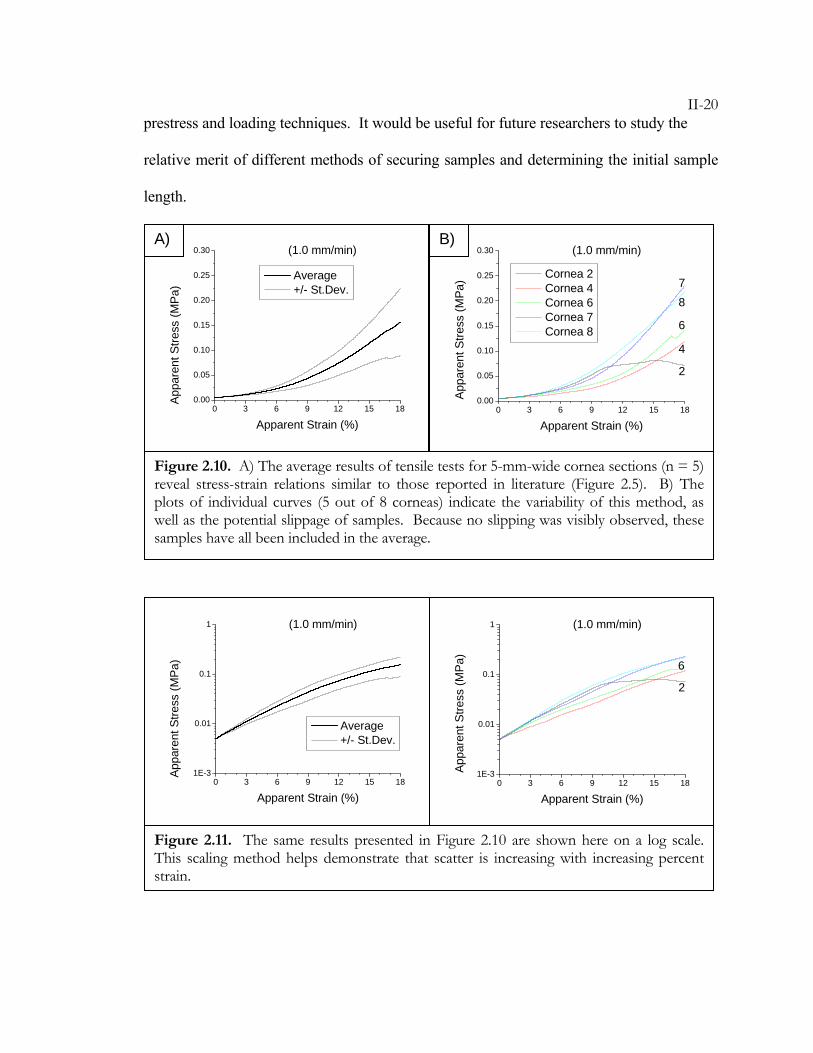
II-20prestress and loading techniques. It would be useful for future researchers to study the
relative merit of different methods of securing samples and determining the initial sample
length.
0 3 6 9 12 15 181E-3
0.01
0.1
1 (1.0 mm/min)
Appa
rent
Stre
ss (M
Pa)
Apparent Strain (%)
Average +/- St.Dev.
0 3 6 9 12 15 181E-3
0.01
0.1
1
6
2
(1.0 mm/min)
Appa
rent
Stre
ss (M
Pa)
Apparent Strain (%)
Figure 2.11. The same results presented in Figure 2.10 are shown here on a log scale. This scaling method helps demonstrate that scatter is increasing with increasing percent strain.
0 3 6 9 12 15 180.00
0.05
0.10
0.15
0.20
0.25
0.30 (1.0 mm/min)
Appa
rent
Stre
ss (M
Pa)
Apparent Strain (%)
Average +/- St.Dev.
0 3 6 9 12 15 180.00
0.05
0.10
0.15
0.20
0.25
0.30
78
6
4
2
(1.0 mm/min)
App
aren
t Stre
ss (M
Pa)
Apparent Strain (%)
Cornea 2 Cornea 4 Cornea 6 Cornea 7 Cornea 8
Figure 2.10. A) The average results of tensile tests for 5-mm-wide cornea sections (n = 5) reveal stress-strain relations similar to those reported in literature (Figure 2.5). B) The plots of individual curves (5 out of 8 corneas) indicate the variability of this method, as well as the potential slippage of samples. Because no slipping was visibly observed, these samples have all been included in the average.
A) B)
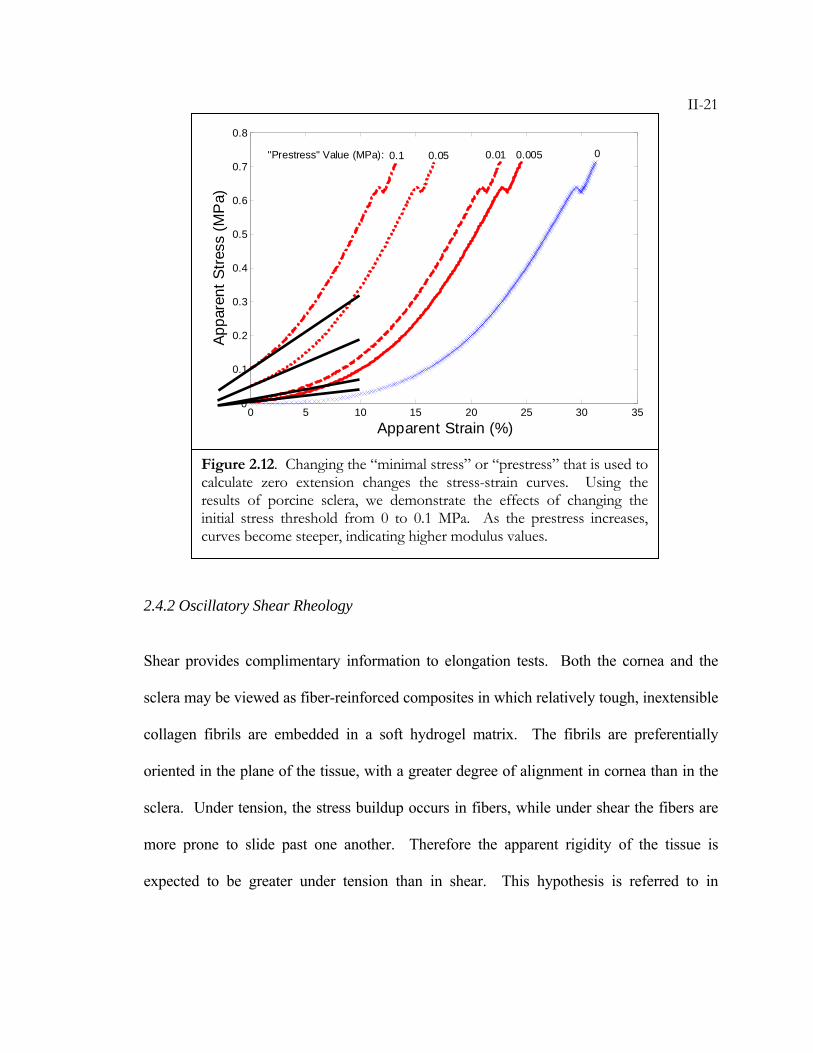
II-21
2.4.2 Oscillatory Shear Rheology
Shear provides complimentary information to elongation tests. Both the cornea and the
sclera may be viewed as fiber-reinforced composites in which relatively tough, inextensible
collagen fibrils are embedded in a soft hydrogel matrix. The fibrils are preferentially
oriented in the plane of the tissue, with a greater degree of alignment in cornea than in the
sclera. Under tension, the stress buildup occurs in fibers, while under shear the fibers are
more prone to slide past one another. Therefore the apparent rigidity of the tissue is
expected to be greater under tension than in shear. This hypothesis is referred to in
0 5 10 15 20 25 30 350
0.1
0.2
0.3
0.4
0.5
0.6
0.7
0.8
Apparent Strain (%)
Appa
rent
Stre
ss (M
Pa)
0.005 00.010.050.1"Prestress" Value (MPa):
Figure 2.12. Changing the “minimal stress” or “prestress” that is used to calculate zero extension changes the stress-strain curves. Using the results of porcine sclera, we demonstrate the effects of changing the initial stress threshold from 0 to 0.1 MPa. As the prestress increases, curves become steeper, indicating higher modulus values.
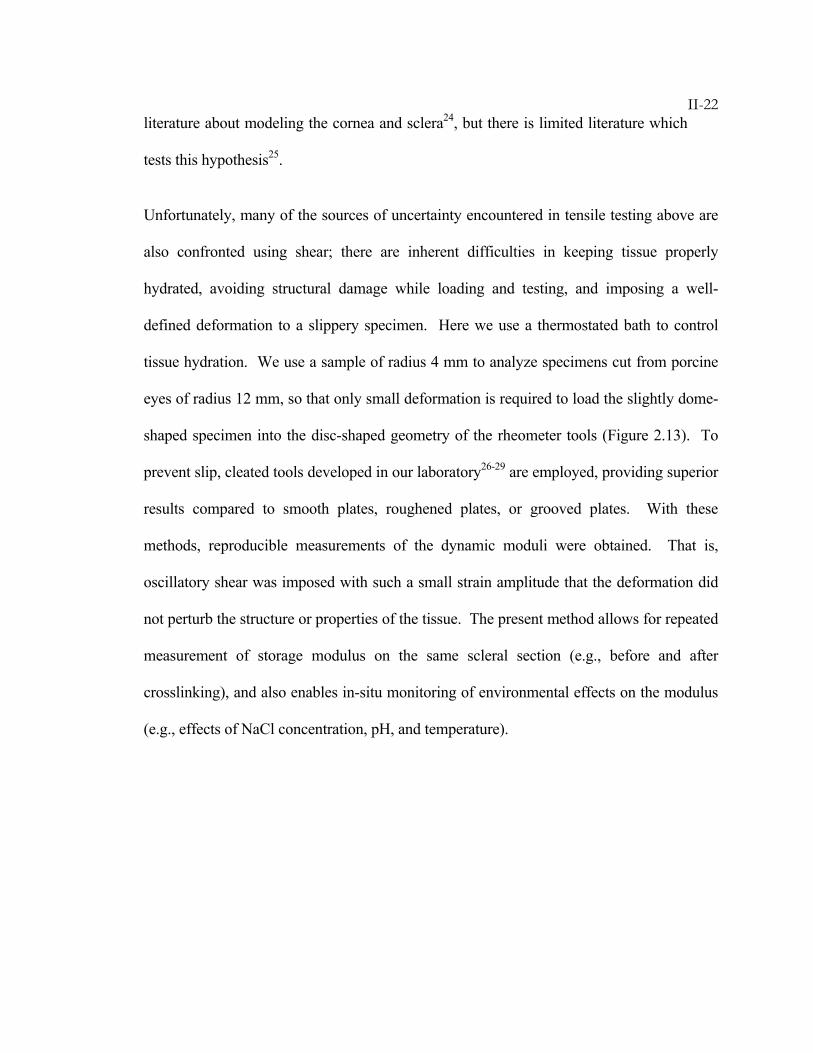
II-22literature about modeling the cornea and sclera24, but there is limited literature which
tests this hypothesis25.
Unfortunately, many of the sources of uncertainty encountered in tensile testing above are
also confronted using shear; there are inherent difficulties in keeping tissue properly
hydrated, avoiding structural damage while loading and testing, and imposing a well-
defined deformation to a slippery specimen. Here we use a thermostated bath to control
tissue hydration. We use a sample of radius 4 mm to analyze specimens cut from porcine
eyes of radius 12 mm, so that only small deformation is required to load the slightly dome-
shaped specimen into the disc-shaped geometry of the rheometer tools (Figure 2.13). To
prevent slip, cleated tools developed in our laboratory26-29 are employed, providing superior
results compared to smooth plates, roughened plates, or grooved plates. With these
methods, reproducible measurements of the dynamic moduli were obtained. That is,
oscillatory shear was imposed with such a small strain amplitude that the deformation did
not perturb the structure or properties of the tissue. The present method allows for repeated
measurement of storage modulus on the same scleral section (e.g., before and after
crosslinking), and also enables in-situ monitoring of environmental effects on the modulus
(e.g., effects of NaCl concentration, pH, and temperature).
II-23
Materials: Dulbecco’s phosphate-buffered saline (DPBS) was purchased from Sigma
Aldrich (pH 7.5, 0.9% NaCl). Solutions of varying salt concentration (0–2% by weight)
were prepared by mixing NaCl in deionized water and adjusting the pH to 7.5 using NaOH
or HCl. A series of 0.9% saline solutions with pH ranging from 5 to 10 were prepared
from 10 mM PBS buffer—4 g NaCl, 0.72 g Na2HPO4, and 0.12 g NaH2PO4 (Sigma
Aldrich) dissolved in distilled water for a final volume of 500 mL—with pH adjusted using
NaOH or HCl.
Porcine eyes were acquired from Sierra for Medical Science and were stored in 0.9% saline
on ice until use within 72 hours of enucleation. The fat and muscle from all eyes were
removed with scissors to expose the sclera. An equatorial incision was used to separate the
posterior sclera from the anterior hemisphere of the eye. The vitreous, retina, and choroid
were removed and 8 mm circular sections were cut using a trephine punch (Katena). The
center of the circular section was located ~10 mm from the optic nerve and in some cases
Curved strip for extension Curved disk for shearCurved strip for extension Curved disk for shearFigure 2.13. Strips cut for either tensile or shear measurements must be straightened before testing. Straightening the tissue introduces stresses in addition to those imposed by the measurement technique.
II-24multiple sections were cut from one eye. The following studies used approximately
60 eyes.
Procedures: Circular sections were tested in an 8 mm parallel plate geometry modified
with cleats on an AR1000 (TA Instruments) Stress Controlled Rheometer (Figure 2.14).
The sample was placed on the lower geometry, and then the upper geometry was lowered
to contact the sclera. Experiments monitoring the effect of normal force and tissue
compression on the modulus were used to determine the appropriate forces to achieve good
contact (Figure 2.15). Good contact was made when the instrument registered a 0.1 N
normal force. The tool position is then fixed and the gap between the tips of the cleats on
the two tools was used to compute the shear strain from the observed torsional
displacement. A small oscillatory stress was imposed on the sample such that the native
structure of the tissue was not perturbed. The amplitude and phase of the resulting
oscillatory deformation reveal the elastic and dissipative character of the material, which is
typically a function of the frequency of the imposed oscillation. The elastic character of the
tissue is manifested in the storage modulus, G′(ω). Because the sclera is solid, at low
frequency its behavior is primarily elastic and the modulus becomes insensitive to
frequency. Oscillatory shear measurements were done using a stress amplitude of 5 Pa and
a frequency of 1 rad/sec. Temperature was controlled using a Peltier plate and the solution
surrounding the tissue was prevented from evaporating by using a solvent trap. The solvent
trap had a port that could be accessed to change the solution around the tissue.
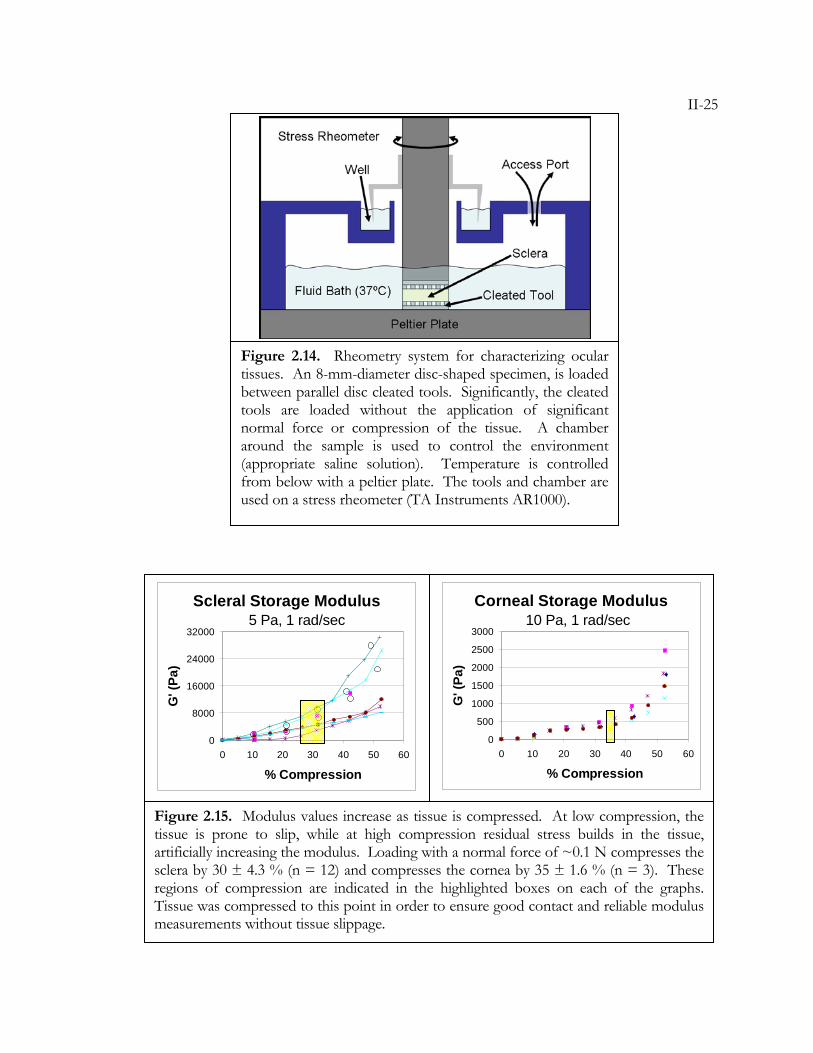
II-25
Figure 2.14. Rheometry system for characterizing ocular tissues. An 8-mm-diameter disc-shaped specimen, is loaded between parallel disc cleated tools. Significantly, the cleated tools are loaded without the application of significant normal force or compression of the tissue. A chamber around the sample is used to control the environment (appropriate saline solution). Temperature is controlled from below with a peltier plate. The tools and chamber are used on a stress rheometer (TA Instruments AR1000).
Scleral Storage Modulus
0
8000
16000
24000
32000
0 10 20 30 40 50 60
% Compression
G' (
Pa)
Corneal Storage Modulus
0
500
1000
1500
2000
2500
3000
0 10 20 30 40 50 60
% Compression
G' (
Pa)
Figure 2.15. Modulus values increase as tissue is compressed. At low compression, the tissue is prone to slip, while at high compression residual stress builds in the tissue, artificially increasing the modulus. Loading with a normal force of ~0.1 N compresses the sclera by 30 ± 4.3 % (n = 12) and compresses the cornea by 35 ± 1.6 % (n = 3). These regions of compression are indicated in the highlighted boxes on each of the graphs. Tissue was compressed to this point in order to ensure good contact and reliable modulus measurements without tissue slippage.
10 Pa, 1 rad/sec 5 Pa, 1 rad/sec
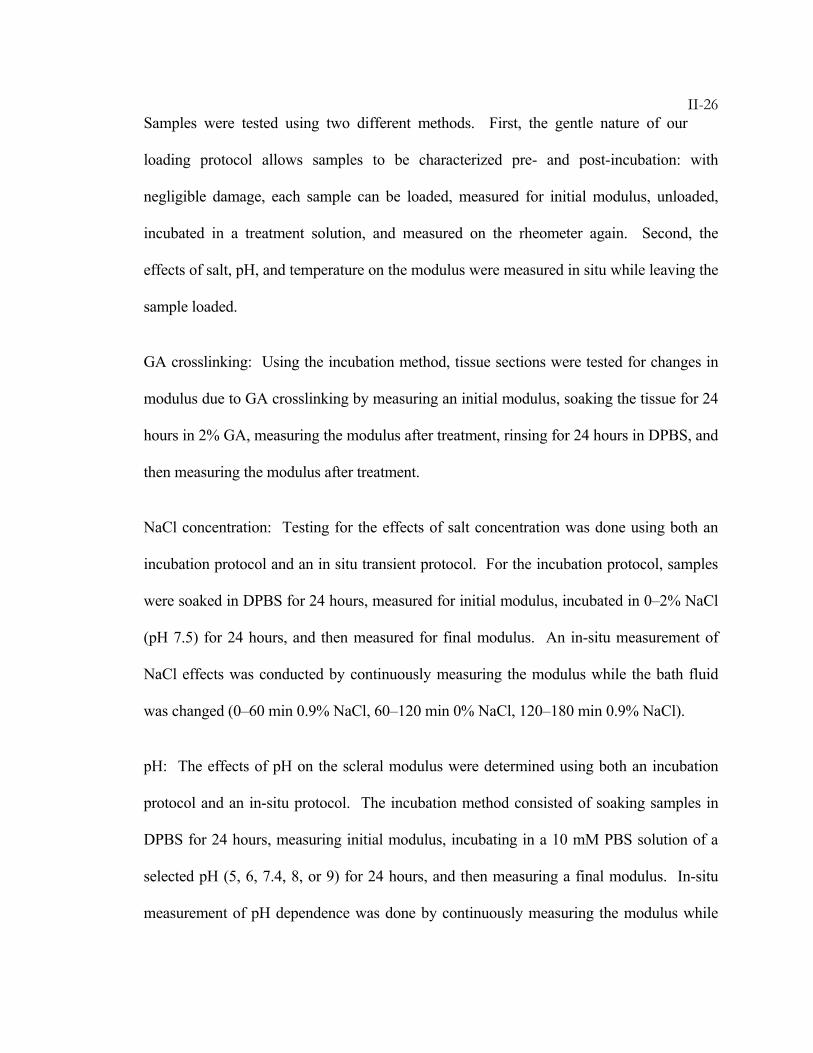
II-26Samples were tested using two different methods. First, the gentle nature of our
loading protocol allows samples to be characterized pre- and post-incubation: with
negligible damage, each sample can be loaded, measured for initial modulus, unloaded,
incubated in a treatment solution, and measured on the rheometer again. Second, the
effects of salt, pH, and temperature on the modulus were measured in situ while leaving the
sample loaded.
GA crosslinking: Using the incubation method, tissue sections were tested for changes in
modulus due to GA crosslinking by measuring an initial modulus, soaking the tissue for 24
hours in 2% GA, measuring the modulus after treatment, rinsing for 24 hours in DPBS, and
then measuring the modulus after treatment.
NaCl concentration: Testing for the effects of salt concentration was done using both an
incubation protocol and an in situ transient protocol. For the incubation protocol, samples
were soaked in DPBS for 24 hours, measured for initial modulus, incubated in 0–2% NaCl
(pH 7.5) for 24 hours, and then measured for final modulus. An in-situ measurement of
NaCl effects was conducted by continuously measuring the modulus while the bath fluid
was changed (0–60 min 0.9% NaCl, 60–120 min 0% NaCl, 120–180 min 0.9% NaCl).
pH: The effects of pH on the scleral modulus were determined using both an incubation
protocol and an in-situ protocol. The incubation method consisted of soaking samples in
DPBS for 24 hours, measuring initial modulus, incubating in a 10 mM PBS solution of a
selected pH (5, 6, 7.4, 8, or 9) for 24 hours, and then measuring a final modulus. In-situ
measurement of pH dependence was done by continuously measuring the modulus while
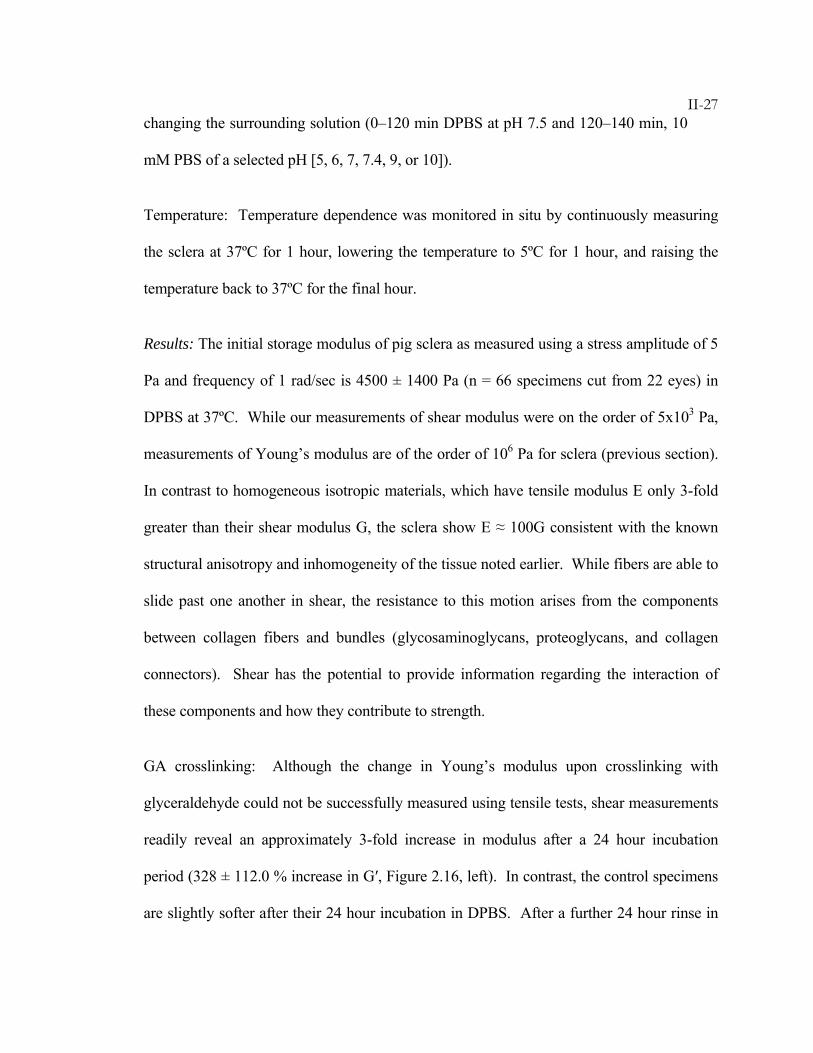
II-27changing the surrounding solution (0–120 min DPBS at pH 7.5 and 120–140 min, 10
mM PBS of a selected pH [5, 6, 7, 7.4, 9, or 10]).
Temperature: Temperature dependence was monitored in situ by continuously measuring
the sclera at 37ºC for 1 hour, lowering the temperature to 5ºC for 1 hour, and raising the
temperature back to 37ºC for the final hour.
Results: The initial storage modulus of pig sclera as measured using a stress amplitude of 5
Pa and frequency of 1 rad/sec is 4500 ± 1400 Pa (n = 66 specimens cut from 22 eyes) in
DPBS at 37ºC. While our measurements of shear modulus were on the order of 5x10³ Pa,
measurements of Young’s modulus are of the order of 106 Pa for sclera (previous section).
In contrast to homogeneous isotropic materials, which have tensile modulus E only 3-fold
greater than their shear modulus G, the sclera show E ≈ 100G consistent with the known
structural anisotropy and inhomogeneity of the tissue noted earlier. While fibers are able to
slide past one another in shear, the resistance to this motion arises from the components
between collagen fibers and bundles (glycosaminoglycans, proteoglycans, and collagen
connectors). Shear has the potential to provide information regarding the interaction of
these components and how they contribute to strength.
GA crosslinking: Although the change in Young’s modulus upon crosslinking with
glyceraldehyde could not be successfully measured using tensile tests, shear measurements
readily reveal an approximately 3-fold increase in modulus after a 24 hour incubation
period (328 ± 112.0 % increase in G′, Figure 2.16, left). In contrast, the control specimens
are slightly softer after their 24 hour incubation in DPBS. After a further 24 hour rinse in
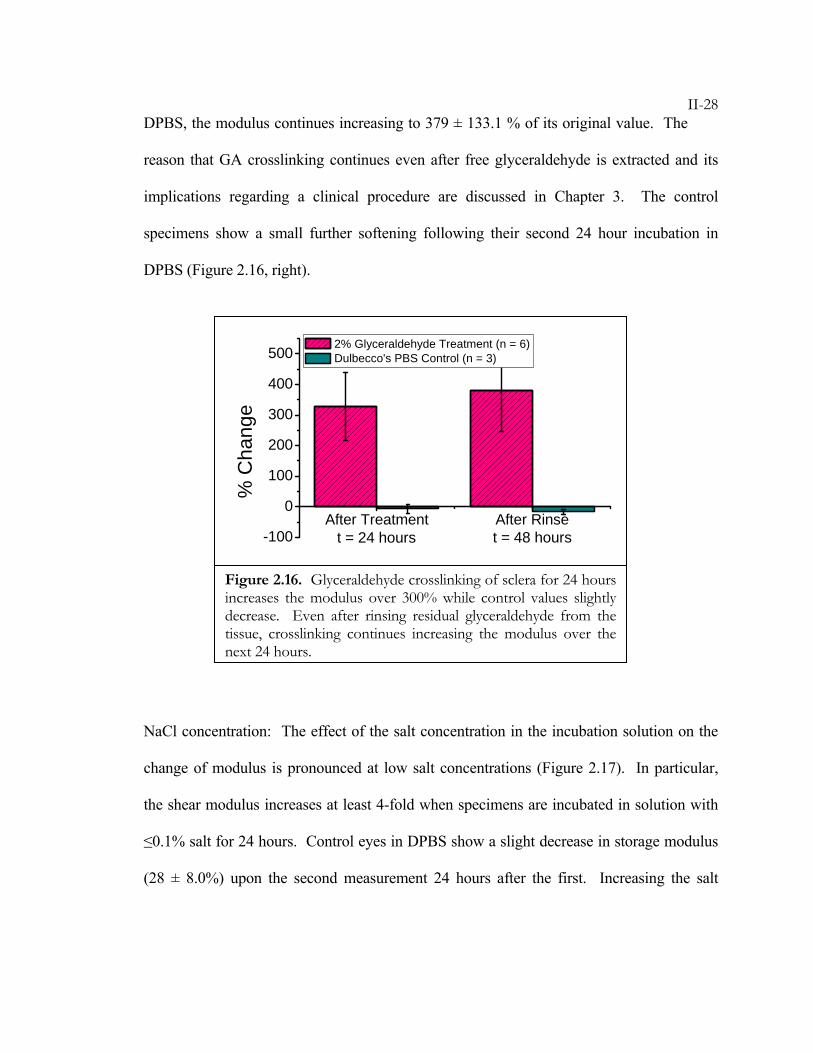
II-28DPBS, the modulus continues increasing to 379 ± 133.1 % of its original value. The
reason that GA crosslinking continues even after free glyceraldehyde is extracted and its
implications regarding a clinical procedure are discussed in Chapter 3. The control
specimens show a small further softening following their second 24 hour incubation in
DPBS (Figure 2.16, right).
NaCl concentration: The effect of the salt concentration in the incubation solution on the
change of modulus is pronounced at low salt concentrations (Figure 2.17). In particular,
the shear modulus increases at least 4-fold when specimens are incubated in solution with
≤0.1% salt for 24 hours. Control eyes in DPBS show a slight decrease in storage modulus
(28 ± 8.0%) upon the second measurement 24 hours after the first. Increasing the salt
After Treatment After Rinse-100
0
100
200
300
400
500
t = 48 hourst = 24 hours
% C
hang
e
2% Glyceraldehyde Treatment (n = 6) Dulbecco's PBS Control (n = 3)
Figure 2.16. Glyceraldehyde crosslinking of sclera for 24 hours increases the modulus over 300% while control values slightly decrease. Even after rinsing residual glyceraldehyde from the tissue, crosslinking continues increasing the modulus over the next 24 hours.
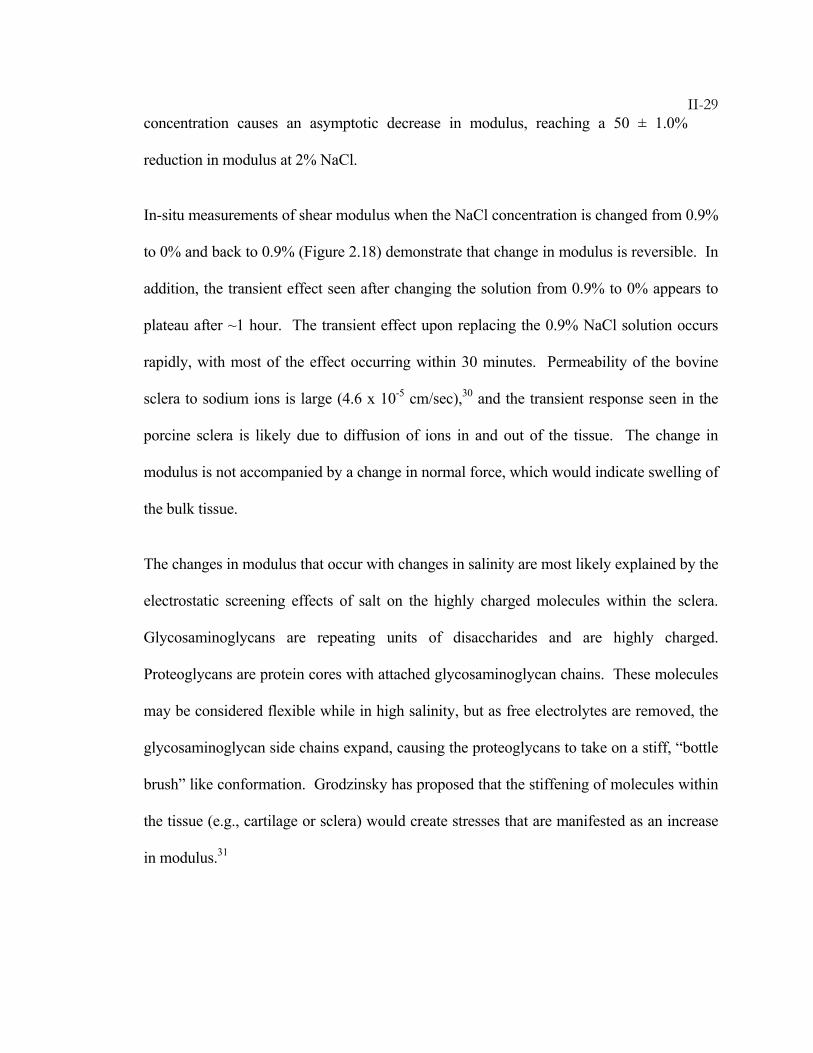
II-29concentration causes an asymptotic decrease in modulus, reaching a 50 ± 1.0%
reduction in modulus at 2% NaCl.
In-situ measurements of shear modulus when the NaCl concentration is changed from 0.9%
to 0% and back to 0.9% (Figure 2.18) demonstrate that change in modulus is reversible. In
addition, the transient effect seen after changing the solution from 0.9% to 0% appears to
plateau after ~1 hour. The transient effect upon replacing the 0.9% NaCl solution occurs
rapidly, with most of the effect occurring within 30 minutes. Permeability of the bovine
sclera to sodium ions is large (4.6 x 10⁻⁵ cm/sec),30 and the transient response seen in the
porcine sclera is likely due to diffusion of ions in and out of the tissue. The change in
modulus is not accompanied by a change in normal force, which would indicate swelling of
the bulk tissue.
The changes in modulus that occur with changes in salinity are most likely explained by the
electrostatic screening effects of salt on the highly charged molecules within the sclera.
Glycosaminoglycans are repeating units of disaccharides and are highly charged.
Proteoglycans are protein cores with attached glycosaminoglycan chains. These molecules
may be considered flexible while in high salinity, but as free electrolytes are removed, the
glycosaminoglycan side chains expand, causing the proteoglycans to take on a stiff, “bottle
brush” like conformation. Grodzinsky has proposed that the stiffening of molecules within
the tissue (e.g., cartilage or sclera) would create stresses that are manifested as an increase
in modulus.31
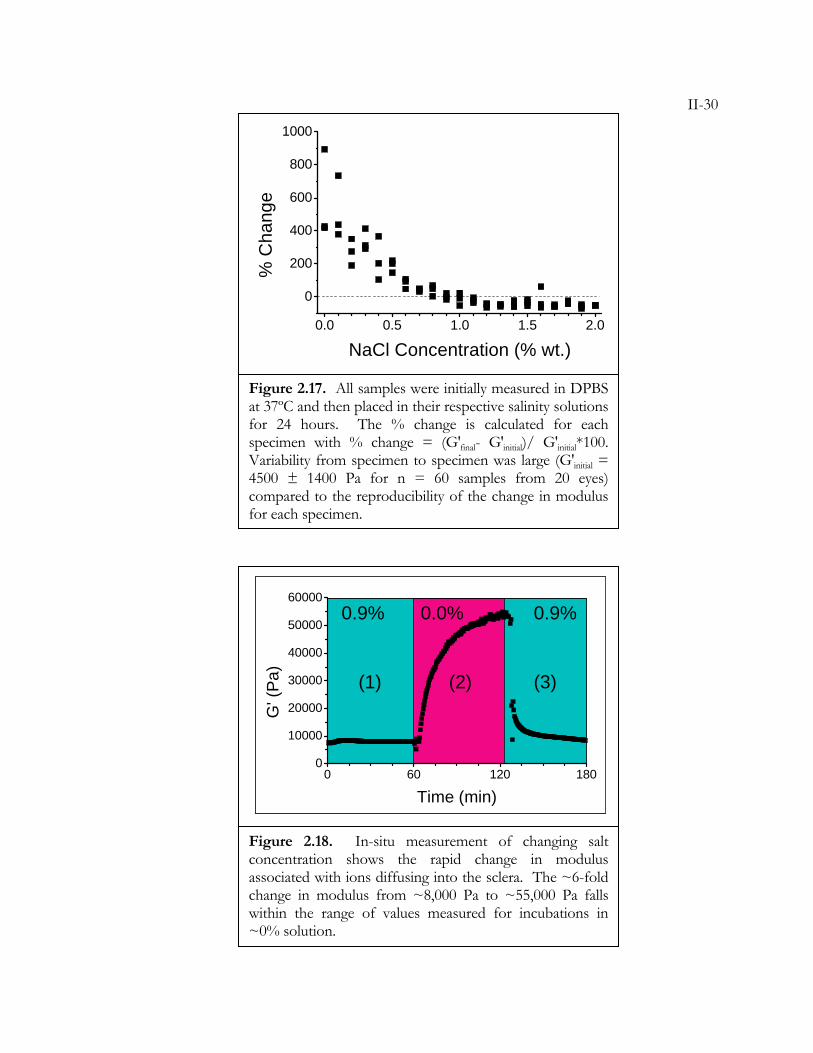
II-30
0.0 0.5 1.0 1.5 2.0
0
200
400
600
800
1000
% C
hang
e
NaCl Concentration (% wt.)
Figure 2.17. All samples were initially measured in DPBS at 37ºC and then placed in their respective salinity solutions for 24 hours. The % change is calculated for each specimen with % change = (G′final- G′initial)/ G′initial*100. Variability from specimen to specimen was large (G′initial = 4500 ± 1400 Pa for n = 60 samples from 20 eyes) compared to the reproducibility of the change in modulus for each specimen.
0 60 120 1800
10000
20000
30000
40000
50000
60000
G' (
Pa)
Time (min)
0.9% 0.9%0.0%
(1) (2) (3)
0 60 120 1800
10000
20000
30000
40000
50000
60000
G' (
Pa)
Time (min)
0.9% 0.9%0.0%
0 60 120 1800
10000
20000
30000
40000
50000
60000
G' (
Pa)
Time (min)0 60 120 180
0
10000
20000
30000
40000
50000
60000
G' (
Pa)
Time (min)
0.9% 0.9%0.0%
(1) (2) (3)
Figure 2.18. In-situ measurement of changing salt concentration shows the rapid change in modulus associated with ions diffusing into the sclera. The ~6-fold change in modulus from ~8,000 Pa to ~55,000 Pa falls within the range of values measured for incubations in ~0% solution.
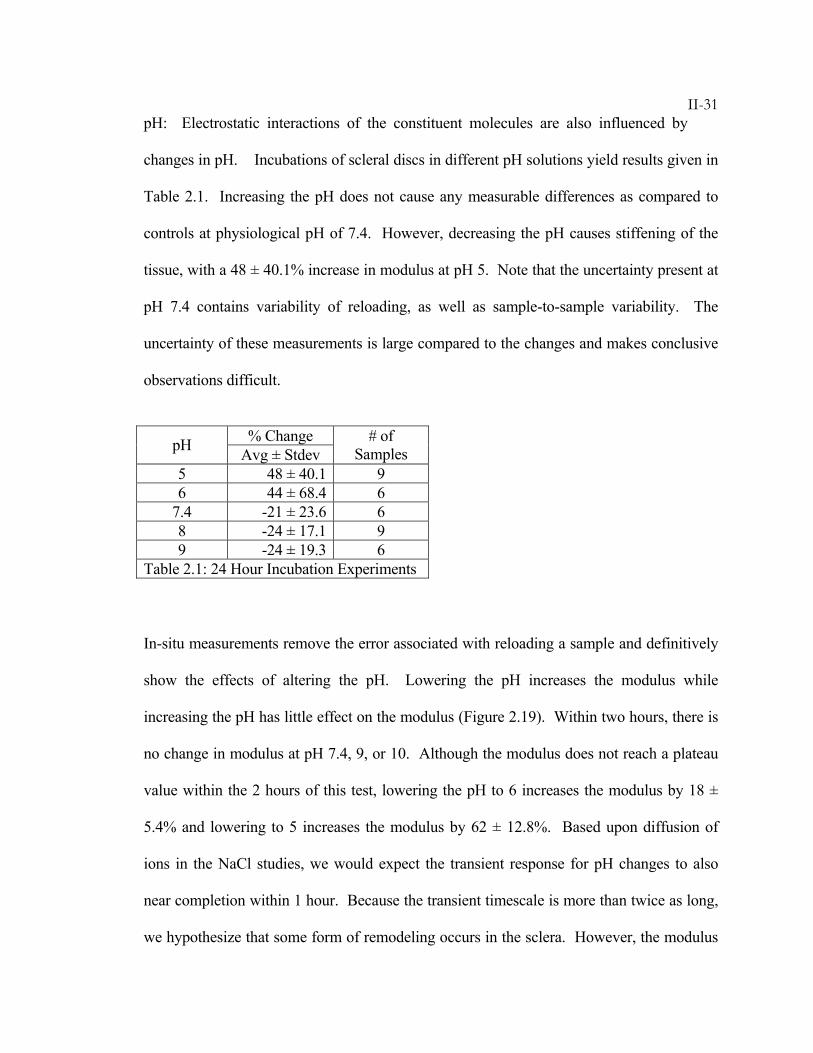
II-31pH: Electrostatic interactions of the constituent molecules are also influenced by
changes in pH. Incubations of scleral discs in different pH solutions yield results given in
Table 2.1. Increasing the pH does not cause any measurable differences as compared to
controls at physiological pH of 7.4. However, decreasing the pH causes stiffening of the
tissue, with a 48 ± 40.1% increase in modulus at pH 5. Note that the uncertainty present at
pH 7.4 contains variability of reloading, as well as sample-to-sample variability. The
uncertainty of these measurements is large compared to the changes and makes conclusive
observations difficult.
% Change pH Avg ± Stdev # of
Samples 5 48 ± 40.1 9 6 44 ± 68.4 6
7.4 -21 ± 23.6 6 8 -24 ± 17.1 9 9 -24 ± 19.3 6
Table 2.1: 24 Hour Incubation Experiments
In-situ measurements remove the error associated with reloading a sample and definitively
show the effects of altering the pH. Lowering the pH increases the modulus while
increasing the pH has little effect on the modulus (Figure 2.19). Within two hours, there is
no change in modulus at pH 7.4, 9, or 10. Although the modulus does not reach a plateau
value within the 2 hours of this test, lowering the pH to 6 increases the modulus by 18 ±
5.4% and lowering to 5 increases the modulus by 62 ± 12.8%. Based upon diffusion of
ions in the NaCl studies, we would expect the transient response for pH changes to also
near completion within 1 hour. Because the transient timescale is more than twice as long,
we hypothesize that some form of remodeling occurs in the sclera. However, the modulus
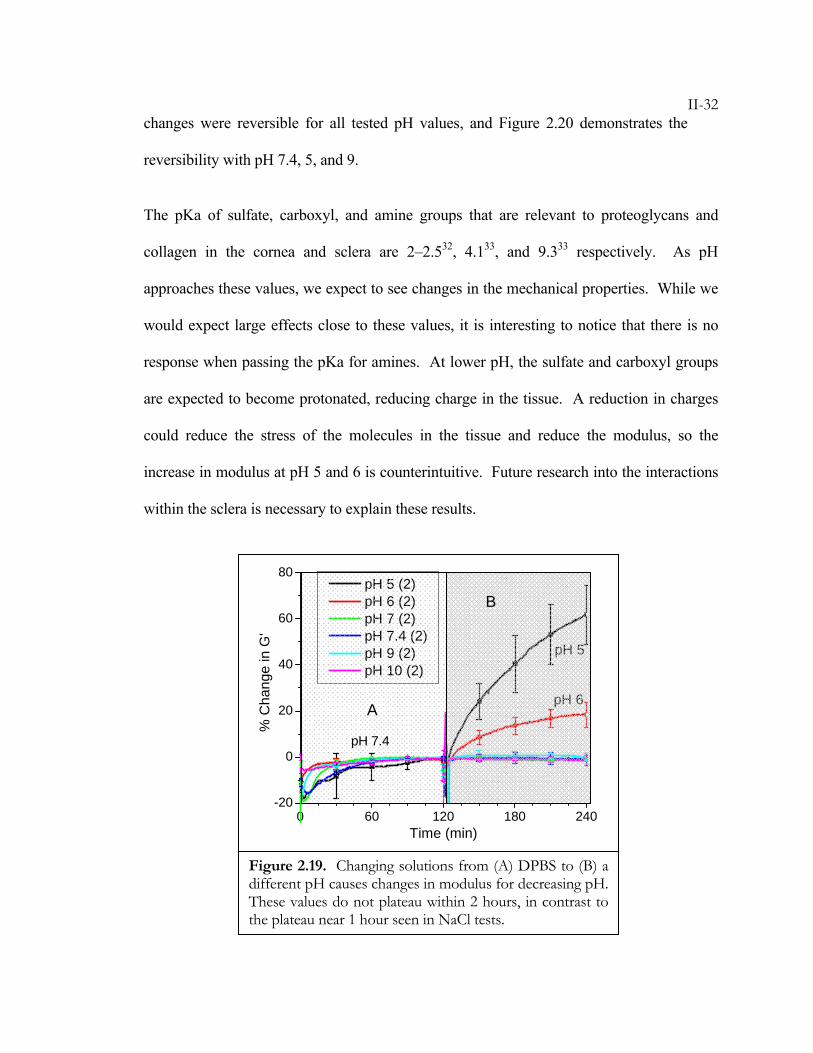
II-32changes were reversible for all tested pH values, and Figure 2.20 demonstrates the
reversibility with pH 7.4, 5, and 9.
The pKa of sulfate, carboxyl, and amine groups that are relevant to proteoglycans and
collagen in the cornea and sclera are 2–2.532, 4.133, and 9.333 respectively. As pH
approaches these values, we expect to see changes in the mechanical properties. While we
would expect large effects close to these values, it is interesting to notice that there is no
response when passing the pKa for amines. At lower pH, the sulfate and carboxyl groups
are expected to become protonated, reducing charge in the tissue. A reduction in charges
could reduce the stress of the molecules in the tissue and reduce the modulus, so the
increase in modulus at pH 5 and 6 is counterintuitive. Future research into the interactions
within the sclera is necessary to explain these results.
0 60 120 180 240-20
0
20
40
60
80
pH 6
pH 5
% C
hang
e in
G'
Time (min)
pH 5 (2) pH 6 (2) pH 7 (2) pH 7.4 (2) pH 9 (2) pH 10 (2)
A
B
pH 7.4
Figure 2.19. Changing solutions from (A) DPBS to (B) a different pH causes changes in modulus for decreasing pH. These values do not plateau within 2 hours, in contrast to the plateau near 1 hour seen in NaCl tests.
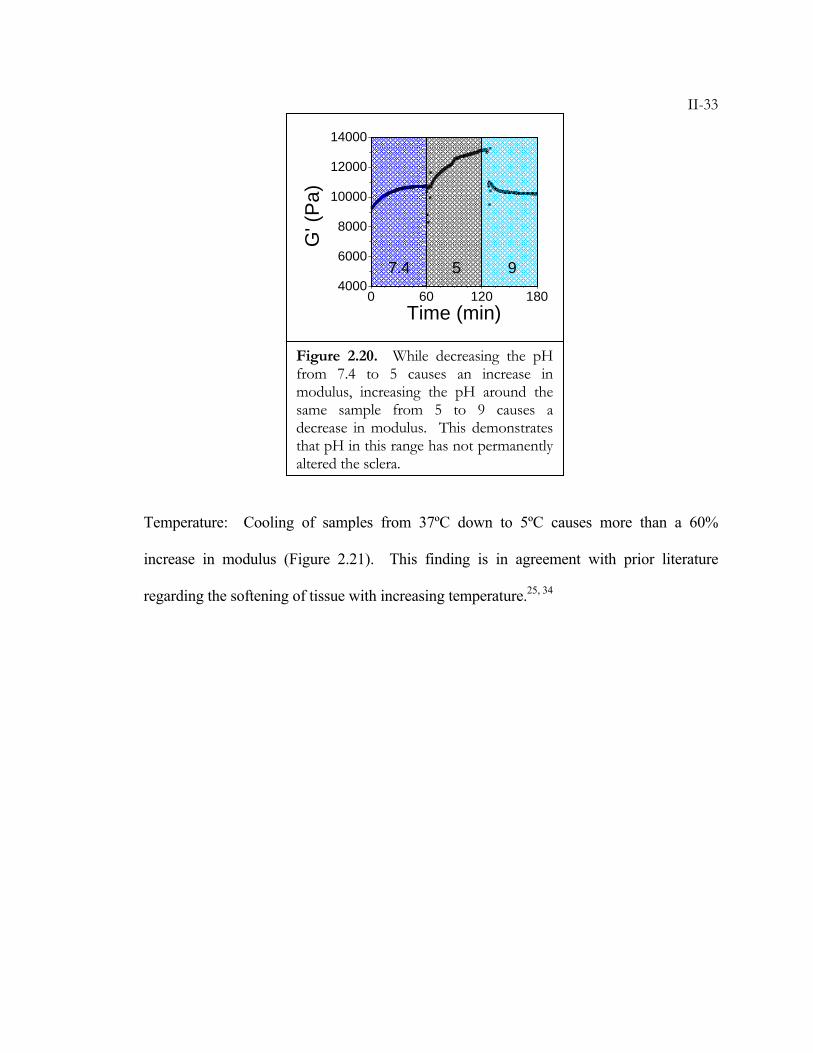
II-33
Temperature: Cooling of samples from 37ºC down to 5ºC causes more than a 60%
increase in modulus (Figure 2.21). This finding is in agreement with prior literature
regarding the softening of tissue with increasing temperature.25, 34
0 60 120 1804000
6000
8000
10000
12000
14000
G' (
Pa)
Time (min)
7.4 5 9
Figure 2.20. While decreasing the pH from 7.4 to 5 causes an increase in modulus, increasing the pH around the same sample from 5 to 9 causes a decrease in modulus. This demonstrates that pH in this range has not permanently altered the sclera.
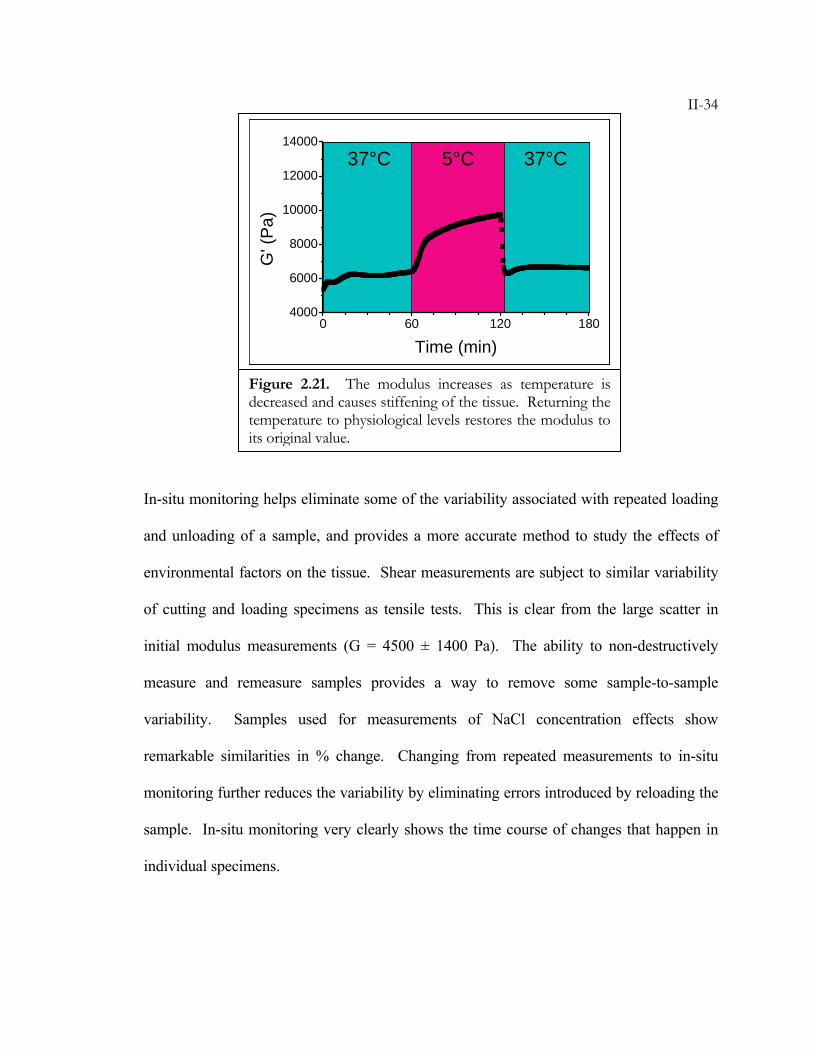
II-34
In-situ monitoring helps eliminate some of the variability associated with repeated loading
and unloading of a sample, and provides a more accurate method to study the effects of
environmental factors on the tissue. Shear measurements are subject to similar variability
of cutting and loading specimens as tensile tests. This is clear from the large scatter in
initial modulus measurements (G = 4500 ± 1400 Pa). The ability to non-destructively
measure and remeasure samples provides a way to remove some sample-to-sample
variability. Samples used for measurements of NaCl concentration effects show
remarkable similarities in % change. Changing from repeated measurements to in-situ
monitoring further reduces the variability by eliminating errors introduced by reloading the
sample. In-situ monitoring very clearly shows the time course of changes that happen in
individual specimens.
0 60 120 1804000
6000
8000
10000
12000
14000
G' (
Pa)
Time (min)
37°C 37°C5°C
0 60 120 1804000
6000
8000
10000
12000
14000
G' (
Pa)
Time (min)0 60 120 180
4000
6000
8000
10000
12000
14000
G' (
Pa)
Time (min)
37°C 37°C5°C
Figure 2.21. The modulus increases as temperature is decreased and causes stiffening of the tissue. Returning the temperature to physiological levels restores the modulus to its original value.
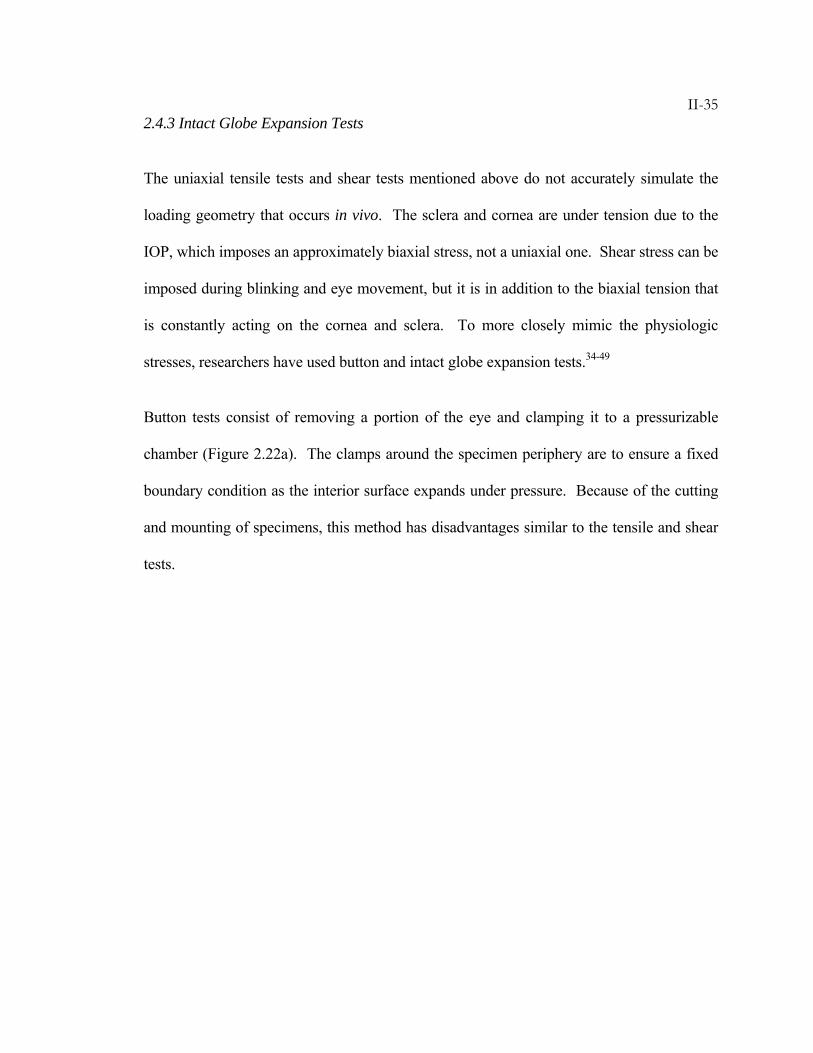
II-352.4.3 Intact Globe Expansion Tests
The uniaxial tensile tests and shear tests mentioned above do not accurately simulate the
loading geometry that occurs in vivo. The sclera and cornea are under tension due to the
IOP, which imposes an approximately biaxial stress, not a uniaxial one. Shear stress can be
imposed during blinking and eye movement, but it is in addition to the biaxial tension that
is constantly acting on the cornea and sclera. To more closely mimic the physiologic
stresses, researchers have used button and intact globe expansion tests.34-49
Button tests consist of removing a portion of the eye and clamping it to a pressurizable
chamber (Figure 2.22a). The clamps around the specimen periphery are to ensure a fixed
boundary condition as the interior surface expands under pressure. Because of the cutting
and mounting of specimens, this method has disadvantages similar to the tensile and shear
tests.
II-36
Intact globe expansion experiments use the eye without cutting the tissue (Figure 2.22b).
The fibril structure is not disturbed by cutting or clamping, and there is an attempt to
maintain the natural boundary conditions of the eye. Most importantly, the type of stresses
imposed in this intact globe expansion test provide a model for conditions that more closely
resemble in vivo stresses. Some research groups have glued eyes to fixtures, or pierced
eyes with several needles in order to hold them steady while testing. In our experiments,
whole eyes are set upon a ring support and pierced through the posterior pole with a single
needle that is used to control IOP. In this manner, there is only minimal damage at the site
of the needle. The eyes are not clamped or glued to the ring support, so they are free to
expand along any ocular dimension. To measure ocular dimensions, groups have used
lasers, interferometry, ultrasound, calipers, and photography. With current advances in
Figure 2.22. A) Buttons of tissue cut from the eye are mounted on a fixture with a circular hole that allows tissue to expand outward. The tissue is clamped down and the pressure inside the fixture is elevated to cause expansion. B) The entire eye is kept intact and a needle is inserted to control intraocular pressure.
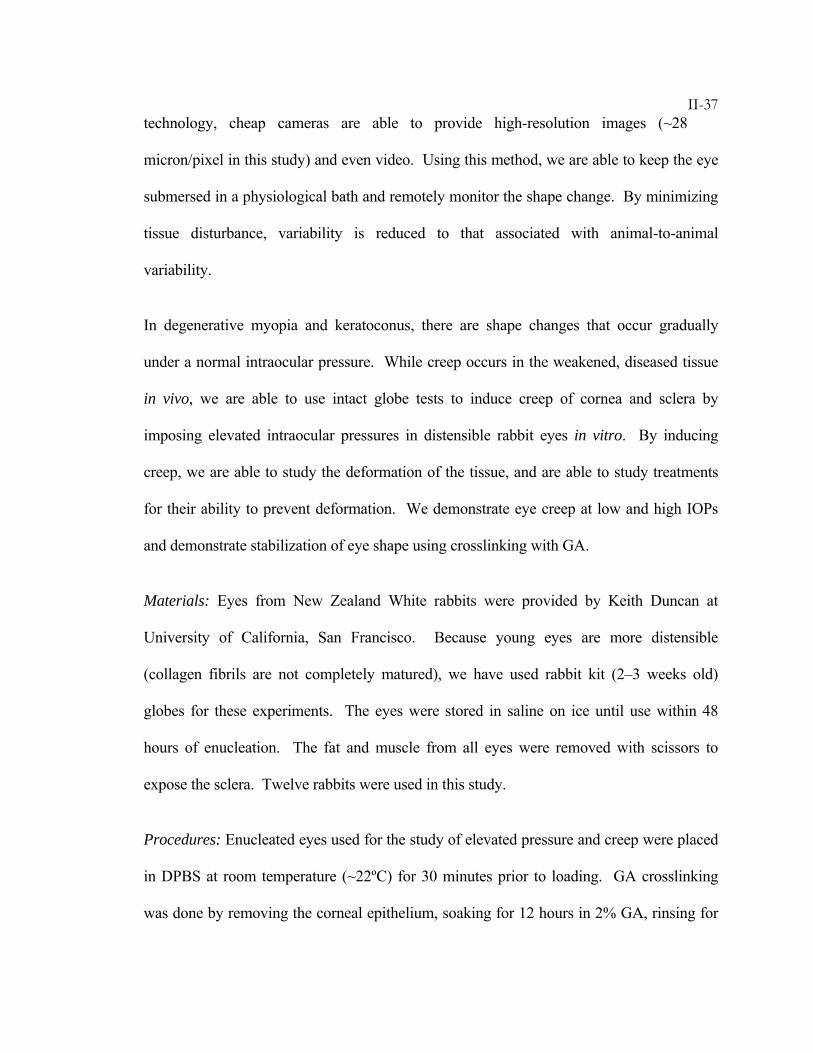
II-37technology, cheap cameras are able to provide high-resolution images (~28
micron/pixel in this study) and even video. Using this method, we are able to keep the eye
submersed in a physiological bath and remotely monitor the shape change. By minimizing
tissue disturbance, variability is reduced to that associated with animal-to-animal
variability.
In degenerative myopia and keratoconus, there are shape changes that occur gradually
under a normal intraocular pressure. While creep occurs in the weakened, diseased tissue
in vivo, we are able to use intact globe tests to induce creep of cornea and sclera by
imposing elevated intraocular pressures in distensible rabbit eyes in vitro. By inducing
creep, we are able to study the deformation of the tissue, and are able to study treatments
for their ability to prevent deformation. We demonstrate eye creep at low and high IOPs
and demonstrate stabilization of eye shape using crosslinking with GA.
Materials: Eyes from New Zealand White rabbits were provided by Keith Duncan at
University of California, San Francisco. Because young eyes are more distensible
(collagen fibrils are not completely matured), we have used rabbit kit (2–3 weeks old)
globes for these experiments. The eyes were stored in saline on ice until use within 48
hours of enucleation. The fat and muscle from all eyes were removed with scissors to
expose the sclera. Twelve rabbits were used in this study.
Procedures: Enucleated eyes used for the study of elevated pressure and creep were placed
in DPBS at room temperature (~22ºC) for 30 minutes prior to loading. GA crosslinking
was done by removing the corneal epithelium, soaking for 12 hours in 2% GA, rinsing for
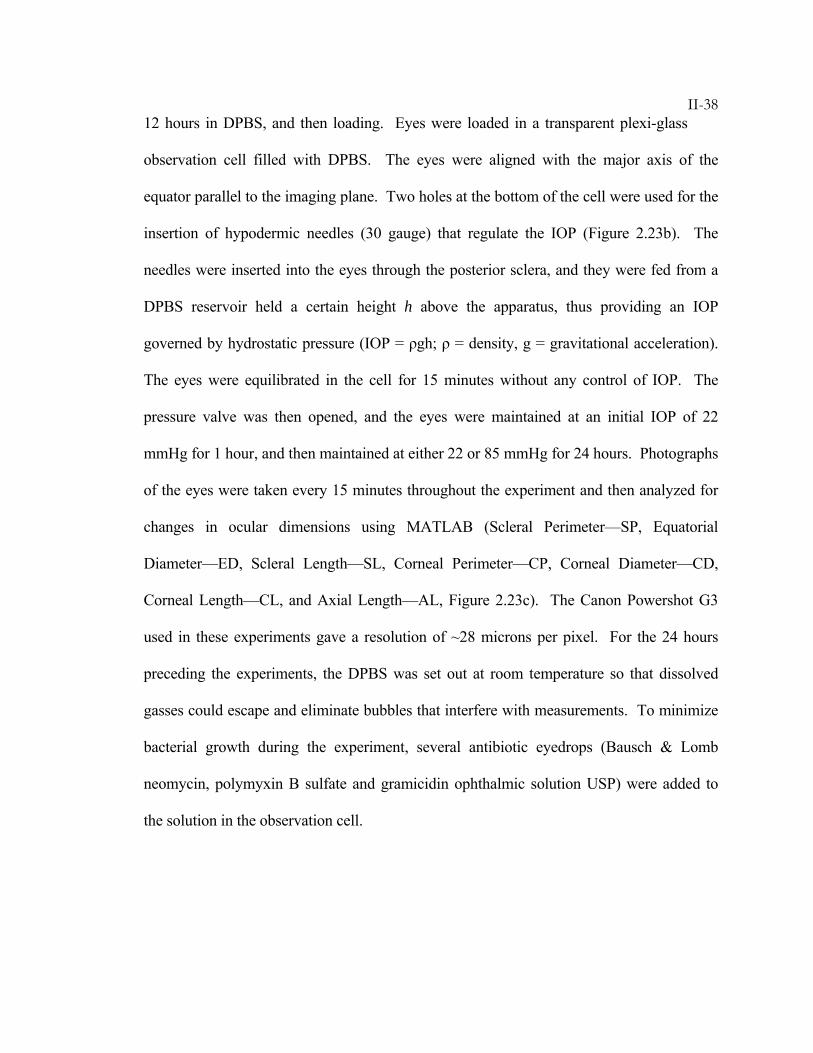
II-3812 hours in DPBS, and then loading. Eyes were loaded in a transparent plexi-glass
observation cell filled with DPBS. The eyes were aligned with the major axis of the
equator parallel to the imaging plane. Two holes at the bottom of the cell were used for the
insertion of hypodermic needles (30 gauge) that regulate the IOP (Figure 2.23b). The
needles were inserted into the eyes through the posterior sclera, and they were fed from a
DPBS reservoir held a certain height h above the apparatus, thus providing an IOP
governed by hydrostatic pressure (IOP = ρgh; ρ = density, g = gravitational acceleration).
The eyes were equilibrated in the cell for 15 minutes without any control of IOP. The
pressure valve was then opened, and the eyes were maintained at an initial IOP of 22
mmHg for 1 hour, and then maintained at either 22 or 85 mmHg for 24 hours. Photographs
of the eyes were taken every 15 minutes throughout the experiment and then analyzed for
changes in ocular dimensions using MATLAB (Scleral Perimeter—SP, Equatorial
Diameter—ED, Scleral Length—SL, Corneal Perimeter—CP, Corneal Diameter—CD,
Corneal Length—CL, and Axial Length—AL, Figure 2.23c). The Canon Powershot G3
used in these experiments gave a resolution of ~28 microns per pixel. For the 24 hours
preceding the experiments, the DPBS was set out at room temperature so that dissolved
gasses could escape and eliminate bubbles that interfere with measurements. To minimize
bacterial growth during the experiment, several antibiotic eyedrops (Bausch & Lomb
neomycin, polymyxin B sulfate and gramicidin ophthalmic solution USP) were added to
the solution in the observation cell.
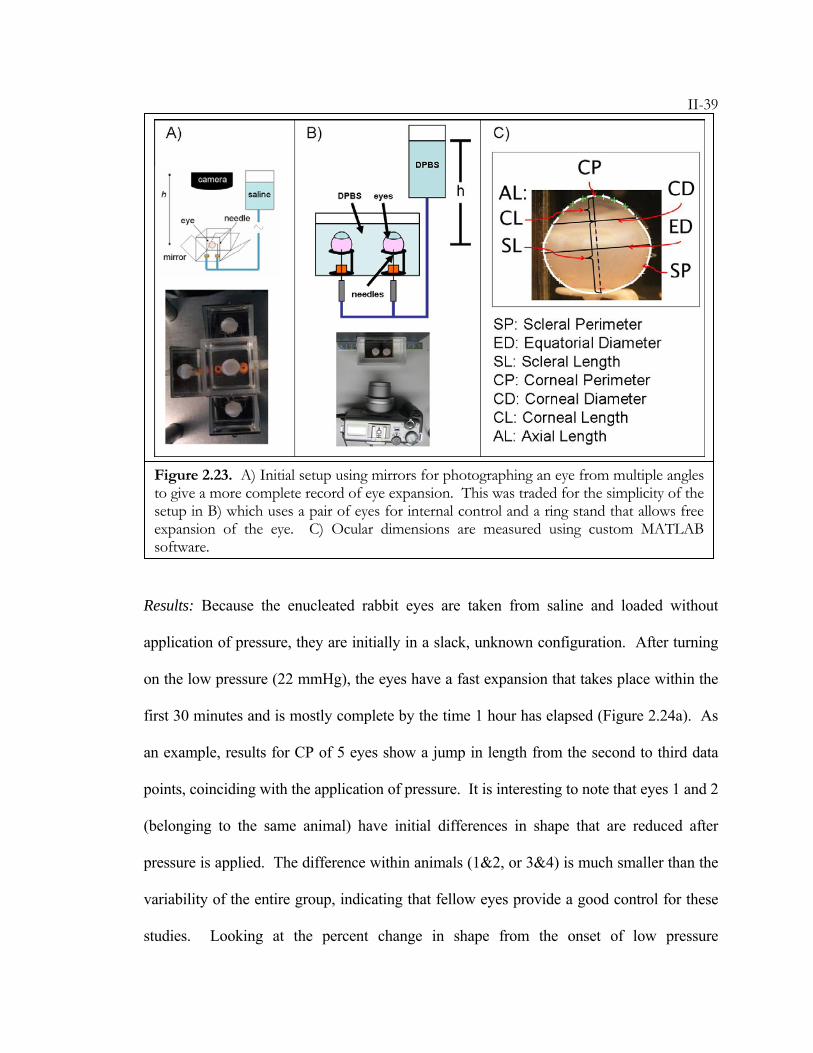
II-39
Results: Because the enucleated rabbit eyes are taken from saline and loaded without
application of pressure, they are initially in a slack, unknown configuration. After turning
on the low pressure (22 mmHg), the eyes have a fast expansion that takes place within the
first 30 minutes and is mostly complete by the time 1 hour has elapsed (Figure 2.24a). As
an example, results for CP of 5 eyes show a jump in length from the second to third data
points, coinciding with the application of pressure. It is interesting to note that eyes 1 and 2
(belonging to the same animal) have initial differences in shape that are reduced after
pressure is applied. The difference within animals (1&2, or 3&4) is much smaller than the
variability of the entire group, indicating that fellow eyes provide a good control for these
studies. Looking at the percent change in shape from the onset of low pressure
Figure 2.23. A) Initial setup using mirrors for photographing an eye from multiple angles to give a more complete record of eye expansion. This was traded for the simplicity of the setup in B) which uses a pair of eyes for internal control and a ring stand that allows free expansion of the eye. C) Ocular dimensions are measured using custom MATLAB software.
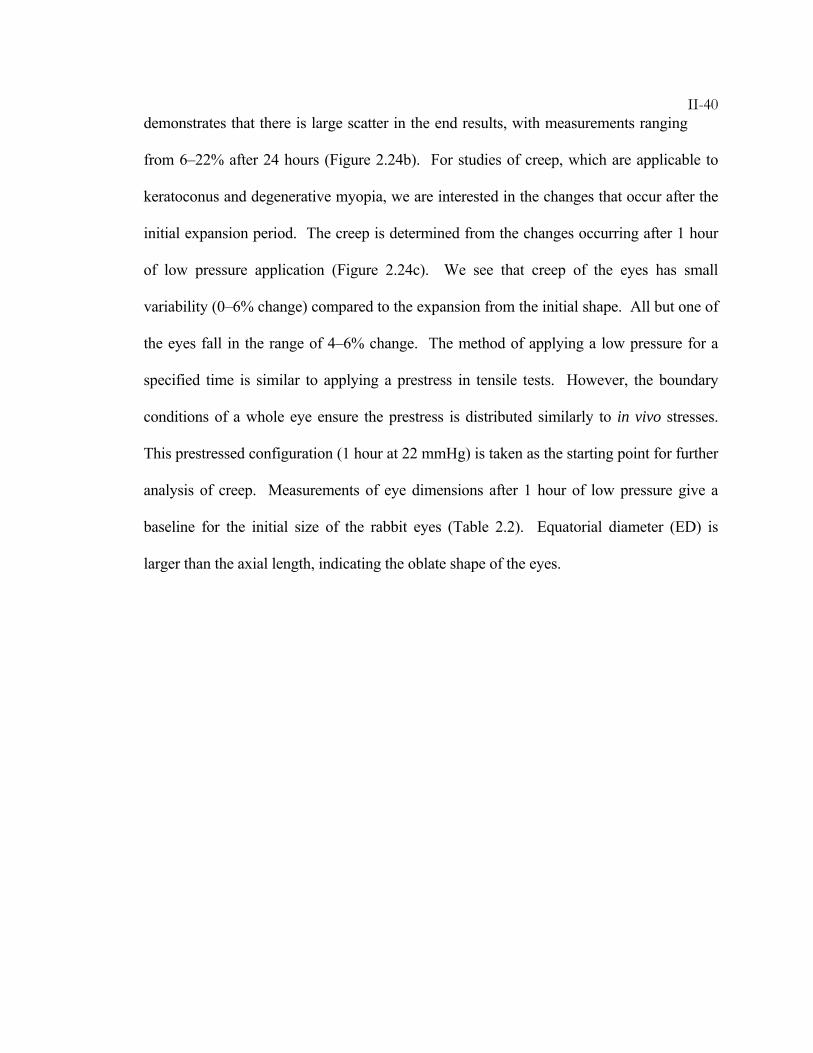
II-40demonstrates that there is large scatter in the end results, with measurements ranging
from 6–22% after 24 hours (Figure 2.24b). For studies of creep, which are applicable to
keratoconus and degenerative myopia, we are interested in the changes that occur after the
initial expansion period. The creep is determined from the changes occurring after 1 hour
of low pressure application (Figure 2.24c). We see that creep of the eyes has small
variability (0–6% change) compared to the expansion from the initial shape. All but one of
the eyes fall in the range of 4–6% change. The method of applying a low pressure for a
specified time is similar to applying a prestress in tensile tests. However, the boundary
conditions of a whole eye ensure the prestress is distributed similarly to in vivo stresses.
This prestressed configuration (1 hour at 22 mmHg) is taken as the starting point for further
analysis of creep. Measurements of eye dimensions after 1 hour of low pressure give a
baseline for the initial size of the rabbit eyes (Table 2.2). Equatorial diameter (ED) is
larger than the axial length, indicating the oblate shape of the eyes.
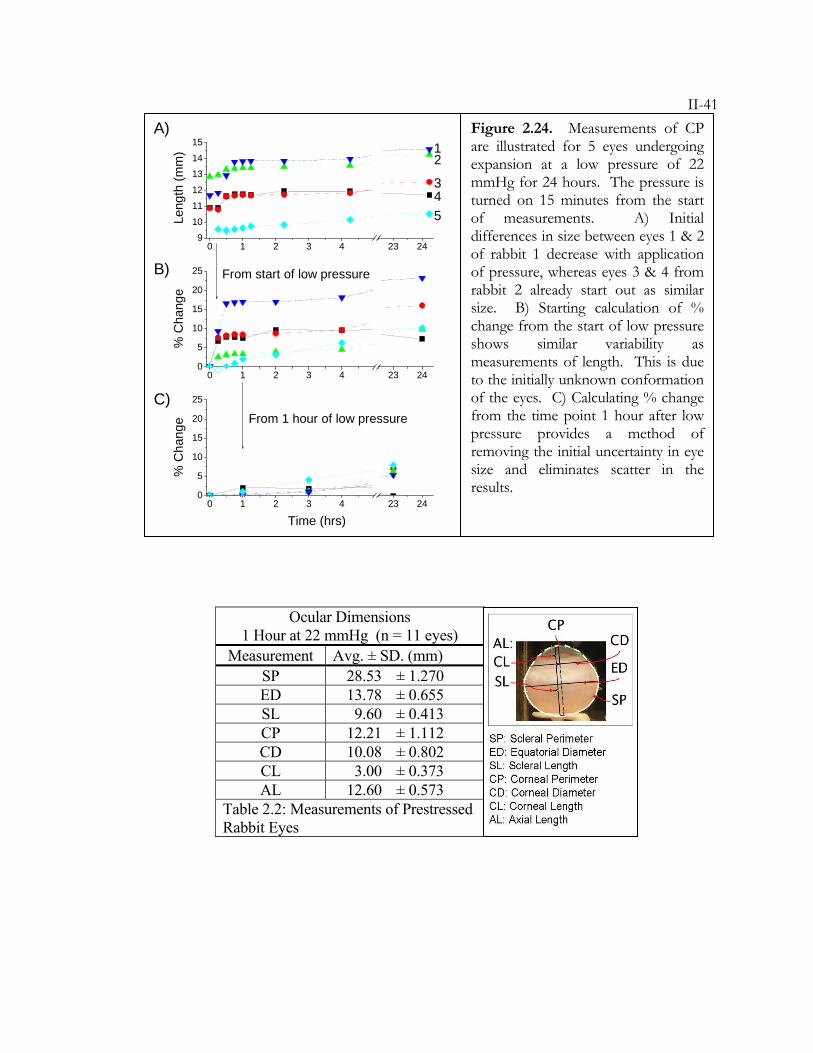
II-41
Figure 2.24. Measurements of CP are illustrated for 5 eyes undergoing expansion at a low pressure of 22 mmHg for 24 hours. The pressure is turned on 15 minutes from the start of measurements. A) Initial differences in size between eyes 1 & 2 of rabbit 1 decrease with application of pressure, whereas eyes 3 & 4 from rabbit 2 already start out as similar size. B) Starting calculation of % change from the start of low pressure shows similar variability as measurements of length. This is due to the initially unknown conformation of the eyes. C) Calculating % change from the time point 1 hour after low pressure provides a method of removing the initial uncertainty in eye size and eliminates scatter in the results.
0 1 2 3 4 23 249
10
11
12
13
14
15
0 1 2 3 4 23 240
5
10
15
20
25
0 1 2 3 4 23 240
5
10
15
20
25
Time (hrs)
Leng
th (m
m)
From start of low pressure
% C
hang
e
From 1 hour of low pressure
% C
hang
e
A)
B)
C)
1
5 4 3
2
Ocular Dimensions 1 Hour at 22 mmHg (n = 11 eyes)
Measurement Avg. ± SD. (mm) SP 28.53 ± 1.270 ED 13.78 ± 0.655 SL 9.60 ± 0.413 CP 12.21 ± 1.112 CD 10.08 ± 0.802 CL 3.00 ± 0.373 AL 12.60 ± 0.573
Table 2.2: Measurements of Prestressed Rabbit Eyes
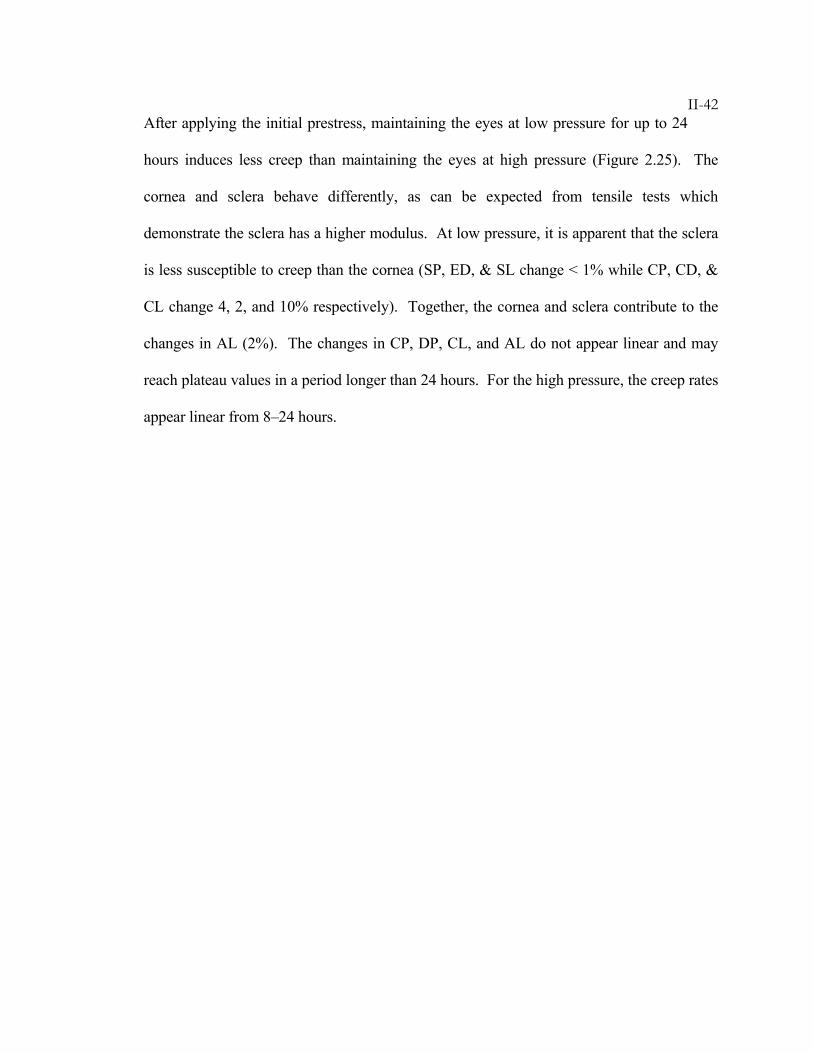
II-42After applying the initial prestress, maintaining the eyes at low pressure for up to 24
hours induces less creep than maintaining the eyes at high pressure (Figure 2.25). The
cornea and sclera behave differently, as can be expected from tensile tests which
demonstrate the sclera has a higher modulus. At low pressure, it is apparent that the sclera
is less susceptible to creep than the cornea (SP, ED, & SL change < 1% while CP, CD, &
CL change 4, 2, and 10% respectively). Together, the cornea and sclera contribute to the
changes in AL (2%). The changes in CP, DP, CL, and AL do not appear linear and may
reach plateau values in a period longer than 24 hours. For the high pressure, the creep rates
appear linear from 8–24 hours.
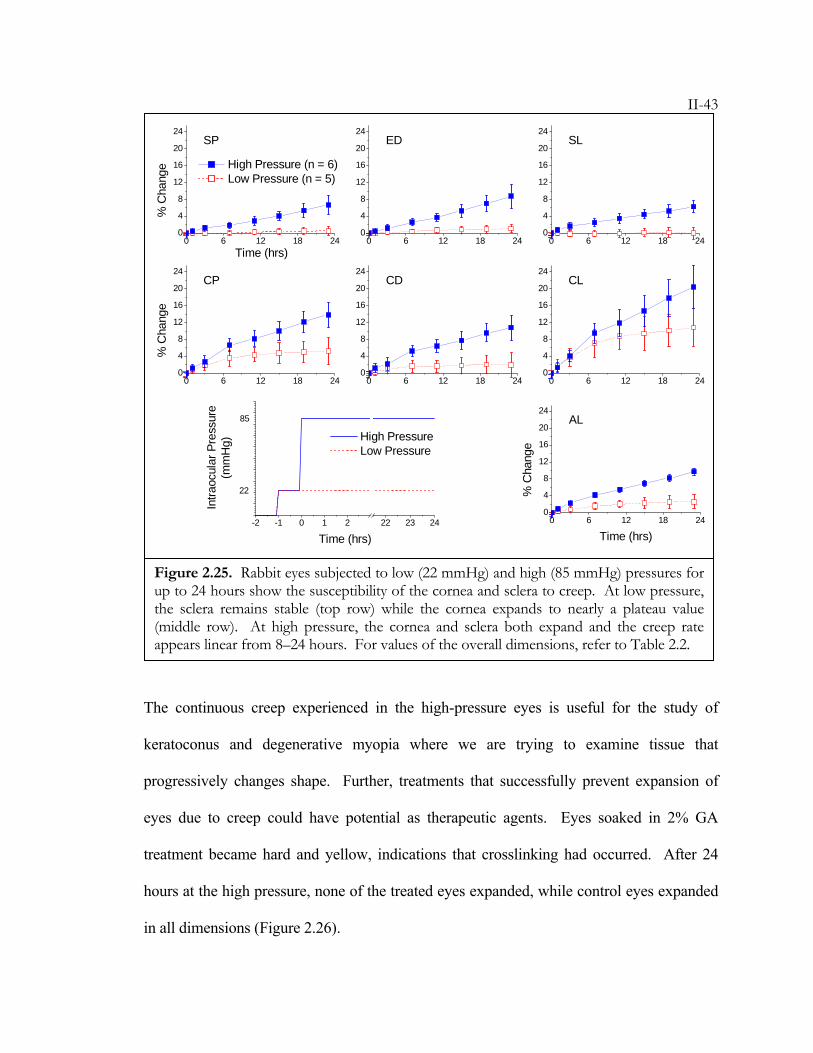
II-43
The continuous creep experienced in the high-pressure eyes is useful for the study of
keratoconus and degenerative myopia where we are trying to examine tissue that
progressively changes shape. Further, treatments that successfully prevent expansion of
eyes due to creep could have potential as therapeutic agents. Eyes soaked in 2% GA
treatment became hard and yellow, indications that crosslinking had occurred. After 24
hours at the high pressure, none of the treated eyes expanded, while control eyes expanded
in all dimensions (Figure 2.26).
0 6 12 18 240
4
8
12
16
20
24
0 6 12 18 240
4
8
12
16
20
24
0 6 12 18 240
4
8
12
16
20
24
0 6 12 18 240
4
8
12
16
20
24
0 6 12 18 240
4
8
12
16
20
24
0 6 12 18 240
4
8
12
16
20
24
0 6 12 18 240
4
8
12
16
20
24
Time (hrs)
High Pressure (n = 6) Low Pressure (n = 5)
SP
% C
hang
e
ED SL
CP
% C
hang
e
CD CL
AL
% C
hang
eTime (hrs)
-2 -1 0 1 2 22 23 24
High Pressure Low Pressure
22
85
Intra
ocul
ar P
ress
ure
(mm
Hg)
Time (hrs)
Figure 2.25. Rabbit eyes subjected to low (22 mmHg) and high (85 mmHg) pressures for up to 24 hours show the susceptibility of the cornea and sclera to creep. At low pressure, the sclera remains stable (top row) while the cornea expands to nearly a plateau value (middle row). At high pressure, the cornea and sclera both expand and the creep rate appears linear from 8–24 hours. For values of the overall dimensions, refer to Table 2.2.
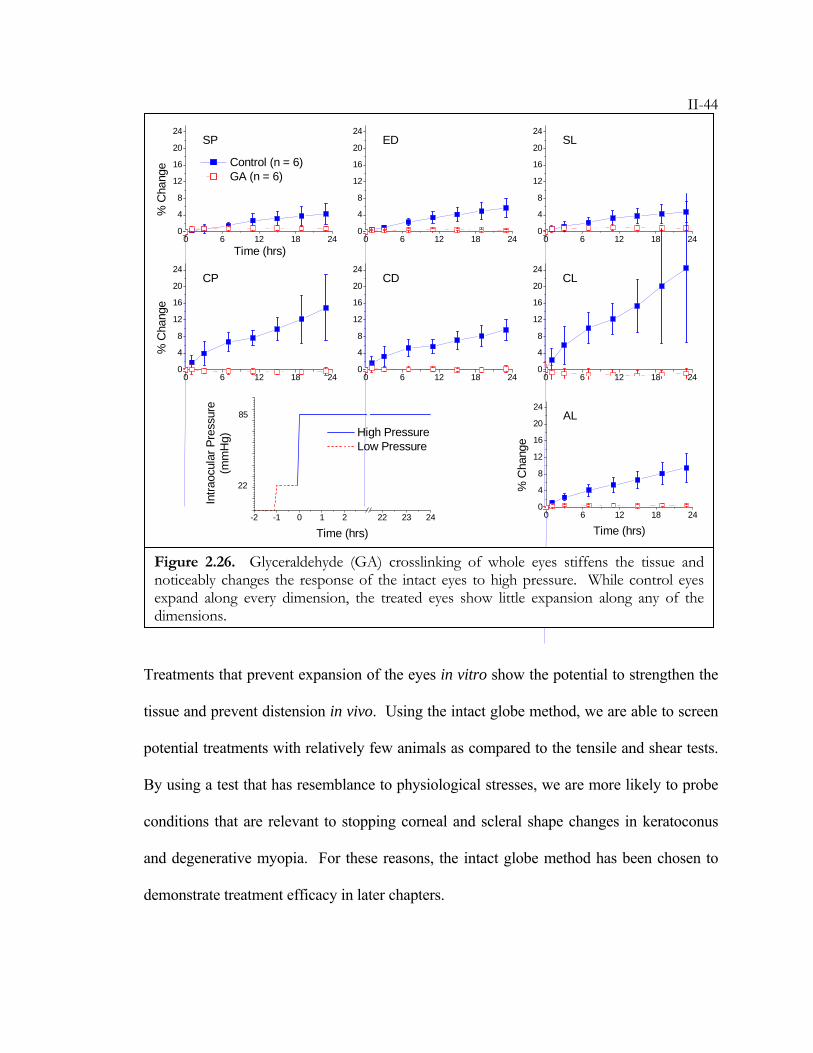
II-44
Treatments that prevent expansion of the eyes in vitro show the potential to strengthen the
tissue and prevent distension in vivo. Using the intact globe method, we are able to screen
potential treatments with relatively few animals as compared to the tensile and shear tests.
By using a test that has resemblance to physiological stresses, we are more likely to probe
conditions that are relevant to stopping corneal and scleral shape changes in keratoconus
and degenerative myopia. For these reasons, the intact globe method has been chosen to
demonstrate treatment efficacy in later chapters.
0 6 12 18 240
4
8
12
16
20
24
0 6 12 18 240
4
8
12
16
20
24
0 6 12 18 240
4
8
12
16
20
24
0 6 12 18 240
4
8
12
16
20
24
0 6 12 18 240
4
8
12
16
20
24
0 6 12 18 240
4
8
12
16
20
24
0 6 12 18 240
4
8
12
16
20
24
Time (hrs)
Control (n = 6) GA (n = 6)
SP
% C
hang
e
ED SL
CP
% C
hang
e
CD CL
AL
% C
hang
eTime (hrs)
-2 -1 0 1 2 22 23 24
High Pressure Low Pressure
22
85
Intra
ocul
ar P
ress
ure
(mm
Hg)
Time (hrs)
Figure 2.26. Glyceraldehyde (GA) crosslinking of whole eyes stiffens the tissue and noticeably changes the response of the intact eyes to high pressure. While control eyes expand along every dimension, the treated eyes show little expansion along any of the dimensions.
II-45The expansion studies developed here could also find application in the study of eyes
with altered mechanical properties. Currently, we use the tests to induce deformation in
normal tissue, but studies of diseased tissue may show increased susceptibility to distension
with worsening disease state. While this has been studied with tensile measurements, we
believe that this method will provide a fuller characterization of the changes. Studies of
molecules such as retinoic acid, which is known to cause increased axial growth in chicks,
could provide insight to the mechanisms by which changes occur in the sclera (cell
signaling, or direct effects on collagen). Such future work with this model is likely to yield
new insights to the field of eye biomechanics.
II-46BIBLIOGRAPHY
1. Hoeltzel, D.A., Altman, P., Buzard, K., Choe, K.I. Strip Extensiometry for
Comparison of the Mechanical Response of Bovine, Rabbit, and Human
Corneas. Journal of Biomechanical Engineering-Transactions of the ASME 114, 202-
215 (1992).
2. Zeng, Y.J., Yang, J., Huang, K., Lee, Z.H., Lee, X.Y. A comparison of
biomechanical properties between human and porcine cornea. Journal of
Biomechanics 34, 533-537 (2001).
3. Andreassen, T.T., Simonsen, A.H., Oxlund, H. Biomechanical Properties of
Keratoconus and Normal Corneas. Experimental Eye Research 31, 435-441
(1980).
4. Bryant, M.R., Szerenyi, K., Schmotzer, H., Mcdonnell, P.J. Corneal Tensile-
Strength in Fully Healed Radial Keratotomy Wounds. Investigative Ophthalmology
& Visual Science 35, 3022-3031 (1994).
5. Curtin, B.J. Physiopathologic aspects of scleral stress-strain. Trans Am
Ophthalmol Soc 67, 417-61 (1969).
6. Downs, J.C., Suh, J.K.F., Thomas, K.A., Bellezza, A.J., Burgoyne, C.F., Hart,
R.T. Viscoelastic characterization of peripapillary sclera: Material properties by
quadrant in rabbit and monkey eyes. Journal Of Biomechanical Engineering-
Transactions Of The ASME 125, 124-131 (2003).
7. Friberg, T.R., Lace, J.W. A Comparison of the Elastic Properties of Human
Choroid and Sclera. Experimental Eye Research 47, 429-436 (1988).
II-478. McBrien, N.A., Gentle, A. Role of the sclera in the development and
pathological complications of myopia. Progress In Retinal And Eye Research 22,
307-338 (2003).
9. Nash, I.S., Greene, P.R., Foster, C.S. Comparison of Mechanical-Properties of
Keratoconus and Normal Corneas. Experimental Eye Research 35, 413-424
(1982).
10. Nyquist, G.W. Rheology of Cornea - Experimental Techniques and Results.
Experimental Eye Research 7, 183-188 (1968).
11. Pandolfi, A., Manganiello, F. A model for the human cornea: constitutive
formulation and numerical analysis. Biomechanics and Modeling in Mechanobiology 5,
237-246 (2006).
12. Phillips, J.R., Khalaj, M., McBrien, N.A. Induced myopia associated with
increased scleral creep in chick and tree shrew eyes. Investigative Ophthalmology &
Visual Science 41, 2028-2034 (2000).
13. Phillips, J.R., McBrien, N.A. Form Deprivation Myopia - Elastic Properties Of
Sclera. Ophthalmic And Physiological Optics 15, 357-362 (1995).
14. Reichel, E., Miller, D., Blanco, E., Mastanduno, R. The Elastic-Modulus of
Central and Perilimbal Bovine Cornea. Annals of Ophthalmology 21, 205-208
(1989).
15. Shchukin, E.D., Izmailova, V.N., Larionova, N.I., Krasnov, M.M., Gurov,
A.N., Bessonov, A.I., Afanas'eva, G.N. Creep of the eye sclera. Materials
Research Innovations 2, 147-149 (1998).
16. Siegwart, J.T., Norton, T.T. Regulation of the mechanical properties of tree
shrew sclera by the visual environment. Vision Research 39, 387-407 (1999).
II-4817. Spoerl, E., Boehm, A.G., Pillunat, L.E. The influence of various substances on
the biomechanical behavior of lamina cribrosa and peripapillary sclera.
Investigative Ophthalmology & Visual Science 46, 1286-1290 (2005).
18. Spoerl, E., Boehm, A.G., Valtink, M., Pillunat, L.E. Changes of biomechanical
properties of lamina cribrosa and of peripapillary sclera by glyceraldehyde.
Investigative Ophthalmology & Visual Science 45, U789 (2004).
19. Spoerl, E., Hellmund, K., Schreiber, J., Seiler, T. In vivo-stiffening of the
rabbit cornea by riboflavin plus UV-irradiation and glutaraldehyde. Investigative
Ophthalmology & Visual Science 40, S339 (1999).
20. Spoerl, E., Huhle, M., Seiler, T. Induction of cross-links in corneal tissue.
Experimental Eye Research 66, 97-103 (1998).
21. Spoerl, E., Seiler, T. Techniques for stiffening the cornea. Journal Of Refractive
Surgery 15, 711-713 (1999).
22. Wollensak, G., Spoerl, E. Collagen crosslinking of human and porcine sclera.
Journal Of Cataract And Refractive Surgery 30, 689-695 (2004).
23. Wollensak, G., Spoerl, E., Seiler, T. Stress-strain measurements of human and
porcine corneas after riboflavin-ultraviolet-A-induced cross-linking. Journal Of
Cataract And Refractive Surgery 29, 1780-1785 (2003).
24. Pinsky, P.M., Datye, D.V. A microstructurally-based finite element model of
the incised human cornea. Journal of Biomechanics 24, 907-909 (1991).
25. Soergel, F., Muecke, S., Pechhold, W. Corneal Viscoelasticity Spectra as a
Result of Dynamic Mechanical Analysis. in Advances in Corneal Research: Selected
Transactions of the World Congress on the Cornea IV (ed. J. H. Lass) 257-272 (1997).
II-4926. Mattson, M., Schwartz, D.M., Kornfield, J.A. Mechanical measurements of
sclera for screening myopia treatments. Investigative Ophthalmology & Visual
Science 46(2005).
27. Nickerson, C.S., Karageozian, H.L., Park, J., Kornfield, J.A. The mechanical
properties of the vitreous humor. Investigative Ophthalmology & Visual Science 45,
U113 (2004).
28. Nickerson, C.S., Karageozian, H.L., Park, J., Kornfield, J.A. Chemical
resilience of the vitreous and vitreoretinal interface. Investigative Ophthalmology &
Visual Science 46, 5165 (2005).
29. Nickerson, C.S., Kornfield, J.A. A "cleat" geometry for suppressing wall slip.
Journal Of Rheology 49, 865-874 (2005).
30. Prausnitz, M.R., Noonan, J.S. Permeability of cornea, sclera, and conjunctiva:
A literature analysis for drug delivery to the eye. Journal Of Pharmaceutical Sciences
87, 1479-1488 (1998).
31. Jin, M.S., Grodzinsky, A.J. Effect of electrostatic interactions between
glycosaminoglycans on the shear stiffness of cartilage: A molecular model and
experiments. Macromolecules 34, 8330-8339 (2001).
32. Kuettner, K.K.E., Lindenbaum, A.A. Analysis of mucopolysaccharides in
partially aqueous media. Biochimica et biophysica acta 101, 223-5 (1965).
33. Nishiyama, N., Suzuki, K., Nagatsuka, A., Yokota, I., Nemoto, K. Dissociation
States of Collagen Functional Groups and their Effects on the Priming
Efficacy of HEMA Bonded to Collagen. J Dent Res 82, 257-261 (2003).
34. Greene, P.R., Mcmahon, T.A. Scleral Creep Vs Temperature and Pressure
Invitro. Experimental Eye Research 29, 527-537 (1979).
II-5035. Arciniegas, A., Amaya, L.E. Mechanical-Behavior of the Sclera. Ophthalmologica
193, 45-55 (1986).
36. Cahane, M., Bartov, E. Axial Length and Scleral Thickness Effect on
Susceptibility to Glaucomatous Damage - a Theoretical-Model Implementing
Laplaces Law. Ophthalmic Research 24, 280-284 (1992).
37. Forster, W., Kasprzak, H., Vonbally, G. Measurement of Elastic-Modulus of
the Central Bovine Cornea by Means of Holographic-Interferometry .2.
Results. Optometry and Vision Science 71, 27-32 (1994).
38. Girard, M., Downs, J.C., Burgoyne, C.F., Suh, J.K.F. Experimental surface
strain mapping of porcine peripapillary sclera under Intraocular pressure.
Investigative Ophthalmology & Visual Science 46, 1271 (2005).
39. Greene, P.R. Mechanical Considerations in Myopia - Relative Effects of
Accommodation, Convergence, Intraocular-Pressure, and the Extra-Ocular
Muscles. American Journal of Optometry and Physiological Optics 57, 902-914 (1980).
40. McEwen, W.K., Sthelen, R. Rheology Of Human Sclera - Unifying
Formulation Of Ocular Rigidity. Ophthalmologica 150, 321-346 (1965).
41. Phillips, J.R., McBrien, N.A. Pressure-induced changes in axial eye length of
chick and tree shrew: Significance of myofibroblasts in the sclera. Investigative
Ophthalmology & Visual Science 45, 758-763 (2004).
42. Pierscionek, B.K., Widlicka, M., Schachar, R.A. The effect of changing
intraocular pressure on the corneal and scleral curvatures in the fresh porcine
eye. Br J Ophthalmol, bjo.2006.110221 (2006).

II-5143. Purslow, P.P., Karwatowski, W.S.S. Ocular elasticity - Is engineering stiffness a
more useful characterization parameter than ocular rigidity? Ophthalmology 103,
1686-1692 (1996).
44. Richards, R.D., Tittel, P.G. Corneal and Scleral Distensibility Ratio on
Enucleated Human Eyes. Investigative Ophthalmology 12, 145-151 (1973).
45. Sampson, W.G., Girard, L.J. The coefficient of scleral rigidity. Effect of
variation of the intraocular volume. Am J Ophthalmol 52, 789-99 (1961).
46. Sthelen, R., McEwen, W.K. Rheology Of Human Sclera .1. Anelastic Behavior.
American Journal Of Ophthalmology 52, 539-548 (1961).
47. Sthelen, R., McEwen, W.K. Rheology Of Human Sclera. American Journal Of
Ophthalmology 51, 328 (1961).
48. Tittel, P.G., Richards, R.D. Distensibility Measurements of Rabbit Eye.
Investigative Ophthalmology 10, 800-809 (1971).
49. Woo, S.L.Y., Schlegel, W.A., Kobayash, A.S., Lawrence, C. Nonlinear Material
Properties of Intact Cornea and Sclera. Experimental Eye Research 14, 29-39
(1972).
III-1C h a p t e r 3
PHOTOACTIVATED TREATMENT USING VISIBLE LIGHT
3.1 Introduction ........................................................................................III-1 3.2 Photoinitiator Systems........................................................................III-3 3.3 Temporal and Spatial Control of Treatments ....................................III-6 3.3.1 Temporal Control of Treatments ....................................................III-6 3.3.2 Spatial Control of Treatments.........................................................III-8 3.4 Light Safety and Clinical Relevance ...............................................III-10 Bibliography ...........................................................................................III-14
This work has been done in collaboration with CJ Yu, Dennis Ko, and Muzhou Wang. Dr.
CJ Yu synthesized PEGylated Eosin Y. Undergraduates Dennis Ko and Muzhou Wang
assisted with spatial control and temporal control experiments respectively.
3.1 Introduction
Treatment of keratoconus and degenerative myopia have been proposed that aim to prevent
tissue deformation by reinforcing the tissue, using crosslinking, which has been shown to
increase tissue modulus and strength (Chapter 2). Wollensak, Seiler, Spoerl, and co-
workers have developed a photoactivated crosslinking system as a potential treatment to
arrest progression of keratoconus.1-14 Through a series of laboratory and clinical studies,
these investigators have demonstrated the efficacy of this treatment for keratoconus, and
examined the possibility of using this treatment for degenerative myopia. A
photosensitizing agent (riboflavin) is administered to the cornea then activated by
excitation with ultraviolet light (UV-A), inducing crosslinking within the tissue. In vitro
III-2study of UV-A irradiation after treatment with riboflavin showed an increase in
modulus greater than 3 times for human corneal strips8 and human sclera specimens.20 In
vivo experiments in a rabbit model showed that UV-A/riboflavin treatment of the cornea
caused a 12% increase in collagen fiber diameter, an effect that may contribute to the
increase in corneal modulus.14 FDA clinical trials are currently underway to determine the
safety of UV-A/riboflavin treatment for keratoconus.
Photoactivated crosslinking systems such as UV-A/riboflavin have advantages in temporal
and spatial control over traditional crosslinking agents or reducing sugars. First, traditional
crosslinkers begin to react as soon as they contact the tissue and create intermediary
products that can continue reacting for minutes to days after removal of the excess reducing
sugars. This effect is evident in the additional 50% increase of the shear modulus observed
over the first 24 hours after rinsing excess glyceraldehyde from the sclera (Figure 2.16).
Ideally, a photoactivatable solution could be delivered to an area and then allowed to
diffuse into tissue before activation. Then upon activation, crosslinking would commence.
After irradiation, no further modification would occur, giving the ability to precisely
control the degree of crosslinking. Second, traditional crosslinking is mediated by small
molecules that spread quickly by diffusion—both into the intended tissue and surrounding
tissues. In the eye, there is the potential that crosslinking agents will be swept away in tears
and in circulation, and there is a potential hazard that agents like GA will continue creating
crosslinks as they move through the body. This poses a danger in the eye where
crosslinking in sensitive areas, such as the retina, should be avoided. Photoactivated
crosslinking can be localized to the intended area by selective irradiation.
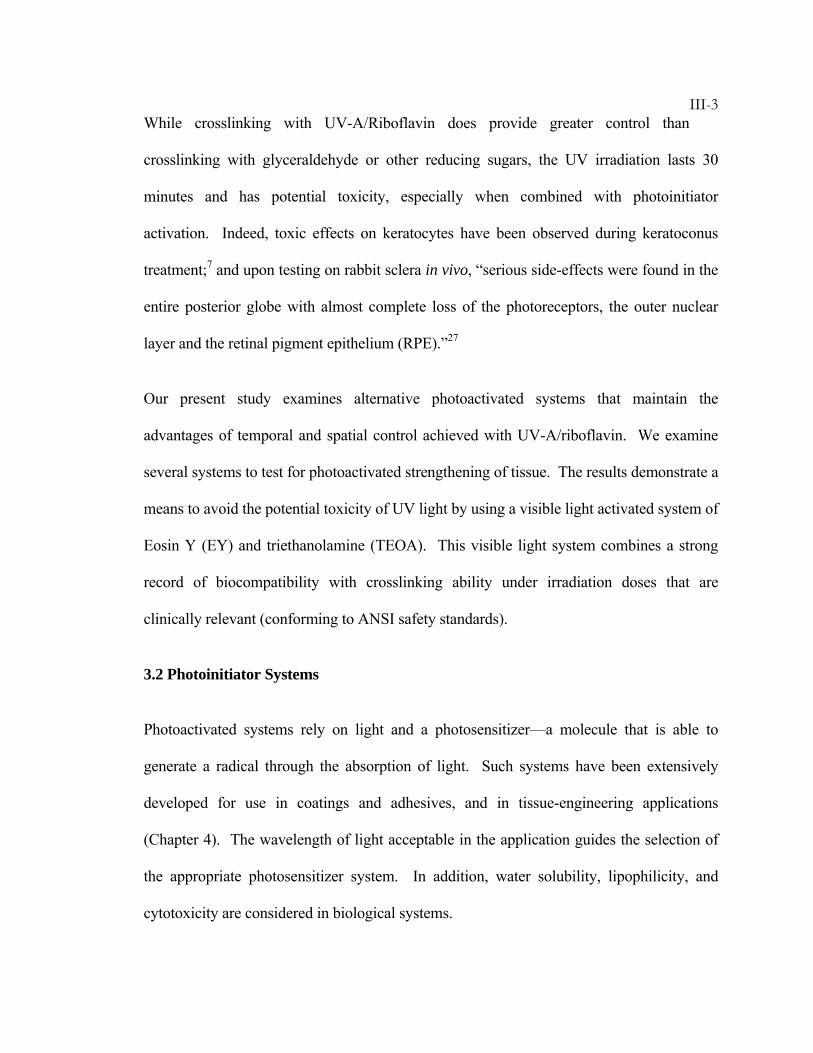
III-3While crosslinking with UV-A/Riboflavin does provide greater control than
crosslinking with glyceraldehyde or other reducing sugars, the UV irradiation lasts 30
minutes and has potential toxicity, especially when combined with photoinitiator
activation. Indeed, toxic effects on keratocytes have been observed during keratoconus
treatment;7 and upon testing on rabbit sclera in vivo, “serious side-effects were found in the
entire posterior globe with almost complete loss of the photoreceptors, the outer nuclear
layer and the retinal pigment epithelium (RPE).”27
Our present study examines alternative photoactivated systems that maintain the
advantages of temporal and spatial control achieved with UV-A/riboflavin. We examine
several systems to test for photoactivated strengthening of tissue. The results demonstrate a
means to avoid the potential toxicity of UV light by using a visible light activated system of
Eosin Y (EY) and triethanolamine (TEOA). This visible light system combines a strong
record of biocompatibility with crosslinking ability under irradiation doses that are
clinically relevant (conforming to ANSI safety standards).
3.2 Photoinitiator Systems
Photoactivated systems rely on light and a photosensitizer—a molecule that is able to
generate a radical through the absorption of light. Such systems have been extensively
developed for use in coatings and adhesives, and in tissue-engineering applications
(Chapter 4). The wavelength of light acceptable in the application guides the selection of
the appropriate photosensitizer system. In addition, water solubility, lipophilicity, and
cytotoxicity are considered in biological systems.
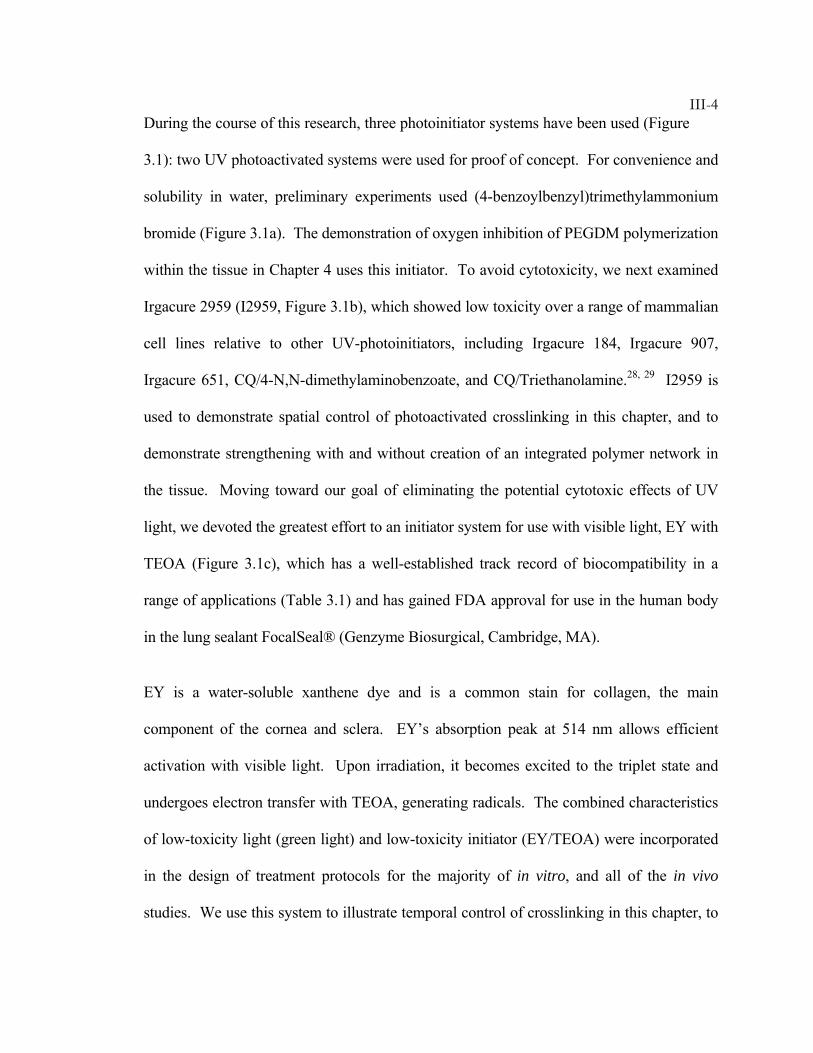
III-4During the course of this research, three photoinitiator systems have been used (Figure
3.1): two UV photoactivated systems were used for proof of concept. For convenience and
solubility in water, preliminary experiments used (4-benzoylbenzyl)trimethylammonium
bromide (Figure 3.1a). The demonstration of oxygen inhibition of PEGDM polymerization
within the tissue in Chapter 4 uses this initiator. To avoid cytotoxicity, we next examined
Irgacure 2959 (I2959, Figure 3.1b), which showed low toxicity over a range of mammalian
cell lines relative to other UV-photoinitiators, including Irgacure 184, Irgacure 907,
Irgacure 651, CQ/4-N,N-dimethylaminobenzoate, and CQ/Triethanolamine.28, 29 I2959 is
used to demonstrate spatial control of photoactivated crosslinking in this chapter, and to
demonstrate strengthening with and without creation of an integrated polymer network in
the tissue. Moving toward our goal of eliminating the potential cytotoxic effects of UV
light, we devoted the greatest effort to an initiator system for use with visible light, EY with
TEOA (Figure 3.1c), which has a well-established track record of biocompatibility in a
range of applications (Table 3.1) and has gained FDA approval for use in the human body
in the lung sealant FocalSeal® (Genzyme Biosurgical, Cambridge, MA).
EY is a water-soluble xanthene dye and is a common stain for collagen, the main
component of the cornea and sclera. EY’s absorption peak at 514 nm allows efficient
activation with visible light. Upon irradiation, it becomes excited to the triplet state and
undergoes electron transfer with TEOA, generating radicals. The combined characteristics
of low-toxicity light (green light) and low-toxicity initiator (EY/TEOA) were incorporated
in the design of treatment protocols for the majority of in vitro, and all of the in vivo
studies. We use this system to illustrate temporal control of crosslinking in this chapter, to
III-5demonstrate stabilization of eye shape using integrated polymer networks created in
vivo in Chapter 4, and it is the system used for development toward a treatment of
degenerative myopia (Chapter 5) and treatment of keratoconus (Chapter 6).
Authors Application Nakayama et al.15 Hemostasis of Liver Tissue Orban et al16 Cardiovascular Applications Cruise et. al., Pathak et al., Desmangles et al.17-19
Islet Cell Encapsulation / Microencapsulation
Elisseeff et al.21 Transdermal Polymerization Luman et al. Carnahan et al.22, 23
Close Linear Corneal Incisions, Secure Lasik flaps
Alleyne et al.24 Dural Sealant in Canine Craniotomy (FocalSeal)
West et al.25, 26 Thrombosis Inhibition Table 3.1. Literature Demonstrating Biocompatibility of Eosin Y
(4-Benzoylbenzyl)trimethylammonium Bromide
Triethanolamine Eosin Y
Figure 3.1. A) (4-Benzoylbenzyl)trimethylammonium Bromide and B) Irgacure 2959 are UV activated photoinitiators, and C) Eosin Y/TEOA is a visible light activated system
A)
C)
B)
III-63.3 Temporal and Spatial Control of Treatments
The following in vitro experiments illustrate the ability to control the degree of crosslinking
using the duration of irradiation, and to achieve spatial control of photoactivated
treatments. Collagen gels are used in lieu of cornea or sclera specimens to establish the
relationship between irradiation time and extent of crosslinking. Irradiation of porcine
sclera through a mask is used to demonstrate spatially resolved activation.
3.3.1 Temporal Control of Treatments
Methods: We have built custom photorheology equipment that allows us to record changes
in mechanical properties of specimens during irradiation. Using this, we record the
modulus of collagen gels with time before, during, and after irradiation.
For these experiments, 8-mm-diameter circular sections of 1-mm-thick slabs of 20%
gelatin with 0.0289 mM Eosin Y and 90 mM TEOA were mounted on the center of the
shear rheometer (AR1000, TA Instruments) modified to allow measurement of light-
induced changes (Figure 3.2). The sample was subjected to oscillatory shear with a stress
amplitude of 30 Pa and frequency of 0.3 rad/sec, at which the initial storage modulus is
approximately 3000 Pa. The dynamic moduli were recorded every 48 seconds for 20
minutes prior to irradiation, during 20 minutes of irradiation, and then monitored for 20
minutes while in the dark (Figure 3.3). Light emitting diodes (LEDs) at 525 ± 16 nm were
used to give an irradiance at the sample of 1–3 mW/cm2.
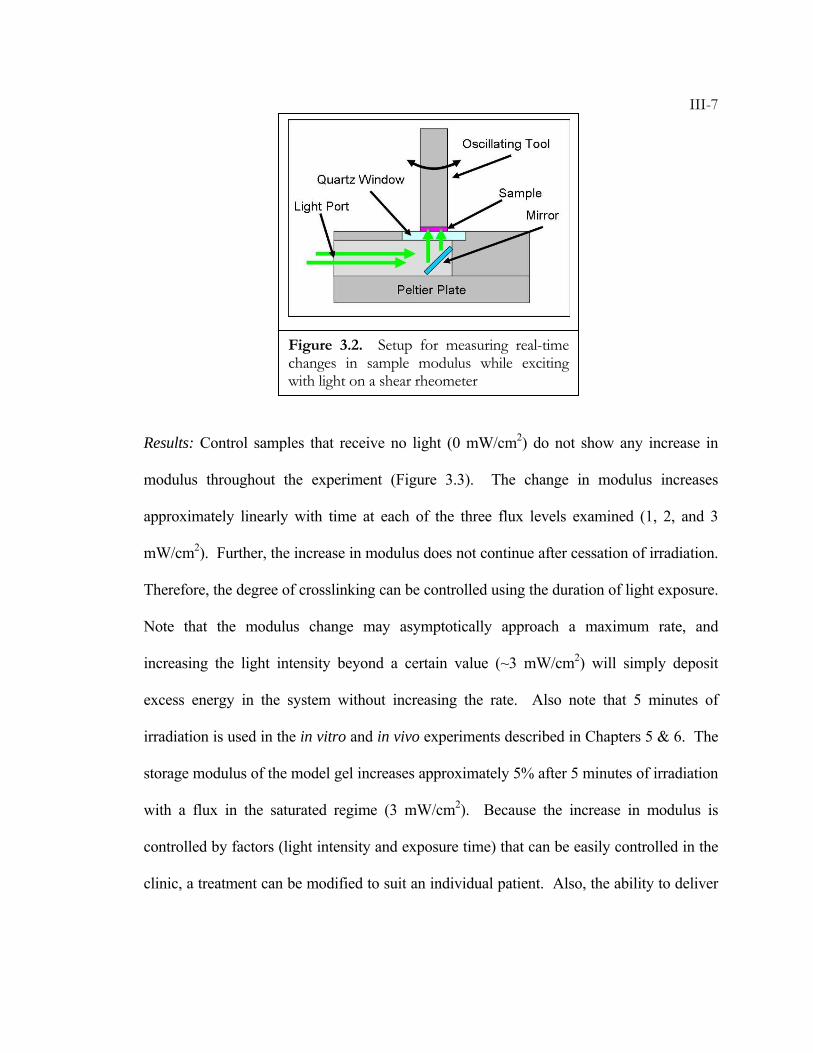
III-7
Results: Control samples that receive no light (0 mW/cm2) do not show any increase in
modulus throughout the experiment (Figure 3.3). The change in modulus increases
approximately linearly with time at each of the three flux levels examined (1, 2, and 3
mW/cm2). Further, the increase in modulus does not continue after cessation of irradiation.
Therefore, the degree of crosslinking can be controlled using the duration of light exposure.
Note that the modulus change may asymptotically approach a maximum rate, and
increasing the light intensity beyond a certain value (~3 mW/cm2) will simply deposit
excess energy in the system without increasing the rate. Also note that 5 minutes of
irradiation is used in the in vitro and in vivo experiments described in Chapters 5 & 6. The
storage modulus of the model gel increases approximately 5% after 5 minutes of irradiation
with a flux in the saturated regime (3 mW/cm2). Because the increase in modulus is
controlled by factors (light intensity and exposure time) that can be easily controlled in the
clinic, a treatment can be modified to suit an individual patient. Also, the ability to deliver
Figure 3.2. Setup for measuring real-time changes in sample modulus while exciting with light on a shear rheometer
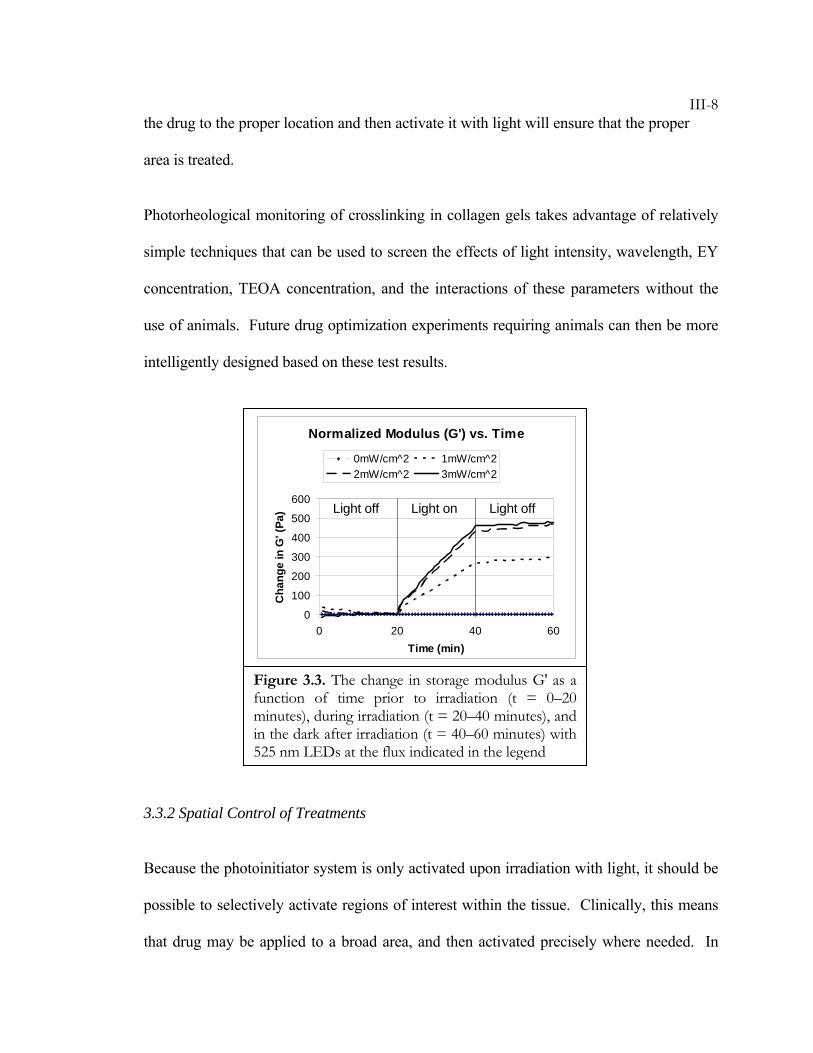
III-8the drug to the proper location and then activate it with light will ensure that the proper
area is treated.
Photorheological monitoring of crosslinking in collagen gels takes advantage of relatively
simple techniques that can be used to screen the effects of light intensity, wavelength, EY
concentration, TEOA concentration, and the interactions of these parameters without the
use of animals. Future drug optimization experiments requiring animals can then be more
intelligently designed based on these test results.
3.3.2 Spatial Control of Treatments
Because the photoinitiator system is only activated upon irradiation with light, it should be
possible to selectively activate regions of interest within the tissue. Clinically, this means
that drug may be applied to a broad area, and then activated precisely where needed. In
Figure 3.3. The change in storage modulus G′ as a function of time prior to irradiation (t = 0–20 minutes), during irradiation (t = 20–40 minutes), and in the dark after irradiation (t = 40–60 minutes) with 525 nm LEDs at the flux indicated in the legend
Normalized Modulus (G') vs. Time
0
100
200
300
400
500
600
0 20 40 60Time (min)
Cha
nge
in G
' (Pa
)
0mW/cm^2 1mW/cm^22mW/cm^2 3mW/cm^2
Light off Light off Light on
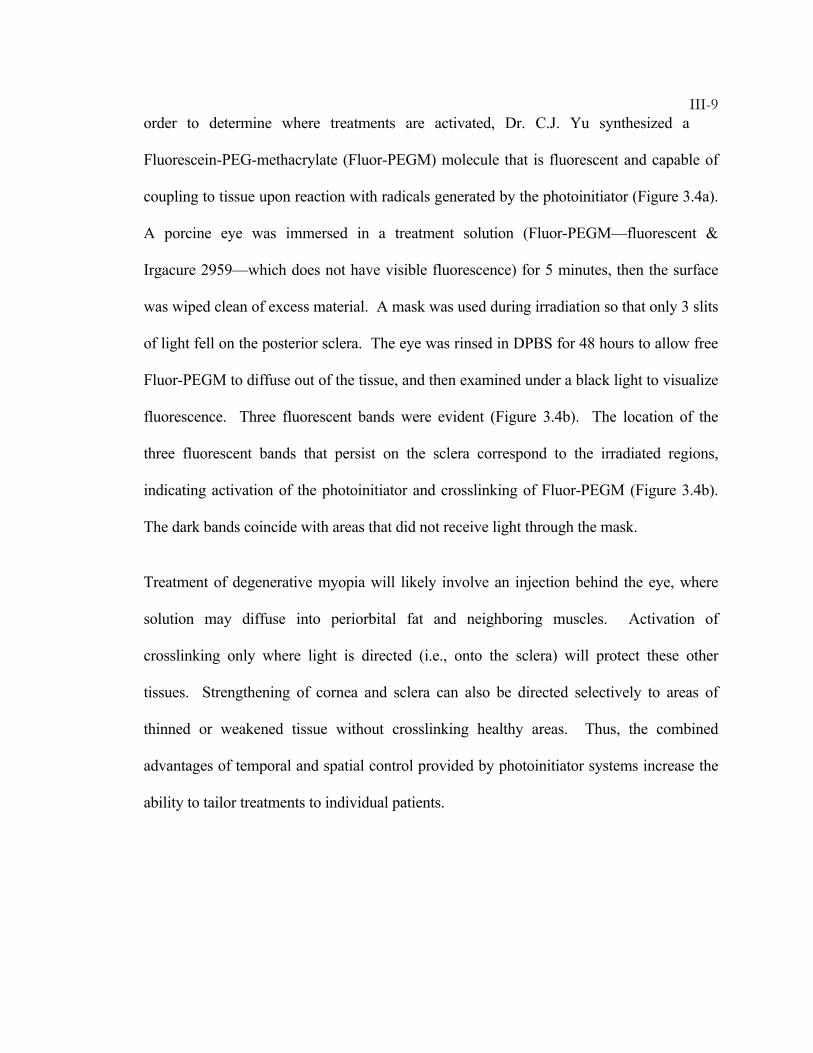
III-9order to determine where treatments are activated, Dr. C.J. Yu synthesized a
Fluorescein-PEG-methacrylate (Fluor-PEGM) molecule that is fluorescent and capable of
coupling to tissue upon reaction with radicals generated by the photoinitiator (Figure 3.4a).
A porcine eye was immersed in a treatment solution (Fluor-PEGM—fluorescent &
Irgacure 2959—which does not have visible fluorescence) for 5 minutes, then the surface
was wiped clean of excess material. A mask was used during irradiation so that only 3 slits
of light fell on the posterior sclera. The eye was rinsed in DPBS for 48 hours to allow free
Fluor-PEGM to diffuse out of the tissue, and then examined under a black light to visualize
fluorescence. Three fluorescent bands were evident (Figure 3.4b). The location of the
three fluorescent bands that persist on the sclera correspond to the irradiated regions,
indicating activation of the photoinitiator and crosslinking of Fluor-PEGM (Figure 3.4b).
The dark bands coincide with areas that did not receive light through the mask.
Treatment of degenerative myopia will likely involve an injection behind the eye, where
solution may diffuse into periorbital fat and neighboring muscles. Activation of
crosslinking only where light is directed (i.e., onto the sclera) will protect these other
tissues. Strengthening of cornea and sclera can also be directed selectively to areas of
thinned or weakened tissue without crosslinking healthy areas. Thus, the combined
advantages of temporal and spatial control provided by photoinitiator systems increase the
ability to tailor treatments to individual patients.
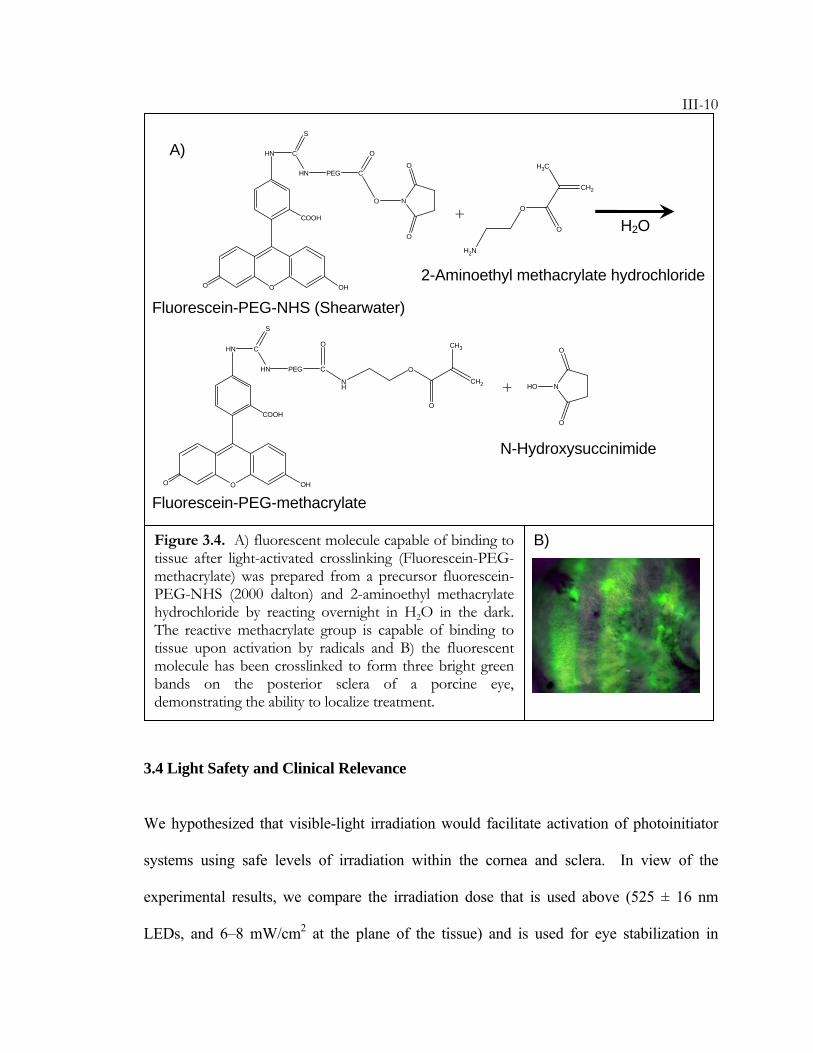
III-10
3.4 Light Safety and Clinical Relevance
We hypothesized that visible-light irradiation would facilitate activation of photoinitiator
systems using safe levels of irradiation within the cornea and sclera. In view of the
experimental results, we compare the irradiation dose that is used above (525 ± 16 nm
LEDs, and 6–8 mW/cm2 at the plane of the tissue) and is used for eye stabilization in
O OHO
COOH
HN C
HN
S
PEG C
O
O N
O
O
CH2
H3C
O
O
H2N
O OHO
COOH
HN C
HN
S
PEG C
O
NH
CH2
CH3
O
O
HO N
O
O
+
+
Fluorescein-PEG-NHS (Shearwater)
2-Aminoethyl methacrylate hydrochloride
Fluorescein-PEG-methacrylate
N-Hydroxysuccinimide
H2O
Figure 3.4. A) fluorescent molecule capable of binding to tissue after light-activated crosslinking (Fluorescein-PEG-methacrylate) was prepared from a precursor fluorescein-PEG-NHS (2000 dalton) and 2-aminoethyl methacrylate hydrochloride by reacting overnight in H2O in the dark. The reactive methacrylate group is capable of binding to tissue upon activation by radicals and B) the fluorescent molecule has been crosslinked to form three bright green bands on the posterior sclera of a porcine eye, demonstrating the ability to localize treatment.
A)
B)
III-11Chapters 5 and 6 to existing standards for safe exposure. The American National
Standards Institute (ANSI) provides the American National Standard for Safe Use of
Lasers30, and although we are using an LED light source instead of lasers, these standards
provide a guideline for the safe irradiation of the eye. Because of reduced photochemical
hazards at longer wavelengths, the maximum permissible exposure (MPE) of the retina to
green light (525 ± 16 nm) is approximately 30 times greater than the MPE for blue light
(400 nm). We use the MPE for blue light (2.7 J/cm2) to make a conservative estimate for
irradiation safety. The safety thresholds for clinical treatment of keratoconus are more
stringent than those for degenerative myopia due to the potential exposure of the retina to
the treatment irradiation.
For keratoconus treatment, light directed onto the cornea is transmitted through the cornea,
lens, and vitreous and to the retina with minimal loss. Using the MPE for retinal irradiance
(ER), we can calculate the maximum permissible source radiance (LS):
2
24
P
RS d
fEL⋅⋅⋅⋅
=τπ
, 31
where τ is the transmission through the ocular media (conservatively taken to be 100%), f is
the focal length of the eye (1.7 cm), and dP is the diameter of the pupil (0.7 cm). This gives
LS of 20 J/(cm2sr). Calculating the exposure at the cornea can be done using the geometry
of the light source, which can be taken as 1 cm in diameter (DS) a distance 1 cm from the
cornea (r). The irradiance at the cornea is:
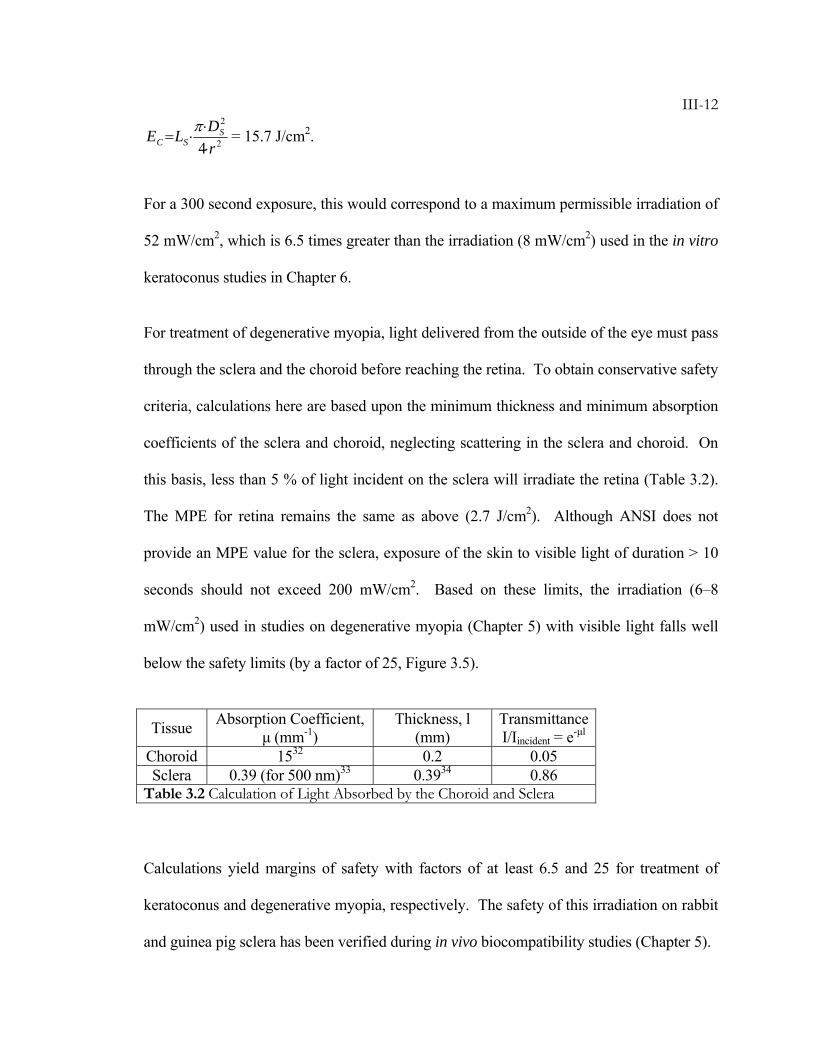
III-12
2
2
4 rDLE S
SC ⋅⋅
⋅=π = 15.7 J/cm2.
For a 300 second exposure, this would correspond to a maximum permissible irradiation of
52 mW/cm2, which is 6.5 times greater than the irradiation (8 mW/cm2) used in the in vitro
keratoconus studies in Chapter 6.
For treatment of degenerative myopia, light delivered from the outside of the eye must pass
through the sclera and the choroid before reaching the retina. To obtain conservative safety
criteria, calculations here are based upon the minimum thickness and minimum absorption
coefficients of the sclera and choroid, neglecting scattering in the sclera and choroid. On
this basis, less than 5 % of light incident on the sclera will irradiate the retina (Table 3.2).
The MPE for retina remains the same as above (2.7 J/cm2). Although ANSI does not
provide an MPE value for the sclera, exposure of the skin to visible light of duration > 10
seconds should not exceed 200 mW/cm2. Based on these limits, the irradiation (6–8
mW/cm2) used in studies on degenerative myopia (Chapter 5) with visible light falls well
below the safety limits (by a factor of 25, Figure 3.5).
Tissue Absorption Coefficient, μ (mm-1)
Thickness, l (mm)
Transmittance I/Iincident = e-μl
Choroid 1532 0.2 0.05 Sclera 0.39 (for 500 nm)33 0.3934 0.86
Table 3.2 Calculation of Light Absorbed by the Choroid and Sclera
Calculations yield margins of safety with factors of at least 6.5 and 25 for treatment of
keratoconus and degenerative myopia, respectively. The safety of this irradiation on rabbit
and guinea pig sclera has been verified during in vivo biocompatibility studies (Chapter 5).
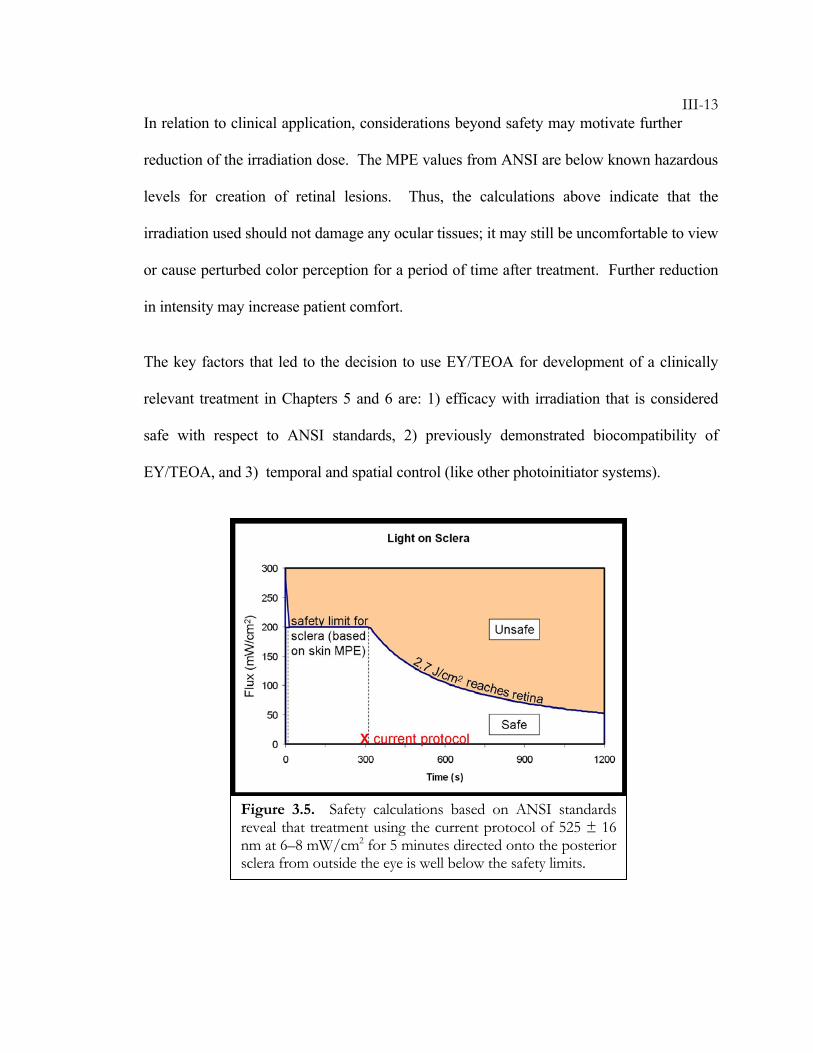
III-13In relation to clinical application, considerations beyond safety may motivate further
reduction of the irradiation dose. The MPE values from ANSI are below known hazardous
levels for creation of retinal lesions. Thus, the calculations above indicate that the
irradiation used should not damage any ocular tissues; it may still be uncomfortable to view
or cause perturbed color perception for a period of time after treatment. Further reduction
in intensity may increase patient comfort.
The key factors that led to the decision to use EY/TEOA for development of a clinically
relevant treatment in Chapters 5 and 6 are: 1) efficacy with irradiation that is considered
safe with respect to ANSI standards, 2) previously demonstrated biocompatibility of
EY/TEOA, and 3) temporal and spatial control (like other photoinitiator systems).
Figure 3.5. Safety calculations based on ANSI standards reveal that treatment using the current protocol of 525 ± 16 nm at 6–8 mW/cm2 for 5 minutes directed onto the posterior sclera from outside the eye is well below the safety limits.
III-14BIBLIOGRAPHY
1. Spoerl, E., Wollensak, G., Dittert, D.D., Seiler, T. Thermomechanical behavior
of collagen-cross-linked porcine cornea. Ophthalmologica 218, 136-140 (2004).
2. Spoerl, E., Wollensak, G., Seiler, T. Increased resistance of crosslinked cornea
against enzymatic digestion. Current Eye Research 29, 35-40 (2004).
3. Sporl, E., Genth, U., Schmalfuss, K., Seiler, T. Thermo-mechanical behavior of
the cornea. Klinische Monatsblatter Fur Augenheilkunde 208, 112-116 (1996).
4. Sporl, E., Genth, U., Schmalfuss, K., Seiler, T. Thermomechanical behavior of
the cornea. German Journal Of Ophthalmology 5, 322-327 (1997).
5. Wollensak, G. Crosslinking treatment of progressive keratoconus: new hope.
Current Opinion In Ophthalmology 17, 356-360 (2006).
6. Wollensak, G., Aurich, H., Pham, D.T., Wirbelauer, C. Hydration behavior of
porcine cornea crosslinked with riboflavin and ultraviolet A. Journal of Cataract
and Refractive Surgery 33, 516-521 (2007).
7. Wollensak, G., Spoerl, E., Reber, F., Seiler, T. Keratocyte cytotoxicity of
riboflavin/UVA-treatment in vitro. Eye 18, 718-722 (2004).
8. Wollensak, G., Spoerl, E., Seiler, T. Stress-strain measurements of human and
porcine corneas after riboflavin-ultraviolet-A-induced cross-linking. Journal Of
Cataract And Refractive Surgery 29, 1780-1785 (2003).
9. Wollensak, G., Spoerl, E., Seiler, T. Riboflavin/ultraviolet-A-induced collagen
crosslinking for the treatment of keratoconus. American Journal Of Ophthalmology
135, 620-627 (2003).
III-1510. Wollensak, G., Spoerl, E., Wilsch, M., Seiler, T. Endothelial cell damage after
riboflavin-ultraviolet-A treatment in the rabbit. Journal Of Cataract And Refractive
Surgery 29, 1786-1790 (2003).
11. Wollensak, G., Spoerl, E., Wilsch, M., Seiler, T. Keratocyte apoptosis after
corneal collagen cross-linking using riboflavin/UVA treatment. Cornea 23, 43-
49 (2004).
12. Wollensak, G., Sporl, E., Reber, F., Pillunat, L., Funk, R. Corneal endothelial
cytotoxicity of riboflavin/UVA treatment in vitro. Ophthalmic Research 35, 324-
328 (2003).
13. Wollensak, G., Sporl, E., Seiler, T. Treatment of keratoconus by collagen cross
linking. Ophthalmologe 100, 44-49 (2003).
14. Wollensak, G., Wilsch, M., Spoerl, E., Seiler, T. Collagen fiber diameter in the
rabbit cornea after collagen crosslinking by riboflavin/UVA. Cornea 23, 503-
507 (2004).
15. Nakayama, Y., Kameo, T., Ohtaka, A., Hirano, Y. Enhancement of visible
light-induced gelation of photocurable gelatin by addition of polymeric amine.
Journal of Photochemistry and Photobiology a-Chemistry 177, 205-211 (2006).
16. Orban, J.M., Faucher, K.M., Dluhy, R.A., Chaikof, E.L. Cytomimetic
biomaterials. 4. In-situ photopolymerization of phospholipids on an alkylated
surface. Macromolecules 33, 4205-4212 (2000).
17. Cruise, G.M., Hegre, O.D., Scharp, D.S., Hubbell, J.A. A sensitivity study of
the key parameters in the interfacial photopolymerization of poly(ethylene
glycol) diacrylate upon porcine islets. Biotechnology and Bioengineering 57, 655-665
(1998).
III-1618. Pathak, C.P., Sawhney, A.S., Hubbell, J.A. Rapid Photopolymerization of
Immunoprotective Gels in Contact with Cells and Tissue. Journal of the American
Chemical Society 114, 8311-8312 (1992).
19. Desmangles, A.I., Jordan, O., Marquis-Weible, F. Interfacial
photopolymerization of beta-cell clusters: Approaches to reduce coating
thickness using ionic and lipophilic dyes. Biotechnology and Bioengineering 72, 634-
641 (2001).
20. Wollensak, G., Spoerl, E. Collagen crosslinking of human and porcine sclera.
Journal Of Cataract And Refractive Surgery 30, 689-695 (2004).
21. Elisseeff, J., Anseth, K., Sims, D., McIntosh, W., Randolph, M., Langer, R.
Transdermal photopolymerization for minimally invasive implantation. Proc.
Natl. Acad. Sci. USA 96, 3104-3107 (1999).
22. Carnahan, M.A., Middleton, C., Kim, J., Kim, T., Grinstaff, M.W. Hybrid
dendritic-linear polyester-ethers for in situ photopolymerization. Journal of the
American Chemical Society 124, 5291-5293 (2002).
23. Luman, N.R., Kim, T., Grinstaff, M.W. Dendritic polymers composed of
glycerol and succinic acid: Synthetic methodologies and medical applications.
Pure and Applied Chemistry 76, 1375-1385 (2004).
24. Alleyne, C.J.J., Cawley, C.M., Barrow, D.L., Poff, B.C., Powell, M.D., Sawhney,
A.S., Dillehay, D.L. Efficacy and biocompatibility of a photopolyrnerized,
synthetic, absorbable hydrogel as a dural sealant in a canine craniotomy model.
Journal of Neurosurgery 88, 308-313 (1998).
25. West, J.L., Hubbell, J.A. Separation of the arterial wall from blood contact
using hydrogel barriers reduces intimal thickening after balloon injury in the
III-17rat: The roles of medial and luminal factors in arterial healing. Proclomations of
the National Academy of Science 93, 13188-13193 (1996).
26. Hill-West, J.L., Chowdhury, S.M., Slepianu, M.J., Hubbell, J.A. Inhibition of
thrombosis and intimal thickening by in situ photopolymerization of thin
hydrogel barriers. Proclomations of the National Academy of Science 91, 5967-5971
(1994).
27. Wollensak, G., Iomdina, E., Dittert, D.D., Salamatina, O., Stoltenburg, G.
Cross-linking of scleral collagen in the rabbit using riboflavin and UVA. Acta
Ophthalmologica Scandinavica 83, 477-482 (2005).
28. Bryant, S.J., Nuttelman, C.R., Anseth, K.S. Cytocompatibility of UV and
visible light photoinitiating systems on cultured NIH/3T3 fibroblasts in vitro.
Journal Of Biomaterials Science-Polymer Edition 11, 439-457 (2000).
29. Williams, C.G., Malik, A.N., Kim, T.K., Manson, P.N., Elisseeff, J.H. Variable
cytocompatibility of six cell lines with photoinitiators used for polymerizing
hydrogels and cell encapsulation. Biomaterials 26, 1211-1218 (2005).
30. American National Standards Institute. American National Standard for Safe Use of
Lasers. (Laser Institute of America, Orlando, FL, 2000).
31. [Anon]. Guidelines on limits of exposure to broad-band incoherent optical
radiation (0.38 to 3 mu M). Health Physics 73, 539-554 (1997).
32. Hammer, M., Roggan, A., Schweitzer, D., Muller, G. Optical-Properties of
Ocular Fundus Tissues - an in-Vitro Study Using the Double-Integrating-
Sphere Technique and Inverse Monte-Carlo Simulation. Physics in Medicine and
Biology 40, 963-978 (1995).
III-1833. Nemati, B., Rylander, H.G., Welch, A.J. Optical properties of conjunctiva,
sclera, and the ciliary body and their consequences for transscleral
cyclophotocoagulation. Applied Optics 35, 3321-3327 (1996).
34. Olsen, T.W., Aaberg, S.Y., Geroski, D.H., Edelhauser, H.F. Human sclera:
Thickness and surface area. American Journal of Ophthalmology 125, 237-241
(1998).
IV-1C h a p t e r 4
INTERPENETRATING POLYMER AND TISSUE NETWORKS
4.1 Tissue Engineering ............................................................................ IV-1 4.2 Concentration and Oxygen Dependence of Increases in Scleral Modulus ......................................................................................... IV-3 4.3 Crosslinking Without PEGDM......................................................... IV-7 4.4 In Vivo Treatment Comparison With and Without PEGDM......... IV-10 Bibliography .......................................................................................... IV-14
This work has been done in collaboration with graduate student Joyce Huynh during her
first year, who assisted with in vivo treatment of rabbit eyes. Undergraduates Dennis Ko
and Meredith Wiseman contributed to the study of fluorescent molecules within the sclera.
4.1 Tissue Engineering
Tissue engineering is an attractive approach for treating keratoconus and degenerative
myopia because of the potential to replace or reinforce old, diseased, or malfunctioning
tissue. Hydrogel based materials are traditionally used in tissue engineering because of
their adjustable mechanical and chemical properties, biocompatibility, and
biodegradability.1 These characteristics have been employed in biosensor coatings, drug
delivery devices, the encapsulation of cells, cell delivery to tissue, and the creation of
biodegradable scaffolding for new tissue growth.2-4 Photopolymerizable hydrogels can be
injected as a liquid and then solidified by exposure to light in a controlled, localized
manner.5 This method has demonstrated usefulness in filling voids in bone,5-7 in wound
IV-2healing, and in creation of an engineered tissue, e.g., cartilage in a specified location
and shape.4, 6-11
Poly(ethylene glycol) (PEG) or PEG-based materials have been widely used in hydrogel
and tissue engineering applications, and PEG-diacrylate has been approved by the FDA for
use in the body. PEG-based hydrogels formed by photopolymerization in the body have
already shown clinical applicability in treatment of lung and dural tissues.12, 13 PEG-based
macromers may have varying-length PEG chains, which alters the solubility of the
macromers and, upon polymerization, can create different crosslink densities (or modulus)
of the polymerized network. By incorporating appropriate amino acid sequences along the
PEG chains, the matrix can contain cell-binding domains, enzymatically degradable
sections, growth factors, etc. This allows for artificial direction of cell growth and
behavior. Also, PEG can be functionalized with varying end groups such as methacrylate,
to give different reactivities. Radical generation by the photoinitiator initiates reaction of
the endgroups, which form bonds with other macromers and/or with the tissue. Because of
the customizability of PEG-based macromers, they have been chosen for use in our
preliminary treatment mixtures.
While literature on tissue engineering typically focuses on the filling of voids, surface
modifications, and temporary support for growing tissue, an alternative approach that we
have studied for the cornea and sclera is the creation of an integrated polymer network
within the tissue. By first allowing the tissue to imbibe photopolymerizable material,
crosslinking incorporates the new material inside the tissue. This interpenetrating network
could increase structural support, and through covalent crosslinks, could lock pre-existing
IV-3structures in place and prevent tissue reconfiguration. In the present case, it might
prevent excessive deformation or tissue remodeling in keratoconus and degenerative
myopia. In addition, we have demonstrated that it can be used to anchor labels or other
functional moieties into the tissue (illustrated in Chapter 3 using Fluorescein-PEG-
methacrylate). In studies of the mechanical properties related to polymerization or grafting
of PEG-dimethacrylate (PEGDM) into ocular tissues, we have examined 1) the
concentration dependence of modulus increases in sclera, 2) the relationship of oxygen to
the modulus increase in sclera, and 3) the stabilization of eye shape with and without an
interpenetrating network.
4.2 Concentration & Oxygen Dependence of Increases in Scleral Modulus
The density of the new network (artificial and natural), or the degree of crosslinking is
expected to determine the treated tissue modulus. For example, a controlled increase in
tissue modulus might be achieved by increasing the concentration of PEGDM, which is
expected to increase crosslink formation.
In addition to control of the final modulus, in the case of degenerative myopia, we desire
selective polymerization within sclera and not within vessel walls that penetrate the
posterior sclera (Figure 4.1a). Oxygen inhibition of radical polymerization is commonly
observed,14, 15 which could be an advantage in this situation. Because sclera is largely
avascular, we can exploit the differential concentration of oxygen within vessel walls
compared to adjacent sclera to control polymerization. In and around blood vessels where
IV-4oxygen tension is higher, polymerization will be inhibited; further away, in avascular
portions of the sclera where the oxygen tension is lower, polymerization will occur.
To test these hypotheses regarding the effects of concentration and oxygen on photo-
activated incorporation of PEGDM, we use oscillatory shear measurements of the
mechanical properties of porcine sclera specimens before and after treatment.
Methods: Eyes from 3–4 month old swine were obtained from Sierra for Medical Science.
Tissue was shipped on ice, in saline to maintain proper hydration and freshness. The fresh
eyes (< 72 hours post mortem) were dissected to remove orbital fat and muscles, and then
cut at the equator to separate the anterior and posterior globe. The episclera, retina, and
choroid were removed before cutting a circular disk from the posterior pole with an 8-mm-
diameter trephine punch. The center of the circular section was located ~10 mm from the
optic nerve on the temporal side. The sections were immediately put on the rheometer for
oscillatory shear tests at a frequency of 1 rad/sec and a stress amplitude of 5 Pa.
After initial modulus measurements on the rheometer, tissue sections were soaked for 1
hour in a solution containing a specific concentration (0, 1, 5, 10, or 25 % w/w) of PEGDM
(550 Dalton) with 1% 4-benzoylbenzyl trimethylammonium bromide (Initiator A: Figure
3.1a) in Dulbecco’s phosphate-buffered saline (DPBS). After soaking for 1 hour, excess
solution was removed from the tissue surface by dabbing with a kimwipe. The samples
were mounted in a humid chamber that allowed control of oxygen in the atmosphere
(Figure 4.1b). The atmosphere was either argon or air during irradiation. After 5 minutes
of equilibration in the chamber, a Thermo Oriel 500 Watt mercury xenon arc lamp was
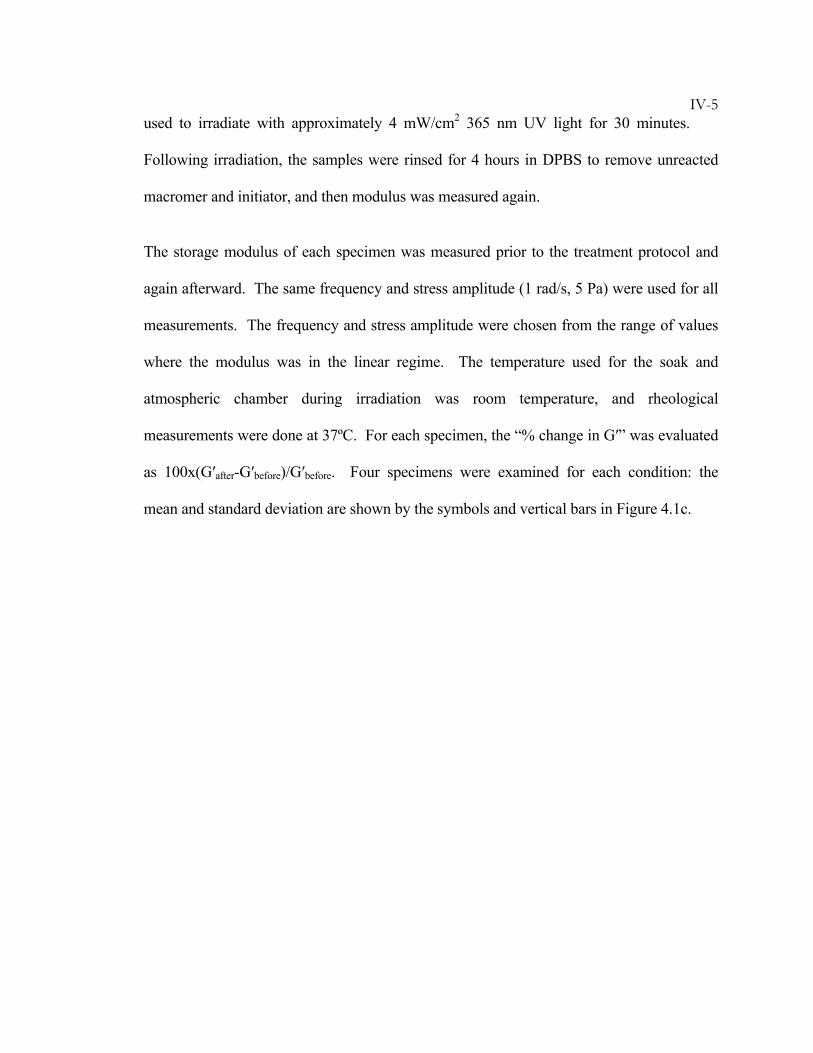
IV-5used to irradiate with approximately 4 mW/cm2 365 nm UV light for 30 minutes.
Following irradiation, the samples were rinsed for 4 hours in DPBS to remove unreacted
macromer and initiator, and then modulus was measured again.
The storage modulus of each specimen was measured prior to the treatment protocol and
again afterward. The same frequency and stress amplitude (1 rad/s, 5 Pa) were used for all
measurements. The frequency and stress amplitude were chosen from the range of values
where the modulus was in the linear regime. The temperature used for the soak and
atmospheric chamber during irradiation was room temperature, and rheological
measurements were done at 37ºC. For each specimen, the “% change in G′” was evaluated
as 100x(G′after-G′before)/G′before. Four specimens were examined for each condition: the
mean and standard deviation are shown by the symbols and vertical bars in Figure 4.1c.
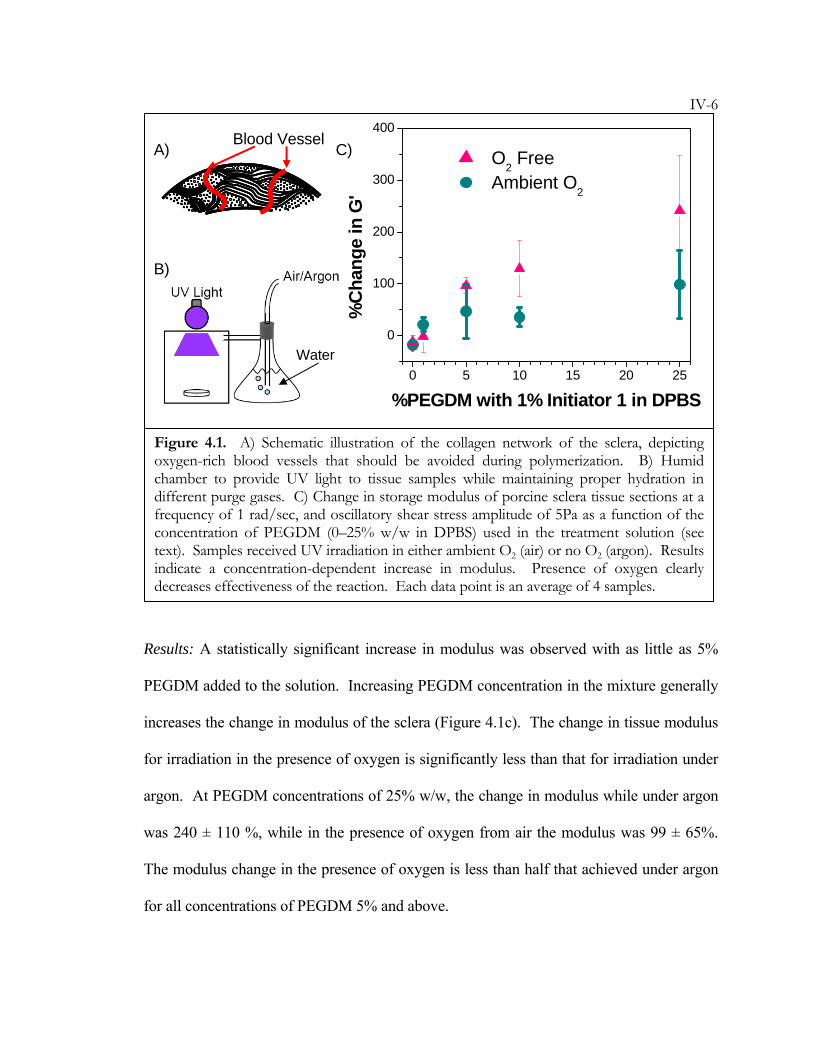
IV-6
Results: A statistically significant increase in modulus was observed with as little as 5%
PEGDM added to the solution. Increasing PEGDM concentration in the mixture generally
increases the change in modulus of the sclera (Figure 4.1c). The change in tissue modulus
for irradiation in the presence of oxygen is significantly less than that for irradiation under
argon. At PEGDM concentrations of 25% w/w, the change in modulus while under argon
was 240 ± 110 %, while in the presence of oxygen from air the modulus was 99 ± 65%.
The modulus change in the presence of oxygen is less than half that achieved under argon
for all concentrations of PEGDM 5% and above.
0 5 10 15 20 25
0
100
200
300
400
%C
hang
e in
G'
%PEGDM with 1% Initiator 1 in DPBS
O2 Free Ambient O2
Figure 4.1. A) Schematic illustration of the collagen network of the sclera, depicting oxygen-rich blood vessels that should be avoided during polymerization. B) Humid chamber to provide UV light to tissue samples while maintaining proper hydration in different purge gases. C) Change in storage modulus of porcine sclera tissue sections at a frequency of 1 rad/sec, and oscillatory shear stress amplitude of 5Pa as a function of the concentration of PEGDM (0–25% w/w in DPBS) used in the treatment solution (see text). Samples received UV irradiation in either ambient O2 (air) or no O2 (argon). Results indicate a concentration-dependent increase in modulus. Presence of oxygen clearly decreases effectiveness of the reaction. Each data point is an average of 4 samples.
A)
B)
C) Blood Vessel
Water
IV-7Discussion: The dose-dependent response of the tissue (increase in modulus with
increasing %PEGDM) should enable the adjustment of individual treatments to achieve
different desired end properties. The changes that occurred for the ~ 2 hour treatment with
25% w/w PEGDM under argon (240 ± 110 %) were comparable to those for a 24 hour 2%
glyceraldehyde crosslinking treatment described in Chapter 2 (330 ± 110 %, Figure 2.16).
Such shortening of treatment time would be beneficial for clinical application.
The inability to crosslink efficiently in the presence of oxygen could be a beneficial for this
system. For the treatment of degenerative myopia it will be necessary to deliver drug
around the back of the eye and close to the retina. The ability of oxygen to inhibit the
reaction could provide a method by which strengthening of tissue is done everywhere
except in close proximity to oxygen-rich vessels. This is especially relevant to prevention
of crosslinking the short posterior ciliary arteries that penetrate sclera in the macular region
and around the optic nerve. If drug and light did reach the choroid, the oxygen-rich layer
could prevent damaging crosslinking there as well.
4.3 Crosslinking Without PEGDM
In addition to controlling tissue modulus by altering the PEGDM concentration, adjusting
the treatment protocols (initiator concentration and soak time) and irradiation parameters
(wavelength, intensity, exposure time) can be used to control the reaction. Shorter soak
times prevent the drug from penetrating far into the tissue, and the light exposure controls
the degree of activation. By examining these parameters, we discovered strengthening of
the tissue was possible without any macromer, as illustrated by the following experiments.
IV-8Methods: Eyes from 3–4 month old swine were obtained from Sierra for Medical
Science. Tissue was shipped on ice, in saline to maintain proper hydration and freshness.
The fresh eyes (< 72 hours post mortem) were dissected to remove orbital fat and muscles.
The whole eyes were soaked for 60 minutes in one of three solutions prepared in DPBS: a
control of only DPBS, 0.3% I2959 in DPBS, or 20% PEGDM (550 MW) with 0.3% I2959
(I2959, Figure 3.1b). Afterward, sections of the eyes were irradiated with UV (~50
mW/cm2, 315–405 nm, for 5 minutes) using a mask and then 8 mm disks were cut from
irradiated and non-irradiated sections of the sclera. The samples were soaked for 24 hours
in DPBS and then measured for modulus using oscillatory shear measurements. The
difference in modulus between the exposed and unexposed regions was compared.
Results: Specimens from control eyes soaked in DPBS showed little difference in modulus
between exposed and unexposed regions (14 ± 33%). The tissue sections from eyes
receiving only initiator, or a combination of initiator and PEGDM both displayed increases
in modulus in the exposed regions (290 ± 180%, and 150 ± 110% respectively). Due to the
large scatter, there is not a significant difference between the treatment with and without
PEGDM (p > 0.05 as determined using an unpaired t-test) so it is not possible to
conclusively determine which treatment was better.
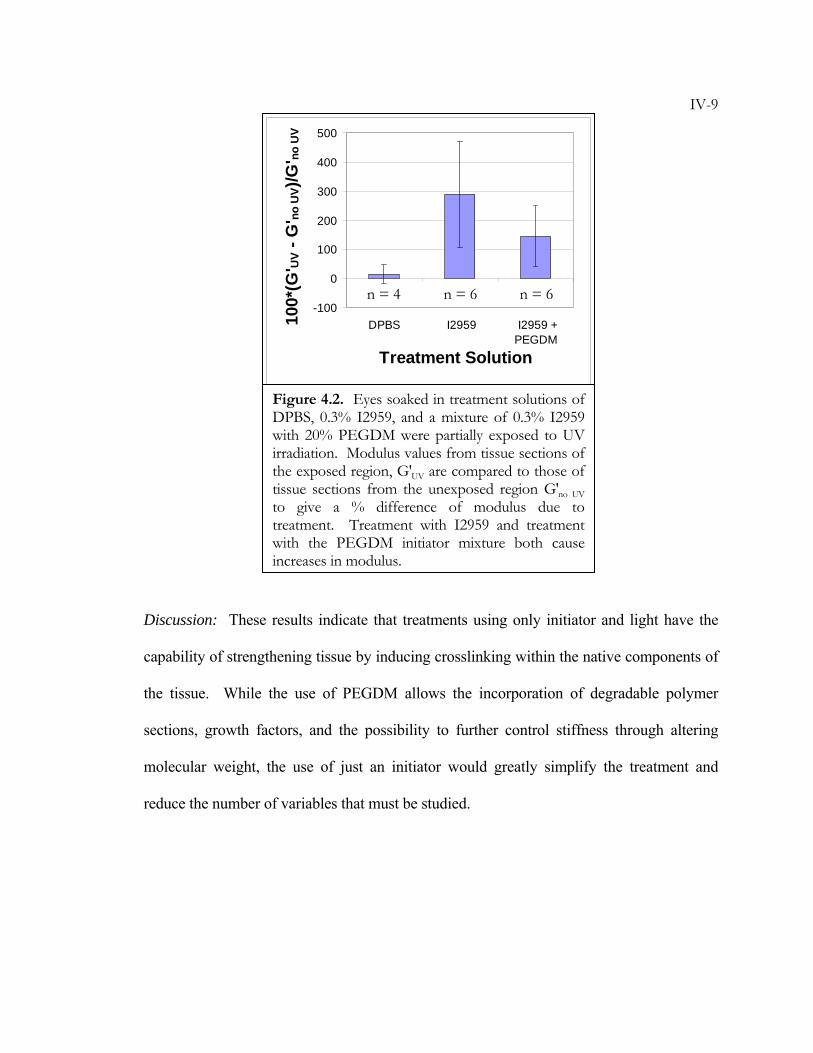
IV-9
Discussion: These results indicate that treatments using only initiator and light have the
capability of strengthening tissue by inducing crosslinking within the native components of
the tissue. While the use of PEGDM allows the incorporation of degradable polymer
sections, growth factors, and the possibility to further control stiffness through altering
molecular weight, the use of just an initiator would greatly simplify the treatment and
reduce the number of variables that must be studied.
-100
0
100
200
300
400
500
DPBS I2959 I2959 +PEGDM
Treatment Solution
100*
(G' U
V - G
' no U
V)/G
' no U
V
Figure 4.2. Eyes soaked in treatment solutions of DPBS, 0.3% I2959, and a mixture of 0.3% I2959 with 20% PEGDM were partially exposed to UV irradiation. Modulus values from tissue sections of the exposed region, G′UV are compared to those of tissue sections from the unexposed region G′no UV to give a % difference of modulus due to treatment. Treatment with I2959 and treatment with the PEGDM initiator mixture both cause increases in modulus.
n = 4 n = 6n = 6
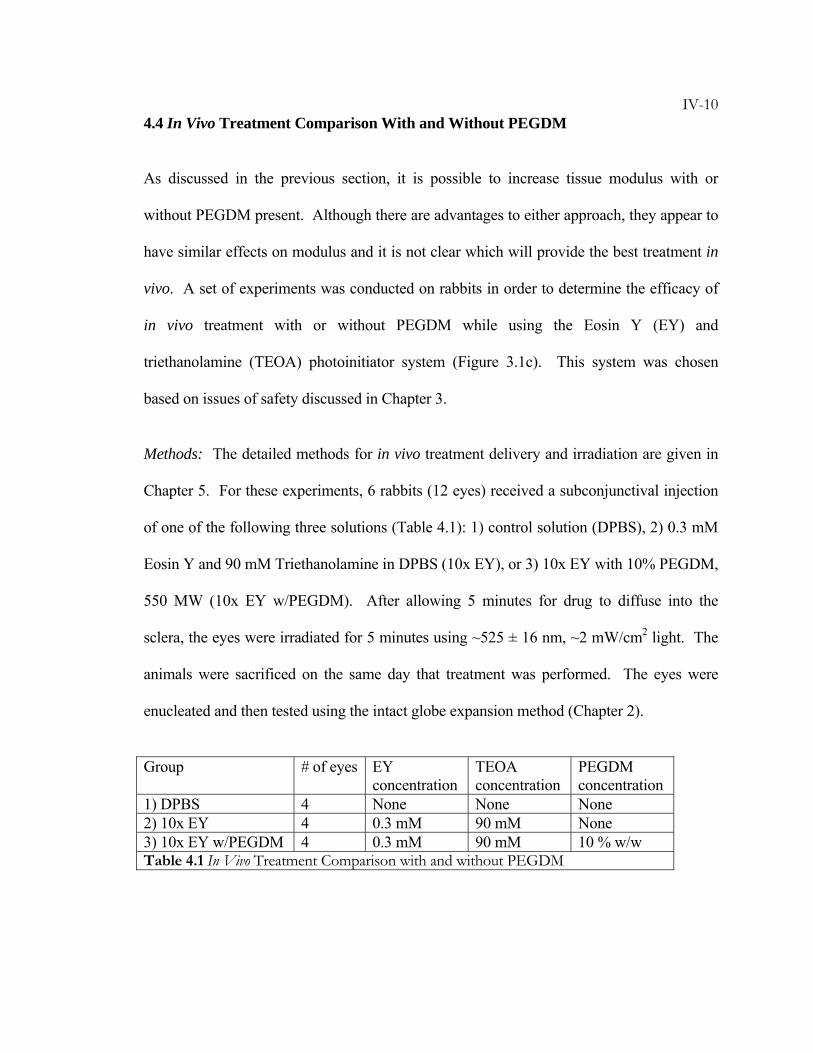
IV-104.4 In Vivo Treatment Comparison With and Without PEGDM
As discussed in the previous section, it is possible to increase tissue modulus with or
without PEGDM present. Although there are advantages to either approach, they appear to
have similar effects on modulus and it is not clear which will provide the best treatment in
vivo. A set of experiments was conducted on rabbits in order to determine the efficacy of
in vivo treatment with or without PEGDM while using the Eosin Y (EY) and
triethanolamine (TEOA) photoinitiator system (Figure 3.1c). This system was chosen
based on issues of safety discussed in Chapter 3.
Methods: The detailed methods for in vivo treatment delivery and irradiation are given in
Chapter 5. For these experiments, 6 rabbits (12 eyes) received a subconjunctival injection
of one of the following three solutions (Table 4.1): 1) control solution (DPBS), 2) 0.3 mM
Eosin Y and 90 mM Triethanolamine in DPBS (10x EY), or 3) 10x EY with 10% PEGDM,
550 MW (10x EY w/PEGDM). After allowing 5 minutes for drug to diffuse into the
sclera, the eyes were irradiated for 5 minutes using ~525 ± 16 nm, ~2 mW/cm2 light. The
animals were sacrificed on the same day that treatment was performed. The eyes were
enucleated and then tested using the intact globe expansion method (Chapter 2).
Group # of eyes EY concentration
TEOA concentration
PEGDM concentration
1) DPBS 4 None None None 2) 10x EY 4 0.3 mM 90 mM None 3) 10x EY w/PEGDM 4 0.3 mM 90 mM 10 % w/w Table 4.1 In Vivo Treatment Comparison with and without PEGDM
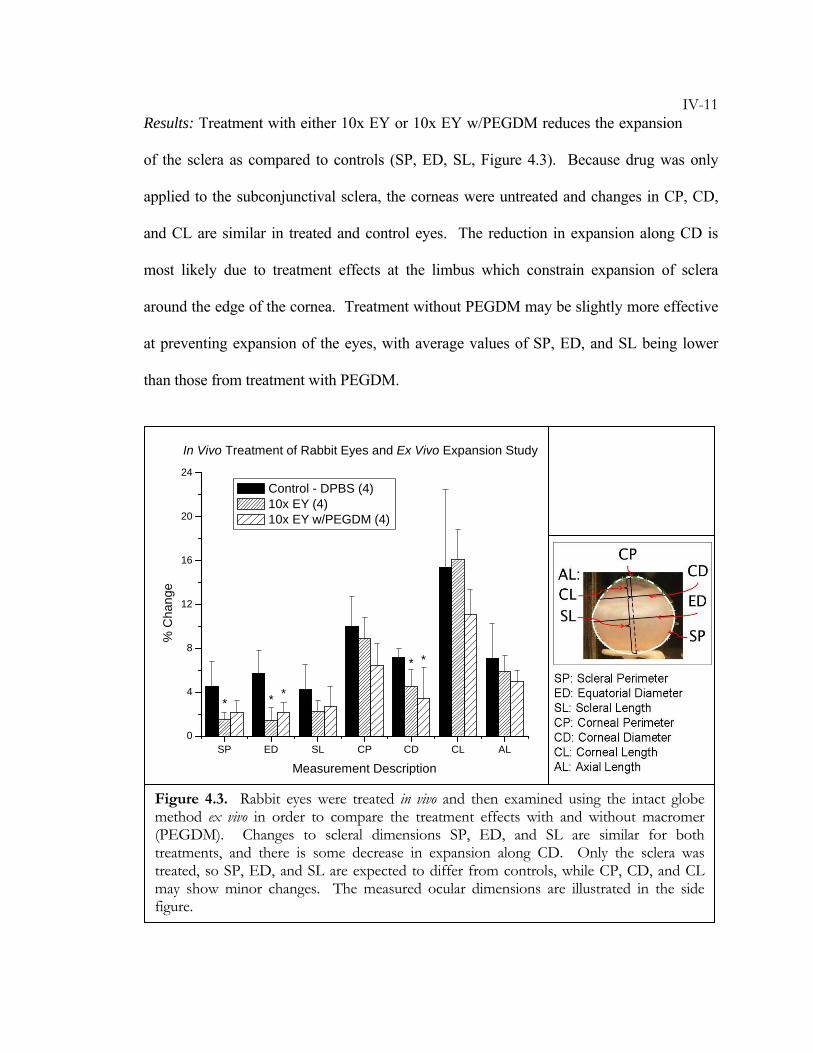
IV-11Results: Treatment with either 10x EY or 10x EY w/PEGDM reduces the expansion
of the sclera as compared to controls (SP, ED, SL, Figure 4.3). Because drug was only
applied to the subconjunctival sclera, the corneas were untreated and changes in CP, CD,
and CL are similar in treated and control eyes. The reduction in expansion along CD is
most likely due to treatment effects at the limbus which constrain expansion of sclera
around the edge of the cornea. Treatment without PEGDM may be slightly more effective
at preventing expansion of the eyes, with average values of SP, ED, and SL being lower
than those from treatment with PEGDM.
SP ED SL CP CD CL AL0
4
8
12
16
20
24
***
**
In Vivo Treatment of Rabbit Eyes and Ex Vivo Expansion Study
% C
hang
e
Measurement Description
Control - DPBS (4) 10x EY (4) 10x EY w/PEGDM (4)
Figure 4.3. Rabbit eyes were treated in vivo and then examined using the intact globe method ex vivo in order to compare the treatment effects with and without macromer (PEGDM). Changes to scleral dimensions SP, ED, and SL are similar for both treatments, and there is some decrease in expansion along CD. Only the sclera was treated, so SP, ED, and SL are expected to differ from controls, while CP, CD, and CL may show minor changes. The measured ocular dimensions are illustrated in the side figure.
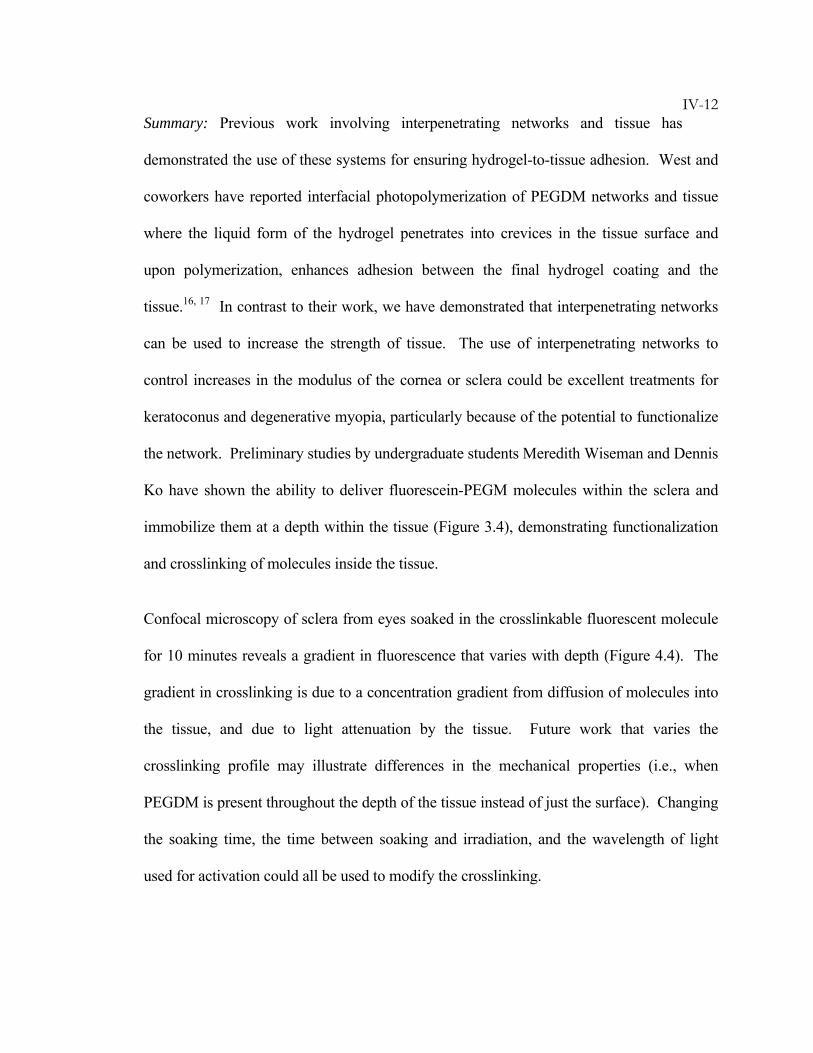
IV-12Summary: Previous work involving interpenetrating networks and tissue has
demonstrated the use of these systems for ensuring hydrogel-to-tissue adhesion. West and
coworkers have reported interfacial photopolymerization of PEGDM networks and tissue
where the liquid form of the hydrogel penetrates into crevices in the tissue surface and
upon polymerization, enhances adhesion between the final hydrogel coating and the
tissue.16, 17 In contrast to their work, we have demonstrated that interpenetrating networks
can be used to increase the strength of tissue. The use of interpenetrating networks to
control increases in the modulus of the cornea or sclera could be excellent treatments for
keratoconus and degenerative myopia, particularly because of the potential to functionalize
the network. Preliminary studies by undergraduate students Meredith Wiseman and Dennis
Ko have shown the ability to deliver fluorescein-PEGM molecules within the sclera and
immobilize them at a depth within the tissue (Figure 3.4), demonstrating functionalization
and crosslinking of molecules inside the tissue.
Confocal microscopy of sclera from eyes soaked in the crosslinkable fluorescent molecule
for 10 minutes reveals a gradient in fluorescence that varies with depth (Figure 4.4). The
gradient in crosslinking is due to a concentration gradient from diffusion of molecules into
the tissue, and due to light attenuation by the tissue. Future work that varies the
crosslinking profile may illustrate differences in the mechanical properties (i.e., when
PEGDM is present throughout the depth of the tissue instead of just the surface). Changing
the soaking time, the time between soaking and irradiation, and the wavelength of light
used for activation could all be used to modify the crosslinking.
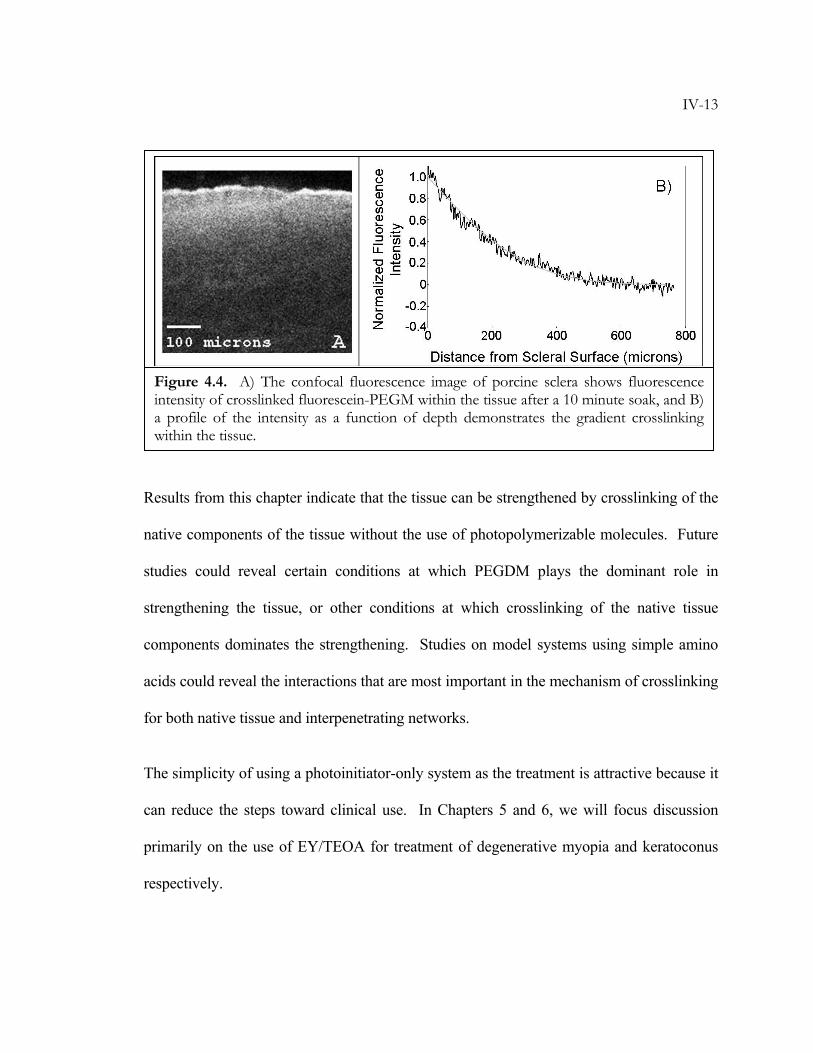
IV-13
Results from this chapter indicate that the tissue can be strengthened by crosslinking of the
native components of the tissue without the use of photopolymerizable molecules. Future
studies could reveal certain conditions at which PEGDM plays the dominant role in
strengthening the tissue, or other conditions at which crosslinking of the native tissue
components dominates the strengthening. Studies on model systems using simple amino
acids could reveal the interactions that are most important in the mechanism of crosslinking
for both native tissue and interpenetrating networks.
The simplicity of using a photoinitiator-only system as the treatment is attractive because it
can reduce the steps toward clinical use. In Chapters 5 and 6, we will focus discussion
primarily on the use of EY/TEOA for treatment of degenerative myopia and keratoconus
respectively.
Figure 4.4. A) The confocal fluorescence image of porcine sclera shows fluorescence intensity of crosslinked fluorescein-PEGM within the tissue after a 10 minute soak, and B) a profile of the intensity as a function of depth demonstrates the gradient crosslinking within the tissue.
IV-14BIBLIOGRAPHY
1. Nguyen, K.T., West, J.L. Photopolymerizable hydrogels for tissue engineering
applications. Biomaterials 23, 4307-4314 (2002).
2. Sershen, S., West, J. Implantable, polymeric systems for modulated drug
delivery. Advanced Drug Delivery Reviews 54, 1225-1235 (2002).
3. Riley, S.L., Dutt, S., de la Torre, R., Chen, A.C., Sah, R.L., Ratcliffe, A.
Formulation of PEG-based hydrogels affects tissue-engineered cartilage
construct characteristics. Journal Of Materials Science-Materials In Medicine 12, 983-
990 (2001).
4. Park, Y., Lutolf, M.P., Hubbell, J.A., Hunziker, E.B., Wong, M. Bovine
primary chondrocyte culture in synthetic matrix metalloproteinase-sensitive
poly(ethylene glycol)-based hydrogels as a scaffold for cartilage repair. Tissue
Engineering 10, 515-522 (2004).
5. Hou, Q.P., De Bank, P.A., Shakesheff, K.M. Injectable scaffolds for tissue
regeneration. Journal Of Materials Chemistry 14, 1915-1923 (2004).
6. Watkins, A.W., Anseth, K.S. Copolymerization of photocrosslinkable
anhydride monomers for use as a biodegradable bone cement. Journal Of
Biomaterials Science-Polymer Edition 14, 267-278 (2003).
7. Poshusta, A.K., Burdick, J.A., Mortisen, D.J., Padera, R.F., Ruehlman, D.,
Yaszemski, M.J., Anseth, K.S. Histocompatibility of photocrosslinked
polyanhydrides: A novel in situ forming orthopaedic biomaterial. Journal Of
Biomedical Materials Research Part A 64A, 62-69 (2003).
IV-158. Halstenberg, S., Panitch, A., Rizzi, S., Hall, H., Hubbell, J.A. Biologically
engineered protein-graft-poly(ethylene glycol) hydrogels: A cell adhesive and
plasm in-degradable biosynthetic material for tissue repair. Biomacromolecules 3,
710-723 (2002).
9. Zisch, A.H., Lutolf, M.P., Ehrbar, M., Raeber, G.P., Rizzi, S.C., Davies, N.,
Schmokel, H., Bezuidenhout, D., Djonov, V., Zilla, P., Hubbell, J.A. Cell-
demanded release of VEGF from synthetic, biointeractive cell-ingrowth
matrices for vascularized tissue growth. Faseb Journal 17 (2003).
10. Rice, M.A., Dodson, B.T., Arthur, J.A., Anseth, K.S. Cell-based therapies and
tissue engineering. Otolaryngologic Clinics Of North America 38, 199-214 (2005).
11. Rizzi, S.C., Hubbell, J.A. Recombinant protein-co-PEG networks as cell-
adhesive and proteolytically degradable hydrogel matrixes. Part 1:
Development and physicochernical characteristics. Biomacromolecules 6, 1226-
1238 (2005).
12. Allen, M.S., Wood, D.E., Hawkinson, R.W., Harpole, D.H., McKenna, R.J.,
Walsh, G.L., Vallieres, E., Miller, D.L., Nichols, F.C., Smythe, W.R., Davis,
R.D. Prospective randomized study evaluating a biodegradable polymeric
sealant for sealing intraoperative air leaks that occur during pulmonary
resection. Annals Of Thoracic Surgery 77, 1792-1801 (2004).
13. Boogaarts, J.D., Grotenhuis, J.A., Bartels, R., Beems, T. Use of a novel
absorbable hydrogel for augmentation of dural repair: Results of a preliminary
clinical study. Neurosurgery 57, 146-151 (2005).
IV-1614. Lee, T.Y., Guymon, C.A., Jönsson, E.S., Hoyle, C.E. The effect of monomer
structure on oxygen inhibition of (meth)acrylates photopolymerization. Polymer
45, 6155-6162 (2004).
15. Ramis, X., Morancho, J.M., Cadenato, A., Salla, J.M., Fernández-Francos, X.
Effect of oxygen on the photopolymerization of a mixture of two
dimethacrylates. Thermochimica Acta 463, 81-86 (2007).
16. Hill-West, J.L., Chowdhury, S.M., Slepianu, M.J., Hubbell, J.A. Inhibition of
thrombosis and intimal thickening by in situ photopolymerization of thin
hydrogel barriers. Proclomations of the National Academy of Science 91, 5967-5971
(1994).
17. West, J.L., Hubbell, J.A. Separation of the arterial wall from blood contact
using hydrogel barriers reduces intimal thickening after balloon injury in the
rat: The roles of medial and luminal factors in arterial healing. Proclomations of
the National Academy of Science 93, 13188-13193 (1996).
V-1C h a p t e r 5
TREATMENT OF MYOPIA
5.1 Introduction .........................................................................................V-2 5.2 Materials and Methods ........................................................................V-6 5.2.1 In Vitro Application & In Vitro Expansion..................................... V-6 5.2.2 Biocompatibility ............................................................................... V-8 5.2.3 In Vivo Application & In Vitro Expansion ..................................... V-9 5.2.4 Animal Model of Myopia................................................................ V-12 5.3 Results................................................................................................V-17 5.3.1 In Vitro Application & In Vitro Expansion................................... V-17 5.3.2 Biocompatibility ............................................................................. V-20 5.3.3 In Vivo Application & In Vitro Expansion ................................... V-23 5.3.4 Animal Model of Myopia................................................................ V-24 5.4 Summary............................................................................................V-31 Bibliography ............................................................................................V-32
This work has been done in collaboration with Joyce Huynh at Caltech, Dr. Marco Coassin
and Dr. Keith Duncan at University of California at San Francisco, and Dr. Sally
McFadden at University of Newcastle. As a first year graduate student, Joyce has assisted
with in vitro expansion tests and with in vivo experiments on rabbits. Marco provided
surgical expertise in both rabbits and guinea pigs. Keith has assisted with procurement of
rabbits necessary for this work as well as with conduction of biocompatibility studies.
Sally provided the guinea pig animal model of myopia and conducted expert measurements
and analysis of ocular parameters. The data related to these guinea pig studies are a subset
of results from a report provided by Dr. McFadden.
V-25.1 Introduction
In degenerative myopia, the reduction of collagen fibril diameter, enhanced turnover of
scleral collagen, and alteration of scleral glycosaminoglycans results in mechanical changes
to the sclera.1 Progressive elongation of the eye in degenerative myopia is thought to be
the result of 1) the tissue being inherently weak, 2) the sclera continuously being
remodeled, or 3) a combination of these.1, 2 From studies of human donor tissue, high
myopia is associated with weakening and thinning of the sclera, a reduction in matrix
material, and reduction in collagen fibril diameter. While refractive errors induced by
progressive myopia are readily corrected by spectacles, contact lenses, corneal refractive
surgery, or intraocular lenses, these modalities do not prevent visual loss induced by
stretching of chorioretinal tissues. Current means to treat choroidal neovascularization in
degenerative myopia, such as photodynamic therapy, are minimally effective,3 and studies
have only recently begun to test injections of anti-angiogenic drugs such as bevacizumab
(Avastin®), or Lucentis®.4-8 Various attempts have been made to treat expansion of the
eye due to myopia, including the use of scleroplasty, scleral reinforcement, and even an
attempt to polymerize foam around the eye.9-18 Largely because these modalities remain
unproven in well-controlled clinical trials, none have been widely adopted to manage
patients with degenerative myopia. Current therapies are essentially palliative, attempting
to mitigate visual loss in this condition.
Crosslinking of scleral components has the potential to halt progression of degenerative
myopia because it addresses both of the underlying causes that are currently hypothesized:
crosslinking increases tissue strength and hinders tissue remodeling.19-21 As mentioned in
V-3Chapters 1 and 3, Wollensak and Spoerl have reported the use of collagen cross-linking
agents, including glutaraldehyde, glyceraldehyde, and riboflavin-UVA treatment, to
strengthen both human and porcine sclera in vitro.22 Glutaraldehyde and glyceraldehyde
would be difficult to spatially control, and unwanted crosslinking of collagen in vascular
and neural structures might have particularly untoward effects. Use of light-activated
riboflavin would seem preferable in this regard; however, when testing on a rabbit model,
“serious side-effects were found in the entire posterior globe with almost complete loss of
the photoreceptors, the outer nuclear layer and the retinal pigment epithelium (RPE).”23
While crosslinking near the posterior pole would increase scleral modulus and potentially
arrest myopic progression, there remains a need for a non-toxic crosslinking agent that
could be activated using short exposure to a less-toxic light source. Our research in
Chapters 3 and 4 indicates that the visible-light-activated co-initiator system of Eosin Y
(EY) and triethanolamine (TEOA) has the potential to fill this need.
For transition of this treatment from the lab to clinical practice, biocompatibility and
efficacy must be proven in an animal model of myopia. Current state-of-the-art animal
models to study the etiology of myopia rely on 1) visual form deprivation and 2) the eye’s
tendency to correct refractive errors toward emmetropia.24 During development, eyes tend
to grow excessively upon removal of spatial vision. Form-deprivation models use this
response to induce myopia either by placing semitransparent occluders over the eye, or by
suturing the eyelid shut.25 The second animal model makes use of emmetropization of the
eye, which is the process by which eyes change to focus images on the retina. When minus
V-4or plus lenses are placed over the eye, the eye adjusts its growth to bring the image into
focus.
As is observed in the human disease, form-deprivation animal models (e.g., tree shrew eyes
covered with occluders for 12 days) also exhibit weakened sclearl tissue (e.g., increased
scleral creep rates). In these animal models, there is also a measurable change in the
amount and type of collagen and proteoglycan present in the tissue, indicating abnormal
remodeling of the sclera. Sustained form-deprivation in animals induces changes in
collagen fibril diameter and spacing analogous to the distinctive structure observed in
human donor tissue of high myopes.
Various animal models exhibit similarities to humans and each other. Eutherian mammals,
such as humans, monkeys, tree shrews and guinea pigs, share the trait that “the entire sclera
consists of the fibrous, type I collagen-dominated extracellular matrix”.2 This feature sets
them apart from other vertebrates, which have an inner layer of cartilage (e.g., in chicks).
Indeed, the mechanism of emmetropization during form-deprivation in eutherian mammals
(remodeling of the fibrous sclera) is different from that in other vertebrates (growth of the
inner cartilaginous region). Therefore, eutherian mammals provide a better model for
testing treatments related to scleral remodeling for potential application in humans. In light
of the fact that tree shrews and monkeys are difficult to obtain and monkeys suffer from
high variability of the results, researchers have been establishing other mammalian models.
Guinea pigs have recently gained acceptance due to the fact that they rapidly develop
myopia, the changes are large and reproducible, and they are easy to care for.26-32 This
animal provides a model that is well suited for research requiring significant numbers of
V-5animals, and at the same time demonstrates physiological and anatomical similarities to
humans.
Despite the fact that the mechanism of degenerative myopia in humans is not completely
understood, the animal models of myopia do express the weakened sclera and excessive
remodeling typical of the disease. As will be demonstrated in this chapter, light activation
of Eosin Y/TEOA strengthens the sclera; and as discussed in Chapter 3, non-enzymatic
collagen crosslinking is known to decrease enzymatic degradation. Therefore, treatment
with Eosin Y/TEOA has the potential to address both putative mechanisms of degenerative
myopia.
This chapter illustrates efficacy and biocompatibility of this potential treatment.
Stabilization of ocular shape is demonstrated for in vitro and in vivo drug delivery to rabbit
eyes followed by in vitro eye expansion using the intact globe method (Chapter 2).
Preliminary safety studies in rabbits suggested no ill effect of the treatment. We have also
conducted experiments to establish drug and light delivery protocols in guinea pigs and to
assess the effect of EY/TEOA on ocular growth and form-deprivation myopia in
collaboration with Sally McFadden at the University of Newcastle in Australia. The
current results indicate that EY/TEOA has an ability to alter ocular parameters of guinea
pig eyes without altering gross ocular function or animal behavior.
V-65.2 Materials and Methods
5.2.1 In vitro Treatment & In Vitro Expansion
The following procedures were used for testing the effect of in vitro treatment of eyes on
preventing expansion of intact rabbit kit globes subjected to an elevated intraocular
pressure.
Tissue Preparation: Eyes from 2–3 week old New Zealand White Rabbits (University of
California at San Francisco) were stored in saline on ice for use within 48 hours of
enucleation. Immediately before testing, the extraocular muscles, the conjunctiva, and the
episcleral tissues around the eyes were carefully removed to expose the sclera.
Materials: Treatment solutions of 0.0289 mM EY and 90 mM TEOA in DPBS (henceforth
called 1x EY) were prepared fresh. As discussed in Chapter 3, these solutions are activated
by visible light and have peak absorption at 514 nm. The measured pH was 7.5 for the
solution. Glyceraldehyde (GA) solution was prepared by mixing 2% by weight DL-
Glyceraldehyde (Sigma) in distilled water. The pH was adjusted to ~7.5 with HCl and
NaOH.
Eosin Procedure: Eyes were soaked for 5 min in 5 mL of treatment (1x EY) or control
(DPBS) solution. The eyes were removed from the soak and excess solution was wiped
from the surface using a Kimwipe. The treatment was activated by placing the eyes under
one of two light sources: a high intensity mercury arc lamp equipped with a 450–550 nm
bandpass filter that provided 34 mW/cm2, or a panel of seven light emitting diodes (LEDs)
with a spectral output at 525 ± 16 nm that provided an irradiance of 7–10 mW/cm2, as
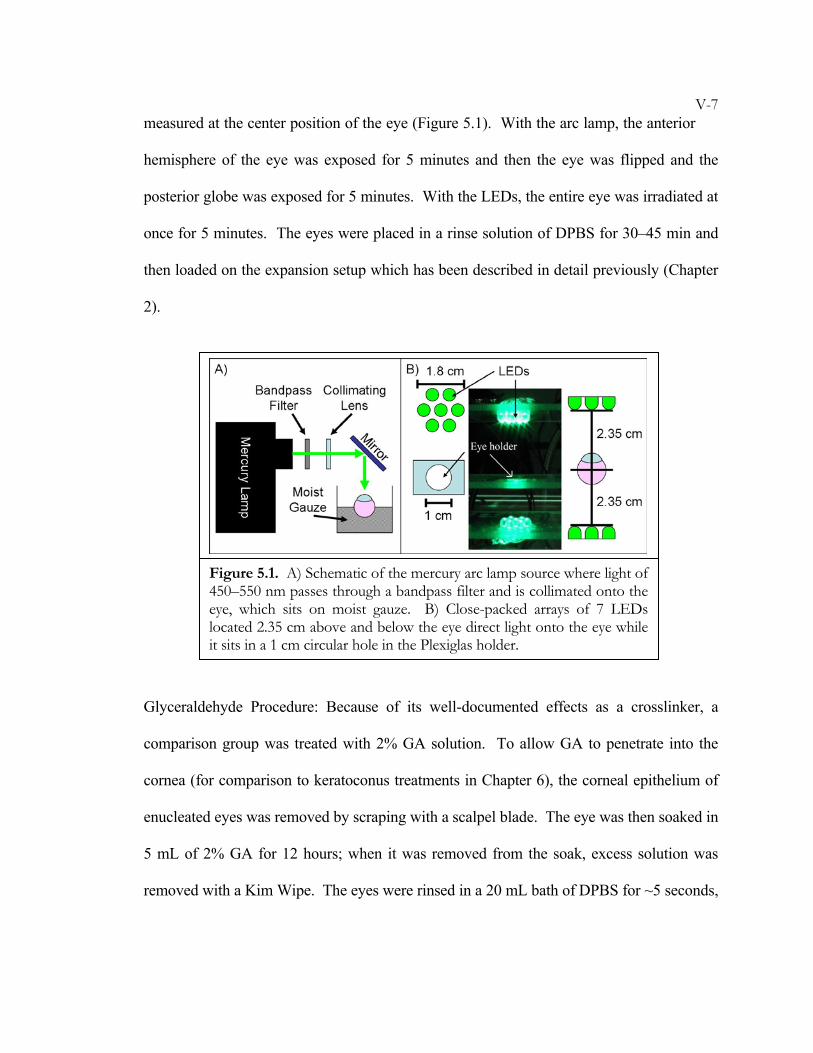
V-7measured at the center position of the eye (Figure 5.1). With the arc lamp, the anterior
hemisphere of the eye was exposed for 5 minutes and then the eye was flipped and the
posterior globe was exposed for 5 minutes. With the LEDs, the entire eye was irradiated at
once for 5 minutes. The eyes were placed in a rinse solution of DPBS for 30–45 min and
then loaded on the expansion setup which has been described in detail previously (Chapter
2).
Glyceraldehyde Procedure: Because of its well-documented effects as a crosslinker, a
comparison group was treated with 2% GA solution. To allow GA to penetrate into the
cornea (for comparison to keratoconus treatments in Chapter 6), the corneal epithelium of
enucleated eyes was removed by scraping with a scalpel blade. The eye was then soaked in
5 mL of 2% GA for 12 hours; when it was removed from the soak, excess solution was
removed with a Kim Wipe. The eyes were rinsed in a 20 mL bath of DPBS for ~5 seconds,
Figure 5.1. A) Schematic of the mercury arc lamp source where light of 450–550 nm passes through a bandpass filter and is collimated onto the eye, which sits on moist gauze. B) Close-packed arrays of 7 LEDs located 2.35 cm above and below the eye direct light onto the eye while it sits in a 1 cm circular hole in the Plexiglas holder.
V-8and then put in a fresh 40 mL DPBS bath to rinse for 10 hours. The eyes were then
loaded on the expansion setup.
As described in Chapter 2, the expansion protocol began with a 1 hour interval at an
intraocular pressure (22 mmHg) close to the physiologic value, which allowed the globe to
recover from shape distortion that may have occurred during handling post mortem. Then
the pressure was raised and held at 85 mmHg for 24 hours. Digital photographs (2272 x
1704) were acquired every 15 min for the duration of the experiment.
5.2.2 Biocompatibility
Toxicity studies were performed at UCSF, to determine if the formulation and light
exposure selected from in vitro studies would be suitable to use in an animal model for
myopia. To test the in vivo response to 1x EY and light exposure, the following
experiments were performed using topical application of the drug.
Procedure: Four adult New Zealand White rabbits were given general anesthesia with 1–
5% inhaled isofluorane administered by mask and topical 0.5% proparacaine to the right
eye (OD). The right eye of each animal was sterilized with 5% povidone-iodine
(betadyne). Throughout the procedure the eye was washed with sterile ocular balanced
saline solution (BSS). A 15 mm incision was made in the conjunctiva close to the limbus
and another incision running anterior to posterior allowed the conjunctiva to be pulled
away to expose the sclera over approximately 1 cm2 area. The animal was positioned such
that the exposed sclera faced upward and a drop of solution placed on it could remain in
contact with the tissue for 5 minutes. Rabbits from Group 1 had 200 microliters of 1x EY
V-9solution applied directly to the exposed sclera. Rabbits from Group 2 had 200
microliters of DPBS (control) applied directly to the exposed sclera.
After 5 minutes, the treated area was rinsed with 1–2 mL of BSS and then photoactivated
by exposure to light from an LW Scientific Alpha 1501 Fiber Light Source (~34 mW/cm2)
for 5 minutes.
The conjunctival incision was closed with 7-0 vicryl suture. All animals received
subconjunctival injections of celestone (75–150 microliters) and cepahzolin (75–150
microliters). All animals were given injections of carprofen (5 mg/kg) and buprenorphine
(0.05 mg/kg) for pain and 2–3 drops of neomycin, polymixin B sulfates, and gramicidin
OD to prevent infection.
Eyes were examined for any signs of pain or inflammation such as redness of the eye,
discharge, ptosis of the eyelid, blepharospasm, or photophobia once a day for 1 week then
once a week for 3 additional weeks.
Histology: After 4 weeks all animals were anesthetized with 30–50 mg/kg ketamine and 5–
10 mg/kg xylazine, euthanized, and the eyes were removed, fixed in 10% formalin, and
processed for light microscopic examination (Eosin/hematoxylin stain).
5.2.3 In vivo Treatment & In Vitro Expansion
The following experiments used in vivo treatment of the eye followed by in vitro expansion
on the intact globe setup to test the ability to deliver drug and treatment in a live animal.
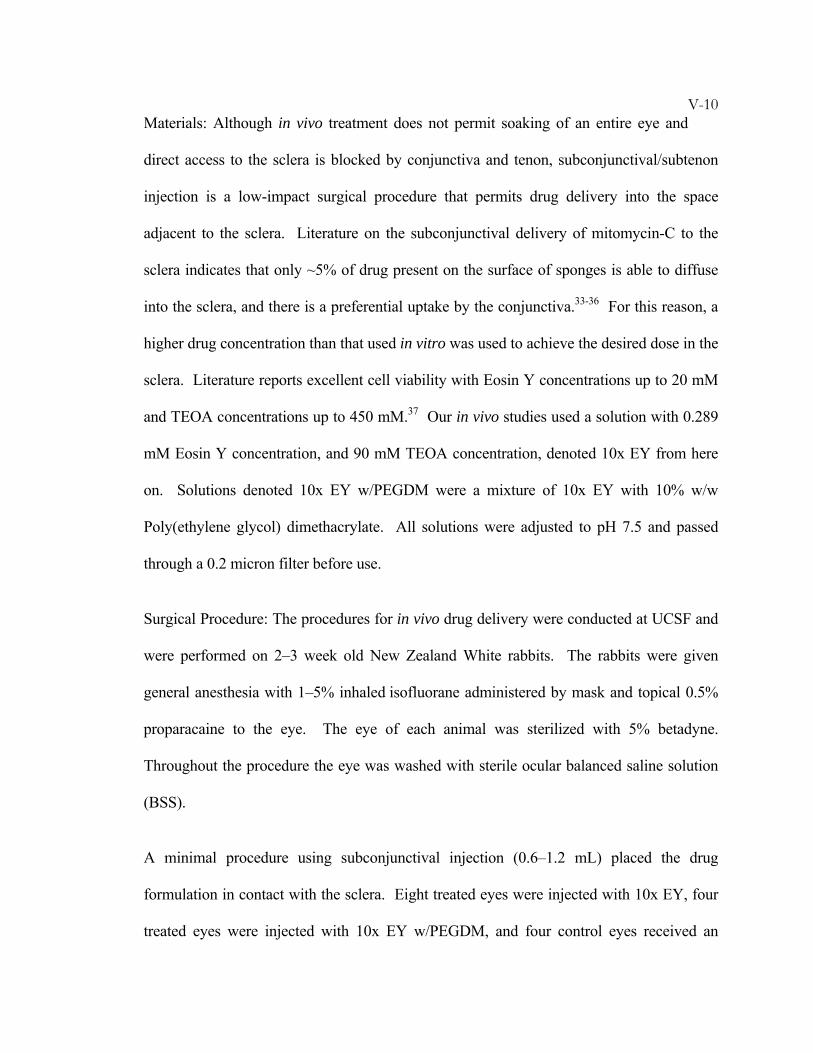
V-10Materials: Although in vivo treatment does not permit soaking of an entire eye and
direct access to the sclera is blocked by conjunctiva and tenon, subconjunctival/subtenon
injection is a low-impact surgical procedure that permits drug delivery into the space
adjacent to the sclera. Literature on the subconjunctival delivery of mitomycin-C to the
sclera indicates that only ~5% of drug present on the surface of sponges is able to diffuse
into the sclera, and there is a preferential uptake by the conjunctiva.33-36 For this reason, a
higher drug concentration than that used in vitro was used to achieve the desired dose in the
sclera. Literature reports excellent cell viability with Eosin Y concentrations up to 20 mM
and TEOA concentrations up to 450 mM.37 Our in vivo studies used a solution with 0.289
mM Eosin Y concentration, and 90 mM TEOA concentration, denoted 10x EY from here
on. Solutions denoted 10x EY w/PEGDM were a mixture of 10x EY with 10% w/w
Poly(ethylene glycol) dimethacrylate. All solutions were adjusted to pH 7.5 and passed
through a 0.2 micron filter before use.
Surgical Procedure: The procedures for in vivo drug delivery were conducted at UCSF and
were performed on 2–3 week old New Zealand White rabbits. The rabbits were given
general anesthesia with 1–5% inhaled isofluorane administered by mask and topical 0.5%
proparacaine to the eye. The eye of each animal was sterilized with 5% betadyne.
Throughout the procedure the eye was washed with sterile ocular balanced saline solution
(BSS).
A minimal procedure using subconjunctival injection (0.6–1.2 mL) placed the drug
formulation in contact with the sclera. Eight treated eyes were injected with 10x EY, four
treated eyes were injected with 10x EY w/PEGDM, and four control eyes received an
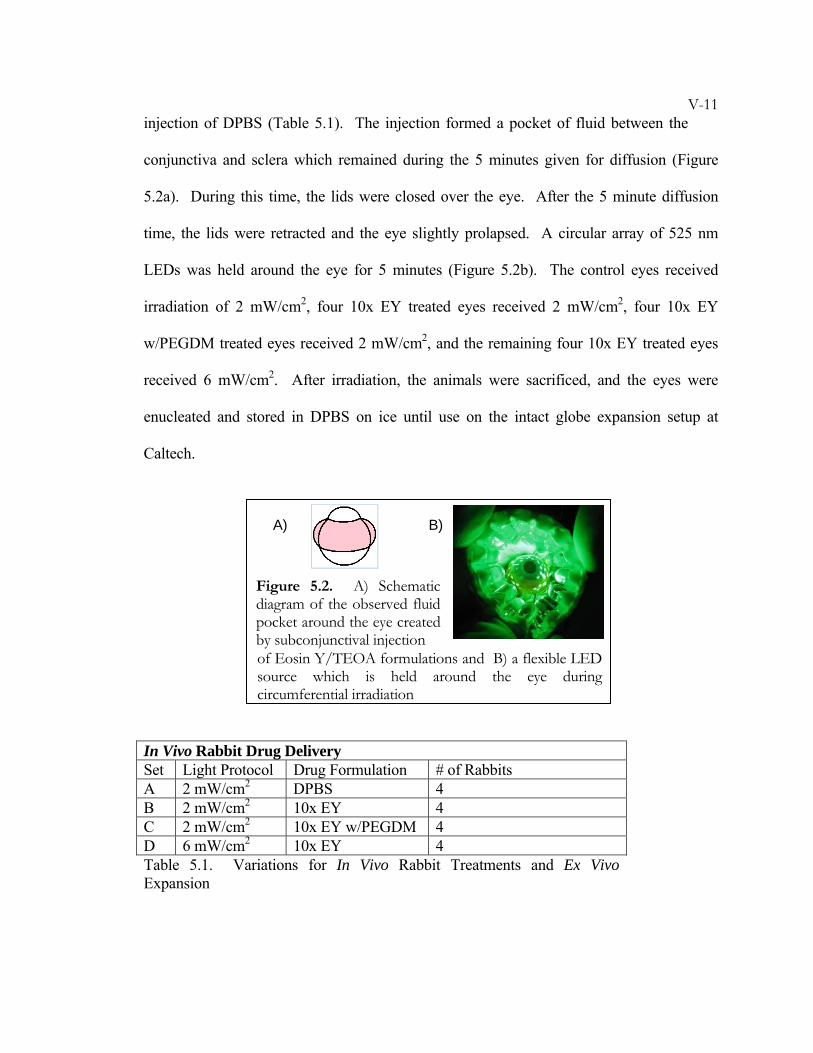
V-11injection of DPBS (Table 5.1). The injection formed a pocket of fluid between the
conjunctiva and sclera which remained during the 5 minutes given for diffusion (Figure
5.2a). During this time, the lids were closed over the eye. After the 5 minute diffusion
time, the lids were retracted and the eye slightly prolapsed. A circular array of 525 nm
LEDs was held around the eye for 5 minutes (Figure 5.2b). The control eyes received
irradiation of 2 mW/cm2, four 10x EY treated eyes received 2 mW/cm2, four 10x EY
w/PEGDM treated eyes received 2 mW/cm2, and the remaining four 10x EY treated eyes
received 6 mW/cm2. After irradiation, the animals were sacrificed, and the eyes were
enucleated and stored in DPBS on ice until use on the intact globe expansion setup at
Caltech.
In Vivo Rabbit Drug Delivery Set Light Protocol Drug Formulation # of Rabbits A 2 mW/cm2 DPBS 4 B 2 mW/cm2 10x EY 4 C 2 mW/cm2 10x EY w/PEGDM 4 D 6 mW/cm2 10x EY 4 Table 5.1. Variations for In Vivo Rabbit Treatments and Ex Vivo Expansion
Figure 5.2. A) Schematic diagram of the observed fluid pocket around the eye created by subconjunctival injection
A) B)
of Eosin Y/TEOA formulations and B) a flexible LED source which is held around the eye during circumferential irradiation
V-12Expansion Testing: Expansion experiments were performed within 48 hours post
mortem. The appearance of the eyes (e.g., clarity of the cornea and size of the globe) was
unchanged over this time scale. For the expansion experiment, extraocular tissues were
carefully removed from the eye and then the eye was placed into DPBS for ~1 hour to
equilibrate to room temperature. The eyes were loaded onto the expansion setup where the
intraocular pressure was set to 22 mmHg for 1 hour then increased to 85 mmHg for 24
hours (Chapter 2 for details).
5.2.4 Animal Model of Myopia
These experiments in a guinea pig model were conducted in collaboration with Dr. Sally
McFadden at the University of Newcastle, NSW Australia. These tests examine the
feasibility and safety of surgery, the safety of drug and irradiation, the effect of treatment
on development of form deprivation, and the effect of treatment on normal ocular growth.
Materials: All treatment solutions were prepared at pH 7.5 and passed through a 0.2 micron
filter to ensure sterility for surgery. The tests used DPBS, 3x EY (0.1 mM EY & 90 mM
TEOA in DPBS), and 10x EY.
Pigmented guinea pigs (Cavia porcellus, n = 47) were maternally reared and housed in
their natural litters with their mothers in opaque plastic boxes (65 x 45 x 20 cm) with wire
mesh lids. Water (supplemented with Vitamin C), guinea pig food pellets, and hay were
available ad libitum. Light hoods containing incandescent bulbs evenly diffused through a
perpex barrier were suspended 30 cm above each box and switched on a 12 h light/12 h
dark cycle. All procedures were approved by The University of Newcastle in accordance
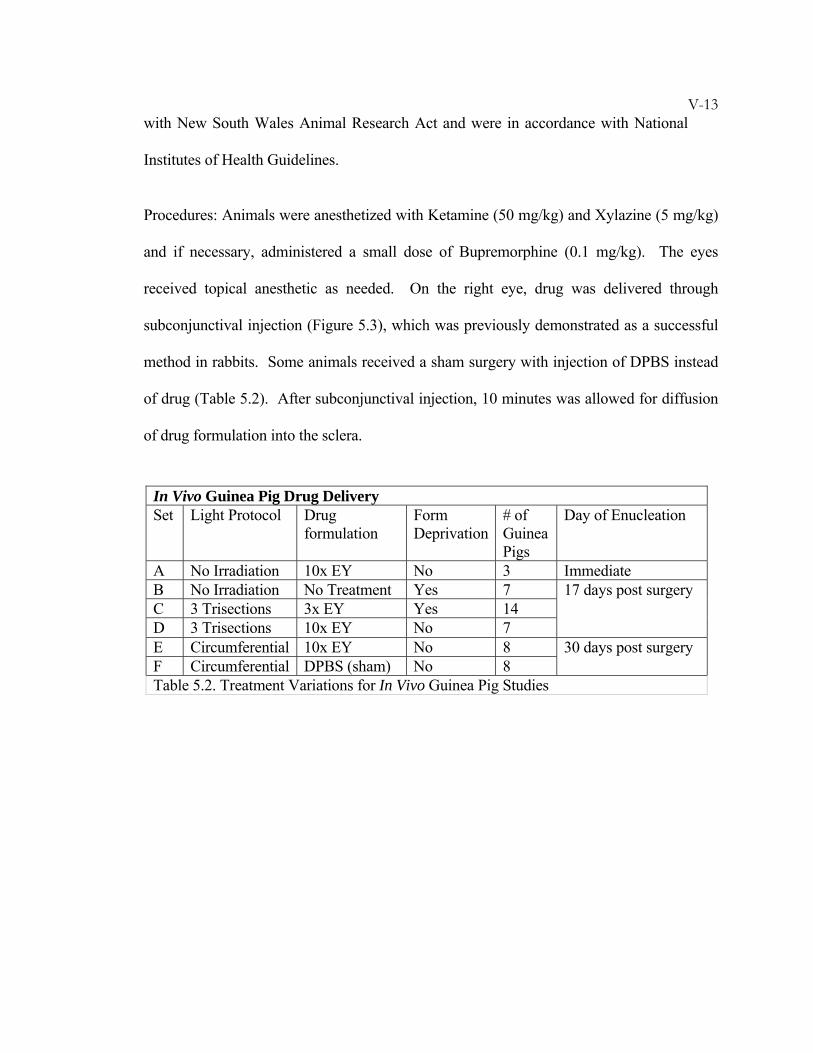
V-13with New South Wales Animal Research Act and were in accordance with National
Institutes of Health Guidelines.
Procedures: Animals were anesthetized with Ketamine (50 mg/kg) and Xylazine (5 mg/kg)
and if necessary, administered a small dose of Bupremorphine (0.1 mg/kg). The eyes
received topical anesthetic as needed. On the right eye, drug was delivered through
subconjunctival injection (Figure 5.3), which was previously demonstrated as a successful
method in rabbits. Some animals received a sham surgery with injection of DPBS instead
of drug (Table 5.2). After subconjunctival injection, 10 minutes was allowed for diffusion
of drug formulation into the sclera.
In Vivo Guinea Pig Drug Delivery Set Light Protocol Drug
formulation Form Deprivation
# of Guinea Pigs
Day of Enucleation
A No Irradiation 10x EY No 3 Immediate B No Irradiation No Treatment Yes 7 C 3 Trisections 3x EY Yes 14 D 3 Trisections 10x EY No 7
17 days post surgery
E Circumferential 10x EY No 8 F Circumferential DPBS (sham) No 8
30 days post surgery
Table 5.2. Treatment Variations for In Vivo Guinea Pig Studies
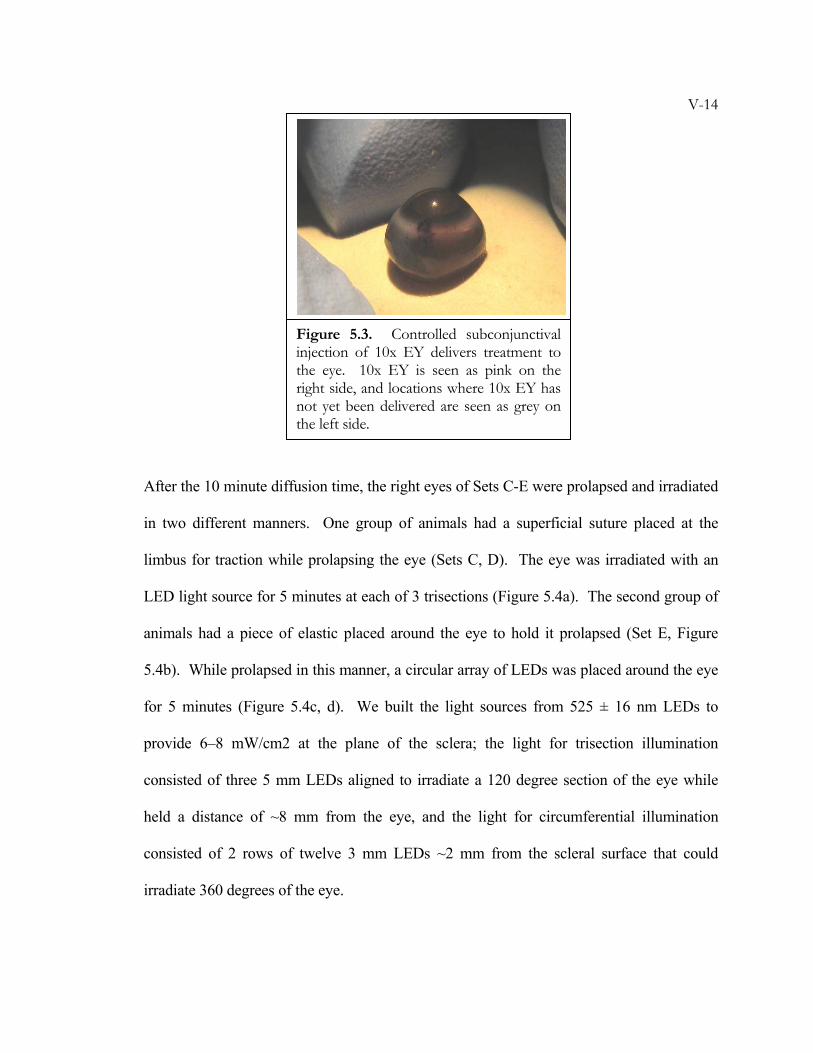
V-14
After the 10 minute diffusion time, the right eyes of Sets C-E were prolapsed and irradiated
in two different manners. One group of animals had a superficial suture placed at the
limbus for traction while prolapsing the eye (Sets C, D). The eye was irradiated with an
LED light source for 5 minutes at each of 3 trisections (Figure 5.4a). The second group of
animals had a piece of elastic placed around the eye to hold it prolapsed (Set E, Figure
5.4b). While prolapsed in this manner, a circular array of LEDs was placed around the eye
for 5 minutes (Figure 5.4c, d). We built the light sources from 525 ± 16 nm LEDs to
provide 6–8 mW/cm2 at the plane of the sclera; the light for trisection illumination
consisted of three 5 mm LEDs aligned to irradiate a 120 degree section of the eye while
held a distance of ~8 mm from the eye, and the light for circumferential illumination
consisted of 2 rows of twelve 3 mm LEDs ~2 mm from the scleral surface that could
irradiate 360 degrees of the eye.
Figure 5.3. Controlled subconjunctival injection of 10x EY delivers treatment to the eye. 10x EY is seen as pink on the right side, and locations where 10x EY has not yet been delivered are seen as grey on the left side.
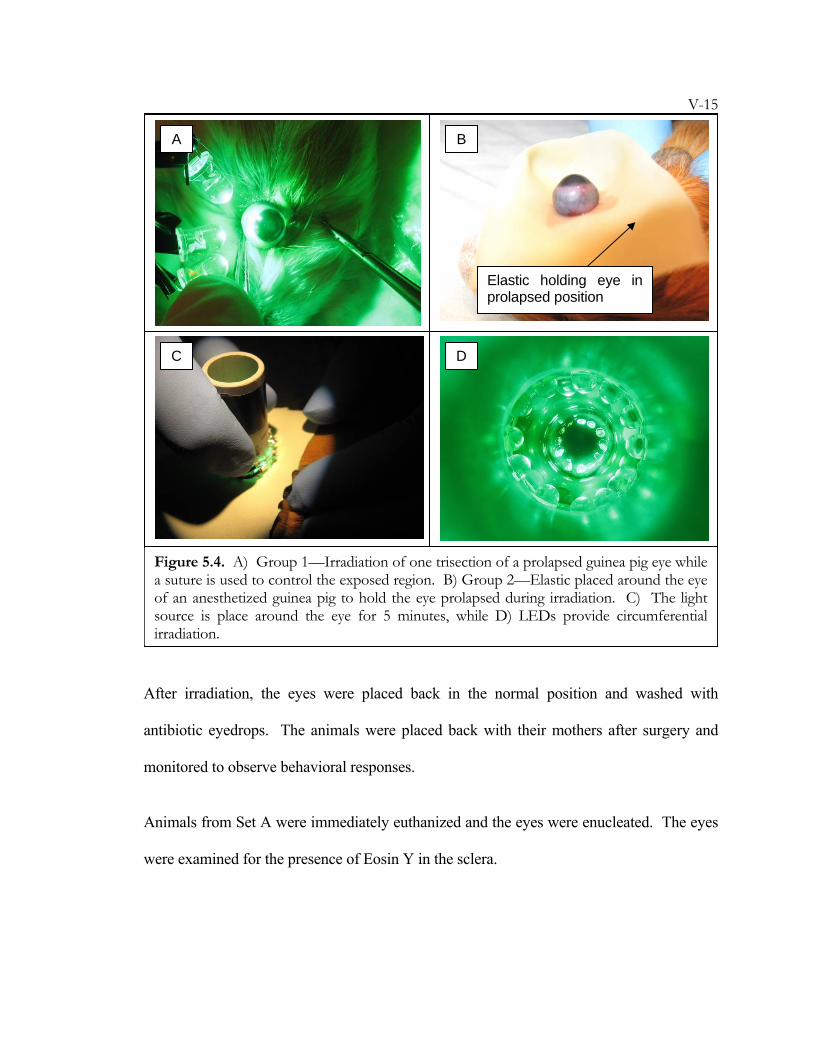
V-15
After irradiation, the eyes were placed back in the normal position and washed with
antibiotic eyedrops. The animals were placed back with their mothers after surgery and
monitored to observe behavioral responses.
Animals from Set A were immediately euthanized and the eyes were enucleated. The eyes
were examined for the presence of Eosin Y in the sclera.
Elastic holding eye in prolapsed position
C D
B A
Figure 5.4. A) Group 1—Irradiation of one trisection of a prolapsed guinea pig eye while a suture is used to control the exposed region. B) Group 2—Elastic placed around the eye of an anesthetized guinea pig to hold the eye prolapsed during irradiation. C) The light source is place around the eye for 5 minutes, while D) LEDs provide circumferential irradiation.
V-16The animals from Sets B and C included form-deprivation studies. Diffusers were
secured with velcro over the right eye when the animals were ~6 days old and the fellow
eye was left untreated (Figure 5.5). This was 2–3 days after surgery of animals in Set C.
The animals were exposed to a 12h/12h light/dark cycle, and the diffusers were removed
for 50–90% of the dark periods overnight. Diffusers were also removed during
measurements.
Animals from Sets D, E, & F did not receive diffusers and they were monitored to observe
normal growth of the eye.
Measurements were made before surgery, and then periodically after surgery to track
changes in eye shape throughout form deprivation and normal growth. Corneal power was
measured using IR videokeratometry. The animals were cyclopleged (i.e., dilated) with 2
drops of 1% cyclopentolate, and refractive error was measured using streak retinoscopy.
Finally, the animals were anesthetized with 2% isoflurane in oxygen and the axial ocular
parameters were measured using high-frequency ultrasound (20 MHz).
Figure 5.5. Method of attaching a diffuser in the guinea pig. (A) Position of the Velcro arcs. Dotted lines indicate the horizontal and vertical meridians used in retinoscopy. (B) The diffuser held in place by a matching Velcro ring attached to its base (Howlett 2006)
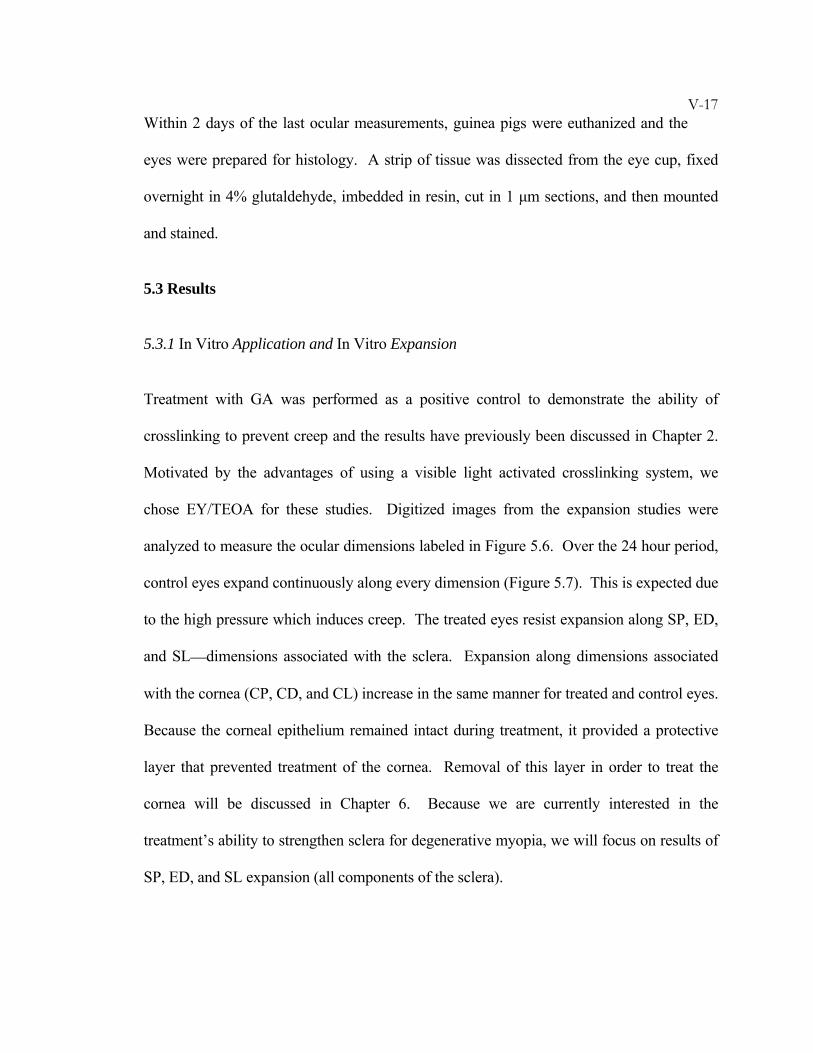
V-17Within 2 days of the last ocular measurements, guinea pigs were euthanized and the
eyes were prepared for histology. A strip of tissue was dissected from the eye cup, fixed
overnight in 4% glutaldehyde, imbedded in resin, cut in 1 μm sections, and then mounted
and stained.
5.3 Results
5.3.1 In Vitro Application and In Vitro Expansion
Treatment with GA was performed as a positive control to demonstrate the ability of
crosslinking to prevent creep and the results have previously been discussed in Chapter 2.
Motivated by the advantages of using a visible light activated crosslinking system, we
chose EY/TEOA for these studies. Digitized images from the expansion studies were
analyzed to measure the ocular dimensions labeled in Figure 5.6. Over the 24 hour period,
control eyes expand continuously along every dimension (Figure 5.7). This is expected due
to the high pressure which induces creep. The treated eyes resist expansion along SP, ED,
and SL—dimensions associated with the sclera. Expansion along dimensions associated
with the cornea (CP, CD, and CL) increase in the same manner for treated and control eyes.
Because the corneal epithelium remained intact during treatment, it provided a protective
layer that prevented treatment of the cornea. Removal of this layer in order to treat the
cornea will be discussed in Chapter 6. Because we are currently interested in the
treatment’s ability to strengthen sclera for degenerative myopia, we will focus on results of
SP, ED, and SL expansion (all components of the sclera).
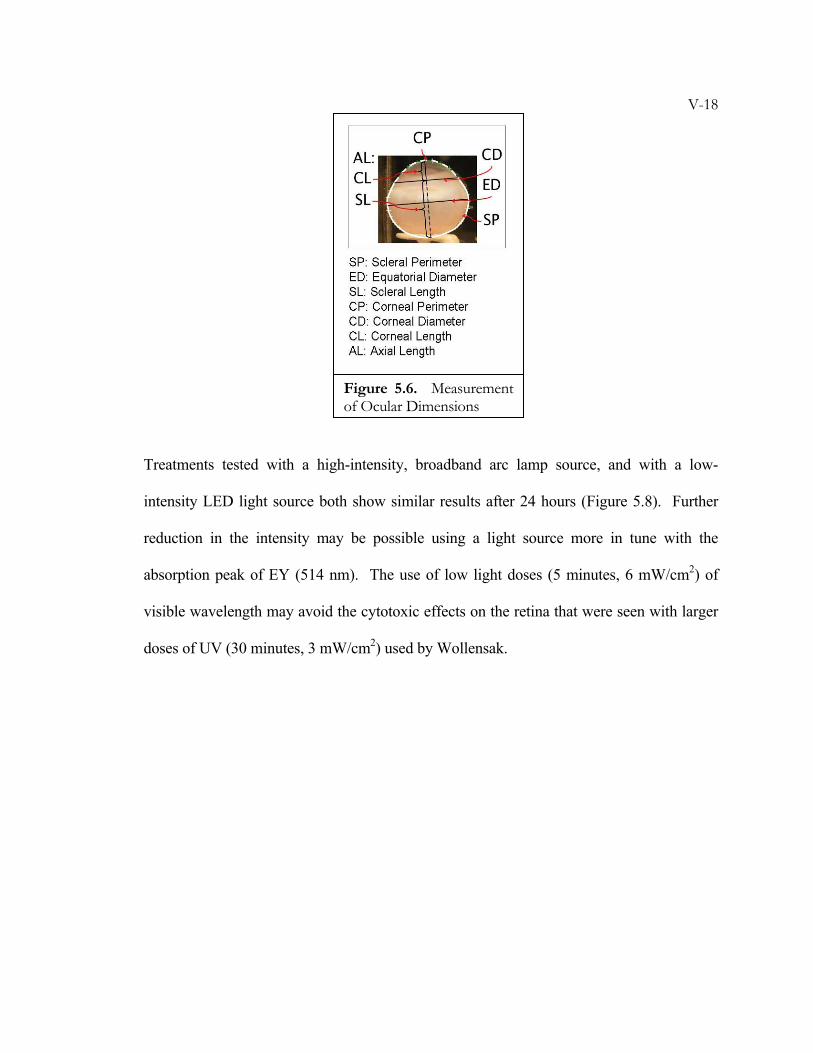
V-18
Treatments tested with a high-intensity, broadband arc lamp source, and with a low-
intensity LED light source both show similar results after 24 hours (Figure 5.8). Further
reduction in the intensity may be possible using a light source more in tune with the
absorption peak of EY (514 nm). The use of low light doses (5 minutes, 6 mW/cm2) of
visible wavelength may avoid the cytotoxic effects on the retina that were seen with larger
doses of UV (30 minutes, 3 mW/cm2) used by Wollensak.
Figure 5.6. Measurement of Ocular Dimensions
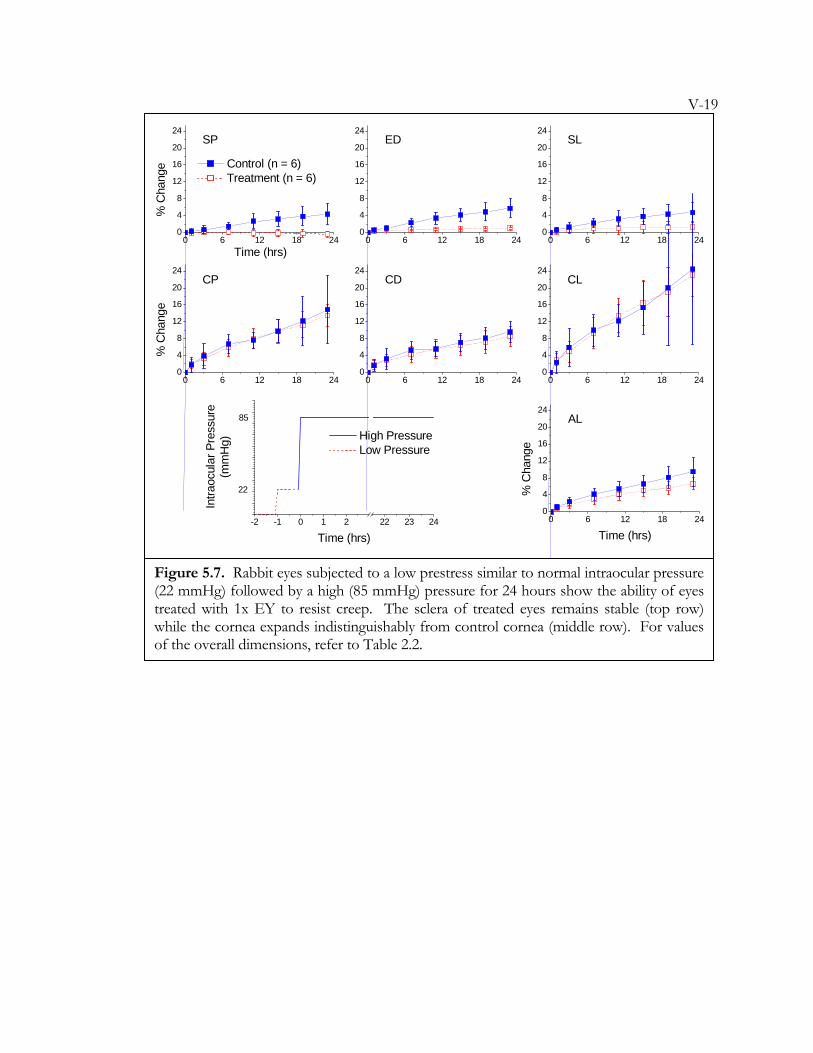
V-19
0 6 12 18 240
4
8
12
16
20
24
0 6 12 18 240
4
8
12
16
20
24
0 6 12 18 240
4
8
12
16
20
24
0 6 12 18 240
4
8
12
16
20
24
0 6 12 18 240
4
8
12
16
20
24
0 6 12 18 240
4
8
12
16
20
24
0 6 12 18 240
4
8
12
16
20
24
Time (hrs)
Control (n = 6) Treatment (n = 6)
SP
% C
hang
e
ED SL
CP
% C
hang
e
CD CL
AL
% C
hang
eTime (hrs)
-2 -1 0 1 2 22 23 24
High Pressure Low Pressure
22
85
Intra
ocul
ar P
ress
ure
(mm
Hg)
Time (hrs)
Figure 5.7. Rabbit eyes subjected to a low prestress similar to normal intraocular pressure (22 mmHg) followed by a high (85 mmHg) pressure for 24 hours show the ability of eyes treated with 1x EY to resist creep. The sclera of treated eyes remains stable (top row) while the cornea expands indistinguishably from control cornea (middle row). For values of the overall dimensions, refer to Table 2.2.
V-20
5.3.2 Biocompatibility
Biocompatibility studies were performed on albino rabbit eyes because the lack of
pigmentation in these eyes allows for easy visualization of toxic or inflammatory
responses. In all of the eyes we operated on, there was some observed swelling and
inflammation for 2 days following the procedure. This was consistent with what would be
expected to result from the surgical procedure itself. There were no clinical signs of pain or
inflammation in any of the eyes 3 days after the procedure and on each examination
thereafter.
SP ED LS-2
0
2
4
6
8 (n) (6) (6) (4)
mW/cm2
66
34
**
*
*
*%
Cha
nge
Measurement Description
Control LED ArcLamp
Figure 5.8. In vitro treatment: percentage change in scleral dimensions after 24 hour expansion—Eyes treated with 1x EY mixture and irradiation show reduced expansion in the intact globe experiment along SP, ED, and SL (Figure 5) as compared to controls treated with DPBS. Similar efficacy is achieved using narrow-band LEDs (525±16 nm) at a low light dose as with a broadband arc lamp (500±50 nm) at a high light dose. *significant difference from control with p < 0.05
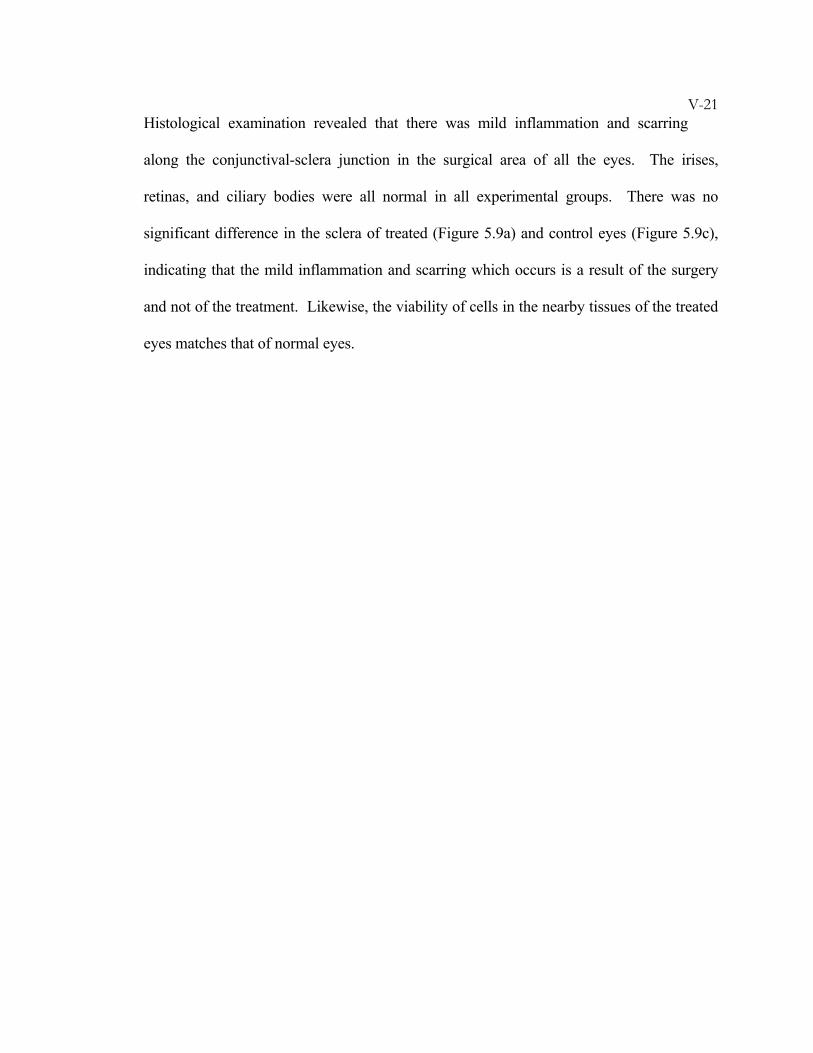
V-21Histological examination revealed that there was mild inflammation and scarring
along the conjunctival-sclera junction in the surgical area of all the eyes. The irises,
retinas, and ciliary bodies were all normal in all experimental groups. There was no
significant difference in the sclera of treated (Figure 5.9a) and control eyes (Figure 5.9c),
indicating that the mild inflammation and scarring which occurs is a result of the surgery
and not of the treatment. Likewise, the viability of cells in the nearby tissues of the treated
eyes matches that of normal eyes.
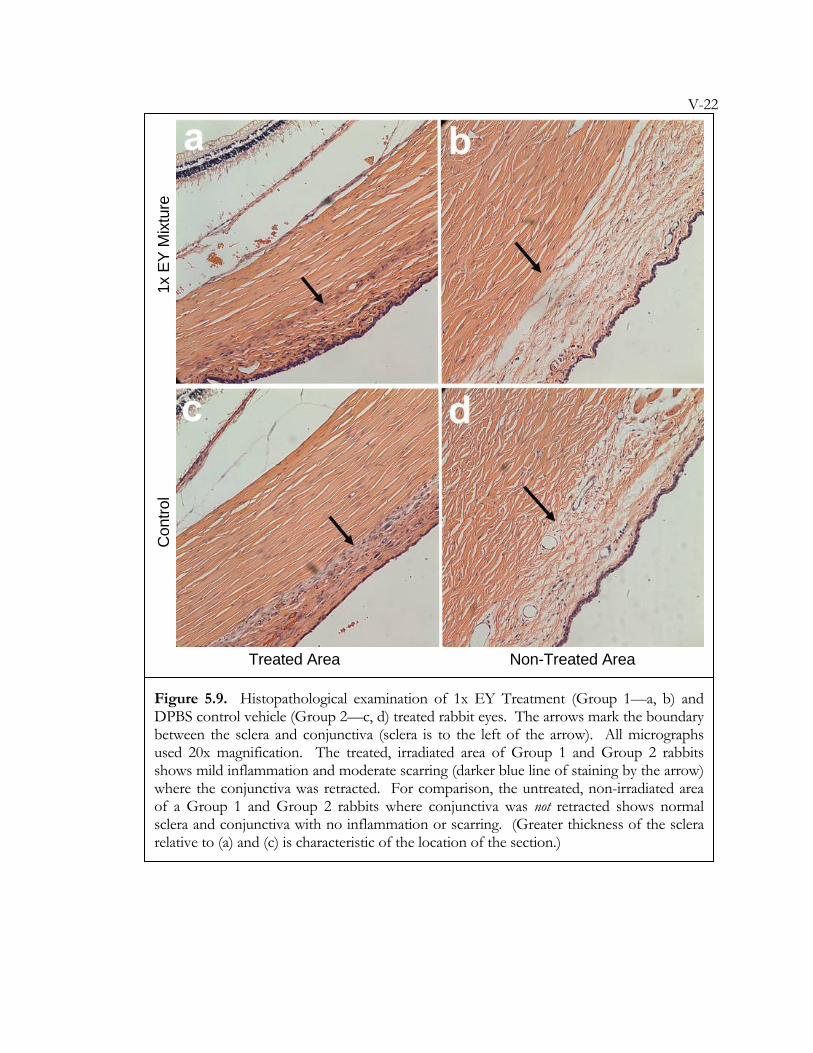
V-22
Con
trol
1x E
Y M
ixtu
re
Figure 5.9. Histopathological examination of 1x EY Treatment (Group 1—a, b) and DPBS control vehicle (Group 2—c, d) treated rabbit eyes. The arrows mark the boundary between the sclera and conjunctiva (sclera is to the left of the arrow). All micrographs used 20x magnification. The treated, irradiated area of Group 1 and Group 2 rabbits shows mild inflammation and moderate scarring (darker blue line of staining by the arrow) where the conjunctiva was retracted. For comparison, the untreated, non-irradiated area of a Group 1 and Group 2 rabbits where conjunctiva was not retracted shows normal sclera and conjunctiva with no inflammation or scarring. (Greater thickness of the sclera relative to (a) and (c) is characteristic of the location of the section.)
Treated Area Non-Treated Area
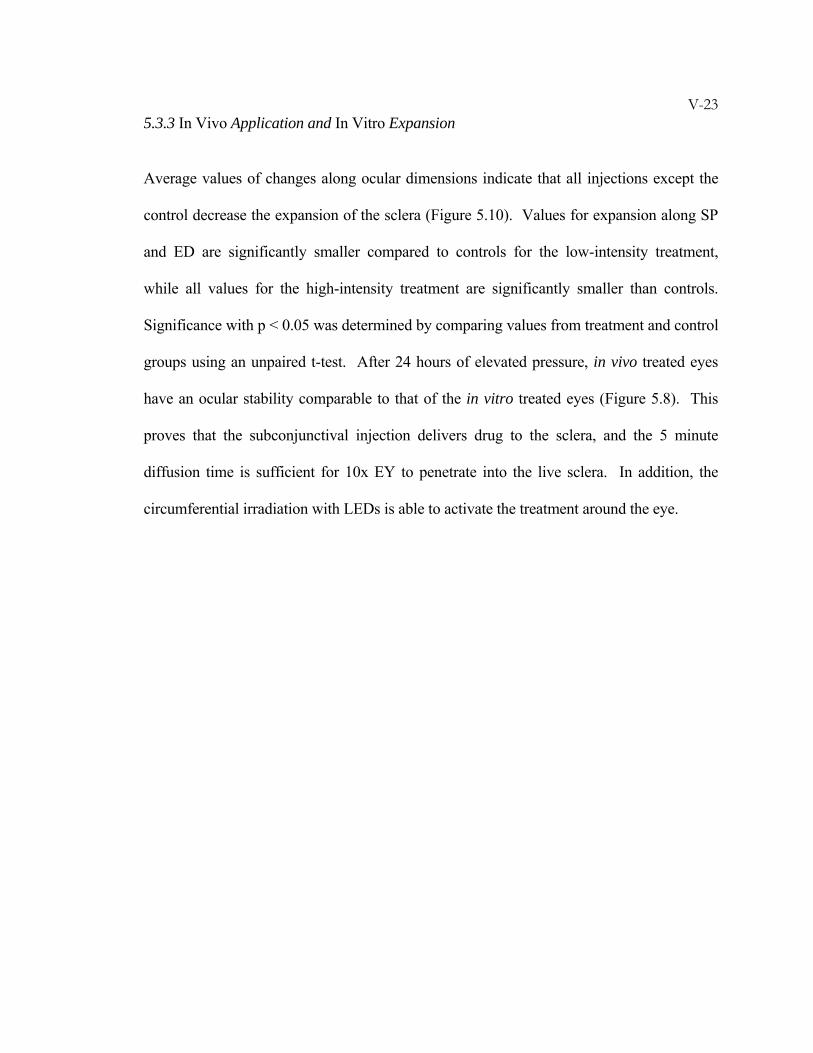
V-235.3.3 In Vivo Application and In Vitro Expansion
Average values of changes along ocular dimensions indicate that all injections except the
control decrease the expansion of the sclera (Figure 5.10). Values for expansion along SP
and ED are significantly smaller compared to controls for the low-intensity treatment,
while all values for the high-intensity treatment are significantly smaller than controls.
Significance with p < 0.05 was determined by comparing values from treatment and control
groups using an unpaired t-test. After 24 hours of elevated pressure, in vivo treated eyes
have an ocular stability comparable to that of the in vitro treated eyes (Figure 5.8). This
proves that the subconjunctival injection delivers drug to the sclera, and the 5 minute
diffusion time is sufficient for 10x EY to penetrate into the live sclera. In addition, the
circumferential irradiation with LEDs is able to activate the treatment around the eye.
V-24
5.3.4 Animal Model of Myopia
Using a guinea pig model, data was obtained regarding drug delivery, toxicity, and
tolerance of surgical procedures. After surgery, there was minimal inflammation of the
conjunctiva that disappeared within 2–3 days. The eyes had a normal pupil response and
clear ocular media which allowed for streak retinoscopy measurements. Gross ocular
function (pupillary reflexes, response to light, blink reflex) appeared normal. Behaviorally,
the animals moved about the habitat normally and had normal eating and drinking habits.
Observations of the sham surgery controls indicated that the surgical procedure was well-
tolerated by the eyes. The eyes receiving the 3x EY and 10x EY formulations
demonstrated no evidence of toxicity problems. Tissue sections from treated and fellow
SP ED SL
-2
0
2
4
6
8 (n)(4)(4)(4)
mW/cm2
226
*
**
*
*
% C
hang
e
Measurement Description
Control 10xEY 10xEY
Figure 5.10. In vivo treatment after 24 hour expansion—Eyes treated with 10x EY and irradiation show reduced expansion in the intact globe experiment as compared to controls treated with DPBS and irradiation. Treatment with 6 mW/cm2 may have greater stabilizing effects than with 2 mW/cm2. Control and treated groups show similar behavior as in vitro treated eyes (Figure 5.8).
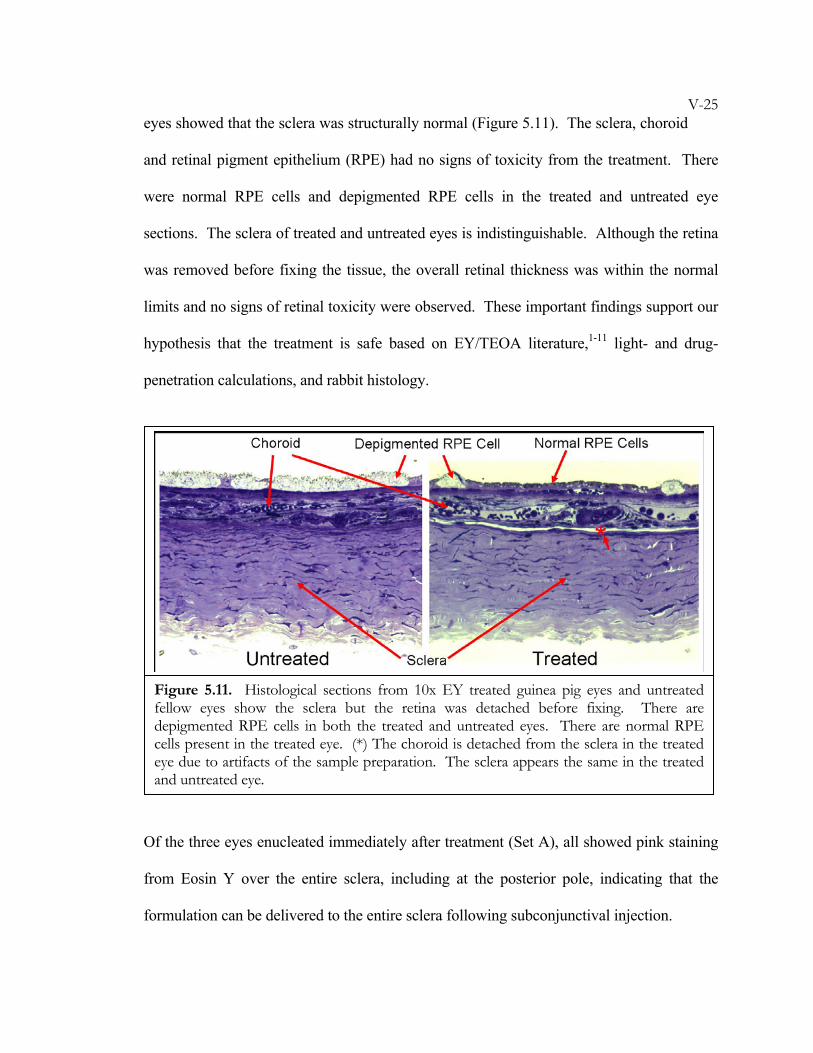
V-25eyes showed that the sclera was structurally normal (Figure 5.11). The sclera, choroid
and retinal pigment epithelium (RPE) had no signs of toxicity from the treatment. There
were normal RPE cells and depigmented RPE cells in the treated and untreated eye
sections. The sclera of treated and untreated eyes is indistinguishable. Although the retina
was removed before fixing the tissue, the overall retinal thickness was within the normal
limits and no signs of retinal toxicity were observed. These important findings support our
hypothesis that the treatment is safe based on EY/TEOA literature,1-11 light- and drug-
penetration calculations, and rabbit histology.
Of the three eyes enucleated immediately after treatment (Set A), all showed pink staining
from Eosin Y over the entire sclera, including at the posterior pole, indicating that the
formulation can be delivered to the entire sclera following subconjunctival injection.
Figure 5.11. Histological sections from 10x EY treated guinea pig eyes and untreated fellow eyes show the sclera but the retina was detached before fixing. There are depigmented RPE cells in both the treated and untreated eyes. There are normal RPE cells present in the treated eye. (*) The choroid is detached from the sclera in the treated eye due to artifacts of the sample preparation. The sclera appears the same in the treated and untreated eye.
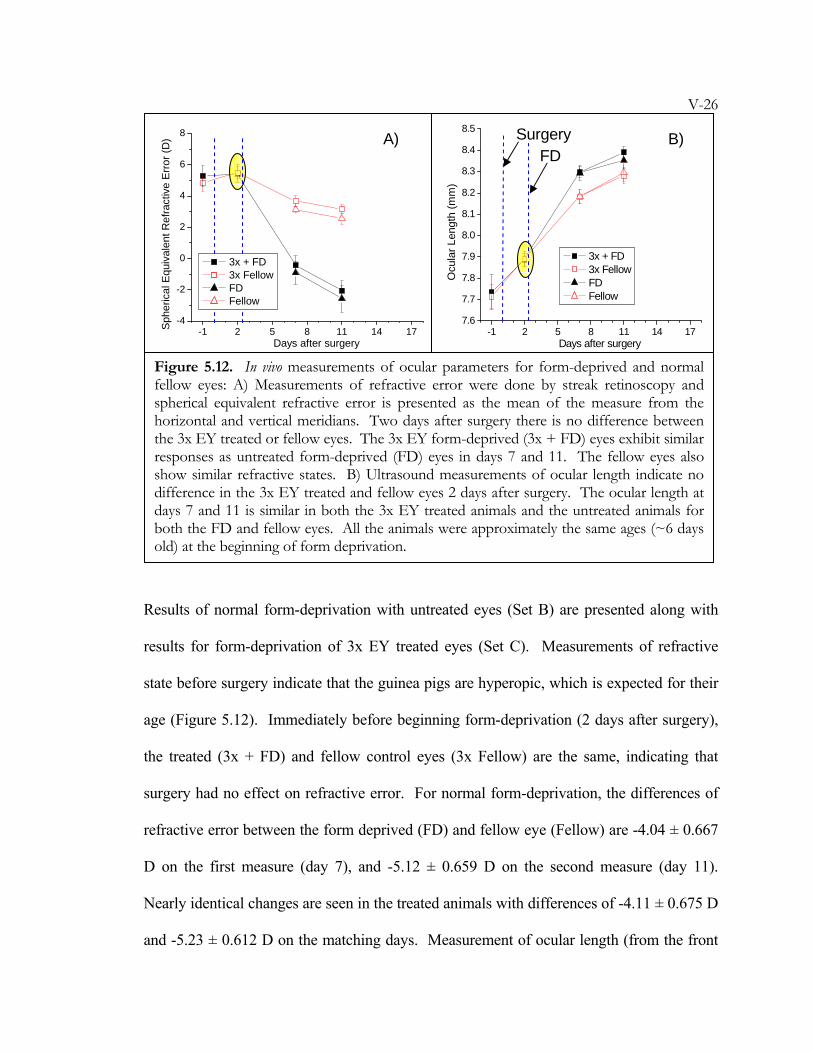
V-26
Results of normal form-deprivation with untreated eyes (Set B) are presented along with
results for form-deprivation of 3x EY treated eyes (Set C). Measurements of refractive
state before surgery indicate that the guinea pigs are hyperopic, which is expected for their
age (Figure 5.12). Immediately before beginning form-deprivation (2 days after surgery),
the treated (3x + FD) and fellow control eyes (3x Fellow) are the same, indicating that
surgery had no effect on refractive error. For normal form-deprivation, the differences of
refractive error between the form deprived (FD) and fellow eye (Fellow) are -4.04 ± 0.667
D on the first measure (day 7), and -5.12 ± 0.659 D on the second measure (day 11).
Nearly identical changes are seen in the treated animals with differences of -4.11 ± 0.675 D
and -5.23 ± 0.612 D on the matching days. Measurement of ocular length (from the front
-1 2 5 8 11 14 17-4
-2
0
2
4
6
8
Days after surgery
Sphe
rical
Equ
ival
ent R
efra
ctiv
e Er
ror (
D)
3x + FD 3x Fellow FD Fellow
-1 2 5 8 11 14 177.6
7.7
7.8
7.9
8.0
8.1
8.2
8.3
8.4
8.5
Days after surgery
Ocu
lar L
engt
h (m
m)
3x + FD 3x Fellow FD Fellow
Figure 5.12. In vivo measurements of ocular parameters for form-deprived and normal fellow eyes: A) Measurements of refractive error were done by streak retinoscopy and spherical equivalent refractive error is presented as the mean of the measure from the horizontal and vertical meridians. Two days after surgery there is no difference between the 3x EY treated or fellow eyes. The 3x EY form-deprived (3x + FD) eyes exhibit similar responses as untreated form-deprived (FD) eyes in days 7 and 11. The fellow eyes also show similar refractive states. B) Ultrasound measurements of ocular length indicate no difference in the 3x EY treated and fellow eyes 2 days after surgery. The ocular length at days 7 and 11 is similar in both the 3x EY treated animals and the untreated animals for both the FD and fellow eyes. All the animals were approximately the same ages (~6 days old) at the beginning of form deprivation.
A) B) Surgery FD
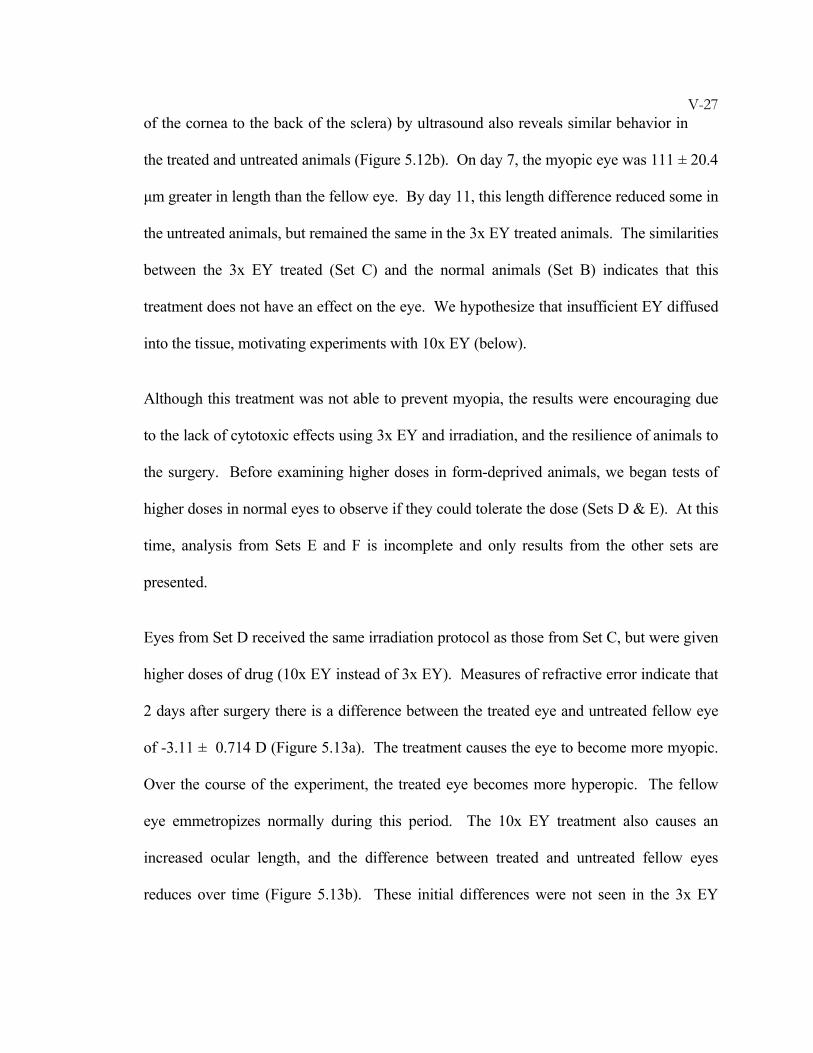
V-27of the cornea to the back of the sclera) by ultrasound also reveals similar behavior in
the treated and untreated animals (Figure 5.12b). On day 7, the myopic eye was 111 ± 20.4
μm greater in length than the fellow eye. By day 11, this length difference reduced some in
the untreated animals, but remained the same in the 3x EY treated animals. The similarities
between the 3x EY treated (Set C) and the normal animals (Set B) indicates that this
treatment does not have an effect on the eye. We hypothesize that insufficient EY diffused
into the tissue, motivating experiments with 10x EY (below).
Although this treatment was not able to prevent myopia, the results were encouraging due
to the lack of cytotoxic effects using 3x EY and irradiation, and the resilience of animals to
the surgery. Before examining higher doses in form-deprived animals, we began tests of
higher doses in normal eyes to observe if they could tolerate the dose (Sets D & E). At this
time, analysis from Sets E and F is incomplete and only results from the other sets are
presented.
Eyes from Set D received the same irradiation protocol as those from Set C, but were given
higher doses of drug (10x EY instead of 3x EY). Measures of refractive error indicate that
2 days after surgery there is a difference between the treated eye and untreated fellow eye
of -3.11 ± 0.714 D (Figure 5.13a). The treatment causes the eye to become more myopic.
Over the course of the experiment, the treated eye becomes more hyperopic. The fellow
eye emmetropizes normally during this period. The 10x EY treatment also causes an
increased ocular length, and the difference between treated and untreated fellow eyes
reduces over time (Figure 5.13b). These initial differences were not seen in the 3x EY
V-28treated eyes and they indicate that significant changes have occurred due to treatment
with 10x EY.
The change in ocular length is examined in greater detail using ultrasound biometry to
evaluate all the ocular dimensions that contribute to ocular length (Figure 5.14). The
cornea and anterior chamber thickness (CAC) grows normally for both eyes (Figure 5.14a).
The lens grows normally despite an initial difference at day 2 (Figure 5.14b). The
variability in day-to-day lens thickness suggests that the uncertainty in the measurement is
greater than the error bars indicate. The vitreous chamber elongates more slowly in the
treated eye than in the untreated eye (Figure 5.14c). There is no difference in retinal
thickness (Figure 5.14d). The choroid and sclera are both thicker in the treated eye (Figure
-1 2 5 8 11 14 17-4
-2
0
2
4
6
8
Days after surgery
Sph
eric
al E
quiv
alen
t Ref
ract
ive
Erro
r (D
)
10x Treated 10x Fellow Treated Fit Fellow Fit
-1 2 5 8 11 14 177.6
7.7
7.8
7.9
8.0
8.1
8.2
8.3
8.4
8.5
Days after surgery
Ocu
lar L
engt
h (m
m)
10x Treated 10x Fellow Treated Fit Fellow Fit
Figure 5.13. Guinea pigs eyes undergoing normal growth were treated at day 0 with 10x EY and irradiation in the right eye and the fellow eye remained untreated. Dotted lines are shown to guide the eye. A) Two days after the surgery, the refractive state of the treated eyes is significantly different from that of the untreated eye. During normal growth, the fellow eye progresses toward emmetropia whereas the 10x EY treated eye maintains a stable refractive state, and becomes slightly more hyperopic over 17 days. B) Measurements of ocular length are different at two days after surgery, with the treated eye being longer than the fellow eye. Over 17 days, the rate of ocular length change is larger in the fellow eye than in the 10x EY treated eye. Linear fits are used to illustrate the growth trends.
A) B) Surgery
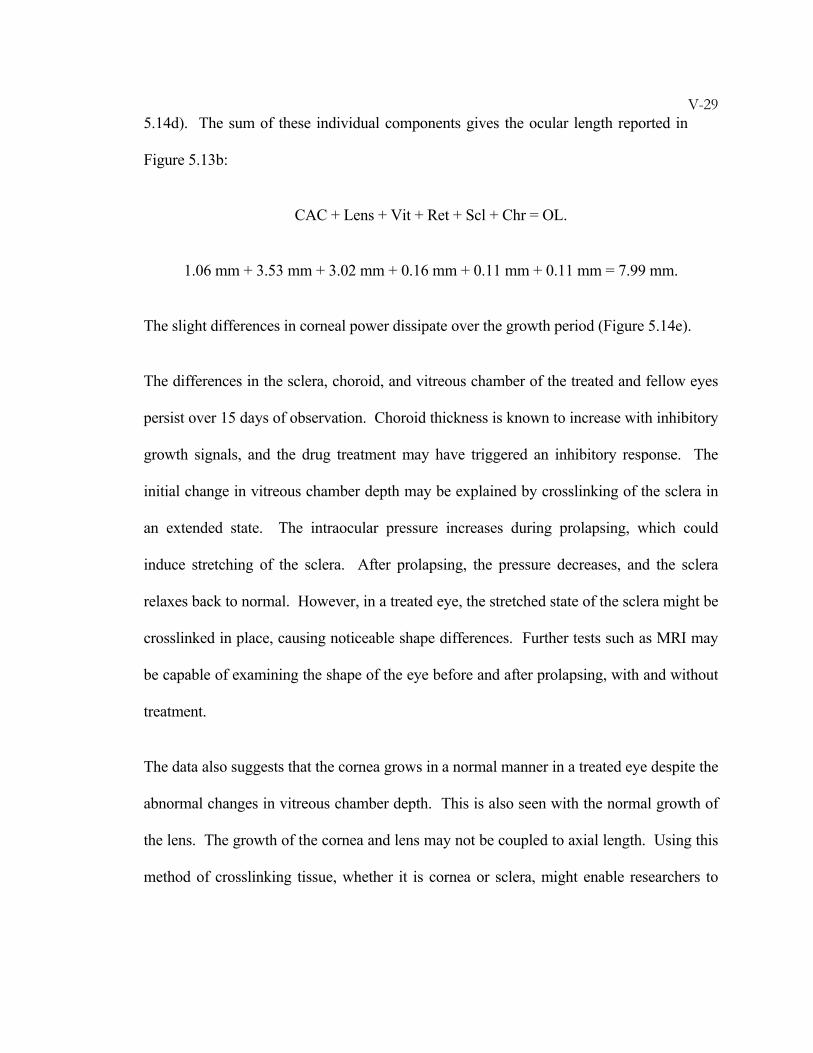
V-295.14d). The sum of these individual components gives the ocular length reported in
Figure 5.13b:
CAC + Lens + Vit + Ret + Scl + Chr = OL.
1.06 mm + 3.53 mm + 3.02 mm + 0.16 mm + 0.11 mm + 0.11 mm = 7.99 mm.
The slight differences in corneal power dissipate over the growth period (Figure 5.14e).
The differences in the sclera, choroid, and vitreous chamber of the treated and fellow eyes
persist over 15 days of observation. Choroid thickness is known to increase with inhibitory
growth signals, and the drug treatment may have triggered an inhibitory response. The
initial change in vitreous chamber depth may be explained by crosslinking of the sclera in
an extended state. The intraocular pressure increases during prolapsing, which could
induce stretching of the sclera. After prolapsing, the pressure decreases, and the sclera
relaxes back to normal. However, in a treated eye, the stretched state of the sclera might be
crosslinked in place, causing noticeable shape differences. Further tests such as MRI may
be capable of examining the shape of the eye before and after prolapsing, with and without
treatment.
The data also suggests that the cornea grows in a normal manner in a treated eye despite the
abnormal changes in vitreous chamber depth. This is also seen with the normal growth of
the lens. The growth of the cornea and lens may not be coupled to axial length. Using this
method of crosslinking tissue, whether it is cornea or sclera, might enable researchers to
V-30determine if there is a coupled feedback for growth of the ocular components in these
animals.
-1 2 5 8 11 14 171.0
1.1
1.2
1.3
1.4
1.5
Days after surgery
CAC
(mm
)
10x Treated 10x Fellow Treated Fit Fellow Fit
-1 2 5 8 11 14 17
3.3
3.4
3.5
3.6
3.7
Days after surgery
Lens
(mm
)
10x Treated 10x Fellow Treated Fit Fellow Fit
-1 2 5 8 11 14 17
2.8
2.9
3.0
3.1
3.2
Days after surgery
Vit
(mm
)
10x Treated 10x Fellow Treated Fit Fellow Fit
-1 2 5 8 11 14 17
0.08
0.10
0.12
0.14
0.16
Scl 10x Treated 10x Fellow
Chr 10x Treated 10x Fellow
Days after surgery
Thic
knes
s (m
m)
Ret 10x Treated 10x Fellow
-1 2 5 8 11 14 1794
96
98
100
102
104
106
Days after surgery
Cor
neal
Pow
er (D
)
10x Treated 10x Fellow
A) B) C)
D) E)
F)
posterior layers, and E) corneal power. C) The vitreous chamber elongates faster in the untreated fellow eye than in the treated eye and D) the sclera and choroid are thicker in treated eyes.
Figure 5.14. The ultrasound measurements are analyzed to measure corneal thickness and anterior chamber depth (CAC), lens thickness (Lens), vitreous chamber depth (Vit), retina thickness (Ret), choroid thickness (Chr), and sclera thickness (Scl) as F) illustrates. There are no differences between the 10x EY treated and untreated fellow eyes for A) CAC, B) Lens, D)

V-315.4 Summary
Were it possible to retard or prevent abnormal axial elongation of the globe in degenerative
myopia, visual loss might be prevented. Use of the expansion model in this study has
allowed us to measure the progressive enlargement of the eye due to creep in the sclera.
The ability of 1x EY and 10x EY to halt expansion in vitro in rabbit eyes indicates that the
change in tissue properties upon treatment might prevent creep in vivo. Results from the
biocompatibility studies in rabbits and guinea pigs show only minor inflammation from the
surgery, and no adverse responses due to treatment concentrations up to 10x EY. Results
from in vivo guinea pig studies demonstrate that the treatment with 3x EY did not alter
ocular shape or prevent form-deprivation myopia. However, the higher dose of 10x EY did
substantially alter ocular parameters during normal growth, possibly due to elevated
intraocular pressure during prolapsing at the time of irradiation. The experiments establish
protocols that may be extended to form-deprivation studies of 10x EY, perhaps with
modification of the irradiation step to ensure that the globe is at normal intraocular
pressure. Future treatments of the entire eye, or specifically the posterior pole, are also
recommended to test their ability to prevent form-deprivation myopia in the guinea pigs.
V-32BIBLIOGRAPHY
1. McBrien, N.A., Gentle, A. Role of the sclera in the development and
pathological complications of myopia. Progress In Retinal And Eye Research 22,
307-338 (2003).
2. Rada, J.A.S., Shelton, S., Norton, T.T. The sclera and myopia. Experimental Eye
Research 82, 185-200 (2006).
3. Blinder, K.J., Blumenkranz, M.S., Bressler, N.M., Bressler, S.B., Donati, G.,
Lewis, H., Lim, J.I., Menchini, U., Miller, J.W., Mones, J.M., Potter, M.J.,
Pournaras, C., Reaves, A., Rosenfeld, P., Schachat, A.P., Schmidt-Erfurth, U.,
Sickenberg, M., Singerman, L.J., Slakter, J., Strong, H.A., Virgili, G., Williams,
G.A. Verteporfin therapy of subfoveal choroidal neovascularization in
pathologic myopia - 2-year results of a randomized clinical Trial - VIP report
no. 3. Ophthalmology 110, 667-673 (2003).
4. Chan, W.M., Ohji, M., Lai, T.Y.Y., Liu, D.T.L., Tano, Y., Lam, D.S.C.
Choroidal neovascularisation in pathological myopia: an update in
management. British Journal of Ophthalmology 89, 1522-1528 (2005).
5. Buys, Y.M. Bevacizumab: the need for controlled studies to move forward.
Canadian Journal of Ophthalmology-Journal Canadien D Ophtalmologie 42, 789-789
(2007).
6. Rosenfeld, P.J. Intravitreal Avastin for choroidal neovascularisation in
pathological myopia: the controversy continues. British Journal of Ophthalmology
91, 128-130 (2007).
V-337. Yamamoto, I., Rogers, A.H., Reichel, E., Yates, P.A., Duker, J.S. Intravitreal
bevacizumab (Avastin) as treatment for subfoveal choroidal neovascularisation
secondary to pathological myopia. British Journal of Ophthalmology 91, 157-160
(2007).
8. Sakaguchi, H., Ikuno, Y., Gomi, F., Kamei, M., Sawa, M., Tsujikawa, M.,
Oshima, Y., Kusaka, S., Tano, Y. Intravitreal injection of bevacizumab for
choroidal neovascularisation associated with pathological myopia. British Journal
of Ophthalmology 91, 161-165 (2007).
9. Avetisov, E.S., Tarutta, E.P., Iomdina, E.N., Vinetskaya, M.I., Andreyeva, L.D.
Nonsurgical and surgical methods of sclera reinforcement in progressive
myopia. Acta Ophthalmologica Scandinavica 75, 618-623 (1997).
10. Chua, W.H., Tan, D., Balakrishnan, V., Chan, Y.H. Progression of childhood
myopia following cessation of atropine treatment. Investigative Ophthalmology &
Visual Science 46 (2005).
11. Tarutta, Y.P., Iomdina, Y.N., Shamkhalova, E.S., Andreyeva, L.D., Maximova,
M.V. Sclera Fortification In Children At A High-Risk Of Progressive Myopia.
Vestnik Oftalmologii 108, 14-17 (1992).
12. Politzer, M. Experiences In Medical-Treatment Of Progressive Myopia.
Klinische Monatsblatter Fur Augenheilkunde 171, 616-619 (1977).
13. Belyaev, V.S., Ilyina, T.S. Late Results Of Scleroplasty In Surgical Treatment
Of Progressive Myopia. Eye Ear Nose And Throat Monthly 54, 109-113 (1975).
14. Chauvaud, D., Assouline, M., Perrenoud, F. Scleral reinforcement. Journal
Francais D Ophtalmologie 20, 374-382 (1997).
V-3415. Jacob, J.T., Lin, J.J., Mikal, S.P. Synthetic scleral reinforcement materials .3.
Changes in surface and bulk physical properties. Journal Of Biomedical Materials
Research 37, 525-533 (1997).
16. Korobelnik, J.F., D'Hermies, F., Chauvaud, D., Legeais, J.M., Hoang-Xuan, T.,
Renard, G. Expanded polytetrafluoroethylene episcleral implants used as
encircling scleral buckling - An experimental and histopathological study.
Ophthalmic Research 32, 110-117 (2000).
17. Mortemousque, B., Leger, F., Velou, S., Graffan, R., Colin, J., Korobelnik, J.F.
S/e-PTFE episcleral buckling implants: An experimental and histopathologic
study. Journal Of Biomedical Materials Research 63, 686-691 (2002).
18. Jacoblabarre, J.T., Assouline, M., Conway, M.D., Thompson, H.W.,
McDonald, M.B. Effects Of Scleral Reinforcement On The Elongation Of
Growing Cat Eyes. Archives Of Ophthalmology 111, 979-986 (1993).
19. Bailey, A.J. Molecular mechanisms of ageing in connective tissues. Mechanisms
of Ageing and Development 122, 735-755 (2001).
20. Singh, R., Barden, A., Mori, T., Beilin, L. Advanced glycation end-products: a
review. Diabetologia 44, 129-146 (2001).
21. Spoerl, E., Wollensak, G., Seiler, T. Increased resistance of crosslinked cornea
against enzymatic digestion. Current Eye Research 29, 35-40 (2004).
22. Wollensak, G., Spoerl, E. Collagen crosslinking of human and porcine sclera.
Journal Of Cataract And Refractive Surgery 30, 689-695 (2004).
23. Wollensak, G., Iomdina, E., Dittert, D.D., Salamatina, O., Stoltenburg, G.
Cross-linking of scleral collagen in the rabbit using riboflavin and UVA. Acta
Ophthalmologica Scandinavica 83, 477-482 (2005).
V-3524. Norton, T.T. Animal Models of Myopia: Learning How Vision Controls the
Size of the Eye. ILAR 40, 59-77 (1999).
25. Gao, Q.Y., Liu, Q., Ma, P., Zhong, X.W., Wu, J.S., Ge, J. Effects of direct
intravitreal dopamine injections on the development of lid-suture induced
myopia in rabbits. Graefes Archive For Clinical And Experimental Ophthalmology
244, 1329-1335 (2006).
26. Howlett, M.H.C., McFadden, S.A. Emmetropization and schematic eye models
in developing pigmented guinea pigs. Vision Research 47, 1178-1190 (2007).
27. Zhou, X.T., Qu, J., Xie, R.Z., Wang, R.Q., Jiang, L.Q., Zhao, H.L., Wen, J.Q.,
Lu, F. Normal development of refractive state and ocular dimensions in guinea
pigs. Vision Research 46, 2815-2823 (2006).
28. Lu, F., Zhou, X.T., Zhao, H.L., Wang, R.Q., Jia, D., Jiang, L.Q., Xie, R.Z., Qu,
J. Axial myopia induced by a monocularly-deprived facemask in guinea pigs: A
non-invasive and effective model. Experimental Eye Research 82, 628-636 (2006).
29. Howlett, M.H.C., McFadden, S.A. Form-deprivation myopia in the guinea pig
(Cavia porcellus). Vision Research 46, 267-283 (2006).
30. McFadden, S.A., Howlett, M.H.C., Mertz, J.R. Retinoic acid signals the
direction of ocular elongation in the guinea pig eye. Vision Research 44, 643-653
(2004).
31. McFadden, S.A. Partial occlusion produces local form deprivation myopia in
the guinea pig eye. Investigative Ophthalmology & Visual Science 43, U34 (2002).
32. Lodge, A., Peto, T., McFadden, S.A. Form deprivation myopia and
emmetropization in the guinea pig. Proceedings of the Australian Neuroscience Society
5, 123 (1994).
V-3633. Georgopoulos, M., Vass, C., El Menyawi, I., Radda, S., Graninger, W.,
Menapace, R. In vitro diffusion of mitomycin-C into human sclera after
episcleral application: Impact of diffusion time. Experimental Eye Research 71,
453-457 (2000).
34. Vass, C., Georgopoulos, M., El Menyawi, I., Radda, S., Nimmerrichter, P.
Intrascleral concentration vs depth profile of mitomycin-C after episcleral
application: Impact of applied concentration and volume of mitomycin-C
solution. Experimental Eye Research 70, 571-575 (2000).
35. Vass, C., Georgopoulos, M., El Menyawi, I., Radda, S., Nimmerrichter, P.,
Menapace, R. Intrascleral concentration vs depth profile of mitomycin-C after
episcleral application: Impact of irrigation. Experimental Eye Research 70, 139-
143 (2000).
36. Vass, C., Georgopoulos, M., El Menyawi, I., Radda, S., Nimmerrichter, P.
Impact of Mitomycin-C application time on the scleral Mitomycin-C
concentration. Journal of Ocular Pharmacology and Therapeutics 17, 101-105 (2001).
37. Cruise, G.M., Hegre, O.D., Scharp, D.S., Hubbell, J.A. A sensitivity study of
the key parameters in the interfacial photopolymerization of poly(ethylene
glycol) diacrylate upon porcine islets. Biotechnology and Bioengineering 57, 655-665
(1998).
VI-1C h a p t e r 6
TREATMENT OF KERATOCONUS
6.1 Introduction ....................................................................................... VI-1 6.2 Materials and Methods ...................................................................... VI-3 6.2.1 Penetration of Molecules—Epithelial Barrier...............................VI-3 6.2.2 In Vitro Application and In Vitro Expansion .................................VI-6 6.3 Results................................................................................................ VI-9 6.3.1 Penetration of Molecules—Epithelial Barrier...............................VI-9 6.3.2 In Vitro Application and In Vitro Expansion ...............................VI-10 6.4 Summary.......................................................................................... VI-14 Bibliography .......................................................................................... VI-16
This work has been done with Joyce Huynh, Heejae Kim, and Muzhou Wang. Graduate
student Joyce Huynh assisted with in vitro expansion experiments, and undergraduates
Heejae and Muzhou assisted with penetration studies.
6.1 Introduction
Keratoconus is a disorder that results in corneal thinning and is named for the conical shape
that the cornea develops.1-3 The progressive distortion of corneal shape usually becomes
noticeable in early adulthood, causing increasingly severe astigmatism, myopia, and
higher-order aberrations that become difficult to correct by spectacles or contact lenses. A
number of different therapies have been tested in keratoconus as alternatives to contact
lenses. These include, thermokeratoplasty4, epikeratophakia5, and intracorneal ring
segments (Intacs).6, 7 These treatments do not appear to stop progression of the disease;
rather, they are alternatives to manage the refractive abnormalities induced by irregular
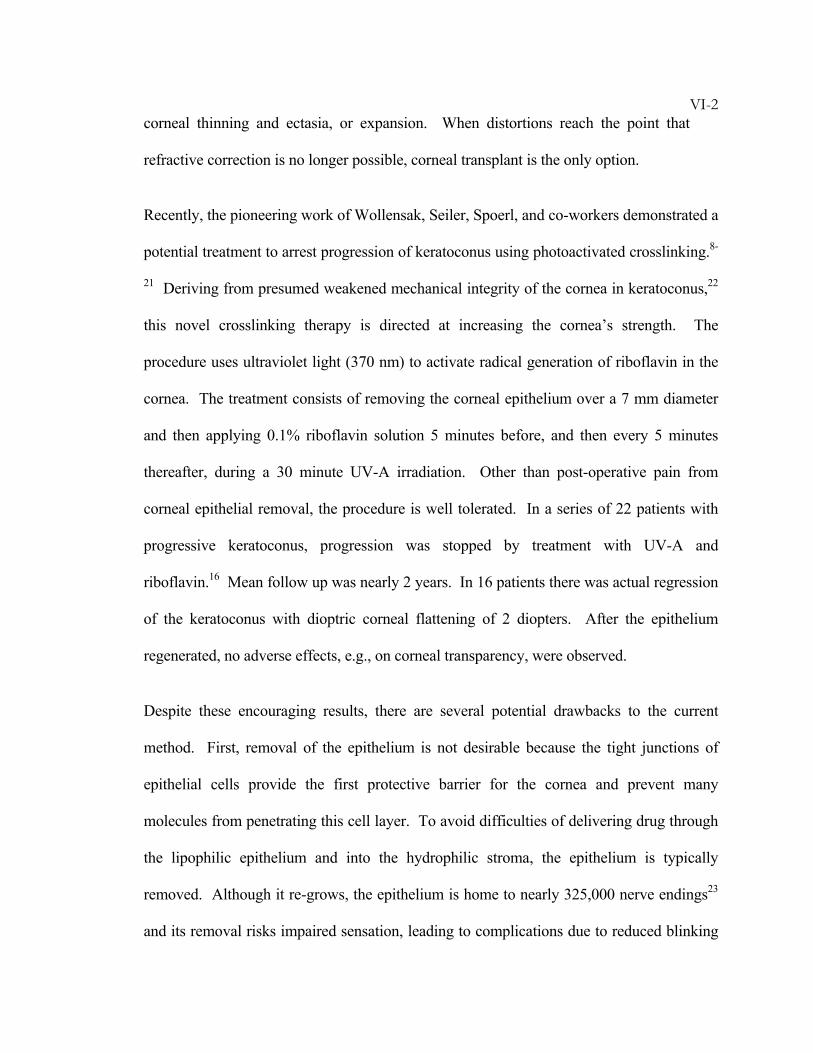
VI-2corneal thinning and ectasia, or expansion. When distortions reach the point that
refractive correction is no longer possible, corneal transplant is the only option.
Recently, the pioneering work of Wollensak, Seiler, Spoerl, and co-workers demonstrated a
potential treatment to arrest progression of keratoconus using photoactivated crosslinking.8-
21 Deriving from presumed weakened mechanical integrity of the cornea in keratoconus,22
this novel crosslinking therapy is directed at increasing the cornea’s strength. The
procedure uses ultraviolet light (370 nm) to activate radical generation of riboflavin in the
cornea. The treatment consists of removing the corneal epithelium over a 7 mm diameter
and then applying 0.1% riboflavin solution 5 minutes before, and then every 5 minutes
thereafter, during a 30 minute UV-A irradiation. Other than post-operative pain from
corneal epithelial removal, the procedure is well tolerated. In a series of 22 patients with
progressive keratoconus, progression was stopped by treatment with UV-A and
riboflavin.16 Mean follow up was nearly 2 years. In 16 patients there was actual regression
of the keratoconus with dioptric corneal flattening of 2 diopters. After the epithelium
regenerated, no adverse effects, e.g., on corneal transparency, were observed.
Despite these encouraging results, there are several potential drawbacks to the current
method. First, removal of the epithelium is not desirable because the tight junctions of
epithelial cells provide the first protective barrier for the cornea and prevent many
molecules from penetrating this cell layer. To avoid difficulties of delivering drug through
the lipophilic epithelium and into the hydrophilic stroma, the epithelium is typically
removed. Although it re-grows, the epithelium is home to nearly 325,000 nerve endings23
and its removal risks impaired sensation, leading to complications due to reduced blinking
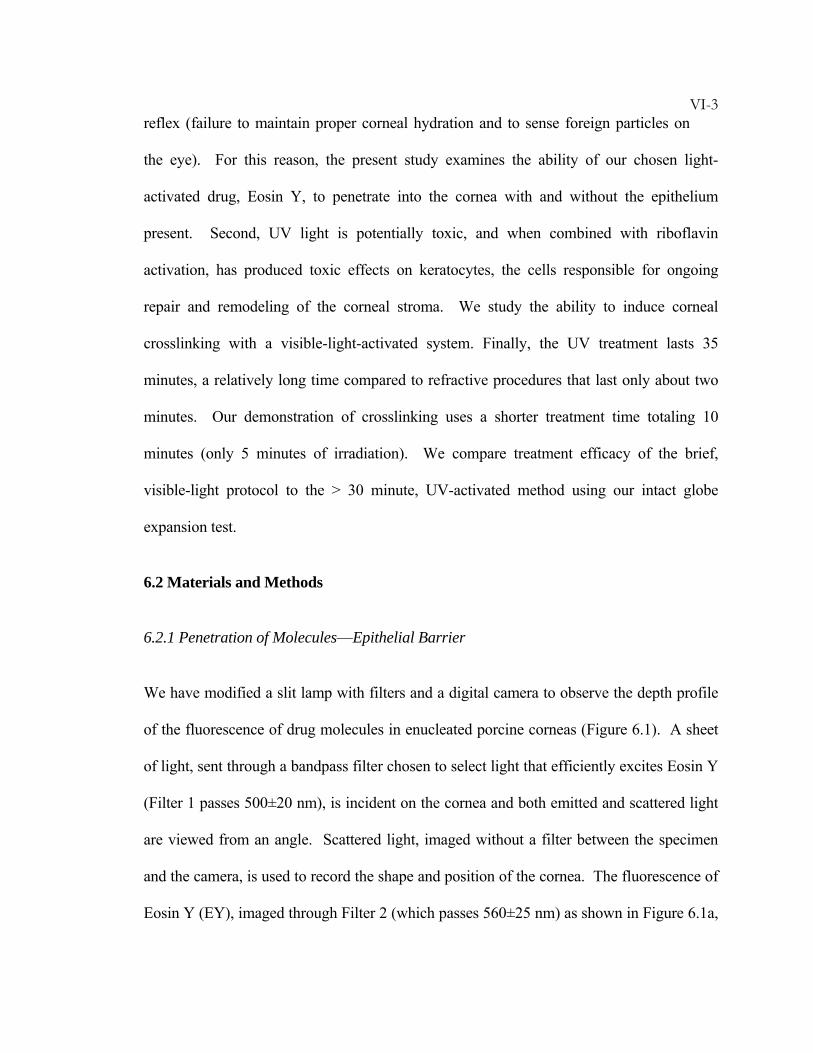
VI-3reflex (failure to maintain proper corneal hydration and to sense foreign particles on
the eye). For this reason, the present study examines the ability of our chosen light-
activated drug, Eosin Y, to penetrate into the cornea with and without the epithelium
present. Second, UV light is potentially toxic, and when combined with riboflavin
activation, has produced toxic effects on keratocytes, the cells responsible for ongoing
repair and remodeling of the corneal stroma. We study the ability to induce corneal
crosslinking with a visible-light-activated system. Finally, the UV treatment lasts 35
minutes, a relatively long time compared to refractive procedures that last only about two
minutes. Our demonstration of crosslinking uses a shorter treatment time totaling 10
minutes (only 5 minutes of irradiation). We compare treatment efficacy of the brief,
visible-light protocol to the > 30 minute, UV-activated method using our intact globe
expansion test.
6.2 Materials and Methods
6.2.1 Penetration of Molecules—Epithelial Barrier
We have modified a slit lamp with filters and a digital camera to observe the depth profile
of the fluorescence of drug molecules in enucleated porcine corneas (Figure 6.1). A sheet
of light, sent through a bandpass filter chosen to select light that efficiently excites Eosin Y
(Filter 1 passes 500±20 nm), is incident on the cornea and both emitted and scattered light
are viewed from an angle. Scattered light, imaged without a filter between the specimen
and the camera, is used to record the shape and position of the cornea. The fluorescence of
Eosin Y (EY), imaged through Filter 2 (which passes 560±25 nm) as shown in Figure 6.1a,
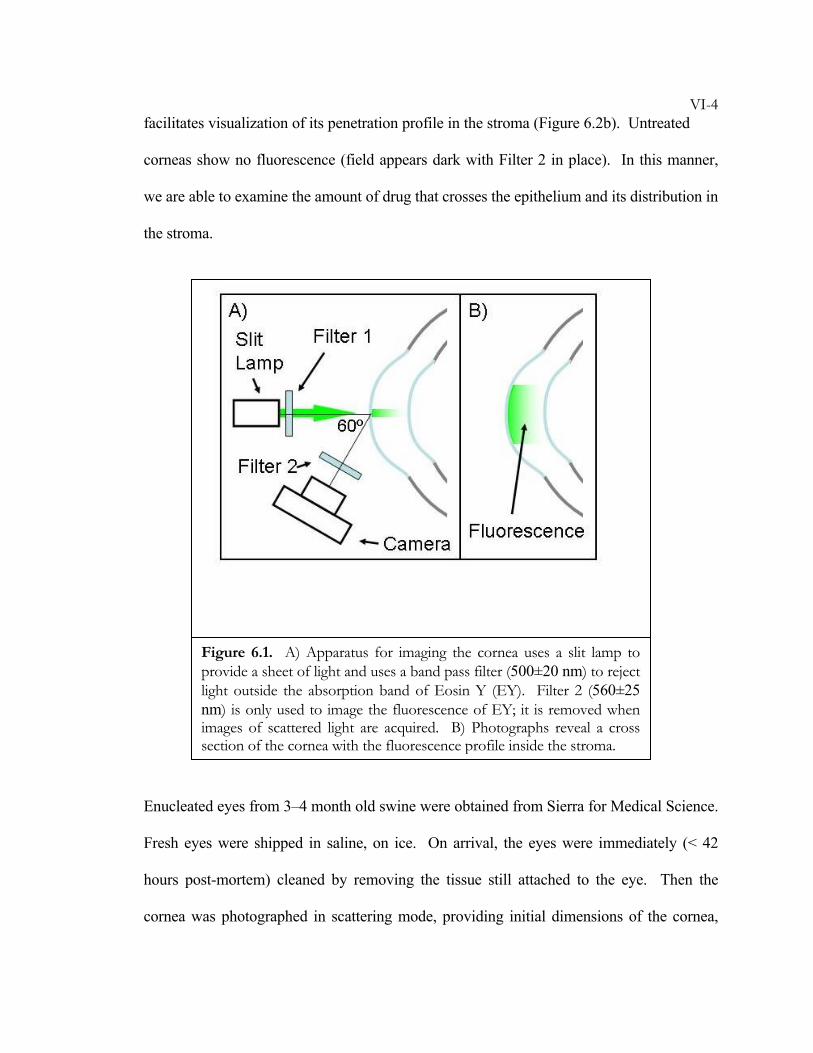
VI-4facilitates visualization of its penetration profile in the stroma (Figure 6.2b). Untreated
corneas show no fluorescence (field appears dark with Filter 2 in place). In this manner,
we are able to examine the amount of drug that crosses the epithelium and its distribution in
the stroma.
Enucleated eyes from 3–4 month old swine were obtained from Sierra for Medical Science.
Fresh eyes were shipped in saline, on ice. On arrival, the eyes were immediately (< 42
hours post-mortem) cleaned by removing the tissue still attached to the eye. Then the
cornea was photographed in scattering mode, providing initial dimensions of the cornea,
Figure 6.1. A) Apparatus for imaging the cornea uses a slit lamp to provide a sheet of light and uses a band pass filter (500±20 nm) to reject light outside the absorption band of Eosin Y (EY). Filter 2 (560±25 nm) is only used to image the fluorescence of EY; it is removed when images of scattered light are acquired. B) Photographs reveal a cross section of the cornea with the fluorescence profile inside the stroma.
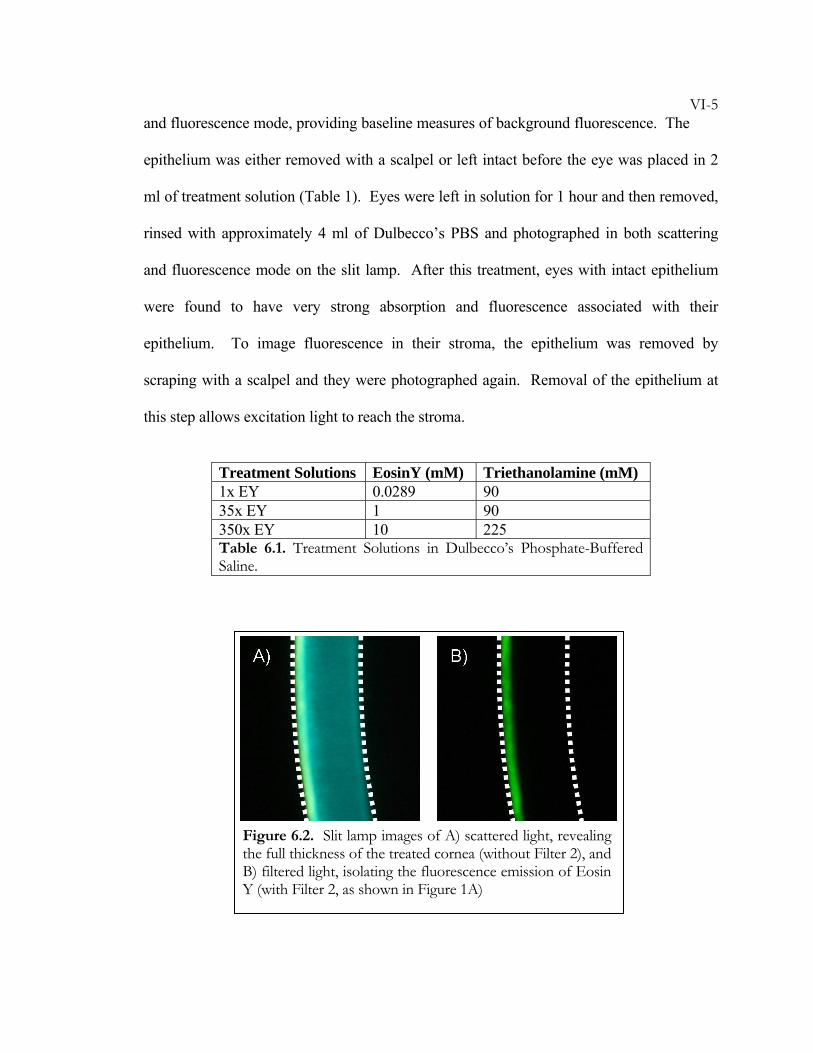
VI-5and fluorescence mode, providing baseline measures of background fluorescence. The
epithelium was either removed with a scalpel or left intact before the eye was placed in 2
ml of treatment solution (Table 1). Eyes were left in solution for 1 hour and then removed,
rinsed with approximately 4 ml of Dulbecco’s PBS and photographed in both scattering
and fluorescence mode on the slit lamp. After this treatment, eyes with intact epithelium
were found to have very strong absorption and fluorescence associated with their
epithelium. To image fluorescence in their stroma, the epithelium was removed by
scraping with a scalpel and they were photographed again. Removal of the epithelium at
this step allows excitation light to reach the stroma.
Treatment Solutions EosinY (mM) Triethanolamine (mM) 1x EY 0.0289 90 35x EY 1 90 350x EY 10 225 Table 6.1. Treatment Solutions in Dulbecco’s Phosphate-Buffered Saline.
Figure 6.2. Slit lamp images of A) scattered light, revealing the full thickness of the treated cornea (without Filter 2), and B) filtered light, isolating the fluorescence emission of Eosin Y (with Filter 2, as shown in Figure 1A)
VI-66.2.2 In Vitro Application and In Vitro Expansion
We use the intact globe method, established in Chapters 2 and 5, to quantitatively compare
treated and control eyes with respect to their resistance to corneal expansion.
Tissue Preparation: Eyes from 2–3 week old New Zealand White Rabbits (provided by
collaborator Dr. Keith Duncan at the University of California at San Francisco) were stored
in saline on ice for use within 48 hours of enucleation. The epithelium was removed by
scraping a scalpel blade across the cornea. Removal was confirmed by visual inspection of
the corneal surface. The extraorbital tissues were removed to expose the sclera and ensure
accurate analysis of the eye shape. The eyes were then put into DPBS until treatment (at
least 30 minutes and not more than 120 minutes).
Materials:
We tested three treatment solutions:
“1x EY”: 0.0289 mM EY with 90 mM TEOA in DPBS,
“10x EY”: 0.289 mM EY with 90 mM TEOA and 2% w/w hyaluronic acid (HA) in DPBS,
and
“R/UVA”: 2.09 mM (0.1% w/w) riboflavin-5′-phosphate sodium salt hydrate and 20% w/w
T-500 Dextran in DPBS.
Respective controls for each group used the treatment vehicle without EY or TEOA (i.e.,
DPBS, 2% HA in DPBS, and 20% T-500 Dextran in DPBS, respectively).
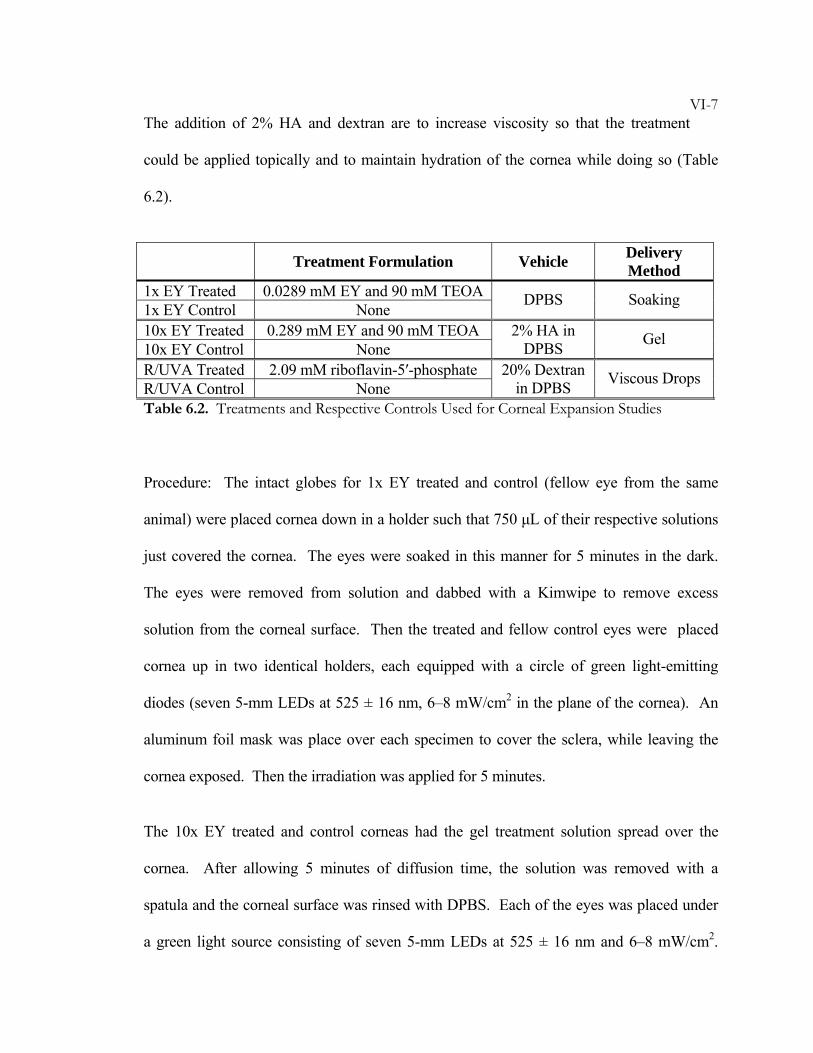
VI-7The addition of 2% HA and dextran are to increase viscosity so that the treatment
could be applied topically and to maintain hydration of the cornea while doing so (Table
6.2).
Treatment Formulation Vehicle Delivery Method
1x EY Treated 0.0289 mM EY and 90 mM TEOA 1x EY Control None DPBS Soaking
10x EY Treated 0.289 mM EY and 90 mM TEOA 10x EY Control None
2% HA in DPBS Gel
R/UVA Treated 2.09 mM riboflavin-5′-phosphate R/UVA Control None
20% Dextran in DPBS Viscous Drops
Table 6.2. Treatments and Respective Controls Used for Corneal Expansion Studies
Procedure: The intact globes for 1x EY treated and control (fellow eye from the same
animal) were placed cornea down in a holder such that 750 μL of their respective solutions
just covered the cornea. The eyes were soaked in this manner for 5 minutes in the dark.
The eyes were removed from solution and dabbed with a Kimwipe to remove excess
solution from the corneal surface. Then the treated and fellow control eyes were placed
cornea up in two identical holders, each equipped with a circle of green light-emitting
diodes (seven 5-mm LEDs at 525 ± 16 nm, 6–8 mW/cm2 in the plane of the cornea). An
aluminum foil mask was place over each specimen to cover the sclera, while leaving the
cornea exposed. Then the irradiation was applied for 5 minutes.
The 10x EY treated and control corneas had the gel treatment solution spread over the
cornea. After allowing 5 minutes of diffusion time, the solution was removed with a
spatula and the corneal surface was rinsed with DPBS. Each of the eyes was placed under
a green light source consisting of seven 5-mm LEDs at 525 ± 16 nm and 6–8 mW/cm2.
VI-8Using the same protocol described above, the corneas of the treated and fellow control
eyes were irradiated simultaneously for 5 minutes while the remainder of the eye was
protected from light exposure using an aluminum foil mask.
The R/UVA treated and control eyes received drops of solution on the cornea for 5 minutes
prior to irradiation, and then received fresh drops every 5 minutes during the 30 minute
irradiation with 3 mW/cm2 of 370±5 nm ultraviolet light for 30 minutes. Both eyes were
irradiated at the same time.
After irradiation, all the eyes were placed in DPBS for 30 minutes. Treated and fellow
control eyes were mounted into an intact globe expansion apparatus with two sites to
ensure that both experienced the same ambient pressure and temperature, and the same
imposed intraocular pressure, as described in Chapter 2. To restore the native shape of the
globes, they received a “prestress” of 22 mmHg for one hour, based on observations that
showed that shape recovery required up to 45 minutes for some specimens. Images were
recorded at 15 minute intervals during the prestress period. Then the imposed intraocular
pressure was increased to 85 mmHg, a first image was required within a few seconds of the
inception of elevated pressure and subsequent images were acquired at 15 minute intervals
for 24 hours.
VI-96.3 Results
6.3.1 Penetration of Molecules—Epithelial Barrier
Fluorescence emission from the stroma of eyes treated with the epithelium present is much
weaker than that observed in specimens that had the epithelium removed prior to treatment
(Figure 6.3): 1x EY penetrates the stroma of eyes with removed epithelium within an hour,
but in eyes with the epithelium intact, 1x EY cannot be detected after 6 hours of soaking.
This observation accords with prior literature indicating that the epithelium inhibits
penetration of compounds closely related to EY (e.g., fluorescein). Nevertheless,
significant penetration of EY across the epithelium is evident in corneas treated with high
concentration solutions (35x EY and 350x EY). These results indicate that EY penetration
through the epithelium is possible. Clinically, it is significant that removal of the
epithelium may not be necessary for treatment.
Note that this method has very low sensitivity relative to, for example, laser scanning
confocal fluorescence microscopy. Due to low sensitivity, soaking for at least 1 hour was
needed to achieve detectable levels of fluorescence for 1x EY even without the epithelium
present (Figure 6.3, left, second row). The next section of this chapter discusses treatments
with 1x EY that successfully stabilize deepithelialized corneas using a 5 minute soaking
time. While slit lamp photography may be used to make qualitative judgments of epithelial
penetration, it cannot be used to quantify changes with the sensitivity required for our
treatments. Future studies with the more sensitive approach of confocal microscopy could
be used to reveal the diffusion rates through the epithelium and within the stroma.
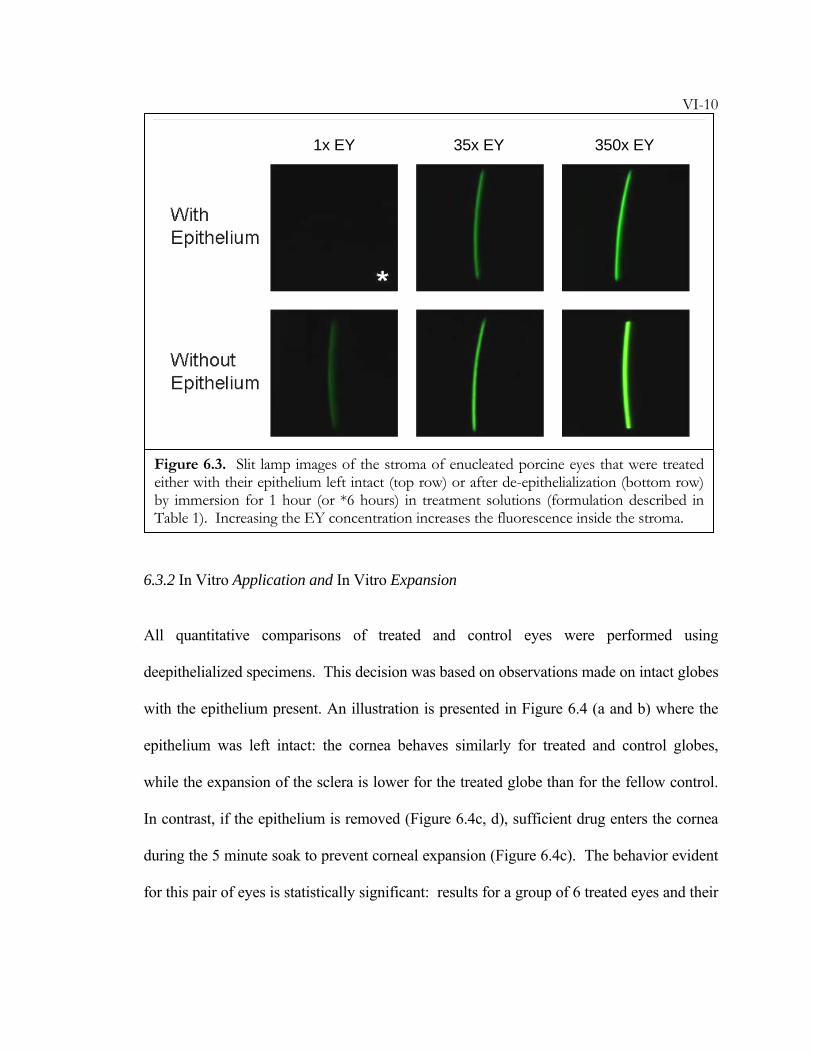
VI-10
6.3.2 In Vitro Application and In Vitro Expansion
All quantitative comparisons of treated and control eyes were performed using
deepithelialized specimens. This decision was based on observations made on intact globes
with the epithelium present. An illustration is presented in Figure 6.4 (a and b) where the
epithelium was left intact: the cornea behaves similarly for treated and control globes,
while the expansion of the sclera is lower for the treated globe than for the fellow control.
In contrast, if the epithelium is removed (Figure 6.4c, d), sufficient drug enters the cornea
during the 5 minute soak to prevent corneal expansion (Figure 6.4c). The behavior evident
for this pair of eyes is statistically significant: results for a group of 6 treated eyes and their
Figure 6.3. Slit lamp images of the stroma of enucleated porcine eyes that were treated either with their epithelium left intact (top row) or after de-epithelialization (bottom row) by immersion for 1 hour (or *6 hours) in treatment solutions (formulation described in Table 1). Increasing the EY concentration increases the fluorescence inside the stroma.
1x EY 35x EY 350x EY
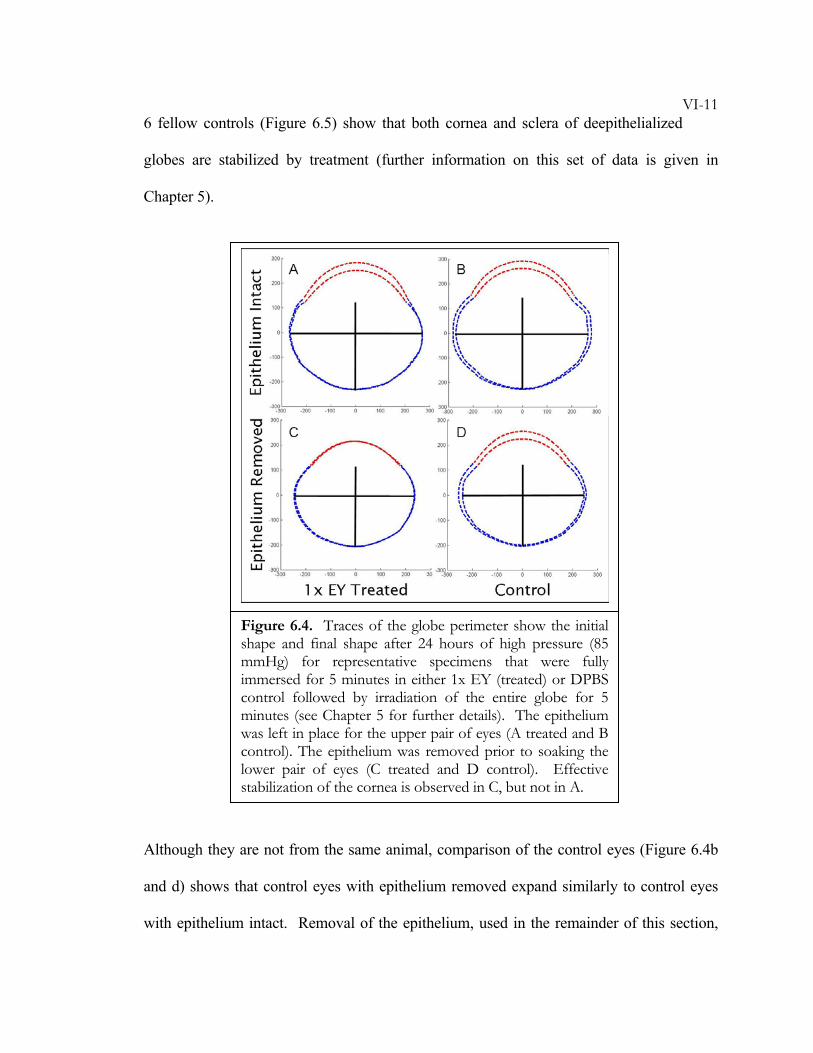
VI-116 fellow controls (Figure 6.5) show that both cornea and sclera of deepithelialized
globes are stabilized by treatment (further information on this set of data is given in
Chapter 5).
Although they are not from the same animal, comparison of the control eyes (Figure 6.4b
and d) shows that control eyes with epithelium removed expand similarly to control eyes
with epithelium intact. Removal of the epithelium, used in the remainder of this section,
Figure 6.4. Traces of the globe perimeter show the initial shape and final shape after 24 hours of high pressure (85 mmHg) for representative specimens that were fully immersed for 5 minutes in either 1x EY (treated) or DPBS control followed by irradiation of the entire globe for 5 minutes (see Chapter 5 for further details). The epithelium was left in place for the upper pair of eyes (A treated and B control). The epithelium was removed prior to soaking the lower pair of eyes (C treated and D control). Effective stabilization of the cornea is observed in C, but not in A.
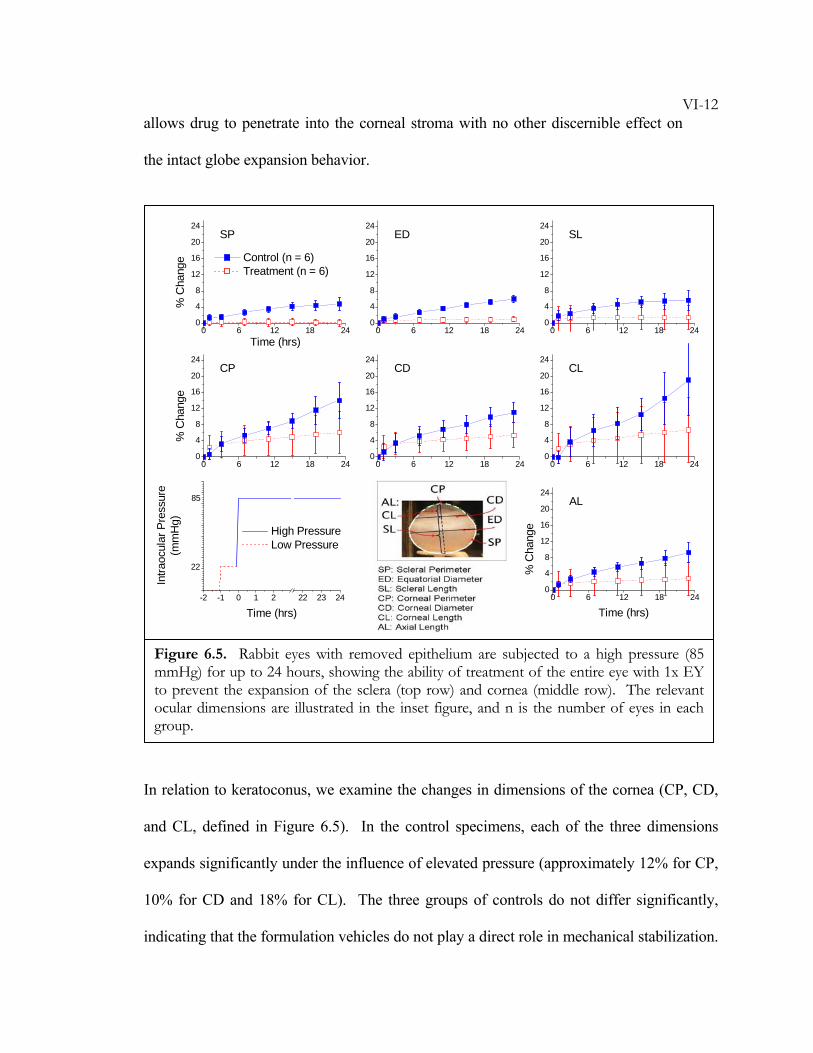
VI-12allows drug to penetrate into the corneal stroma with no other discernible effect on
the intact globe expansion behavior.
In relation to keratoconus, we examine the changes in dimensions of the cornea (CP, CD,
and CL, defined in Figure 6.5). In the control specimens, each of the three dimensions
expands significantly under the influence of elevated pressure (approximately 12% for CP,
10% for CD and 18% for CL). The three groups of controls do not differ significantly,
indicating that the formulation vehicles do not play a direct role in mechanical stabilization.
0 6 12 18 240
4
8
12
16
20
24
0 6 12 18 240
4
8
12
16
20
24
0 6 12 18 240
4
8
12
16
20
24
0 6 12 18 240
4
8
12
16
20
24
0 6 12 18 240
4
8
12
16
20
24
0 6 12 18 240
4
8
12
16
20
24
0 6 12 18 240
4
8
12
16
20
24
Time (hrs)
Control (n = 6) Treatment (n = 6)
SP
% C
hang
e
ED SL
CP
% C
hang
e
CD CL
AL
% C
hang
e
Time (hrs)-2 -1 0 1 2 22 23 24
High Pressure Low Pressure
22
85
Intra
ocul
ar P
ress
ure
(mm
Hg)
Time (hrs)
Figure 6.5. Rabbit eyes with removed epithelium are subjected to a high pressure (85 mmHg) for up to 24 hours, showing the ability of treatment of the entire eye with 1x EY to prevent the expansion of the sclera (top row) and cornea (middle row). The relevant ocular dimensions are illustrated in the inset figure, and n is the number of eyes in each group.
VI-13Soaking the cornea in 1x EY for 5 minutes and irradiating with visible light for 5
minutes reduces expansion of the cornea as compared to DPBS controls (Figure 6.6). In
anticipation of topical application of a viscous solution or gel on the cornea to administer
the drug, a more concentrated solution (10x EY) was made with a “viscoelastic” surgical
aid (2% HA) that creates a gel. It was applied to form a coating on the cornea. This
treatment showed enhanced ability to prevent expansion (Figure 6.6), consistent with the
increased EY concentration. For comparison to the treatment that is currently in FDA
clinical trials for the treatment of keratoconus, we include a protocol that uses the same
parameter values described for that clinical procedure. The treated eyes in the R/UVA
group show similar resistance to expansion as the 10x EY treated group (Table 6.3). The
treatment of the whole eye with GA (Figure 2.26) gives an extreme degree of crosslinking
that is presented here for comparison (Figure 6.6).
Importantly, the intact globe expansion method provides a way to compare treatments for
efficacy. Tests using a few animals (8–10) are able to distinguish treatments and to screen
variations on the procedure to improve the treatment. Further, the results of the R/UVA
treatment provide a benchmark for identifying clinically relevant treatments.
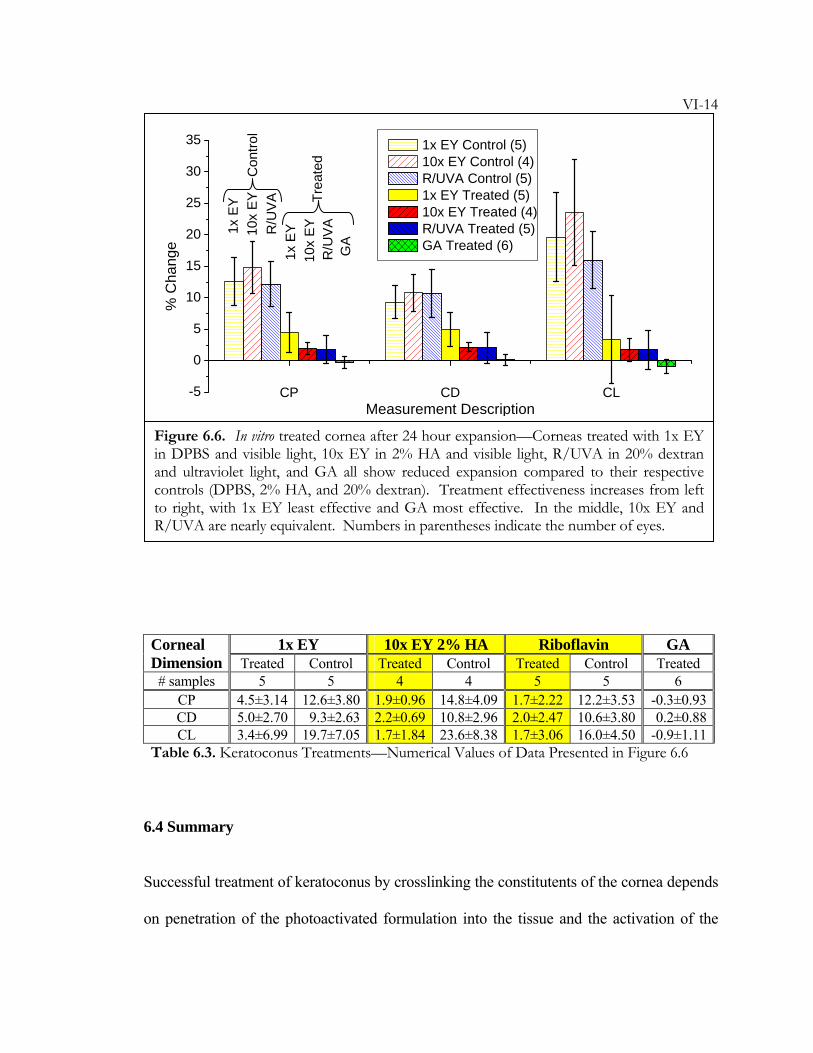
VI-14
1x EY 10x EY 2% HA Riboflavin GA Corneal Dimension Treated Control Treated Control Treated Control Treated
# samples 5 5 4 4 5 5 6 CP 4.5±3.14 12.6±3.80 1.9±0.96 14.8±4.09 1.7±2.22 12.2±3.53 -0.3±0.93CD 5.0±2.70 9.3±2.63 2.2±0.69 10.8±2.96 2.0±2.47 10.6±3.80 0.2±0.88CL 3.4±6.99 19.7±7.05 1.7±1.84 23.6±8.38 1.7±3.06 16.0±4.50 -0.9±1.11
Table 6.3. Keratoconus Treatments—Numerical Values of Data Presented in Figure 6.6
6.4 Summary
Successful treatment of keratoconus by crosslinking the constitutents of the cornea depends
on penetration of the photoactivated formulation into the tissue and the activation of the
CP CD CL-5
0
5
10
15
20
25
30
35
Trea
ted
Con
trol
GA
R/U
VA
1x E
Y10
x EYR
/UV
A10
x EY
1x E
Y
% C
hang
e
Measurement Description
1x EY Control (5) 10x EY Control (4) R/UVA Control (5) 1x EY Treated (5) 10x EY Treated (4) R/UVA Treated (5) GA Treated (6)
Figure 6.6. In vitro treated cornea after 24 hour expansion—Corneas treated with 1x EY in DPBS and visible light, 10x EY in 2% HA and visible light, R/UVA in 20% dextran and ultraviolet light, and GA all show reduced expansion compared to their respective controls (DPBS, 2% HA, and 20% dextran). Treatment effectiveness increases from left to right, with 1x EY least effective and GA most effective. In the middle, 10x EY and R/UVA are nearly equivalent. Numbers in parentheses indicate the number of eyes.
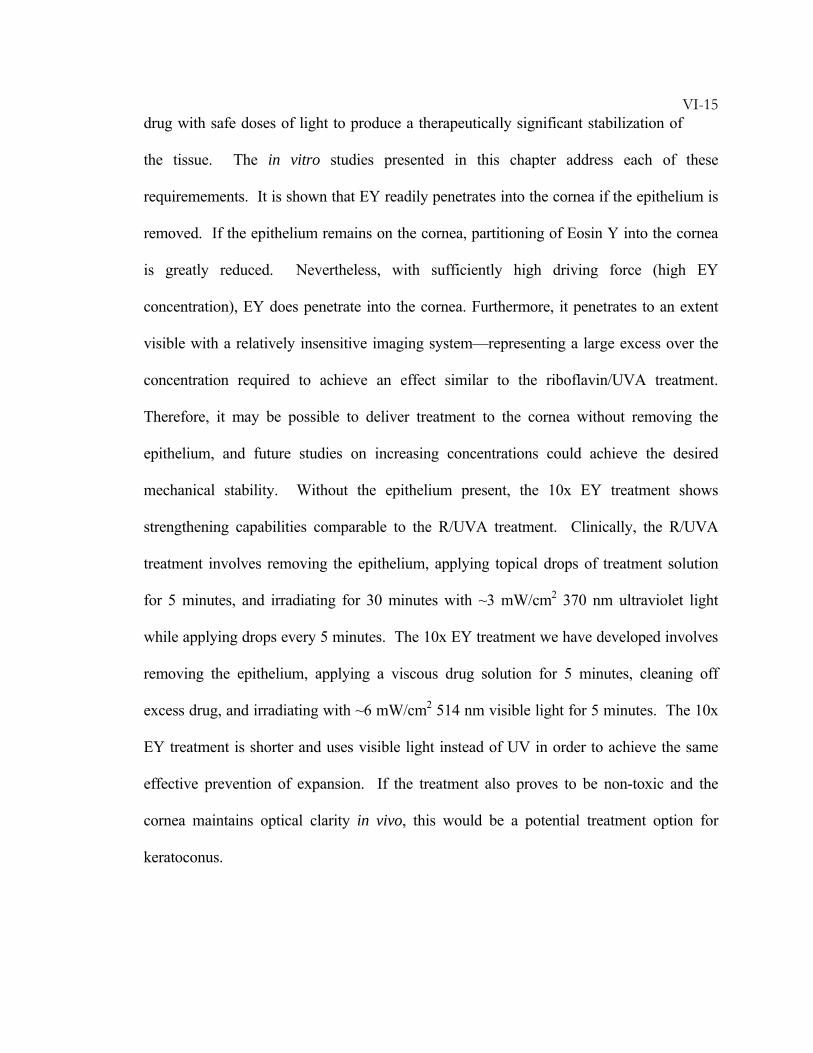
VI-15drug with safe doses of light to produce a therapeutically significant stabilization of
the tissue. The in vitro studies presented in this chapter address each of these
requiremements. It is shown that EY readily penetrates into the cornea if the epithelium is
removed. If the epithelium remains on the cornea, partitioning of Eosin Y into the cornea
is greatly reduced. Nevertheless, with sufficiently high driving force (high EY
concentration), EY does penetrate into the cornea. Furthermore, it penetrates to an extent
visible with a relatively insensitive imaging system—representing a large excess over the
concentration required to achieve an effect similar to the riboflavin/UVA treatment.
Therefore, it may be possible to deliver treatment to the cornea without removing the
epithelium, and future studies on increasing concentrations could achieve the desired
mechanical stability. Without the epithelium present, the 10x EY treatment shows
strengthening capabilities comparable to the R/UVA treatment. Clinically, the R/UVA
treatment involves removing the epithelium, applying topical drops of treatment solution
for 5 minutes, and irradiating for 30 minutes with ~3 mW/cm2 370 nm ultraviolet light
while applying drops every 5 minutes. The 10x EY treatment we have developed involves
removing the epithelium, applying a viscous drug solution for 5 minutes, cleaning off
excess drug, and irradiating with ~6 mW/cm2 514 nm visible light for 5 minutes. The 10x
EY treatment is shorter and uses visible light instead of UV in order to achieve the same
effective prevention of expansion. If the treatment also proves to be non-toxic and the
cornea maintains optical clarity in vivo, this would be a potential treatment option for
keratoconus.
VI-16BIBLIOGRAPHY
1. Bron, A.J. Keratoconus. Cornea 7, 163-169 (1988).
2. Krachmer, J.H., Feder, R.S., Belin, M.W. Keratoconus And Related
Noninflammatory Corneal Thinning Disorders. Survey Of Ophthalmology 28, 293-
322 (1984).
3. Rabinowitz, Y.S. Keratoconus. Survey Of Ophthalmology 42, 297-319 (1998).
4. Kaufman, H.E., Werblin, T.P. Epikeratophakia for the Treatment of
Keratoconus. American Journal of Ophthalmology 93, 342-347 (1982).
5. Spitznas, M., Eckert, J., Frising, M., Eter, N. Long-term functional and
topographic results seven years after epikeratophakia for keratoconus. Graefes
Archive for Clinical and Experimental Ophthalmology 240, 639-643 (2002).
6. Colin, J., Cochener, B., Savary, G., Malet, F. Correcting keratoconus with
intracorneal rings. Journal of Cataract and Refractive Surgery 26, 1117-1122 (2000).
7. Kymionis, G.D., Siganos, C.S., Tsiklis, N.S., Anastasakis, A., Yoo, S.H.,
Pallikaris, A.I., Astyrakakis, N., Pallikaris, I.G. Long-term follow-up of intacs in
keratoconus. American Journal of Ophthalmology 143, 236-244 (2007).
8. Spoerl, E., Wollensak, G., Dittert, D.D., Seiler, T. Thermomechanical behavior
of collagen-cross-linked porcine cornea. Ophthalmologica 218, 136-140 (2004).
9. Sporl, E., Genth, U., Schmalfuss, K., Seiler, T. Thermo-mechanical behavior of
the cornea. Klinische Monatsblatter Fur Augenheilkunde 208, 112-116 (1996).
10. Sporl, E., Genth, U., Schmalfuss, K., Seiler, T. Thermomechanical behavior of
the cornea. German Journal Of Ophthalmology 5, 322-327 (1997).
VI-1711. Spoerl, E., Wollensak, G., Seiler, T. Increased resistance of crosslinked cornea
against enzymatic digestion. Current Eye Research 29, 35-40 (2004).
12. Wollensak, G. Crosslinking treatment of progressive keratoconus: new hope.
Current Opinion In Ophthalmology 17, 356-360 (2006).
13. Wollensak, G., Aurich, H., Pham, D.T., Wirbelauer, C. Hydration behavior of
porcine cornea crosslinked with riboflavin and ultraviolet A. Journal of Cataract
and Refractive Surgery 33, 516-521 (2007).
14. Wollensak, G., Spoerl, E., Reber, F., Seiler, T. Keratocyte cytotoxicity of
riboflavin/UVA-treatment in vitro. Eye 18, 718-722 (2004).
15. Wollensak, G., Spoerl, E., Seiler, T. Stress-strain measurements of human and
porcine corneas after riboflavin-ultraviolet-A-induced cross-linking. Journal Of
Cataract And Refractive Surgery 29, 1780-1785 (2003).
16. Wollensak, G., Spoerl, E., Seiler, T. Riboflavin/ultraviolet-A-induced collagen
crosslinking for the treatment of keratoconus. American Journal Of Ophthalmology
135, 620-627 (2003).
17. Wollensak, G., Spoerl, E., Wilsch, M., Seiler, T. Endothelial cell damage after
riboflavin-ultraviolet-A treatment in the rabbit. Journal Of Cataract And Refractive
Surgery 29, 1786-1790 (2003).
18. Wollensak, G., Spoerl, E., Wilsch, M., Seiler, T. Keratocyte apoptosis after
corneal collagen cross-linking using riboflavin/UVA treatment. Cornea 23, 43-
49 (2004).
19. Wollensak, G., Sporl, E., Reber, F., Pillunat, L., Funk, R. Corneal endothelial
cytotoxicity of riboflavin/UVA treatment in vitro. Ophthalmic Research 35, 324-
328 (2003).
VI-1820. Wollensak, G., Sporl, E., Seiler, T. Treatment of keratoconus by collagen cross
linking. Ophthalmologe 100, 44-49 (2003).
21. Wollensak, G., Wilsch, M., Spoerl, E., Seiler, T. Collagen fiber diameter in the
rabbit cornea after collagen crosslinking by riboflavin/UVA. Cornea 23, 503-
507 (2004).
22. Andreassen, T.T., Simonsen, A.H., Oxlund, H. Biomechanical Properties of
Keratoconus and Normal Corneas. Experimental Eye Research 31, 435-441
(1980).
23. Oyster, C.W. The Human Eye: Structure and Function. (Sinauer Associates, Inc.,
Sunderland, Massachusetts, 1999).