Embed Size (px)
Citation preview
International Journal of Business, Humanities and Technology Vol. 2 No. 1; January 2012
192
Understanding Attitudes toward Globalization at the Individual and National Level
Edward M. Feasel
Dean of Faculty and Professor of Economics
Soka University of America
United States of America
Professor Diya Muzumder
Assistant Professor of Economics
Soka University of America
United States of America
Abstract
The paper utilizes surveys from the Pew Research Center to develop an extensive dataset consisting of 53
countries, for the years 2002, 2007 and 2008, with over 80,000 respondents to examine attitudes toward
globalization at the individual and national level. Attitudes vary widely across countries with important determinants at the national level being FDI, trade, net migration and GDP per capita. The first two macro
linkages, FDI and trade, are found to be positively associated with benefits from globalization. Net migration is
found to have a negative association. The results help to explain why the US, with relatively lower FDI and trade
and higher net migration, has the lowest perceived benefits to globalization in the sample. Results also show that wealthier individuals and nations have higher perceived benefits from globalization. There is evidence that less
skilled individuals view greater benefits to globalization compared to skilled workers in very poor countries.
SER Keywords: Globalization, preferences, migration, trade, poverty.
JEL Classification Codes: F, E, G, O, C.
Section 1. Introduction
The buzzword ―globalization‖ conjures up images of protesters at WTO, IMF and World Bank meetings, and is
often associated with domino effects suffered throughout the world from economic meltdowns such as the 1994 Mexican peso crisis, the 1997-98 Asian financial crisis, and the 2008 worldwide financial crisis. However, there
is also evidence of the rising tide of globalization lifting the fortunes of countries around the world, with China
and India perhaps the greatest example of this trend. This paper examines attitudes toward globalization both at the individual and national level and attempts to determine how income and increased ties between countries is
associated with these attitudes across countries.
Following Bhagwati and others, we view globalization as a process of increasing integration and ties between countries in the economic realms of trade, foreign direct investment (FDI), and international movement of
workers, among others.1 In this context, each of these dimensions has both economic and non-economic
influences on public opinion toward globalization. For instance, while trade and FDI potentially bring greater consumer choice, higher product quality and technology, and increased job opportunities, they also include the
presence of multinational corporations often perceived as forces disruptive of local and indigenous cultures.
While international trade theory examines economic factors that shape individual opinion towards globalization,
little has been said about how these opinions are influenced by country level factors. We study how specific experiences with greater integration in the global economy at the country level affect individual attitudes and are
necessary to understand the wide variations that exist in individual attitudes across countries. Finally, we
contribute to the larger debate of how globalization impacts inequality across the world by examining perceptions of the poor as well as those of low-skilled workers in countries with different national income levels.
Using data from the Pew Research Center a large extensive dataset with over 80,000 respondents is created
covering 53 countries over three recent periods at the beginning of the new millennium, 2002, 2007, and 2008. This is the most diverse data set used thus far in the literature. The study uses individual survey responses to
examine individual and national attitudes towards globalization.
1 See Bhagwati (2004), and Kenwood and Lougheed (1999).

© Centre for Promoting Ideas, USA www.ijbhtnet.com
193
It is reasonable to assume that attitudes conveyed in the survey represent a measure of the relative benefits of
globalization to the respondent. At the individual level higher income and greater educational attainment are associated with more favorable attitudes toward globalization. This is consistent with the standard trade theory
model which predicts greater returns to trade for skilled workers. In addition, the study is able to identify
individuals classified as living in poverty based on the World Bank’s recently introduced concept of Base of the
Economic Pyramid. The income results hold in a smaller sample where 40 percent of the respondents across 32 countries live in poverty: their assessment of the benefits from globalization is lower than all other individual
income categories.
At the national level, attitudes toward globalization vary widely across countries. Surprisingly, the US has the
lowest assessment of benefits from globalization across the 53 countries. This is true both for raw averages of
scores and after accounting for individual demographic characteristics. Using national data for FDI, trade and net
migration, the paper investigates how national attitudes are related to increased integration in these three dimensions. FDI and trade have a positive association with the benefits from globalization, while net migration is
viewed negatively. The net migration effect is consistent with results of other studies showing concern over
increased fiscal pressures from immigrants. GDP per capita has positive effects on perceptions of globalization: richer countries view globalization more positively than poorer ones. Thus, the income effect at both the
individual and national levels favors the rich over the poor and is consistent with concerns expressed over the
inequality effects of globalization. However, evidence indicates that low skilled individuals view greater benefits to globalization compared to skilled workers only in very poor countries, much lower than those estimated in
prior studies.
Our results show that individual level data can explain differences in attitudes within a country, but national level
data are necessary to explain partially the distribution of attitudes toward globalization across countries. The US, for example, has relatively lower levels of FDI and trade and higher levels of net migration, all of which have the
effect of making attitudes toward globalization in the US lower compared to other countries. However, the macro
variables only capture about a third of the variation in attitudes across countries. The rest of the paper is organized as follows: Section 2 examines other studies in the literature, Section 3 describes the data and
methodology, Section 4 presents the results, Section 5 considers robustness issues and finally Section 5
concludes.
Section 2. Background
While there has not been a significant amount of research on attitudes toward globalization per se, a large
literature studying the determinants of public preferences towards trade and immigration exists. One set of papers focuses on how perceptions are influenced through trade-induced impacts on the labor market. The Heckscher-
Ohlin-Samuelson (HOS) model states that free trade benefits abundant factors and hurts scarce factors. For
instance, if we assume that skilled and unskilled workers are the two inputs into production, then in skill-abundant countries, we would expect skilled workers to favor trade while the unskilled labors to oppose it. Scheve and
Slaughter (2001a) find results consistent with this prediction using data on voter behavior in the United States.
O’Rourke and Sinnott (2002) and Mayda and Rodrik (2005) also find evidence consistent with the HOS result using cross-national survey data. Mayda et al. (2007) find similar evidence using a multi-level analysis by
incorporating individual variables interacted with two macro variables representing government consumption and
GDP per capita, which are proxies for the generosity of government spending and relative skill abundance,
respectively. However, fears from trade-induced effects on the labor market are but one kind of influence on public opinions.
Other economically induced attitudes arise due to immigration, which raise concerns of sustaining the welfare state. Government consumption in Mayda et al. (2007) is included to capture the impact of spending toward
immigrants in their model. Using data from California and Texas, Hanson et al. (2007) find that most immigrants
are poor and likely to receive public assistance, generating an average fiscal burden equivalent to 2.3% of average native household income.
2 Since trade and immigration are important aspects of globalization, we expect similar
effects to carry over.
2 For other prominent works on this issue, see Hanson, Scheve and Slaughter (2007), Hanson (2005) and Facchini and Mayda
(2006), and Mayda, O’Rourke and Sinnott (2007).

International Journal of Business, Humanities and Technology Vol. 2 No. 1; January 2012
194
Attitudes towards globalization may also stem from non-economic concerns of xenophobia and threats to national
identities and sovereignties, leading to support for protectionist policies. Some in the literature provide evidence for the existence of these non-economic influences on public opinions. For instance, Hainmueller and Hiscox
(2006) find that education mitigates such fears as it plays a broader role in shaping attitudes rather than merely
acting as a vehicle for accumulating skills. He finds that through greater education individuals become aware of rational arguments in favor of trade, and learn to live a more cosmopolitan life, both culturally and ideationally.
These explanations provide alternative mechanisms, other than the traditional income-distribution predictions of
the Stolpher-Samuelson Theorem, through which education acts to shape an individual’s perception.
Our contribution to the literature is two-fold. The prior literature, has mostly examined attitudes toward trade and
immigration. However, economic globalization embraces a larger concept on which much less research exists.
We treat attitudes toward globalization as an important variable in its own right to be examined. These attitudes will no doubt be related to attitudes toward trade and other variables, but we examine these relationships directly.
Moreover, incorporating country specific and personal factors allows us to examine not only individual
perceptions towards globalization but also to explain why these perceptions vary across countries.
Mayda et al. (2007) have used a similar multi-level analysis to examine how protectionist attitudes are influenced
by the size of government and GDP per capita. However, our study differs in important ways. First, we look at
direct effects of GDP per capita, which are not reported in their study. We also use net migration as a more direct measure of the effects of immigration compared to government consumption. Whereas their paper examined trade
attitudes, we add trade and FDI as independent variables that we conjecture will be two additional variables at the
national level affecting perceptions on globalization, which is focus in this paper. Finally our sample including 53 countries for three periods is more representative globally and of the various stages of economic development
than their study which includes 18 countries in 2000.
Studies incorporating individual and macro-level data have recently become popular in the well-being literature.3
In our case, the multilevel analysis allows us to identify sources behind differences in national perceptions toward
globalization which simple macro data combined with averages of individual survey responses across countries
would not capture.
Section 3. Data and Methodology
We draw our data from the Pew Research Center’s Global Attitudes Project that conducts large public opinion
surveys on important issues such as globalization. More specifically, their data includes information at the individual level on over 80,000 respondents from 53 countries representative of the developed as well as the
developing world. Moreover, our large-scale data set allows us to identify a large number of key variables shaping
individual preferences towards globalization. Mayda and Rodrik (2005) are one of the few studies in the literature
that use the World Values Survey (WVS) which is as representative as the Pew survey. Other prominent works in the literature such as those of Scheve and Slaughter (2001a, 2001b) and Mayda, O’Rourke and Sinnott (2007) use
data from the International Social Survey Programme (ISSP) and from the Asia-Europe Survey (ASES). These
surveys include several countries in the world, but most of the countries are drawn from North America and Europe, and some from East and South-East Asia. This excludes major regions of the world such as those of
South Asia, Latin America and Africa that have become important players in the global economy. Thus, by
including countries from these regions our survey data uses a more representative sample than those used in the literature. Moreover, we use data for three years; 2002, 2007 and 2008. This allows us to capture how individual
attitudes of optimism or pessimism reflected toward globalization change with fluctuations of the global
economic climate.
Since our focus is to understand attitudes towards globalization, we use the following as our primary research
question:
Q1: What do you think about the growing trade and business ties between our country and other countries—do you think it is a very bad, somewhat bad, somewhat good, or a very good thing for our
country?
3 See Diener (2000) and Helliwell (2003), Di Tella et al (2001), Frey and Stutzer (2000, 2002), Putnam (2000, 2001). For a
detailed survey see Helliwell (2001).

© Centre for Promoting Ideas, USA www.ijbhtnet.com
195
This question captures a broader, more inclusive notion of globalization, rather than the mere association with the
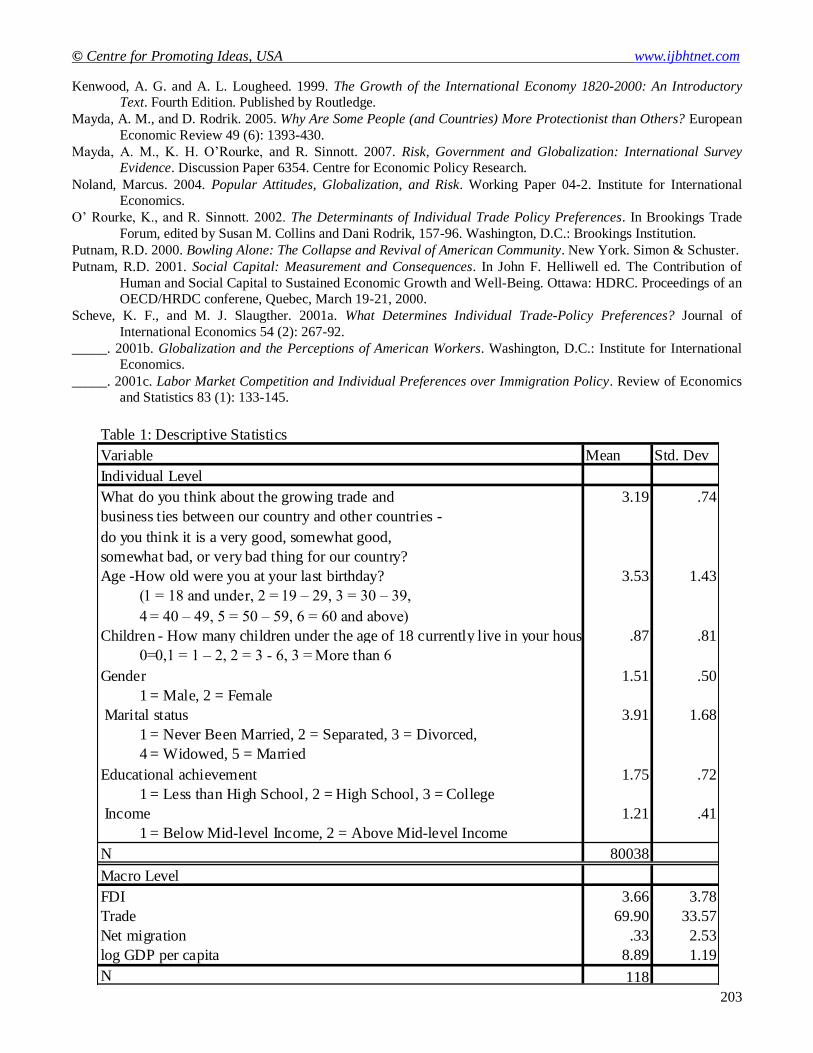
phenomenon of trade, and thus is apt for our purpose. Responses to Q1 are coded on an ordinal scale from 1-4, with an average response approximately of 3.2, as shown in Table 1. The Pew survey has two other questions
related to globalization that could also be used:
Q2: Now thinking about you and your family—do you think the growing trade and business ties between
our country and other countries are very bad, somewhat bad, somewhat good, or very good for you and
your family? Q3: Do you think that globalization is a very bad thing, somewhat bad, somewhat good or a very good
thing?
Q3 asks respondents most directly about their feelings towards globalization. However, both Q2 and Q3 exist
only for certain years in the sample: Q2 only for years 2002 and 2007, while Q3 was asked only in 2002. Thus, to
take advantage of the maximum data, we use the first question as our baseline regression, and then test the
robustness of our results using questions 2 and 3. This also allows us to check for biased responses due to framing effects as discussed in Hiscox (2006).
We use several independent variables at the individual level. Table 1 reports summary statistics for all these variables. Most of these are commonly used in the literature that examine trade-policy preferences. The first
independent variable is age. Mayda, O’Rourke, and Sinnott (2007) model age as a continuous variable, while the
Pew dataset divides age into 6 discrete categories: 18 and under, 19-29, 30-39, 40-49, 50-59, and 60 and above. Similar to Mayda et al. (2007) who find younger respondents have more favorable views toward trade, we expect
younger cohorts to view globalization more favorably than older cohorts. The second variable we incorporate is
number of children, which has the following 4 categories: none, 1-2, 3-6, and more than 6. Gender is also included in the regressions along with marital status, which includes 5 categories; never been married, separated,
divorced, widowed, and married. Two other independent variables are included at the individual level, namely
income, and education. Each of these is treated in greater detail below.
The Pew survey has several advantages. Combining the three separate survey years creates an impressive sample,
which is more recent and globally representative than samples used in other works. However, it also has some
disadvantages. For instance, individual incomes exist only in distinct brackets for each country, and not as a continuous variable. Moreover, income categories are in local currencies and are not consistently comparable
across countries and individuals. This issue is dealt with in two ways. First, we create income categories below
and above mid-level income, which is defined as $20,000 in 2002 international dollars adjusted for purchasing
power parity. This categorization uses the definition created by the World Resources Institute and the World Bank. The report from these institutions highlighted the importance of the mid-market segment of individuals for
worldwide consumption. It also developed the concept of the Base of the Economic Pyramid as a measurement
for poverty (World Resources Institute and International Financial Corporation, 2007) which we use to create a
second measure of income.
The base of the economic pyramid (BOP) is defined as people living with incomes below $3,000 in 2002. This is the lowest income category, and is coded as 1 in our dataset. Three other categories have been created—greater
than BOP and less than $6,000, (twice the BOP) and coded as 2, greater than $6,000 and less than $9,000, (three
times the BOP) and coded as 3, and finally greater than $9,000, which is coded as 4. To create the BOP income
categories, the Pew income categories were first transformed to PPP international dollars using the PPP conversion factor from the World Development Indicators. An income range in the Pew data set was then
assigned to the appropriate BOP income category based on where the majority of the income in the Pew income
range fell. For example, for the monthly income range 10,001-12,000 CZK for the Czech Republic in 2002, the PPP conversion factor of 15.528 was used to convert the Pew income range to the annual income range of $7729-
$9274 PPP international dollars. This income range was then assigned to the third BOP income category,
between $6000-$9000 PPP international dollars.4 Another problem with the data is that many of the high-income
countries are missing a primary education category. Hence, we treat this issue in two ways.
4 The US Consumer Price Index was used to calculate BOP income categories in 2007 and 2008 following the work of the
World Resources Institute and World Bank publication.
International Journal of Business, Humanities and Technology Vol. 2 No. 1; January 2012
196
First we include three educational attainment categories in the regression to take advantage of the entire data set:
less than high school, high school and above high school. As an alternative test of the effect of education on public attitudes towards globalization we add the primary education category. Thus, we recode the education
variable by adding in the following two categories: less than primary and primary. However, this loses all of the
developed countries, leaving only 32 middle and low-income countries in the data set, dropping the total number
of observations to just over 50,000. Several studies in the literature have suggested that education plays a large role in individuals’ assessment of trade and in shaping attitudes toward global issues.
5 However, some of the
recent findings with regard to the effects of education on trade preferences have been conflicting. Mayda et al.
(2007) find that the educated respondents in sufficiently poor countries are anti-trade, while those in sufficiently rich countries are liberal in their attitudes towards trade. On the contrary, Scheve and Slaughter (2001a) and
Hainmueller and Hiscox (2006) find that education has a largely positive impact on individual attitudes towards
globalization. Since Hainmueller and Hiscox use a data set only for the United States, they might be picking up only part of the results reported in Mayda et al. This is also true of Scheve and Slaughter (2001a). We will
examine this issue in greater detail later in the paper.
Macro level influences on attitudes toward globalization are captured through the following variables: FDI, trade, net migration and real GDP per capita. Data on net immigration was obtained from CIA, The World Factbook,
while all other macro data was retrieved from world development indicators (WDI). FDI and trade are expressed
as percentages of GDP, net migration is migrants/1000 population, and the log of GDP per capita is used in the regressions. O’Rourke and Sinnott (2001), Mayda and Rodrik (2005) and Mayda et al. (2007) all include GDP
per capita in their analysis. All view GDP per capita as a proxy for measuring relative skill abundance in a
country. To examine the potential existence of a Stolper-Samuelson effect, where unskilled workers benefit from
trade more than skilled workers in poor countries, GDP per capita is interacted with education levels. Only O’Rourke and Sinnott (2001) include GDP per capita as a separate independent variable.
6 There has been great
attention in the popular press over the potential increase in inequality resulting from globalization. This view has
been expressed as a greater divergence of rewards across both nations and individuals of different income levels. We start by examining how national income affects perceptions of globalization. If it is a proxy of skill
abundance, we would expect GDP per capita to have a positive effect on perceptions of globalization. Following
others, we then examine the interaction of education with GDP per capita to see if a Stolper-Samuelson effect exists with regard to skill level and perceived benefits to globalization.
We expect net immigration to have a negative impact on public perceptions of globalization due to the threat to
domestic jobs and a drain on public resources, in addition to being perceived as a threat to local cultures and ethical systems. On the other hand, we expect trade and FDI to have positive impacts since they not only present
better economic opportunities, but also allow for diverse cultural and economic experiences. There has been
relatively less work done on attitudes toward FDI across countries.7 While there have been negative sentiments
expressed about the influence of foreign companies and goods in many countries, it is expected the overall effect
of FDI is positive. Year dummies are also included to examine how attitudes fluctuate over time.
We use the ordered logit regression model to estimate the association between individual and macro variables and attitudes toward globalization by means of standard maximum likelihood procedures. This specification assumes
that the error term in the underlying latent relationships is distributed logistically. The unobserved, latent
relationship for individual utility gained from globalization is specified as follows:
𝑌𝑖𝑗𝑡∗ = 𝛼𝑡 + 𝜆𝑗 + 𝛽𝑖𝑗𝑡 𝑋1,𝑖𝑗𝑡 + 𝛶𝑗𝑡𝑋2,𝑗𝑡 + µ
𝑖𝑗𝑡 (1)
where 𝑌𝑖𝑗𝑡∗ is the utility from globalization, 𝛼𝑡 is the year dummy, where t = 2002, 2007 and 2008, 𝜆𝑗 are the
country dummies, 𝑋1,𝑖𝑗𝑡 are the set of individual regressors for individual i in country j and time t, 𝑋2,𝑗𝑡 are the set
of macro level variables for country j in year t, and µ𝑖𝑗𝑡
is the error term.
5 See, for example, Erikson, Luttbeg, and Tedin 1991, Gleason and van Scyoc 1995, and Hainmueller and Hiscox 2006. 6 Mayda and Rodrik (2005) do state that they exclude GDP per capita since country dummies will capture the effect. We
include GDP per capita to allow for a separate effect from other factors at the national level. 7 See Faeth (2009), Noland (2004), and Brooks and Hil (2004) for views on attitudes and determinants of FDI across countries. Noland (2004) uses country averages to responses in questions from the Pew datasets as potential explanatory
variables.

© Centre for Promoting Ideas, USA www.ijbhtnet.com
197
The manifest response to Q1, 𝑌𝑖𝑗𝑡 , an ordered 4 scale response, is assumed to result from a range of the
continuous unobservable variable, 𝑌𝑖𝑗𝑡∗ :
𝑌𝑖𝑗𝑡 = 1 𝑖𝑓 𝑌𝑖𝑗𝑡∗ ≤ 0
𝑌𝑖𝑗𝑡 = 2 𝑖𝑓 0 < 𝑌𝑖𝑗𝑡∗ ≤ 𝜋1
𝑌𝑖𝑗𝑡 = 3 𝑖𝑓 𝜋1 < 𝑌𝑖𝑗𝑡∗ ≤ 𝜋2
𝑌𝑖𝑗𝑡 = 4 𝑖𝑓 𝜋2 < 𝑌𝑖𝑗𝑡∗
The c.d.f. of µ𝑖𝑗𝑡
is 𝐹 µ𝑖𝑗𝑡 =
𝑒µ𝑖𝑗𝑡
1+𝑒µ𝑖𝑗𝑡 . The next section will present coefficient estimates for the ordered logit
regression. A significant, positive estimate indicates that when cumulating over higher values of the independent
variable, a greater fraction of respondents would move into the largest response category and a smaller fraction
would lie in the lowest category.8
Section 4. Results
We now turn to estimation results. Column 1 of Table 2 presents results for the regression using the main question stated as Q1 in Section 3. The table shows estimates for the ordered logit regression, including personal
characteristics of the respondents and year and country indicator variables. The sample includes 80,038
individuals for the period 2002, 2007 and 2008, across 53 countries. Estimates that are statistically significant at the 5 percent level are highlighted in bold.
For age, the estimates are relative to the omitted category of 60 years and above. The point estimates show that
younger respondents view increasing business ties between countries more positively relative to older respondents. This result is consistent with findings in the literature on trade. Since we divide age into 6 different
categories, we find that preferences become increasingly more favorable as the cohorts get younger. The number
of children in the household and marital status appears not to play a role in individual attitudes towards globalization. Results show clearly that higher levels of educational attainment indicate a more favorable opinion
of globalization. These results confirm those of Scheve and Slaughter (2001a) and Hainmueller and Hiscox
(2006).
Higher incomes are also strongly associated with significantly higher responses toward globalization. Individual
income is not included in several previous studies. One reason is that the survey data often does not ask for the
information. Mayda and Rodrik (2005) do include individual income and similarly find a positive significant effect on perceptions toward trade. The authors find a very robust impact, but state ―we are not aware of any
simple economic theory that would explain this finding, and we leave the development of such a theory to further
research.‖The result clearly shows that individuals with higher income perceive greater benefits from
globalization relative to the poor, something Mayda and Rodrik (2005) acknowledge for their findings in terms of trade.
9 The estimates for the year dummies suggest that in each successive period, the attitudes towards
globalization have declined relative to previous periods: the dummy variable for 2008 is excluded and the 2002
estimate is positive and larger than the 2007 estimate. The start of the worldwide financial crisis which began in the US in 2008 is the likely reason for this finding. Column 2 of Table 2 excludes number of children and marital
status from the regression and results are largely unchanged, but with a larger sample of 82,560.
Table 2a provides the estimates for all country dummy variables that are included in the regression from column2
in Table 2. The estimates are all relative to the excluded country, the United States. All of the estimates are
statistically significant at the 5 percent level. Somewhat more surprisingly, all the estimates are greater than zero, indicating that attitudes towards globalization are more positive in all 52 countries than in the United States. It is
striking that the country that is perhaps most synonymous with the image of globalization would have the least
favorable view toward globalization.
8 The effect on the middle two response categories is ambiguous in this case and requires estimates of the marginal effects,
which are not included in favor of conciseness. As such, significant coefficients are interpreted as unambiguously affecting
the fraction of respondents in the highest and lowest response categories. Marginal effects are available from the authors
upon request. 9 Scheve and Slaugther 2001a also find that higher occupation wages reduce the likelihood of supporting trade restrictions,
but they use occupational wage alternatively with education as a proxy for skill.

International Journal of Business, Humanities and Technology Vol. 2 No. 1; January 2012
198
Of course, this current era of globalization has included a recent attack on US soil in 2001, several financial
downturns and quarters of negative economic growth in both 2001 and 2008. Table 2a also includes the raw averages for responses across countries to the question examined. The United States has one of the lowest
average responses, basically equal to Argentina, Jordan, and Egypt. The correlation between the country
parameter estimates and the raw averages is 0.98. This suggests that the individual characteristics included in
Table 2 do not account for much of the variation in responses across countries, although it does result in the US being the absolute lowest in the sample.
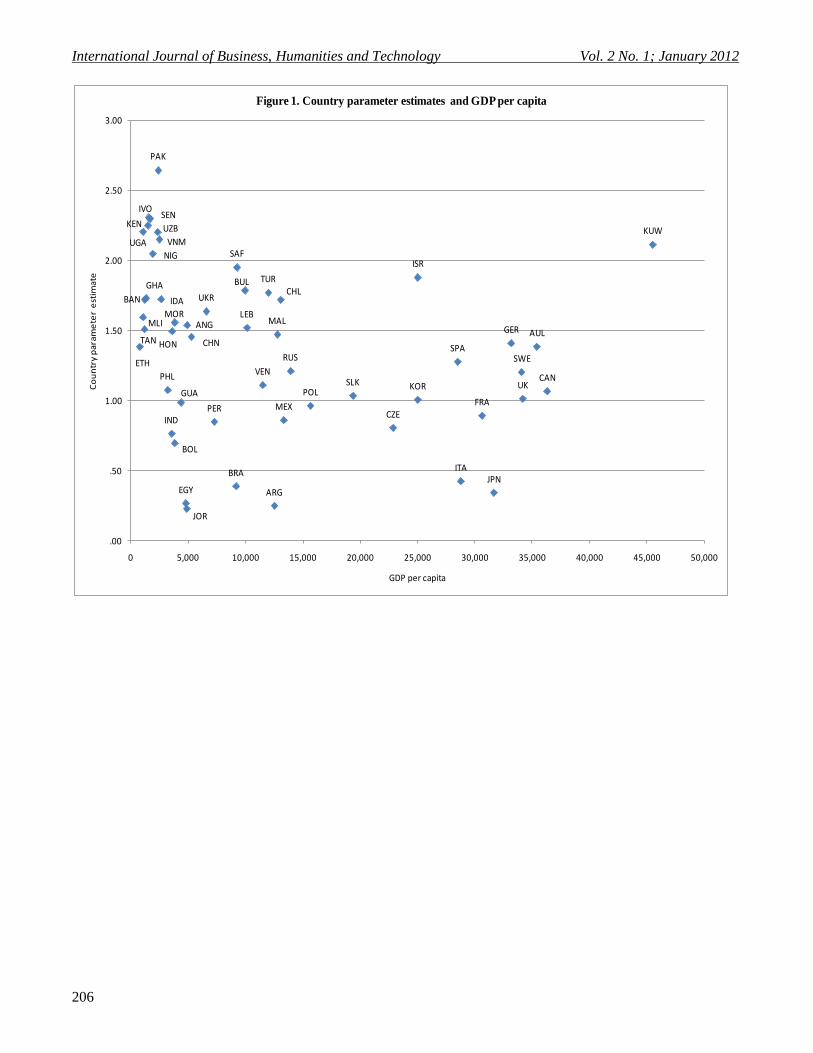
Figure 1 plots the estimates for the country dummies against real GDP per capita in 2005 for the 52 countries. We see that wealthier countries cluster in the mid to low range of responses, South American countries in the lowest
ranges, and the least developed countries, often from the African continent, in the mid to high level ranges.
Overall, there appears to be a slight negative relationship between GDP per capita and attitudes toward
globalization across countries based on visual inspection. This would suggest that income at the national level, beyond individual income as measured by the two income categories discussed in Section 3, has a negative effect
on public perception of globalization. Adding macroeconomic variables to the regression will allow us to examine
this relationship more formally.
Column 1 of Table 3 presents results for the regression adding four macroeconomic variables; namely FDI, trade,
net migration, as well as real GDP per capita. The total number of respondents is still 82,560. Results for the individual level characteristics are largely unchanged, including those for education and individual income. The
parameter estimates for FDI, trade, and net migration are all statistically significant and of the signs consistent
with prior expectations: increased FDI and trade are positively associated with perceptions of globalization while
net migration has a negative association. The increased ties between countries in the dimensions of trade in goods and flow of capital (as measured by FDI) are perceived as positives for the country in which respondents reside.
This is supportive of the view that overall, there are perceived significant benefits to trade and financial openness.
However, the flow of people, which has on net been in the direction of poorer countries to wealthier ones, is not viewed positively. The result here suggests that this increased migration has negatively affected attitudes towards
globalization.
With regard to GDP per capita, the effect is positive. If GDP per capita indeed proxies for relative skill
abundance, then the results show that higher income/skill countries perceive greater benefits from globalization than poorer countries. Together with the results for individual income, the picture emerges that globalization has
led to increased inequality from the perspective that richer individuals and countries view greater benefits from
globalization compared to poorer ones. Estimates for the year dummies are similar to previous ones, although the
magnitude is slightly larger.
Column 2 of Table 3 more closely examines the effect of education and income on attitudes towards globalization
with more detailed categories for both variables, which reduces the sample of respondents to 52,815 across 32 countries. 21 countries are lost in the sample, mostly the highest income countries. The Czech Republic is now the
country with the highest GDP per capita. The list of countries along with the percentages of respondents
belonging to the various education and income categories across countries is provided in Table 4. The new education and income measures allow us to examine the attitudes toward globalization at the lowest education and
income levels across a large section of mid and low income countries.
The results in column 2 show that the estimates for age and gender are largely unchanged from column 1. All estimates for both education and income are significant and display a pronounced positive gradient: responses
become higher as one moves from the less educated, lower income respondents to the more educated, higher
income individuals. For education, college graduates is the excluded category and the estimates for high school, primary and less than primary are all negative and larger in magnitude moving down the scale. Similarly for
income, income in category 4 (greater than three times BOP) is the excluded category.
The estimates for the income categories are all negative and larger in size as income level decreases. Those in poverty, as defined by the Base of the Economic Pyramid, show the least perceived benefit from globalization:
that is, the impoverished in middle and low income countries have the most negative views of globalization.
Across countries, those with the lowest income and education levels have a more pessimistic view on the benefits of increased economic integration for their country. This result contradicts findings in Mayda et al. (2007) who
report that educated respondents are anti-trade relative to less educated ones in sufficiently poor countries.
© Centre for Promoting Ideas, USA www.ijbhtnet.com
199
We will examine this issue more precisely through including interaction terms. The macro variables and year
dummies in column 2 are similar to those from column 1 with the exception that the estimate for net migration is more negative and that for GDP per capita more positive. Results in this sample continue to support the view
that globalization has greater perceived benefits to richer individuals and countries and, thus, is consistent with
the perception of increased inequality at all levels.
Column 3 of Table 3 adds interaction terms between the education categories and GDP per capita. This has been
used widely in the trade perceptions literature to capture unequal income distribution effects of trade as predicted
by the Stolper-Samuelson Theorem. Column 3 first uses the original education and income categories with 53 countries in the sample. The results for age, gender and income and all the other macro variables, including GDP
per capita, are largely unchanged. The estimates for education are now all positive. The interaction terms,
however, are all negative. O’Rourke and Sinnott (2001), Mayda and Rodrik (2005), and Mayda et al. (2007) all
find a negative impact from years of education on perceptions of trade benefits and a positive interaction effect for education and GDP per capita. This suggests that for sufficiently poor countries skilled workers will have
negative attitudes toward trade as the Stolper-Samuelson Theorem predicts. The results here potentially support
this finding given the positive estimate on the level of education but negative effect on the interaction of education and GDP per capita.
To find the effect of education on perceptions toward globalization, one must combine the level effect and the interaction effect. For example, a person from Brazil with less than high school education would have an overall
education effect of -.393, which is .976 (the education level parameter estimate) plus -.150 (the interaction
parameter estimate) times 9.12, which is log of the average GDP per capita from Brazil in the sample. The
overall estimate of -.393 suggests individuals with less than high school education perceive lower benefits from globalization compared to those with a college education. For any country with GDP per capita above $670,
individuals with less than high school education will have a negative perception of the benefits from globalization
relative to the excluded category of college education. For those with a high school education the cutoff level of GDP per capita is $757. Only one country has a level of GDP per capita lower than $757, Ethiopia. Thus, only in
Ethiopia will the views on the benefits of globalization be greater for those with a high school education
compared to those with a college education. While the results suggest the possibility of the Stolper-Samuelson
distributional effect being present in terms of perceptions of the benefits to globalization, there is evidence for it in only one country for our full sample.
Column 4 of Table 3 provides results where the expanded education and income categories are now included in the regression with interaction terms. Again, this reduces our sample to 32 countries with 52,815 respondents.
Parameter estimates show the same tendency as those in Column 3: results are similar to previous ones for age,
gender, individual income and the four macro variables, but the education effect is positive and the interaction of
education and GDP per capita is negative. The GDP per capita cutoff points for where college educated individuals perceive the benefits to globalization as less compared to other levels of educational achievement are:
$1024 for less than primary education, $668 for primary education, and $1349 for high school education. The
number of countries that lie below this cutoff is three countries for less than primary education (Ethiopia, Uganda, and Mali), 0 for primary education and 6 for high school education (Ethiopia, Uganda, Mali, Tanzania,
Bangladesh, and Ghana). For example, this suggests that in Ethiopia individuals with less than primary education
and those with high school education view the benefits from globalization more positive relative to those with a college education.
O’Rourke and Sinnott (2001) report the cutoff level of GDP per capita at $11,942 and Mayde et al. (2007) at
$9,500, both much higher than estimates presented here. One reason behind this may be that both previous studies had a continuous variable for education levels and not education categories as the Pew Dataset provides.
More likely, however, is the fact that in O’Rourke and Sinnot (2001), the 1995 dataset employed included only 6
of 24 countries with a GDP per capita with less than $10,000 (Bulgaria, Hungary, Philippines, Poland, Russia, and the Slovak Republic) and in Mayda et al. (2007) the 2000 dataset utilized only had 4 of 18 countries (China,
Indonesia, Thailand and Philippines).
Although Mayda and Rodrik (2005) do not report the cutoff levels for GDP per capita where Stolper-Sumuelson
distributional impacts are present with regard to attitudes toward trade, a close examination of the paper confirm
the sensitivity of the cutoff level to the sample of countries employed.

International Journal of Business, Humanities and Technology Vol. 2 No. 1; January 2012
200
In addition to using the International Social Survey Programme (ISSP) dataset for 1995 which has 23 countries,
the authors also utilize the 1995 World Values Survey (WVS) which has a sample of 43 countries.10
Based on the authors preferred regression results in column 2 of Table 8 with the ISSP dataset, one can calculate the cutoff
level for GDP per capita to be $7,604. In contrast the calculated cutoff for GDP per capita based on results in
column 2 of Table 5 of the paper using the WVS would be $1,302. The education variable in the WVS is similar
to the Pew Dataset in that the education variable is expressed in categories. Mayda and Rodrik (2005) interacted education with GDP per capita treating education as a continuous variable with 9 possible outcomes. This
estimate of $1,302 is more in line with estimates of this paper, although none of the countries in the WVS sample
used by Mayda and Rodrik (2005) would actually have a GDP per capita level below this amount.
Columns 5 and 6 of Table 3 similarly treat the education variables as continuous variables in the regression. Now
the parameter estimate on education is negative and the interaction term is positive, as was the case in previous studies. The estimates for the other variables are similar to previous ones. The calculated cutoff level of GDP per
capita in column 5 is $746 and is $771 for column 6. While the exercise is useful to compare results here with
others, it is of course more appropriate to treat the education variables as categorical variables as in columns 1-4 in Table 3 instead of as continuous. Overall, the results support previous findings in the trade literature of a
Stolper-Samuelson effect where lower skill workers perceive greater benefits to globalization, in this case,
compared to higher skilled workers. However, this only applies to very low income countries, much lower than
previously estimated in the trade literature. For the vast majority of countries there is clear indication that higher skill individuals perceive greater benefits from globalization compared to low skill workers.
The results for the macro variables help us understand why certain countries perceive lower benefits from globalization, such as in the case of the US. Since FDI and trade are positively associated with benefits to
globalization and the US has relatively lower levels of FDI and trade compared to other countries, it will have
lower perceived benefits. In contrast, net migration is negatively associated with benefits from globalization and
the US, who has the 5th
highest net migration rate in the sample, will perceive fewer benefits from globalization due to this effect. Of course, the GDP per capita effect on perceived benefits from globalization would be
positive for the US relative to most countries in the sample, working in the opposite direction. This latter result is
consistent with viewing wealthier countries as generally pro globalization. To give some sense of how much the macro variables account for the variation of perspectives on the benefits of globalization across countries, we
examine the country dummy parameter estimates from Table 2a and those from column 3, Table 3. The
correlation between the country dummy parameter estimates between the two regressions is .67. This suggests that about one-third of the variation across countries is accounted for by FDI, trade, net migration and GDP per
capita. While this helps to explain some fraction of the variation, two-thirds of the variation is due to other
factors at the national level that are captured by country dummies, which are unknown.
Section 4. Robustness Issues
One concern with the current study may be whether individuals are actually considering the benefits of
globalization when asked the question examined thus far or if they are actually thinking about something narrower in scope. As mentioned before, the primary question we use from the survey does not use the word
globalization even though respondents are asked about the increased business ties between their country and
others. To examine this issue, Table 5 examines results for three alternative survey questions: Column 1 presents results using the globalization question stated as Q3 in Section 3; column 2 uses the phrasing ―increased business
ties‖, but focuses on personal impacts by asking the effect on ―your family‖, Q2 in Section 3; and column 3 uses
the question examined earlier in the paper. The samples for all three regressions are restricted to the year 2002 to
make them directly comparable.11
The estimates for the personal characteristics in this reduced sample including education and income are generally all consistent across questions and with those presented in earlier. The one
exception is the parameter estimate for ―male‖ which is positive and statistically significant in columns 2 and 3, is
not statistically significant in column 1. Table 5 also shows that the results for all 4 macroeconomic variables are also generally consistent across the three questions. Almost all are statistically significant and, as in the previous
case, the parameter estimates for FDI are positive and those for net migration are negative.
10 For the ISSP dataset, Mayda and Rodrik (2005) are able to identify individuals sector of employment and to test also for sector level effects such as comparative advantage. The Pew datasets do not ask respondents for the sector of employment. 11 The samples in all three cases include 43 countries.

© Centre for Promoting Ideas, USA www.ijbhtnet.com
201
Interestingly, the parameter estimate for trade is now negative in all three cases. When the sample is reduced to
only 2002, increased trade is associated with more negative opinions on the benefits of globalization across countries. Of course, 2002 is right after a serious global downturn in 2000 and the effects of September 11, 2001.
Trade, being the most notable measure of economic integration, may be reflecting the negative attitudes towards
globalization held by many individuals at that time due to the significant global events that occurred. GDP per
capita continues to be positively associated with benefits from trade, although the estimate is not significant and is of the wrong sign in column 1. Overall, however, we view the consistency of results across the three regressions
based on different questions as evidence of the robustness of using the questions alternatively as measures of
attitudes towards globalization.
As a final check to robustness, Table 6 presents results using averages of individual responses to the original
globalization question across countries. Ferrer-i-Carbonell and Frijters (2004) point out potential biases that may
be present in the empirical literature on subjective well-being which also utilizes ordered latent response model specifications in empirical estimation. Individual heterogeneity for unobservable personal traits, such as
personality, could lead to substantial bias in estimation. One method to avoid this problem is to simply average
across respondents by country, thus removing the individual heterogeneity that could lead to bias in estimation using individual respondent data.
Column 1 of Table 6 shows the results for the sample which includes 53 countries.12
GDP per capita is the only macroeconomic variable that is statistically significant. Trade has the right sign, but net migration and FDI, while
not significant, both have the opposite signs from the original results presented in Tables 3 and 5. The sign on
GDP per capita is negative, suggesting a negative relationship between response levels and income per capita
across countries. This is consistent with the visual perception examined in Figure 1 between the country dummy variables from the baseline regression plotted against GDP per capita. The year dummies are both positive but
only 2002 is statistically significant.
Column 2 runs the same regression, but includes country fixed effects. In this case, trade is now positive and
statistically significant. FDI and net migration, while not significant, now have the same signs as the original
results. GDP per capita is no longer significant, but the sign is now positive. One interpretation of the results in
Table 6 is that while the results may be indicative in some cases, there is not enough variation or explanatory power in the averaged data to obtain accurate estimates. The sample is reduced to 114 observations from well
over 80 thousand observations and standard errors are simply too large. Moreover, country fixed effects change
results significantly, implying that there exist some commonality of perceptions and publicly held opinions within the residents of a particular country and must be taken into account to avoid omitted variable bias. The national
effect is significant and important in understanding attitudes toward globalization. The benefit of using the
multilevel approach with the ordinal latent response model and individual level data to examine the effects of
macroeconomic variables is that the increased sample size allows for enough variation to obtain more precise estimates of attitudes toward globalization both at the individual and national level.
Section 5. Conclusion
Public perceptions regarding globalization have vacillated over the past few decades and the subject continues to spark heated debates amongst academics and activists. Our paper begins with the premise that attitudes toward
globalization are an important area of examination. These attitudes surely reflect perceptions of the benefits of
globalization. While there is a significant literature focusing on attitudes toward trade and immigration, there has
been little work on attitudes toward the larger encompassing subject of globalization. We use individual and national level data to explain the wide variation in attitudes across countries. In our study, we use trade and
immigration as linkages affecting views on globalization along with FDI and GDP per capita. Multiple surveys
from the Pew Research Center are utilized to develop an impressive dataset covering 53 countries, for the years 2002, 2007 and 2008, with over 80,000 respondents. In addition, our paper contributes to the larger debate of the
effects of globalization on inequality by incorporating the perceptions of the poor and those of low-skilled
workers in countries with diverse income levels. The overall picture that emerges is one where globalization is perceived as leading to increased inequality in the world, both at the individual level and across nations.
Wealthier individuals and nations perceive greater benefits to globalization than their poorer counterparts.
12 The sample includes 43, 47, and 24 countries in 2002, 2007 and 2008, respectively.

International Journal of Business, Humanities and Technology Vol. 2 No. 1; January 2012
202
The paper is able to identify individuals living in poverty in a subset of 32 middle and low income countries and
the results continue to hold with those individuals at the bottom of the income ladder perceiving the least benefits to globalization. There is evidence that the distributional effects are more complicated where less skilled
individuals view greater benefits to globalization compared to skilled workers, as the trade literature has found.
However, this is at very low levels of GDP per capita, somewhere near $1,000, much lower than previous studies on trade attitudes has suggested. The results also help us to understand why attitudes vary across countries. The
US, for example, is found to have lower levels of perceived benefits from globalization compared to all countries
in the sample. The empirical results show that FDI and trade at the national level are positively associated with benefits from globalization, whereas net migration is negatively associated. The fact that the US has relatively
lower FDI and trade levels and higher net migration would then help to explain the lower relative assessment of
benefits from globalization. The macro variables included in the paper, namely FDI, trade, net migration, and
GDP per capita, only account for one-third of the variation of attitudes toward globalization across countries. A future course of research may be to expand this list of macro factors that can account for the variation observed
across countries.
References
Bhagwati, J.. 2004. In Defense of Globalization. Chapter 1, Page 3, Oxford, New York: Oxford University Press.
Bhagwati, J. 1958. Immiserizing Growth: A Geometrical Note. Review of Economic Studies 25: 201-205.
Brooks, D.H., and Hill, H. 2004. Divergent Asian Views on Foreign Direct Investment and Its Governance. Asian
Development Review, 21(1): 1-36.
Daniels, J. P., and M. von der Ruhr. 2005. God and the Global Economy: Religion and Attitudes towards Trade and
Immigration in the United States. Socio-Economic Review 3: 467-89.
Diener, E. 2000. Subjective Well-being: The Science of Happiness and a Proposal for a National Index. American
Psychologist 55(1): 34-43.
Di Tella, R., R. J. MacCulloch, and A. J. Oswald. 2001. Preferences over Inflation and Unemployment: Evidence from
Surveys of Happiness. The American Economic Review 91 (1): 335-341.
Erikson, R.S., N. R. Luttbeg, and K. L. Tedin. 1991. American Public Opinion: Its Origins, Content, and Impact. 4th
ed. New York: Macmillan.
Facchini, G. and A. M. Mayda. 2006. Learning to Love Globalization: Education and Individual Attitudes Towards International Trade. Mimeo.
Faeth, Isabel. 2009. Determinants of Foreign Direct Investment – A Tale of Nine Theoretical Models. Journal of
Economic Surveys. 23(1): 165-196.
Ferrer-i-Carbonell, A. and P. Frijters. 2004. How important is Methodology for the Estimates of the Determinants of Happiness? Economic Journal 114 (497): 641-659.
Freeman, R.. 2003. Trade Wars: The Exaggerated Impact of Trade in Economic Debate. World Economy Annual
Lecture, Blackwell Publishing Ltd. 2004.
Frey, B. S., and A. Stutzer. 2000. Happiness, Economy and Institutions. Economic Journal 111(466): 918-38.
Frey, B. S., and A. Stutzer. 2002. Happiness and Economics. Princeton. Princeton University Press.
Gleason, J., and L. J. Van Scyoc. 1995. A Report on the Economic Literacy of Adults. Journal of Economic Education
26 (3): 203-10.
Hainmueller, J. and M. J. Hiscox. 2006. Learning to Love Globalization: Education and Individual Attitudes Toward
International Trade. International Organization 60, 469-498.
Hanson, G. H. 2005. Why does Immigration Divide America? Public Finance and Political Opposition to Open Borders. Institute for International Economics, Washington D.C.
Hanson, G. H., K.F. Scheve, and M. J. Slaughter. 2007. Public Finance And Individual Preferences Over Globalization
Strategies. Economics and Politics. Blackwell Publishing 19 (1): 1-33.
Helliwell, J. F. 2003. How’s Life? Combining Individual and National Variables to Explain Subjective Well-Being.
Economic Modelling 20: 331–360.
Helliwell, J. F. 2001. Social Capital, the Economic and Well-Being. In Keith Banting, Andrew Sharpe and France St-
Hilaire, eds. The Review of Economic Performance and Social Progress. Montreal and Ottawa: Institute for
Research on Public Policy and Center for the Study of Living Standards.
Hiscox, M. J.. 2006. Through a Glass and Darkly: Attitudes Toward International Trade and the Curious Effects of
Issue Framing. International Organization 60: 755-780.
© Centre for Promoting Ideas, USA www.ijbhtnet.com
203
Kenwood, A. G. and A. L. Lougheed. 1999. The Growth of the International Economy 1820-2000: An Introductory Text. Fourth Edition. Published by Routledge.
Mayda, A. M., and D. Rodrik. 2005. Why Are Some People (and Countries) More Protectionist than Others? European
Economic Review 49 (6): 1393-430.
Mayda, A. M., K. H. O’Rourke, and R. Sinnott. 2007. Risk, Government and Globalization: International Survey
Evidence. Discussion Paper 6354. Centre for Economic Policy Research.
Noland, Marcus. 2004. Popular Attitudes, Globalization, and Risk. Working Paper 04-2. Institute for International
Economics.
O’ Rourke, K., and R. Sinnott. 2002. The Determinants of Individual Trade Policy Preferences. In Brookings Trade
Forum, edited by Susan M. Collins and Dani Rodrik, 157-96. Washington, D.C.: Brookings Institution.
Putnam, R.D. 2000. Bowling Alone: The Collapse and Revival of American Community. New York. Simon & Schuster.
Putnam, R.D. 2001. Social Capital: Measurement and Consequences. In John F. Helliwell ed. The Contribution of
Human and Social Capital to Sustained Economic Growth and Well-Being. Ottawa: HDRC. Proceedings of an
OECD/HRDC conferene, Quebec, March 19-21, 2000.
Scheve, K. F., and M. J. Slaugther. 2001a. What Determines Individual Trade-Policy Preferences? Journal of
International Economics 54 (2): 267-92.
_____. 2001b. Globalization and the Perceptions of American Workers. Washington, D.C.: Institute for International
Economics.
_____. 2001c. Labor Market Competition and Individual Preferences over Immigration Policy. Review of Economics
and Statistics 83 (1): 133-145.
Table 1: Descriptive Statistics
Variable Mean Std. Dev
Individual Level
What do you think about the growing trade and 3.19 .74
business ties between our country and other countries -
do you think it is a very good, somewhat good,
somewhat bad, or very bad thing for our country?
Age -How old were you at your last birthday? 3.53 1.43
(1 = 18 and under, 2 = 19 – 29, 3 = 30 – 39,
4 = 40 – 49, 5 = 50 – 59, 6 = 60 and above)
Children - How many children under the age of 18 currently live in your household? .87 .81
0=0,1 = 1 – 2, 2 = 3 - 6, 3 = More than 6
Gender 1.51 .50
1 = Male, 2 = Female
Marital status 3.91 1.68
1 = Never Been Married, 2 = Separated, 3 = Divorced,
4 = Widowed, 5 = Married
Educational achievement 1.75 .72
1 = Less than High School, 2 = High School, 3 = College
Income 1.21 .41
1 = Below Mid-level Income, 2 = Above Mid-level Income
N 80038
Macro Level
FDI 3.66 3.78
Trade 69.90 33.57
Net migration .33 2.53
log GDP per capita 8.89 1.19
N 118

International Journal of Business, Humanities and Technology Vol. 2 No. 1; January 2012
204
(1) (2)
Age 18 and under .201
(.05)
.2023
(.05)
19 - 29 .142
(.03)
.173
(.03)
30 - 39 .090
(.03)
.107
(.03)
40 - 49 .069
(.03)
.079
(.03)
50 - 59 .057
(.03)
.063
(.03)
Children None .024
(.05)
1-2 .025
(.05)
3-6 .028
(.05)
Gender Male .189
(.01)
.189
(.01)
Marital Status Never been married .034
(.02)
Seperated -.011
(.05)
Divorced -.055
(.04)
Widowed -.053
(.04)
Education Less than high school -.354
(.02)
-.355
(.02)
High School -.239
(.02)
-.236
(.02)
Income Below mid-level -.250
(.03)
-.237
(.03)
Year 2002 .370
(.02)
.350
(.02)
2007 .137
(.02)
.112
(.02)
Country Dummies inlcluded Yes
Yes
(see Table 2a)
Number of countries 53 53
Number of observation 80038 82560
Psuedo R-squared .13 .13
Boldface means significant at the 5 % level.
Category Variable
Table 2. Ordered Logit: Q. What do you think about the growing trade and business ties between
our country and other countries- do you think it is a very good, somewhat good, somewhat bad, or
very bad thing for our country?
Estimate
(standard error)

© Centre for Promoting Ideas, USA www.ijbhtnet.com
205
Angola 1.54 3.34 Lebanon 1.52 3.24
Argentina .25 2.76 Malaysia 1.47 3.25
Australia 1.38 3.23 Mali 1.59 3.30
Bangladesh 1.72 3.34 Mexico .86 3.00
Bolivia .70 2.96 Morocco 1.56 3.16
Brazil .39 2.87 Nigeria 2.05 3.42
Bulgaria 1.79 3.36 Pakistan 2.64 3.59
Canada 1.07 3.19 Peru .85 3.04
Chile 1.72 3.31 Phillippines 1.07 3.17
China 1.45 3.27 Poland .96 3.04
Czech Republic .80 3.06 Russia 1.21 3.15
Egypt .27 2.72 Senegal 2.30 3.53
Ethiopia 1.38 3.21 Slovakia 1.03 3.13
France .89 3.08 South Africa 1.95 3.35
Germany 1.41 3.28 South Korea 1.01 3.19
Ghana 1.73 3.39 Spain 1.28 3.18
Guatemala .99 3.13 Sweden 1.20 3.22
Honduras 1.49 3.33 Tanzania 1.51 3.29
India 1.72 3.33 Turkey 1.77 3.26
Indonesia .76 2.99 Uganda 2.20 3.45
Israel 1.88 3.41 UK 1.01 3.14
Italy .42 2.94 Ukraine 1.64 3.34
Ivory Coast 2.31 3.53 United States 0 2.78
Japan .34 2.91 Uzbekistan 2.20 3.57
Jordan .23 2.77 Venezuela 1.11 3.12
Kenya 2.25 3.51 Vietnam 2.15 3.54
Kuwait 2.11 3.52 Number of
Onservations
82560 82560
Table 2a. Country dummy parameter estimates from regression in Table 2, column (2)
and raw averages of responses by country.
Boldface means parameter estimate is significant at the 5% level.
Country Estimate
Raw
Average Country Estimate
Raw
Average
International Journal of Business, Humanities and Technology Vol. 2 No. 1; January 2012
206
ANG
ARG
AUL
BAN
BOL
BRA
BUL
CAN
CHL
CHN
CZE
EGY
ETH
FRA
GER
GHA
GUA
HON
IDA
IND
ISR
ITA
IVO
JPN
JOR
KENKUW
LEBMALMLI
MEX
MOR
NIG
PAK
PER
PHL
POL
RUS
SEN
SLK
SAF
KOR
SPASWE
TAN
TUR
UGA
UK
UKR
UZB
VEN
VNM
.00
.50
1.00
1.50
2.00
2.50
3.00
0 5,000 10,000 15,000 20,000 25,000 30,000 35,000 40,000 45,000 50,000
Co
un
try
par
ame
ter
est
imat
e
GDP per capita
Figure 1. Country parameter estimates and GDP per capita

© Centre for Promoting Ideas, USA www.ijbhtnet.com
207
(1) (2) (3) (4) (5) (6)
Age 18 and under .228
(.05)
.241
(.06)
.214
(.05)
.231
(.06)
.198
(.05)
.214
(.06)
19 - 29 .180
(.03)
.197
(.03)
.170
(.03)
.189
(.03)
.158
(.03)
.177
(.03)
30 - 39 .111
(.03)
.129
(.03)
.099
(.03)
.121
(.03)
.091
(.03)
.112
(.03)
40 - 49 .086
(.03)
.079
(.03)
.075
(.03)
.071
(.03)
.067
(.03)
.063
(.03)
50 - 59 .066
(.03)
.065
(.04)
.057
(.03)
.059
(.04)
.052
(.03)
.053
(.04)
Gender Male .191
(.01)
.153
(.02)
.193
(.01)
.155
(.02)
.194
(.01)
.154
(.02)
Education (1) Less than high school -.345
(.02)
.976
(.17)
High School -.241
(.02)
.662
(.15)
Education (2) Less than primary school -.234
(.04)
1.22
(.36)
Primary School -.228
(.03)
.787
(.30)
High School -.136
(.03)
.836
(.29)
Education (3) continuous with categories 1-3 -.516
(.08)
Education (4) continuous with categories 1-4 -.339
(.11)
Income (1) Below mid-level -.255
(.03)
-.236
(.03)
-.237
(.03)
Income (2) poverty -.312
(.03)
-.309
(.03)
-.312
(.03)
greater than BOP, less than 2BOP -.230
(.03)
-.221
(.03)
-.225
(.03)
greater than 2BOP, less than 3BOP -.105
(.03)
-.098
(.03)
-.103
(.03)
Education (1)*GDPCAP Less than high school x ln(gdp per cap) -.150
(.02)
High School x ln(gdp per cap) -.100
(.02)
Education (2)*GDPCAP Less than primary school x ln(gdp per cap) -.176
(.04)
Primary School x ln(gdp per cap) -.121
(.04)
High School x ln(gdp per cap) -.116
(.04)
Education (3)(4)*GDPCAP uses Education (3) in column 5
and Education (4) in column 6
.078
(.01)
.051
(.013)
FDI .037
(.004)
.033
(.004)
.037
(.004)
.033
(.004)
.038
(.004)
.033
(.004)
Trade .018
(.001)
.022
(.002)
.017
(.001)
.022
(.002)
.017
(.001)
.022
(.002)
Net Migration -.054
(.015)
-.319
(.034)
-.057
(.015)
-.321
(.034)
-.058
(.015)
-.322
(.034)
GDPCAP log GDP per Capita.246
(.11)
.626
(.15)
.374
(.11)
.707
(.15)
.132
(.11)
.478
(.16)
Year 2002 .723
(.04)
1.01
(.06)
.730
(.04)
1.00
(.06)
.727
(.04)
1.00
(.06)
2007 .176
(.02)
.260
(.03)
.175
(.02)
.260
(.03)
.175
(.02)
.259
(.03)
Country Dummies inlcluded Yes Yes Yes Yes Yes Yes
Number of countries 53 32 53 32 53 32
Number of observation 82560 52815 82560 52815 83560 52815
Psuedo R-squared .13 .14 .13 .14 .13 .14
Boldface means significant at the 5 % level.
Table 3. Ordered Logit: Macro variables and expanded educational
and income categories
Category Variable
Estimate
(standard error)

International Journal of Business, Humanities and Technology Vol. 2 No. 1; January 2012
208
no primary
educ
completed
primary
educ
completed
high school
completed
college
completed
Poverty
(below
BOP) 2BOP 3BOP
Above
3BOP
Angola 17.7% 48.8% 31.3% 2.2% 60.4% 21.1% 11.4% 7.0% 412
Argentina 9.6% 45.6% 40.4% 4.3% 25.1% 26.1% 22.0% 26.8% 1442
Bangladesh 32.6% 40.1% 21.6% 5.7% 82.3% 10.5% 4.0% 3.1% 968
Bolivia 13.6% 28.8% 47.4% 10.2% 30.5% 32.9% 16.5% 20.1% 2108
Brazil 11.1% 37.7% 44.0% 7.3% 25.8% 29.3% 16.3% 28.5% 1647
Bulgaria 8.3% 26.7% 51.1% 13.9% 31.8% 36.0% 18.6% 13.7% 812
Chile 19.5% 34.7% 32.0% 13.9% 19.0% 50.1% 14.7% 16.3% 707
China 1.8% 38.4% 43.4% 16.4% 39.9% 25.5% 21.8% 12.9% 6722
Czech Republic 0.2% 37.1% 44.9% 17.8% 0.2% 5.8% 11.3% 82.7% 900
Ghana 16.1% 44.2% 35.5% 4.1% 6.9% 8.4% 6.9% 77.8% 868
India 3.8% 16.9% 49.7% 29.5% 33.1% 38.6% 16.4% 11.9% 5745
Indonesia 9.2% 35.2% 51.0% 4.6% 69.4% 25.6% 4.3% 0.6% 2854
Ivory Coast 14.8% 52.7% 17.1% 15.4% 45.3% 29.3% 15.1% 10.3% 696
Jordan 34.9% 23.3% 34.9% 7.0% 8.7% 41.3% 19.2% 30.8% 2789
Kenya 15.1% 38.2% 36.4% 10.3% 75.7% 17.4% 4.4% 2.5% 925
Mali 36.1% 23.4% 27.4% 13.0% 56.0% 26.7% 13.6% 3.7% 675
Mexico 18.3% 32.9% 39.5% 9.2% 24.1% 35.9% 22.7% 17.3% 2083
Morocco 53.2% 22.8% 17.3% 6.7% 31.9% 30.6% 17.0% 20.5% 624
Nigeria 12.1% 17.4% 48.2% 22.3% 59.7% 16.2% 13.4% 10.7% 1549
Pakistan 39.8% 21.4% 28.0% 10.7% 51.4% 35.4% 7.3% 5.9% 3260
Peru 8.0% 33.7% 48.7% 9.6% 50.4% 24.9% 10.9% 13.8% 1344
Phillippines 9.2% 28.5% 41.9% 20.4% 44.8% 31.1% 11.8% 12.3% 618
Poland 1.6% 49.6% 38.9% 9.8% 5.2% 21.8% 28.2% 44.9% 1161
Russia 2.4% 30.3% 45.5% 21.7% 32.0% 28.9% 19.2% 19.9% 2572
Senegal 48.4% 35.9% 10.1% 5.5% 51.0% 27.0% 14.0% 8.0% 671
Slovakia 0.0% 29.0% 49.1% 22.0% 2.9% 17.7% 13.8% 65.6% 911
South Africa 13.3% 31.7% 46.0% 9.0% 42.9% 20.1% 7.1% 29.9% 2156
Tanzania 16.1% 58.8% 24.1% 1.1% 86.3% 12.1% 0.2% 1.4% 560
Turkey 9.1% 50.5% 32.0% 8.4% 12.7% 38.5% 24.9% 23.8% 1617
Uganda 35.8% 41.8% 18.1% 4.3% 89.5% 6.7% 1.9% 1.9% 1853
Ukraine 2.2% 16.5% 54.9% 26.4% 31.4% 38.6% 12.4% 17.6% 879
Vietnam 11.5% 55.0% 24.3% 9.2% 57.6% 21.7% 13.4% 7.3% 687
All Observations 14.1% 32.5% 40.0% 13.4% 39.0% 28.0% 14.8% 18.2% 52815
2BOP is greater than BOP, less than or equal to 2xBOP; 3BOP is greater than 2xBOP, less than or equal to 3xBOP;
Table 4. Distribution of respondents by education and income across countries, with expanded categories
Country
Education Categories Income Categories
Total
number
of obs

© Centre for Promoting Ideas, USA www.ijbhtnet.com
209
(1)
Do you think that globalization is
a very good thing, somewhat
good, somewhat bad or a very
bad thing?
(2)
Now thinking about you and your
family - do you th ink the growing
trade and business ties between
our country and other countries
are very good, somewhat good,
somewhat bad, or very bad for
you and your fami ly?
(3)
What do you think about the
growing trade and business ties
between our country and other
countries- do you think it is a very
good, somewhat good, somewhat
bad, or very bad thing for our
country?
Age 18 and under .482
(.08)
.279
(.08)
.230
(.08)
19 - 29 .322
(.05)
.291
(.04)
.196
(.04)
30 - 39 .185
(.05)
.188
(.05)
.118
(.04)
40 - 49 .118
(.05)
.109
(.05)
.091
(.04)
50 - 59 .011
(.05)
.054
(.05)
.062
(.05)
Gender Male .017
(.03)
.137
(.02)
.191
(.02)
Education (1) Less than high school -.193
(.04)
-.437
(.04)
-.474
(.04)
High School -.134
(.04)
-.262
(.04)
-.310
(.04)
Income (1) Below mid-level -.238
(.05)
-.287
(.05)
-.198
(.04)
FDI 1.08
(.18)
1.35
(.17)
1.41
(.17)
Trade -.035
(.007)
-.041
(.006)
-.056
(.006)
Net Migration -.344
(.16)
-.898
(.15)
-.965
(.14)
GDP per Capita log GDP per Capita -.169
(.20)
.681
(.18)
.366
(.18)
Country Dummies inlcluded Yes Yes Yes
Number of countries 43 43 43
Number of observation 25204 29940 31155
Psuedo R-squared ,19 .15 ,17
Boldface means significant at the 5 % level.
Table 5. Ordered Logit: Macro variables with different survey questions
Category Variable
Estimate
(standard error)

International Journal of Business, Humanities and Technology Vol. 2 No. 1; January 2012
210
(1) (2)
Macro Varibale FDI -.0002
(.0061)
.0059
(.0053)
Trade .0008
(.0007)
.0032
(.0016)
Net Migration.0043
(.0090)
-.0021
(.0218)
Log GDP per capita-.089
(.019)
.259
(.194)
Year 2002
.117
(.056)
.236
(.058)
2007
.064
(.055)
.051
(.032)
Country Dummies inlcluded No Yes
Number of countries 53 53
Number of observation 114 114
Psuedo R-squared .22 .90
Boldface means significant at the 5 % level.
Table 6. OLS Regressions with averages across countries
Category Variable
Estimate
(standard error)