Embed Size (px)
Citation preview

DOI 10.1007/s00148-006-0083-x
ORIGINAL PAPER
Sylvia Dixon . David C. Maré
Understanding changes in Māori incomesand income inequality 1997–2003
Received: 2 February 2005 / Accepted: 9 March 2006 / Published online: 21 July 2006© Springer-Verlag 2006
Abstract This paper examines recent changes in weekly income levels anddispersion for Māori, New Zealand’s indigenous ethnic group. Changes in theMāori income distribution between 1997 and 2003 reflect rapid increases ineconomic growth and employment rate. A reduced proportion of people had zeroor benefit-level incomes and a higher proportion had high incomes. Incomeinequality declined for working-aged Māori and was stable for employed Māori.The average income gap between Māori and Europeans declined. The increasedMāori employment rate during this period was the single most important driver ofchanges in the Māori income distribution.
Keywords Income distribution . Decomposition
JEL Classification D31 personal income and wealth distribution . J15 economicsof minorities and races
1 Introduction
This paper examines recent changes in the income distribution of an indigenousethnic group, New Zealand Māori, during a period of sustained economic growth.It describes changes in income differentials within the Māori population andbetween Māori and Europeans. It also explores the likely causes of those incomedistribution changes, evaluating the effects of changes in population character-istics, socioeconomic outcomes and labour market activity patterns.
New Zealand has a much larger indigenous population, relative to the totalpopulation, than Australia, Canada or the US. In the 2001 census, 15% of the
Responsible editor: Deborah Cobb-Clark
S. Dixon . D. C. Maré (*)Motu Economic and Public Policy Research, Level 1, 93 Cuba Street,P.O. Box 24390, Wellington, New ZealandFax: +64-4-9394251, E-mail: [email protected], [email protected]
J Popul Econ 20:571–598 (2007)

population identified themselves as being ofMāori ethnicity (alone or in combinationwith other ethnic groups), and 18% reported that they had some Māori ancestry.Intermarriage between Māori and Europeans is widespread, and Māori are highlyurbanised.1 The incomes ofMāori, relative to those of Europeans, are also higher thanthe relative incomes of indigenous people in Australia, Canada or the US.2
However, the economic status of Māori deteriorated during the 1980s and early1990s (Maani 2004). A prolonged recession and economic reforms resulted in aperiod of high unemployment rates, limited real income growth within householdsand rising income inequality. Due to their initial over-representation in lowerskilled jobs and in the primary sector and manufacturing industries, Māori weremore vulnerable to negative employment shocks and job loss than people of otherethnic groups (Chapple 1999). At the peak of the recession, the unemployment ratefor Māori was as high as 25%. Māori incomes were also badly affected by theeconomic changes of the 1980s and early 1990s. The Māori-to-European ratio ofaverage annual incomes for males declined from 76% in 1986 to 67% in 1996,whilst the ratio for females declined from 86 to 80% (Maani 2004, pp 105–06).
This paper analyses more recent trends in the economic well-being of Māori,focusing on 1997 to 2003, a period of sustained economic growth, risingemployment and falling unemployment. The paper has three main objectives. Thefirst is to identify the impact of the improvements in national economicperformance on the incomes of Māori. We consider both the absolute incomegrowth experienced by Māori and the change in their relative incomes, usingEuropeans as the comparison group.
A second objective is to identify changes in the distribution of incomes withinthe Māori population. Was the growth in employment and average incomesassociated with rising or falling inequality? Descriptive statistics and kernel densityestimation methods are used to describe the changes that occurred in differentregions of the Māori income distribution and their overall impact on dispersion.
A third aim of the paper is to explore the most likely causes of the incomedistribution changes. To do so, we use an analytical procedure introduced byDiNardo et al. (1996), which enables the estimation of ‘counterfactual’ incomedistributions as a means to provide information on the impact of various sets ofexplanatory factors at different levels of income. We estimate counterfactualincome distributions to explore the effects of changes in demographiccharacteristics, changes in educational levels, shifts in employment rates andchanges in labour market activity patterns.
The paper begins with a brief review of previous research on the subject. Thedata source is described in Section 3. Section 4 gives contextual information on themajor changes in the demographic characteristics and labour market activitypatterns that occurred in this period. The analysis of changes in the Māori and
1In 2001, 84% of Māori lived in urban areas, compared with 86% of all New Zealanders. Abouthalf of Māori adults who were married or partnered in 1996 had non-Māori partners (Callister2003, unpublished paper; available at http://www.msd.govt.nz/events/conferences/social-policy-03/abstracts-papers-presentations/3.18.html).2In 2001, for example, the average gross weekly income of adult Māori was 77% of the averagegross weekly income of adult Europeans. Australian Bureau of Statistics figures indicate that themedian weekly gross income of indigenous peoples in 2001 was 59% of that of non-indigenouspeople. The average annual income of aboriginal peoples in Canada in 1995 was 62% of thefigure for the non-Aboriginal population (Statistics Canada 2001, p.6).
572 S. Dixon, D. C. Maré

European income distributions is presented in Section 5, whilst Section 6 exploresthe underlying drivers of change.
We find evidence of significant reductions in the proportion of working-agedMāori with zero incomes or gross weekly incomes of around NZ$150–200 a week(measured in June 2000 dollar values). There were corresponding increases in theproportion of Māori with gross weekly incomes above NZ$500 a week,particularly in certain ranges. The distribution of weekly income across working-aged Māori became less unequal in this period. This was due, in large part, to thetransition of many Māori who were previously not working into employment.
Shifts in the European income distribution in this period were broadly similar insize and direction to the changes in the Māori income distribution, suggesting somecommon drivers of change. There was a small reduction in most Māori–Europeanincome gaps when all working-aged people are considered. Income gaps betweenemployed Māori and employed Europeans were stable or slightly increasing.
Our analysis of the sources of change in the income distribution of all working-aged Māori suggests that the increase in employment rates is likely to have been thesingle most important driver of change, operating over all regions of the incomedistribution. Improvements in the educational qualifications of Māori andoccupational change may also have had a significant impact, particularly in theupper half of the income distribution.
2 Previous research
Previous research on Māori incomes has tended to focus on gaps between Māoriand European average incomes. Maani (2000, 2002, 2004) has compared trends inthe average annual incomes of Māori and Europeans, using census data for 1986 to1996. She found large reductions in both the absolute and the relative incomes ofMāori between these years. She analyses the factors contributing to the Māori–European income gap at means and concludes that a lower level of educationalattainment among Māori was a key factor, along with lower employment rates andweekly hours of work (Maani 2004, p 123).
More recent developments in Māori incomes are reported in Gibson andScrimgeour (2004), Dixon and Maré (2005) and Krishnan and Jensen (2005).Gibson and Scrimgeour (2004) report a small improvement between 1991 and2001 in the ratio of the median annual income of Māori to that of the totalpopulation. However, Dixon and Maré (2005), using the same census years, find adeterioration in relative Māori incomes when the mean annual income of working-aged Māori is compared with the equivalent figure for Europeans. Krishnan andJensen (2005) use a different data source, the Household Economic Survey, andcompare estimates of the median equivalised, post-tax, annual family income.They find no change in the Māori/European median family income gap between1995 and 2001.
The distribution of income within the Māori population is a relatively neglectedsubject. A report by Statistics New Zealand (1999) analyses changes in thedistribution of equivalised annual household disposable income, using HouseholdEconomic Survey data for 1981, 1986, 1991, and 1996. It looks briefly at thelocation of Māori within the total household income distribution and finds that asignificant percentage of Māori moved down the household income distribution
Understanding changes in Māori incomes and income inequality 1997–2003 573

between 1986 and 1991 (Statistics New Zealand 1999, p77). That downgrading ofrelative incomes was only partially reversed between 1991 and 1996. Whilst nomeasures of dispersion are given, it is clear from the data presented that householdincome dispersion within the Māori population must have increased significantly inthe 1986 to 1991 period.
Dixon and Maré (2005) examine changes in the distribution of personal annualincomes within the working-aged Māori population, using census data for the yearsfrom 1991 to 2001. They find that individual-level income dispersion widenedbetween 1991 and 1996. They are unable to show conclusively whether inequalitystabilised or continued to increase slightly between 1996 and 2001.
3 Data source, population and key variables
This is the first study to use data from the Income Survey to examine Māoriincomes. The main advantages of the Income Survey lie in the fact that it measurescurrent (i.e. weekly) income in detail and has a relatively large sample of Māori.The main disadvantage is the relatively short time period covered (1997 to thepresent).
The Income Survey is conducted each June quarter by New Zealand’s centralstatistical agency, Statistics New Zealand, as a supplement to the HouseholdLabour Force Survey. The total sample size is approximately 15,000 householdsand 28,000 adults. About 85% of respondents also completed the Income Survey.Sampling weights are calculated by Statistics New Zealand, and these were used inthe analysis.
The population of study in this paper is restricted to adults aged 20–59 years.This age range approximately captures the age groups in which the majority ofmembers (more than half) are engaged in the labour market. The ‘Māori’ sampleincludes all those who specified ‘Māori’ as one of their ethnic identities. This is themost inclusive and commonly used definition of ‘Māori’.
For comparative purposes, we also report results from a parallel analysis of theincomes of the European ethnic group. The European sample comprises all thosewho identified themselves as ‘Pâkehâ’, ‘European’ or any specific European ethnicgroup, and did not affiliate with any non-European ethnic group. It includes bothNew Zealand-born and overseas-born Europeans.
There are about 1,100 20- to 59-year-old Māori men in each annual IncomeSurvey sample and about 1,400 women of this age group. Because these samplesizes are relatively small, the 1997 and 1998, and the 2002 and 2003 samples werepooled in all analyses undertaken in this study to reduce the effects of samplingvariability on the estimates obtained. 1997–1998 represents the starting period forthe analysis of change and 2002–2003 the end period, giving an average gap of5 years.
Around 15% of Income Survey responses are imputed by Statistics NewZealand because the respondent was not available to answer the questions inperson. The imputation rate is somewhat higher for Māori than for other ethnicgroups (18% on average). Imputed responses were used in the calculation of themain results reported in this paper, but not in the calculation of sampling errors.3
3The imputation methods are described in Dixon and Maré (2004).
574 S. Dixon, D. C. Maré

The income measure we focus on is actual gross weekly income from allsources, as received in the survey reference week. This includes gross weeklyearnings, income from self-employment, income from government benefits,national and private superannuation, student allowances, and earnings-relatedaccident compensation. Income from investments is not included, because it wasnot measured systematically in the Income Survey until 2002.4 The incomevariable was converted to June 2000 dollar values using the Consumer Price Index.
An advantage of studying income distributions using the individual as the unitof analysis is that no assumptions are required about income sharing withinfamilies and households. A disadvantage is that the well-being of people who arenot employed may depend more on the total incomes of their families than on theirown personal incomes. To check on the consistency of the changes at householdand individual level, we also briefly analyse trends in the household incomes andincome dispersion of the study population.
4 Labour market and demographic changes
The economic activity of Māori was particularly severely affected by the recessionthat New Zealand experienced in the late 1980s and early 1990s. Whilstemployment rates fell across all ethnic groups, the employment rate for Māorideclined especially precipitously, from 60% in 1986 to 45% in 1992 (see Fig. 1).After 1993, employment growth resumed at the national level, reversing the earlierdecline but at a slower rate. By 2003, the aggregate Māori employment rate wasback to 1986 levels. It rose 8 percentage points in the period of study (1997 to2003) alone.
Figure 1 highlights the fact that the study period corresponds entirely to theupswing phase of a business cycle. Furthermore, the substantial improvements inMāori employment and incomes that were recorded during the 1997–2003 periodcan be viewed, at least in part, as the recovery of ground that was ‘lost’ by Māoriearlier on, during the recession of 1987–1992.
Table 1 provides information on the changing demographic characteristics andlabour market activity patterns of working-aged Māori and working-agedEuropeans. Some notable shifts in income-related characteristics can be identified.The Māori population became older, by 1.2 years on average. Its educationalprofile was lifted as an increasing proportion of Māori acquired post-schoolqualifications at both degree and sub-degree levels. Whereas in 1997–1998, 36.6%of working-aged Māori held a post-school qualification, by 2002–2003, thisproportion had risen to 44.5%.
The total employment rate of Māori rose by 9.4 percentage points and the full-time employment rate by 8.6 percentage points. The occupational composition ofemployed Māori also shifted away from manual jobs in this period. The proportionof Māori who were working in clerical or in managerial, professional or technicaloccupations expanded. At the same time, the proportions working in trade
4The investment income figures that have been collected since 2002 show that investment incomeis a very small component of Māori weekly incomes. It is a more significant component of theweekly incomes of Europeans; therefore, the exclusion of investment income is likely to biasMāori-European income comparisons to some small degree.
Understanding changes in Māori incomes and income inequality 1997–2003 575

occupations, in metal and machinery operative and processing jobs and inelementary jobs declined. There was little change in average weekly hours.
Comparative data for Europeans are given in the right-hand columns of Table 1.The employment rate of working-aged Europeans increased by 4 percentage pointsbetween 1997–1998 and 2002–2003, half the increase recorded for Māori. Shifts inthe age structure, qualifications profile and occupational profile of working-agedEuropeans were broadly similar to those recorded for Māori, although typically alittle smaller in magnitude. For example, the decline in the proportion of peoplewith no formal qualifications, whilst starting from a higher base, was faster amongMāori.
5 Changes in the Māori and European income distributions
5.1 Average real incomes
Table 2 presents data on the increases in the average real before-tax weeklyincomes of Māori and Europeans between 1997–1998 and 2002–2003. Onaverage, the real weekly incomes of working-aged Māori grew 15.6% in thisperiod. The real income growth experienced by employed Māori was lower at8.2%. The difference between the two growth rates reflects the importance ofmovement into jobs as a factor raising average incomes for the total population.
During the same period, the proportion of Māori who reported zero weeklyincomes in the survey reference week declined from 10.2 to 8.1 percentage points.The proportion reporting receipt of government benefit income declined fromaround 35 to 28%. There was also a small reduction in the average weekly incomesof people who were not in any form of employment. This may be due to a change in
20
25
30
35
40
45
50
55
60
65
70
1986
1987
1988
1989
1990
1991
1992
1993
1994
1995
1996
1997
1998
1999
2000
2001
2002
2003
Em
ploy
men
t rat
e
Maori Europeans
Fig. 1 Longer-term shifts in Māori and European employment rates. Data are from Statistics NewZealand’s Household Labour Force Survey
576 S. Dixon, D. C. Maré

the composition of this group, towards a greater share of people who were notdrawing income support benefits.
The figures for men and women indicate that Māori women experienced fasterreal income growth in this period than Māori men, reducing gender incomedifferences. This was linked to a larger increase in the employment rate of Māoriwomen.
The average weekly income of working-aged Europeans was 13% higher at theend of the period than at the beginning, and the average weekly income ofemployed Europeans was 8.7% higher. The increase in the average weekly incomeof working-aged Europeans was less than the comparable increase for working-aged Māori, leading to a decline in this particular ethnic income gap. However,there was little difference between the two ethnic groups in the average incomegrowth of employed people, suggesting that patterns of job growth and wageincreases in this period did not especially favour (or disadvantage) Māori.
5.2 Kernel density estimates of the income distribution
To identify the key features of the income distribution shifts, we begin with a visualexamination of the changes. A kernel density estimator is used to estimate the
Table 1 Changes in income-related population characteristics
Māori Europeans
1997–1998 2002–2003 Change 1997–1998 2002–2003 Change
Sample sizes 4,810 5,304 29,793 28,996Mean age 35.0 36.2 1.2 38.7 39.7 1.0Highest qualifications (%)None 42.7 34.8 −7.9 20.4 16.8 −3.6Lower school 11.1 11.5 0.4 11.0 10.5 −0.5Higher school 9.6 9.2 −0.4 13.5 13.0 −0.4Vocational 33.5 38.9 5.4 42.6 44.3 1.7Degree 3.1 5.6 2.5 12.5 15.3 2.8Employment rate 57.4 66.8 9.4 76.5 80.7 4.2Full-time employment rate 44.9 53.5 8.6 60.5 64.1 3.7Occupations of the employed (%)Managerial 6.4 8.1 1.7 13.7 14.5 0.9Professional 9.6 10.7 1.1 14.8 16.6 1.8Technical 8.9 9.9 0.9 13.9 12.2 −1.7Clerical 11.4 12.4 1.1 14.8 16.6 1.8Service and sales 14.5 14.4 −0.1 11.7 12.3 0.5Agricultural 6.7 7.9 1.2 8.4 8.6 0.2Trades 9.8 7.9 −1.9 10.3 10.5 0.2Manual 18.6 17.2 −1.3 7.7 7.3 −0.4Elementary 14.0 11.1 −2.9 5.6 4.4 −1.2Not Specified 0.2 0.3 0.1 0.2 0.1 0.0Mean weekly hours of theemployed
38.0 37.8 −0.2 39.0 38.6 −0.4
Understanding changes in Māori incomes and income inequality 1997–2003 577

density of the Māori (or European) income distribution at each level of real logweekly income in 1997–1998 and 2002–2003. Kernel density estimation providesa means to identify the exact location in the income distribution where changeshave occurred.
The kernel density estimate bfh of a univariate distribution f, based on a randomsample of observations on a variable such as income w1,...wn with weightsθ1,... θn,
Pθi ¼ 1; is
bfh wð Þ ¼Xni¼1
θihK
w� wi
h
h i(1)
where h is the bandwidth and K(.) is the kernel function. The bandwidth and thekernel function, together, regulate the relationship between the distance of wi fromw, and the weight given to observation i in the estimation of the density at w.
In this analysis, we use the Epanechnikov kernel function, a bandwidth of 0.08for estimating Māori income distributions, and a bandwidth of 0.06 for estimatingEuropean income distributions. These bandwidths are slightly narrower than the‘optimal’ bandwidths, which differ for the two groups because of the largedifference in sample sizes.5 We prefer to under-smooth than over-smooth as thelatter may disguise localised peaks and troughs in the income distribution.
Table 2 Mean income changes
Māori Europeans
1997–1998
2002–2003
Change 1997–1998
2002–2003
Change
Average incomes ($)All persons 401 463 15.6% 535 604 13.0%Employed 553 599 8.2% 664 721 8.7%Non-employed 195 191 −2.2% 115 115 −0.2%MalesAll persons 488 557 14.1% 698 766 9.7%Employed 623 670 7.6% 796 853 7.2%Non-employed 184 170 −7.7% 138 134 −2.7%FemalesAll persons 325 383 18.1% 372 443 18.8%Employed 463 517 11.5% 499 564 12.9%Non-employed 200 200 −0.2% 104 106 1.4%Percentage with zero income 10.2 8.1 −2.1 12.0 9.8 −2.2Percentage with some benefitincome
34.7 27.9 −6.8 11.9 10.3 −1.6
5The ‘optimal’ bandwidths for the main income distributions considered in this paper are asfollows: 0.108 for all Europeans, 0.067 for employed Europeans, 0.135 for all Māori and 0.087for employed Māori.
578 S. Dixon, D. C. Maré

The income distributions of working-aged Māori in 1997–1998 and 2002–2003are shown in Fig. 2. The x-axis represents weekly income, measured in June 2000dollars and shown on a log scale. The labels on the x-axis have been converted fromlog to dollar values to aid interpretation. The y-axis represents the density of theincome distribution. The total area under the income distribution curve is the samein each time period. Vertical differences in the height of the income distributioncurve at any particular level of income represent increases/decreases in theproportion of the population at that point.
Note that in this part of the analysis, we have censored the real weekly incomedata above 8.7 log points (approximately NZ$6,000) and below 2.3 log points(approximately NZ$10). This is to limit the length of the tails of the distributionand make it easier to plot the portion of the income distribution where the majorityof people are located. Weekly income values above 8.7 were changed to 8.7, andvalues below 2.3 (the vast majority of which represent people with no income inthe survey reference week) were changed to 2.3. This change does not apply to oraffect the analysis of income levels and dispersion in the rest of the paper.
Several features of change stand out in Fig. 2. Firstly, there is a spike at thebeginning of the distribution, representing people who had no income in thereference week. The size of this spike declined between the base and end periods.Secondly, there was a hollowing out of the density at relatively low levels ofincome, between about NZ$60 and NZ$250 a week. A pronounced peak in thedistribution, located between NZ$150 and 200 a week, was much reduced in size.The central peak of the income distribution moved upwards and to the right,consistent with the growth in average real incomes described earlier. Finally, therewas an increase in the proportion of people located at mid-to-high levels of income,from about NZ$650 per week upwards.
The decline in the size of the spike at zero incomes and the decline in theproportion of Māori with incomes between NZ$60 and 250 per week couldpotentially be explained, in part at least, by a transition of people who werepreviously out of the labour force and/or gaining most of their income fromgovernment income support, into employment. The peak at NZ$180 a weekcorresponds approximately to the gross value of the unemployment and sicknessbenefits for single adults.6 The increase in density in the mid-to-high incomeranges could plausibly be due to transitions into full-time employment, real incomeincreases for those in full-time employment or a combination of both.
One useful insight from the analysis is that the process of economic changedoes not seem to have led to an increased concentration of Māori on low weeklyincomes—if we define ‘low’ in absolute terms, for example as less than NZ$500 aweek (equivalent to NZ$26,000 a year). Instead, the growth was fairly well-spreadacross income levels above NZ$500.
Changes in the income distributions of Māori men and women are plotted inFig. 3. The male distribution shows an increase in the concentration of people in theNZ$650–800 a week range, which is around the central peak. This change in shapesuggests that a decline in the dispersion of male incomes is likely to have occurred.
6Whilst many respondents report their benefit income in after-tax terms, Statistics New Zealandconverts these values to the pre-tax equivalent.
Understanding changes in Māori incomes and income inequality 1997–2003 579

0.0
0.1
0.2
0.3
0.4
0.5
0.6
0.7N
Z$1
0
NZ
$13
NZ
$18
NZ
$23
NZ
$31
NZ
$41
NZ
$54
NZ
$72
NZ
$96
NZ
$127
NZ
$169
NZ
$224
NZ
$297
NZ
$394
NZ
$522
NZ
$693
NZ
$919
NZ
$1,2
20
NZ
$1,6
18
NZ
$2,1
47
NZ
$2,8
49
NZ
$3,7
80
NZ
$5,0
14
Den
sity
1997−1998 2002−2003 Weekly income(NZ$2000, log scale)
Fig. 2 Distribution of log income: working-aged Māori for 1997–1998 and 2002–2003. Thehorizontal axis is on a log scale. The labels have been converted from log to dollar values to aidinterpretation
0.0
0.1
0.2
0.3
0.4
0.5
0.6
0.7
0.8
0.9
NZ
$10
NZ
$13
NZ
$18
NZ
$23
NZ
$31
NZ
$41
NZ
$54
NZ
$72
NZ
$96
NZ
$127
NZ
$169
NZ
$224
NZ
$297
NZ
$394
NZ
$522
NZ
$693
NZ
$919
NZ
$1,2
20
NZ
$1,6
18
NZ
$2,1
47
NZ
$2,8
49
NZ
$3,7
80
NZ
$5,0
14
Den
sity
Males 1997−1998 Females 1997−1998Males 2002−2003 Females 2002−2003
Weekly income (NZ$2000, log scale)
Fig. 3 Distribution of log income: working-aged Māori, by gender. The horizontal axis is on alog scale. The labels have been converted from log to dollar values to aid interpretation
580 S. Dixon, D. C. Maré
The change in the female distribution, on the other hand, could be characterised moresimply as a rightward shift, with less sign of any change in shape or dispersion.
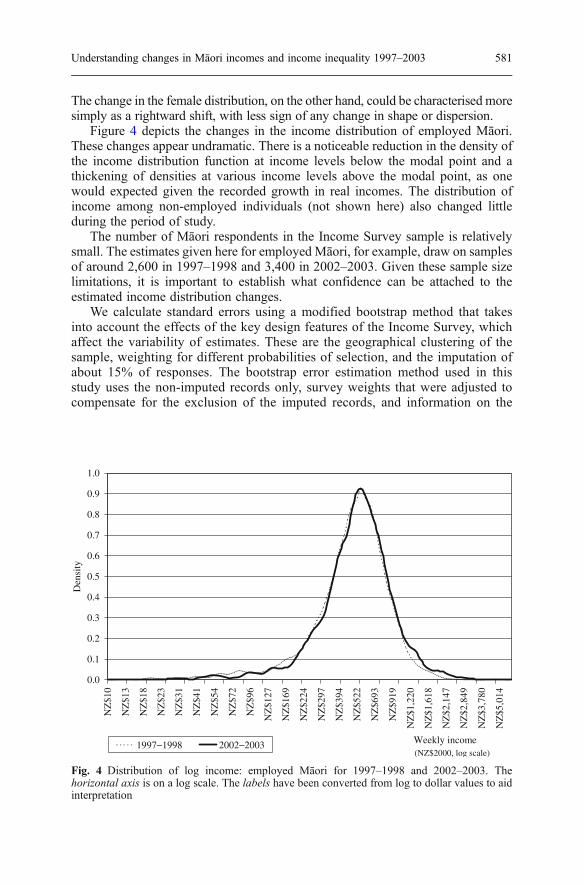
Figure 4 depicts the changes in the income distribution of employed Māori.These changes appear undramatic. There is a noticeable reduction in the density ofthe income distribution function at income levels below the modal point and athickening of densities at various income levels above the modal point, as onewould expected given the recorded growth in real incomes. The distribution ofincome among non-employed individuals (not shown here) also changed littleduring the period of study.
The number of Māori respondents in the Income Survey sample is relativelysmall. The estimates given here for employed Māori, for example, draw on samplesof around 2,600 in 1997–1998 and 3,400 in 2002–2003. Given these sample sizelimitations, it is important to establish what confidence can be attached to theestimated income distribution changes.
We calculate standard errors using a modified bootstrap method that takesinto account the effects of the key design features of the Income Survey, whichaffect the variability of estimates. These are the geographical clustering of thesample, weighting for different probabilities of selection, and the imputation ofabout 15% of responses. The bootstrap error estimation method used in thisstudy uses the non-imputed records only, survey weights that were adjusted tocompensate for the exclusion of the imputed records, and information on the
0.0
0.1
0.2
0.3
0.4
0.5
0.6
0.7
0.8
0.9
1.0
NZ
$10
NZ
$13
NZ
$18
NZ
$23
NZ
$31
NZ
$41
NZ
$54
NZ
$72
NZ
$96
NZ
$127
NZ
$169
NZ
$224
NZ
$297
NZ
$394
NZ
$522
NZ
$693
NZ
$919
NZ
$1,2
20
NZ
$1,6
18
NZ
$2,1
47
NZ
$2,8
49
NZ
$3,7
80
NZ
$5,0
14
Den
sity
1997−1998 2002−2003 Weekly income (NZ$2000, log scale)
Fig. 4 Distribution of log income: employed Māori for 1997–1998 and 2002–2003. Thehorizontal axis is on a log scale. The labels have been converted from log to dollar values to aidinterpretation
Understanding changes in Māori incomes and income inequality 1997–2003 581

clustering of the sample.7 For a more detailed account of the method, seeDixon and Maré (2004). The sampling errors estimated in this manner weretypically around 1.5 times the size of those obtained using the standardstatistical software and sampling weights (i.e., with no adjustments for sampleclustering or imputation).
Figure 5 plots the difference between the kernel density estimates of the totalMāori income distribution in the base and end periods and 95% confidenceintervals around that change. The confidence intervals shown encompass both the1997–1998 and the 2002–2003 estimates at most points of the distribution,indicating that the changes recorded during this 5-year period are generally notstatistically significant. Three points of change are clearly outside the confidenceintervals: the decline in the proportion of the sample with zero incomes, the declinein the ‘mini-peak’ of people with incomes of around NZ$180 per week, and the risein the central peak of the distribution, corresponding to incomes of betweenNZ$500 and 600. There are also some small pockets of significant growth in thedensity of the income distribution at higher levels of income, such as aroundNZ$700–870 per week, NZ$1,100–1,500 per week and NZ$1,900–2,500 per week.
Figure 6 gives analogous sampling error information for the change in theincome distribution of employed Māori. Although the direction of change is clearlyone of redistribution towards income levels of NZ$500 and above, significantdifferences are harder to identify. The graph shows significant growth in theproportion of employed Māori with incomes of NZ$1,250–1,450 and NZ$1,900–2,200 per week. However, the distance of the confidence intervals from zero issmall, suggesting these changes could fail a more precise test of significance.
Figures 7 and 8 compare the Māori income distribution shifts with the changesin the European income distribution. The European distribution is centred around ahigher level of weekly income and has a higher proportion of people with nilincomes, but fewer at the NZ$150–200 per week level. The European distributionshows some similar processes of change to the Māori income distribution,including a decline in the proportion of individuals who were stacked at zeroincomes, a rightward shift of the modal income level, a small reduction in theproportion earning incomes below the mode, and an increase in the proportionearning incomes in the range from NZ$600 to 1,800 per week.
To summarise these results, there is evidence that the weekly incomedistribution of working-aged Māori become more regular in shape between1997–1998 and 2002–2003. There were statistically significant reductions in theproportion of people with zero incomes and incomes in the range of NZ$150–200 aweek. Significant increases occurred in the proportion located at or above thecentral peak, particularly in the following income bands: between NZ$500 and600, between NZ$1,100 and 1,500 and between NZ$1,900 and 2,500.
The precise changes in the income distribution for employed Māori are moredifficult to identify. However, the data indicate statistically significant increases inthe proportion of employed Māori with incomes in the ranges of NZ$1,250–1,450and NZ$1,900–2,200 per week.
7The modified weights and clustering information were supplied by Statistics New Zealand.
582 S. Dixon, D. C. Maré

-0.20
-0.15
-0.10
-0.05
0.00
0.05
0.10
0.15
0.20
NZ
$10
NZ
$13
NZ
$18
NZ
$23
NZ
$31
NZ
$41
NZ
$54
NZ
$72
NZ
$96
NZ
$127
NZ
$169
NZ
$224
NZ
$297
NZ
$394
NZ
$522
NZ
$693
NZ
$919
NZ
$1,2
20
NZ
$1,6
18
NZ
$2,1
47
NZ
$2,8
49
NZ
$3,7
80
NZ
$5,0
14Den
sity
Change c.i. lower bound (5%) c.i. upper bound (95%)
Weekly income (NZ$2000, log scale)
Fig. 5 Change in density of log income: working age Māori. The horizontal axis is on a log scale.The labels have been converted from log to dollar values to aid interpretation
-0.20
-0.15
-0.10
-0.05
0.00
0.05
0.10
0.15
0.20
NZ
$10
NZ
$13
NZ
$18
NZ
$23
NZ
$31
NZ
$41
NZ
$54
NZ
$72
NZ
$96
NZ
$127
NZ
$169
NZ
$224
NZ
$297
NZ
$394
NZ
$522
NZ
$693
NZ
$919
NZ
$1,2
20
NZ
$1,6
18
NZ
$2,1
47
NZ
$2,8
49
NZ
$3,7
80
NZ
$5,0
14Den
sity
Change c.i. lower bound (5%) c.i. upper bound (95%)
Weekly income (NZ$2000, log scale)
Fig. 6 Change in density of log income: employed Māori. The horizontal axis is on a log scale.The labels have been converted from log to dollar values to aid interpretation
Understanding changes in Māori incomes and income inequality 1997–2003 583

0.0
0.1
0.2
0.3
0.4
0.5
0.6
0.7
0.8N
Z$1
0
NZ
$13
NZ
$18
NZ
$23
NZ
$31
NZ
$41
NZ
$54
NZ
$72
NZ
$96
NZ
$127
NZ
$169
NZ
$224
NZ
$297
NZ
$394
NZ
$522
NZ
$693
NZ
$919
NZ
$1,2
20
NZ
$1,6
18
NZ
$2,1
47
NZ
$2,8
49
NZ
$3,7
80
NZ
$5,0
14
Den
sity
Europeans 1997−1998 Maori 1997−1998
Europeans 2002−2003 Maori 2002−2003
Weekly income (NZ$2000, log scale)
Fig. 7 Distribution of log income: Māori and European. The horizontal axis is on a log scale. Thelabels have been converted from log to dollar values to aid interpretation
-0.20
-0.15
-0.10
-0.05
0.00
0.05
0.10
0.15
NZ
$10
NZ
$13
NZ
$18
NZ
$23
NZ
$31
NZ
$41
NZ
$54
NZ
$72
NZ
$96
NZ
$127
NZ
$169
NZ
$224
NZ
$297
NZ
$394
NZ
$522
NZ
$693
NZ
$919
NZ
$1,2
20
NZ
$1,6
18
NZ
$2,1
47
NZ
$2,8
49
NZ
$3,7
80
NZ
$5,0
14
Den
sity
Maori Europeans
Weekly income (NZ$2000, log scale)
Fig. 8 Change in density of log income: Māori and European. The horizontal axis is on a logscale. The labels have been converted from log to dollar values to aid interpretation
584 S. Dixon, D. C. Maré

5.3 Summary statistics
More conventional measures of the changes that occurred at specific points of theMāori income distribution and the impact of those changes on income dispersionare presented in Table 3. The upper section of Table 3 gives results for all working-aged Māori and Europeans. Results for the employed and non-employed sub-populations are shown in the middle and lower sections, respectively. Standarderrors on the change in each statistic are also shown, and changes that aresignificant at the 95% confidence level are italicised.
There were substantial increases in the dollar-value level of most percentiles ofthe working-aged Māori income distribution, from the 10th to the 90th. Whilst a10–12% increase was typical, the 25th percentile gained 22%. These largeincreases reflect at least in part the impact of the redistribution of more than 2% ofMāori from zero to positive incomes, causing an upward shift in the position of allpercentile rankings above zero.
Several measures of dispersion are shown, including the Gini coefficient ofincome inequality, the standard deviation of log incomes, the inter-quartile rangeand the 90–50 percentile gap in the log income distribution.8 All these measures ofincome inequality fell in this period, although only the fall in the inter-quartilerange was statistically significant. This reduction in inequality is not surprising,given the growth in Māori employment rates and large reductions in the fraction ofMāori with zero incomes or incomes from benefits.
As suggested by the kernel density graphs, the income changes experienced byemployed Māori were more modest. All parts of the income distributionexperienced some real income growth, ranging from 4.4% at the median to 7%at the 90th percentile and 11% at the 10th percentile. The increases were somewhatlarger at the upper and lower ends than at the centre of the distribution. The changesin the mean and median are significant at the 95% confidence level. The changes inother percentiles are (marginally) insignificant at this level of significance.
The net effect of this pattern of change was relatively little change in overallincome inequality among employed Māori. The Gini coefficient increased slightly,whilst the standard deviation of log income and the inter-quartile range declinedslightly. The 90/50 and 50/10 percentile ratios suggest that the lower half of theincome distribution for employed Māori became somewhat more compressed,whilst the upper half became somewhat more spread out. However, none of thechanges in the dispersion indices was statistically significant.
The income statistics for non-employed Māori show relatively little change ineither levels or dispersion.
Summary statistics on changes in the European income distribution are given inthe right-hand side of the table. The increases in income levels corresponding to the10th, 25th, 50th, 75th and 90th percentiles are reasonably similar to the rates ofgrowth observed for Māori. The pattern of change in dispersion indices is alsosimilar. The distribution of income for the total working-aged population becamesignificantly less unequal in this period. The inequality measures for employedEuropeans suggest a small reduction in the dispersion of the bottom half of theincome distribution, and a small increase in the dispersion of the upper half.
8 The 50–10 percentile difference is not defined because the 10th percentile was at zero in 1997–1998.
Understanding changes in Māori incomes and income inequality 1997–2003 585

Tab
le3Changes
inpersonal
incomedistributio
ns:MāoriandEuropean
Māori
Europeans
1997
–1998
2002
–2003
Change
%change
SE(change)
1997
–1998
2002
–2003
Change
%change
SE(change)
Allworking-aged
A.Meanandpercentiles
oftheincomedistributio
nMean
401
463
6315.6
8.6
535
604
6913.0
7.8
90th
762
847
8411.1
25.5
1033
1131
989.5
20.5
75th
558
614
5610.1
14.1
723
792
699.5
8.9
50th
362
410
4813.4
9.2
468
520
5311.3
6.8
25th
185
226
4122.3
6.6
202
254
5125.4
5.5
10th
069
6922.8
012
1210.5
B.Sum
marymeasuresof
incomeinequality
Ginicoefficient
0.402
0.395
−0.007
−1.7
0.011
0.449
0.438
−0.011
−2.4
0.006
SD
logincome
1.902
1.771
−0.131
−6.9
0.067
2.134
2.006
−0.128
−6.0
0.029
IQR(oflogs)
1.105
1.000
−0.105
−9.5
0.035
1.274
1.139
−0.135
−10.6
0.024
90–5
0(oflogs)
0.746
0.725
−0.021
−2.7
0.033
0.792
0.776
−0.016
−2.0
0.017
Employed
persons
A.Meanandpercentiles
oftheincomedistributio
nMean
553
599
468.2
13.9
664
721
57.4
8.7
8.6
90th
894
955
616.8
35.8
1158
1252
94.5
8.2
20.3
75th
689
714
253.7
14.4
813
882
69.3
8.5
8.8
50th
514
537
234.4
8.2
579
615
36.2
6.3
4.4
25th
368
385
184.8
12.0
387
409
21.5
5.5
4.4
10th
233
258
2510.7
13.2
211
237
26.5
12.6
7.0
B.Sum
marymeasuresof
incomeinequality
Ginicoefficient
0.280
0.293
0.013
4.6
0.011
0.345
0.351
0.006
1.7
0.005
SD
logincome
0.624
0.600
−0.024
−3.9
0.032
0.741
0.721
−0.020
−2.7
0.012
586 S. Dixon, D. C. Maré

Māori
Europeans
1997
–1998
2002
–2003
Change
%change
SE(change)
1997
–1998
2002
–2003
Change
%change
SE(change)
IQR(oflogs)
0.631
0.617
−0.015
−2.3
0.030
0.742
0.770
0.028
3.8
0.012
90–5
0(oflogs)
0.546
0.579
−0.033
6.0
0.035
0.693
0.708
0.015
2.1
0.017
50–1
0(oflogs)
0.792
0.723
−0.069
−8.7
0.047
1.009
0.953
−0.056
−5.5
0.029
Non-employed
persons
A.Meanandpercentiles
oftheincomedistributio
nMean
195
191
−4−2
.26.5
115
115
0−0
.24.2
90th
395
383
−12
−3.1
8.3
343
329
−14
−4.1
7.6
75th
303
297
−6−2
.19.0
195
200
52.3
5.3
50th
186
186
00.2
8.4
00
025th
3114
−17
−53.2
40.4
00
010th
00
00
00
B.Sum
marymeasuresof
theinequality
Ginicoefficient
0.435
0.437
0.002
0.4
0.017
0.661
0.659
−0.002
−0.3
0.011
SD
logincome
0.621
0.655
0.034
5.4
0.057
0.825
0.832
0.007
0.9
0.060
IQR(oflogs)
2.281
3.020
0.739
32.4
1.681
90–5
0(oflogs)
0.753
0.720
−0.033
−4.4
0.046
Italicised
values
arestatistically
significantat
the5%
level
Tab
le3(contin
ued)
Understanding changes in Māori incomes and income inequality 1997–2003 587

Standard errors on the European estimates are smaller, with the result that mostof the changes recorded are estimated with significance. The changes in thedispersion of income among employed Europeans were, however, too small to besignificant, like those for employed Māori. This suggests that the incomedistribution changes of this period were driven more by the transfer of people fromunemployment or inactivity to employment, than by large changes in the structureof returns to employment.
The gap in incomes between Māori and Europeans declined during this period,although the degree of compression was fairly limited. Māori-to-European incomeratios, calculated at the mean and at various points in the two income distributions,are shown in Table 4. We focus here on the left-hand column of the table. TheMāori-to-European mean income ratio increased from 0.75 to 0.77. Ratiosincreased at most points in the distribution, except for the 25th percentile. If onlyemployed Māori and Europeans are considered, however, the Māori-to-Europeanratio actually fell slightly at most points in the distribution. There was also a smalldecline in the ratio of the average income of non-employed Māori to the averageincome of non-employed Europeans.9
5.4 Comparison with household income trends
This paper focuses on the distribution of personal incomes, but family or householdincome is a more important determinant of financial well-being for many peoplewho are not in paid work. In this section, changes in the level and distribution ofhousehold incomes are briefly examined to identify whether the trends wereconsistent with those identified in our main analysis.
Because of a high level of ethnic group intermarriage in New Zealand, it isdifficult to classify families or households as ‘Māori’ or ‘European’. Instead, wesimply calculate the equivalised weekly pre-tax household incomes of the samplesof Māori and European individuals that are the subject of the rest of this analysis.Household incomes were calculated by adding together the incomes of allhousehold members and equivalising this total using the inverse of the square rootof the number of household members, which is the equivalisation formula adoptedby the Luxembourg Income Study.
Results are shown in Table 5. An important difference between the individualand household income distributions is that relatively few households had zeroweekly incomes in either 1997–1998 or 2002–2003. Consequently, increases inemployment during the study period did not have so marked an effect on the lowerend of the household distribution. For example, the 25th percentile for Māoriincreased by 13%, which is similar to the percentage increases at other points in thehousehold income distribution, but far below the increase of 22% recorded at the25th percentile of the individual income distribution.
Both Māori and Europeans benefitted from significant growth in real householdincomes, which is shown by statistically significant increases at all points in the
9Note that non-employed Māori, on average, had much higher incomes than non-employedEuropeans. This is almost certainly due to a higher level of benefit eligibility among Māori.Table 2 gives the proportion of each ethnic group with some benefit income in the surveyreference week.
588 S. Dixon, D. C. Maré

distribution. Household income growth for both the employed and non-employedsub-populations was lower than household income growth for the total working-aged population. This reflects the importance of compositional change in re-shapingthe aggregate income distribution during a period of rapid employment growth.
Few of the changes in the household income inequality measures arestatistically significant, suggesting this was not a period of major change in thedispersion of household incomes.
Māori/European gaps in household incomes narrowed between 1997–1998 and2002–2003. The changes in a selection of different Māori–European householdincome ratios are shown in the right-hand columns of Table 5. Most of the ratiosthat are shown increased, typically by around 1−4 percentage points.
Non-employed people also experienced household-level income growth. Onaverage, the household incomes of non-employed Māori increased by 10%, whilstthose of non-employed Europeans increased 7%. The income shifts within this sub-population of households were unevenly distributed and appear to have beenlargest at the upper and lower ends of the distribution.
In summary, trends in the level and dispersion of the weekly household incomesof Māori adults are broadly consistent with the trends identified at the individuallevel. Income growth at the individual level appears to have been translated intoimprovements at the household level. On most measures, income disparitiesbetween the households of Māori and those of Europeans narrowed.
Table 4 Ratios of Māori to European incomes
Personal incomes Household incomes
1997–1998 2002–2003 Change 1997–1998 2002–2003 Change
All working-agedMean 0.75 0.77 0.02 0.71 0.74 0.0490th 0.74 0.75 0.01 0.75 0.78 0.0275th 0.77 0.78 0.00 0.73 0.75 0.0250th 0.77 0.79 0.01 0.66 0.72 0.0525th 0.91 0.89 −0.02 0.67 0.67 0.0010th 0.00 6.00 6.00 0.74 0.77 0.03EmployedMean 0.83 0.83 0.00 0.80 0.81 0.0190th 0.77 0.76 −0.01 0.78 0.81 0.0275th 0.85 0.81 −0.04 0.81 0.81 0.0050th 0.89 0.87 −0.02 0.80 0.81 0.0125th 0.95 0.94 −0.01 0.80 0.81 0.0110th 1.11 1.09 −0.02 0.85 0.81 0.01Non-employedMean 1.70 1.66 −0.03 0.76 0.78 0.0290th 1.15 1.16 0.01 0.68 0.72 0.0475th 1.56 1.49 −0.07 0.73 0.74 0.0150th 0.79 0.79 0.0025th 0.90 0.90 0.0010th 1.48 1.33 −0.14
Cells are empty if the statistics is undefined
Understanding changes in Māori incomes and income inequality 1997–2003 589

Tab
le5Household
incomes
ofthestudysamples
Māori
Europeans
1997
–1998
2002
–2003
Change
%change
SE(change)
1997
–1998
2002
–2003
Change
%change
SE(change)
Allworking-agedindividuals
A.Meanandpercentiles
oftheincomedistributio
nMean
475
557
8217.2
11.7
672
748
7611.2
9.5
90th
899
1,009
110
12.2
29.4
1191
1299
108
9.1
24.2
75th
647
717
7010.8
19.5
885
957
728.1
13.4
50th
395
471
7619.2
14.6
595
656
6210.3
9.2
25th
246
279
3213.1
7.5
366
414
4813.0
5.9
10th
169
195
2615.5
5.1
228
252
2410.6
4.2
B.Sum
marymeasuresof
incomeinequality
Ginicoefficient
0.347
0.352
0.005
1.4
0.008
0.339
0.339
0.001
0.1
0.005
SD
logincome
0.987
0.901
−0.085
−8.7
0.020
1.059
0.992
−0.067
−6.3
0.013
IQR(oflogs)
0.966
0.945
−0.021
−2.1
0.031
0.838
0.838
−0.045
−5.1
0.017
90–5
0(oflogs)
0.821
0.762
−0.060
−7.3
0.036
0.694
0.683
−0.011
−1.7
0.019
50–1
0(oflogs)
0.850
0.881
0.031
3.6
0.033
0.958
0.955
−0.003
−0.3
0.018
Employed
individuals
A.Meanandpercentiles
oftheincomedistributio
nMean
605
670
6510.7
14.7
757
826
699.1
11.5
90th
994
1,106
112
11.2
42.3
1,267
1,368
101
7.9
25.7
75th
772
822
496.4
24.1
954
1,018
636.6
12.9
50th
551
594
437.8
18.2
685
731
466.7
8.8
25th
372
408
369.8
10.6
464
501
378.0
8.0
10th
270
283
135.0
10.6
316
347
319.8
6.7
B.Sum
marymeasuresof
incomeinequality
Ginicoefficient
0.278
0.292
0.014
5.1
0.007
0.293
0.300
0.008
2.6
0.005
SD
logincome
0.565
0.543
−0.022
−3.8
0.018
0.586
0.584
−0.002
−0.4
0.009
590 S. Dixon, D. C. Maré

Māori
Europeans
1997
–1998
2002
–2003
Change
%change
SE(change)
1997
–1998
2002
–2003
Change
%change
SE(change)
IQR(oflogs)
0.731
0.700
−0.031
−4.3
0.030
0.721
0.708
−0.013
−1.8
0.015
90–5
0(oflogs)
0.590
0.622
0.031
5.3
0.039
0.616
0.627
0.011
1.8
0.015
50–1
0(oflogs)
0.715
0.742
0.027
3.8
0.037
0.772
0.744
−0.028
−3.7
0.017
Non-employed
individuals
A.Meanandpercentiles
oftheincomedistributio
nMean
300
330
3010.0
10.8
395
421
266.6
11.2
90th
529
588
5911.2
25.3
780
820
405.2
28.5
75th
364
389
257.0
15.9
500
527
275.4
12.1
50th
250
257
72.8
6.1
315
324
93.0
7.1
25th
186
193
73.5
4.7
207
213
63.1
4.1
10th
122
137
1512.3
6.5
83103
2024.2
22.7
B.Sum
marymeasuresof
theinequality
Ginicoefficient
0.330
0.356
0.026
7.8
0.014
0.409
0.414
0.005
1.3
0.012
SD
logincome
1.185
1.146
−0.039
−3.3
0.047
1.662
1.646
−0.016
−1.0
0.033
IQR(oflogs)
0.669
0.702
0.033
5.0
0.039
0.883
0.905
0.022
2.5
0.025
90–5
0(oflogs)
0.750
0.828
0.078
10.4
0.047
0.908
0.929
0.021
2.3
0.035
50–1
0(oflogs)
0.717
0.629
−0.088
−12.2
0.040
1.335
1.148
−0.187
−14.0
0.259
Italicised
values
arestatistically
significantat
the5%
level
Tab
le5(contin
ued)
Understanding changes in Māori incomes and income inequality 1997–2003 591

6 Factors contributing to the income distribution changes
It is useful to think of changes in the income distribution for individuals in a givenpopulation as the product of several sets of factors:
1. Changes in the level or distribution of individual attributes that are related toincome, such as age, residential patterns, family size, and educationalattainment. These individual attributes may be correlated with income becausethey are differently rewarded in the labour market10 because they are correlatedwith differences in labour supply behaviour or because they are linked todifferences in entitlements to government income support.
2. Changes in levels and patterns of labour market activity, such as theemployment rate or the number of hours worked.
3. Changes in the wage structure (representing the level and distribution of rewardsthat can be earned in the labour market for different skills and attributes).
4. Changes in the level or distribution of unearned income, such as income supportpayments from the government.
Previous research on average Māori incomes has shown that age, education,rural/urban locality, hours of work and occupation are all significant predictors ofindividual income level in an income regression context (Maani 2000, 2002).These attributes and dimensions of labour market activity are therefore naturalcandidates for explaining changes in the Māori income distribution.
In this section, we estimate the role played by changes in the populationcharacteristics and labour market activity patterns of Māori between 1997–1998and 2002–2003 in bringing about income distribution changes, using techniquesdeveloped by DiNardo, Fortin and Lemieux (DiNardo et al. 1996).11 To estimatethe effect of the change in a particular population characteristic, such as the agestructure, the base period (1997–1998) sample of working-aged Māori is re-weighted so that the distribution of age in that sample matches the distribution thatexisted by the end of the study period (in 2002–2003). The income distributionassociated with this counterfactual re-weighted by age is then obtained andcompared with the actual start and end period income distributions. The goal is toestimate the amount and pattern of change in the density of incomes that couldpotentially be explained by the change in age structure.
More specifically, in the DiNardo, Fortin and Lemieux approach, eachobservation is viewed as a vector (yi, xi, ti) consisting of an income y, a vector ofcharacteristics x and a date t, and belongs to a joint distribution F(y,x,t) ofincomes, characteristics and dates.12 The density of incomes at a particular pointin time ft(y) can be written as the integral of the density of income conditionalupon a set of individual characteristics (based on the relationship between
10Or correlated with other unmeasured attributes that are differentially rewarded in the labourmarket.11For other recent applications of the DiNardo, Fortin and Lemieux method, see Hyslop and Maré2005, Wilkins 2003, and Barsky et al. 2002.12This summary draws on Hyslop and Maré (2005) and Wilkins (2003).
592 S. Dixon, D. C. Maré

characteristics and incomes at date ty), over the distribution of individualcharacteristics F(x|tx) at date tx:
ft yð Þ ¼Z
f yjx; ty ¼ t� �
dF xjtx ¼ tð Þ� f y; ty ¼ t; tx ¼ t� �
(2)
This notation allows us to express equations for counterfactual densities, with tydenoting the date from which the function mapping characteristics to incomes isdrawn, and tx denoting the date from which the distribution of characteristics isdrawn. For example, whilst f ( y; ty=98, tx=98) represents the actual density ofincomes in 1997–1998, f ( y; ty=98, tx=03) represents the density that would haveresulted in 1997–1998 if characteristics were as observed in 2002–2003. Thishypothetical density can be identified as follows:
f y; ty ¼ 98; tx ¼ 03� � ¼ R
f y x; ty ¼ 98��� �
dF x tx ¼ 03jð Þ¼ R
f y x; ty ¼ 98��� �
ψx xð ÞdF x tx ¼ 98jð Þ (3)
where ψx(x) is a re-weighting function:
ψx xð Þ ¼ dF x tx ¼ 03jð Þ dF x tx ¼ 98jð Þ�(4)
The counterfactual income density is identical to the 1997–1998 density exceptfor the re-weighting function, so once an estimate of ψx(x) is obtained, thecounterfactual density can be estimated using a re-weighted version of the kernel
density formula in Eq. (1), with θi replaced by θibψx xð Þ; applied to observations inthe 1997–1998 sample. Similarly, any summary measure such as the median orGini coefficient can be calculated as a weighted median or weighted Ginicoefficient. Essentially, each individual in the 1997–1998 is re-weighted so as togive the same distribution of characteristics as in the 2002–2003 sample.
Applying Bayes’ rule to the ratio dF x tx ¼ 03jð Þ dF x tx ¼ 98jð Þ�gives the
following re-weighting function:
ψx xð Þ ¼ Pr tx ¼ 03 xjð ÞPr tx ¼ 98 xjð Þ �
Pr tx ¼ 98ð ÞPr tx ¼ 03ð Þ (5)
where Pr(tx=03|x) is the conditional probability that an individual with attributes xis observed in 2002–2003 and Pr(tx=03) is the unconditional probability of beingobserved in that year. To estimate ψx(x), we pool the samples from the two periodsand estimate the probability of each individual being observed in 2002–2003, as afunction of their attributes x, using a logit model for the binary dependent variable t.The predictions from this model are used to obtain the first ratio in Eq. 5, which isthen adjusted by the sample proportions, (Pri(t=98)/Pri(t=03)). Intuitively, this re-weighting scheme puts more weight on individuals with attributes that are morelikely to occur in 2002–2003 and less likely to occur in 1997–1998.13
13 The re-weighting could also be carried out using 2002–2003 as the base year and adjustingattributes to match their 1997–1998 distribution. This variation leads to slightly different results,but does not materially alter the patterns and effects reported here.
Understanding changes in Māori incomes and income inequality 1997–2003 593

Counterfactual Māori income distributions representing the effects of change inbasic demographic characteristics (including age structure, rural/urban residentialpatterns and the relative proportions of different family types) and the effects ofchanges in educational attainment are shown in Fig. 9. The line plotted fordemographic change represents the change in the density of the income distributionthat could be expected to occur on the basis of the demographic shifts that wererecorded between 1997–1998 and 2002–2003. Similarly, the line plotted foreducation represents the estimated effect of the rise in educational attainment on theincome density. Both of these effects are calculated under the assumption thatrelative incomes for different values of the attributes remain as they were in 1997–1998. (Stated another way, the wage structure and benefit structure are heldconstant.) The lines plotted for demographic change and educational change can becompared with the bold line, which represents the actual total change in incomedistribution that was recorded. Note that our counterfactuals are not sequential,unlike the approach taken by DiNardo, Fortin and Lemieux (1996). Eachcounterfactual is derived independently and, therefore, will reflect the impact ofother correlated factors.
The results in Fig. 9 suggest that demographic change had a fairly minor impacton the distribution of income among working-aged Mâori. The impact ofeducational change was potentially more substantial, however. The counterfactualincome distribution for educational change shows a reduction in the proportion ofpeople at low income levels and an increase in the proportion above a threshold ofabout NZ$450 per week.
The ‘employment rate’ counterfactual captures the effects of the change in theproportions of Māori who were employed full-time or employed part-time. This isillustrated in Fig. 10. The effect is large and appears capable of explaining at leasttwo-thirds of the total actual change in the Māori income distribution between1997–1998 and 2002–2003. This employment rate counterfactual ‘predicts’ muchof the decline in the proportion of Māori with incomes in the NZ$120–220 range, aswell as much of the increase in the proportion with incomes above NZ$500 a week.
A counterfactual income distribution incorporating information on the changesin the distribution of hours worked and the distribution of employed Māori acrossoccupations, as well as the changes in labour force status, was estimated; however,for brevity, it is not illustrated here. The combined impact of these three dimensionsof labour market activity is slightly greater than the effect of labour force statusalone and ‘explains’ a slightly greater proportion of the total change in the incomedensity function.
Finally, a multivariate or ‘full’ model counterfactual was estimated and isplotted in Fig. 10. This incorporates all of the factors considered so far:demographic change, education, employment rates, hours and occupationalstructure. Note that these factors are correlated with each other; therefore, thecombined effect is much less than the sum of the individual contributions. The fullattribute model accounts for somewhat more of the total change in income densitiesthan the employment rate counterfactual, particularly at higher levels of income.
Numerical information on the counterfactual income distributions is presentedin Table 6. It shows the estimated income levels at the 10th, 25th, 50th, 75th and90th percentiles of income, the relative contribution of each counterfactual to thetotal income change that was recorded at each percentile and standard errors on the
594 S. Dixon, D. C. Maré

-0.10
-0.05
0.00
0.05
0.10N
Z$1
0
NZ
$13
NZ
$18
NZ
$23
NZ
$31
NZ
$41
NZ
$54
NZ
$72
NZ
$96
NZ
$127
NZ
$169
NZ
$224
NZ
$297
NZ
$394
NZ
$522
NZ
$693
NZ
$919
NZ
$1,2
20
NZ
$1,6
18
NZ
$2,1
47
NZ
$2,8
49
NZ
$3,7
80
NZ
$5,0
14
Den
sity
Total change Demographic effect Education effect
Weekly income(NZ$2000, log scale)
Fig. 9 Counterfactual income distributions: demographic change and education. The horizontalaxis is on a log scale. The labels have been converted from log to dollar values to aidinterpretation
-0.10
-0.05
0.00
0.05
0.10
NZ
$10
NZ
$13
NZ
$18
NZ
$23
NZ
$31
NZ
$41
NZ
$54
NZ
$72
NZ
$96
NZ
$127
NZ
$169
NZ
$224
NZ
$297
NZ
$394
NZ
$522
NZ
$693
NZ
$919
NZ
$1,2
20
NZ
$1,6
18
NZ
$2,1
47
NZ
$2,8
49
NZ
$3,7
80
NZ
$5,0
14
Den
sity
Total change Employment rate effect Full model
Weekly income(NZ$2000, log scale)
Fig. 10 Counterfactual income distributions: Employment rate and combined labour marketactivity. The horizontal axis is on a log scale. The labels have been converted from log to dollarvalues to aid interpretation
Understanding changes in Māori incomes and income inequality 1997–2003 595

estimated counterfactual changes. The effects of demographic changes andeducational attainment are largely confined to the upper half of the incomedistribution. Employment status, on the other hand, has its largest impact on theposition of the 10th percentile and a rather smaller impact on the position of the90th percentile. The effect of the combined model, which includes bothdemographic and labour market variables, is more evenly distributed across theincome spectrum. The combined model accounts for an estimated 62% of theactual total change in mean incomes; nearly all of the change in the 10th percentileand about two-thirds of the change in the 90th percentile.
These simulations offer evidence in support of the view that the rise in theMāori employment rate was the single most important force transforming theincome distribution, by shifting people from income levels below NZ$500 per
Table 6 Counterfactual income distributions
Actual Counterfactual distributions Actual
1997–1998 Demography Education Empt R LM activity Full model 2002–2003
Percentiles of the income distribution ($)Mean 400.6 402.0 415.6 429.5 435.1 441.2 466.0P90 762.2 774.8 792.5 792.5 794.4 818.6 846.7P75 557.9 568.2 584.7 594.4 596.0 608.5 614.2P50 361.6 361.6 377.4 396.3 401.4 406.5 410.0P25 184.7 183.0 190.5 206.6 216.3 215.1 226.0P10 0.0 0.0 0.0 58.5 79.3 67.1 69.3Change from base year = 1997–1998 ($)Mean 1.5 15.1 28.9 34.5 40.6 65.5P90 12.6 30.3 30.3 32.2 56.4 84.5P75 10.3 26.9 36.5 38.2 50.6 56.3P50 0.0 15.8 34.7 39.8 44.9 48.4P25 −1.7 5.9 21.9 31.6 30.4 41.3P10 0.0 0.0 58.5 79.3 67.1 69.3Standard errors on the changes ($)Mean 1.5 2.3 0.8 1.4 3.4 8.6P90 6.2 10.3 7.6 8.7 11.7 25.5P75 3.0 5.5 4.8 5.5 6.9 14.1P50 2.1 3.4 2.9 3.3 4.1 9.2P25 1.3 1.7 2.8 4.2 4.8 6.6P10 0.0 0.0 11.4 9.6 11.3 22.8Estimated contribution to the income change (% share)Mean 2.2 23.0 44.2 52.8 62.0 100.0P90 14.9 35.9 35.9 38.2 66.8 100.0P75 18.3 47.7 64.9 67.8 89.8 100.0P50 0.0 32.7 71.7 82.3 92.8 100.0P25 −4.2 14.2 53.1 76.7 73.6 100.0P10 0.0 0.0 84.4 114.4 96.8 100.0
Each couterfactual was estimated separately, and the results shown reflect separate not cumulativeeffects. Italicised values are statistically significant at the 5% level
596 S. Dixon, D. C. Maré

week to levels above this threshold. Changes in the distribution of other income-related attributes, particularly education, and changes in the occupationalemployment structure of Māori may also have made a significant contribution.The combined effects of the changes in these measured attributes and labourmarket outcomes can account for at least two-thirds of the total change in theincome distribution and more than two-thirds at specific points.
No attempt was made to analyse the sources of change in the incomedistribution of employedMāori because of the imprecision with which the changesin that income distribution are measured.
7 Summary and conclusion
This paper began by mapping out some of the main changes that were recorded inthe income-related attributes and labour market activity patterns of working-agedMāori during the past 5 years. Average levels of educational attainment increasedrelatively rapidly between 1997 and 2003. The occupational profile of employedMāori shifted towards a greater share of skilled managerial, professional andtechnical jobs, suggesting new patterns of job-related skill acquisition. Mostsignificantly, there was a 9-percentage point increase in the employment rate ofworking-aged Māori. All of these changes could potentially have contributed tochanges in the distribution of incomes.
Weekly pre-tax income statistics for Māori show evidence of the types ofchanges that one would expect in a period of rapidly increasing employment. Theproportion of working-aged Māori with no income in the survey reference weekdeclined from 10 to 8%, and the proportion reporting income from governmentbenefits declined from 35 to 28%. The average real income gain between 1997–1998 and 2002–2003, across all working-aged Māori, was 16%.
Kernel density estimates of the density of the income distribution at differentlevels of income reveal a significant decline in the density ‘peak’ at zero income, asignificant decline in density at NZ$150–200 per week, and significant increases indensity at several regions of the distribution above NZ$500 a week. Areas ofgrowth in the density of the income distribution were fairly evenly spread acrosslower-middle to high income levels, indicating that the recent changes in Māoriskills and economic activity patterns have not led to a new concentration of Māoriat low or lower middle incomes.
Summary measures of income inequality for the total population of working-aged Māori show a reduction in inequality in this period. This decline was drivenby a decline in the proportion of Māori with zero or benefit-level incomes and by anincrease in the clustering of individuals at the central peak of the distribution.Summary measures of income inequality among employed Māori show littlechange in this period.
The main changes in the European income distribution were broadly similar tothose affecting the Māori income distribution, suggesting the likelihood of similardrivers or processes of change. There was a small reduction in Māori–Europeanincome gaps when all working-aged people are considered. Income gaps betweenemployed Māori and employed Europeans were stable or slightly increasing.
Understanding changes in Māori incomes and income inequality 1997–2003 597

An analysis of the key drivers of change in the income distribution indicatedthat the transition of many Māori who were previously not working intoemployment had a powerful impact on the aggregate income distribution, and canpotentially account for the majority of the total change observed. Changes in thedistribution of other income-related attributes, particularly education, and changesin the occupational structure of Māori employment may also have made asignificant contribution.
Acknowledgements This research was funded by the Foundation for Research, Science andTechnology, and the financial support of the Foundation is gratefully acknowledged. Access tothe data used in this study was provided by Statistics New Zealand under conditions designed togive effect to the security and confidentiality provisions of the Statistics Act 1975. The authorsthank Robert Templeton and Jonathan Khoo for their valuable assistance with the calculation ofsampling errors. They also thank Steven Stillman and three anonymous referees for their helpfulcomments on earlier drafts of the paper.
References
Barsky R, Bound J, Charles K, Lupton J (2002) Accounting for the black–white wealth gap: anonparametric approach. J Am Stat Assoc 97:663–673
Chapple S (1999) Explaining patterns of disparity between Māori and non-Māori employmentchances. Labour Mark Bull 51(1):70–100. Available at http://www.dol.govt.nz
DiNardo J, Fortin NM, Lemieux T (1996) Labor market institutions and the distribution of wages,1973–1992: a semiparametric approach. Econometrica 64(5):1001–1044
DixonS,MaréD (2004)Understanding changes inMāori incomes and income inequality 1997–2003.Motu working paper 2004-12. Available at http://www.motu.org.nz/motu_wp_2004_12.htm
Dixon S, Maré D (2005) Changes in the Māori income distribution: evidence from thepopulation census. Motu working paper 2005-06. Available at http://www.motu.org.nz/motu_wp_2005_06.htm
Gibson J, Scrimgeour F (2004) Mâori in the 21st century: wealth, resources and institutions.Paper presented at the 48th Annual conference of the Australian agricultural and resourceeconomics society, Melbourne, 11–13 February 2004
Hyslop D, Maré D (2005) Understanding New Zealand’s changing income distribution 1983–98:a semiparametric analysis. Economica 72(3):469–496
Krishnan V, Jensen J (2005) Trends in economic wellbeing: changing patterns in New Zealand1989–2001. Ministry of social development, Wellington. Available at http://www.msd.govt.nz/work-areas/social-research/trends-in-economic-wellbeing.html
Maani S (2000) Secondary and tertiary educational attainment and income levels for Māori andnon-Māori over time. New Zealand treasury working paper 2000/18. Available at http://www.treasury.govt.nz/workingpapers/2000/00-18.asp
Maani S (2002) Education and Māori relative income levels over time: the mediating effect ofoccupation, industry, hours of work and locality. New Zealand treasury working paper2002/17. Available at http://www.treasury.govt.nz/workingpapers/2002/02-17.asp
Maani S (2004) Why have Mâori relative income levels deteriorated over time? Econ Rec 80(248):101–124
Statistics Canada (2001) Aboriginal peoples in Canada. Canadian Centre for Justice StatisticsProfile Series, Statistics Canada, Ottawa
Statistics New Zealand (1999) New Zealand now—incomes. Statistics New Zealand, WellingtonWilkins R (2003) Immigrant and native-born earnings distributions in Australia: 1982–1996.
Australian Journal of Labour Economics 6(1):83–115
598 S. Dixon, D. C. Maré