Embed Size (px)
Citation preview
Sustainable pricing for customers and shareholders
Understanding Commercial Insurance Premiums

Risk and uncertainty are part of everyday life. There are some risks we are all prepared to take and some risks that may severely impact our lives and livelihoods.
The insurance industry exists to satisfy the fundamental need for people and businesses to protect themselves from those risks that are just too great to take.
The principle of insurance is, in itself, fairly straightforward:
• An insurance policy transfers all or most of the expense of a potential loss from customer to insurer, for which the insurer charges a fee or premium.
• The insurer pools all premiums from customers facing similar risks.
• It then pays for losses, its own expenses to understand risks and administer the business, and usually a broker for providing a customer with professional advice and choice.
• The insurer also attempts to retain a profit to deliver the expected returns to the shareholders who provide the capital to make all of this possible.
That said, the internal workings of an insurance company and its jargon are complex. That’s not for any ‘bad reason’ or ulterior motive, it’s simply complex to understand the variety of risks that face a wide range of businesses, set appropriate premiums, assess and attach reserves to claims… and set reserves for claims that may happen in 40 years’ time that haven’t even been considered at that point.
This booklet is designed to try to make the financial workings of the industry easier to understand by breaking down a typical commercial insurer’s profit and loss. We want to have an honest dialogue with our brokers and customers in terms that we all understand and not hide behind complexity.
We’ve done our best in this booklet. But nothing is better than talking. Let’s continue the dialogue face to face.
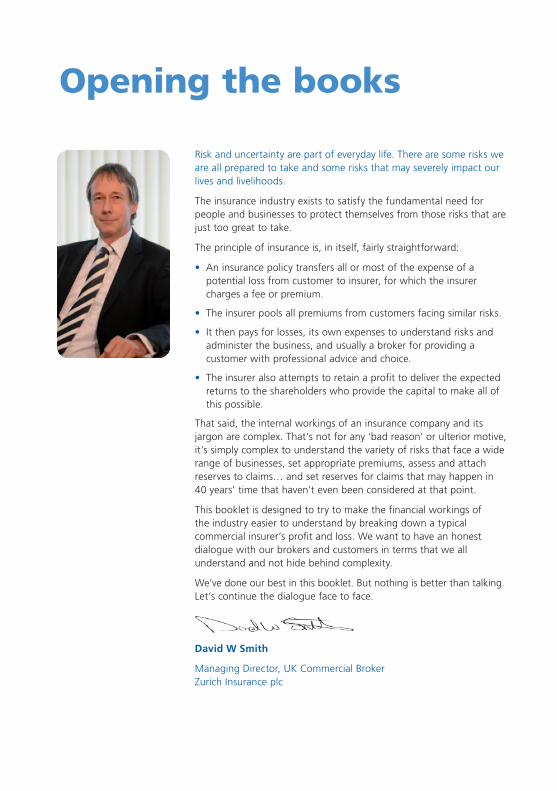
David W Smith
Managing Director, UK Commercial Broker Zurich Insurance plc
Opening the books
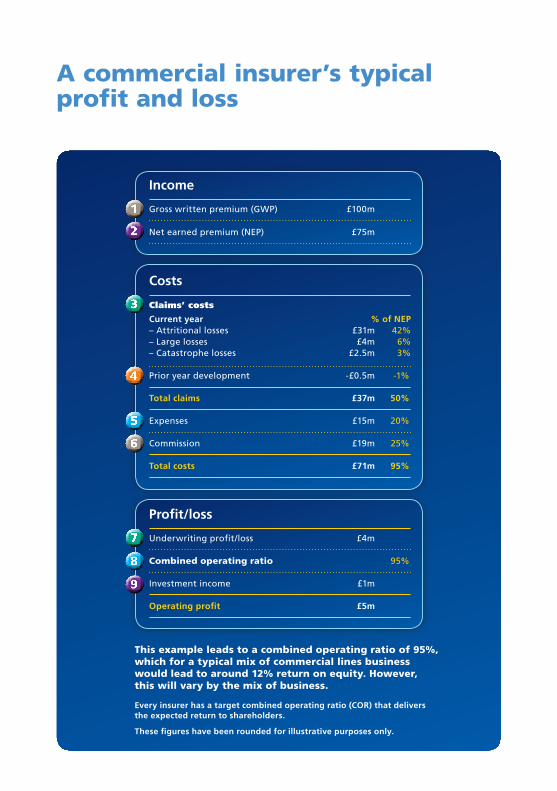
A commercial insurer’s typical profit and loss
This example leads to a combined operating ratio of 95%, which for a typical mix of commercial lines business would lead to around 12% return on equity. However, this will vary by the mix of business.
Every insurer has a target combined operating ratio (COR) that delivers the expected return to shareholders.
These figures have been rounded for illustrative purposes only.
Profit/loss
Underwriting profit/loss £4m
Combined operating ratio 95%
Investment income £1m
Operating profit £5m
7
8
9
Income
Gross written premium (GWP) £100m
Net earned premium (NEP) £75m
1
2
Costs
Claims’ costs
Current year % of NEP – Attritional losses £31m 42% – Large losses £4m 6% – Catastrophe losses £2.5m 3%
Prior year development -£0.5m -1%
Total claims £37m 50%
Expenses £15m 20%
Commission £19m 25%
Total costs £71m 95%
5
6
3
4
Commercial insurance jargon explained
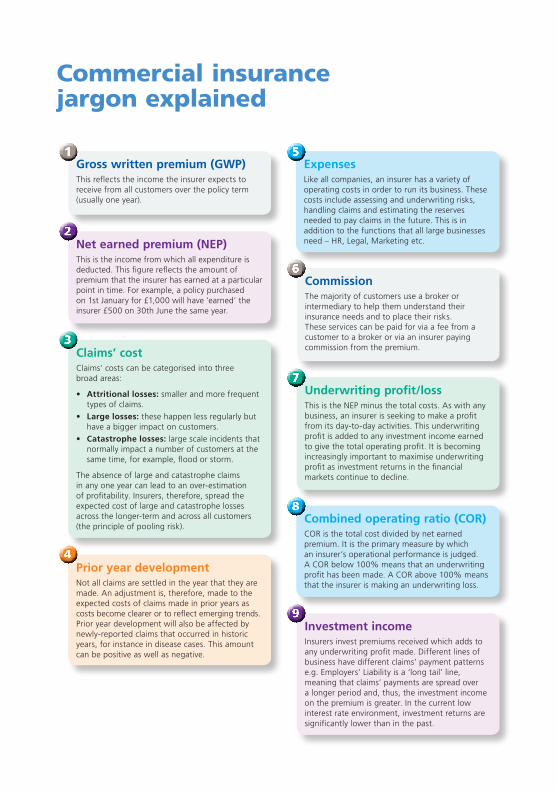
Gross written premium (GWP)This reflects the income the insurer expects to receive from all customers over the policy term (usually one year).
1ExpensesLike all companies, an insurer has a variety of operating costs in order to run its business. These costs include assessing and underwriting risks, handling claims and estimating the reserves needed to pay claims in the future. This is in addition to the functions that all large businesses need – HR, Legal, Marketing etc.
5
CommissionThe majority of customers use a broker or intermediary to help them understand their insurance needs and to place their risks. These services can be paid for via a fee from a customer to a broker or via an insurer paying commission from the premium.
6
Underwriting profit/loss This is the NEP minus the total costs. As with any business, an insurer is seeking to make a profit from its day-to-day activities. This underwriting profit is added to any investment income earned to give the total operating profit. It is becoming increasingly important to maximise underwriting profit as investment returns in the financial markets continue to decline.
7
Combined operating ratio (COR)COR is the total cost divided by net earned premium. It is the primary measure by which an insurer’s operational performance is judged. A COR below 100% means that an underwriting profit has been made. A COR above 100% means that the insurer is making an underwriting loss.
8
Investment incomeInsurers invest premiums received which adds to any underwriting profit made. Different lines of business have different claims’ payment patterns e.g. Employers’ Liability is a ‘long tail’ line, meaning that claims’ payments are spread over a longer period and, thus, the investment income on the premium is greater. In the current low interest rate environment, investment returns are significantly lower than in the past.
9
Net earned premium (NEP) This is the income from which all expenditure is deducted. This figure reflects the amount of premium that the insurer has earned at a particular point in time. For example, a policy purchased on 1st January for £1,000 will have ‘earned’ the insurer £500 on 30th June the same year.
2
Claims’ costClaims’ costs can be categorised into three broad areas:
• Attritional losses: smaller and more frequent types of claims.
• Large losses: these happen less regularly but have a bigger impact on customers.
• Catastrophe losses: large scale incidents that normally impact a number of customers at the same time, for example, flood or storm.
The absence of large and catastrophe claims in any one year can lead to an over-estimation of profitability. Insurers, therefore, spread the expected cost of large and catastrophe losses across the longer-term and across all customers (the principle of pooling risk).
3
Prior year developmentNot all claims are settled in the year that they are made. An adjustment is, therefore, made to the expected costs of claims made in prior years as costs become clearer or to reflect emerging trends. Prior year development will also be affected by newly-reported claims that occurred in historic years, for instance in disease cases. This amount can be positive as well as negative.
4
Profit and loss explained –
Public/Products’ Liability
Every insurer has a target combined operating ratio (COR) that delivers
the expected return to shareholders.
Income
Gross written premium (GWP) £25m
Net earned premium (NEP) £19m
Profit/loss
Underwriting profit/loss -£1.5m
Investment income £0.5m
Operating result (loss) -£1m
Costs
Claims’ costs
Current year
% of NEP
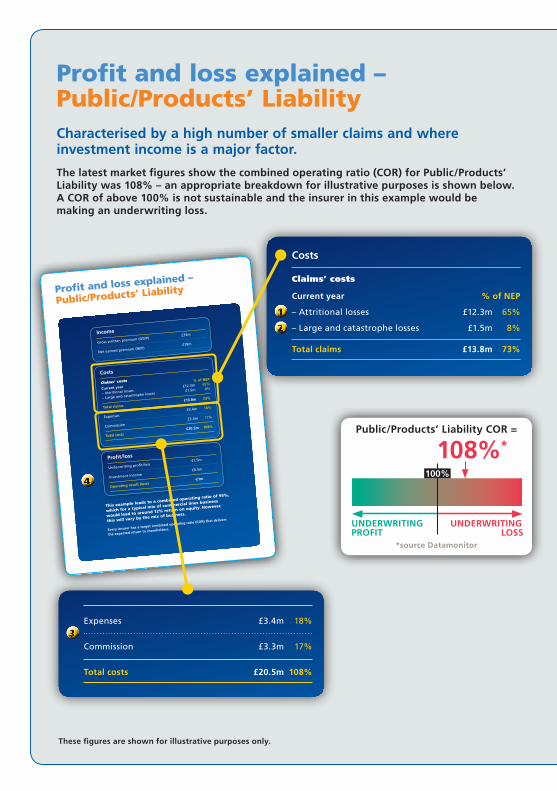
– Attritional losses £12.3m 65%
– Large and catastrophe losses £1.5m 8%
Total claims £13.8m 73%
Expenses
£3.4m 18%
Commission
£3.3m 17%
Total costs
£20.5m 108%
This example leads to a combined operating ratio of 95%,
which for a typical mix of commercial lines business
would lead to around 12% return on equity. However,
this will vary by the mix of business.
Profit and loss explained – Public/Products’ LiabilityCharacterised by a high number of smaller claims and where investment income is a major factor.
The latest market figures show the combined operating ratio (COR) for Public/Products’ Liability was 108% – an appropriate breakdown for illustrative purposes is shown below. A COR of above 100% is not sustainable and the insurer in this example would be making an underwriting loss.
These figures are shown for illustrative purposes only.
Expenses £3.4m 18%
Commission £3.3m 17%
Total costs £20.5m 108%
Costs
Claims’ costs
Current year % of NEP
– Attritional losses £12.3m 65%
– Large and catastrophe losses £1.5m 8%
Total claims £13.8m 73%
UNDERWRITING UNDERWRITING PROFIT LOSS
*source Datamonitor
100%
108%*Public/Products’ Liability COR =
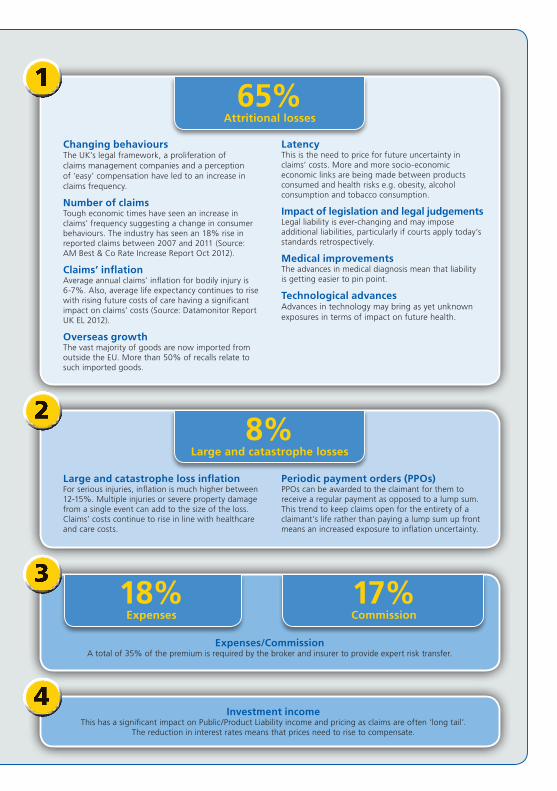
Changing behaviours The UK’s legal framework, a proliferation of claims management companies and a perception of ‘easy’ compensation have led to an increase in claims frequency.
Number of claims Tough economic times have seen an increase in claims’ frequency suggesting a change in consumer behaviours. The industry has seen an 18% rise in reported claims between 2007 and 2011 (Source: AM Best & Co Rate Increase Report Oct 2012).
Claims’ inflationAverage annual claims’ inflation for bodily injury is 6-7%. Also, average life expectancy continues to rise with rising future costs of care having a significant impact on claims’ costs (Source: Datamonitor Report UK EL 2012).
Overseas growthThe vast majority of goods are now imported from outside the EU. More than 50% of recalls relate to such imported goods.
LatencyThis is the need to price for future uncertainty in claims’ costs. More and more socio-economic economic links are being made between products consumed and health risks e.g. obesity, alcohol consumption and tobacco consumption.
Impact of legislation and legal judgementsLegal liability is ever-changing and may impose additional liabilities, particularly if courts apply today’s standards retrospectively.
Medical improvementsThe advances in medical diagnosis mean that liability is getting easier to pin point.
Technological advancesAdvances in technology may bring as yet unknown exposures in terms of impact on future health.
65%Attritional losses
Expenses/CommissionA total of 35% of the premium is required by the broker and insurer to provide expert risk transfer.
18%Expenses
17%Commission
Investment incomeThis has a significant impact on Public/Product Liability income and pricing as claims are often ‘long tail’.
The reduction in interest rates means that prices need to rise to compensate.
8%Large and catastrophe losses
Large and catastrophe loss inflationFor serious injuries, inflation is much higher between 12-15%. Multiple injuries or severe property damage from a single event can add to the size of the loss. Claims’ costs continue to rise in line with healthcare and care costs.
Periodic payment orders (PPOs)PPOs can be awarded to the claimant for them to receive a regular payment as opposed to a lump sum. This trend to keep claims open for the entirety of a claimant’s life rather than paying a lump sum up front means an increased exposure to inflation uncertainty.
Profit and loss explained – Property
Income
Gross written premium (GWP) £25m
Net earned premium (NEP) £19m
Profit/loss
Underwriting profit/loss -£3m
Investment income £0.5m
Operating result (loss) -£2.5m
Costs
Claims’ costs
Current year
% of NEP
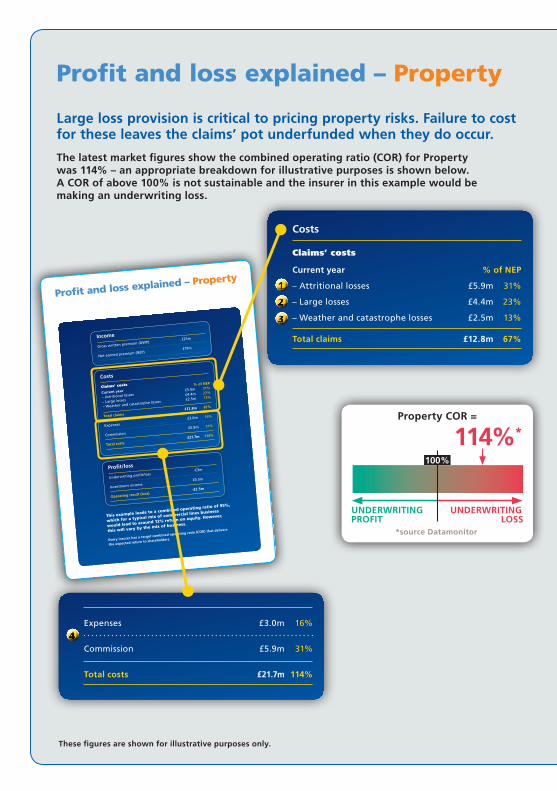
– Attritional losses £5.9m 31%
– Large losses £4.4m 23%
– Weather and catastrophe losses £2.5m 13%
Total claims £12.8m 67%
Expenses
£3.0m 16%
Commission
£5.9m 31%
Total costs
£21.7m 114%
Every insurer has a target combined operating ratio (COR) that delivers
the expected return to shareholders.
This example leads to a combined operating ratio of 95%,
which for a typical mix of commercial lines business
would lead to around 12% return on equity. However,
this will vary by the mix of business.
Profit and loss explained – Property
These figures are shown for illustrative purposes only.
Expenses £3.0m 16%
Commission £5.9m 31%
Total costs £21.7m 114%
Costs
Claims’ costs
Current year % of NEP
– Attritional losses £5.9m 31%
– Large losses £4.4m 23%
– Weather and catastrophe losses £2.5m 13%
Total claims £12.8m 67%
Large loss provision is critical to pricing property risks. Failure to cost for these leaves the claims’ pot underfunded when they do occur.
The latest market figures show the combined operating ratio (COR) for Property was 114% – an appropriate breakdown for illustrative purposes is shown below. A COR of above 100% is not sustainable and the insurer in this example would be making an underwriting loss.
114%*Property COR =
UNDERWRITING UNDERWRITING PROFIT LOSS
*source Datamonitor
100%
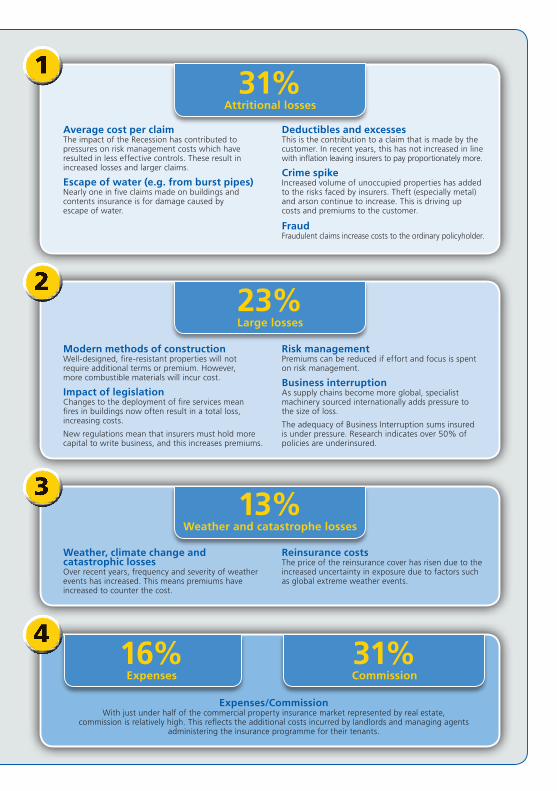
Average cost per claimThe impact of the Recession has contributed to pressures on risk management costs which have resulted in less effective controls. These result in increased losses and larger claims.
Escape of water (e.g. from burst pipes)Nearly one in five claims made on buildings and contents insurance is for damage caused by escape of water.
Deductibles and excessesThis is the contribution to a claim that is made by the customer. In recent years, this has not increased in line with inflation leaving insurers to pay proportionately more.
Crime spikeIncreased volume of unoccupied properties has added to the risks faced by insurers. Theft (especially metal) and arson continue to increase. This is driving up costs and premiums to the customer.
FraudFraudulent claims increase costs to the ordinary policyholder.
31%Attritional losses
Modern methods of constructionWell-designed, fire-resistant properties will not require additional terms or premium. However, more combustible materials will incur cost.
Impact of legislationChanges to the deployment of fire services mean fires in buildings now often result in a total loss, increasing costs.
New regulations mean that insurers must hold more capital to write business, and this increases premiums.
Risk managementPremiums can be reduced if effort and focus is spent on risk management.
Business interruptionAs supply chains become more global, specialist machinery sourced internationally adds pressure to the size of loss.
The adequacy of Business Interruption sums insured is under pressure. Research indicates over 50% of policies are underinsured.
23%Large losses
Weather, climate change and catastrophic lossesOver recent years, frequency and severity of weather events has increased. This means premiums have increased to counter the cost.
Reinsurance costsThe price of the reinsurance cover has risen due to the increased uncertainty in exposure due to factors such as global extreme weather events.
13%Weather and catastrophe losses
Expenses/CommissionWith just under half of the commercial property insurance market represented by real estate,
commission is relatively high. This reflects the additional costs incurred by landlords and managing agents administering the insurance programme for their tenants.
16%Expenses
31%Commission
Profit and loss explained –
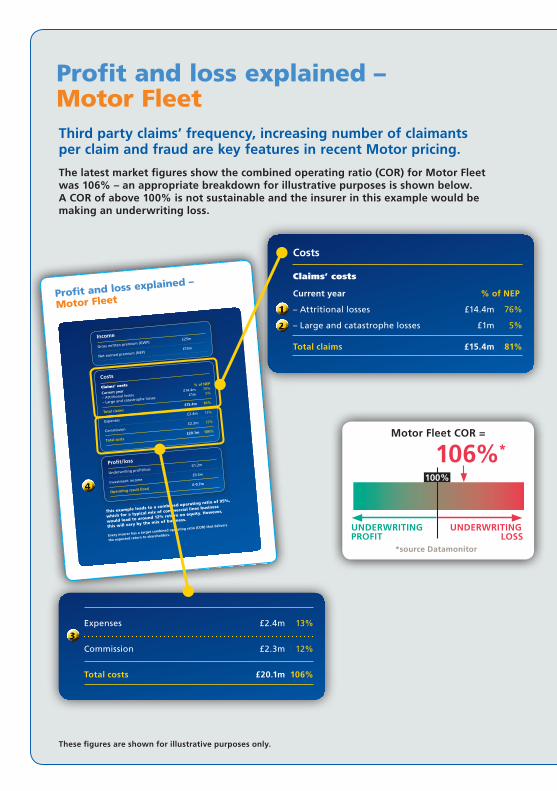
Motor Fleet
Income
Gross written premium (GWP) £25m
Net earned premium (NEP) £19m
Profit/loss
Underwriting profit/loss -£1.2m
Investment income £0.5m
Operating result (loss) £-0.7m
Costs
Claims’ costs
Current year
% of NEP
– Attritional losses £14.4m 76%
– Large and catastrophe losses £1m 5%
Total claims £15.4m 81%
Expenses
£2.4m 13%
Commission £2.3m 12%
Total costs
£20.1m 106%
Every insurer has a target combined operating ratio (COR) that delivers
the expected return to shareholders.
This example leads to a combined operating ratio of 95%,
which for a typical mix of commercial lines business
would lead to around 12% return on equity. However,
this will vary by the mix of business.
Profit and loss explained – Motor FleetThird party claims’ frequency, increasing number of claimants per claim and fraud are key features in recent Motor pricing.
The latest market figures show the combined operating ratio (COR) for Motor Fleet was 106% – an appropriate breakdown for illustrative purposes is shown below. A COR of above 100% is not sustainable and the insurer in this example would be making an underwriting loss.
These figures are shown for illustrative purposes only.
Expenses £2.4m 13%
Commission £2.3m 12%
Total costs £20.1m 106%
Costs
Claims’ costs
Current year % of NEP
– Attritional losses £14.4m 76%
– Large and catastrophe losses £1m 5%
Total claims £15.4m 81%
106%*Motor Fleet COR =
UNDERWRITING UNDERWRITING PROFIT LOSS
*source Datamonitor
100%
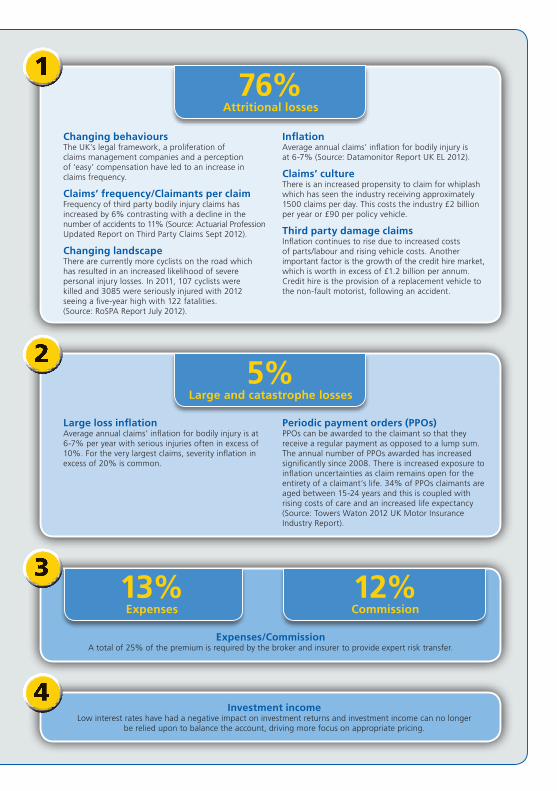
Changing behaviours The UK’s legal framework, a proliferation of claims management companies and a perception of ‘easy’ compensation have led to an increase in claims frequency.
Claims’ frequency/Claimants per claimFrequency of third party bodily injury claims has increased by 6% contrasting with a decline in the number of accidents to 11% (Source: Actuarial Profession Updated Report on Third Party Claims Sept 2012).
Changing landscapeThere are currently more cyclists on the road which has resulted in an increased likelihood of severe personal injury losses. In 2011, 107 cyclists were killed and 3085 were seriously injured with 2012 seeing a five-year high with 122 fatalities. (Source: RoSPA Report July 2012).
InflationAverage annual claims’ inflation for bodily injury is at 6-7% (Source: Datamonitor Report UK EL 2012).
Claims’ cultureThere is an increased propensity to claim for whiplash which has seen the industry receiving approximately 1500 claims per day. This costs the industry £2 billion per year or £90 per policy vehicle.
Third party damage claimsInflation continues to rise due to increased costs of parts/labour and rising vehicle costs. Another important factor is the growth of the credit hire market, which is worth in excess of £1.2 billion per annum. Credit hire is the provision of a replacement vehicle to the non-fault motorist, following an accident.
76%Attritional losses
Large loss inflationAverage annual claims’ inflation for bodily injury is at 6-7% per year with serious injuries often in excess of 10%. For the very largest claims, severity inflation in excess of 20% is common.
Periodic payment orders (PPOs)PPOs can be awarded to the claimant so that they receive a regular payment as opposed to a lump sum. The annual number of PPOs awarded has increased significantly since 2008. There is increased exposure to inflation uncertainties as claim remains open for the entirety of a claimant’s life. 34% of PPOs claimants are aged between 15-24 years and this is coupled with rising costs of care and an increased life expectancy (Source: Towers Waton 2012 UK Motor Insurance Industry Report).
5%Large and catastrophe losses
Expenses/CommissionA total of 25% of the premium is required by the broker and insurer to provide expert risk transfer.
13%Expenses
12%Commission
Investment incomeLow interest rates have had a negative impact on investment returns and investment income can no longer
be relied upon to balance the account, driving more focus on appropriate pricing.
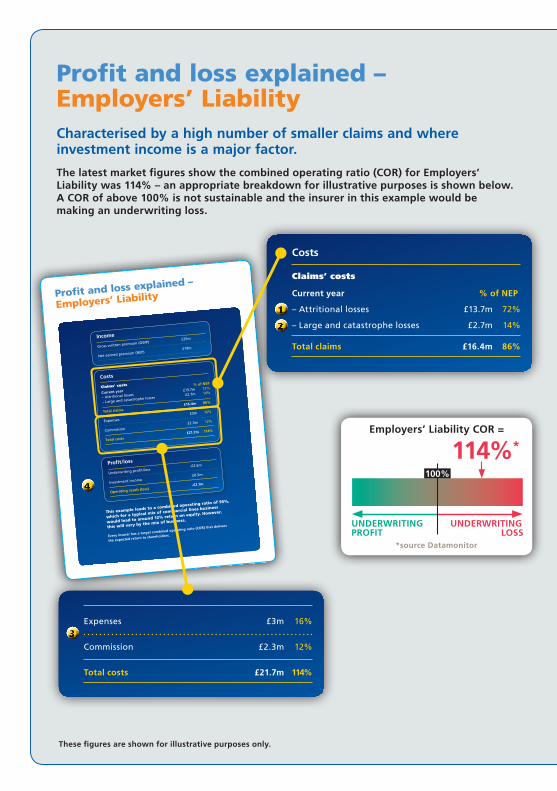
Profit and loss explained –
Employers’ Liability
Income
Gross written premium (GWP) £25m
Net earned premium (NEP) £19m
Profit/loss
Underwriting profit/loss -£2.6m
Investment income £0.5m
Operating result (loss) -£2.1m
Costs
Claims’ costs
Current year
% of NEP
– Attritional losses £13.7m 72%
– Large and catastrophe losses £2.7m 14%
Total claims £16.4m 86%
Expenses
£3m 16%
Commission £2.3m 12%
Total costs
£21.7m 114%
Every insurer has a target combined operating ratio (COR) that delivers
the expected return to shareholders.
This example leads to a combined operating ratio of 95%,
which for a typical mix of commercial lines business
would lead to around 12% return on equity. However,
this will vary by the mix of business.
Profit and loss explained – Employers’ LiabilityCharacterised by a high number of smaller claims and where investment income is a major factor.
The latest market figures show the combined operating ratio (COR) for Employers’ Liability was 114% – an appropriate breakdown for illustrative purposes is shown below. A COR of above 100% is not sustainable and the insurer in this example would be making an underwriting loss.
Expenses £3m 16%
Commission £2.3m 12%
Total costs £21.7m 114%
Costs
Claims’ costs
Current year % of NEP
– Attritional losses £13.7m 72%
– Large and catastrophe losses £2.7m 14%
Total claims £16.4m 86%
These figures are shown for illustrative purposes only.
114%*Employers’ Liability COR =
UNDERWRITING UNDERWRITING PROFIT LOSS
*source Datamonitor
100%
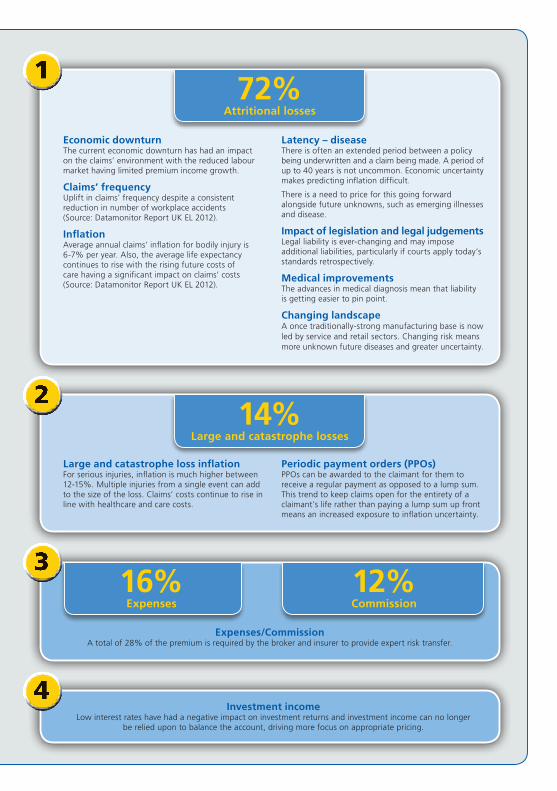
Economic downturnThe current economic downturn has had an impact on the claims’ environment with the reduced labour market having limited premium income growth.
Claims’ frequencyUplift in claims’ frequency despite a consistent reduction in number of workplace accidents (Source: Datamonitor Report UK EL 2012).
InflationAverage annual claims’ inflation for bodily injury is 6-7% per year. Also, the average life expectancy continues to rise with the rising future costs of care having a significant impact on claims’ costs (Source: Datamonitor Report UK EL 2012).
Latency – diseaseThere is often an extended period between a policy being underwritten and a claim being made. A period of up to 40 years is not uncommon. Economic uncertainty makes predicting inflation difficult.
There is a need to price for this going forward alongside future unknowns, such as emerging illnesses and disease.
Impact of legislation and legal judgementsLegal liability is ever-changing and may impose additional liabilities, particularly if courts apply today’s standards retrospectively.
Medical improvementsThe advances in medical diagnosis mean that liability is getting easier to pin point.
Changing landscapeA once traditionally-strong manufacturing base is now led by service and retail sectors. Changing risk means more unknown future diseases and greater uncertainty.
72%Attritional losses
Expenses/CommissionA total of 28% of the premium is required by the broker and insurer to provide expert risk transfer.
16%Expenses
12%Commission
Investment incomeLow interest rates have had a negative impact on investment returns and investment income can no longer
be relied upon to balance the account, driving more focus on appropriate pricing.
14%Large and catastrophe losses
Large and catastrophe loss inflationFor serious injuries, inflation is much higher between 12-15%. Multiple injuries from a single event can add to the size of the loss. Claims’ costs continue to rise in line with healthcare and care costs.
Periodic payment orders (PPOs)PPOs can be awarded to the claimant for them to receive a regular payment as opposed to a lump sum. This trend to keep claims open for the entirety of a claimant’s life rather than paying a lump sum up front means an increased exposure to inflation uncertainty.


UK
GI5
47 (
7144
4200
1) (
05/1
3) R
RD
Zurich Insurance plc A public limited company incorporated in Ireland. Registration No. 13460. Registered Office: Zurich House, Ballsbridge Park, Dublin 4, Ireland. UK Branch registered in England and Wales Registration No. BR7985. UK Branch Head Office: The Zurich Centre, 3000 Parkway, Whiteley, Fareham, Hampshire PO15 7JZ.
Zurich Insurance plc is authorised by the Central Bank of Ireland and subject to limited regulation by the Financial Conduct Authority. Details about the extent of our regulation by the Financial Conduct Authority are available from us on request. These details can be checked on the FCA’s Financial Services Register via their website www.fca.org.uk or by contacting them on 0800 111 6768. Our FCA Firm Reference Number is 203093.
Communications may be monitored or recorded to improve our service and for security and regulatory purposes.
© Copyright – Zurich Insurance plc 2013. All rights reserved. Reproduction, adaptation, or translation without prior written permission is prohibited except as allowed under copyright laws.
The pulp used in the manufacture of this paper is from renewable timber produced on a fully sustainable basis. The pulp used in the manufacture of this paper is bleached without the use of chlorine gas (ECF – Elemental Chlorine Free). The paper is suitable for recycling.