Embed Size (px)
Citation preview

2017
Understanding consumer
psychographics of two wheeler
owners
Consumer Survey
Focus Group Discussion (FGD)
A Research Report
Submitted to: Submitted by:
Terra Motors

1. Background
1.1 Statement of problem
Nepalese market is heavily dominated by vehicles using petrol. As the valley dwellers are already tired of
frequent fuel shortage, demand for vehicle running on alternative energy has increased by a fold.
Nepalese have shifted their attention towards electric bikes and scooters. Since the demand for electric
two-wheelers is increasing, the number of these two-wheeler brands is also growing accordingly. In the
past couple of years, several electric two-wheeler brands were introduced in the Nepali market like —
Terra Motors, Hero Electric, Vmoto, BMC Electric Scooters and newly launched Bela Motors.
Terra Motors is also trying to launch its new electric scooter variant in the Nepalese market. But before
doing that, it becomes necessary to understand the market as well as perception or psychographics of the
consumers. So, for this purpose following research questions were assessed:
How do consumers perceive the two wheelers market or the two wheeler options
that are available in the market?
What is their knowledge level related with the electric scooters?
Are they really comfortable with the change from petrol vehicle to two wheelers?
Are they really willing to switch to electric scooter from the available options of the
petrol variant?
Thus, the research tries to find out the answer to these questions which would be valuable in finding the
right way to brand and market Terra scooter.
1.2 Objectives of study
The major objective of the research is to know why electric scooters couldn’t get enough consumer
attraction and who could be Terra’s specific target customer and what are their psychographics.

The specific objectives of the research are as follows:
To find out the perception of consumers on two wheelers (both current owners and non-
owners)
To examine the current consumer awareness scenario of electric scooters
To analyze consumer’s level of acceptance to the environmental changes
To examine the switching possibility of the existing two wheeler owners
1.3 Research methodologies
This research mainly aims the consumer research that represents a larger population in terms of two-
wheeler users. However, since the distribution of population is in wider geographies and the research
cannot be carried out in all geographies and not relevant in terms of market segmentation and target
audience, the collection of sample size as a part of research methodology was focused only in Kathmandu
valley.
1.3.1 Research Design
Approach to this research is basically an inductive that aims to explore response of the market to eco-
friendly vehicle (E-Scooter) that has already been launched in the Nepalese market. The research is
completely based on the secondary data collected through questionnaire survey and focused group
discussion.
1.3.2 Population and sample size
Two-wheelers as a business portfolio in Automobile industry has huge customer base with registration of
55, 844 units in the year 2014/15, 64,926 in 2015/16 and 29,861 within the first quarter of 2016/17 in
Bagmati Zone alone; which takes the total number of vehicles registered from 1989/90 to 752, 583 units
up to now. This shows significant growth in two wheeler’s market over the years. Similarly, the official
census data of 2011 shows that the total population of Kathmandu valley from age group 18 to 44 years

stands at 1,477,998. For this population, by taking 95% confidence interval, the sample size of 386 is
enough. But, since we were segmenting the population into 3 segments: students, students and corporate
both and corporate only, 400 sample from each segment was taken. Thus, the total sample was 1200 for
the quantitative analysis and the sample taken for the focused group discussion was 30.
1.3.3 Data collection method
The study used two methods: firstly, primary questionnaire survey as a part of quantitative data collection
technique and finally, focus group discussion as a part of qualitative data collection technique.
The work started from the quantitative part that was followed by the qualitative part, i.e. the focus group
discussion.
1.3.4 Data analysis
Quantitative data analysis from questionnaire was performed with the help of Statistical Packages for
Social Science (SPSS) in order to understand the response of the surveyed samples while qualitative
analysis of the focused group discussion was done through collection and transcribing of the things
discussed in the focused group discussion.
The statistical measures used to analyze quantitative and qualitative data was Frequency, Cross
Tabulation and Mean while SPSS and MS Excel were the software that were used for the analysis of
collected data.
1.3.5 Parameter analysis
To understand the similarities and differences in the preferences, choice and behaviors of
respondent’s different classification information was taken. They are as follows:
Occupation
We have categorized the sample into 3 groups which are students, corporate and students and
corporate both.
Gender
This personality dimension differentiates male and female.
Age group
This dimension differentiates the age groups into various segments starting from 16 to 55 years
Education Background
This personality dimension differentiates the education background of the respondents. The
education backgrounds taken into consideration were S.L.C, High School, Bachelor level, Masters
Level and above masters.
Income Level
This dimension differentiates the income level of respondents.
2. Analysis of data
2.1 Quantitative analysis
2.1.1 General information
2.1.1.1 Occupation of respondents
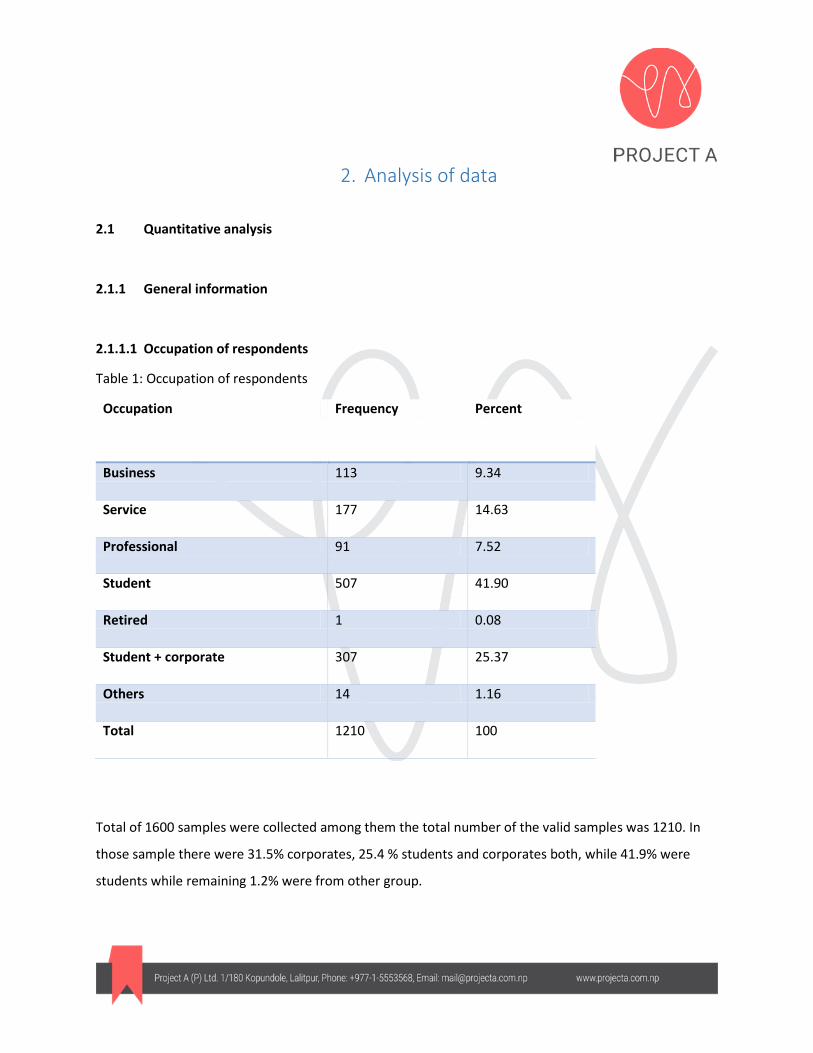
Table 1: Occupation of respondents
Occupation Frequency Percent
Business 113 9.34
Service 177 14.63
Professional 91 7.52
Student 507 41.90
Retired 1 0.08
Student + corporate 307 25.37
Others 14 1.16
Total 1210 100
Total of 1600 samples were collected among them the total number of the valid samples was 1210. In
those sample there were 31.5% corporates, 25.4 % students and corporates both, while 41.9% were
students while remaining 1.2% were from other group.
2.1.1.2 Gender of respondents
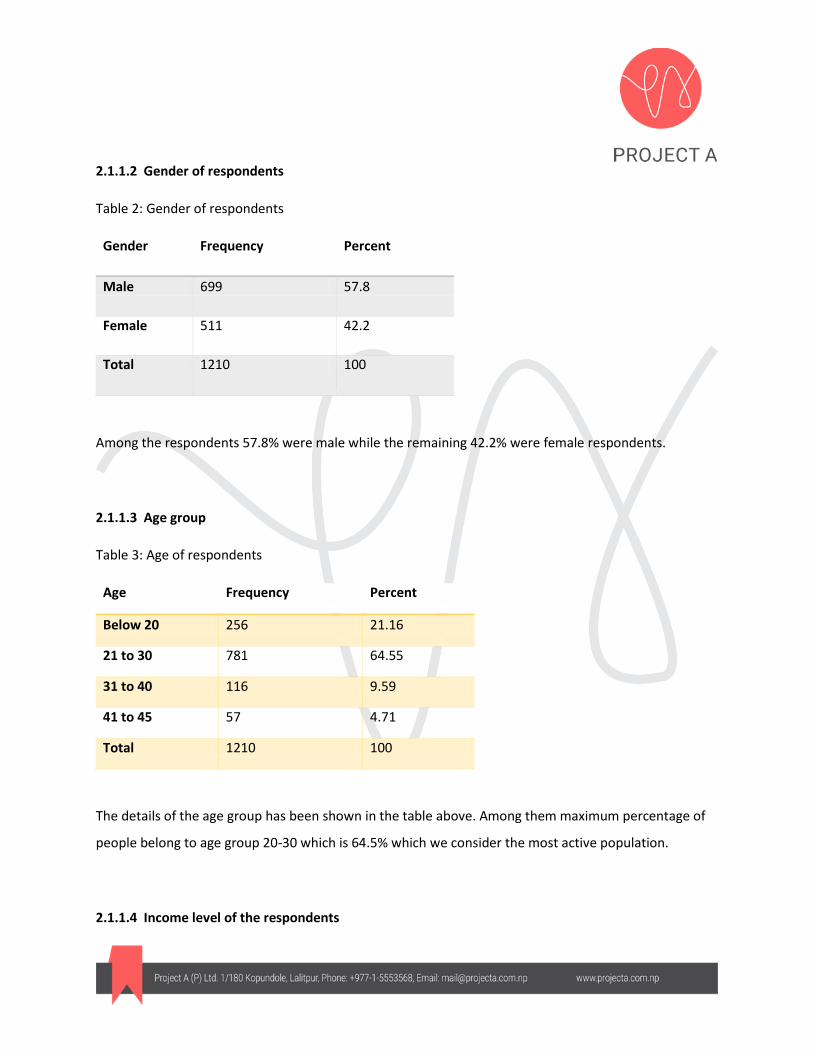
Table 2: Gender of respondents
Gender Frequency Percent
Male 699 57.8
Female 511 42.2
Total 1210 100
Among the respondents 57.8% were male while the remaining 42.2% were female respondents.
2.1.1.3 Age group
Table 3: Age of respondents
Age Frequency Percent
Below 20 256 21.16
21 to 30 781 64.55
31 to 40 116 9.59
41 to 45 57 4.71
Total 1210 100
The details of the age group has been shown in the table above. Among them maximum percentage of
people belong to age group 20-30 which is 64.5% which we consider the most active population.
2.1.1.4 Income level of the respondents

Table 4: Income level
Monthly Income Frequency Percent
Below 20000 845 69.8
20001-40000 269 22.2
40001-60000 66 5.5
60001-80000 12 1
Above 80000 18 1.5
Total 1210 100
The table above represents the division of sample as per the level of income Maximum number of the
respondents fall in the category of salary below Rs.20,000, in the range Rs.0-20,000 which we believe
mostly are students that depend upon their parents for income.
2.1.2 Data centric questions
2.1.2.1 The thing that people value most in life:
Fig1: Thing that is valued most in life
865
787
612
504
425
219
119
345
423
598
706
785
991
1091
0 200 400 600 800 1000 1200
Freedom
Independence
Comfort
Smartness
Pride
Style
Fashion and trend
Value most in life
Frequency No Frequency Yes
Among the six options given in the questionnaire, people had option of choosing 3 of them. The three
options that were chosen by most of the samples were freedom (71.5 %), Independence (65.0%) and
comfort (50.6%).
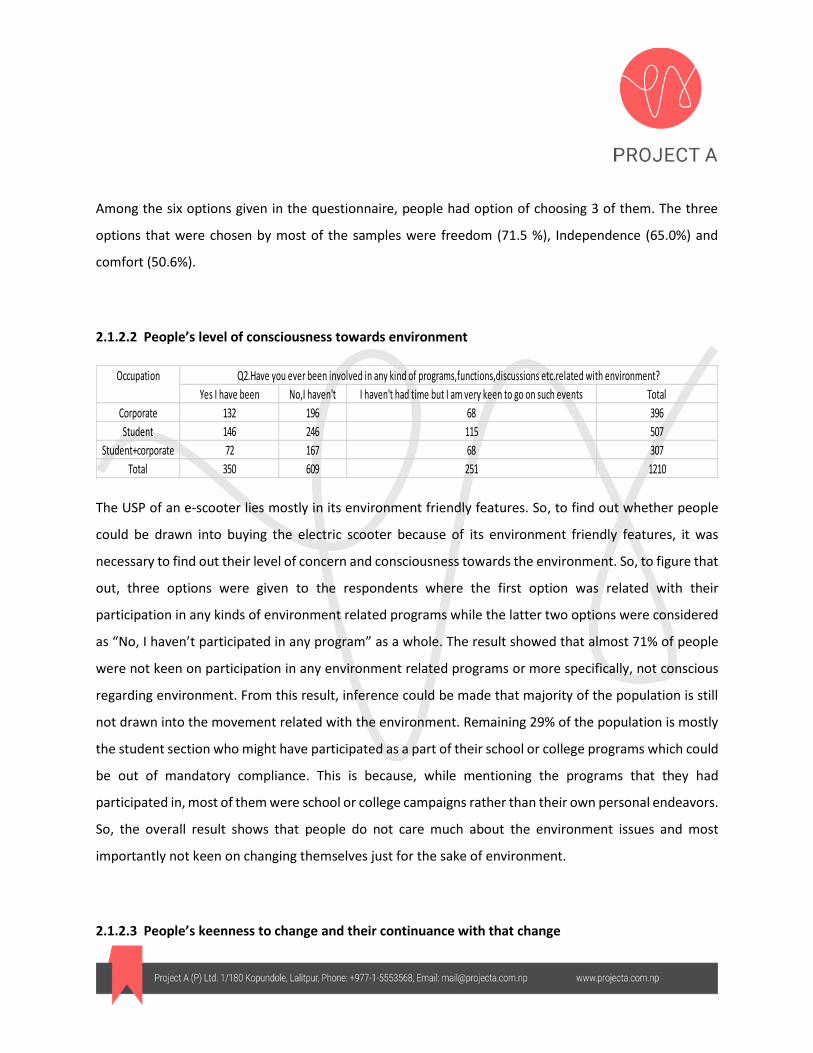
2.1.2.2 People’s level of consciousness towards environment
The USP of an e-scooter lies mostly in its environment friendly features. So, to find out whether people
could be drawn into buying the electric scooter because of its environment friendly features, it was
necessary to find out their level of concern and consciousness towards the environment. So, to figure that
out, three options were given to the respondents where the first option was related with their
participation in any kinds of environment related programs while the latter two options were considered
as “No, I haven’t participated in any program” as a whole. The result showed that almost 71% of people
were not keen on participation in any environment related programs or more specifically, not conscious
regarding environment. From this result, inference could be made that majority of the population is still
not drawn into the movement related with the environment. Remaining 29% of the population is mostly
the student section who might have participated as a part of their school or college programs which could
be out of mandatory compliance. This is because, while mentioning the programs that they had
participated in, most of them were school or college campaigns rather than their own personal endeavors.
So, the overall result shows that people do not care much about the environment issues and most
importantly not keen on changing themselves just for the sake of environment.
2.1.2.3 People’s keenness to change and their continuance with that change
Yes I have been No,I haven't I haven't had time but I am very keen to go on such events
Corporate 132 196 68
Student 146 246 115
Student+corporate 72 167 68
Total 350 609 251
507
307
1210
Q2.Have you ever been involved in any kind of programs,functions,discussions etc.related with environment?Occupation
Total
396

Most of the surveyed sample population were the ones that had their own existing petrol two wheeler
options with them. Switching to electric option scooter is supposed to be a complete change for them.
So, to find out whether people are really keen on changing and to figure out their adaptability to change,
we wanted to draw some kind of analogy. Thus, we took help of the induction stove. It was something
which was widely used during the Indian blockade that took place in Nepal in the year 2015. At that point
of time there was shortage of LPG. Thus, most of the people had switched to induction stove, which was
electric powered rather than fuel powered. So, we wanted to see whether people switched to induction
stove or not and even if they have switched to that, they are still using it or not.
The result from the survey showed that majority of people i.e. 51% didn’t buy it while 25.7% bought it but
use it very little and 14.4 % population said that they had bought it but they don’t use it now. Mere 8.9%
of people said that they are using it more than LPG.
This shows that it is very difficult for people to bring change in their lives specially by changing the things
that they are comfortable with. Induction is much cheaper than the electric scooter and it was very helpful
to reduce the fuel consumption and could have saved a lot of money for the people. But still majority
didn’t buy and those who bought it, started using it less when the crisis was over. This shows that people
are less keen on changing something that they are comfortable with. This was for mere induction stove,
but one could imagine what could be there level of adaptability to electric scooter which is much more
costly.
2.1.2.4 Perception related to fuel crisis
I didn't buy it,so I don't have it right now I use it very little I use it more often compared to LPG. I have but don't use it now Total
Corporate 188 113 29 66 396
Student 278 114 57 58 507
Student+corporate 151 84 22 50 307
Total 617 311 108 174 1210
Q3.You must have bought induction stove during the fuel crisis triggered by indian blocked.How often do you use it now?
Occupation

To know whether to push electric scooter as an option of escaping from the hassle brought in by constant
fuel crisis, we wanted to check whether the people are really frustrated with the fuel crisis and wanted to
switch to the alternative sources of energy, or not. So, we asked them whether they are comfortable with
that and have accepted that the crisis is inevitable; or whether they have switched to more alternative
sources of energy. The result showed that the majority chunk (74%) have accepted that and moved on
while the remaining 26% switched to more alternative source.
This shows that even though people might be frustrated with the fuel crisis in Nepal, they have moved on
accepting the fact that it is inevitable, rather than switching to other alternative sources.
2.1.2.5 Consciousness towards the alternative sources
As electric scooter uses electricity which an alternative source to the regular fuel, it was necessary to find
out the level of consciousness of people towards alternative sources. So, a question was devised which
could infer people’s perception towards the alternative sources of energy. Nepal has been struggling with
the fuel crisis, hence they were asked to give their opinion on what could be done to solve the constant
fuel crisis. The first two options: establishing good relationship with India and being self-dependent by
It bothers me but I cannot do anything other than accepting it I have switched to more alternative sources of energy rather than being dependent on fuel. Total
Corporate 296 100 396
Student 382 125 507
Student+corporate 217 90 307
Total 895 315 1210
Occupation
Q4.What do you think about fuel crises that constantly takes place in Nepal?
Establish good relationship with India Be self-dependent by producing fuel in Nepal itself Switch to more alternative sources like electricity in our day-to-day life Total
Corporate 29 210 157 396
Student 16 256 235 507
Student+corporate 14 161 132 307
Total 59 627 524 1210
Q5.What could be done to solve this problem of constant fuel crisis?
Occupation

producing fuel in Nepal itself was more related with existing sources while the third option switch to more
alternative sources was related with checking their level of consciousness.
The result shows that 56.7 % of respondents showed that they were not keen on alternative sources while
remaining 43.3% of respondents were towards more alternative sources.
As a chunk of people think switching to alternative sources of energy could be the option for solving the
fuel crisis as a whole, if policies are made and things started to change accordingly, making alternative
sources more reliable and accessible then the change could be brought in and market could absorb the
electric scooters easily. But, everything lies on the fact that whether that would change the perception of
56.7% of samples that do not care about the alternative source or not.
2.1.2.6 Things that motivate people to bring changes in their lifestyles
Motivational thing to change lifestyle
N Minimum
Maximum
Mean Std. Deviation
changes in environment
1210 1 5 2.53 1.318
What other are doing 1210 1 5 3.58 1.389
To be unique 1210 1 5 3.49 1.366
Responsibility towards environment and society
1210 1 5 2.65 1.230
Personal needs and experience
1210 1 5 2.74 1.413
We wanted to ask the respondents what factors motivate them to bring changes in their lifestyles because
we thought that electric scooters was a part of a change in their lives. We thought that later their
preference could be used to devise the marketing strategies by putting more focus on factors that
motivates people the most. For that, we provided them with 5 options given in the table above and asked
them to rank those according to their preferences, one being most preferred while five being the least
preferred.
According to results that we got, changes in environment (technology, economy, political and legal) had
maximum population ranked as the first choice while responsibility towards environment and society was
the second option that was ranked first by most of the population while the option “personal needs and
experience” was the third best.
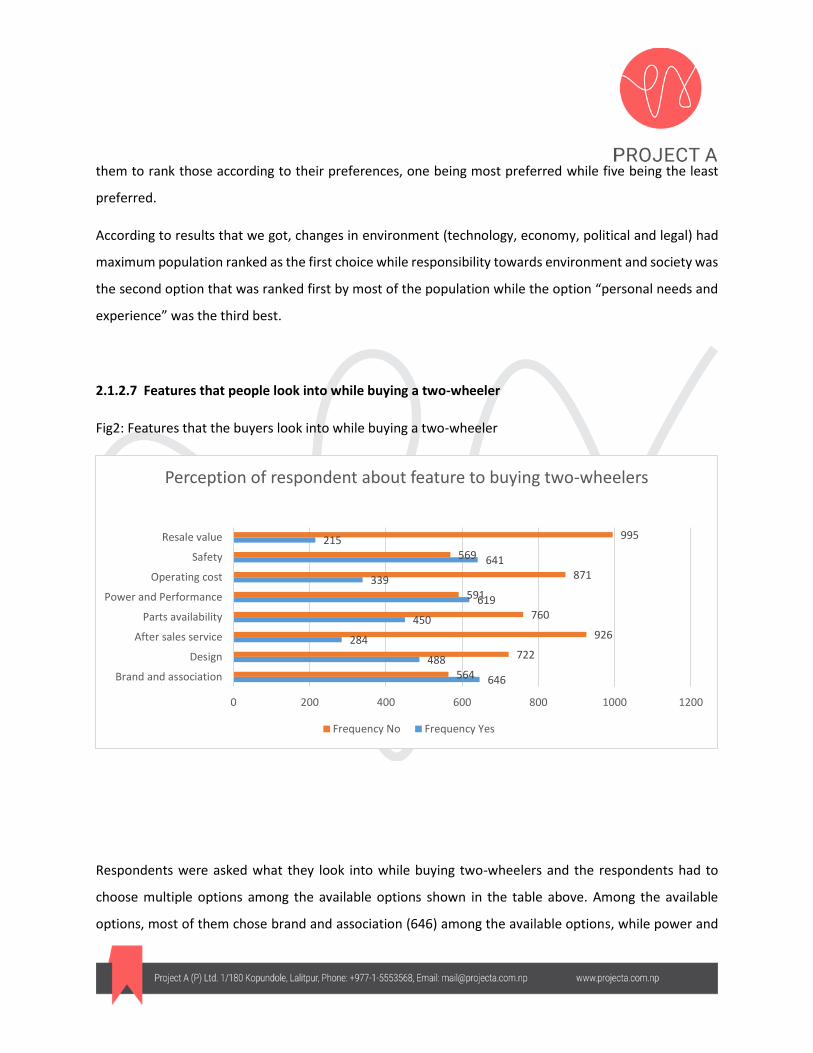
2.1.2.7 Features that people look into while buying a two-wheeler
Fig2: Features that the buyers look into while buying a two-wheeler
Respondents were asked what they look into while buying two-wheelers and the respondents had to
choose multiple options among the available options shown in the table above. Among the available
options, most of them chose brand and association (646) among the available options, while power and
646
488
284
450
619
339
641
215
564
722
926
760
591
871
569
995
0 200 400 600 800 1000 1200
Brand and association
Design
After sales service
Parts availability
Power and Performance
Operating cost
Safety
Resale value
Perception of respondent about feature to buying two-wheelers
Frequency No Frequency Yes

performance (619) came in second and design (488) was the third best among the options. Resale value
(215) was the least chosen option.
This result shows the two wheeler owner’s affinity to brand, performance and design among all.
2.1.2.8 The personal factors that determine the purchase decision of two-wheelers in people
Fig 3: Personal factors that affect the purchase decision
Respondents were given multiple choice options on the question which asked them to choose the
personal factors that motivated them or will motivate them to buy a two wheeler; and among the options
available, needs and requirement (949) was chosen by most, current trends and styles (850) was second
and ease and comfort in mobility (807) came in third while family/ peer pressure came in last.
2.1.2.9 Satisfaction with the features offered by current two wheelers
949
360
807
155261
850
403
1055
0
200
400
600
800
1000
1200
Needs and requirement Current trends and styles Ease and comfort inmobility
Family/ Peer pressure
THINGS THAT AFFECT THE PURCHASE DECISION
Frequency Yes Frequency No
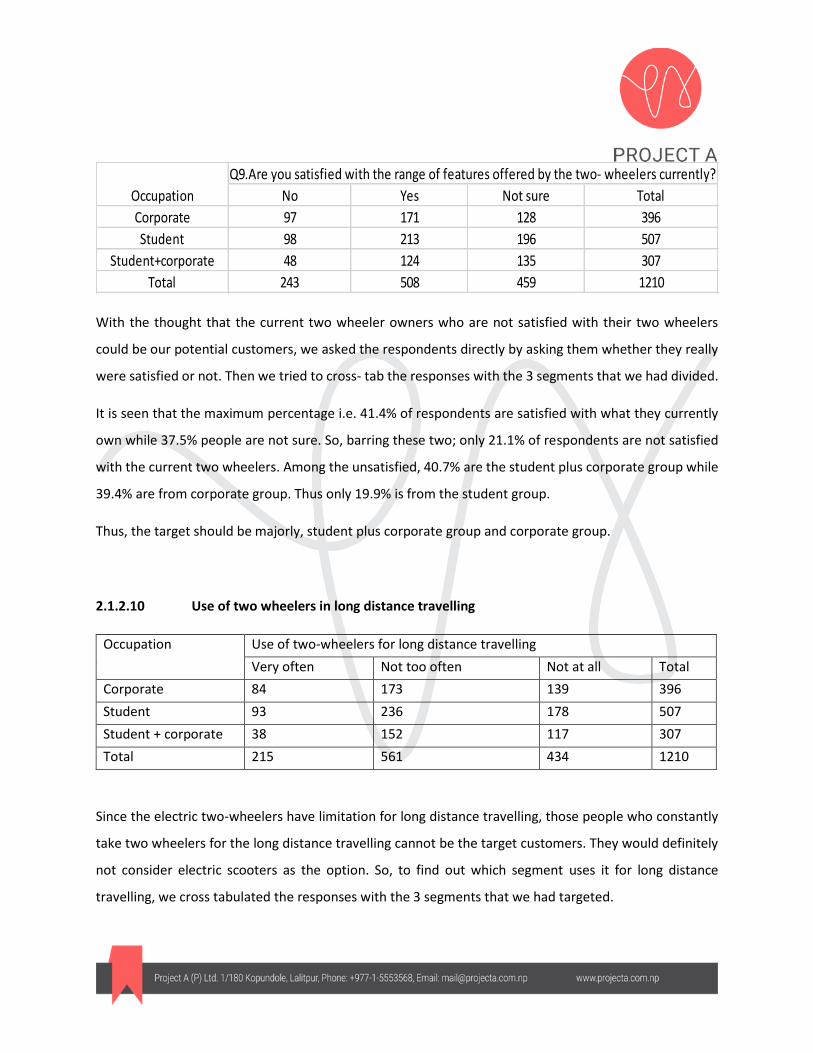
With the thought that the current two wheeler owners who are not satisfied with their two wheelers
could be our potential customers, we asked the respondents directly by asking them whether they really
were satisfied or not. Then we tried to cross- tab the responses with the 3 segments that we had divided.
It is seen that the maximum percentage i.e. 41.4% of respondents are satisfied with what they currently
own while 37.5% people are not sure. So, barring these two; only 21.1% of respondents are not satisfied
with the current two wheelers. Among the unsatisfied, 40.7% are the student plus corporate group while
39.4% are from corporate group. Thus only 19.9% is from the student group.
Thus, the target should be majorly, student plus corporate group and corporate group.
2.1.2.10 Use of two wheelers in long distance travelling
Occupation Use of two-wheelers for long distance travelling
Very often Not too often Not at all Total
Corporate 84 173 139 396
Student 93 236 178 507
Student + corporate 38 152 117 307
Total 215 561 434 1210
Since the electric two-wheelers have limitation for long distance travelling, those people who constantly
take two wheelers for the long distance travelling cannot be the target customers. They would definitely
not consider electric scooters as the option. So, to find out which segment uses it for long distance
travelling, we cross tabulated the responses with the 3 segments that we had targeted.
No Yes Not sure Total
Corporate 97 171 128 396
Student 98 213 196 507
Student+corporate 48 124 135 307
Total 243 508 459 1210
Q9.Are you satisfied with the range of features offered by the two- wheelers currently?
Occupation
The result showed that almost 50% of the students plus corporate sector do not travel long distance too
often and 38% said that they do not travel long distance in two wheelers at all. While in the corporate
sector 44% said that they do not take two wheelers for long distance too often and 34% said “not at all”.
Even though students segment also shows huge percentage of population towards “not too often” and
“not at all section”, we still do not believe that this could induce them to consider buying two-wheelers.
This is because even though students don’t go for long distance travel, they might think about it while
buying the two wheelers. Thus, the lucrative sector is still the student plus corporate and corporate sector.
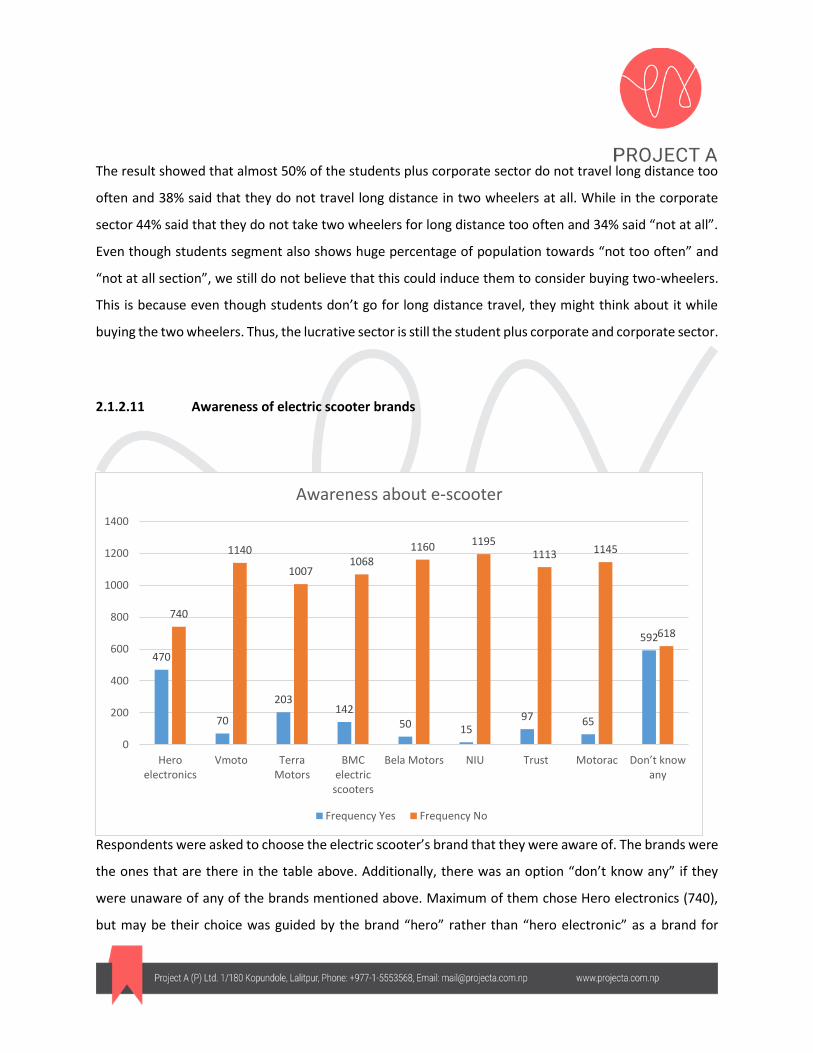
2.1.2.11 Awareness of electric scooter brands
Respondents were asked to choose the electric scooter’s brand that they were aware of. The brands were
the ones that are there in the table above. Additionally, there was an option “don’t know any” if they
were unaware of any of the brands mentioned above. Maximum of them chose Hero electronics (740),
but may be their choice was guided by the brand “hero” rather than “hero electronic” as a brand for
470
70
203142
50 1597 65
592
740
1140
10071068
1160 11951113 1145
618
0
200
400
600
800
1000
1200
1400
Heroelectronics
Vmoto TerraMotors
BMCelectric
scooters
Bela Motors NIU Trust Motorac Don’t know any
Awareness about e-scooter
Frequency Yes Frequency No
electric scooters. Terra came in second in their choice with 203 respondent’s choosing it over others. But
592 people chose that they “do not know any” electric scooter brand which is 48.9% of the total
respondents.
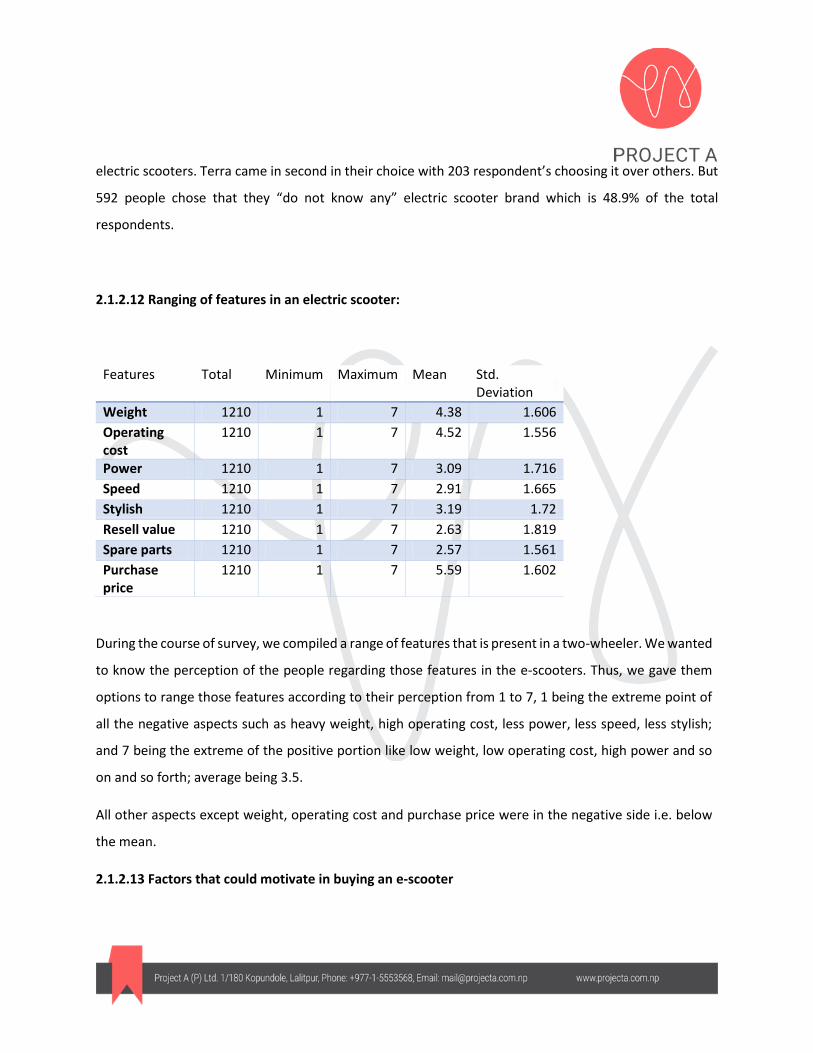
2.1.2.12 Ranging of features in an electric scooter:
Features Total Minimum Maximum Mean Std. Deviation
Weight 1210 1 7 4.38 1.606
Operating cost
1210 1 7 4.52 1.556
Power 1210 1 7 3.09 1.716
Speed 1210 1 7 2.91 1.665
Stylish 1210 1 7 3.19 1.72
Resell value 1210 1 7 2.63 1.819
Spare parts 1210 1 7 2.57 1.561
Purchase price
1210 1 7 5.59 1.602
During the course of survey, we compiled a range of features that is present in a two-wheeler. We wanted
to know the perception of the people regarding those features in the e-scooters. Thus, we gave them
options to range those features according to their perception from 1 to 7, 1 being the extreme point of
all the negative aspects such as heavy weight, high operating cost, less power, less speed, less stylish;
and 7 being the extreme of the positive portion like low weight, low operating cost, high power and so
on and so forth; average being 3.5.
All other aspects except weight, operating cost and purchase price were in the negative side i.e. below
the mean.
2.1.2.13 Factors that could motivate in buying an e-scooter
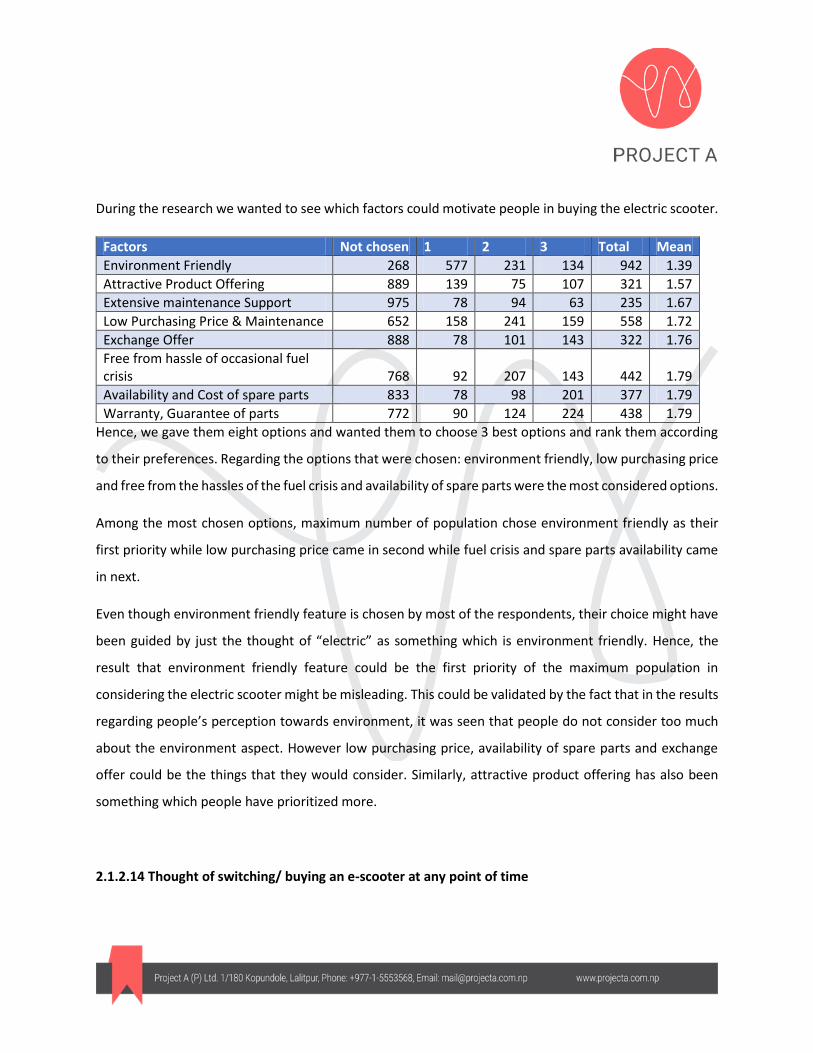
During the research we wanted to see which factors could motivate people in buying the electric scooter.
Hence, we gave them eight options and wanted them to choose 3 best options and rank them according
to their preferences. Regarding the options that were chosen: environment friendly, low purchasing price
and free from the hassles of the fuel crisis and availability of spare parts were the most considered options.
Among the most chosen options, maximum number of population chose environment friendly as their
first priority while low purchasing price came in second while fuel crisis and spare parts availability came
in next.
Even though environment friendly feature is chosen by most of the respondents, their choice might have
been guided by just the thought of “electric” as something which is environment friendly. Hence, the
result that environment friendly feature could be the first priority of the maximum population in
considering the electric scooter might be misleading. This could be validated by the fact that in the results
regarding people’s perception towards environment, it was seen that people do not consider too much
about the environment aspect. However low purchasing price, availability of spare parts and exchange
offer could be the things that they would consider. Similarly, attractive product offering has also been
something which people have prioritized more.
2.1.2.14 Thought of switching/ buying an e-scooter at any point of time
Factors Not chosen 1 2 3 Total Mean
Environment Friendly 268 577 231 134 942 1.39
Attractive Product Offering 889 139 75 107 321 1.57
Extensive maintenance Support 975 78 94 63 235 1.67
Low Purchasing Price & Maintenance 652 158 241 159 558 1.72
Exchange Offer 888 78 101 143 322 1.76
Free from hassle of occasional fuel crisis 768 92 207 143 442 1.79
Availability and Cost of spare parts 833 78 98 201 377 1.79
Warranty, Guarantee of parts 772 90 124 224 438 1.79
Occupation Thought of switching to/buy an e-scooter at any point of time?
No Yes Not sure Total
Corporate 70 168 158 396
Student 135 191 181 507
Student +corporate
46 150 111 307
Total 251 509 450 1210
In this section we asked the respondents if they ever thought about switching to electric scooter. 20.7%
said no while 37.2 % of respondents said not sure. This could not guarantee that there are certain number
of people eager to switch, but during the course of the survey it could be said that some kind of curiosity
was generated in 42.1% of the sample.
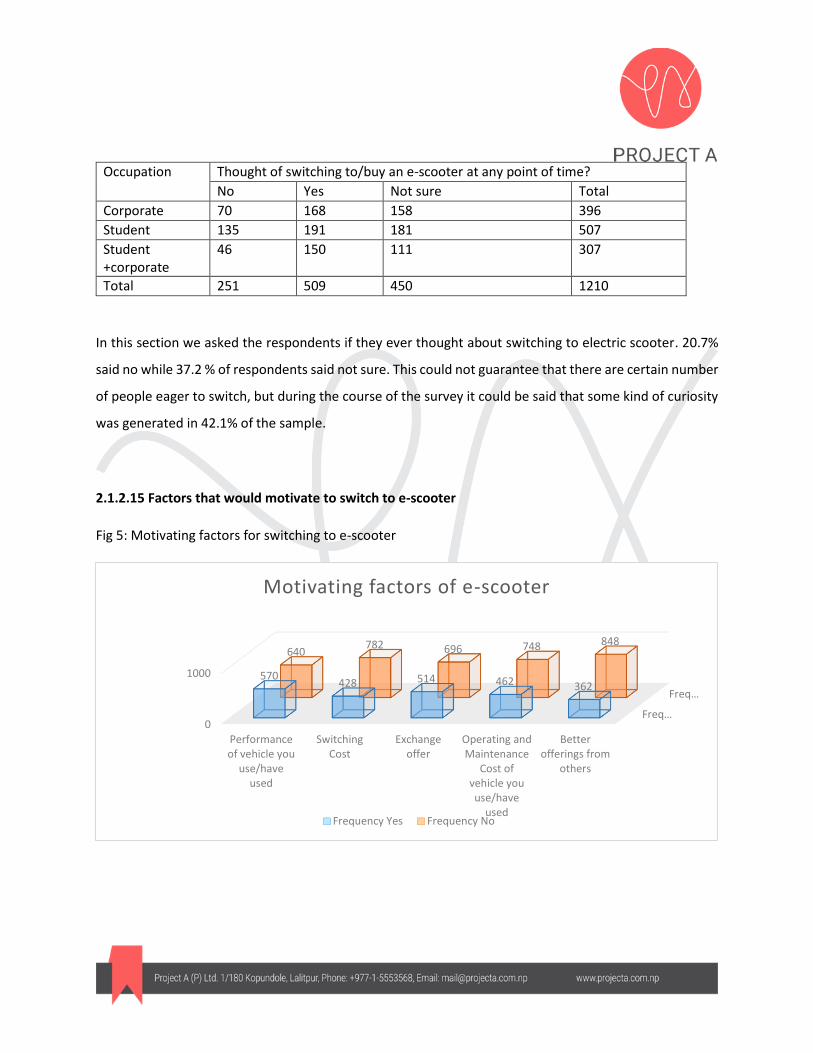
2.1.2.15 Factors that would motivate to switch to e-scooter
Fig 5: Motivating factors for switching to e-scooter
Freq…
Freq…
0
1000
Performanceof vehicle you
use/haveused
SwitchingCost
Exchangeoffer
Operating andMaintenance
Cost ofvehicle youuse/have
used
Betterofferings from
others
570428 514 462 362
640782 696 748 848
Motivating factors of e-scooter
Frequency Yes Frequency No
In this section, we had asked the respondents what could motivate them to switch to electric scooters.
This was targeted to people who already had existing petrol variant two wheelers. Multiple choice was
given with five choices. Maximum respondents chose performance of the existing vehicle (570); while
exchange offer (514) came in second and operating and maintenance cost of existing vehicle (462) came
in third.
This means maximum would switch to electric scooter only if the performance of the existing vehicle is
unsatisfactory and only if good exchange offer is provided to them while switching.
2.1.2.16 Perception regarding whether there is future for electric scooter
Occupation Q16.Do you feel that with the increasing petrol prices and environmental concerns, petrol scooters would be replaced by electric scooters in the near future?
No Yes No Idea Total
Corporate 44 265 87 396
Student 66 348 93 507
Student+corporate
21 220 66 307
Total 131 833 246 1210
Just to figure out the general perception of the people regarding the future of electric two wheelers, we
asked them direct question relating to their perception related with the future of the e-scooters. 68.8%
said “yes” while 10.8% said “no” and 20.4% said they had no idea.
This to some extent proves that there is certain chunk of population who think that electric scooter would
take the market at some point of time. Although, there is no significant result from the electric scooter
market at present, it gives the glimpse of the perception of the market in the future. These people could
be our market in the days to come who believe that there would be market in the future.
2.1.2.15 Satisfaction of the range of features offered by two-wheelers

The respondents were asked whether they were satisfied by the range of features offered by the two
wheelers. Among them only 20.1% said that they were unsatisfied, 42% said that they were satisfied while
37.9% said that they were not sure about it.
2.1.2.16 Two-wheelers for long distance travelling
The respondents were asked how often they used two wheelers for travelling. 17.8% said that they
travelled very often, 46.4% said that they travelled not too often while 35.9% said that they didn’t travel
at all.
2.2 Qualitative analysis
Focused group discussion:
Total of five groups were there for the focused group discussion. The five groups were divided as: students
group, students plus corporates group, corporate group, mixed group and terra owner’s group. Varied
views were taken from each group of the focused group discussion on the topics.
Pictorial identification of the electric scooters
Each of the 30 participants were given a sheet of paper containing 9 images of two wheelers. Among
the images: 2 were Terra e-scooters, 3 were mopeds and 4 were other types of scooters. Participants
were allowed to make multiple choices on the images that they thought represented e-scooters. Total
of 98 choices were made. Table below shows what people chose as e-scooter.
Mopeds Others Terra scooters
57 29 12
58.16% 29.6% 12.24%
58.16% of choices made by the participants were for mopeds while 29.6% were the choices for other
scooters while only 12.24% choices came for Terra scooters. This shows that majority of people are
still unaware about the electric scooters. They perceive electric scooters as mopeds and something
with very ugly design. Though mopeds are not particularly electric vehicles, still people perceive them
as electric scooters.
Participant’s concerns related with environment and fuel crisis:
In this section of the focused group discussion the participants were asked about their concern related
with environment and the constant fuel crisis that takes place in Nepal the things that were observed
are as follows:
Student plus corporate group said that they are concerned about the environment but they
viewed environment problem in terms of lack of waste management and so on and so forth.
They said that they were concerned that pollution is a very serious issue here but they didn’t
think that their vehicles contributed much to this cause. Similarly, regarding the fuel crisis,
they said that they have started to move on because they viewed it as something that couldn’t
be changed.
The response from the student group was also somewhat similar. They were frustrated by
pollution but they thought that the contribution of their two wheelers in this cause is
minimum as they regularly maintained and serviced their vehicles. When they were asked
about their contribution towards “go green” concept, they viewed their contribution from
only waste management perspective. Similarly, fuel crisis seemed to be something that they
have accepted and moved on with.
In the same way, corporate group also didn’t associate their vehicles contribution towards
pollution. Most of them believed that they produced less sound and drove slowly as well as
did timely servicing of their vehicles. Regarding the fuel crisis, they said that they try to
mitigate the impact by creating petrol reserves at home rather than looking for the
alternatives. One of the participant even said that he don’t trust electric scooters at all.
Similar was the case in mixed group. They said that they have developed tolerance for these
kinds of things

So, from all these things it is clear that eco-friendly nature of terra scooters and their “all electric no petrol”
feature may not be the only driving force in selling the e-scooter in Nepalese market. People are
comfortable with the level of pollution that their vehicle create and don’t seem much more concerned
about it. Similarly, they also have developed a level of tolerance towards the fuel crisis and don’t seem to
go for the alternative.
Perception towards existing two wheelers options:
In this section, the participants were asked about what they thought about the two wheelers that they
currently own. From this section we wanted to know about their experience and satisfaction. The results
were as follows:
Most of the people in mixed group preferred the brand of two wheelers because of design and
brand (Vespa), performance and resale value (Honda), mileage and off road experience. The
seemed fairly satisfied with what they owned except for minor glitches such as decrease in
performance, mileage etc. Speed range that they were comfortable with was 40-50 kmph. Most
of them said that their family was the influence in their purchase decision. And they preferred
brand and power and performance in vehicles most.
Students group also said that they preferred the particular brand because of mileage, style,
comfort and budget. Apart from what they own, they prefer bikes with more power, performance
and looks. The speed range that they were comfortable with was 40-60 kmph. In financing aspect
most of them were financed by family for their two wheelers.
Corporate and students plus corporate group were also fairly on the same standpoint in this
aspect. They said particular brand because of budget, comfort, safety, mileage, durability. Most
of them were fairly satisfied with what they owned and said that they occasionally took their two
wheelers for long range travelling.
From this, it also became clear that performance, brand, safety, etc; mattered most for them as a whole.
So, it is very difficult for the electric scooter to tap in those values and create the market.

Participant’s views regarding electric scooter:
Regarding the perception of the people regarding the two wheels the response was fairly similar.
Almost all of them seems to have no prior experience of the two wheelers
When asked about what they think about when they hear the term electric scooters, most of
them said no sound, safe, cost effective, less weight, smooth, slow, less power. Students
group seem fairly negative as unreliable, cheap, difficulty in charging etc. Most of them
thought that the design is similar to that of mopeds.
Regarding the scope of e-scooters in Nepal, most of them thought that the roads might not
be friendly here, geography of Kathmandu valley might not support it. Some thought that it
could do great if it is backed by power and looks
Regarding the price range most of the respondents thought that it was really cheap. They
thought that the price range would come around 50,000 to 130,000.
Then finally they were asked about the “no sound” aspect of the electric scooter. They said
that they would feel uncomfortable if that happens they would not want their vehicle to not
make any sound.
Thus, from the observation it seems that the range of features offered by electric scooter is perceived
fairly negatively by the participants as a whole. Even, the price range that they perceive is much lower
than the actual price of the electric two-wheelers.
Things that could tempt them to switch to e-scooter
Most of them said that they haven’t thought about switching to electric scooter and don’t even think
about buying one at the present. They said that they would only buy the electric scooter if they are
financially strong i.e. if they can afford another two wheeler in addition to the existing two wheelers.
Some of them said that they would wait and see if the market absorbs the product or not and then
only they would make decision. Most of them also said that they would buy electric scooters only if it
was really cheap 40-50k. Some participants said that they would only buy it if it matches the
performance of the current two-wheeler that they own.

So, electric scooter is something which is yet to generate that kind of vibe and market which would
curb the enthusiasm in people.
Terra owner’s experiences:
As a part of gathering their opinion, terra owners were also called up for the discussion. Regarding
the age of the owners, they seemed to be fairly old people who did not have license for the two
wheelers. They seemed to be satisfied by the power and performance. Their dissatisfaction was
related with the indicators. They thought that it would have been helpful if the indicators have had
sound. Similarly, they had some technical issues with the light. Similarly, they were a bit concerned
about the scooters getting wet during the course of rain and hampering the battery unit. License and
number plates was another major issue they faced during the travel in Kathmandu.
3. Recommendations
Association of freedom comfort and independence with the scooter:
The top three things that people valued most were freedom, independence and comfort. While doing
the focused group discussion respondents were asked how they associate these things with the two
wheelers. They said that two wheelers took them where they wanted to go so freedom; independence
they associated with not being dependent on parents or even public transport too much and comfort
was related with the ease in mobility. So, while promoting the scooter the theme could be like “Feel
comfort, independence and freedom by owning a terra scooter”
Environment focus not recommended
Most of the respondents didn’t seem to be too much concerned about the environmental issues and
during the focused group discussions also they said that contribution from their two wheelers in
pollution is minimum. So, going by the theme that the scooter is environment friendly won’t help for
the promotion of the scooter for the general mass of people. But, there is still a potential for this.
Terra could target the companies and SMEs and promote in such a way that using Terra could be a
part of their CSR activities. Specially, in manufacturing industries which contribute to environment
pollution a lot.
Massive social media and Facebook campaigns:
While doing the focused group discussion, people were shown the pictures different scooters
including some mopeds and were asked to identify electric scooters among them. Most of the
respondents chose mopeds because they thought that the electric scooters would be like those. This
highlights the fact that people are still not conscious that electric scooters could look like normal
scooters. So, massive social media campaign is needed to highlight the design and the style aspect of
terra scooters. It is needed to make them aware that e-scooters can also be stylish and fashionable.
Market assessment for Terra assuming people are frustrated by petrol crisis can be misleading:
The result shows that the fuel crisis has certainly bothered the people but that hasn’t been turned
into massive frustration and people have developed a certain level of tolerance. So, petrol pump
activations and human billboard thing could be used to develop a kind of inquisitiveness for the
electric scooters which can induce footfalls to the showroom. But preconceiving the fact that there is
market for e-scooters because people are really frustrated from constant fuel crisis can be misleading.
Massive test ride campaigns:
When respondents were asked to range the features in the electric scooters, most of the respondents
thought that electric scooters have less speed, less power, less performance etc. So, this highlights
the fact that massive test ride campaigns could be done in colleges and public places. Similarly, events
and programs targeting the test ride could also be done. This would ensure that the people experience
terra scooters and it is pretty sure that once people experience it, they would definitely change their
opinion.
Home takeaway campaign
Another thing that could be done is letting people to keep terra scooters for 2-3 days. They could
deposit their existing two-wheelers for 2-3 days at the showroom and can take terra scooters with
them. This would ensure that they would have experience of riding the terra scooters.
Promoting brand and power and performance factor
From the research it was found that power and performance as well as brand is another important
aspect that people look into while buying the two wheelers. Power and performance is something
which seems very good in this scooter. People could experience this with the test ride. Similarly, for
brand value it has backup from the Japanese technology. So that Japan and Japanese technology
aspect could be taken into consideration while promoting Terra as a brand.

Long distance charging stations in the outskirts
Long distance travelling is not too frequent in people. But while doing the focused group discussion,
it was found out that even though people might not go for long distance travelling after all, they still
consider it as a factor while buying the two wheeler. So, facilitating charging stations in the outskirts
of the valley just to let them know that there are charging stations if they really want to go to the
outskirts in weekend; would ensure some kind of assurance that there is no problem going out.
Price factor concern
During research, it was found that regarding the price range also people seemed to be a bit more
hesitant. They said that if they could add Rs.20k more in that price range they could get a “real”
scooter rather than going for the electric variant. So, it is important to give justification to people why
that price range is justifiable in terms of features and values that it gives to the people. Hence, while
campaigning, this thing could also be pushed.
Highlighting changes in environment
According to research it was found that many people opt to change their lifestyles because of the
changes in the environment around them. So, unless there is some kind of rapid movement for electric
scooters, it is very difficult to change the mindset. So, theme of the activations could be something
like: “Let’s be a part of change”.
Strengthening the important aspects of two wheelers
Another 5 important aspects in a two wheelers are: Easy financing, License, Insurance, Number plate
and Blue book. Terra scooters lack in these things. While doing focused group discussion with the
terra owners, it was found that they bought terra scooters just because it didn’t needed license and
registration. This thing might be the USP of the electric scooters but in long run it creates a negative
image. If it really wants to compete with petrol variant, these negative things should be removed and
it should be made competent. So bringing all those things is equally important.
Target market

From the research it is proven that student group or even the student and corporate group might not
be our target market as for now. In fact, our target market could be a reasonably settled 35-45 years
chunk of population working in government offices who have limited mobility (just the daily commute
from office to house). In that segment also if we target the working women segment then that would
be fruitful. Similarly, tying up with the corporate houses as a part of their CSR activities could be
another alternative to push the scooter through.
Annex:
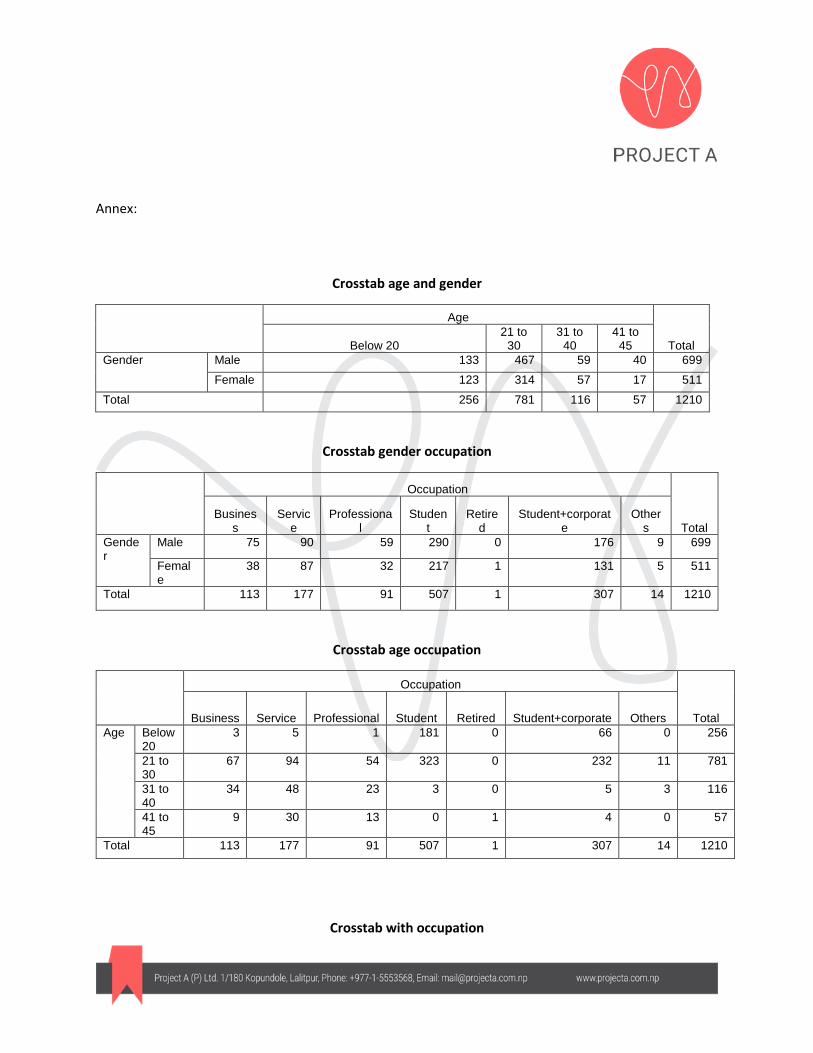
Crosstab age and gender
Age
Total Below 20 21 to
30 31 to
40 41 to
45
Gender Male 133 467 59 40 699
Female 123 314 57 17 511
Total 256 781 116 57 1210
Crosstab gender occupation
Occupation
Total Busines
s Servic
e Professiona
l Studen
t Retire
d Student+corporat
e Other
s
Gender
Male 75 90 59 290 0 176 9 699
Female
38 87 32 217 1 131 5 511
Total 113 177 91 507 1 307 14 1210
Crosstab age occupation
Occupation
Total Business Service Professional Student Retired Student+corporate Others
Age Below 20
3 5 1 181 0 66 0 256
21 to 30
67 94 54 323 0 232 11 781
31 to 40
34 48 23 3 0 5 3 116
41 to 45
9 30 13 0 1 4 0 57
Total 113 177 91 507 1 307 14 1210
Crosstab with occupation

Things that are valued most in life
Group Freedom Independence Comfort Smartness Pride Fashion
Students 71% 66% 49% 43% 36% 15%
Both 69% 60% 48% 46% 36% 25%
Corporate 74% 68% 55% 37% 33% 16.5%
Features to look into while buying two wheelers
Group Brand Design After sales services
Parts availability
Power and performance
Operating cost
Safety Resale Value
Students 50% 41% 19% 37% 61% 32% 52% 15%
Both 58% 40% 27% 36% 41% 24% 49% 13%
Corporate 54% 40% 27% 39% 46% 27% 57% 24%
Factors affecting purchase decision
Group Needs Current trends Ease in mobility Family and peer pressure
Students 76% 32% 69% 11%
Both 75% 36% 64% 12%
Corporate 84% 22% 67% 15%
Factors motivating to buy electric scooter
Group Performance Switching cost Exchange offer Operating cost Better offering from others
Students 50% 30% 35% 43% 30%
Both 44% 39% 53% 31% 26%
Corporate 46% 40% 45% 37% 34%
Crosstab with gender
Things that are valued most in life
Gender Freedom Independence Comfort Smartness Pride Fashion
Male 75% 63% 50% 42% 36% 9%

Female 67% 68% 52% 41% 33% 11%
Features to look into while buying two wheelers
Gender Brand Design After sales services
Parts availability
Power and performance
Operating cost
Safety Resale Value
Male 52% 52% 22% 39% 55% 30% 50% 21%
Female 56% 41% 34% 35% 46% 26% 57% 14%
Factors affecting purchase decision
Gender Needs Current trends Ease in mobility Family and peer pressure
Male 77% 30% 65% 14%
Female 80% 29% 69% 11%
Factors motivating to buy electric scooter
Gender Performance Switching cost Exchange offer Operating cost Better offering from others
Male 46% 38% 40% 39% 29%
Female 48% 32% 45% 37% 31%
Satisfied with the two wheelers or not
Gender Yes No Not sure
Male 44% 23% 33%
Female 39% 16% 45%
Two wheelers in long distance travelling
Gender Very often Not too often Not at all
Male 19% 49% 32%
Female 16% 43% 41%
Thought of buying/ switching to electric scooter
Gender Yes No Not sure
Male 23% 41% 36%

Female 17% 44% 39%