Embed Size (px)
Citation preview

Understanding corruption and firm responses
in cross-national firm-level surveys
Nathan M Jensen1,Quan Li2 andAminur Rahman3
1Department of Political Science, Washington
University in St Louis, USA; 2Department of
Political Science, Texas A&M University, CollegeStation, USA; 3World Bank Group, Washington,
DC, USA
Correspondence:NM Jensen, Department of Political Science,Washington University in St Louis,St Louis, MO 63130, USA.Tel: þ1 314 935 5857;Fax: þ1 314 935 5856;E-mail: [email protected]
Received: 5 December 2008Revised: 27 October 2009Accepted: 2 November 2009Online publication date: 20 May 2010
AbstractThe issue of corruption is important to politicians, citizens, and firms. Since theearly 1990s, a large number of studies have sought to understand the causes
and consequences of corruption employing firm-level survey data from various
countries. While insightful, these analyses have largely ignored two importantpotential problems: nonresponse and potential false response by the firms. We
argue that in politically repressive environments, firms use nonresponse and
potential false response as self-protection mechanisms. Corruption is likelyunderstated in such countries. We test our argument using the World Bank
enterprise survey data of more than 44,000 firms in 72 countries for the period
2000–2005. We find that firms in countries with less press freedom are more
likely to provide nonresponse and false response on the issue of corruption.Therefore ignoring these systematic biases in firms’ responses could result in
serious underestimation of the severity of corruption in politically repressive
countries. More important, these biases are a rich and underutilized source ofinformation on the political constraints faced by the firms. Firm managers can
better evaluate levels of corruption, not only by truthful answers to corruption
questions, but also by nonresponses and false responses to such questions.Journal of International Business Studies (2010) 41, 1481–1504.
doi:10.1057/jibs.2010.8
Keywords: corruption; nonresponse; false response; political freedom; firm-level surveys
UNDERSTANDING CORRUPTION AND FIRM RESPONSESIN CROSS-NATIONAL LEVEL SURVEYS
The issue of corruption has received wide attention in inter-national business (IB) research, where scholars have examinedboth the causes and the consequences of corruption. Early researchon the multinational firm, such as Vernon (1971, 1977) and Wells(1977), identified corruption as a potential cost of doing businessthat was heightened by the obsolescing bargain. In the wake of the1977 US Foreign Corrupt Practices Act, the Journal of InternationalBusiness Studies published various studies examining the legisla-tion’s impact on business (e.g., Graham, 1984; Kim & Barone,1981). Recent scholarship has exploited new survey data andmethods, producing firm-level survey evidence on the causes andconsequences of corruption.1 Our paper contributes to this bodyof work by examining possible nonresponse and false responsebiases in firm-level survey research. We explore how the politicalenvironment influences firm responses to politically sensitivequestions. By doing so, we provide insights into how scholarscan become aware of and investigate these biases, and in some
Journal of International Business Studies (2010) 41, 1481–1504& 2010 Academy of International Business All rights reserved 0047-2506
www.jibs.net

cases use the information contained in the biases tounderstand substantive problems such as corruption.
The topic of corruption is not just of interest toscholars; it is of first-order importance for citizensand firm managers. Corruption is the use of publicoffice for private gains, including practices such ascontract kickbacks in public procurement, simplebribery, nepotism, and outright embezzlement ofpublic property by government officials. Corrup-tion is widely documented as undermining thequality of market and political institutions, distort-ing investment decisions, reducing firm productiv-ity and national economic growth, and affordingundue political influence to those engaged incorruption.2 Therefore understanding the scope,causes, and effects of corruption is important forpolicy reforms that seek to build and strengthenmarket-promoting institutions that improve firmefficiency.
Corruption can have a number of effects on firmsand firm–government relations. It is essentially atax on firms, increasing transaction costs (Rose-Ackerman, 1975a, b, 1999), but its negative impactis greater than a transparent tax, because illegalityrequires secrecy (Schleifer & Vishny, 1993). Thussome firms may simply avoid investments in highlycorrupt countries, which reduces domestic andforeign direct investment (FDI) (Habib & Zurawicki,2002; Knack & Keefer, 1995; Lambsdorff, 2003;Mauro, 1995, 1998; Wei, 2000). Corruption can alsochange the composition of FDI by disadvantagingmultinationals whose parent firms operate incountries with stringent anticorruption standards(Cuervo-Cazurra, 2006).
While corruption decreases investment, it canalso lead firms to adapt to their environment,which results in economic inefficiencies (Kwok &Tadesse, 2006). For example, corruption may forcefirms to partner with domestic firms in order toguard against corrupt politicians, thus influencingthe firm entry strategy (Henisz, 2000; Rodriguez,Siegel, Hillman, & Eden, 2006; Uhlenbruck,Rodriguez, Doh, & Eden, 2006). Luo (2006) arguesthat firms that perceive the host government to becorrupt are less likely to cooperate with it, andmay even decrease their philanthropic activities.Corruption can also lead to major decreases in theprices that firms are willing to pay for local assetsduring mergers and acquisitions (Weitzel & Berns,2006).
In order to fight corruption, scholars and policy-makers have been trying to understand its causes.Many empirical studies of corruption in the last
decade (e.g., Ades & Di Tella, 1999; Mauro, 1995;Treisman, 2000) focused on the country level, andtypically used the expert-perception-based indica-tors of country-level corruption (e.g., the Transpar-ency International Corruption Index, and PoliticalRisk Service’s International Country Risk GuideIndicators). In recent years scholars have started tostudy corruption using firm-level survey data,including the World Bank surveys collected invarious countries.3 These studies use firm-levelcorruption indicators that measure firms’ percep-tions of and their actual experiences with corrup-tion. Hence these analyses provide additionalinsights into the causes of corruption at a differentlevel of analysis using new data.4 The firm-leveldata also allow researchers to explore the variancein firm experiences with corruption within countries.
These firm-level data-based analyses, however,have relied on the firm responses available from thesurveys as they are, assuming that firms providetruthful responses to all questions. These analyseshave therefore largely ignored two important issuesassociated with the firm survey data: (1) firms oftendeliver nonrandom nonresponses to politicallysensitive questions; and (2) firms may provide falseresponses to these politically sensitive questions. Byrelying on available firm responses alone, firm-leveldata-based research into corruption may produceincorrect inferences and erroneous policy recom-mendations.5
More important, we argue that the generation ofnonresponse and potential false response is system-atically related to the national political environ-ment in which firms operate. In environments withless political freedom, firms fear that their privacycould be violated and the confidentiality of theirresponses compromised: hence, if they state theirtrue beliefs or actual bribery experiences, govern-ments could punish them. Firms may employnonresponse and false response as self-protectionmechanisms in these environments. As a result,corruption is probably understated. We demon-strate empirically at both the national and the firmlevel that firms in countries with lower levels ofpress freedom are more likely to evade the corrup-tion question, and that they also are more likely toprovide potential false responses, that is responsesthat are inconsistent with outside evaluations ofthe corruption environment. In light of thesefindings, we conclude that previous research thatrelies on the firm-level survey data as they arehas underestimated the severity of corruption incountries with lower levels of press freedom.
Understanding corruption and firm responses Nathan M Jensen et al
1482
Journal of International Business Studies

Our research makes two important contributions.The first contribution is to the literature oncorruption, with implications for IB research.Scholars that use these firm-level survey data onthe issue of corruption (e.g., Fisman & Gatti 2006;Hellman, Jones, & Kaufmann, 2006; Hellman &Kaufmann, 2004) have paid limited attention tothe impact of nonresponse and false response onthe assessment of corruption. We demonstrate thatthese problems are present in the firm-level surveydata from countries with lower levels of pressfreedom. We also show that cross-national varia-tions in press freedom explain variations in thesetypes of responses even after we control for variousfirm and country attributes. Hence the degree ofcorruption is likely to be more severe in countrieswith less political freedom than the firm surveydata lead us to believe. Equally important, model-ing nonresponse and false response providesinformation on how the political environmentconstrains firms.
Our second contribution is to the firm-levelsurvey literature. In national and cross-nationalsurvey research, nonresponse is considered a nui-sance that may contaminate statistical inferencesbased on the response data (e.g., Sherman, 2000).There is very limited research in cross-nationalsurveys of the data generation process of nonre-sponse (for an exception, see Berinsky & Tucker,2006). But a large amount of research in publicopinion, health care research, economics, finance,IB, and marketing demonstrates that the datageneration process of nonresponse is not randombut often systematic (e.g., Holmes & Schmitz, 1996;Pickreign & Gabel, 2005; Riphahn & Serfling,2005). Our research confirms that the data genera-tion process of nonresponse on corruption in theWorld Bank firm-level surveys is systematicallyrelated to cross-national institutional differences.We also consider the problem of false response,which has rarely received attention in cross-national survey research. We demonstrate and alertcross-national survey researchers to the potentialfalse response problem, and discuss how this biascan be informative. Rather than a nuisance, non-response and false response can be a valuable sourceof information to researchers.
Thus we offer a number of suggestions for IBresearchers who utilize firm-level survey data toexamine patterns of corruption. First, scholars canmake great strides from simply reporting nonre-sponse on single items of a survey (‘‘item non-response’’), in the same way that scholars diligently
report other forms of nonresponse (such as ‘‘unitnonresponse’’). Second, we highlight the value ofcross-national research, specifically in samplingmultinational enterprises (MNEs) with operationsin multiple countries to identify and possiblycorrect for the nonresponse and false responsebiases by exploiting information on the causes ofsuch biases. Finally, we encourage researchers totake advantage of existing surveys that ask a batteryof both non-sensitive and politically sensitivequestions. By linking questions, scholars can lever-age existing data to dig deeper into how politicsaffects firms.
The rest of the paper proceeds as follows. Thesecond section provides a conceptualization ofnonresponse and potential false response problemsin the firm-level surveys, and presents somedescriptive evidence. The third section offers atheory that looks into the institutional origin ofthese problems. The fourth section tests our argu-ment at the national and firm levels. We discussthe implications of these results for IB research inthe fifth section, and the sixth section concludes.
RESPONSES TO CORRUPTION QUESTIONSIN FIRM-LEVEL SURVEYS
Cross-national firm-level surveys often involvepolitically sensitive questions that may pose twoproblems for quality data collection. First, sensitivequestions in a survey may elicit nonresponses fromfirms that intend to evade trouble from thegovernment, resulting in the common problem ofitem nonresponse in survey research. Second, somegovernments may be heavily involved in executingthese surveys. Government involvement may argu-ably restrict the type of questions to be asked, orrequire firms to fill out these surveys to generate ahigh response rate to look good. In these cases,when a firm is compelled to deliver a responsebut fears possible government reprisal that mayresult from a certain response, it may provide a falseresponse.
Figure 1 provides a conceptualization of the datageneration process in cross-national firm-levelsurveys, assuming that the same question is askedof all firms in different countries. As shown, thetruthful response is but one of three possibleoutcomes of the data generation process. Non-response and false response are the other twopossible outcomes. When scholars model thecauses of the available response data, they oftenassume that all responses are truthful, and thatthe effect of nonresponse is independent of the
Understanding corruption and firm responses Nathan M Jensen et al
1483
Journal of International Business Studies

right-hand side variables or the available responses.We will discuss in the next section why these twoassumptions could be erroneous and problematic.Before we do so, it is useful to clarify the meaningsof nonresponse and false response, and demon-strate that nonresponse and false response arehighly likely.
It is important to note that we use the labels ‘‘falseresponse’’ and ‘‘truthful response’’ for brevity. Aswe outline in the next section, there is a vastliterature on survey responses and the complicatedmechanisms that link respondents to answers onsurvey questions. Our meaning of a ‘‘false response’’is similar to that of a ‘‘reticent respondent’’ in Azfarand Murrell (2009: 388):
We define a reticent respondent as one who gives know-
ingly false answers with a nonzero probability when honest
answers to a specific set of survey questions could lead
to the inference that the respondent might have committed
a sensitive act.
We can take a similar position on nonresponse,where nonresponse could be driven by a numberof factors, one of them being a firm’s concernsabout the sensitive nature of a question. Yet it isimportant to remember that labels of ‘‘truthful’’ or‘‘false response’’ are probabilistic, and as analystswe have no way to directly assert that a specificanswer by a firm is true or false. Hence we focuson whether, in answering politically sensitivequestions, firms exhibit a systematic bias thatcorrelates with the attributes of cross-nationalpolitical environments. We label this bias the‘‘potential for false response’’, given that falseresponses are not directly observable in these data.
We study the extent to which nonresponse andthe potential for false response have affected thedata gathered for the most general questionregarding the impact of corruption on firms in
the World Bank Productivity and Investment ClimatePrivate Enterprise Surveys (PICS) of some 44,000 firmsin about 72 countries. These investment climatesurveys are designed to
allow (i) better identification of the features of the
investment climate that matter most for the productivity
and hence income growth, especially for poor men and
women, (ii) tracking of changes in the investment climate
within a country, and (iii) comparison of countries or
regions within countries. (World Bank, 2003: 1)
The PICS survey asks questions on operations of thebusiness along with questions on the barriersto growth and productivity and the overall invest-ment environment. The World Bank collects thesedata at the level of the firm (both foreign anddomestic), aggregates them, and broadly dissemi-nates the summary findings through its websitesand publications.6
Questions are put directly to firm managers byenumerators, and each survey on average takesabout 1–1.5 h to administer. Questions on theinvestment environment and background informa-tion (the majority of the questions) are asked tofirm managers, while a set of detailed financialquestions are administered to accountants. Whileeach country team can add questions of specialinterest to the team, core questions cannot bedropped or reworded. Thus the World Bank utilizesa comparable survey instrument and methodologywith the goal of using the PICS survey to compareinvestment environments across countries. Al-though the survey instrument undergoes a seriousvetting process including peer review, the surveyimplementation is administered through regionsand country teams (World Bank, 2003: 2–3). Whileexplaining all the details of the survey design andimplementation are beyond the scope of this paper,we note that most relevant to our analysis is therole of each national government in administeringthe survey.
As summarized in the PICS Implementation Manual (World
Bank, 2003: 4):
ICAs should be conducted with the knowledge and support
of relevant government authorities. The Region, when
initiating an ICA, should assure relevant counterparts are
engaged and supportive. Government buy-in at the initial
stages is necessary for later implementation of ICA recom-
mendations and will increase the positive impact on the
business climate.
This need for heavy government involvement canaccentuate the problems of nonresponse and false
Question
Nonresponse Response
False response Truthful response
Figure 1 Conceptualization of data generation process in
World Bank firm-level surveys.
Understanding corruption and firm responses Nathan M Jensen et al
1484
Journal of International Business Studies

response we identified above. The PICs manualcontinues:
Given the sensitive nature of the data, having government
officials directly involved in data collection is likely to
reduce managers’ willingness to speak frankly about the
business environment. In some countries it may not be
possible to operate without the permission of the national
statistics agency and other ministries involved in regulating
and developing industry. In addition, close coordination
with the statistics agencies is necessary to obtain the sample
frame and other information. However, the government
will not be given the raw data or any information that
allows them to identify the responses of individual firms.
While World Bank officials make assurances aboutthe confidentiality of the respondent’s identity,nonresponse and the potential for false responseremain as confounding issues. The concern overfalse response has subsequently led to some designchange in the World Bank surveys. The newestround of enterprise survey questionnaires since 2007requires the enumerator to report at the end ofthe interview whether, in the enumerator’s view, therespondent provided truthful, somewhat truthful, ornot truthful responses to the questions regardingopinions and perceptions (World Bank, 2007).
Survey administrators also have begun to makechanges to address nonresponse and false response.One method they use is for enumerators torandomize response questions on politically sensi-tive topics. For example, on a corruption questionwhere a firm manager is asked whether the firm wasforced to pay a bribe in a certain circumstance, therespondent flips a coin and is instructed to say ‘‘yes’’if a head was flipped or if the firm was forced to paya bribe. Unfortunately, this method has limitedeffectiveness in dealing with nonresponse and falseresponse (Lensvelt-Mulders, Hox, van der Heijden,& Maas, 2005). Azfar and Murrell (2009) provideguidance on how to better implement randomizedresponses in questionnaires, but they provide noguidance on how to use existing questionnairesthat do not implement this method. Should wethrow out existing surveys? We argue that non-response and patterns of potential false response inexisting surveys are actually a valuable resource forresearchers.
Our study focuses on a politically sensitivequestion in the PICS survey. While this questionfocuses on corruption, we stress that our theorybroadly relates to other politically sensitive ques-tions. The question is as follows:7
Please tell us if corruption is a problem for the operation
and growth of your business. If corruption poses a problem,
please judge its severity as an obstacle on a five-point scale:
0¼no obstacle, 1¼minor obstacle, 2¼moderate obstacle,
3¼major obstacle, 4¼very severe obstacle.
Among the 72 countries where this question wasadministered, on average, 418 firms per countrywere surveyed. While the overall response rate isquite high (94.6%), the variations in response ratesacross countries are quite large as well (rangingfrom 54% to 100%). Descriptive statistics of thesedata are in the Appendix.
While nonresponse is directly observable fromthe data, it is not possible to demonstrate thepresence of false response directly. However, anec-dotal evidence does exist to lead one to suspectfalse response. For example, among the firms thatwere surveyed and responded, 70% of the firmsin China and 60% in Uzbekistan reported thatcorruption is not a problem for them. In Eritrea,92% of the responding firms said that corruption isnot a problem; the reported percentage is compar-able to those in Germany and Ireland, and higherthan those in Greece and Spain. These reportedpercentages also stand in sharp contrast to thehigh levels of corruption in these countries, asperceived by external observers associated withTransparency International. This pattern of discre-pancy is obviously consistent with the possibilityof false responses by firms. Thus we label the typeof responses that causes such discrepancy as‘‘potential false responses’’, since they are consis-tent with our expected pattern of false response,yet it is impossible to prove that these evaluationsof managers are indeed false responses.
If nonresponse and false response are random,statistical inferences using available data are valid.However, if nonresponse and false response arecorrelated in a systematic manner with thosefactors that explain the response patterns, infer-ences based on available response data alone willbe problematic. In the next section, we offer anargument for how the degree of political freedomin a country is related to nonresponse and falseresponse on the corruption question.
THEORETICAL FRAMEWORKIn firm-level surveys, managers are asked bothsubjective and objective questions on how corrup-tion influences the firm and other similar firms.Scholars in mass public opinion have laid thefoundation for how individuals respond to surveys(see Berinsky, 2004). Zaller and Feldman (1992)argue that individuals are sometimes inconsistent
Understanding corruption and firm responses Nathan M Jensen et al
1485
Journal of International Business Studies
across surveys, or even across different questionswithin one survey. This is not a violation ofrationality; rather, Zaller and Feldman argue,individuals’ answers are drawn from an underlyingdistribution of beliefs. For simple and straightfor-ward questions, individuals answer questions in aconsistent manner. For ‘‘hard’’ questions thatrequire either recalling very specific knowledgeor making cognitive efforts, individuals may giveinaccurate responses, or choose not to answer(Carmines & Stimson, 1980). In this project weare not addressing these issues, and our focus onelite-level surveys of firm managers mitigates manyof the problems associated with poorly informedrespondents.
We argue that a key determinant of nonresponseand potential false response on corruption ques-tions is the degree of political freedom in the hostcountry. Like Rosendorff and Vreeland (2006), weargue that some political leaders have the incentiveto limit information that is critical for the govern-ment, providing pressures on firms to either notrespond or provide false responses to politicallysensitive questions. While Rosendorff and Vreeland(2006) model the government’s incentive tolimit information flows as a function of politicalregimes, we focus on the consequences of restrict-ing information flows on firm-level corruptionsurveys. Thus some governments have incentivesto provide detailed public information, even aboutpolitically sensitive issues. Other governmentslimit political freedom by tightly controllingthe media and repressing the freedom of thepress to control information flows. We believe thisis an uncontroversial point, given many obviousexamples of governments restricting informationflows.
We argue that firms in some countries fear thatsurvey responses, though officially anonymous,could be monitored by agents of the host govern-ment.8 The government may retaliate against firmsthat provide answers that damage its reputation.9
In some countries this is relatively obvious, wherethe government controls information flows andrepresses outspoken private citizens.10 Where poli-tical freedom is low in degree, businesses may bepenalized for their responses that conflict withthe preferences of the governments. In contrast,where political freedom is high, the rights ofmanagers to speak their mind tend to be betterrespected and protected by law. Such cross-nationalvariations in information censorship, and therelated degree of the underlying fear of government
reprisal, can help to explain patterns in nonre-sponse and false response.
Therefore our argument on how the governmentmay influence the responses of firms mirrors theargument in the literature on vote-buying inelections. Numerous scholars in political sciencehave examined how political parties can influencesecret ballots through a number of mechanisms,including monitoring by using informal networksto ascertain how individuals vote (Stokes, 2005),and examining patterns of turnout and aggregatevoting (Nichter, 2008). Within our context, govern-ments can monitor and can attempt to use informalmechanisms to ascertain how firms respondedor, even more likely, gather information on whichfirms responded to surveys questions and thendraw inferences on the nature of the responses,based on aggregate results. While this monitoringis imperfect, it can systematically alter the incen-tives of voters to cast honest votes or, in our case,the incentives of managers to respond at all orrespond truthfully.
This parallel between firm-level surveys andvoting is not limited to monitoring. It also affectsin other ways the incentives for nonresponseand false response. Completing the World Banksurvey, like voting, provides few direct benefits tothe individual respondents.11 Thus, in both surveyresponses and voting, individuals are engaging inactivities that, if truly anonymous, are of both lowcost and low benefit. Some firms may decline torespond to any part of the survey, although this isnot an option available in countries that requirefirms to participate in these surveys. Yet if surveyresponses are monitored by the government, thisaffects the incentives to answer honestly. Therefore,in environments with less political freedom, firmsare more likely to provide nonresponses and falseresponses to politically sensitive questions.12
EMPIRICAL ANALYSISWe test the relationship between press freedom andfirm responses in two separate analyses, each atboth the country and firm levels. We begin with thenonresponse test and then turn to false response.We provide descriptive statistics for all variablesand correlation matrices at both levels in theAppendix.
Testing the Impact of Press Freedom onNonresponse at Country and Firm LevelsFor the country-level analysis of nonresponse, thedependent variable is the percentage of firms in a
Understanding corruption and firm responses Nathan M Jensen et al
1486
Journal of International Business Studies

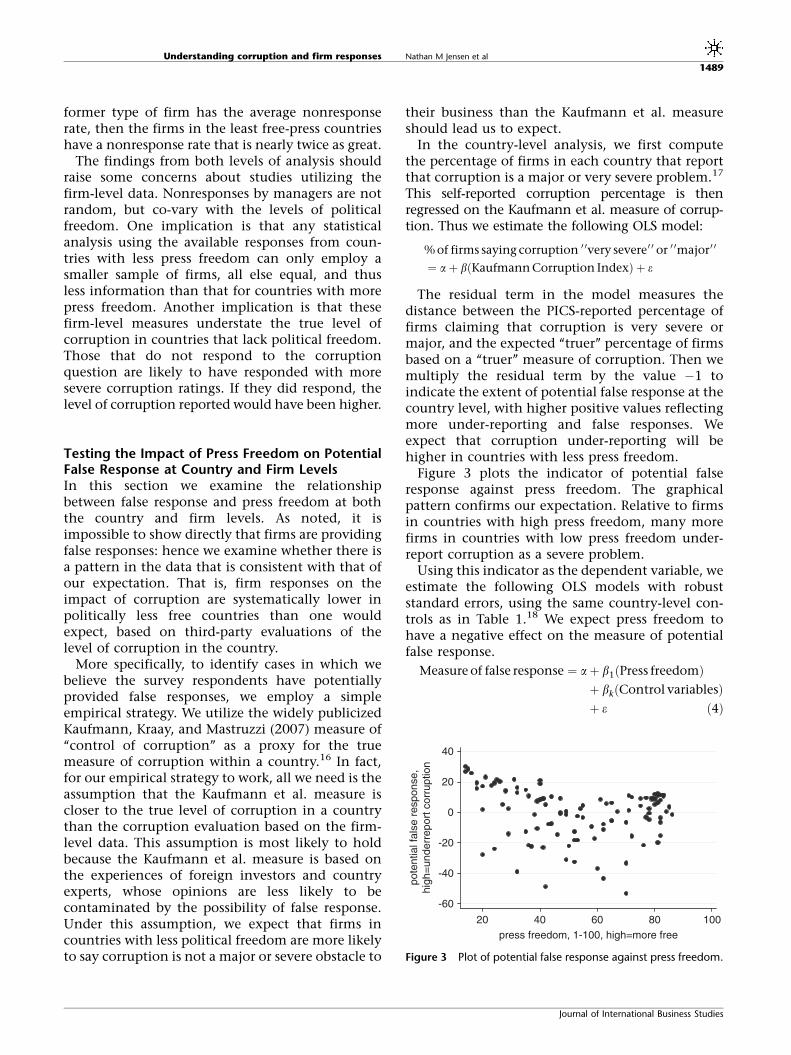
country that answered the corruption question,that is the average firm response rate for eachcountry in a year. The key independent variable isthe continuous measure of press freedom from theFreedom House data. It ranges from 0 to 100, withhigher values indicating less freedom. In ouranalysis, the press freedom indicator is transformedto equal 100 minus the Freedom House pressfreedom indicator, so that higher scores implymore press freedom.13 We also construct a compo-site indicator of political freedom, based on thecivil liberties and political rights variables from theFreedom House. It ranges from 2 to 14, with highervalues reflecting greater freedom. As shown in theAppendix, press freedom and the composite poli-tical freedom indicator are correlated at 0.95. Theresults for using these two measures are similar inall regressions. Hence we focus on the results usingpress freedom, and present the tests of politicalfreedom in the Appendix in Tables A2–A4.
Figure 2 plots the country-level firm response rateagainst the level of press freedom. The pattern isconsistent with our expectation. In countries withhigh levels of press freedom the response rate isalways higher than 90%, but in countries with lowlevels of press freedom the response rate variesbetween 53% and 100%.
Previous analyses based on firm-level data haveseveral findings that are useful for determining thecontrol variables for our statistical model. Severalstudies (e.g., Batra, Kaufmann, & Stone, 2003; Gray,Hellman, & Ryterman, 2004) find that, comparedwith state-owned enterprises, private firms paymore of their revenues as bribes, pay bribes moreoften, and perceive corruption as more of anobstacle. Also, relative to large firms, small firmspay bribes in greater amount and frequency.Relative to older firms, younger firms pay morebribes, and do so more often. Relative to domesticfirms, foreign firms pay fewer bribes and less often.Relative to firms in rural areas, firms in cities paybribes more often and with greater frequency. Toavoid spurious regression, these firm-level variablesshould be controlled for at both the national andfirm levels. Thus our control variables include logof gross national income (log GNI per capita) percapita, the percentage of firms that have fewer than20 employees (Small Firms), the percentage of firmswith between 20 and 99 employees (MediumFirms), the percentage of firms with foreign own-ership (Foreign Firms), the percentage of firms thatare wholly or partially government owned (State-owned Firms), and the proportion of firms in each
sector (Manufacturing, Services, Agroindustry, andConstruction). All these variables come from theWorld Bank PICS survey (World Bank, 2002). Ourfirst test estimates a country-level model of non-response. Given that the dependent variable iscensored between 0 and 100, we estimate thefollowing model with Tobit and robust standarderrors. We expect increases in press freedom toincrease the firm response rate in a country.14
Country response rate ¼ aþ b1ðPress freedomÞþ bkðControl variablesÞþ e ð1Þ
The results from Tobit regressions of the country-level nonresponse are presented in models 1 and 2in Table 1. In model 1 we present the baselinespecification, which includes only control vari-ables. In model 2 we include the continuousmeasure of press freedom. While we find that thestructure of the sample of firms, including sector,size, and ownership, has very little impact on thecountry-level response rate, press freedom has astatistically significant and positive impact. Coun-tries with lower levels of press freedom havesignificantly lower firm response rates, and thushigher nonresponse rates.
The impact of press freedom on nonresponserates is substantial. As noted above, the responserate for this question among 72 countries is about94.6% on average, ranging from 53% to 100%, witha standard deviation of 6.76. All else equal, acountry with the lowest in-sample level of pressfreedom (14, e.g., Belarus or Uzbekistan) is pre-dicted to have a firm nonresponse rate about 8%lower (model 2) than a country with the highest in-sample level of press freedom (86, e.g., Portugal).15
50
60
70
80
90
100
coun
try
resp
onse
rat
e
20 40 60 80 100
press freedom, 1-100, high=more free
Figure 2 Plot of country response rate against press freedom.
Understanding corruption and firm responses Nathan M Jensen et al
1487
Journal of International Business Studies

This difference amounts to 1.17 standard devi-ations of the dependent variable. As noted, onaverage, 418 firms per country were surveyed onthis question among the 72 countries. According tothe substantive effect estimate of 8%, on average,33 more firms will not answer this corruptionquestion in the lowest press freedom country,relative to those in the highest press freedomcountry.
Our second test of nonresponse utilizes thefirm-level responses to evaluate the impact ofpress freedom on the probability of nonresponseat the individual level. The dependent variableFirm Response Dummy is coded 1 if a firm answersthe corruption question and 0 if it skips it. Weemploy the same set of control variables as inmodels 1 and 2, although they are now measuredat the firm level, except per capita GNI andpress freedom. Thus we now have a battery ofdummy variables on firm size, ownership, andsectors as control variables. We estimate thefollowing probit model with robust standarderrors clustered by country. We expect press free-dom to have a positive impact on the likelihood
that an individual firm will answer the corruptionquestion.
Firm response dummy ¼ aþ b1ðPress freedomÞþ bkðControl variablesÞþ e ð2Þ
The results from probit regressions are presented inmodels 3 and 4 in Table 1. Model 3 is the baselinespecification, and model 4 includes the continuousmeasure of press freedom. The effect of pressfreedom is positive and statistically significant.Consistent with our expectation, firms are morelikely to give nonresponses to the corruptionquestion in environments with lower levels of pressfreedom. These findings at the firm level areconsistent with our country-level results.
Relative to the firms in countries with the highestlevel of press freedom (86), those firms in countrieswith the lowest level of press freedom (14) have aprobability of nonresponse that is 5.07% higher.This is about as large as the average nonresponserate in the sample (5.36%). If we assume that the
Table 1 Impact of press freedom on response rate at country and firm levels
Country level (1) Tobit (2) Tobit Firm level (3) Probit (4) Probit
Press freedom 0.128** Press freedom 0.009***
[0.050] [0.003]
log GNI per capita 2.048** 0.310 log GNI per capita 0.080* �0.302
[0.947] [0.888] [0.048] [0.048]
Small firms (%) �0.013 �0.056 Small firm dummy �0.161** �0.190***
[0.084] [0.072] [0.072] [0.072]
Medium firms (%) 0.186 0.183 Medium firm dummy �0.018 �0.025
[0.127] [0.118] [0.045] [0.047]
Foreign firms (%) 0.282 0.0206 Foreign-owned firm dummy 0.011 0.009
[0.205] [0.182] [0.047] [0.048]
State-owned firms (%) �0.183* �0.178* State-owned firm dummy �0.305*** �0.284***
[0.103] [0.100] [0.054] [0.051]
Manufacturing (%) 0.091 �0.174 Manufacturing dummy 0.163 0.109
[0.446] [0.459] [0.179] [0.182]
Service sector (%) 0.079 �0.187 Service sector dummy �0.119 �0.127
[0.495] [0.513] [0.145] [0.163]
Agroindustry (%) 0.137 �0.209 Agroindustry dummy 0.385 0.164
[0.547] [0.568] [0.240] [0.236]
Construction (%) �0.138 �0.269 Construction dummy �0.147 �0.166
[0.397] [0.397] [0.162] [0.174]
Constant 65.846 100.510** Constant 1.235*** 1.690***
[48.71] [49.095] [0.457] [0.405]
Observations 106 104 Observations 45,100 44,552
R2 0.06 0.07 Pseudo R2 0.02 0.03
*Significant at 10%; **significant at 5%; ***significant at 1%.Robust standard errors in brackets.
Understanding corruption and firm responses Nathan M Jensen et al
1488
Journal of International Business Studies
former type of firm has the average nonresponserate, then the firms in the least free-press countrieshave a nonresponse rate that is nearly twice as great.
The findings from both levels of analysis shouldraise some concerns about studies utilizing thefirm-level data. Nonresponses by managers are notrandom, but co-vary with the levels of politicalfreedom. One implication is that any statisticalanalysis using the available responses from coun-tries with less press freedom can only employ asmaller sample of firms, all else equal, and thusless information than that for countries with morepress freedom. Another implication is that thesefirm-level measures understate the true level ofcorruption in countries that lack political freedom.Those that do not respond to the corruptionquestion are likely to have responded with moresevere corruption ratings. If they did respond, thelevel of corruption reported would have been higher.
Testing the Impact of Press Freedom on PotentialFalse Response at Country and Firm LevelsIn this section we examine the relationshipbetween false response and press freedom at boththe country and firm levels. As noted, it isimpossible to show directly that firms are providingfalse responses: hence we examine whether there isa pattern in the data that is consistent with that ofour expectation. That is, firm responses on theimpact of corruption are systematically lower inpolitically less free countries than one wouldexpect, based on third-party evaluations of thelevel of corruption in the country.
More specifically, to identify cases in which webelieve the survey respondents have potentiallyprovided false responses, we employ a simpleempirical strategy. We utilize the widely publicizedKaufmann, Kraay, and Mastruzzi (2007) measure of‘‘control of corruption’’ as a proxy for the truemeasure of corruption within a country.16 In fact,for our empirical strategy to work, all we need is theassumption that the Kaufmann et al. measure iscloser to the true level of corruption in a countrythan the corruption evaluation based on the firm-level data. This assumption is most likely to holdbecause the Kaufmann et al. measure is based onthe experiences of foreign investors and countryexperts, whose opinions are less likely to becontaminated by the possibility of false response.Under this assumption, we expect that firms incountries with less political freedom are more likelyto say corruption is not a major or severe obstacle to
their business than the Kaufmann et al. measureshould lead us to expect.
In the country-level analysis, we first computethe percentage of firms in each country that reportthat corruption is a major or very severe problem.17
This self-reported corruption percentage is thenregressed on the Kaufmann et al. measure of corrup-tion. Thus we estimate the following OLS model:
% of firms saying corruption 0 0very severe0 0 or 0 0major0 0
¼ aþ bðKaufmann Corruption IndexÞ þ e
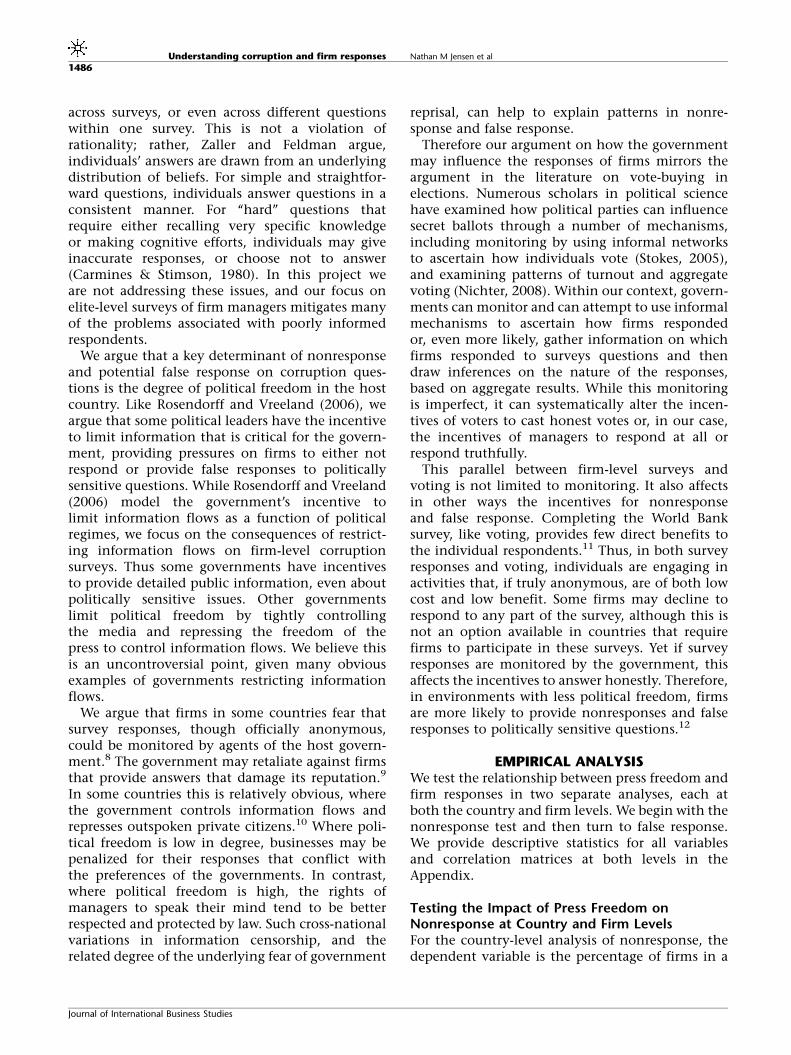
The residual term in the model measures thedistance between the PICS-reported percentage offirms claiming that corruption is very severe ormajor, and the expected ‘‘truer’’ percentage of firmsbased on a ‘‘truer’’ measure of corruption. Then wemultiply the residual term by the value �1 toindicate the extent of potential false response at thecountry level, with higher positive values reflectingmore under-reporting and false responses. Weexpect that corruption under-reporting will behigher in countries with less press freedom.
Figure 3 plots the indicator of potential falseresponse against press freedom. The graphicalpattern confirms our expectation. Relative to firmsin countries with high press freedom, many morefirms in countries with low press freedom under-report corruption as a severe problem.
Using this indicator as the dependent variable, weestimate the following OLS models with robuststandard errors, using the same country-level con-trols as in Table 1.18 We expect press freedom tohave a negative effect on the measure of potentialfalse response.
Measure of false response ¼ aþ b1ðPress freedomÞþ bkðControl variablesÞþ e ð4Þ
-60
-40
-20
0
20
40
pote
ntia
l fal
se r
espo
nse,
high
=un
derr
epor
t cor
rupt
ion
20 40 60 80 100press freedom, 1-100, high=more free
Figure 3 Plot of potential false response against press freedom.
Understanding corruption and firm responses Nathan M Jensen et al
1489
Journal of International Business Studies

These results are presented in models 1–3 ofTable 2. Model 1 is the baseline specification, andmodel 2 adds press freedom. It is worth noting thatthe four sector variables introduce very severemulticollinearity to these models, with their VIFscores (ranging from 27 to 633) much higher thanthe typical threshold of 10 for serious multicolli-nearity. Thus in model 3 we exclude the four sectorvariables to establish the robustness of the results.Both models 2 and 3 demonstrate that firms incountries with less press freedom are more likely tohave higher values for the measure of potentialfalse response. This indicates that more firms incountries with less political freedom tend to under-state the severity of corruption.19 Using model 2 tocompute the marginal effect, we find that, relativeto the countries with the highest press freedom,those with the lowest press freedom have theirmeasures of potential false response higher by 15.2(or 0.90 standard deviations). The substantiveeffect is even larger based on model 3, which does
not suffer from serious multicollinearity. Thedifference is as large as 23 (or 1.32 standarddeviations of the potential false response measure).Hence the impact of press freedom on falseresponse is substantial.
One may question that our results rely tooheavily on the premise that the Kaufmann et al.measure of corruption is closer to the true level ofcorruption, and thus may not be robust under analternative indicator of the true corruption level.An innovative objective indicator of corruptionis the Fisman and Miguel (2007) measure, which isthe number of unpaid parking tickets in New YorkCity per diplomat for each country. This novelmeasure of corruption mitigates some of themeasurement issues of other corruption measures,though one should caution that the corruption ofdiplomats in New York correlates with, but may notbe comparable to, the type of corruption in thehost country that affects firm operations. Still, asa robustness test, we re-estimate models 1–3 in
Table 2 Impact of press freedom on potential false responses at country level
Residuals from Kaufmann et al. measure
of corruption
Residuals from Fisman and Miguel
measure of corruption
(1) OLS (2) OLS (3) OLS (4) OLS (5) OLS (6) OLS
Press freedom �0.211* �0.319*** �0.085 �0.161*
[0.126] [0.103] [0.119] [0.096]
log GNI per capita �0.205 2.735 6.672*** 3.741** 4.925** 8.407***
[1.438] [2.300] [1.582] [1.558] [2.256] [1.544]
Small firms (%) �0.213 �0.143 0.046 �0.173 �0.145 0.030
[0.192] [0.188] [0.136] [0.188] [0.192] [0.138]
Medium firms (%) �0.076 �0.075 �0.024 �0.037 �0.041 0.028
[0.274] [0.264] [0.212] [0.282] [0.283] [0.227]
Foreign firms (%) �0.162 �0.040 0.114 �0.153 �0.108 0.074
[0.275] [0.284] [0.234] [0.277] [0.294] [0.247]
State-owned firms (%) 0.630** 0.639** 1.171*** 0.579** 0.583** 1.133***
[0.249] [0.251] [0.205] [0.268] [0.271] [0.244]
Manufacturing (%) �0.543 �0.103 �0.646 �0.464
[0.751] [0.803] [0.784] [0.841]
Service sector (%) �0.402 0.038 �0.485 �0.302
[0.798] [0.844] [0.838] [0.890]
Agroindustry (%) �0.833 �0.254 �0.707 �0.466
[0.881] [0.936] [0.927] [0.990]
Construction (%) 0.236 0.454 �0.185 �0.097
[0.795] [0.808] [0.816] [0.837]
Constant 53.552 �4.177 �46.347*** 33.222 9.715 �67.390***
[82.644] [88.999] [13.832] [86.867] [94.936] [16.514]
Observations 106 104 104 103 101 101
R2 0.45 0.47 0.43 0.43 0.43 0.39
*Significant at 10%; **significant at 5%; ***significant at 1%.Robust standard errors in brackets clustered for observations in a given country.
Understanding corruption and firm responses Nathan M Jensen et al
1490
Journal of International Business Studies

Table 2 using the residual measure of potentialfalse response based on the Fisman and Miguel(2007) parking ticket data. These results arereported in models 4–6 in Table 2. In these models,press freedom continues to reduce potentialfalse response. The effect is not statistically sig-nificant in model 5, owing to the severe collinearityproblem, and becomes statistically significantin model 6 without the sector variables. Theseresults largely confirm our findings based on theKaufmann et al. measure. We also note that ourresults are not driven by a small number ofoutliers.20
Like the nonresponse case, we also test the impactof press freedom on false response at the firm level.Our empirical strategy is similar to the one usedat the country level. We code firm responses of‘‘very severe’’ or ‘‘major’’ to the corruption questionas 1, and 0 otherwise. We then run a simple probitmodel:
Firm responseðcorruption very severe or majorÞ¼ aþ bðKaufmann Corruption IndexÞ þ e ð5Þ
From the model, we obtain the predicted prob-ability of firms indicating corruption is very severeor major, and then construct a firm-level measureof the likelihood of potential firm false responsewith the following formula:
ðfirm response dummy� predicted probabilityÞ� � 1
Higher values on this measure imply greaterlikelihood that firms will reply that corruption isnot a very severe or major issue when theKaufmann et al. measure indicates that it is. Whilewe cannot conclusively prove that this preciselymeasures the degree of false response, the indicatorshould co-vary with the degree of false response.Hence it measures the likelihood of potential firmfalse response.
Using this measure as the dependent variable, weestimate the following OLS model with robuststandard errors clustered by country. We expectpress freedom to reduce the likelihood of eachindividual firm providing a false response on theissue that corruption is very severe or major.
Likelihood of potential firm false response
¼ aþ b1ðPress freedomÞþ bkðCountry- and firm-level controlsÞþ e ð6Þ
The statistical results are presented in Table 3. Asin Table 2, we estimate six models, with the firstthree based on the Kaufmann et al. measure ofcorruption and the second three based on theFisman and Miguel measure. As expected, higherlevels of press freedom reduce the likelihoodthat an individual firm’s assessment of corruptionseverity will be lower than one would expectbased on the Kaufmann et al. corruption indexor the Fisman and Miguel measure of unpaidparking tickets, although it is worth notingthat the results using the Fisman and Miguelmeasure are not as strong, owing to severemulticollinearity.
The impact of press freedom on potential falseresponse at the firm level is also substantivelyimportant. According to model 2 in Table 3, relativeto firms in the countries with the highest pressfreedom, firms in the countries with the lowestpress freedom can expect their likelihood ofpotential firm false response to be higher by 0.22.This is nearly half of one standard deviation (0.45)of the dependent variable.
Testing Effects of Political Freedom and OutsideCorruption Evaluation on PICS Firm PerceptionsHow does our argument regarding nonresponseand false response relate to existing explanationsof corruption? According to one alternative argu-ment, if people do not identify corruption as aconstraint on their firms in a country wherecorruption is common, that does not imply theyhave responded falsely. It may mean that they donot find it problematic, and they accept corruptionas a fact of life. A second related alternativeargument would go even further and suggest that,in such an environment, many firms may find thatthe corrupt system is beneficial in terms of gettingthings done more promptly (the widely known‘‘greasing the wheel’’ hypothesis). Under bothalternative interpretations, firms in corrupt coun-tries that do not identify corruption as a constraintmay be responding truthfully from their ownprivate perspective, and may even regard theexistence of corruption as a source of competitiveadvantage. While political competition and trans-parency reduce the benefits from corruption, firmsin more authoritarian societies may find corruptionmore beneficial. Hence, in analyzing the questionof corruption as a constraint on business, onecannot start from the premise that all firms findcorruption problematic.
Understanding corruption and firm responses Nathan M Jensen et al
1491
Journal of International Business Studies

Table 4 presents the results for four probit models.The dependent variable equals 1 when a firm inthe PICS survey reports that corruption is a ‘‘verysevere’’ or ‘‘major’’ obstacle, and 0 otherwise.The key independent variables include politicalfreedom, press freedom, the Kaufmann et al. cor-ruption index, and/or the Fisman and Miguelmeasure of unpaid parking tickets in differentmodels. The controls are typical co-variates asbefore.
Interestingly, across the models, the Kaufmannet al. corruption index and the Fisman and Miguelmeasure of corruption are both highly significantand positive. Firms in more corrupt countries(according to either the Kaufmann et al. corruptionindex or the Fisman and Miguel measure) are morelikely to report corruption as a very severe or majorproblem for them. In other words, a significantnumber of firms in the PICS survey find corruptionto undermine their business when outside evalua-tions find the levels of corruption in their countriesto be high. This evidence, based on the PICS survey,
directly contradicts the notion that firms considercorruption as being either irrelevant or evenbeneficial for business.
The other intriguing finding from Table 4 is that,across the models, press freedom and politicalfreedom have positive coefficients that are eitherstatistically significant or insignificant (most likelydue to the confounding influence of severe colli-nearity). Firms in countries with more press free-dom or political freedom are either more likelythan or as likely as those in countries with less pressfreedom or political freedom to report corruptionas a very severe or major problem. This findingdirectly contradicts the widely recognized cross-national pattern that politically free countries areassociated with lower levels of corruption. The highnegative correlation between press freedom andthe Kaufmann et al. corruption index in theAppendix (Tables A2–A4) also supports this widelyrecognized pattern. Yet one may easily explainthis contradiction if we allow the possibility offalse responses in politically repressive regimes.
Table 3 Impact of press freedom on potential false responses at firm level
Residuals from Kaufmann et al measure of corruption Residuals from Fisman and Miguel measure of corruption
(1) OLS (2) OLS (3) OLS (4) OLS (5) OLS (6) OLS
Press freedom �0.003** �0.003** �0.002 �0.002*
[0.001] [0.001] [0.001] [0.001]
log GNI per capita 0.004 0.036** 0.053*** 0.046*** 0.065*** 0.080***
[0.013] [0.017] [0.015] [0.013] [0.017] [0.014]
Small firm �0.025 �0.014 0.025 �0.017 �0.010 0.023
[0.021] [0.022] [0.026] [0.022] [0.022] [0.026]
Medium firm �0.030* �0.027 �0.014 �0.027 �0.025 �0.014
[0.017] [0.017] [0.016] [0.017] [0.017] [0.017]
State-owned firm 0.144*** 0.132*** 0.167*** 0.129*** 0.122*** 0.154***
[0.020] [0.021] [0.032] [0.020] [0.021] [0.032]
Foreign-owned firm 0.033* 0.035* 0.045* 0.032* 0.034* 0.043*
[0.019] [0.019] [0.023] [0.019] [0.019] [0.022]
Manufacturing �0.121*** �0.111** �0.108** �0.104**
[0.044] [0.045] [0.042] [0.043]
Services 0.017 0.015 0.011 0.007
[0.032] [0.032] [0.031] [0.031]
Agroindustry �0.117** �0.065 �0.060 �0.029
[0.050] [0.049] [0.052] [0.052]
Construction �0.015 �0.017 �0.029 �0.033
[0.031] [0.028] [0.029] [0.027]
Constant 0.050 �0.058 �0.265*** �0.278** �0.340*** �0.531***
[0.110] [0.106] [0.076] [0.108] [0.110] [0.084]
Observations 43,384 42,893 42,893 42,549 42,058 42,058
R2 0.03 0.04 0.03 0.05 0.05 0.04
*Significant at 10%; **significant at 5%; ***significant at 1%.Robust standard errors in brackets clustered for observations in a given country.
Understanding corruption and firm responses Nathan M Jensen et al
1492
Journal of International Business Studies

This should cast serious doubt on inferences basedon the PICS survey regarding the level of corruptionin politically repressive countries.
IMPLICATIONS FOR IB RESEARCHIn this paper we illustrate how nonresponse andpotential false response are associated with the levelof political freedom. We document that firmresponses to an important corruption question inan important World Bank firm-level survey acrosscountries suffer from these biases, particularly inpolitically repressive countries. What do our find-ings mean for the current state of IB research?
It is important to note that collecting firm-leveldata on corruption is an important enterprise.We by no means want to suggest throwingout the baby with the bathwater. Research oncorruption requires knowledge of (often illegal)transactions between politicians (or bureaucrats)and individuals representing firms. Firms and
governments have incentives to hide bribes,misrepresent firm–business relationships, or simplynot answer questions about corruption. Wheneverfirms have incentives to provide false responses ornot respond at all, owing to potential governmentreprisals, corruption is most probably understated,in both situations.21 Thus the micro-foundation ofcorruption research is these firm- or individual-level transactions. We argue that IB researchersshould seriously consider the incentives of firmsand take into account the political environmentwhen evaluating survey research on corruptionperceptions. Expert surveys that are designed tominimize the potential for government reprisal,or use alternative sources to measure corruption,may be one solution to this problem. Yet firm-levelsurveys are a valuable data resource, and thusresearchers can leverage these surveys as wellas the nonresponse and false response biasesto explore politically sensitive topics such as
Table 4 Political freedom, outside corruption evaluation, and firm response on corruption
(1) (2) (3) (4)
Press freedom 0.007* 0.004
[0.004] [0.003]
Political freedom 0.037* 0.026
[0.022] [0.018]
Kaufmann corruption index 0.327*** 0.298***
[0.123] [0.113]
Fisman & Miguel unpaid parking tickets 0.003* 0.003*
[0.002] [0.002]
log GNI per capita �0.124* �0.209*** �0.127* �0.214***
[0.067] [0.055] [0.066] [0.052]
Small firm 0.040 0.029 0.052 0.034
[0.063] [0.063] [0.063] [0.064]
Medium firm 0.079 0.077 0.088* 0.083*
[0.048] [0.049] [0.048] [0.048]
State-owned firm �0.450*** �0.444*** �0.452*** �0.437***
[0.072] [0.071] [0.072] [0.069]
Foreign-owned firm �0.105* �0.109* �0.102* �0.107*
[0.057] [0.057] [0.056] [0.057]
Manufacturing 0.369** 0.360** 0.354** 0.339**
[0.150] [0.151] [0.146] [0.146]
Services �0.035 �0.036 �0.057 �0.060
[0.128] [0.127] [0.127] [0.126]
Agroindustry 0.220 0.152 0.241 0.139
[0.163] [0.170] [0.153] [0.159]
Construction 0.088 0.107 0.078 0.092
[0.115] [0.115] [0.112] [0.112]
Constant �0.308 0.522 �0.255 0.523
[0.556] [0.386] [0.551] [0.381]
Observations 42,893 42,058 43,106 42,271
*Significant at 10%; **significant at 5%; ***significant at 1%.Robust standard errors in brackets.
Understanding corruption and firm responses Nathan M Jensen et al
1493
Journal of International Business Studies

corruption. We offer a number of suggestions onhow to deal with these issues.
One simple suggestion is to make sure to docu-ment the potential for bias, including descriptivestatistics on the nonresponse bias. One concreteexample is a recent contribution in JIBS by Luo’s(2006) influential paper on the perceived corrup-tion of MNEs operating in China. Luo’s researchdesign comprises a survey of 350 MNE units inChina, administering questions about perceptionsof corruption. Luo is careful to document thenonresponse bias in which MNEs do not completethe survey (‘‘unit nonresponse’’), which is animportant step in detecting nonresponse bias.Yet our paper suggests that ‘‘item nonresponse’’can also be a serious problem. IB scholars shouldstrive to report both types of nonresponse in theirresearch.
For some projects, scholars may actually under-state the substantive impact of their results, owingto this nonresponse bias. For example, Beck,Demirguc-Kunt, and Maksimovic (2005) estimatehow financial constraints and corruption affectfirms’ growth rates using a World Bank surveysimilar to ours. They find a weak relation-ship between the quality of domestic courts andthe growth rates of firms. Beck et al. (2005) providesummary statistics that allow us to calculate thenonresponse rate, where there are questions onthe interpretation of the laws, with a 99% responserate, on the ‘‘proportion of revenues paid as bribes’’,with a 67% response rate, and on the amountof bribes paid for government contracts, with a 41%response rate. It is reasonable to infer that theamount of bribes paid is systematically understatedin politically less free countries, owing to the largenonresponse bias.
While these criticisms of firm-level studies ofcorruption may point scholars to utilize othermeasures of corruption, such as TransparencyInternational, when engaging in cross-nationalresearch, we again stress that the fundamentalproblem is the same, although to varying degrees.Firms are unwilling to provide honest answers toquestions about levels of corruption in certainpolitical environments. For example, in anotherimportant JIBS paper, DiRienzo, Das, Cort, andBurbridge (2007) examine how the informationenvironment affects levels of corruption. Theyargue that public knowledge of business transac-tions reduces the level of corruption. DiRienzo et al.(2007: 322) hypothesize that ‘‘the higher the accessto information and technology in a country, the
lower the degree of corruption in the country’’.Using an index of access to digital technologyand information, they find a strong relationshipbetween more information leading to lower levelsof corruption as measured by Transparency Inter-national. Our argument and empirical evidencesuggest that a different mechanism could also be atwork.22 Firms are unwilling to voice negativeopinions on corruption questions in countrieswith lower levels of press freedom. The use ofTransparency International data may seem to side-step this problem by surveying experts outsidethe country, free from political pressure, yet we stillwant to know more about the data generationprocess, and specifically on how these expertsobtain information on corruption from firmsfearing retaliation from the government. There ismuch room for future research into how thesedata are generated. Still, the important lesson isthat the level of corruption as reflected in the PICSsurvey is most likely to be severely underestimatedfor politically repressive countries. One shouldinterpret with caution findings based on politicallysensitive questions for these countries.
While these criticisms highlight the need forscholars to provide detailed information on thepattern of nonresponse, there are some remediesto deal with nonresponse. Scholars can implementtheir research designs either to minimize or to beable to document the extent of the nonresponsebias. One example is the work of Holmes andSchmitz (1996). In their study, they examinenonresponse bias in the US Characteristics ofBusiness Owners by using information from allowners of a multi-owner business. They argue thatthis bias can be corrected for by examining theresponses of the other owners of multi-ownerbusinesses. Scholars can also utilize differentweighting schemes, such as Vaaler, Schrage, andBlock (2005), which corrects for outliers by usinga method of analytical weights. Our findingsindicate that one may want to give less weight toobservations from politically repressive countries,owing to the potential biases.
These approaches allow us to examine firm-leveldata in the presence of nonresponse. One finalsuggestion is that nonresponse, rather than beingtreated simply as a nuisance that should becorrected for, can provide important informationon the political environment. One simple strategyis to employ a series of questions that range fromroutine to politically highly sensitive. For example,our data include routine questions on power usage,
Understanding corruption and firm responses Nathan M Jensen et al
1494
Journal of International Business Studies

sales, and other simple operational data, and highlysensitive questions on corruption and evaluationof government performance. High levels of non-response on politically sensitive questions canindicate firms’ fear of retaliation from governmentofficials.
In some circumstances scholars may be able tolink questions to address not only nonresponsebias, but also the potential false response. Azfar andMurrell (2009) provide a methodology for usingthe logic of randomized responses in the designingand implementation of surveys to identify falseresponse. Unfortunately, this method cannot beapplied to existing survey data. We offer one finalsuggestion on identifying false response in existingsurvey data, and an example from our data. Mostsurvey data, including the PICS survey, collectroutine information along with more sensitiveinformation such as questions on bribes, corrup-tion, or political activities. In many cases detailedbackground information is required to answer thesepolitically sensitive questions.
In our survey, we have multiple questions onelectricity provision. Some questions are non-sensitive, such as the average cost of a kilowatt-hour of electricity (c220a), and whether the firmowns or shares a generator (c220b). The survey alsoasks sensitive questions, such as an evaluationof government provision of electricity (c218b). Ifwe deem the basic information asked in c220aand c220b to be necessary for an evaluation ofelectricity provision, then respondents who failto answer the basic electricity questions and yetanswer the politically sensitive question are likelyto be engaging in false response. Individualswho don’t know whether their firms own agenerator aren’t in a position to evaluate thegovernment’s provision of power. In the PICSsurvey we found relatively low rates of non-response on the non-sensitive electricity questions,and only a very small number of responses thatindicated false response. The respondents whoskipped the question on electricity pricing andthe owning of a private generator tended to skipthe question on the evaluation of the government’seffectiveness in providing power. While thisexample failed to reject the null, we believe itprovides a concrete example of how to furthertest the patterns of false response – one that canbe utilized even within a single-country survey.Thus existing surveys may contain a rich datasource that has not been fully exploited by theresearchers.
CONCLUSIONIn order to fight corruption, scholars and policy-makers have been trying to understand its causesand consequences. Many recent studies havefocused on firms’ experiences with corruption,relying on firm-level survey data that the WorldBank collected from various countries. While thesefirm-level analyses provide additional insights intothe causes and effects of corruption, they havelargely ignored the presence and impact of non-response and false response. More importantly,we argue that the generation of nonresponse andfalse response is a function of the political environ-ment in which firms operate. In short, in politicallyrepressive environments firms use nonresponseand false response to shield themselves frompossible government reprisals. Because both biasespoint in the same direction, corruption is mostlikely to be understated by firms in politicallyrepressive countries. By relying on available firmresponses alone, and treating them as though all ofthem are truthful, firm-level data-based researchinto corruption could produce incorrect inferencesand lead to erroneous policy recommendations.
We test our arguments about nonresponse andfalse response at both the country and firm levels,using data from more than 44,000 firms in 72countries in the period 2000–2005. Our empiricalfindings show that press freedom is an importantdeterminant of how firms report on corruption asa problem for their operations in their countries. Interms of the nonresponse bias, at the aggregatelevel, countries lacking political freedom are asso-ciated with higher firm nonresponse rates; consis-tently, at the individual firm level, firms are morelikely to skip the corruption question in countrieslacking press freedom. Meanwhile, in terms of thepotential false response bias, at the aggregate level,countries lacking press freedom are associatedwith higher percentages of firms reporting corrup-tion not being a very severe or major problem thanone should expect based on a third-party measureof corruption, a pattern we call potential falseresponse. Consistently, at the individual level,individual firms in politically repressive countriesare more likely to report corruption severity asbeing lower than one would expect based on boththe Kaufmann et al. corruption index and theFisman and Miguel unpaid parking ticket measure,a pattern of potential false response. More surpris-ingly, our further analysis using the PICS datashows that firms in politically free countries reporthigher or equal levels of corruption than their
Understanding corruption and firm responses Nathan M Jensen et al
1495
Journal of International Business Studies

counterparts in politically repressive ones, a findingthat directly contradicts the prevalent finding fromcross-national research, but is completely reconcil-able if we allow false response to exist. In lightof these findings on both biases pointing towardthe same direction, we argue that previous researchaccepting and relying on the firm survey data forpolitically repressive countries at their face valuehas underestimated the severity of corruption inthese countries.
One potential criticism of this research design isthat these subjective measures of corruption can besubject to bias. This is an important consideration,one that we share, but our analysis explores thedeterminants of this bias. We find that the lack ofpress freedom is associated with nonresponse andunder-reporting of the extent and depth of corrup-tion. We argue that this evidence is consistent withfirms’ fear of government reprisal in politicallyrepressive environments.
Obviously there are potentially other alternativeinterpretations of our empirical results. For exam-ple, one could argue that in societies that lack pressfreedom, citizens are bombarded with messagesabout the lack of corruption, producing citizenevaluations that are consistent with our results,but not a function of false response. Yet we believethat this argument would be inconsistent withour results on the condition of nonresponse bias. Ifa political regime controls information in a waythat biases all citizens on their views of corruption,why would firms systematically fail to respond tocorruption questions in societies without a freepress? We believe that our results on nonresponseand potential false response, taken together,provide strong support for our theory, and areinconsistent with other arguments on how sub-jective measures of corruption may be capturingother factors related to the perceptions of corrup-tion. Finally, as discussed earlier, our analysisalso provides direct evidence disputing the ‘‘greas-ing the wheel’’ hypothesis, thus ruling it out as analternative explanation of our results.
Our findings in the paper suggest that corruptionis more severe in politically repressive countriesthan previous firm-level analyses lead one tobelieve. This has broad implications for how tointerpret the findings and inferences of previousfirm-level data-based analyses, particularly for poli-tically repressive countries and for any comparisonbetween such countries and others. For example,in a study of the impact of investment climate onproductivity using firm-level data for Guatemala,
Honduras, and Nicaragua, Escribano and Guasch(2005) find that firms that pay 1% of sales to speedup bureaucratic issues experience an increase inproductivity by 1.3–3.3%. To the extent that theseestimates do not take into account the existence ofpotential false responses and nonresponse, theeffect of bribery on productivity is likely to bebiased and incorrect.
Our paper is not meant to be a critical review ofexisting corruption studies that use firm-levelsurveys. Rather, our goal is to make a substantivecontribution to the literature on political institu-tions and the business environment. Our empiricalresults point to the lack of political freedom asbeing associated with firms either failing to respondto sensitive questions, or filling out surveys in amanner consistent with potential false response.These results provide indirect evidence of firmsfearing reprisals from the repressive government.We believe that this fear of reprisals is an importantbut seriously understudied element of the businessenvironment. It is conceivable that the presence ofsuch fear compels firms to modify their businessoperations and political strategies. This analysisprovides some insights, and demonstrates the needfor more future research into this issue.
Finally, we believe that this work can provideinsights for business managers. Existing survey dataon the condition of corruption is biased towardsunderestimation in repressive regimes. While theseperception-based surveys have serious flaws, webelieve that they provide one clear avenue forunderstanding the local business environment.The high levels of nonresponse and potential falseresponse to politically sensitive questions in certaincountries can provide important information formanagers about the nature of the business environ-ment. Thus we can learn not only from truthfulresponses to firm-level surveys, but also from thesystematic patterns of nonresponses and potentialfalse responses by firms that fear retribution fromtheir host governments.
ACKNOWLEDGEMENTSEqual authorship is implied. The authors thankLorraine Eden, Witold Henisz, Aart Kraay, AndrewStone, Vincent Palmade, Matt Gabel, Layna Mosley,Eddy Malesky, Tom Kenyon, the anonymous referees,the participants at the Political Risk in EmergingMarkets Conference, Washington University, atSt Louis, March 2007, and the Midwest PoliticalScience Association Conference, Chicago, April 2007,for their comments. Greg Allen, Daehee Bak, Ekrem
Understanding corruption and firm responses Nathan M Jensen et al
1496
Journal of International Business Studies

Karakoc, and Sam Snideman provided researchassistance. David Stewart helped the authors withtheir numerous queries related to the surveys. NathanJensen’s research was funded by the WeidenbaumCenter on the Economy, Government, and PublicPolicy at Washington University. The views expressedin this paper are solely those of the authors, andthey do not necessarily represent the views of theWorld Bank, its Board of Directors, or the countriesthey represent. The authors are responsible for all theerrors.
NOTES1For example, see the Journal of International
Business Studies special issue on the topic (Rodriguezet al., 2006). Mocan (2008) examines individual-levelcorruption by utilizing the United Nations Inter-national Crime Victim Survey.
2See, for example, Bardhan (1997), Gatti (2004),Gray and Kaufmann (1998), Kaufmann (1997), Mauro(1998), Tanzi (1998), Treisman (2000), and Wei(1999, 2000).
3See Recanatini, Wallsten, and Xu (2000) fordiscussion of the early World Bank surveys. Forexamples of the firm-level data-based analyses, seeBatra, Kaufmann, and Stone (2003), Clarke and Xu(2004), Escribano and Guasch (2005), Fisman andGatti (2006), Gray, Hellman, and Ryterman (2004),Hellman et al. (2006), Hellman and Kaufmann (2004),Lee, Oh, and Eden (forthcoming), Svensson (2003),and World Bank (2005).
4A few corruption studies triangulate betweenenterprise surveys, citizen surveys, and public officialssurveys. See, for example, World Bank (2000).
5As an exception, Svensson (2003) applies a selec-tion model to the generation of firm nonresponsesin a single-country survey, but does not find anysignificant selection effect.
6A similar World Bank survey is the BusinessEnvironment and Enterprise Performance Survey.
7Another general corruption question in the surveyconcerns the proportion of sales the firms reportedlyhave devoted to bribery. From both the legal andbusiness perspectives, this question is highly proble-matic. As bribery is considered illegal in manycountries, acknowledging the specific amount ofbribery can easily be self-incriminating, causing thefirm to be taken advantage of by the government orbusiness competitors. It also reveals the firm’s strate-gies to its potential business competitors. Finally, sincebribery is also unethical, it is unrealistic and question-able to suggest that firm managers will truthfullyadmit and report their unethical behaviors. Other
corruption-related questions in the PICS survey arenarrowly targeted, concerning firm perceptions ortheir actual bribe payments for specific services(e.g., utility service, construction permit, importlicense, customs clearance). They lack the general-izability of the question we choose to analyze.
8See Batra et al. (2003: 51) for the specific referenceto China.
9One may contend that these World Bank surveystypically have confidentiality agreements that protectthe identity of the respondent from being revealedto the government. This type of protection may belimited when the World Bank survey team needs thecollaboration of the relevant government bureaucracyto provide industry census data to generate therepresentative stratified sample. Also, there is oftena data-sharing arrangement between the Bank andthe national government. Hence it is quite plausiblethat an unconstrained autocratic government wouldbe able to identity respondents.
10It is important to note that we are not arguing thatthe lack of information causes corruption. See DiRienzoet al. (2007) for a theoretical argument and anempirical test linking information and communicationtechnology to the level of corruption. Also see Freille,Haque, and Kneller (2007) for work on the relationshipbetween press freedom and corruption, and Leeet al. (forthcoming) on the firm-level determinantsof paying bribes.
11While they often provide feedback (a public good)on the investment environment to governmentofficials, World Bank staff, and other potential inves-tors, the impact of each individual firm’s responseon the government policy reform is low, and thebenefits of a resultant policy reform are diffused anddispersed among all firms, including those that do notparticipate in the survey.
12It is important to note that firms that find thesedisincentives to be so large will be unlikely to answerany question at all. And these firms are typicallyreplaced in surveys by those that are willing to respondto at least some questions. To the extent that theinclusion of politically sensitive questions deters firmparticipation in autocratic countries, we should expectto see higher replacement rates in them than indemocracies. But this implication cannot be tested,because the replacement data are not available.
13The Freedom House also provides a categoricalpress freedom variable with three categories: Free,Partially Free, and Not Free. Using this variable,we code a press freedom dummy variable, with 1indicating no press freedom and 0 otherwise. Statis-tical results based on this press freedom dummy are
Understanding corruption and firm responses Nathan M Jensen et al
1497
Journal of International Business Studies

consistent with those based on the continuousmeasure. These results, not reported because of spaceconstraints, are available upon request.
14OLS regressions produce similar results.15The calculation employs the computed marginal
effect of press freedom on the actual dependentvariable in Tobit, which is 0.11. OLS estimates leadto smaller standard errors, but a very similar sub-stantive impact. A move from the lowest level of pressfreedom to the highest level leads to a 7.8% increasein the response rate.
16This is a continuous aggregate measure of cor-ruption, ranging from �2.5 (lowest level of corrup-tion) to 2.5 (highest level of corruption). Data areavailable at www.govindicators.org.
17This includes cases where the response to thecorruption question is recorded as 3 (major) or 4 (verysevere) in the data.
18Since our dependent variable is no longer cen-sored, we use OLS instead of Tobit for estimation.
19These results are robust for the dichotomousmeasure of press freedom, which are not reportedhere for the sake of space.
20We present the raw country-level data in theAppendix. We also examined the robustness of our
results for both nonresponse and potential falseresponse at the country level, using the robustregression procedure rreg in Stata. This iterativelyreweighted least-squares estimator first runs the OLSregression, finds the values of Cook’s D (an outlierdiagnostic), drops any observation if its Cook’s D valueis greater than 1, and then iteratively performsregression using case weights from absolute residualsuntil the maximum change in weight from oneiteration to the next drops below tolerance. In essence,this estimator drops the most influential observationsand then down-weights cases with large absoluteresiduals. Our results for press freedom based on thisrobust regression estimator remain unchanged (resultsavailable from the authors).
21Alternative measures of corruption, such as expertsurveys and the Kaufmann et al. measure, may alsoconfront the same problems. As noted earlier, though,we have reasons to believe that the Kaufmann et al.measure is closer to the true level of corruption thanthat reflected by the firm-level survey data.
22Assuming that the per capita GNI variable allowsus to control for the information access effectidentified by DiRienzo et al. (2007), our statisticalevidence relates directly to our argument.
REFERENCESAdes, A., & Di Tella, R. 1999. Rents, competition, and
corruption. American Economic Review, 89(4): 982–993.Azfar, O., & Murrell, P. 2009. Identifying reticent responses:
Assessing the quality of survey data on corruption and values.Economic Development and Cultural Change, 57(2): 387–411.
Bardhan, P. 1997. Corruption and development: A review ofissues. Journal of Economic Literature, 35(3): 1320–1346.
Batra, G., Kaufmann, D., & Stone, A. H. W. 2003. Investmentclimate around the world: Voices of the firms from the worldbusiness environment survey. Washington, DC: World Bank.
Beck, T., Demirguc-Kunt, A., & Maksimovic, V. 2005. Financialand legal constraints to growth: Does firm size matter? Journalof Finance, 60(1): 137–177.
Berinsky, A. J. 2004. Silent voices: Public opinion and politicalparticipation in America. Princeton, NJ: Princeton UniversityPress.
Berinsky, A. J., & Tucker, J. A. 2006. ‘‘Don’t knows’’ and publicopinion toward economic reform: Evidence from Russia.Communist and Post-Communist Studies, 39(1): 73–99.
Carmines, E. G., & Stimson, J. A. 1980. The two faces of issuevoting. American Political Science Review, 74(1): 78–91.
Clarke, G. R. G., & Xu, L. C. 2004. Privatization, competition,and corruption: How characteristics of bribe takers and payersaffect bribes to utilities. Journal of Public Economics, 88(9–10):2067–2097.
Cuervo-Cazurra, A. 2006. Who cares about corruption? Journalof International Business Studies, 37(6): 803–822.
DiRienzo, C. E., Das, J., Cort, K. T., & Burbridge Jr., J. 2007.Corruption and the role of information. Journal of InternationalBusiness Studies, 38(2): 320–332.
Escribano, A., & Guasch, J. L. 2005. Assessing the impact ofinvestment climate on productivity using firm level data:
Methodology and the cases of Guatemala, Honduras andNicaragua, Policy Research Working Paper 3621, World Bank,Washington, DC.
Fisman, R., & Gatti, R. 2006. Bargaining for bribes: The role ofinstitutions, Discussion Paper 5712, Center for Economic Policyand Research (CEPR).
Fisman, R., & Miguel, E. 2007. Cultures, norms, and legalenforcement: Evidence from diplomatic parking tickets.Journal of Political Economy, 115(6): 1020–1048.
Freille, S., Haque, M. E., & Kneller, R. 2007. A contribution to theempirics of press freedom and corruption. European Journal ofPolitical Economy, 23(4): 838–862.
Gatti, R. V. 2004. Explaining corruption: Are open countries lesscorrupt? Journal of International Development, 16(6): 851–861.
Graham, J. L. 1984. The Foreign Corrupt Practices Act: A newperspective. Journal of International Business Studies, 15(3):107–121.
Gray, C. W., Hellman, J., & Ryterman, R. 2004. Anticorruption intransition 2: Corruption in enterprise-state interactions in Europeand Central Asia 1999–2002. Washington, DC: World Bank.
Gray, C. W., & Kaufmann, D. 1998. Corruption and develop-ment. Finance and Development, 35(1): 7–10.
Habib, M., & Zurawicki, L. 2002. Corruption and foreign directinvestment. Journal of International Business Studies, 33(2):291–307.
Hellman, J. S., Jones, G., & Kaufmann, D. 2006. Far fromhome: Do foreign investors import higher standards ofgovernance in transition economies? In T. Clarke & M. DelaRama (Eds), Corporate governance and globalization. New York:Sage.
Hellman, J. S., & Kaufmann, D. 2004. The inequality ofinfluence. In J. Kornai & S. Rose-Ackerman (Eds), Building a
Understanding corruption and firm responses Nathan M Jensen et al
1498
Journal of International Business Studies

trustworthy state in post-socialist transition. New York: PalgraveMacmillan.
Henisz, W. J. 2000. The institutional environment for multi-national investment. Journal of Law, Economics, and Organiza-tion, 16(2): 334–364.
Holmes, T. J., & Schmitz Jr., J. A. 1996. Nonresponse bias andbusiness turnover rates: The case of the characteristics ofbusiness owners survey. Journal of Business & EconomicStatistics, 14(2): 231–241.
Kaufmann, D. 1997. Corruption: The facts. Foreign Policy,107(Summer): 114–131.
Kaufmann, D., Kraay, A., & Mastruzzi, M. 2007. Governancematters V: Governance indicators for 1996–2005, PolicyResearch Working Paper 4280, World Bank, Washington, DC.
Kim, S., & Barone, S. 1981. Is the Foreign Corrupt Practices Actof 1977 a success or failure? Journal of International BusinessStudies, 12(3): 123–126.
Knack, S., & Keefer, P. 1995. Institutions and economicperformance: Cross-country tests using alternative institutionalmeasures. Economics and Politics, 7(3): 207–227.
Kwok, C. C. Y., & Tadesse, S. 2006. The MNC as an agent ofchange for host-country institutions: FDI and corruption.Journal of International Business Studies, 37(6): 767–785.
Lambsdorff, J. G. 2003. How corruption affects persistent capitalflows. Economics of Governance, 4(3): 229–243.
Lee, S.-H., Oh, K., & Eden, L. (forthcoming). Why do firmsbribe? Insights from residual control theory into firms’exposure and vulnerability to corruption. Management Inter-national Review.
Lensvelt-Mulders, G. J. L. M., Hox, J. J., van der Heijden, P. G.M., & Maas, C. J. M. 2005. Meta-analysis of randomizedresponse research: Thirty-five years of validation. SociologicalMethods and Research, 33(3): 319–348.
Luo, Y. 2006. Political behavior, social responsibility, andperceived corruption: A structural perspective. Journal ofInternational Business Studies, 37(6): 747–766.
Mauro, P. 1995. Corruption and growth. Quarterly Journal ofEconomics, 110(3): 681–712.
Mauro, P. 1998. Corruption and the composition of govern-ment expenditure. Journal of Public Economics, 69(2):263–279.
Mocan, N. 2008. What determines corruption? Inter-national evidence from microdata. Economic Inquiry, 46(4):493–510.
Nichter, S. 2008. Vote buying or turnout buying? Machinepolitics and the secret ballot. American Political Science Review,102(1): 19–31.
Pickreign, J. D., & Gabel, J. R. 2005. Health benefit offer rates: Isthere a nonresponse bias? HSR: Health Services Research, 40(2):401–412.
Recanatini, F., Wallsten, S. J., & Xu, L. C. 2000. Surveying surveysand questioning questions: Learning from the World Bankexperience, Policy Research Working Paper 2307, World Bank,Washington, DC.
Riphahn, R. T., & Serfling, O. 2005. Item nonresponse onincome and wealth questions. Empirical Economics, 30(2):521–538.
Rodriguez, P., Siegel, D. S., Hillman, A., & Eden, L. 2006. Threelenses on the multinational enterprise: Politics, corruption andcorporate social responsibility. Journal of International BusinessStudies, 37(6): 733–746.
Rose-Ackerman, S. 1975a. The economics of corruption. Journalof Public Economics, 4(1): 187–203.
Rose-Ackerman, S. 1975b. Corruption and government. Cambridge:Cambridge University Press.
Rose-Ackerman, S. 1999. Corruption and government: Causes,consequences, and reform. Cambridge: Cambridge UniversityPress.
Rosendorff, B. P., & Vreeland, J. R. 2006. Democracy and datadissemination: The effect of political regime on transparency,Working Paper, New York University.
Schleifer, A., & Vishny, R. 1993. Corruption. Quarterly Journal ofEconomics, 108(3): 599–617.
Sherman, R. P. 2000. Tests of certain types of ignorablenonresponse in surveys subject to item nonresponseor attrition. American Journal of Political Science, 44(2):362–374.
Stokes, S. C. 2005. Perverse accountability: A formal model ofmachine politics with evidence from Argentina. AmericanPolitical Science Review, 99(3): 315–325.
Svensson, J. 2003. Who must pay bribes and how much?Evidence from a cross-section of firms. Quarterly Journal ofEconomics, 118(1): 207–230.
Tanzi, V. 1998. Corruption and the budget: Problems andsolutions. In A. K. Jain (Ed.), Economics of corruption. Boston,MA: Kluwer Academic Publishers.
Treisman, D. 2000. The causes of corruption: A cross-nationalstudy. Journal of Public Economics, 76(3): 399–457.
Uhlenbruck, K., Rodriguez, P., Doh, J., & Eden, L. 2006. Theimpact of corruption on entry strategy: Evidence fromtelecommunication projects in emerging economies. Organi-zational Science, 17(3): 402–414.
Vaaler, P. M., Schrage, B. N., & Block, S. A. 2005. Counting theinvestor vote: Political business cycle effects on sovereign bondspreads in developing countries. Journal of InternationalBusiness Studies, 36(1): 62–88.
Vernon, R. 1971. Sovereignty at bay: The multinational spread ofUS enterprise. New York: Basic Books.
Vernon, R. 1977. The strains on national objectives: thedeveloping countries. In R. Vernon (Ed.), Storm over themultinationals: The real issues: 139–173. Cambridge, MA:Harvard University Press.
Wei, S.-J. 1999. Corruption in economic development: Beneficialgrease, minor annoyance, or major obstacle? Policy ResearchWorking Paper 2048, World Bank, Washington, DC.
Wei, S.-J. 2000. How taxing is corruption on internationalinvestors? Review of Economics and Statistics, 82(1): 1–11.
Weitzel, U., & Berns, S. 2006. Cross-border takeovers, corrup-tion, and related aspects of governance. Journal of Interna-tional Business Studies, 37(6): 786–806.
Wells, L. 1977. Negotiating with third-world governments.Harvard Business Review, 55(1): 72–80.
World Bank. 2000. Cambodia governance and corruption diag-nostic: Evidence from citizen, enterprise, and public officialsurveys. Washington, DC: World Bank.
World Bank. 2002. Productivity and the Investment ClimatePrivate Enterprise Survey. Washington, DC: World Bank,http://info.worldbank.org/etools/docs/library/86441/ses1.2_icaquestionnaire.pdf.
World Bank. 2003. Productivity and Investment Climate Survey(PICS): Implementation manual. Washington, DC: WorldBank.
World Bank. 2005. World development report 2005: A betterinvestment climate for everyone. New York: Oxford UniversityPress for the World Bank.
World Bank. 2007. Enterprise survey core plus manufacturingmodule (2007). Washington, DC: World Bank.
Zaller, J., & Feldman, S. 1992. A simple theory of the surveyresponse: Answering questions versus revealing preferences.American Journal of Political Science, 36(3): 579–616.
Understanding corruption and firm responses Nathan M Jensen et al
1499
Journal of International Business Studies

APPENDIXSee Tables A1–A6.
Table A1 Summary statistics
Variable N Mean s.d. Min Max
Panel A Country-level analysis
Dependent variables
Response 106 94.64439 6.768386 53.01205 100
False response 106 1.93�10�8 17.36324 �52.89046 30.53849
False Response (Fishman and Miguel) 102 �3.37�10�8 17.90498 �57.70901 26.48949
Independent variables
Press freedom 110 52.29091 21.52248 14 86
Political freedom 111 9.36036 3.597456 2 14
log GNI 112 7.322174 1.269324 4.60517 10.44232
Small 112 44.38283 16.85003 1.125176 79.43925
Medium 112 32.09842 9.594982 14.65347 54.77707
Foreign 112 13.67828 7.096738 0.9328358 43.57798
Government 112 9.427621 7.693954 0 29.61539
Manufacture 112 56.22714 33.15942 12.52485 100
Service 112 33.40836 28.85773 0 77.07317
Agriculture 112 2.157049 7.995355 0 43.43435
Construction 112 7.182073 6.370005 0 27.2
Kaufmann 112 0.282562 0.6740808 �1.919725 1.156015
Violations 109 19.74404 29.69616 0 139.6
Panel B Firm-level analysis
Dependent variables
Response 45,100 0.9619512 0.1913162 0 1
False response 43,384 �0.0003322 0.450435 �0.9066397 0.411754
False resp(v) 41,584 �0.0000547 0.449209 �0.7464988 0.5069643
Independent variables
Press freedom 49,628 50.73743 21.2674 14 86
Political freedom 50,917 9.086945 3.733429 2 14
log GNI 50,176 7.452257 1.207716 4.60517 10.44232
Small 50,176 0.3908442 0.4879444 0 1
Medium 50,176 0.3365354 0.4725291 0 1
Government 50,176 0.0854393 0.279537 0 1
Foreign 50,176 0.1266342 0.3325661 0 1
Manufacture 50,176 0.6507693 0.4767317 0 1
Service 50,176 0.2743144 0.4461726 0 1
Agroindustry 50,176 0.0135722 0.1157078 0 1
Construction 50,176 0.0547074 0.2274105 0 1
Kaufmann 50,176 0.2079086 0.6943753 �1.919725 1.156015
Violations 49,292 20.70131 29.75697 0 1.156015
Understanding corruption and firm responses Nathan M Jensen et al
1500
Journal of International Business Studies
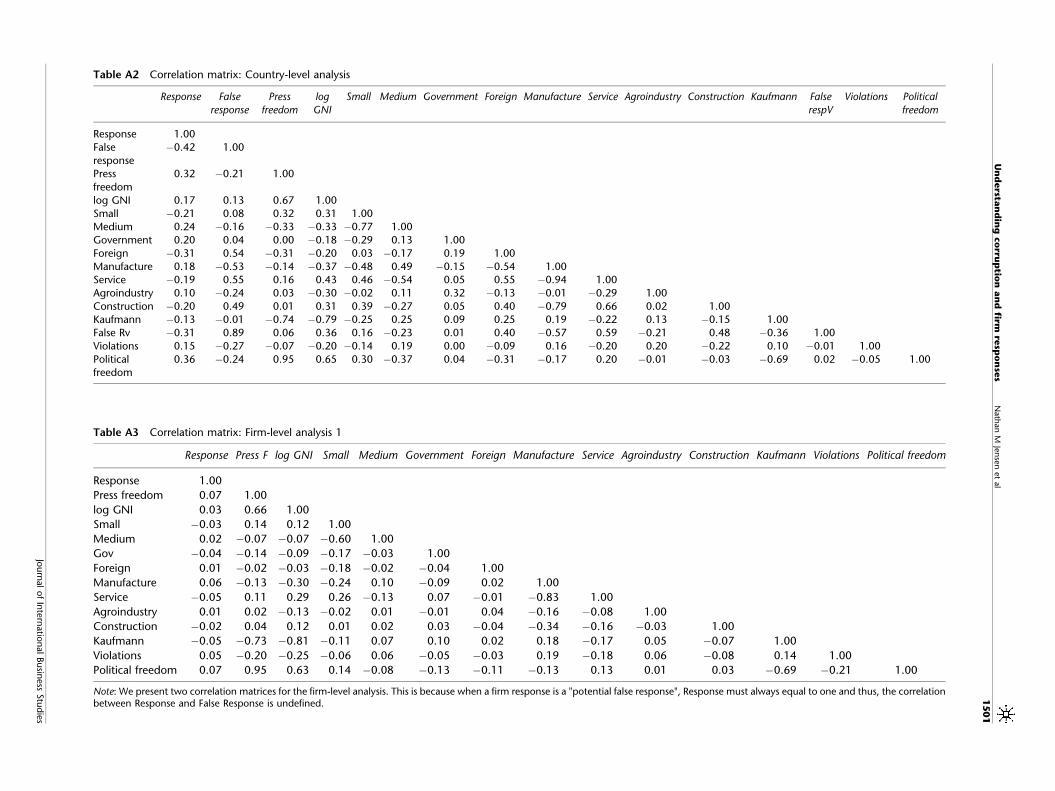
Table A2 Correlation matrix: Country-level analysis
Response False
response
Press
freedom
log
GNI
Small Medium Government Foreign Manufacture Service Agroindustry Construction Kaufmann False
respV
Violations Political
freedom
Response 1.00
False
response
�0.42 1.00
Press
freedom
0.32 �0.21 1.00
log GNI 0.17 0.13 0.67 1.00
Small �0.21 0.08 0.32 0.31 1.00Medium 0.24 �0.16 �0.33 �0.33 �0.77 1.00
Government 0.20 0.04 0.00 �0.18 �0.29 0.13 1.00
Foreign �0.31 0.54 �0.31 �0.20 0.03 �0.17 0.19 1.00
Manufacture 0.18 �0.53 �0.14 �0.37 �0.48 0.49 �0.15 �0.54 1.00Service �0.19 0.55 0.16 0.43 0.46 �0.54 0.05 0.55 �0.94 1.00
Agroindustry 0.10 �0.24 0.03 �0.30 �0.02 0.11 0.32 �0.13 �0.01 �0.29 1.00
Construction �0.20 0.49 0.01 0.31 0.39 �0.27 0.05 0.40 �0.79 0.66 0.02 1.00Kaufmann �0.13 �0.01 �0.74 �0.79 �0.25 0.25 0.09 0.25 0.19 �0.22 0.13 �0.15 1.00
False Rv �0.31 0.89 0.06 0.36 0.16 �0.23 0.01 0.40 �0.57 0.59 �0.21 0.48 �0.36 1.00
Violations 0.15 �0.27 �0.07 �0.20 �0.14 0.19 0.00 �0.09 0.16 �0.20 0.20 �0.22 0.10 �0.01 1.00
Politicalfreedom
0.36 �0.24 0.95 0.65 0.30 �0.37 0.04 �0.31 �0.17 0.20 �0.01 �0.03 �0.69 0.02 �0.05 1.00
Table A3 Correlation matrix: Firm-level analysis 1
Response Press F log GNI Small Medium Government Foreign Manufacture Service Agroindustry Construction Kaufmann Violations Political freedom
Response 1.00
Press freedom 0.07 1.00
log GNI 0.03 0.66 1.00
Small �0.03 0.14 0.12 1.00
Medium 0.02 �0.07 �0.07 �0.60 1.00
Gov �0.04 �0.14 �0.09 �0.17 �0.03 1.00
Foreign 0.01 �0.02 �0.03 �0.18 �0.02 �0.04 1.00
Manufacture 0.06 �0.13 �0.30 �0.24 0.10 �0.09 0.02 1.00
Service �0.05 0.11 0.29 0.26 �0.13 0.07 �0.01 �0.83 1.00
Agroindustry 0.01 0.02 �0.13 �0.02 0.01 �0.01 0.04 �0.16 �0.08 1.00
Construction �0.02 0.04 0.12 0.01 0.02 0.03 �0.04 �0.34 �0.16 �0.03 1.00
Kaufmann �0.05 �0.73 �0.81 �0.11 0.07 0.10 0.02 0.18 �0.17 0.05 �0.07 1.00
Violations 0.05 �0.20 �0.25 �0.06 0.06 �0.05 �0.03 0.19 �0.18 0.06 �0.08 0.14 1.00
Political freedom 0.07 0.95 0.63 0.14 �0.08 �0.13 �0.11 �0.13 0.13 0.01 0.03 �0.69 �0.21 1.00
Note: We present two correlation matrices for the firm-level analysis. This is because when a firm response is a "potential false response", Response must always equal to one and thus, the correlationbetween Response and False Response is undefined.
Un
dersta
nd
ing
co
rrup
tion
an
dfirm
resp
on
ses
Nath
an
MJe
nse
net
al
15
01
Journ
al
of
Inte
rnatio
nalBusin
ess
Stu
die
s

Table A4 Correlation matrix: Firm-level analysis 2
False
response
Press
freedom
log
GNI
Small Medium Government Foreign Manufacture Service Agroindustry Construction Kaufmann Violations Political
freedom
False V
False
response
1.00
Press freedom �0.07 1.00
log GNI 0.03 0.65 1.00
Small 0.01 0.14 0.12 1.00
Medium �0.04 �0.07 �0.08 �0.60 1.00
Government 0.10 �0.14 �0.09 �0.17 �0.03 1.00
Foreign 0.02 �0.01 �0.03 �0.18 �0.02 �0.04 1.00
Manufacture �0.15 �0.13 �0.30 �0.24 0.10 �0.09 0.02 1.00
Service 0.14 0.11 0.29 0.26 �0.12 0.07 �0.01 �0.83 1.00
Agroindustry �0.01 0.02 �0.13 �0.02 0.01 �0.01 0.04 �0.16 �0.07 1.00
Construction 0.04 0.04 0.12 0.01 0.02 0.03 �0.04 �0.34 �0.16 �0.03 1.00
Kaufmann 0.02 �0.73 �0.81 �0.11 0.07 0.09 0.02 0.19 �0.18 0.05 �0.07 1.00
Violations �0.10 �0.21 �0.25 �0.06 0.06 �0.05 �0.03 0.19 �0.18 0.06 �0.08 0.15 1.00
Political
freedom
�0.06 0.95 0.63 0.14 �0.08 �0.13 �0.01 �0.14 0.13 0.00 0.04 �0.68 �0.22 1.00
False V 0.98 0.05 0.16 0.03 �0.04 0.08 0.02 �0.16 0.15 �0.01 0.04 �0.15 0.00 0.04 1.00
Table A5 Impact of political freedom on nonresponses at country and firm levels
Country level (A1) Tobit Firm level (A2) Probit
Political freedom 0.758** Political freedom 0.045**[0.368] [0.018]
log GNI per capita 0.427 log GNI per capita �0.013[0.933] [0.047]
Small firms (%) �0.029 Small firm dummy �0.179**[0.074] [0.073]
Medium firms (%) 0.221* Medium firm dummy �0.012[0.124] [0.048]
Foreign firms (%) 0.199 Foreign-owned firm dummy 0.014[0.170] [0.047]
State-owned firms (%) �0.166 State-owned firm dummy �0.282***[0.112] [0.052]
Manufacturing (%) �0.065 Manufacturing dummy 0.142[0.473] [0.175]
Service sector (%) �0.087 Service sector dummy �0.111[0.529] [0.152]
Agroindustry (%) �0.083 Agroindustry dummy 0.267[0.582] [0.231]
Construction (%) �0.131 Construction dummy �0.132[0.394] [0.166]
Constant 85.913* Constant 1.543***[50.777] [0.405]
Observations 105 Observations 44800R2 0.067 Pseudo R2 0.032
*Significant at 10%; **significant at 5%; ***significant at 1%.Robust standard errors in brackets.
Un
dersta
nd
ing
co
rrup
tion
an
dfirm
resp
on
ses
Nath
an
MJe
nse
net
al
15
02
Journ
al
of
Inte
rnatio
nalBusin
ess
Stu
die
s
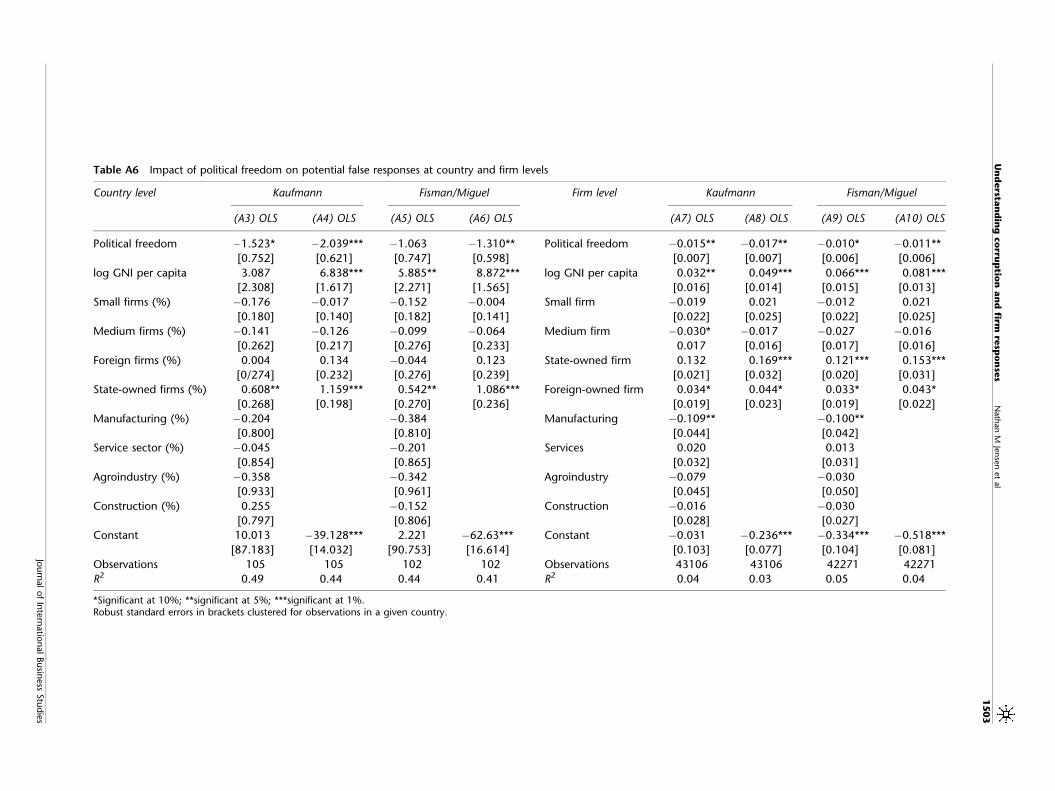
Table A6 Impact of political freedom on potential false responses at country and firm levels
Country level Kaufmann Fisman/Miguel Firm level Kaufmann Fisman/Miguel
(A3) OLS (A4) OLS (A5) OLS (A6) OLS (A7) OLS (A8) OLS (A9) OLS (A10) OLS
Political freedom �1.523* �2.039*** �1.063 �1.310** Political freedom �0.015** �0.017** �0.010* �0.011**
[0.752] [0.621] [0.747] [0.598] [0.007] [0.007] [0.006] [0.006]
log GNI per capita 3.087 6.838*** 5.885** 8.872*** log GNI per capita 0.032** 0.049*** 0.066*** 0.081***
[2.308] [1.617] [2.271] [1.565] [0.016] [0.014] [0.015] [0.013]
Small firms (%) �0.176 �0.017 �0.152 �0.004 Small firm �0.019 0.021 �0.012 0.021
[0.180] [0.140] [0.182] [0.141] [0.022] [0.025] [0.022] [0.025]
Medium firms (%) �0.141 �0.126 �0.099 �0.064 Medium firm �0.030* �0.017 �0.027 �0.016
[0.262] [0.217] [0.276] [0.233] 0.017 [0.016] [0.017] [0.016]
Foreign firms (%) 0.004 0.134 �0.044 0.123 State-owned firm 0.132 0.169*** 0.121*** 0.153***
[0/274] [0.232] [0.276] [0.239] [0.021] [0.032] [0.020] [0.031]
State-owned firms (%) 0.608** 1.159*** 0.542** 1.086*** Foreign-owned firm 0.034* 0.044* 0.033* 0.043*
[0.268] [0.198] [0.270] [0.236] [0.019] [0.023] [0.019] [0.022]
Manufacturing (%) �0.204 �0.384 Manufacturing �0.109** �0.100**
[0.800] [0.810] [0.044] [0.042]
Service sector (%) �0.045 �0.201 Services 0.020 0.013
[0.854] [0.865] [0.032] [0.031]
Agroindustry (%) �0.358 �0.342 Agroindustry �0.079 �0.030
[0.933] [0.961] [0.045] [0.050]
Construction (%) 0.255 �0.152 Construction �0.016 �0.030
[0.797] [0.806] [0.028] [0.027]
Constant 10.013 �39.128*** 2.221 �62.63*** Constant �0.031 �0.236*** �0.334*** �0.518***
[87.183] [14.032] [90.753] [16.614] [0.103] [0.077] [0.104] [0.081]
Observations 105 105 102 102 Observations 43106 43106 42271 42271
R2 0.49 0.44 0.44 0.41 R2 0.04 0.03 0.05 0.04
*Significant at 10%; **significant at 5%; ***significant at 1%.Robust standard errors in brackets clustered for observations in a given country.
Un
dersta
nd
ing
co
rrup
tion
an
dfirm
resp
on
ses
Nath
an
MJe
nse
net
al
15
03
Journ
al
of
Inte
rnatio
nalBusin
ess
Stu
die
s

ABOUT THE AUTHORSNathan Jensen is a US citizen, and received his PhDin 2002 from the Department of Political Scienceat Yale University. He is an associate professor in theDepartment of Political Science at WashingtonUniversity in St Louis. He conducts research onpolitical risk in emerging markets, trade policy,international institutions, and civil conflict.
Quan Li is Professor of Political Science andDirector of the Program on International Conflictand Cooperation at Texas A&M University. Born inChina, he is a US citizen. He received his doctoratein political science from Florida State University.His research interests are the causes and conse-
quences of economic globalization (trade, foreigndirect investment, financial openness, and capitalaccount liberalization), political violence (militaryconflict and transnational terrorism), and demo-cratic governance.
Aminur Rahman is a Bangladeshi citizen. Hereceived his Masters in Development Economicsfrom Oxford University in 1999 and is a PhDcandidate in the Department of Economics, Uni-versity College London. He is an Investment PolicyOfficer at the Investment Climate Advisory Servicesof the World Bank Group. He conducts research onfirm behavior, household behavior, political econ-omy of reforms, corruption, and aid effectiveness.
Accepted by Witold Henisz, Area Editor, 2 November 2009. This paper has been with the authors for three revisions.
Understanding corruption and firm responses Nathan M Jensen et al
1504
Journal of International Business Studies