Embed Size (px)
Citation preview

BOSTON UNIVERSITY
GRADUATE SCHOOL OF ARTS AND SCIENCES
Dissertation
UNDERSTANDING CORTICAL AND CEREBELLAR
CONTRIBUTIONS TO SPEECH PRODUCTION THROUGH
MODELING AND FUNCTIONAL IMAGING
by
SATRAJIT SUJIT GHOSH
B.S.(Honors), National University of Singapore, 1997
Submitted in partial fulfillment of the
requirements for the degree of
Doctor of Philosophy
2005

c© Copyright bySATRAJIT SUJIT GHOSH2004
Approved by
First Reader
Frank H. Guenther, PhDAssociate Professor of Cognitive and Neural Systems
Second Reader
Joseph S. Perkell, PhDAdjunct Professor of Cognitive and Neural Systems
Third Reader
Daniel H. Bullock, PhDAssociate Professor of Cognitive and Neural Systems, andPsychology

“... she encased the substance of the brain, which she had made soft and fluid,with a hard earthen casing. She had decided to employ a soft and transparentmaterial in creating the brain, so that the images of things might impress them-selves more easily upon it. Then, dividing the whole cavity of the skull into threechambers, she assigned these to the three functions of the soul. In the frontalchamber provision was made for imagination to receive the shapes of things,and transmit all that it beheld to reason. Memory’s chamber was set at thevery back of the head, lest, dwelling at the threshold of perception, she should betroubled by a continual invasion of images. Reason dwelt between these two, toimpose its firm judgment on the workings of the others. She also set the organsof sensory perception close about the palace of the head, that judging intellectmight maintain close contact with the messenger senses. [...]
Sound emerges from the windpipe and stirs the still air. Once aroused, theagitation spreads, until the last wave of motion slackens, having attained itslimit and been drawn out to its full extent. Air provides the substance, andthe instrument of speech the form; from these two sound derives the shape andessence of speech. For the tongue forges sounds to the form and image of speechand serves as a hammer in the process. Shaped by its efforts, the articulatedsubstance of speech travels to the open ears. Having first been admitted to theear as though to the outer vestibule, the voice calls out and is admitted to theinner rooms. The ear keeps outside the rhythm and the resonance of the words,but the thought signified gains admittance. The ear interprets what comes fromwithout, the tongue reveals what is within; and each requires the aid of the other.The channel of the ear is tortuous, lest cold air should pass by too open a pathto the brain. Nature feared for its frail condition, and so a winding path leadsinward from the curving shore.”
Bernardus Silvestris, Cosmographia (circa 1146), ”Microcosmos”, ChaptersXIII, XIV (translated from the Latin by Winthrop Wetherbee).
iv
Acknowledgments
Some people refer to a PhD as Permanent head Damage, but I have to say that finishing this
degree did not even give me a headache. And that is due to the tremendous encouragement
and support that I have received from everyone along the way.
I have to start by thanking Lonce Wyse for introducing me to the work of somebody
named Frank Guenther in the summer of 1996. Least did I know at that point in time
that Frank would become such an important figure in my life. I would like to thank Steve
Grossberg, Gail Carpenter and the rest of the CNS faculty for accepting me to the program,
and Boston University, CNS and NIH for the financial support1. Thanks are also due to
the various faculty members at Boston University whose classes have been a source of
knowledge and inspiration. Many thanks also to Robin, Carol, Cindy and the rest of the
administrative staff for ensuring that I could concentrate on research instead of worrying
about administrative details.
This dissertation would not have been completed without the support of Larry Wald,
Mary Foley, Larry White and others in the Martinos center at MGH who help make brain
imaging almost a walk in the park. Discussions with my readers Joseph Perkell and Daniel
Bullock have been extremely helpful and enlightening. I would like to thank Ennio Mingolla
and Michele Rucci for being part of the defense committee. While there is a long list of
people who have contributed in some way or other to finishing this dissertation, none have
spent as much time and effort on it as my advisor and friend, Frank. I have learned a lot
from him and he has been there with help and support whenever needed. I wish every grad
student has an advisor like him.
Starting from the days of room B05 to the days of room 102, the members of the
SpeechLab have always been there to discuss science, politics, sports, music and the best
chicken wings in town. I especially thank Jason Tourville and Alfonso Nieto-Castanon
for being patient (although on the verge of exploding) about dealings with the word “to-
1This work has been partially funded by NIH grants R01 DC02852 (Frank Guenther, PI) and R01DC01925 (Joseph Perkell, PI).
v
pography,” besides countless other discussions. Thanks are also due Bradley Rhodes and
Jason Bohland for being such patient sounding boards. The entertaining atmosphere at
CNS made the journey enjoyable and without the ultimate frisbee, softball, golf and CNS
parties I might have lost my sanity.
Finally, I would not be writing this page today had it not been for the never subsiding
support and encouragement from my parents, my sister Dia and my partner in life Katrien.
They were there whenever I needed a boost. Katrien has spent countless hours listening to
discussions of the model and proofreading this dissertation. To them, I dedicate this work.
vi
UNDERSTANDING CORTICAL AND CEREBELLAR CONTRIBUTIONS
TO SPEECH PRODUCTION THROUGH MODELING AND
FUNCTIONAL IMAGING
(Order No. )
SATRAJIT SUJIT GHOSH
Boston University Graduate School of Arts and Sciences, 2005
Major Professor: Frank H. Guenther, Associate Professor of Cognitiveand Neural Systems
Abstract
This thesis reports modeling and experimental work investigating brain function dur-
ing speech production. In particular, the modeling work investigates speech motor control
and development in the presence of neural transmission and sensory delays. Prior mod-
els addressing speech production phenomena did not consider these delays and could not
explain timing data from experiments involving perturbation to speech articulators while
speaking. The modeling section of this thesis extends the DIVA model of speech produc-
tion by mapping components of the model to different brain regions and adding realistic
delays between these regions. Introducing these temporal constraints necessitates a re-
consideration of how the model learns and controls the speech articulators. These issues
are addressed in two ways: first, by separating the model into feedforward and feedback
subsystems; second, by involving the cerebellum. Simulations using simple modifications
of an existing cerebellar model demonstrate cerebellar contributions to learning in the feed-
forward subsystem and to temporal alignment of delayed sensory feedback with internal
sensory expectations that arise during execution of speech in the feedback subsystem. The
extended speech production model can simulate utterances from a speaker and temporal
data from perturbation experiments, and generates predictions that can be tested using
vii

functional magnetic resonance imaging (fMRI) and psychophysical experiments.
Functional imaging studies of speech production have concentrated primarily on word
production and linguistic aspects of speech communication. The experimental component
of the thesis investigates brain regions involved in overt speech production of simple syl-
lables and two-syllable nonsense words using fMRI. Statistical analyses of the fMRI data
collected from normal speakers of American English reveal activity in a large network of
brain regions, even for the simplest utterances (e.g., “ba”, “oo”). Further analysis con-
cludes that the cerebellum was notably active, first, during consonant-vowel production
(e.g., “ba”), which requires stricter timing compared to vowel production, and secondly,
during bisyllabic production (e.g., “pihdih”), which requires sequencing. Statistical anal-
yses of data collected from ataxic dysarthrics (subjects with cerebellar damage) reveals
bilateral activity in premotor cortex in contrast to normal subjects’ lateralized activity in
the left hemisphere. This suggests that the right premotor cortex may be compensating
for the lack of cerebellar activity.
viii
Contents
1 Introduction 1
1.1 Hypothesis . . . . . . . . . . . . . . . . . . . . . . . . . . . . . . . . . . . . 1
1.2 Motivation . . . . . . . . . . . . . . . . . . . . . . . . . . . . . . . . . . . . 3
1.3 Organization of dissertation . . . . . . . . . . . . . . . . . . . . . . . . . . . 4
2 Functional neuroanatomy of speech and issues in neurophysiological con-
trol theory 6
2.1 Introduction . . . . . . . . . . . . . . . . . . . . . . . . . . . . . . . . . . . . 6
2.2 Review of functional neuroanatomy of speech . . . . . . . . . . . . . . . . . 6
2.2.1 Brain regions involved in production and perception . . . . . . . . . 7
2.2.2 Learning and practice . . . . . . . . . . . . . . . . . . . . . . . . . . 8
2.2.3 Performance monitoring . . . . . . . . . . . . . . . . . . . . . . . . . 10
2.2.4 Inter-region communication . . . . . . . . . . . . . . . . . . . . . . . 11
2.3 Transmission delays and control mechanisms . . . . . . . . . . . . . . . . . 13
2.3.1 What is an adaptive controller? . . . . . . . . . . . . . . . . . . . . . 14
2.3.2 Feedback control . . . . . . . . . . . . . . . . . . . . . . . . . . . . . 15
2.3.3 Feedforward control . . . . . . . . . . . . . . . . . . . . . . . . . . . 16
2.3.4 Combining feedback and feedforward control . . . . . . . . . . . . . 17
2.3.5 Neurophysiological constraints . . . . . . . . . . . . . . . . . . . . . 18
2.3.6 Choosing a control mechanism . . . . . . . . . . . . . . . . . . . . . 21
3 The DIVA model 22
3.1 Introduction . . . . . . . . . . . . . . . . . . . . . . . . . . . . . . . . . . . . 22
3.2 Review of earlier versions of the DIVA model . . . . . . . . . . . . . . . . . 23
3.2.1 Vocal tract model . . . . . . . . . . . . . . . . . . . . . . . . . . . . 23
ix
3.2.2 Articulator Direction Vector and Articulator Position Vector . . . . 25
3.2.3 Planning Position Vector . . . . . . . . . . . . . . . . . . . . . . . . 25
3.2.4 Speech Sound Map . . . . . . . . . . . . . . . . . . . . . . . . . . . . 26
3.2.5 Planning Direction Vector . . . . . . . . . . . . . . . . . . . . . . . . 26
3.2.6 Learning the mappings (transformations) . . . . . . . . . . . . . . . 27
3.2.7 Control mechanism . . . . . . . . . . . . . . . . . . . . . . . . . . . . 28
3.3 Description of the extended DIVA model . . . . . . . . . . . . . . . . . . . . 29
3.3.1 Description of the model . . . . . . . . . . . . . . . . . . . . . . . . . 29
3.3.2 General model equations and representations . . . . . . . . . . . . . 38
3.3.3 The synaptic projections . . . . . . . . . . . . . . . . . . . . . . . . . 46
3.4 Simulations . . . . . . . . . . . . . . . . . . . . . . . . . . . . . . . . . . . . 51
3.4.1 Simulation 1: “good doggie” . . . . . . . . . . . . . . . . . . . . . . 51
3.4.2 Simulation 2: Abbs and Gracco (1984) lip perturbation . . . . . . . 52
3.4.3 Simulation 3: Kelso, Tuller,Vatikiotis-Bateson and Fowler (1984) jaw
perturbation . . . . . . . . . . . . . . . . . . . . . . . . . . . . . . . 54
3.5 Summary . . . . . . . . . . . . . . . . . . . . . . . . . . . . . . . . . . . . . 56
4 The Cerebellum and its relation to DIVA 58
4.1 Introduction . . . . . . . . . . . . . . . . . . . . . . . . . . . . . . . . . . . . 58
4.2 Review of cerebellar neuroanatomy, neurophysiology and models . . . . . . 59
4.2.1 Neuroanatomy and neurophysiology . . . . . . . . . . . . . . . . . . 59
4.2.2 Neuroanatomy: internal structure of the cerebellum . . . . . . . . . 60
4.2.3 Neurophysiology . . . . . . . . . . . . . . . . . . . . . . . . . . . . . 62
4.3 Classical conditioning, hypothesized functions and the RSL model . . . . . 64
4.3.1 Cerebellar role in classical conditioning . . . . . . . . . . . . . . . . 65
4.3.2 The functional roles of the cerebellum . . . . . . . . . . . . . . . . . 66
4.3.3 RSL model of cerebellar learning . . . . . . . . . . . . . . . . . . . . 69
4.4 A revised model of the cerebellum . . . . . . . . . . . . . . . . . . . . . . . 71
4.4.1 Issues to address . . . . . . . . . . . . . . . . . . . . . . . . . . . . . 71
x

4.4.2 Proposed modifications . . . . . . . . . . . . . . . . . . . . . . . . . 72
4.4.3 Summary of revised model . . . . . . . . . . . . . . . . . . . . . . . 79
4.5 Discussion of cerebellar contributions to DIVA . . . . . . . . . . . . . . . . 79
5 Review of Ataxic dysarthria 82
5.1 Introduction . . . . . . . . . . . . . . . . . . . . . . . . . . . . . . . . . . . . 82
5.2 Ataxic dysarthria: a review . . . . . . . . . . . . . . . . . . . . . . . . . . . 82
5.2.1 Deficits in timing . . . . . . . . . . . . . . . . . . . . . . . . . . . . . 84
5.2.2 Deficits in motor learning . . . . . . . . . . . . . . . . . . . . . . . . 86
5.2.3 Acoustic analysis of dysarthric speech: some examples . . . . . . . . 87
6 FMRI studies of speech production 90
6.1 Introduction . . . . . . . . . . . . . . . . . . . . . . . . . . . . . . . . . . . . 90
6.2 Review of hypotheses . . . . . . . . . . . . . . . . . . . . . . . . . . . . . . . 90
6.3 Data acquisition and analysis . . . . . . . . . . . . . . . . . . . . . . . . . . 91
6.3.1 Data acquisition . . . . . . . . . . . . . . . . . . . . . . . . . . . . . 91
6.3.2 Data analysis . . . . . . . . . . . . . . . . . . . . . . . . . . . . . . . 92
6.4 Experiment 1 . . . . . . . . . . . . . . . . . . . . . . . . . . . . . . . . . . . 94
6.4.1 Subjects, stimuli and results . . . . . . . . . . . . . . . . . . . . . . . 94
6.4.2 Results . . . . . . . . . . . . . . . . . . . . . . . . . . . . . . . . . . 95
6.5 Experiment 2 . . . . . . . . . . . . . . . . . . . . . . . . . . . . . . . . . . . 99
6.5.1 Subjects, Stimuli and Results . . . . . . . . . . . . . . . . . . . . . . 99
6.5.2 Results from standard and ROI analysis . . . . . . . . . . . . . . . . 101
6.6 Interpretations of the results using the DIVA model . . . . . . . . . . . . . 102
6.6.1 Motor cortex: (BA 4, vMC) . . . . . . . . . . . . . . . . . . . . . . . 104
6.6.2 Ventral Premotor cortex (BA 6, vPMC) . . . . . . . . . . . . . . . . 106
6.6.3 Broca’s area and frontal operculum (BA 44, IFo, IFt, FO) . . . . . . 108
6.6.4 Cerebellum . . . . . . . . . . . . . . . . . . . . . . . . . . . . . . . . 110
6.6.5 Somatosensory cortex and supramarginal gyrus . . . . . . . . . . . . 111
xi

6.6.6 Auditory cortex and STG, STS, MTG . . . . . . . . . . . . . . . . . 113
6.6.7 SMA . . . . . . . . . . . . . . . . . . . . . . . . . . . . . . . . . . . . 115
6.7 Discussion . . . . . . . . . . . . . . . . . . . . . . . . . . . . . . . . . . . . . 116
7 Conclusion and future directions 118
7.1 Summary of research . . . . . . . . . . . . . . . . . . . . . . . . . . . . . . . 118
7.2 Future directions . . . . . . . . . . . . . . . . . . . . . . . . . . . . . . . . . 120
A Parcellation Scheme 124
B Augmented Tactile Feedback model 129
C Vocal tract model 130
D Simulation parameter choices 131
D.1 Parameter list . . . . . . . . . . . . . . . . . . . . . . . . . . . . . . . . . . . 131
D.2 Simulation parameters . . . . . . . . . . . . . . . . . . . . . . . . . . . . . . 132
E ROI Results 133
References 144
Curriculum Vitae 167
xii

List of Tables
5.1 Etiologies of ataxic dysarthria . . . . . . . . . . . . . . . . . . . . . . . . . . 83
6.1 Examples of different stimulus types . . . . . . . . . . . . . . . . . . . . . . 94
6.2 Speaking compared to basline . . . . . . . . . . . . . . . . . . . . . . . . . . 96
6.3 CVCV compared to CV . . . . . . . . . . . . . . . . . . . . . . . . . . . . . 98
6.4 CV compared to V . . . . . . . . . . . . . . . . . . . . . . . . . . . . . . . . 98
6.5 Speaking compared to baseline in ataxic dysarthrics . . . . . . . . . . . . . 101
6.6 Speaking compared to baseline in ataxic dysarthrics . . . . . . . . . . . . . 102
A.1 Primary cerebral ROIs . . . . . . . . . . . . . . . . . . . . . . . . . . . . . . 125
A.2 Remaining cerebral ROIs . . . . . . . . . . . . . . . . . . . . . . . . . . . . 127
A.3 Cerebellar ROIs . . . . . . . . . . . . . . . . . . . . . . . . . . . . . . . . . . 128
D.1 Model parameters . . . . . . . . . . . . . . . . . . . . . . . . . . . . . . . . 131
xiii

List of Figures
2·1 Brain regions involved in speech production from a meta-analysis . . . . . . 8
2·2 Brain regions involved in speech production from fMRI data . . . . . . . . . 9
2·3 Negative Feedback Control . . . . . . . . . . . . . . . . . . . . . . . . . . . 16
2·4 Gain delay trade-offs . . . . . . . . . . . . . . . . . . . . . . . . . . . . . . . 17
2·5 PID control scheme . . . . . . . . . . . . . . . . . . . . . . . . . . . . . . . . 18
2·6 Model predictive control scheme . . . . . . . . . . . . . . . . . . . . . . . . 18
2·7 Smith predictor control scheme . . . . . . . . . . . . . . . . . . . . . . . . . 19
2·8 Buffer solution to matching delays . . . . . . . . . . . . . . . . . . . . . . . 20
3·1 DIVA model circa(1998) . . . . . . . . . . . . . . . . . . . . . . . . . . . . . 24
3·2 The extended DIVA model . . . . . . . . . . . . . . . . . . . . . . . . . . . 30
3·3 DIVA: Sensory expectations . . . . . . . . . . . . . . . . . . . . . . . . . . . 33
3·4 DIVA: Feedback signals . . . . . . . . . . . . . . . . . . . . . . . . . . . . . 36
3·5 DIVA: Feedforward signals . . . . . . . . . . . . . . . . . . . . . . . . . . . . 37
3·6 Simluation of the utterance “good doggie” . . . . . . . . . . . . . . . . . . . 53
3·7 Simulation of lip perturbation . . . . . . . . . . . . . . . . . . . . . . . . . . 55
3·8 Simulation of jaw perturbation . . . . . . . . . . . . . . . . . . . . . . . . . 57
4·1 Internal structure of the cerebellum . . . . . . . . . . . . . . . . . . . . . . . 61
4·2 Phylogenetic subdivisions of the cerebellum . . . . . . . . . . . . . . . . . . 63
4·3 Allen and Tsukahara (1974) hypothesized function of the cerebellum . . . . 67
4·4 Spectrum of second messenger cascades in a Purkinje cell . . . . . . . . . . 70
4·5 Parallel fiber to climbing fiber synchronization . . . . . . . . . . . . . . . . 73
4·6 A cerebellar solution to learning the feedforward commands . . . . . . . . . 74
xiv

4·7 Cerebellar solution to aligning sensory signals . . . . . . . . . . . . . . . . . 76
4·8 An alternative cerebellar solution to learning the feedforward commands . . 78
5·1 Comparison of normal and ataxic dysarthric speech . . . . . . . . . . . . . . 88
6·1 Event triggered paradigm . . . . . . . . . . . . . . . . . . . . . . . . . . . . 92
6·2 fMRI data processing stream . . . . . . . . . . . . . . . . . . . . . . . . . . 93
6·3 SPM and ROI analysis of normal subjects speaking . . . . . . . . . . . . . . 97
6·4 SPM and ROI analysis of normal subjects: CVCV-CV . . . . . . . . . . . . 97
6·5 Examples of cerebellar atrophy . . . . . . . . . . . . . . . . . . . . . . . . . 100
6·6 SPM and ROI analysis of ataxic dysarthric subjects’ data . . . . . . . . . . 103
A·1 Parcellation of cerebral and cerebellar cortex . . . . . . . . . . . . . . . . . 126
E·1 Experiment 1 ROI results: motor, insular and opercular areas . . . . . . . . 134
E·2 Experiment 1 ROI results: sensory and cerebellar areas . . . . . . . . . . . 135
E·3 Experiment 1 ROI results: inhibited areas . . . . . . . . . . . . . . . . . . . 136
E·4 Experiment 1 ROI results main contrasts: motor, insular and opercular areas137
E·5 Experiment 1 ROI results main contrasts: sensory and cerebellar areas . . . 138
E·6 Experiment 2 ROI results: motor, insular and opercular areas . . . . . . . . 139
E·7 Experiment 2 ROI results: sensory and cerebellar areas . . . . . . . . . . . 140
E·8 Experiment 2 ROI results: inhibited areas . . . . . . . . . . . . . . . . . . . 141
E·9 Experiment 2 ROI results main contrasts: motor, insular and opercular areas142
E·10 Experiment 2 ROI results main contrasts: sensory and cerebellar areas . . . 143
xv

LIST OF ABBREVIATIONS
3D . . . . . . . . . . . . . . Three Dimensional
aCG . . . . . . . . . . . . . . Anterior Cingulate Gyrus
aCO . . . . . . . . . . . . . . Anterior Central Operculum
AD . . . . . . . . . . . . . . Ataxic Dysarthria
adPMC . . . . . . . . . . . . . . Anterior Dorsal Premotor Cortex
adSTs . . . . . . . . . . . . . . Anterior Dorsal Superior Temporal Sulcus
Ag . . . . . . . . . . . . . . Angular Gyrus
aINS . . . . . . . . . . . . . . Anterior Insula
aITg . . . . . . . . . . . . . . Anterior Inferior Temporal Gyrus
alCB . . . . . . . . . . . . . . Anterior Lateral Cerebellum
amCB . . . . . . . . . . . . . . Anterior Medial Cerebellum
aMFg . . . . . . . . . . . . . . Anterior Middle Frontal Gyrus
aMTg . . . . . . . . . . . . . . Anterior Middle Temporal Gyrus
aPHg . . . . . . . . . . . . . . Anterior Parahippocampal Gyrus
aSMA . . . . . . . . . . . . . . Anterior Supplementary Motor Area
aSMg . . . . . . . . . . . . . . Anterior Supramarginal Gyrus
aSTg . . . . . . . . . . . . . . Anterior Superior Temporal Gyrus
aTFg . . . . . . . . . . . . . . Anterior Temporal Fusiform Gyrus
avSTs . . . . . . . . . . . . . . Anterior Ventral Superior Temporal Sulcus
BA . . . . . . . . . . . . . . Brodmann Area
BOLD . . . . . . . . . . . . . . Blood Oxygenation Level Dependent
CF . . . . . . . . . . . . . . Climbing Fiber
xvi

CN . . . . . . . . . . . . . . Cranial Nerves
CNS . . . . . . . . . . . . . . Cental Nervous System
CR . . . . . . . . . . . . . . Conditioned Response
CS . . . . . . . . . . . . . . Conditioned Stimulus
CV . . . . . . . . . . . . . . Consonant-vowel
CVCV . . . . . . . . . . . . . . Sequence Of Two Cvs
DAF . . . . . . . . . . . . . . Delayed Auditory Feedback
DCN . . . . . . . . . . . . . . Deep Cerebellar Nuclei
DIVA . . . . . . . . . . . . . . Directions Into Velocities Of Articulators
dMC . . . . . . . . . . . . . . Dorsal Primary Motor Cortex
dSC . . . . . . . . . . . . . . Dorsal Somatosensory Cortex
EMG . . . . . . . . . . . . . . Electromyography
FDR . . . . . . . . . . . . . . False Discovery Rate Correction
FMC . . . . . . . . . . . . . . Frontal Medial Cortex
fMRI . . . . . . . . . . . . . . Functional Magnetic Resonance Imaging
FO . . . . . . . . . . . . . . Frontal Operculum
FOC . . . . . . . . . . . . . . Frontal Orbital Cortex
FOV . . . . . . . . . . . . . . Field Of View
FP . . . . . . . . . . . . . . Frontal Pole
FWE . . . . . . . . . . . . . . Family-wise Error Correction
GrC . . . . . . . . . . . . . . Granule Cell
Hg . . . . . . . . . . . . . . Heschl’s Gyrus
IFo . . . . . . . . . . . . . . Inferior Frontal Gyrus, Pars Opercularis
IFt . . . . . . . . . . . . . . Inferior Frontal Gyrus, Pars Triangularis
IO . . . . . . . . . . . . . . Inferior Olive
iplCB . . . . . . . . . . . . . . Inferior Posterior Lateral Cerebellum
ipmCB . . . . . . . . . . . . . . Inferior Posterior Medial Cerebellum
ITOg . . . . . . . . . . . . . . Inferior Temporal Occipital Gyrus
xvii

Lg . . . . . . . . . . . . . . Lingual Gyrus
LTD . . . . . . . . . . . . . . Long Term Depression
LTP . . . . . . . . . . . . . . Long Term Potentiation
mdPMC . . . . . . . . . . . . . . Middle Dorsal Premotor Cortex
MEG . . . . . . . . . . . . . . Magnetoencephalography
MF . . . . . . . . . . . . . . Mossy Fiber
MNI . . . . . . . . . . . . . . Montreal Neurological Institute
MR . . . . . . . . . . . . . . Magnetic Resonance
MRI . . . . . . . . . . . . . . Magnetic Resonance Imaging
MTOg . . . . . . . . . . . . . . Middle Temporal Occipital Gyrus
NMR . . . . . . . . . . . . . . Nictitating Membrane Response
OC . . . . . . . . . . . . . . Occipital Cortex
PC . . . . . . . . . . . . . . Purkinje Cell
pCG . . . . . . . . . . . . . . Posterior Cingulate Gyrus
PCN . . . . . . . . . . . . . . Precuneus Cortex
pCO . . . . . . . . . . . . . . Posterior Central Operculum
pdPMC . . . . . . . . . . . . . . Posterior Dorsal Premotor Cortex
pdSTs . . . . . . . . . . . . . . Posterior Dorsal Superior Temporal Sulcus
PET . . . . . . . . . . . . . . Positron Emission Tomography
PF . . . . . . . . . . . . . . Parallel Fiber
PID . . . . . . . . . . . . . . Proportional Integral Derivative
pINS . . . . . . . . . . . . . . Posterior Insula
pITg . . . . . . . . . . . . . . Posterior Inferior Temporal Gyrus
pMFg . . . . . . . . . . . . . . Posterior Middle Frontal Gyrus
pMTg . . . . . . . . . . . . . . Posterior Middle Temporal Gyrus
PO . . . . . . . . . . . . . . Parietal Operculum
PP . . . . . . . . . . . . . . Planum Polare
pPC . . . . . . . . . . . . . . Posterior Parietal Cortex
xviii

pPH . . . . . . . . . . . . . . Posterior Parahippocampal Gyrus
pSMA . . . . . . . . . . . . . . Posterior Supplementary Motor Area
pSMg . . . . . . . . . . . . . . Posterior Supramarginal Gyrus
pSTg . . . . . . . . . . . . . . Posterior Superior Temporal Gyrus
PT . . . . . . . . . . . . . . Planum Temporale
pTFg . . . . . . . . . . . . . . Posterior Temporal Fusiform Gyrus
pvSTs . . . . . . . . . . . . . . Posterior Ventral Superior Temporal Sulcus
ROI . . . . . . . . . . . . . . Region Of Interest
RSL . . . . . . . . . . . . . . Recurrent Slide And Latch
rTMS . . . . . . . . . . . . . . Repetitive Transcranial Magnetic Stimulation
rV . . . . . . . . . . . . . . /r/-heavy Vowel
SCC . . . . . . . . . . . . . . Subcallosal Cortex
SFg . . . . . . . . . . . . . . Superior Frontal Gyrus
SMA . . . . . . . . . . . . . . Supplementary Motor Area
SMg . . . . . . . . . . . . . . Supramarginal Gyrus
SPL . . . . . . . . . . . . . . Superior Parietal Lobule
splCB . . . . . . . . . . . . . . Superior Posterior Lateral Cerebellum
SPM . . . . . . . . . . . . . . Statistical Parametric Mapping
spmCB . . . . . . . . . . . . . . Superior Posterior Medial Cerebellum
STP . . . . . . . . . . . . . . Superior Temporal Polysensory
TE . . . . . . . . . . . . . . Time Of Echo
TMS . . . . . . . . . . . . . . Transcranial Magnetic Stimulation
TOFg . . . . . . . . . . . . . . Temporal Occipital Fusiform Gyrus
TP . . . . . . . . . . . . . . Temporal Pole
TR . . . . . . . . . . . . . . Time Of Repetition
US . . . . . . . . . . . . . . Unconditioned Stimulus
V . . . . . . . . . . . . . . Vowel
vMC . . . . . . . . . . . . . . Ventral Primary Motor Cortex
xix

vSC . . . . . . . . . . . . . . Ventral Somatosensory Cortex
yV . . . . . . . . . . . . . . /y/-heavy Syllables
xx
Chapter 1
INTRODUCTION
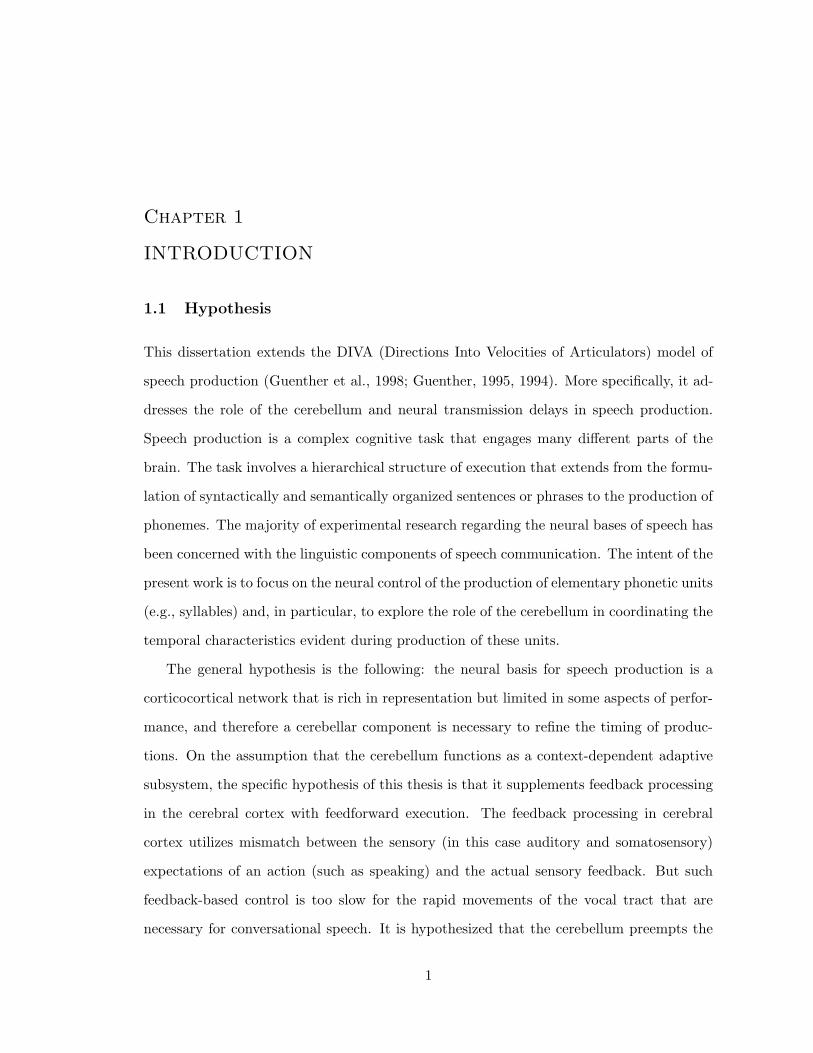
1.1 Hypothesis
This dissertation extends the DIVA (Directions Into Velocities of Articulators) model of
speech production (Guenther et al., 1998; Guenther, 1995, 1994). More specifically, it ad-
dresses the role of the cerebellum and neural transmission delays in speech production.
Speech production is a complex cognitive task that engages many different parts of the
brain. The task involves a hierarchical structure of execution that extends from the formu-
lation of syntactically and semantically organized sentences or phrases to the production of
phonemes. The majority of experimental research regarding the neural bases of speech has
been concerned with the linguistic components of speech communication. The intent of the
present work is to focus on the neural control of the production of elementary phonetic units
(e.g., syllables) and, in particular, to explore the role of the cerebellum in coordinating the
temporal characteristics evident during production of these units.
The general hypothesis is the following: the neural basis for speech production is a
corticocortical network that is rich in representation but limited in some aspects of perfor-
mance, and therefore a cerebellar component is necessary to refine the timing of produc-
tions. On the assumption that the cerebellum functions as a context-dependent adaptive
subsystem, the specific hypothesis of this thesis is that it supplements feedback processing
in the cerebral cortex with feedforward execution. The feedback processing in cerebral
cortex utilizes mismatch between the sensory (in this case auditory and somatosensory)
expectations of an action (such as speaking) and the actual sensory feedback. But such
feedback-based control is too slow for the rapid movements of the vocal tract that are
necessary for conversational speech. It is hypothesized that the cerebellum preempts the
1

2
cortical, feedback-based control commands by providing feedforward commands that are
well-timed.
Experimental observations point to the involvement of the cerebellum in a wide variety
of motor and cognitive tasks. The cerebellum has a uniquely uniform neurophysiological
architecture and widespread connectivity to and from cerebral cortex. Based on these facts,
Dow and Moruzzi (1958) conjectured that it ”may be utilized, alone or in combination, for
quite different purposes.” Several models of the cerebellum connect it with timed prediction
specifically: it learns to produce proper responses or outputs at appropriate times when
provided with a certain context or input. The Recurrent Slide and Latch (RSL) model
(Rhodes and Bullock, 2002) is one such model. This study modifies the RSL model to
extend its functionality so that it can be used in a more general theory of cerebellar
involvement in brain function. But the main purpose of this dissertation is to use the
modified cerebellar model to extend the DIVA model of speech production. In other words,
the cerebellar model in the extended DIVA model is based on a modification of the RSL
model of cerebellar timing. This extension is necessary because the current version of DIVA
does not take into account delays, does not contain a feedforward component of the form
explored in this dissertation1, and does not have an explicit cerebellar component.
The hypothesis in the specific context of speech production is therefore the follow-
ing. Early in speech development, the feedback mechanism is the driving force while the
feedforward system develops as it learns from the feedback system. Gradually there is a
transfer of control from the feedback to the feedforward system. In a mature speaker, the
system typically relies on the feedforward controller for production. However, in the case
of perturbations, whether auditory or somatosensory, only the feedback system provides
information about the perturbation. Changes in the vocal tract length and shape during
development might also be thought of as perturbations. Here also the feedback system
1The current DIVA model uses an internal model to predict sensory consequences of motor behavior anduses the difference between the targeted and predicted consequence to drive motor output. This is referredto as model-predictive control, that is feedback control using an internal model of the motor to sensorytransformation. Since this type of control does not utilize actual feedback, it can be thought of as a formof feedforward control.

3
monitors changes in sensory feedback and provides information to update the feedforward
controller appropriately. In this study another kind of disruption of the normal speech
process is investigated in an experiment conducted using functional Magnetic Resonance
Imaging (fMRI): a cerebellar disorder called ataxic dysarthria. Ataxic dysarthria is a cere-
bellar disorder that results in speech motor control deficits, particularly in problems with
timing. The experiment compares and contrasts the brain activity of normal subjects to
that of individuals diagnosed with ataxic dysarthria when uttering simple phonetic units
of speech. The newly extended DIVA model is used to interpret the results from the
experiment.
In short, this research has been guided by the following questions. How does the central
nervous system (CNS) efficiently combine feedforward and feedback processes for speech
production? How do regions of the CNS differ in activity when producing different types
of simple phonetic elements that do not contain syntactic information? How does this
behavior change in the absence of a functional cerebellum? How does the proposed model
explain the differences? The study integrates existing knowledge of cerebellar function from
electrophysiological and imaging experiments, from the modeling literature, anatomical
and clinical observations, and from the findings of the fMRI experiment, into the extended
DIVA model.
1.2 Motivation
Relatively little was known about brain function during speech and language tasks until
the late 1980’s. The recent advent of functional brain imaging techniques that are safe
for use on human subjects has led to an explosion in the amount of data concerning brain
activity during speech and language tasks since that time. As these data accumulate, it is
becoming increasingly important to have a modeling framework within which to interpret
data from the various studies. Without such a framework, these important data can seem
like a random set of information points rather than a coherent description of the neural
processes underlying speech.

4
Perhaps the most comprehensive current model of speech production to date is DIVA.
To date, however, DIVA has primarily been used to explain psychophysical observations
without addressing the underlying neural processes and areas in detail. Like most models of
motor control, it avoids the crucial timing issues related to delays in sensory feedback and
varied neural conduction velocities that cause transmission delays in the nervous system.
The intent in this dissertation is to extend the DIVA model so that it can provide a
framework in which to address the brain imaging data, as well as issues of motor control
such as timing and transmission delays. The model can guide more pertinent research
questions and experiments in the future.
1.3 Organization of dissertation
This dissertation is divided into two parts. The first part presents the enhanced DIVA
model of the temporal dynamics of speech production. Chapter 2 provides the background
for the dissertation. After reviewing the literature on imaging studies of speech, it ad-
dresses key issues in neurophysiological control theory, such as controlling in the presence
of transmission delays, feedback delays and sensor noise. In Chapter 3 appropriate control
mechanisms and corresponding neural substrates are brought to bear on speech production
by extending the DIVA model. First, the earlier versions of the DIVA model are reviewed,
and then the extended DIVA model is presented, along with a description and simulation
of the behavioral phenomena related to normal speech sequences that are explained by the
model. The dissertation turns specifically to the cerebellum in Chapter 4. After presenting
a review of cerebellar neuroanatomy, neurophysiology and models, it proposes a revised
model of the cerebellum (which is not specifically related to speech), as well as simulations,
using that model, of interactions between cerebellum and cerebral cortex. The chapter ends
with a discussion of how this cerebellar model addresses timing and learning issues in the
new DIVA model.
The second part of the dissertation experimentally explores brain function during speech
production by contrasting individuals with and without ataxic dysarthria. Chapter 5

5
reviews the literature on ataxic dysarthria. Chapter 6 then presents the fMRI experiment
that was conducted specifically for this study. Results for both normal speakers and ataxic
dysarthrics are then presented, including comparisons between the two subject groups.
Finally, these results are interpreted using the DIVA model.
The last chapter summarizes the findings, points to alternative models and hypothe-
ses, proposes further experiments to test certain assumptions in the model, and identifies
directions for future research of speech production using the DIVA model.
Chapter 2
FUNCTIONAL NEUROANATOMY OF SPEECH AND
ISSUES IN NEUROPHYSIOLOGICAL CONTROL
THEORY
2.1 Introduction
The purpose of this chapter is to provide an overview of the brain areas involved in speech
production and the speech motor control issues that arise from neural transmission delays.
The first part of this chapter provides a review of brain areas involved in speech production
and perception as revealed by functional imaging studies. These studies are discussed in
terms of mechanisms hypothesized to be part of the speech production and perception
network. The second part of this chapter discusses issues in neurophysiological control
theory. In particular, it deals with motor control in the presence of transmission delays,
feedback delays and noise in sensor feedback.
2.2 Review of functional neuroanatomy of speech
A model of speech production in the brain necessarily involves interaction among a variety
of sensory and motor regions. These regions are involved in learning, monitoring the
result of production and the external environment and transferring information between
them as they carry out speech. The DIVA model (described in Chapter 3) draws on
data from a variety of experimental studies describing the functional organization of brain
areas. The purpose of the following paragraphs is to provide an overview of experimental
observations of the brain areas and hypothesized brain mechanisms involved in production
and perception.
6
7
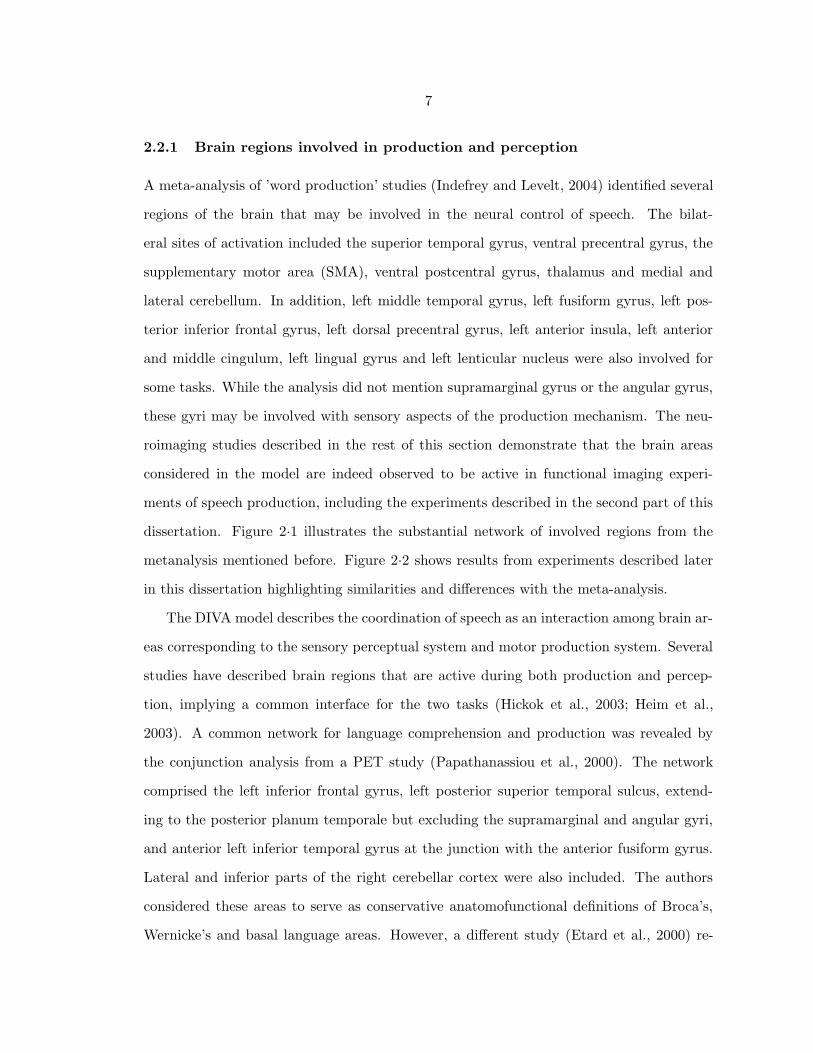
2.2.1 Brain regions involved in production and perception
A meta-analysis of ’word production’ studies (Indefrey and Levelt, 2004) identified several
regions of the brain that may be involved in the neural control of speech. The bilat-
eral sites of activation included the superior temporal gyrus, ventral precentral gyrus, the
supplementary motor area (SMA), ventral postcentral gyrus, thalamus and medial and
lateral cerebellum. In addition, left middle temporal gyrus, left fusiform gyrus, left pos-
terior inferior frontal gyrus, left dorsal precentral gyrus, left anterior insula, left anterior
and middle cingulum, left lingual gyrus and left lenticular nucleus were also involved for
some tasks. While the analysis did not mention supramarginal gyrus or the angular gyrus,
these gyri may be involved with sensory aspects of the production mechanism. The neu-
roimaging studies described in the rest of this section demonstrate that the brain areas
considered in the model are indeed observed to be active in functional imaging experi-
ments of speech production, including the experiments described in the second part of this
dissertation. Figure 2·1 illustrates the substantial network of involved regions from the
metanalysis mentioned before. Figure 2·2 shows results from experiments described later
in this dissertation highlighting similarities and differences with the meta-analysis.
The DIVA model describes the coordination of speech as an interaction among brain ar-
eas corresponding to the sensory perceptual system and motor production system. Several
studies have described brain regions that are active during both production and percep-
tion, implying a common interface for the two tasks (Hickok et al., 2003; Heim et al.,
2003). A common network for language comprehension and production was revealed by
the conjunction analysis from a PET study (Papathanassiou et al., 2000). The network
comprised the left inferior frontal gyrus, left posterior superior temporal sulcus, extend-
ing to the posterior planum temporale but excluding the supramarginal and angular gyri,
and anterior left inferior temporal gyrus at the junction with the anterior fusiform gyrus.
Lateral and inferior parts of the right cerebellar cortex were also included. The authors
considered these areas to serve as conservative anatomofunctional definitions of Broca’s,
Wernicke’s and basal language areas. However, a different study (Etard et al., 2000) re-

8
Figure 2·1: The figure shows brain regions that are considered reliably active (red) or inactive(blue)from a meta-analysis of word production studies [Adapted from Indefrey and Levelt (2004)].
ported that speech production does not necessarily involve the Wernicke-Broca language
network. A conjunction analysis of naming and verb generation showed a common network
including the ventral visual pathway for object recognition, bilateral anterior insula, SMA
and precentral gyrus for coordination, planning and overt word production.
2.2.2 Learning and practice
During development, the speech production and perception networks undergo a multi-
tude of changes. There seems to be an established timeline of development of different
capabilities of the system (Vihman, 1996). Using fMRI, Dehaene-Lambertz et al. (2002)
demonstrated the activation of left-lateralized brain regions in 3-month old infants similar
to those of adults when exposed to normal speech compared to reversed speech. The ac-
tivity in these regions, which include the superior temporal and angular gyri, suggests the

9
Figure 2·2: The figure shows brain regions that are significantly (p < 0.001 regional level) active(red) and inactive (blue) based on the results of a speech production experiment conducted for thisdissertation (the results are described later in Chapter 6). See Appendix A for an explanation oflabels.

10
formation of the perceptual network before speech is produced. Goffman and Smith (1999)
showed that in children speech movements reflect phonetically distinctive patterns by 4
years of age. A variability analysis indicated “that the stability of underlying patterning of
the movement sequence improves with maturation.” For fine motor control such as hand-
writing, there is a steady progression of reduction in amplitude and increase in speed during
learning of movements (Hamstra-Bletz and Blote, 1990; Zesiger et al., 1993). If the same
perceptual outcome is achieved, lower movement amplitudes with practice demonstrate an
increase in efficiency as it requires less effort to move a shorter distance. A similar effect
has been observed in kinematic studies of speech. Several studies found increases in move-
ment speed and reductions in amplitude and variability through development (Sharkey and
Folkins, 1985; Smith and Gartenberg, 1984; Smith and McLean-Muse, 1987). The effect
of practice was evident in an imaging study, in which silent (subvocal) recitation of names
of the months of the year showed concurrent activity in the right cerebellar hemisphere,
the SMA and left motor strip (Ackermann et al., 1998). The authors assumed that highly
over-learned word strings pose few demands on controlled response selection and therefore
concluded that the observed cerebellar and SMA activation is related to articulatory lev-
els of speech production rather than to cognitive operations. This suggests a role of the
cerebellum and the SMA in coordinating articulation of practiced utterances.
2.2.3 Performance monitoring
The DIVA model assumes that speech production is self-monitored and that this moni-
toring is used to tune the production system. However, the literature is still unclear as
to the exact mechanism used for self-monitoring (see Postma 2000, for an evaluation of
monitoring mechanisms) and how the result of monitoring is used to refine functionality.
One particular method that has been used for determining the neural bases of monitoring
is delayed auditory feedback (DAF) (Stuart et al., 2002). An fMRI study (Hashimoto and
Sakai, 2003) showed activations of bilateral superior temporal gyrus (STg), supramarginal
gyrus, and middle temporal gyrus during DAF compared to normal, fast and slow rates
11
of speaking under normal feedback. It also showed a correlation between STG activity
and the degree of dysfluency for all subjects. Based on other results, that study concluded
that temporo-parietal regions behave “as a conscious self-monitoring system to support an
automatic speech production system.” In a study using noise-masking (Oomen et al., 2001)
it was shown that noise-masked productions in Broca’s aphasics contain a lower number of
errors compared to productions with unmasked auditory feedback. The number of errors
was also lower than the number of errors made by normal subjects with normal auditory
feedback. These findings were taken to indicate that Broca’s aphasics do not rely on ex-
ternal feedback and use some prearticulatory monitoring mechanism for correcting errors.
This would indicate the existence of a mechanism in addition to feedback monitoring for
speech production. Prearticulatory monitoring will not be treated in the dissertation.
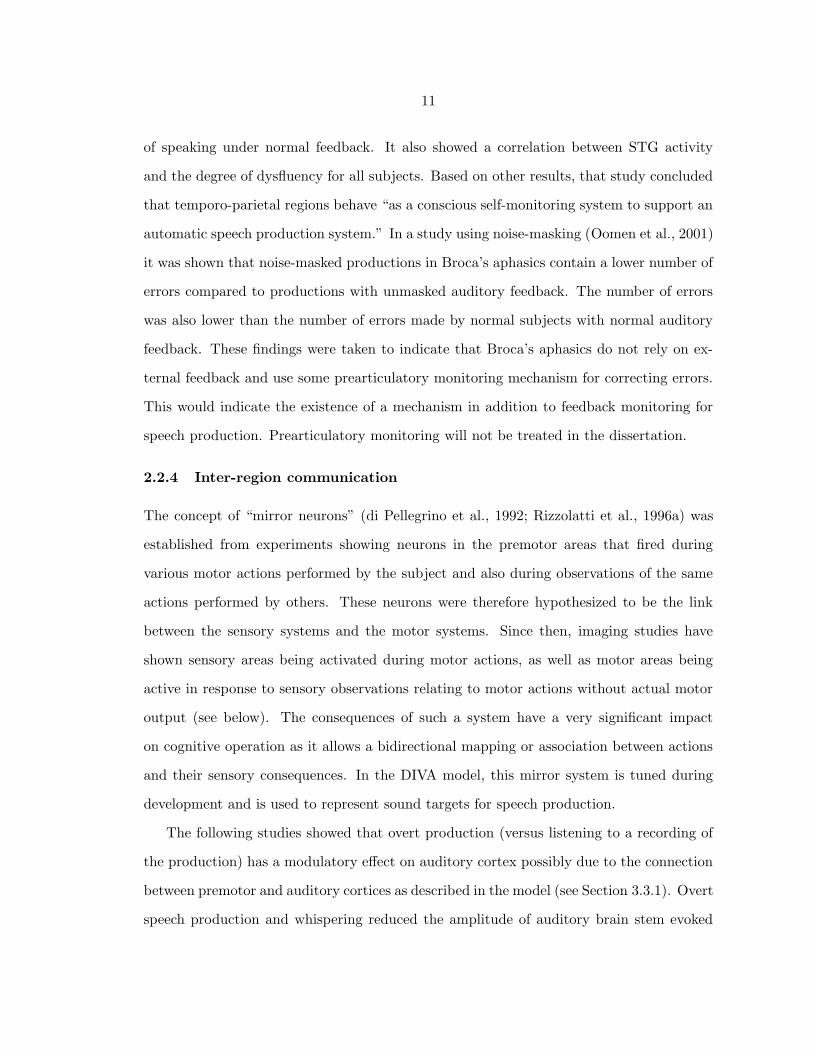
2.2.4 Inter-region communication
The concept of “mirror neurons” (di Pellegrino et al., 1992; Rizzolatti et al., 1996a) was
established from experiments showing neurons in the premotor areas that fired during
various motor actions performed by the subject and also during observations of the same
actions performed by others. These neurons were therefore hypothesized to be the link
between the sensory systems and the motor systems. Since then, imaging studies have
shown sensory areas being activated during motor actions, as well as motor areas being
active in response to sensory observations relating to motor actions without actual motor
output (see below). The consequences of such a system have a very significant impact
on cognitive operation as it allows a bidirectional mapping or association between actions
and their sensory consequences. In the DIVA model, this mirror system is tuned during
development and is used to represent sound targets for speech production.
The following studies showed that overt production (versus listening to a recording of
the production) has a modulatory effect on auditory cortex possibly due to the connection
between premotor and auditory cortices as described in the model (see Section 3.3.1). Overt
speech production and whispering reduced the amplitude of auditory brain stem evoked

12
responses (Papanicolaou et al., 1986) and left cortical hemisphere responses (Papanicolaou
et al., 1983) when compared to the responses from listening to external speech (not self
generated). This suppression has also been shown via magnetoencephalographic (MEG)
studies of covert versus overt production using tone bursts and vowel stimuli (Numminen
and Curio, 1999; Numminen et al., 1999). A recent MEG study of speech production
(Houde et al., 2002) suggested that during self-production the auditory cortex “(1) atten-
uates its sensitivity and (2) modulates its activity as a function of the expected acoustic
feedback.” This modulation was also demonstrated in primate auditory cortex using single
cell recordings during self-initiated vocalizations (Eliades and Wang, 2003). The recordings
showed a large group of cells being inhibited while a small group of cells were excited. The
authors proposed that the inhibition was due to the vocal production centers suppressing
the auditory cortical neurons to increase their dynamic range while the observed excitatory
responses are needed for “maintaining hearing sensitivity to the external acoustic environ-
ment during vocalization.” Similar to auditory cortex studies, several studies (Chapman
et al., 1988; Jiang et al., 1990a,b) have demonstrated a reduction in somatosensory cortical
evoked potentials during movement. McClean et al. (1990) demonstrated that thalamic
somatosensory neurons with tongue and lip receptive fields were activated whenever the
structures were being used for speech production as well as in response to mechanical
stimuli, suggesting that these neurons are not suppressed at the thalamic level.
In the other direction of information travel, various studies have shown premotor/motor
areas being activated during sensory perception of action, irrespective of whether the input
is visual or auditory. Santi et al. (2003) used fMRI to identify the neural systems under-
lying point-light visible speech. Their analysis showed that perception of visible speech
movements “activated right visual area 5 and a network of motor-related areas (Broca’s
area, premotor cortex, primary motor cortex, and SMA), none of which were activated
by walking biological motion.” With the exception of M1 and SMA, seeing point-light
speech movements activated several of the same regions as speech reading from an actual
face. Using a different method, Watkins et al. (2003) showed that transcranial magnetic

13
stimulation (TMS) in the left hemisphere face area during listening to speech and view-
ing speech-related lip movements enhanced the size of motor-evoked potentials in the lip
muscles, thereby suggesting a connection from sensory areas to motor areas. Fadiga et al.
(2002) showed a similar effect for tongue muscles when listening to speech sounds that
involve tongue movement. The authors described it as a phoneme-specific activation of
speech motor centers during perception of speech.
The above paragraphs discussed observations from brain imaging experiments detailing
various aspects of the speech production system. For the most part, these observations
were of an essentially static representation of brain function, that is, they did not provide
an understanding of the temporal order of processing. The dynamical nature of the brain
necessitates an inquiry into the temporal nature of neural information transmission and
control.
2.3 Transmission delays and control mechanisms
The transmission of information in the nervous system is far from instantaneous and the
nervous system operates in such a manner that it is able to accommodate these delays.
In addition, these delays change throughout development as a result of axonal growth and
myelination of neurons, and the system is capable of adapting itself to these changing
delays.
Unless accounted for, delays can cause instabilities and inappropriate output in a bio-
logical system. These delays create problems for certain types of control mechanisms, and
they also place limitations on the nature of a complex learning system. They place restric-
tions on how associative learning takes place in the brain and raise questions about the
nature of representations that control motor behavior. But the restrictions can actually be
useful in that they limit the available options in designing a model: they force researchers
to ask more pertinent and focused questions about the system.
Models of motor control have generally avoided dealing with nervous system delays.
Motor control is often modeled using a pure feedback type controller or a pure feedforward
14
type controller. Individually, either of these forms of control have serious problems, and it
is highly likely that the brain employs a combination of feedforward and feedback strategies
to deal with delays.
In the paragraphs that follow, the advantages and limitations of feedforward and feed-
back control mechanisms are discussed, starting with a simple definition of a controller.
Using neurophysiological constraints, available control mechanisms are evaluated and a se-
lection is made from these mechanisms of the most appropriate controller for neural speech
motor control. Certain aspects of this controller are implemented as processes involving
the cerebellum. A cerebellar model illustrating these functions will be presented in the
next chapter.
2.3.1 What is an adaptive controller?
A controller can be defined in very general terms as a functional unit that is capable of
driving a system or a physical plant to a desired state. The process by which it achieves this
functionality is called a “control mechanism.” In some cases, the system being controlled
undergoes changes in its behavior over time. A controller that is capable of modifying its
output as a result of changes in the system is referred to as an adaptive controller.
For example, in this dissertation, a neural network comprising different brain areas
functions as an adaptive controller for speech movement. The controller learns to control
the vocal tract musculature by monitoring the differences between expected auditory and
somatosensory consequences and the actual sensory consequences. During development,
the controller also adapts its output based on the same mismatch signals. In general,
controllers operate by monitoring the output of the system in response to a command.
A controller is termed a “feedback controller” when current mismatch values are used to
modify the control signals. On the other hand, when the control signals are independent
of the current mismatch values, the controller is referred to as a “feedforward controller.”
The benefits and drawbacks of each of these types of controllers and the reasons why both
types of controllers may be required for speech are discussed next.

15
2.3.2 Feedback control
Humans are capable of adapting to certain types of perturbations to the speech system, such
as bite blocks (DeJarnette, 1988; Fowler and Turvey, 1981; Baum et al., 1996) or complex
auditory frequency shifts (Houde and Jordan, 1998, 2002). Any model of speech production
should try to provide an explanation for how the system deals with such perturbations.
These perturbations can be internal, such as noise inherent in neuronal activation, loss of
brain regions or of connections between regions involved with the process. They can also
be external: external perturbations can be due to prosthetic devices such as dentures or
cochlear implants, or they may be artificially induced in an experimental setting, e.g., by
bite blocks that alter somatosensory feedback or by auditory feedback alteration such as
spectral shifts of the acoustic waveform. Whatever the source of perturbation, the system
may need to alter its output in response to the change. This can be achieved using a
feedback controller.
Feedback controllers rely on sensory information to monitor the output of the system to
determine if the control signal produced the desired output. Based on the discrepancy, the
controller can alter control signals to compensate for the perturbation. This type of control
is referred to as negative feedback control and is schematized in Figure 2·3. If there are
no delays in the system and/or the gain is low enough, the system will operate in a stable
manner. However, in any real physical system there are processing as well as transmission
time delays. Feedback control in the presence of delays leads to oscillatory instabilities
that can only be avoided by lowering the output gain of the system. This is demonstrated
in Figure 2·4. However, there are alternative forms of feedback control mechanisms such
as Proportional+Integral+Derivative (PID) control (see Figure 2·5) that can operate with
a higher gain in the presence of delays by utilizing leading indicators such as the derivative
and the integral of the errors.

16
Figure 2·3: A simple formulation of negative feedback control is show in this diagram. TheController generates commands to drive the Plant such that the output matches the target. It isassumed here that the Target is in the same coordinates as the Output. The Controller has onlyone parameter: gain. The Plant is an integrator, that is, it takes the controller output and adds itto the current plant output. The black arrow represents negative input.
2.3.3 Feedforward control
As discussed in the previous paragraph, inherent delays arising from the physics and bio-
physics of feedback limit the scope of response of the feedback system. The system may
become unstable if feedback gains are high and transmission delays are long (Lurie and En-
right, 2000; Rack, 1981). These problems can be avoided by using a feedforward controller.
In situations in which sensor feedback is not reliable or in which the parameters required to
drive the system to a desired state do not change significantly over repeated executions of
the action, it can be advantageous to use either an open-loop control or an internal model,
instead of waiting for delayed feedback. An internal model based controller does not de-
pend on feedback and hence such a controller is equivalent to a open-loop control system.
This type of control is referred to as model predictive control (Wolpert and Miall, 1996)
and is schematized in Figure 2·6. Since this type of control is not dependent on feedback,
it can operate with high output gain. A reasonably small number of sounds or syllables or
words are repeated over and over again in a person’s lifetime. Presumably, such actions
can be executed using a feedforward controller. While experiments have demonstrated the
lack of dependence on feedback during various kinds of well practiced ballistic movements,
they do not clearly demonstrate the type of feedforward control mechanism that is used.
17
0 200 400 600 800 1000−2
−1
0
1
2
Time (ms)
Am
plitu
deGain= 1.000 Delay= 1.0 ms RMSE=0.00
TargetOutput
0 200 400 600 800 1000−2
−1
0
1
2
Time (ms)
Am
plitu
de
Gain= 1.000 Delay= 1.0 ms RMSE=0.00
TargetOutput
0 200 400 600 800 1000−2
−1
0
1
2
Time (ms)
Am
plitu
de
Gain= 0.100 Delay= 30.0 ms RMSE=174585.55
TargetOutput
0 200 400 600 800 1000−2
−1
0
1
2
Time (ms)
Am
plitu
de
Gain= 0.100 Delay= 30.0 ms RMSE=422.10
TargetOutput
0 200 400 600 800 1000−2
−1
0
1
2
Time (ms)
Am
plitu
de
Gain= 0.030 Delay= 30.0 ms RMSE=0.08
TargetOutput
0 200 400 600 800 1000−2
−1
0
1
2
Time (ms)
Am
plitu
de
Gain= 0.030 Delay= 30.0 ms RMSE=0.13
TargetOutput
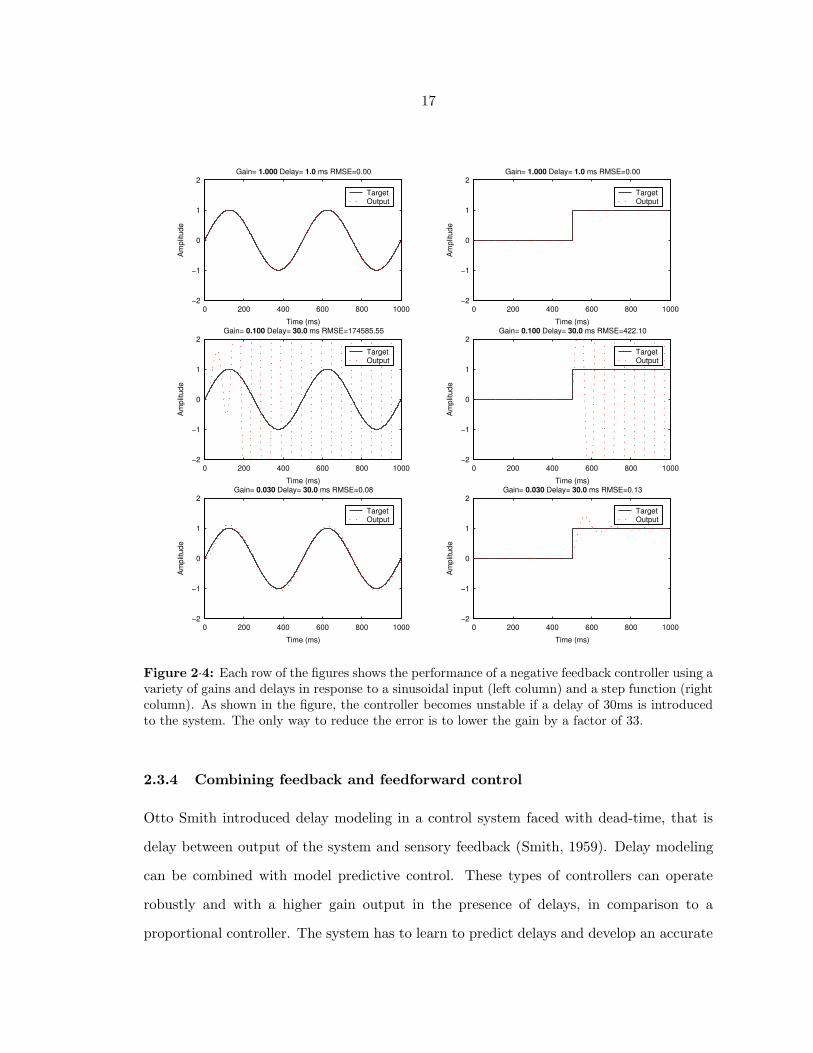
Figure 2·4: Each row of the figures shows the performance of a negative feedback controller using avariety of gains and delays in response to a sinusoidal input (left column) and a step function (rightcolumn). As shown in the figure, the controller becomes unstable if a delay of 30ms is introducedto the system. The only way to reduce the error is to lower the gain by a factor of 33.
2.3.4 Combining feedback and feedforward control
Otto Smith introduced delay modeling in a control system faced with dead-time, that is
delay between output of the system and sensory feedback (Smith, 1959). Delay modeling
can be combined with model predictive control. These types of controllers can operate
robustly and with a higher gain output in the presence of delays, in comparison to a
proportional controller. The system has to learn to predict delays and develop an accurate
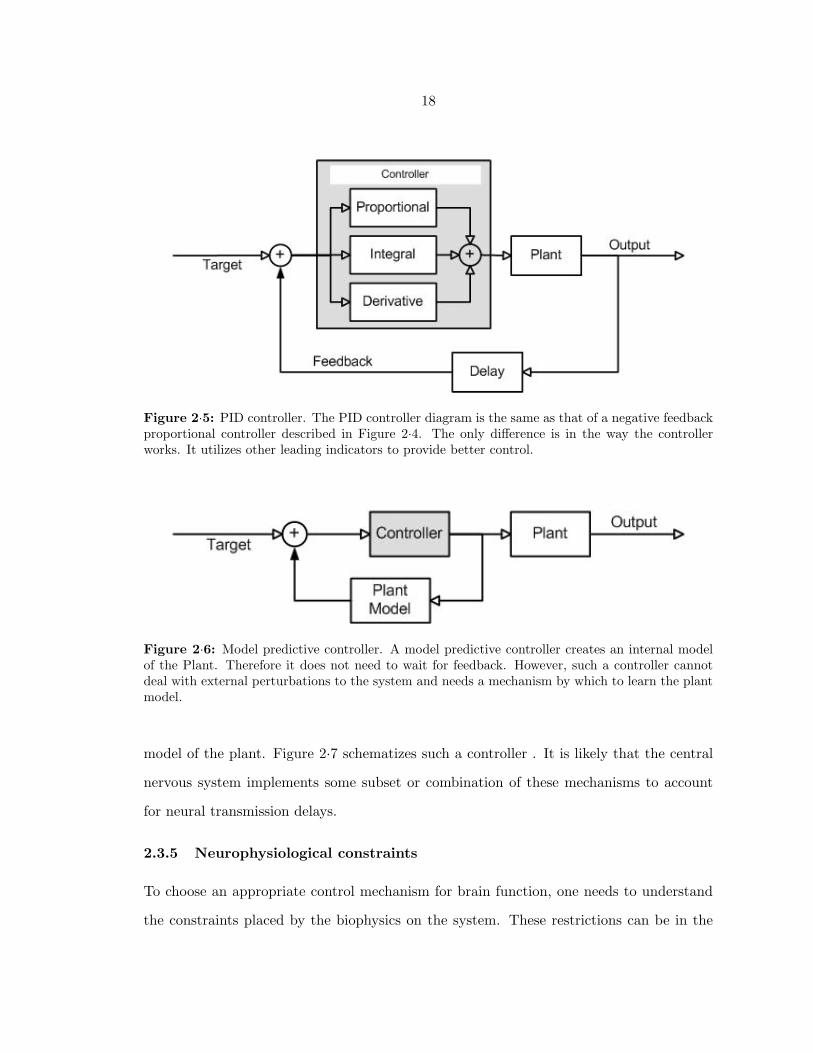
18
Figure 2·5: PID controller. The PID controller diagram is the same as that of a negative feedbackproportional controller described in Figure 2·4. The only difference is in the way the controllerworks. It utilizes other leading indicators to provide better control.
Figure 2·6: Model predictive controller. A model predictive controller creates an internal modelof the Plant. Therefore it does not need to wait for feedback. However, such a controller cannotdeal with external perturbations to the system and needs a mechanism by which to learn the plantmodel.
model of the plant. Figure 2·7 schematizes such a controller . It is likely that the central
nervous system implements some subset or combination of these mechanisms to account
for neural transmission delays.
2.3.5 Neurophysiological constraints
To choose an appropriate control mechanism for brain function, one needs to understand
the constraints placed by the biophysics on the system. These restrictions can be in the
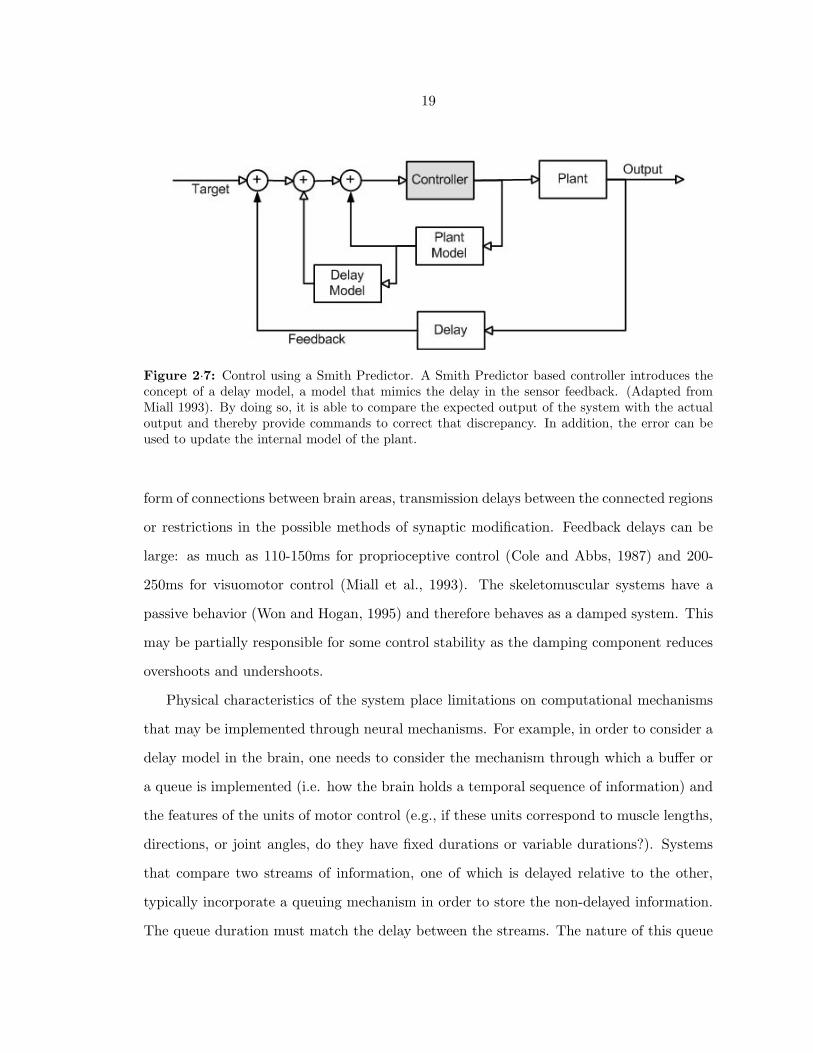
19
Figure 2·7: Control using a Smith Predictor. A Smith Predictor based controller introduces theconcept of a delay model, a model that mimics the delay in the sensor feedback. (Adapted fromMiall 1993). By doing so, it is able to compare the expected output of the system with the actualoutput and thereby provide commands to correct that discrepancy. In addition, the error can beused to update the internal model of the plant.
form of connections between brain areas, transmission delays between the connected regions
or restrictions in the possible methods of synaptic modification. Feedback delays can be
large: as much as 110-150ms for proprioceptive control (Cole and Abbs, 1987) and 200-
250ms for visuomotor control (Miall et al., 1993). The skeletomuscular systems have a
passive behavior (Won and Hogan, 1995) and therefore behaves as a damped system. This
may be partially responsible for some control stability as the damping component reduces
overshoots and undershoots.
Physical characteristics of the system place limitations on computational mechanisms
that may be implemented through neural mechanisms. For example, in order to consider a
delay model in the brain, one needs to consider the mechanism through which a buffer or
a queue is implemented (i.e. how the brain holds a temporal sequence of information) and
the features of the units of motor control (e.g., if these units correspond to muscle lengths,
directions, or joint angles, do they have fixed durations or variable durations?). Systems
that compare two streams of information, one of which is delayed relative to the other,
typically incorporate a queuing mechanism in order to store the non-delayed information.
The queue duration must match the delay between the streams. The nature of this queue
20
directly depends on what is considered to be a unit of information and the duration of that
unit. For example, if a unit of control corresponds to 10ms and the delay is 100ms, one
needs a first-in-first-out buffer to hold 10 such units. However, if the duration of the unit
is longer than the sensor feedback pathway delay, then the delay model simply needs to
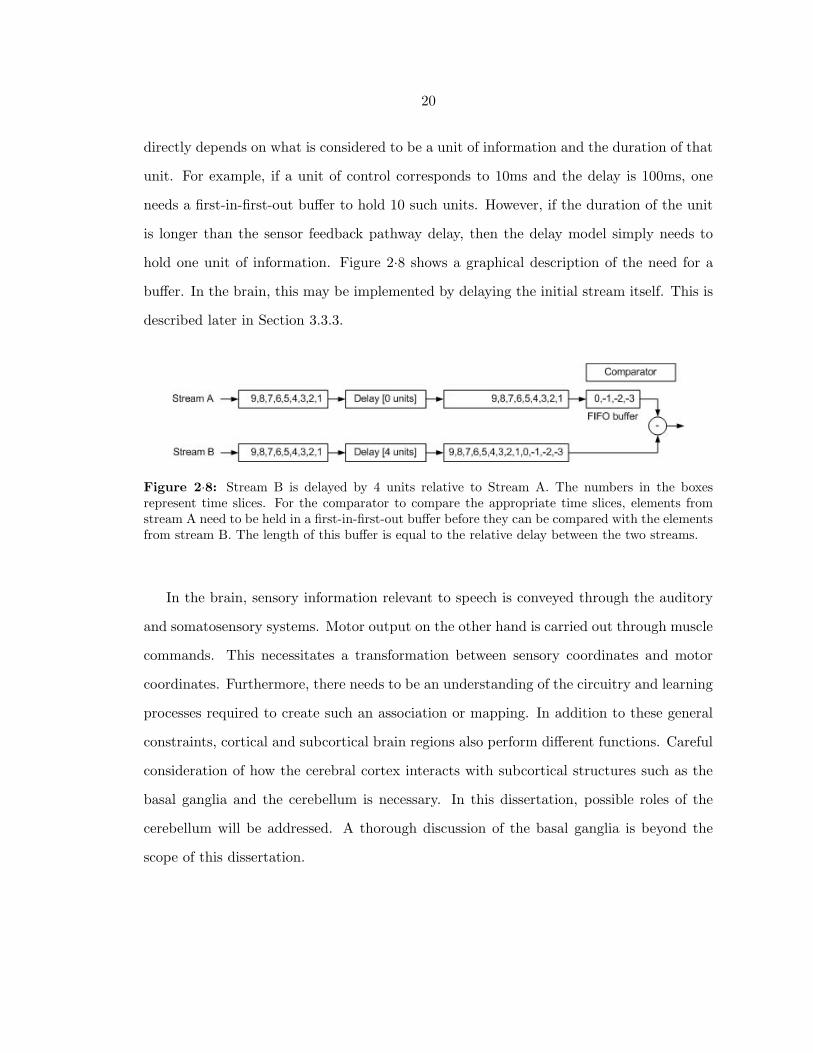
hold one unit of information. Figure 2·8 shows a graphical description of the need for a
buffer. In the brain, this may be implemented by delaying the initial stream itself. This is
described later in Section 3.3.3.
Figure 2·8: Stream B is delayed by 4 units relative to Stream A. The numbers in the boxesrepresent time slices. For the comparator to compare the appropriate time slices, elements fromstream A need to be held in a first-in-first-out buffer before they can be compared with the elementsfrom stream B. The length of this buffer is equal to the relative delay between the two streams.
In the brain, sensory information relevant to speech is conveyed through the auditory
and somatosensory systems. Motor output on the other hand is carried out through muscle
commands. This necessitates a transformation between sensory coordinates and motor
coordinates. Furthermore, there needs to be an understanding of the circuitry and learning
processes required to create such an association or mapping. In addition to these general
constraints, cortical and subcortical brain regions also perform different functions. Careful
consideration of how the cerebral cortex interacts with subcortical structures such as the
basal ganglia and the cerebellum is necessary. In this dissertation, possible roles of the
cerebellum will be addressed. A thorough discussion of the basal ganglia is beyond the
scope of this dissertation.

21
2.3.6 Choosing a control mechanism
The primary criteria for a speech motor control system are the following: the controller
must be able to account for the categorical nature of speech, for delays, for compensation
to perturbations and also for incorrect or noisy sensor readings. A feedback controller can
account for perturbations to the system while a feedforward type controller can account for
delays and deviant sensor behavior. A learned internal forward model that maps efferent
motor commands to sensory consequences can be useful in the presence of sensor noise. To
be successful, the system has to determine which sensor information is useful and which is
not. Monitoring the feedback and comparing it to the estimate can help correct for pertur-
bations as well as retune/adapt the internal model. There has to be an inverse-kinematic
mapping that transforms information in sensor space to information in (a much different)
motor space. Otherwise, motor commands cannot be modified using errors determined in
sensory spaces. The categorical units of speech, such as syllables, are produced at variable
rates. A controller also has to account for different rates of speaking.
The cerebellum with its involvement in timing is a strong candidate for the delay mod-
els. In the models discussed in this dissertation, the primary concern is with the generation
of appropriate inverse kinematic signals without worrying about the dynamical (muscle
force generation related) aspects of speech production. It is very likely that the cerebellum
plays a role in both aspects of speech production. The following chapter introduces the
new DIVA model and establishes the timing conflicts and learning issues that arise in a
biologically plausible model of speech production. The subsequent chapter then describes
a cerebellar solution to these timing and learning problems.

Chapter 3
THE DIVA MODEL
3.1 Introduction
Several versions of the DIVA model have been described since the initial version (Guenther,
1994). The bases of these versions have been drawn from behavioral data that were gath-
ered using psychophysical experiments of speech production and perception, neuroimaging
data from fMRI and PET experiments and neurophysiological data from motor control
experiments in animals. This chapter starts with a brief review of the DIVA model as
it existed from 1995 to 2002 (Callan et al., 2000; Guenther et al., 1998; Guenther, 1995,
1994). These variations of the model reflected coarse neuroanatomical associations with
brain regions. Guenther and Ghosh (2003) presented a revised version of the model with
a refined specification of the involvement of several areas of cerebral cortex.
The aim of this chapter is to introduce the new DIVA model and establish the tim-
ing and learning issues that arise in a biologically plausible model of speech production.
After the review of the earlier models (Section 3.2), the current DIVA model is presented
(Section 3.3). The new model, in addition to using the brain areas described in Guenther
and Ghosh (2003), introduces algorithmic methods to resolve the temporal alignment and
learning problems that arise from realistic delays. The following chapter will review the
cerebellum and propose a cerebellar model that can replace these algorithmic methods.
The chapter concludes with descriptions and simulations of behavioral observations during
production of speech in normal individuals.
22

23
3.2 Review of earlier versions of the DIVA model
The purpose of this section is to outline the components of the model as they existed
in the earlier versions of the model. More thorough descriptions can be found elsewhere
(Guenther et al., 1998; Guenther, 1995). Most of these components have been carried over
to the new model. An understanding of these components greatly reduces the apparent
complexity of the new model.
The DIVA model is schematized in Figure 3·1. Each block in the model corresponds to
a set of neurons that constitute a neural representation. The term “map” or “vector” will
be used to refer to such a set of cells. In numerical implementations, these cells are repre-
sented by vectors. The term “mapping” will be used to refer to a transformation from one
neural representation (a “map” or a “vector”) to another map or vector. This transforma-
tion is typically assumed to be carried out by filtering cell activations in one map through
synapses projecting to another map. These synapses constitute the model’s primary pa-
rameters. The model’s modifiable synapses, shown as filled semicircles in Figure 3·1, are
tuned during a babbling phase when random movements of the speech articulators pro-
vide tactile, proprioceptive, and auditory feedback signals that are used to train neural
mappings between different neural representations. Other mappings (shown as arrows in
Figure 3·1) are “hard-wired” in the model; i.e., they do not change during babbling. The
model’s goal is to learn to control the movements of a simulated vocal tract in order to
produce phoneme strings. After babbling, the model is capable of producing arbitrary
combinations of the phonemes it has learned during babbling. That is, the neural network
takes as input a phoneme string and generates as output a time sequence of articulator
positions that command movements of the simulated vocal tract. The following paragraphs
will outline the model’s components.
3.2.1 Vocal tract model
The vocal tract model (“Maeda’s articulatory model” Maeda (1990) in Figure 3·1) takes as
input seven parameters specifying the positions of seven speech articulators: three tongue

24
Figure 3·1: DIVA model (circa 1998). See Section 3.2 for details.
shape parameters, two lip shape parameters, a jaw height parameter, and a larynx height
parameter. These parameters are used to determine the shape of the vocal tract. The
resulting vocal tract area function is converted into a digital filter that is used to synthesize
an acoustic signal. This signal forms the output of the model. The model does not address
the control of the pitch contour during speech; instead, a pitch profile explicitly specified by

25
the modeler is used to control the fundamental frequency of the glottal pulses. This vocal
tract model does not involve generation of forces, and hence is not suitable for modeling
the dynamics (as opposed to kinematics) of articulator movement.
3.2.2 Articulator Direction Vector and Articulator Position Vector
The Articulator Direction Vector and Articulator Position Vector in Figure 3·1 act as
commands that move the speech articulators in the Vocal Tract Model. These vectors
each have seven dimensions, corresponding to the seven degrees of freedom of the vocal
tract model. Movement speed is controlled by the speaking rate signal shown as “GO
Signal” in Figure 3·1. This is performed by multiplicatively scaling the movement command
represented by the Articulator Direction Vector. The Articulator Direction Vector and
Articulator Position Vector cells were hypothesized to correspond to cells in primary motor
cortex.
3.2.3 Planning Position Vector
The Planning Position Vector in the model represents the “shape” or position of the vocal
tract within the reference frame used for the planning of speech movements. The nature
of this reference frame is a key aspect of human speech production and will be treated
in more detail below. The first version of the DIVA model (Guenther, 1994) had a vocal
tract shape reference frame. In this context, the Planning Position Vector represents the
shape of the vocal tract in terms of articulatory and constriction parameters. However,
in a more recent version of the model (Guenther et al., 1998), an acoustic-like coordinate
frame that is related to parameters such as the formant frequencies of the acoustic signal,
was used for the planning of speech movements. Within this conception, the Planning
Position Vector represents the acoustic properties of the current shape of the vocal tract.
This acoustic-like coordinate frame will be referred to as an auditory perceptual reference
frame since it represents the acoustic signal after transduction by the auditory periphery
(Auditory Processing in Figure 3·1).
26
3.2.4 Speech Sound Map
Cells in the Speech Sound Map code the different speech sounds learned by the model. Each
cell corresponds to a different phoneme. The signals projecting from the Speech Sound Map
to the Planning Direction Vector specify targets for phonemes in terms of the planning
reference frame to be compared with the signals from the Planning Position Vector. In
Guenther et al. (1998), these targets take the form of regions in auditory perceptual space.
The use of target regions, rather than points, is one of the important properties of the DIVA
model. The concept of target regions provides a unified explanation for a wide range of
speech production phenomena which had previously been treated separately. These include
motor equivalence and contextual variability using an auditory planning space (Guenther
et al., 1998) and anticipatory coarticulation, carryover coarticulation and speaking rate
effects using an orosensory planning space (Guenther, 1994, 1995).
3.2.5 Planning Direction Vector
The Planning Direction Vector represents the difference between the current position of
the vocal tract (as represented by the Planning Position Vector) and the target region
corresponding to the phoneme currently being produced. The target is represented by the
weights projecting from the active cell in the Speech Sound Map. This difference constitutes
the desired movement direction (i.e., the movement direction needed to get to the nearest
point on the target region) as represented in the planning reference frame. In Guenther
(1995, 1994), this difference is a desired change in orosensory configuration. In Guenther
et al. (1998), this can be envisioned as a desired change in the formant frequencies being
produced by the vocal tract. The time course of the cell activities in the Planning Direction
Vector represents the planned movement trajectory (in auditory perceptual terms in the
1998 version), and this trajectory is then transformed into appropriate movements of the
articulators through the learned mapping projecting from the Planning Direction Vector
to the Articulator Direction Vector.
27
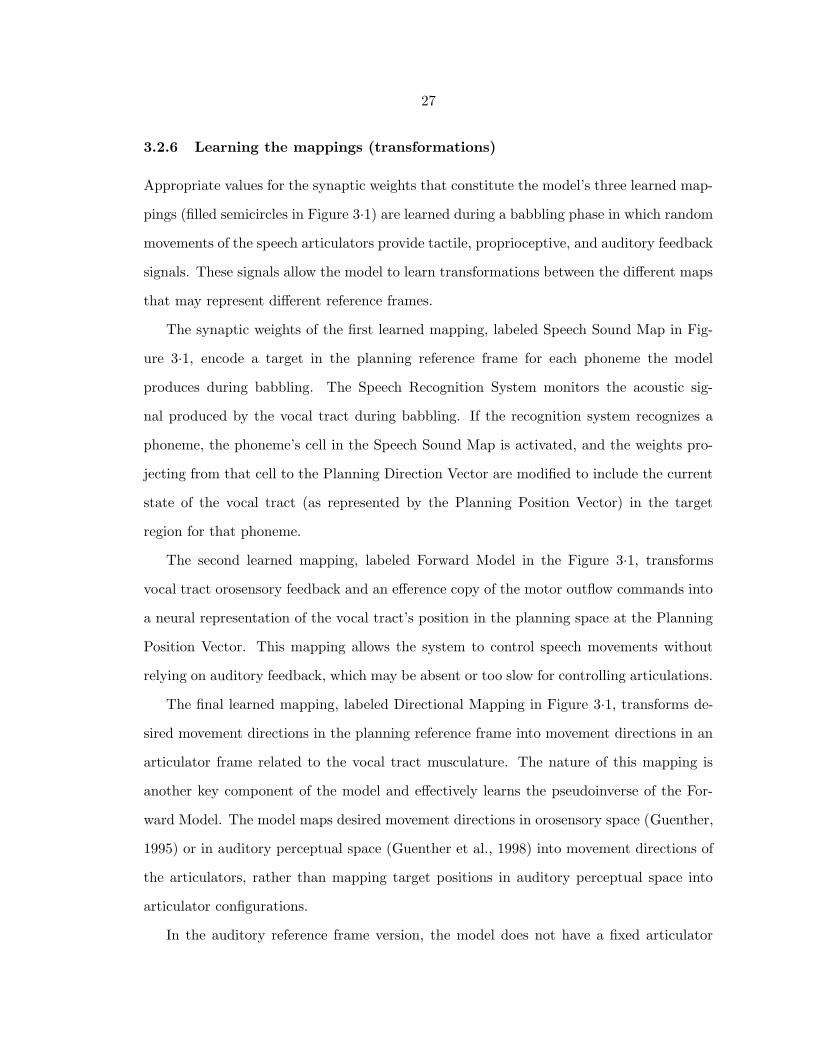
3.2.6 Learning the mappings (transformations)
Appropriate values for the synaptic weights that constitute the model’s three learned map-
pings (filled semicircles in Figure 3·1) are learned during a babbling phase in which random
movements of the speech articulators provide tactile, proprioceptive, and auditory feedback
signals. These signals allow the model to learn transformations between the different maps
that may represent different reference frames.
The synaptic weights of the first learned mapping, labeled Speech Sound Map in Fig-
ure 3·1, encode a target in the planning reference frame for each phoneme the model
produces during babbling. The Speech Recognition System monitors the acoustic sig-
nal produced by the vocal tract during babbling. If the recognition system recognizes a
phoneme, the phoneme’s cell in the Speech Sound Map is activated, and the weights pro-
jecting from that cell to the Planning Direction Vector are modified to include the current
state of the vocal tract (as represented by the Planning Position Vector) in the target
region for that phoneme.
The second learned mapping, labeled Forward Model in the Figure 3·1, transforms
vocal tract orosensory feedback and an efference copy of the motor outflow commands into
a neural representation of the vocal tract’s position in the planning space at the Planning
Position Vector. This mapping allows the system to control speech movements without
relying on auditory feedback, which may be absent or too slow for controlling articulations.
The final learned mapping, labeled Directional Mapping in Figure 3·1, transforms de-
sired movement directions in the planning reference frame into movement directions in an
articulator frame related to the vocal tract musculature. The nature of this mapping is
another key component of the model and effectively learns the pseudoinverse of the For-
ward Model. The model maps desired movement directions in orosensory space (Guenther,
1995) or in auditory perceptual space (Guenther et al., 1998) into movement directions of
the articulators, rather than mapping target positions in auditory perceptual space into
articulator configurations.
In the auditory reference frame version, the model does not have a fixed articulator

28
configuration for each position in auditory perceptual space. Instead, it can use many
different articulator configurations to reach a given position in auditory perceptual space.
Furthermore, the model is capable of automatically compensating for constraints or pertur-
bations applied to the articulators by using novel articulator configurations when required.
This can account for the motor equivalence capabilities observed in humans when speaking
with a bite block or lip perturbation.
3.2.7 Control mechanism
Together with the acoustic reference frame for the planning of speech movements, Guenther
et al. (1998) introduced a pseudoinverse-based control mechanism. In this mechanism,
the Planning Direction Vector is converted into an Articulator Direction Vector using a
pseudoinverse of the function that maps changes in articulation to changes in the planning
reference frame. The pseudoinverse-style control scheme utilized by the DIVA model leads
to characteristic movements (or “kinematic signatures”) of the speech articulators. If the
brain is using a similar control scheme, this “kinematic signature” should be evident in
human speech movements. Electromagnetic mid-sagittal articulometry (Perkell et al., 1992)
experiments have been used to measure articulator movements during speech production
in order to test this hypothesis. The results (Guenther et al., 1999; Nieto-Castanon et al.,
2004) have been consistent with the pseudoinverse-style control scheme used in the model.
The model described in this section was specifically developed as a computational frame-
work to explain various behavioral phenomena, including development, of the speech pro-
duction and perception system. This model has effectively emulated many experimental
observations of speech phenomena such as motor equivalence (generating the same acoustic
output with different motor configurations, e.g., speaking with or without a bite block),
contextual variability (variability in articulator configuration depending on the surround-
ing context of the phoneme e.g. /r/ configuration in /wabrav/ vs /wagrav/) and sensor
based error correction (updating a production based on the mismatch between expected
sensory input and actual sensory input). However, the model is deficient in describing the

29
neuroanatomy and neurophysiology of the speech production system, nor does it incor-
porate realistic processing delays. The following section presents a refined version of the
DIVA model that addresses these issues.
3.3 Description of the extended DIVA model
The primary goal of the modeling component of this dissertation is to extend the DIVA
model of speech production. The earlier versions as discussed in the previous system
had certain drawbacks. First, they assumed that all information about the state of the
system at a given point in time is available to the system instantaneously. Second, the
system operated using instantaneous feedback control, given the assumption of no neural
delays. Third, the reference frame used for control was either orosensory space or auditory
space rather than both simultaneously. Fourth, the separation of cortical and subcortical
processes and the association of components to brain regions were coarse.
The current model addresses these concerns. The proposed extension incorporates
neurally plausible transmission delays between different components of the model. These
components are associated with brain areas that are active during functional imaging ex-
periments related to speech production. The scope of the dissertation is limited to creating
a stable, dynamical model given realistic time delays between different components.
A description of the model and brain regions involved is presented next, followed by
equations of operation and representations used in the model. This section will conclude
with a description of how the different synaptic projections in the model are learned.
3.3.1 Description of the model
Figure 3·2 provides an overview of the current version of the DIVA model. The model
consists of a neural network controller whose cells correspond to boxes and synaptic weights
correspond to arrows. The neural network utilizes a babbling stage to learn the neural
mappings necessary for controlling an articulatory synthesizer (Maeda, 1990). The output
of the model specifies the positions of 8 articulators that determine the vocal tract shape
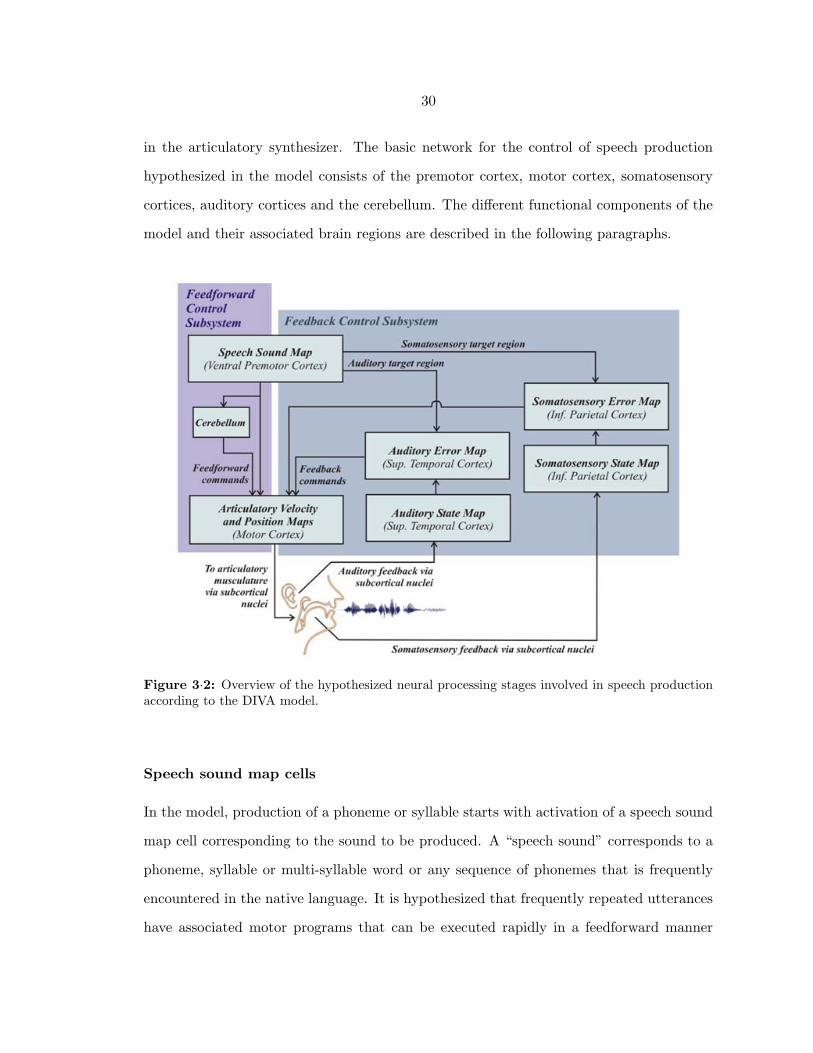
30
in the articulatory synthesizer. The basic network for the control of speech production
hypothesized in the model consists of the premotor cortex, motor cortex, somatosensory
cortices, auditory cortices and the cerebellum. The different functional components of the
model and their associated brain regions are described in the following paragraphs.
Figure 3·2: Overview of the hypothesized neural processing stages involved in speech productionaccording to the DIVA model.
Speech sound map cells
In the model, production of a phoneme or syllable starts with activation of a speech sound
map cell corresponding to the sound to be produced. A “speech sound” corresponds to a
phoneme, syllable or multi-syllable word or any sequence of phonemes that is frequently
encountered in the native language. It is hypothesized that frequently repeated utterances
have associated motor programs that can be executed rapidly in a feedforward manner

31
for their production instead of relying on a feedback process. In the model all phonemes
and frequent syllables of a language are represented by unique speech sound map cells.
In contrast, infrequent syllables and words do not have stored motor programs associated
with them; instead they are produced by sequentially activating the motor programs of the
phonemes or syllables that make up the syllable or word. Each time a new speech sound is
presented to the model for learning, a new cell is recruited into the premotor cortex speech
sound map to represent that sound.
The lateral premotor cortex and nearby regions (such as posterior inferior frontal gyrus
and frontal operculum) are hypothesized to contain Speech Sound Map cells. These cells
are hypothesized to correspond to “mirror neurons” (Kohler et al., 2002; Rizzolatti et al.,
1996a). Studies of speech perception have shown activation in these regions. For exam-
ple, using PET, Golestani and Zatorre (Golestani and Zatorre, 2004) showed that parts of
inferior frontal gyrus and frontal operculum/anterior insula undergo modulation of acti-
vation when learning new non-native sound distinctions. Several non-speech studies have
identified left premotor cortex or the adjacent inferior frontal gyrus (Broca’s area) as loca-
tions for “mirror neurons.” For example, Tai et al. (2004) identified the location of mirror
neurons for grasping in left premotor cortex, while Rizzolatti et al. (1996b) identified left
inferior frontal gyrus (Brodmann’s area 44) as the site of grasp observation neurons, and
similarly Iacoboni et al. (1999) identified mirror neurons for finger movements in the oper-
cular region of the left inferior frontal gyrus. Furthermore, it is likely that different motor
skills, perhaps even different speech tasks, involve mirror neurons in different subregions
of the premotor cortex and/or Broca’s area. Stimulation of inferior frontal gyrus shows
activation patterns in different parts of motor cortex (Greenlee et al., 2004). Thus we
currently assume that the speech sound map cells may lie in either left BA 6 or BA 44, or
both.
Both single neuron recording studies and human imaging studies suggest that the pre-
motor cortex plays an important role in the selection of movements for execution (Cram-
mond and Kalaska, 2000; Thoenissen et al., 2002; Kalaska and Crammond, 1995). Activat-
32
ing a premotor cortical cell in the model initiates a motor plan corresponding to a syllable.
The interactions of a feedforward subsystem consisting of premotor and motor cortex and
a feedback system consisting of premotor, motor, auditory and somatosensory areas carry
out this plan. The cerebellum forms an integral part of both of these subsystems.
Sensory expectations and error signals
After a speech sound map cell has been activated, signals from the premotor cortex travel to
the auditory and somatosensory cortical areas through tuned synapses that encode sensory
expectations for the sound being produced (see Figure 3·3). These “forward models” are
hypothesized to include both cortical and cerebellar components and are hypothesized to
have an inhibitory effect in the sensory areas, probably via the inhibitory interneurons in
these sensory areas. The inhibitory effect allows a subtraction of the sensory expectations
from the actual sensory afference.
The synapses projecting from the premotor cortex to the higher-order auditory cortical
areas in the posterior superior temporal gyrus and posterior planum temporale encode an
expected auditory trace for each speech sound. According to the model, when an infant
listens to a speaker producing a new speech sound, a previously unused speech sound
map cell becomes active. Projections from this cell to auditory cortical areas are tuned
to represent the auditory signal corresponding to that sound. Thus these cells can be
acquired and tuned while listening to phonemes and syllables from the native language.
After learning, these synapses encode a spatiotemporal target region for the sound in
auditory coordinates. During production of the sound, this target region is compared to
the current auditory state from auditory cortex, and any discrepancy between the target
and the current state, or auditory error, will lead to a command signal to motor cortex
that acts to correct this discrepancy via projections from auditory to motor cortical areas.
Evidence for inhibition of auditory cortical areas in the superior temporal gyrus during
one’s own speech comes from several different sources, including recorded neural responses
during open brain surgery (Creutzfeldt et al., 1989a,b), MEG measurements (Numminen

33
Figure 3·3: Overview of the hypothesized sensory expectation pathways from premotor to sensoryareas in the DIVA model. Also show are sensory feedback signals from the sensory cortices. Thesignals are compared in the error cells: ∆Au and ∆S. Abbreviations: M, Motor; P, Premotor; Au,Auditory; S, Somatosensory
and Curio, 1999; Numminen et al., 1999; Houde et al., 2002), and PET measurements
(Wise et al., 1999).
A second set of synapses, projecting from the premotor cortex to the higher-order so-
matosensory cortical areas in the post-central and supramarginal gyri, encodes the expected
somatic sensation corresponding to the active syllable. This spatiotemporal somatosensory
target region is estimated by monitoring the somatosensory consequences of producing the
syllable. Once the syllable is learned, somatosensory error signals are generated by com-
paring the target region with somatosensory afferents from primary somatosensory cortex.
Somatosensory error signals are then mapped to corrective motor commands via pathways
projecting from somatosensory to motor cortical areas. Similar to auditory inhibition, there

34
is corresponding evidence for such an inhibition during motor movements in somatosensory
areas (Jiang et al., 1991, 1990a). No studies have looked for a modulation effect of speech
production in the supramarginal gyrus, although this brain region has been implicated
in phonological processing for speech perception (Caplan et al., 1995; Celsis et al., 1999),
and speech production (Geschwind, 1965; Damasio and Damasio, 1980). This area has also
been shown to be involved in phonemic processing (Gelfand and Bookheimer, 2003; Benson
et al., 2001), is also increasingly active during DAF of self-generated speech (Hashimoto
and Sakai, 2003) and is hypothesized to be part of a frontoparietal speech perception net-
work (Hickok et al., 2003, 2000). There are few fMRI studies showing brain areas involved
in monitoring feedback during speech production: a lip tube perturbation study (Baciu
et al., 2000), a delayed auditory feedback study (Hashimoto and Sakai, 2003) and from a
pneumatic bite block (jaw block) study using fMRI (Guenther et al., 2003). In all of these
studies, supramarginal gyrus activity was observed in response to the perturbation.
Although there are few imaging studies of speech perturbation, there is pertinent data
on the role of parietal cortex during limb movement, for which analogous issues arise. Stud-
ies in primates have shown that parietal lesions affect corrective redirection of movement
without affecting initial selection of action (Rushworth et al., 2001, 1997), thus demon-
strating degraded evaluation of the sensory consequences of the motor action. In addition,
the study by Rushworth et al. demonstrated the presence of a feedforward pathway that
can bypass the feedback monitoring circuit in order to generate movements. Imaging stud-
ies have shown activation of posterior parietal cortex in a variety of movements (Ramnani
et al., 2001; Seitz et al., 1997) and increased activation in the case of a mismatch between
expected consequence and actual feedback (Fink et al., 1999). A single-cell recording
study (Andersen et al., 1997) showed that some neurons in the medial intra-parietal sulcus
changed their activity prior to execution of the movement itself, which suggests that an
efference copy of the movement reaches the site in addition to sensory and proprioceptive
information. Other studies (Duhamel et al., 1992; Wolpert et al., 1998) have shown that
the PPC likely receives updates of intended activities. PPC neurons are responsive to mul-

35
timodal stimuli (Johnson et al., 1996; Pouget et al., 2002). Strong connections to dorsal
premotor areas and weak projections to primary motor cortex have been demonstrated
using tracers in macaques (Wise et al., 1997) and using a combination of PET and TMS in
humans (Chouinard et al., 2003). Using rTMS, recent studies (Haggard and Magno, 1999;
Haggard et al., 1999) have suggested that ”our awareness of our own actions is associated
with some pre-motor event after the initial intention and preparation of action, but before
the assembly and dispatch of the actual motor command to the muscles.” A different study
(MacDonald and Paus, 2003) demonstrated that TMS over the parietal cortex reduces this
awareness for active movements but not for passive movements. The experimental obser-
vations of these studies strengthen the possibility of a connection between premotor areas
and parietal areas (such as the supramarginal gyrus) that encodes sensory expectation, as
is suggested in the model.
Combining feedback and feedforward signals
Feedforward and feedback-based control signals are combined in the model’s motor cortex.
Feedback control signals project from sensory error cells to the motor cortex as described
above and shown in Figure 3·4. These ”inverse model” projections are tuned during bab-
bling by monitoring the relationship between movement commands and their sensory con-
sequences. The neural output of these sensorimotor projections effect a transformation of
coordinates from somatosensory or auditory space to motor coordinates. A small num-
ber of experiments have found evidence for sensorimotor adaptation in speech (Tremblay
et al., 2003; Houde and Jordan, 2002, 1998). However, these experiments were behavioral
in nature, demonstrating dependence on auditory and somatosensory feedback, but did
not completely clarify the mechanism by which the feedback signals are used for modifying
the production. Nor did they provide a thorough understanding of brain areas involved in
such a transformation. They simply suggested that sensory feedback may modulate current
output. The model considers such adaptation to be the outcome of combining feedforward
and feedback commands.
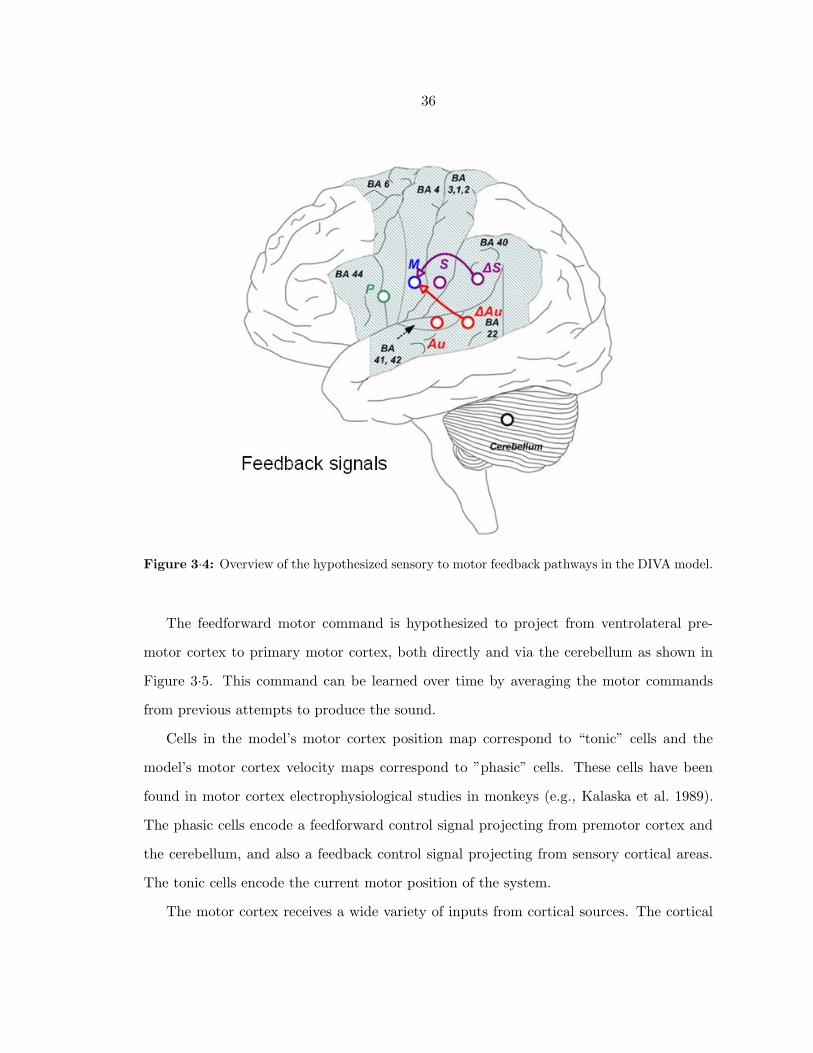
36
Figure 3·4: Overview of the hypothesized sensory to motor feedback pathways in the DIVA model.
The feedforward motor command is hypothesized to project from ventrolateral pre-
motor cortex to primary motor cortex, both directly and via the cerebellum as shown in
Figure 3·5. This command can be learned over time by averaging the motor commands
from previous attempts to produce the sound.
Cells in the model’s motor cortex position map correspond to “tonic” cells and the
model’s motor cortex velocity maps correspond to ”phasic” cells. These cells have been
found in motor cortex electrophysiological studies in monkeys (e.g., Kalaska et al. 1989).
The phasic cells encode a feedforward control signal projecting from premotor cortex and
the cerebellum, and also a feedback control signal projecting from sensory cortical areas.
The tonic cells encode the current motor position of the system.
The motor cortex receives a wide variety of inputs from cortical sources. The cortical

37
Figure 3·5: Overview of the hypothesized premotor to motor feedforward pathways in the DIVAmodel.
inputs to the orofacial areas of macaques include projections from BA 12, insula, fron-
toparietal operculum, lateral premotor cortex and the orofacial region of the SMA as well
as a number of projections from motor cortex neurons around the injection sites and in the
parietal cortex (including the somatosensory cortex and area 7b) (Tokuno et al., 1997).
There is no direct evidence of connections from speech motor cortex to primary auditory
cortex or somatosensory cortex in humans. The larynx area in macaques is, however,
strongly connected to premotor areas, Broca’s area, rostral somatosensory cortex, insula,
SMA, anterior cingulate and frontal and parietal operculum, with medium projections to
BA 2 and BA 3b and minor projections to primary somatosensory BA 1 and posterior
superior temporal sulcus (Simonyan and Jurgens, 2002). The relative lack of connections
from primary motor areas to sensory areas may restrict the formation and existence of

38
lower-level corticocortical internal models for sensory prediction.
Temporal alignmnent and learning
In the previous paragraphs, the discussion of the model interactions did not specify the
delays between model components. Also, it did not describe how signals converging in
a given region of the brain are synchronized. An estimation of the delays between the
different brain regions will be presented in the next section. This paragraph outlines the
model locations where synchronization becomes necessary.
The somatosensory error cells and the auditory error cells make a comparison between
the sensory expectations and the actual sensory afference. In order to generate a correct
feedback command, the sensory error needs to be computed from time-aligned signals and
the error needs to maintain a correspondence with the motor command that generated
the error. Since the feedback command is delayed because of sensory delays, the premotor
to motor synapses also need to be able to sample the appropriate feedback commands
to update (“learn”) the feedforward command that resulted in the feedback error. It is
hypothesized that the cerebellum plays an important role in resolving these issues. In
the simulations, the temporal alignment and learning issues will be solved algorithmically.
The next chapter will propose a computational model of the cerebellum that may be used
instead of these algorithmic methods to solve the timing problems.
Thus far, the discussion of the model has focused on the qualitative functional aspects
of the model and its neural substrates. The following section now defines the equations
and representations that govern the computational implementation of these functions.
3.3.2 General model equations and representations
This section provides details of the model components and the equations that govern them.
For each component, it describes the representation used and provides estimates of neu-
ral transmission delays of the component’s input and output pathways. The equations
described in this section are general and are independent of the representation. There-
39
fore, these equations can be used along with any other form of motor, somatosensory and
auditory representations.
Speech sound map cells
The speech sound map cells in the premotor areas currently define the context of the sound
being produced and are active through the duration of production. The activity of these
cells is governed by the following equation:
Pi(t) =
1 if the ith sound is being produced
0 Otherwise
(3.1)
In the current implementation of the model, it is assumed that the onset of premotor
activity leads to the sequential activation of a group of cells where each cell represents an
interval of 1 ms and the total number of cells is equal to duration in ms of the speech sound
to be produced. The model simulations are then carried out with reference to these cells.
This assumption of a uniform frame rate is not based on any particular biological fact, but
primarily a matter of computational convenience. The current units of representation can
be thought of as a sequence of features, each with a temporal duration of 1ms. However,
to explain certain speech phenomena (e.g., speaking rate), this representation needs to
be altered. Possible changes to the representation that may address characterization of
speaking rate are discussed in the concluding chapter of the dissertation.
Auditory state cells, error cells and expectations
The model posits auditory state cells that correspond to the representation of speech-like
sounds in auditory cortical areas (BA 41, 42, 22). The activity of these cells is represented
as follows:
Au(t) = fAcAu(Acoust(t − δAcAu)) (3.2)
where fAcAu is the function that transforms an acoustic signal (Acoust will be defined
later) produced by the vocal tract into the corresponding auditory representation and
40
δAcAu is the time it takes an acoustic signal transduced by the cochlea to make its way to
the auditory cortical areas. Schroeder and Foxe (2002) measured the latency between onset
of an auditory stimulus and responses in higher-order auditory cortical areas posterior to
A1 and a superior temporal polysensory (STP) area in the dorsal bank of the superior
temporal sulcus. They noted a response latency of approximately 10 ms in the posterior
auditory cortex and 25 ms in STP. Based in part on these numbers, an estimate of 20 ms
is used for δAcAu in the simulations reported later.
The model also has auditory error cells in these same cortical regions that encode the
difference between the expected auditory representation for the sound being produced and
the current auditory state as represented by Au(t). The activity of the auditory error cells
(∆Au(t)) is defined by the following equation:
∆Au(t) = Au(t) − ZPAu(t) (3.3)
where ZPAu(t) is a set of “effective” synaptic projections (see Section 3.3.3 for details)
from premotor cortex to higher order auditory cortices that encodes auditory expectations
for the sound being produced. The auditory error cells become active during production
if the speaker’s auditory feedback of his/her own speech deviates from the auditory target
for the sounds being produced. The synaptic weights encode target regions for each point
in time from the start of production to the end of production of the speech sound they
encode. That is, each column of the weight matrix represents the target at one point in
time, and there is a different column for every 1 ms of the duration of the speech sound.
A number of different auditory representations have been used in the model, including
formant frequencies, log formant ratios (Miller, 1989), and wavelet-based transformations
of the acoustic signal. In this dissertation and in the computer simulations reported below,
a formant frequency representation is used in which Au(t) is a three-dimensional vector
whose components correspond to the first three formant frequencies of the acoustic signal.
Correspondingly, ∆Au(t) represents a difference in formant frequency space.

41
Somatosensory state cells, error cells and expectations
The model also includes somatosensory state cells that correspond to the representation of
speech articulators in somatosensory cortical areas (BA 1,2,3,40,43):
S(t) = fArS(Artic(t − δArS)) (3.4)
where fArS is a function that transforms the current state of the articulators (Artic defined
later) into the corresponding somatosensory map state (e.g., proprioceptive and tactile in-
formation from vocal tract) and δArS is the time it takes for proprioceptive and tactile
information from the vocal tract to reach the cortical areas. It is currently assumed that
both these forms of information arrive synchronously. O’Brien et al. (1971) measured
evoked potentials in somatosensory cortex induced by stimulation of facial nerves inner-
vating the lips, jaw, tongue, and larynx in anesthetized monkeys. They reported typical
latencies of approximately 5-20 ms, though some somatosensory cortical cells had signif-
icantly longer latencies, on the order of 50 ms. Schroeder and Foxe (2002) measured
latencies of approximately 10 ms in inferior parietal sulcus to somatosensory stimulation
(electrical stimulation of a hand nerve). Based on these results, an estimate of 15 ms is
used for δArS in the simulations reported below.
The function fArS is implemented algorithmically and transforms the articulatory state
into a 22-dimensional somatosensory map representation S(t). The first 16 dimensions
of S(t) correspond to proprioceptive feedback representing the current positions of the
8 Maeda articulators, each represented by an antagonistic pair of cells as in the motor
representation. The remaining 6 dimensions correspond to tactile feedback, consisting
of palatal and labial tactile information derived from the first five Maeda articulatory
parameters using a simple modification of the mapping described by Schwartz and Boe
(2000, see Appendix B for details).
Somatosensory error cells code the difference between the somatosensory target region

42
for a speech sound and the current somatosensory state:
∆S(t) = S(t) − ZPS(t) (3.5)
where ZPS(t) encodes somatosensory expectations for the sound being produced. The
somatosensory error cells become active during production if the speaker’s somatosensory
feedback from the vocal tract deviates from the somatosensory target region for the sound
being produced.
Motor cortex velocity and position cells
According to the model, feedforward and feedback-based control signals are combined in
motor cortex. The model’s motor cortex velocity cells correspond to “phasic” cells found
in motor cortex single-cell recording studies. The model includes two sets of motor velocity
cells: one that encodes a feedback control signal and one that encodes a feedforward control
signal.
Feedback control signals project from sensory error cells to the motor cortex. These
inverse differential kinematic projections are governed by the following equation:
∆MFeedback(t) = ZAuM (t)∆Au(t − δAuM ) + ZSM (t)∆S(t − δSM ) (3.6)
where ZAuM (t) and ZSM (t) are synaptic projections that transform directional sensory
error signals into motor velocities that correct for these errors. The model’s name, DIVA,
derives from this mapping from sensory Directions Into Velocities of Articulators. These
weights can be tuned during babbling by monitoring the relationship between movement
commands and their sensory consequences. The motor cortex cells combine the feedforward
and feedback signals into a single phasic command.
∆M(t) =1
αff + αfb
[αff∆MFeedforward(t) + αfb∆MFeedback(t)] (3.7)
where αff and αfb are parameters that determine how much the model is weighted toward
feedback control and feedforward control, respectively.
43
The feedforward motor command is hypothesized to project from ventrolateral premo-
tor cortex to primary motor cortex both directly and via the cerebellum and is represented
by the following equation in the model:
∆MFeedforward(t) = ZPM (t) − M(t) (3.8)
The projections ZPM (t) encode the feedforward motor command for the speech sound be-
ing produced. This command can be learned over time by averaging the motor commands
from previous attempts to produce the sound. Once an appropriate feedforward command
sequence has been learned for a speech sound, this sequence will successfully produce the
sound with very little, if any, contribution from the feedback system, which will auto-
matically become disengaged since no sensory errors will arise during production unless
unexpected constraints are placed on the articulators or the auditory signal is perturbed.
The model’s motor cortex position cells correspond to “tonic” cells found in motor cor-
tex single-cell recording studies. They represent the length of a muscle or muscle synergy,
and they act as a command to the motor periphery. Their activity is governed by the
following equation:
M(t) = M(tstart) +
t∫
tstart
∆M(x)GO(x)dx (3.9)
where GO(x) is a gating signal that is 0 when not speaking and 1 when speaking1. The
combined signal is used to command the movement of the vocal tract articulators through
the corticobulbar tract. The muscles that move these articulators are controlled by the
cranial nerves: CN V Trigeminal, CN VII Facial, CN IX Glossopharyngeal, CN X Vagus
and CN XII Hypoglossal (Brodal, 1981; Zemlin, 1998). Although the model does not have
a representation of muscle dynamics, the motor cortical state (M(t)) is represented by a
16-dimensional vector where each pair of cells act as agonist and antagonist muscles that
control each of the 8 articulators of the vocal tract model (described later). In the model
1Voluntary changes in speaking rate are currently not handled by the model. See Chapter 7 for adiscussion.
44
simulations, the motor cortex signal controls these parameters to produce a dynamically
changing vocal tract configuration. The resulting vocal tract area function is converted
into a digital filter that is used to synthesize an acoustic signal that forms the output of
the model.
Articulatory and acoustic state
The model also contains variables corresponding to the current articulatory and acoustic
state. These values do not correspond to any brain cell activities; they correspond instead to
the physical positions of the articulators and the resulting acoustic signal. The articulatory
state describes the positions of the eight articulators in the Maeda articulatory synthesizer,
and is governed by the following equation in the model:
Artic(t) = fMAr(M(t − δMAr)) (3.10)
where fMAr is the function relating the motor cortex position command to the Maeda
parameter values (transforming each antagonistic pair into a single articulator position
value) and is the inverse of the proprioceptive part of the fArS function. The Maeda
articulatory vocal tract synthesizer originally consisted of seven parameters but the lip
height parameter has been separated into upper lip and lower lip position parameters. The
details of the vocal tract and its extension are described in Appendix C. The acoustic state
is determined from the articulatory state as follows:
Acoust(t) = fArAc(Artic(t)) (3.11)
where fArAc is the transformation performed by Maeda’s articulatory synthesis software.
Roughly speaking, the delay δMAr corresponds to the time it takes for an action poten-
tial in a motor cortical cell to affect the length of a muscle via a subcortical motoneuron.
This time can be broken into two components: (1) the delay between motor cortex acti-
vation and activation of a muscle as measured by EMG, and (2) the delay between EMG
onset and muscle length change. Regarding the former, Meyer et al. (1994) measured the

45
latency of EMG responses to transcranial magnetic stimulation of the face area of motor
cortex in humans and found latencies of 11-12 ms for both ipsilateral and contralateral
facial muscles. Regarding the latter, time delays between EMG onset and onset of the
corresponding articulator acceleration of approximately 30 ms have been measured in the
posterior genioglossus muscle of the tongue (Majid Zandipour and Joseph Perkell, personal
communication); this estimate is in line with a more thorough investigation of bullfrog mus-
cles which showed average EMG to movement onset latencies of approximately 24 ms in hip
extensor muscles, with longer latencies occurring in other leg muscles (Olson and Marsh,
1998). In keeping with these results, a 42 ms delay is used in the simulations reported
below.
Contribution of feedforward and feedback components
Before an infant has any practice producing a speech sound, the contribution of the feed-
forward control signal to the overall motor command is small since it is not yet tuned.
Therefore, during the first few productions, the primary mode of control will be feedback-
based control. During these early productions, the feedforward control system “tunes itself
up” by monitoring the motor commands generated by the feedback control system (Kawato
and Gomi, 1992). The feedforward system gets better and better over time, all but elim-
inating the need for feedback-based control except when external constraints are applied
to the articulators (e.g., a bite block) or auditory feedback is artificially perturbed. As
the speech articulators get larger with growth, the feedback-based control system provides
corrective commands that are eventually subsumed into the feedforward controller. This
allows the feedforward controller to stay properly tuned despite dramatic changes in the
sizes and shapes of the speech articulators over the course of a lifetime (Callan et al., 2000).
The model implicitly predicts that auditory or somatosensory errors will be corrected
via the feedback-based control mechanism, and that these corrections will eventually be-
come coded into the feedforward controller if the errors are consistently encountered (see
next section for learning in the feedforward control subsystem). This would be the case if a
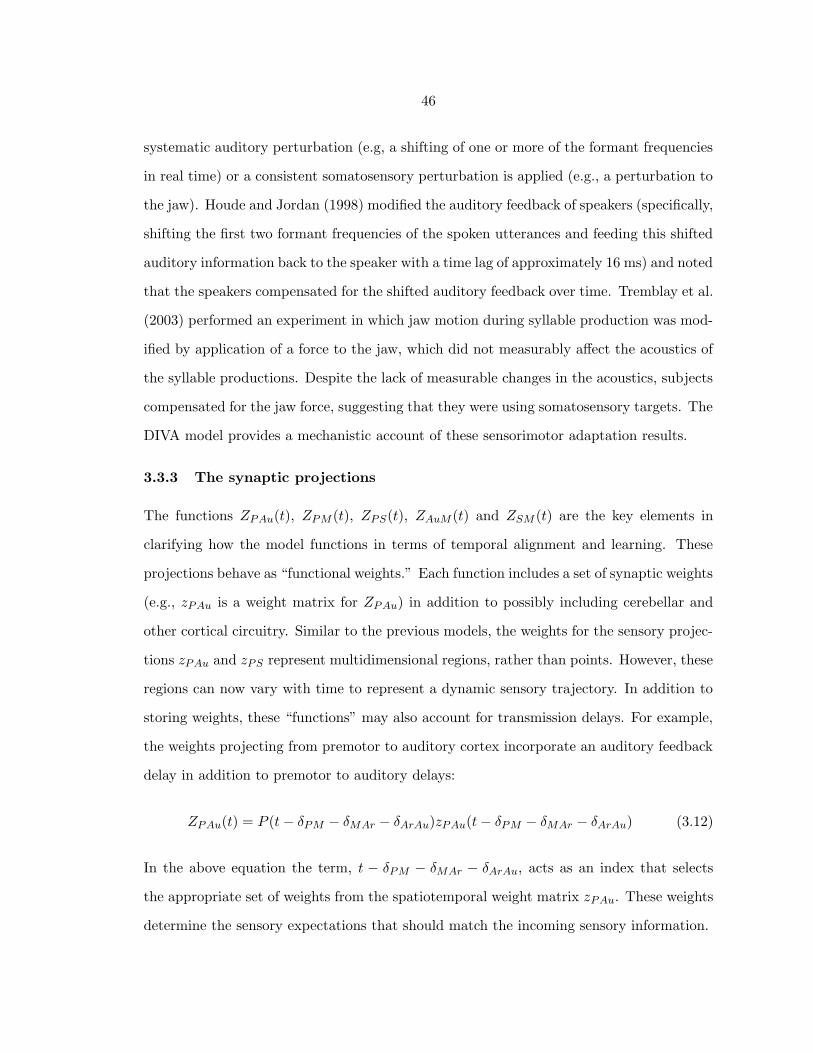
46
systematic auditory perturbation (e.g, a shifting of one or more of the formant frequencies
in real time) or a consistent somatosensory perturbation is applied (e.g., a perturbation to
the jaw). Houde and Jordan (1998) modified the auditory feedback of speakers (specifically,
shifting the first two formant frequencies of the spoken utterances and feeding this shifted
auditory information back to the speaker with a time lag of approximately 16 ms) and noted
that the speakers compensated for the shifted auditory feedback over time. Tremblay et al.
(2003) performed an experiment in which jaw motion during syllable production was mod-
ified by application of a force to the jaw, which did not measurably affect the acoustics of
the syllable productions. Despite the lack of measurable changes in the acoustics, subjects
compensated for the jaw force, suggesting that they were using somatosensory targets. The
DIVA model provides a mechanistic account of these sensorimotor adaptation results.
3.3.3 The synaptic projections
The functions ZPAu(t), ZPM (t), ZPS(t), ZAuM (t) and ZSM (t) are the key elements in
clarifying how the model functions in terms of temporal alignment and learning. These
projections behave as “functional weights.” Each function includes a set of synaptic weights
(e.g., zPAu is a weight matrix for ZPAu) in addition to possibly including cerebellar and
other cortical circuitry. Similar to the previous models, the weights for the sensory projec-
tions zPAu and zPS represent multidimensional regions, rather than points. However, these
regions can now vary with time to represent a dynamic sensory trajectory. In addition to
storing weights, these “functions” may also account for transmission delays. For example,
the weights projecting from premotor to auditory cortex incorporate an auditory feedback
delay in addition to premotor to auditory delays:
ZPAu(t) = P (t − δPM − δMAr − δArAu)zPAu(t − δPM − δMAr − δArAu) (3.12)
In the above equation the term, t − δPM − δMAr − δArAu, acts as an index that selects
the appropriate set of weights from the spatiotemporal weight matrix zPAu. These weights
determine the sensory expectations that should match the incoming sensory information.

47
The projections share some common properties. The projection from premotor to
auditory error cells ZPAu(t) is learned from external sounds while the associations for the
remaining projections are learned from information generated by the system (e.g., during
babbling movements). The projections from premotor to the higher order sensory cortices
have a delayed effect in order to align the activity with the incoming sensory afference
due to the motor command while the remaining projections have an immediate or near
immediate effect on their post-synaptic cells. The projections ZPAu(t), ZPS(t) and ZPM (t)
can be considered forward projections associating motor actions to their corresponding
sensory consequences, while ZAuM (t) and ZSM (t) would be considered inverse projections
associating sensory changes with corresponding motor changes. The projections ZPAu(t),
ZPS(t) and ZPM (t) contain spatiotemporal weight matrices whereas ZAuM (t) and ZSM (t)
contain only spatial weight matrices. Spatiotemporal projections represent spatial and
temporal properties (e.g., formant positions or regions for each time point in an utterance
such as /ba/). Spatial projections represent only spatial properties; e.g., mapping a change
in sensory space to a change in motor space requires no temporal information.
If the projections are thought to be synapses from one group of cells to another, then the
learning of an association between these groups can be defined in terms of three quantities:
context (or input), output and teaching signal (secondary input). Context represents the
activity of the presynaptic cell. Output represents the activity of the postsynaptic cell. The
teaching signal is some additional input that allows modification of the association between
the input and output cells. Details of how these projections are possibly learned and
how they are activated at the appropriate time are presented in the following paragraphs.
A discussion of how the cerebellum can contribute towards learning these projections is
presented in the next chapter.
Premotor to higher order auditory projection: ZPAu(t)
The purpose of this projection is two-fold: (1) to define the expected auditory consequences
in the higher order auditory regions and (2) to ensure that this projection is temporally

48
aligned with the actual auditory afference such that an appropriate error can be computed.
It is hypothesized that the spatiotemporal weights of this projection become tuned when
an infant listens to examples of a speech sound, e.g. as produced by his/her parents2. In
the current model the weights are algorithmically tuned by presenting the model with an
audio file containing a speech sound produced by an adult male. The weights encoding
that sound are then adjusted so that they encode upper and lower bounds for each of the
first three formant frequencies at 1 ms intervals for the duration of the utterance.
In terms of timing, when a sound is heard, successful categorization of the sound leads
to premotor activity. The trick is to determine a method of triggering the premotor cell
to read out the sound pattern with an appropriate delay. Algorithmically, this involves
learning the time delay between premotor activity and the corresponding sensory activity.
This delay can then be used to determine when the projections from the premotor cortex
are activated in the auditory error cells.
Biologically one way of implementing this alignment would be to vary the degree of
corticocortical myelination to delay neural information transfer by the appropriate delay.
Such variation has been observed in the climbing fiber projections to the Purkinje cells in
the cerebellum (Lang and Rosenbluth, 2003). Such an option would predict that a fully
developed system would be incapable of adapting to a delayed auditory feedback. A second
option would be to use the cerebellum, which is capable of predicting time intervals and
remains adaptive beyond the developmental period. Such an approach is hypothesized in
the following chapter.
2A discussion of how this learning takes place in humans is beyond the scope of this dissertation. Oneapproach to classify the sensory input representations into corresponding targets is to use a process involvingstatistical clustering (Mattys and Jusczyk, 2001; Jusczyk, 1999). This process involves categorizing inputsounds based on how often these sounds are heard and the differences between these sounds in terms ofsensory activation. See Morasso et al. (2001) and Westermann and Reck (2004) for modeling work onlearning these mappings.

49
Premotor to higher order somatosensory projection: ZPS(t)
It is hypothesized that the spatiotemporal weights of ZPS(t) become tuned during correct
self-productions of the corresponding speech sound. This occurs after learning of the au-
ditory target for the sound since the auditory target can be learned simply by monitoring
a sound spoken by someone else, but many aspects of the somatosensory target require
monitoring of correct self-productions of the sound, which are expected to occur after (and
possibly during) the learning of feedforward commands for producing the sound.
Regarding the timing aspect, the somatosensory feedback activity always occurs after
the activation of the speech sound map cell (as opposed to the auditory targets described
above). Thus the premotor to somatosensory projections need to have a delayed effect on
their targets to match expectation with sensation. This involves learning a delayed asso-
ciation between input (premotor cortical activation) and output (somatosensory targets)
based on the teaching signal (somatosensory feedback). Although this is a different form
of association (teaching signal arrives after context as opposed to teaching signal before
context in the auditory target scenario above), computationally this is implemented in
exactly the same manner as the readout of the auditory target described above.
Premotor to motor projection: ZPM (t)
The spatiotemporal weights of the feedforward projection from premotor to motor cortex
is learned over time by averaging the motor commands from previous attempts to produce
the sound. Similar to the somatosensory projections described previously, the teaching
signal (motor activity due to corrective feedback command) occurs after the context is
generated. However, unlike the somatosensory projections which needed to have a delayed
effect, the output from this projection needs to have an immediate effect. There is no
temporal alignment required here, but one has to match the corrective command to the
motor command that generated it.
Biologically this sort of learning is based on the concept of eligibility traces (Klopf,
1982). In this sort of learning, the order of activity is: context gets activated, output takes

50
place and then after some delay learning takes place. Again, the cerebellum may be used
to perform this type of learning and the scope and implications of that will be discussed
in the next chapter.
Higher order sensory to motor cortex projections: ZSM (t) and ZAuM (t)
The spatial weights of the two inverse projections ZSM (t) and ZAuM (t) have the same issues
of timing as learning the auditory pattern of activity. In order to learn these associations, a
movement is made and the sensory changes corresponding to the movement are associated
with the movement itself.
Mathematically speaking, these projections approximate a pseudoinverse of the Jaco-
bian of the function relating motor cortical activity (M(t)) to the corresponding sensory
state (Au(t) and S(t)). Though calculated algorithmically in the current implementation,
these weights are believed to be tuned during an early babbling stage by monitoring the
relationship between movement commands and their sensory consequences (see Guenther
et al. 1998; Guenther 1995 for simulations involving learning of the weights). These synap-
tic weights effectively implement what is sometimes referred to as an “inverse model” in the
motor control literature, since they represent an inverse kinematic transformation between
desired sensory consequences and appropriate motor actions.
In terms of timing, the sensory changes arriving later have to be associated with the
movements made earlier. For a biologically plausible implementation, the model can utilize
an eligibility trace mechanism (Klopf, 1982) to learn this association between the sensory
error cells and phasic motor cells that generatee the feedback motor command. The motor
phasic cells that generate the movement produce an eligibility trace. When the sensory
changes occur, these are associated with the motor phasic cells through a Hebbian learning
scheme. It is assumed that this map is learned during “motor babbling.”
The following section will demonstrate the performance of the model during normal pro-
duction illustrating the learning process. Simulations of model response to somatosensory
perturbations will also be presented. These are intended to illustrate the temporal aspects

51
of combining feedforward and feedback control and the algorithmic implementations of
temporal alignment and learning processes.
3.4 Simulations
This section describes computer simulations that illustrate the model’s ability to learn to
produce new speech sounds, as well as simulations of lip and jaw perturbation experiments.
Introducing perturbations during a speech task and observing the system response provides
information about the nature of the controller. In particular, the time course and movement
characteristics of the response can provide a window into the control processes, including
neural transmission delays and the nature of the transformation between sensory and motor
representations. Parameter choices and targets are presented in Appendix D.
The simulations presented in the section highlight the characteristics of the model that
distinguish the new model from its predecessors. The model introduced the idea of sepa-
ration of feedback and feedforward control subsystems. The first simulation demonstrates
the model’s capability to learn a spatiotemporal sound pattern and in particular illustrates
the transfer of control from the feedback to the feedforward controller. The new model
incorporates realistic delays between components and remains stable during learning and
execution. The earlier versions of the model would not be stable if delays were introduced
between the model components. The first example also demonstrates this stability during
learning. As the earlier models did not have any delays in them, they were incapable of
simulating the time-course of responses to perturbations. The second and third simula-
tions demonstrate the ability of the model to simulate such data while maintaining other
fundamental properties, such as motor equivalence.
3.4.1 Simulation 1: “good doggie”
For this simulation, an utterance of the phrase “good doggie” was recorded at a sampling
rate of 10 kHz. Formants were extracted from the signal and were modified slightly to
form an auditory target that better matched the vocal tract characteristics of the Maeda

52
synthesizer. The auditory target was represented as a convex region for each time point
(see Guenther et al. 1998, for a discussion of convex region targets). Figure 3·6 shows the
results of the simulations through the spectrograms of model utterances. The top plot
shows the original spectrogram. The remaining plots show the 1st, 3rd, 5th, 7th, and 9th
model attempts to produce the sound. With each trial, the feedforward system subsumes
the corrective commands generated by the feedback system to compensate for the sensory
error signals that arose during that trial. As can be seen from the figure, the spectrograms
approach the original as learning progresses. The left bar on the right corresponds to the
contribution of the feedforward command while the right bar corresponds to the feedback
activity. As learning progresses the feedforward system gets better, thereby reducing the
error detected by the feedback system. As a result the contribution of the feedback system
diminishes with time.
The process by which the model learns can be best thought of as trying to mimic the
acoustic properties of the original signal. This mimicry does not utilize any knowledge
of what phonetic units may be contained in the acoustic signal. Instead, it focuses on
generating a time-varying modulation of the vocal tract, the output of which best matches
the target. The generation of the motor commands is driven by the discrepancy between
the target and the model’s output.
3.4.2 Simulation 2: Abbs and Gracco (1984) lip perturbation
In this simulation of the lip perturbation study (Abbs and Gracco, 1984), the model’s lower
lip was perturbed downward using a steady force during the movement toward closure of
the lips when producing the utterance /aba/. Figure 3·7 shows a comparison of the model’s
productions to those measured in the original experiment for normal (no perturbation) and
perturbed trials. The experimental results demonstrated that the speech motor system
compensates for the perturbation by lowering the upper lip further than normal, resulting
in successful closure of the lips despite the downward perturbation to the lower lip. The
corresponding model simulations are shown in the right panel of Figure 3·7.
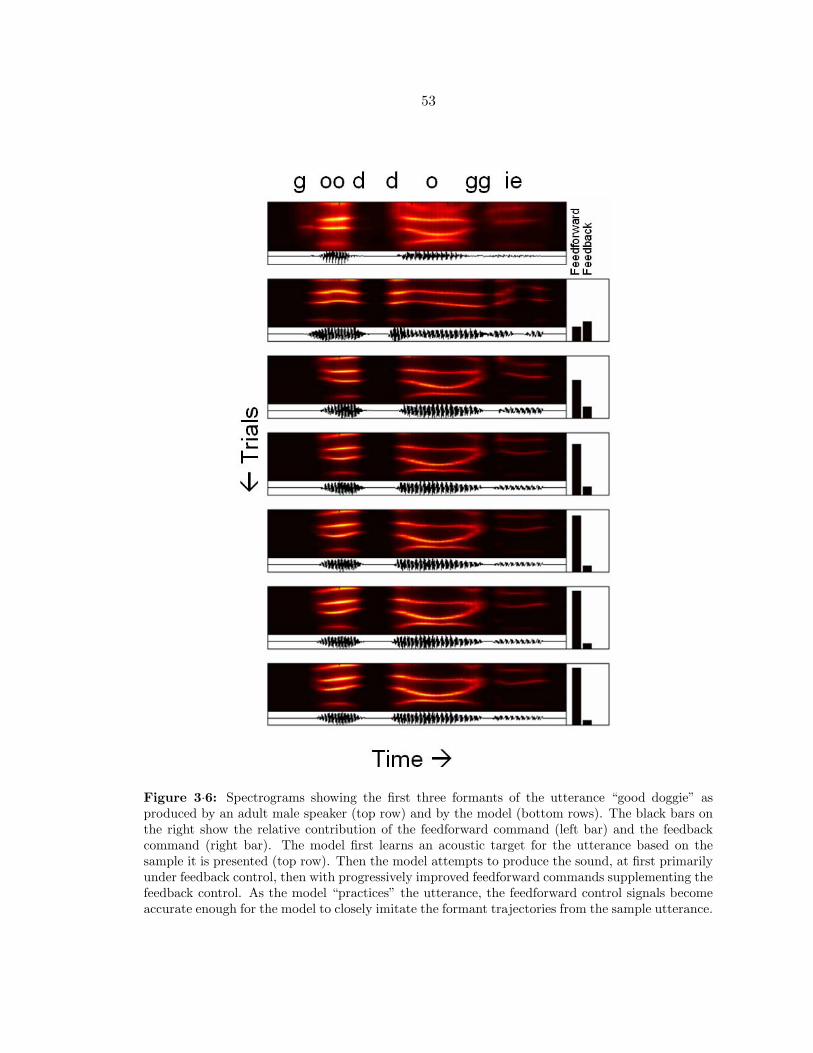
53
Figure 3·6: Spectrograms showing the first three formants of the utterance “good doggie” asproduced by an adult male speaker (top row) and by the model (bottom rows). The black bars onthe right show the relative contribution of the feedforward command (left bar) and the feedbackcommand (right bar). The model first learns an acoustic target for the utterance based on thesample it is presented (top row). Then the model attempts to produce the sound, at first primarilyunder feedback control, then with progressively improved feedforward commands supplementing thefeedback control. As the model “practices” the utterance, the feedforward control signals becomeaccurate enough for the model to closely imitate the formant trajectories from the sample utterance.

54
The model was first trained to produce the utterance /aba/. After the sound was
learned, the lower lip parameter of the model was then perturbed with a constant downward
force. This was similar to the perturbation applied in the original experiment. The onset of
perturbation was determined by tracking the velocity of the jaw parameter. The vertical
black line marks the onset of perturbation. The position of the lips during the control
condition is shown with the dashed lines while the position during the perturbed condition
is shown with the solid lines. When the lips are perturbed, the tactile and proprioceptive
feedback no longer matches the somatosensory target, giving rise to a somatosensory error
signal. This error signal leads to the generation of a corrective motor command through
the model’s feedback subsystem. The command is generated approximately 60 ms (the
sum of δArS , δSM and δMAr ) after the onset of perturbation. This is within the range
of values (22-75 ms) measured during the experiment. If the perturbation was applied
continuously, the system would adapt to the perturbation over a set of trials.
3.4.3 Simulation 3: Kelso, Tuller,Vatikiotis-Bateson and Fowler (1984) jaw
perturbation
In the experiment (Kelso et al., 1984), the jaw was perturbed downward during the upward
movement of the closing gesture in each of the two words: /baeb/ and /baez/. Their results
demonstrated that the upper lip compensated for the perturbation during the production
of /baeb/ but not during the production of /baez/ (top panel of Figure 3·8). These
results indicate that compensation to perturbation does not affect the whole vocal tract
but primarily affects articulators involved in the production of the particular phonetic unit
that was being perturbed. Since the upper lip is not involved in the production of /z/, it
is not influenced by the jaw perturbation in /baez/.
In the model simulations (bottom panel of Figure 3·8), we used the words /baeb/
and /baed/ to demonstrate the effects of jaw perturbation. The vocal tract model is not
capable of producing the phoneme /z/ simply by controlling the 8 parameters3, so instead
3Glottal source parameters of the Maeda vocal tract model need to be controlled in addition to the
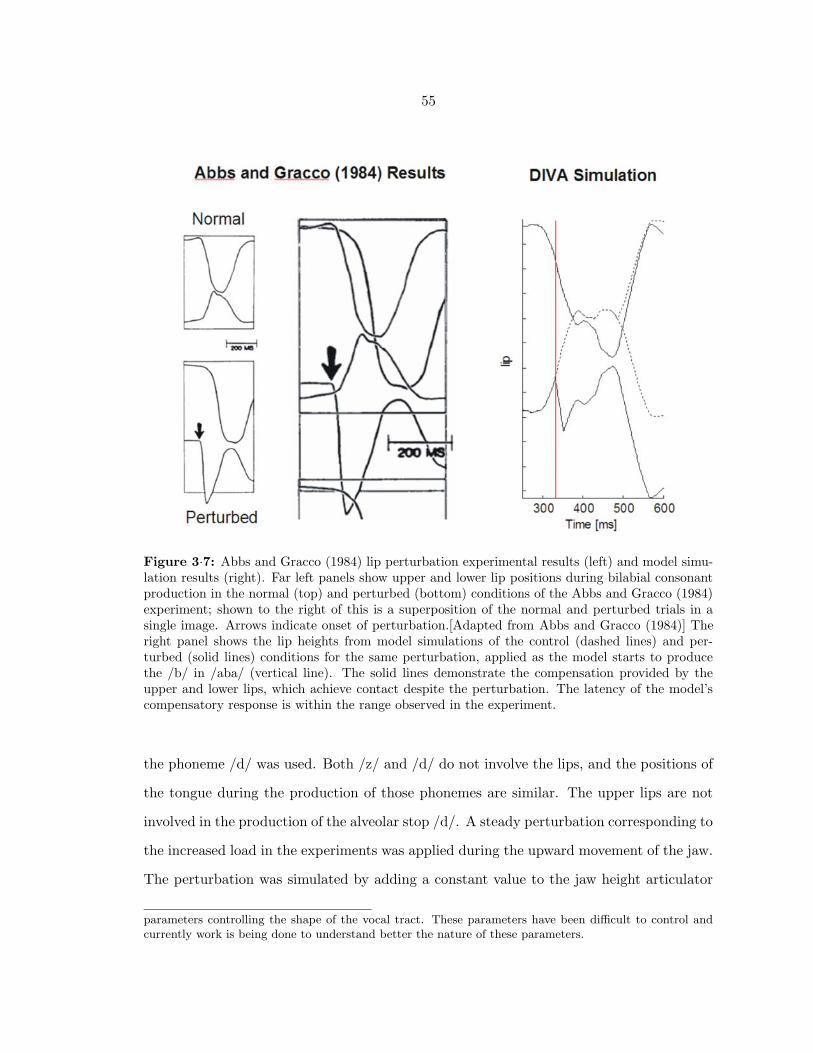
55
Figure 3·7: Abbs and Gracco (1984) lip perturbation experimental results (left) and model simu-lation results (right). Far left panels show upper and lower lip positions during bilabial consonantproduction in the normal (top) and perturbed (bottom) conditions of the Abbs and Gracco (1984)experiment; shown to the right of this is a superposition of the normal and perturbed trials in asingle image. Arrows indicate onset of perturbation.[Adapted from Abbs and Gracco (1984)] Theright panel shows the lip heights from model simulations of the control (dashed lines) and per-turbed (solid lines) conditions for the same perturbation, applied as the model starts to producethe /b/ in /aba/ (vertical line). The solid lines demonstrate the compensation provided by theupper and lower lips, which achieve contact despite the perturbation. The latency of the model’scompensatory response is within the range observed in the experiment.
the phoneme /d/ was used. Both /z/ and /d/ do not involve the lips, and the positions of
the tongue during the production of those phonemes are similar. The upper lips are not
involved in the production of the alveolar stop /d/. A steady perturbation corresponding to
the increased load in the experiments was applied during the upward movement of the jaw.
The perturbation was simulated by adding a constant value to the jaw height articulator
parameters controlling the shape of the vocal tract. These parameters have been difficult to control andcurrently work is being done to understand better the nature of these parameters.

56
of the vocal tract model. The perturbation remained in effect through the end of the
utterance, as in the experiment. The onset of the perturbation is indicated by the vertical
line in the simulation diagrams of Figure 5 and was determined by the velocity and position
of the jaw displacement. The dotted lines indicate the positions of the articulators in the
normal (unperturbed) condition. The solid lines indicate the positions in the perturbed
condition. As in the experiment, the upper lip compensates by moving further downward
when the bilabial stop /baeb/ is perturbed, but not when the alveolar stop /baed/ is
perturbed.
3.5 Summary
In this chapter, a revised DIVA model was presented that extended the neural bases of
the model to discrete brain regions, provided a control solution to the problem of neu-
ral transmission delays (in particular, delays in sensory feedback) and demonstrated the
model’s ability to provide a detailed account for experiments involving compensations to
perturbations of the lip and jaw. Discussions about the learning in the model’s components
identified timing issues that were solved algorithmically. The second part of this disserta-
tion will present functional imaging data that substantiates the neural bases of this model
and provides directions of extending the model. But first, the next chapter will review and
discuss properties of the cerebellum and provide an alternative physiologically plausible
solution to addressing the temporal alignment and learning issues.

57
Figure 3·8: Top: Results of (Kelso et al., 1984) jaw perturbation experiment. Solid lines indicatenormal (unperturbed) trials, and dotted lines indicate perturbed trials. Vertical line indicates onsetof perturbation. Lower lip position is measured relative to jaw. Subjects produce compensatorydownward movement of the upper lip for the bilabial stop /b/ but not for the alveolar /z/. [Adaptedfrom Kelso et al. (1984).] Bottom: Corresponding DIVA simulation. As in the Kelso et al. (1984)experiment, the model produces a compensatory downward movement of the upper lip for thebilabial stop /b/ but not for the alveolar stop /d/.
Chapter 4
THE CEREBELLUM AND ITS RELATION TO DIVA
4.1 Introduction
The cerebellum has an anatomical structure that is consistent throughout (Voogd and
Glickstein, 1998). Given the unique internal structure and the widespread connectivity to
and from cerebral cortex, several hypotheses (see Barlow 2002, for a review) have been
proposed to the effect that the cerebellum utilizes a consistent processing scheme of trans-
forming inputs to outputs. However, the details of how the transfer function is generated
and the possible roles of the cerebellum in cognitive control remain disputed.
In the DIVA model, the cerebellum is hypothesized as a component necessary to refine
the timing of productions. On the assumption that the cerebellum functions as a context-
dependent adaptive subsystem, the specific hypothesis is that it supplements feedback
processing in the cerebral cortex with feedforward execution1 The feedback processing in
cerebral cortex utilizes mismatch between the sensory (in this case auditory and somatosen-
sory) expectation of an action (such as speaking) and the actual sensory feedback. But
such feedback-based control is too slow for the rapid movements of the vocal tract that are
necessary for speaking. This is where the cerebellum comes in. It preempts the cortical,
feedback-based control commands by feedforward commands that are well-timed. In par-
ticular, it will be hypothesized that the cerebellum plays a significant role in feedforward
learning as well as the sensory prediction of action.
Following a review of cerebellar neuroanatomy, neurophysiology and some current mod-
els of cerebellar function, this chapter presents a system level model of the cerebellum. The
1The cerebellum does not replace the feedforward pathway described in the previous chapter but addsto it. Its contributions are discussed later in this chapter.
58

59
model, built using the framework established in the Recurrent Slide and Latch (RSL) model
(Rhodes and Bullock, 2002), explains data obtained from classical conditioning experiments
and is extended to demonstrate the operation of the cerebellum in the presence of neural
transmission delays. Simulations demonstrate the behavior of this extended model. The
chapter concludes with a discussion of the hypothesis (see previous paragraph) and the
utility of such a model in the DIVA framework.
The contributions of the model include accounting for timedelays inherent in neural
transmission (Miall et al., 1993), serial order of motor execution (Rhodes and Bullock,
2002) and inverse kinematics (Miall et al., 1993). The cerebellum is also hypothesized to
play an important role in inverse dynamics, but this topic is not covered in this thesis.
4.2 Review of cerebellar neuroanatomy, neurophysiology and models
A thorough treatment of the neuroanatomy and neurophysiology of the cerebellum is be-
yond the scope of this dissertation, which will restrict itself to presenting an overview in the
following paragraphs. For detailed reviews see Voogd and Glickstein (1998) and Bastian
and Thach (1995).
4.2.1 Neuroanatomy and neurophysiology
General afferent and efferent connections of the cerebellum
The cerebellum is attached to the brainstem via three pairs of peduncles: the inferior
and middle cerebellar peduncles carry information into the cerebellum and the superior
cerebellar peduncle carries the output of the cerebellum. The cerebellum receives all of its
input through mossy fibers from the pontine nuclei and spinal cord, and climbing fibers
from the inferior olive. The pontine nuclei receive input from many areas of cerebral cortex
as well as collaterals of cerebellar outputs. The cerebellum sends its outputs through the
thalamus to all of motor and many other parts of cortex (Schmahmann and Pandya, 1997),
largely avoiding primary sensory cortices. Connections to and from the cerebellum have
been identified in premotor cortex and motor cortex (Kelly and Strick, 2003; Dum and
60
Strick, 2003), in SMA (Sakai et al., 2002), in parietal cortex (Clower et al., 2001; Amino
et al., 2001; Stein and Glickstein, 1992; Schmahmann and Pandya, 1989, 1990) and in the
superior temporal region (Schmahmann and Pandya, 1991).
Recent studies (Kelly and Strick, 2003; Dum and Strick, 2003; Middleton and Strick,
2000) have demonstrated the existence of reciprocal connectivity between the cerebellum
and the input and output regions of cerebral cortex. That is, there exist loops through the
cerebellum, which originate and terminate in close proximity in cerebral cortex. Although
these loops have been thus far been demonstrated in primary motor cortex and area 46
in monkeys, it is highly likely that these loops might exist in all regions that project to
the cerebellum. According to Dum and Strick (2003), all critical regions that project to
the cerebellum appear to have a dentate nucleus output pathway back to those regions.
The cerebellum and the basal ganglia do not interact directly with each other and most of
their projections to the thalamus are segregated. However, recent evidence has shown that
the outputs of the two regions may overlap in the intra-laminar layers in the thalamus and
target common areas of the frontal lobe (Sakai et al., 2002, 1999, 1996; Rouiller et al., 1994).
While the global cerebrocerebellar circuitry has been well established, the specificities of
the connection pathways between cerebral cortex and cerebellar cortex through the pontine
nuclei remain largely unclear.
4.2.2 Neuroanatomy: internal structure of the cerebellum
Santiago Ramon y Cajal first demonstrated the internal structure of the cerebellum using
a Golgi staining technique (Cajal, 1990, a translation). Figure 4·1 shows some of the sig-
nificant internal connections in the cerebellum. The mossy fibers (MFs) deliver the inputs
from the pontine nuclei and the spinal cord to the granule cells. Most MFs originating in
the spinal cord also send collaterals to the deep cerebellar nuclei (DCN), while the collat-
erals of MFs from the pontine nuclei are scant (Shinoda et al., 1992). Parallel fibers (PF)
connect the granule cells to the Purkinje cells (PC). The PCs synapse onto DCN cells (in
an inhibitory fashion), thereby completing one part of the circuit. In addition, climbing

61
fibers (CF) arising from the olivary nuclei, e.g. the inferior olive (IO), synapse onto the
PCs. They also send collaterals to DCN cells, which in turn project back to the IO.
Figure 4·1: A simplified cerebellar circuit representing the essential elements (see text for details).The numbers represent the ratio of fiber type to the cells they synapse with (except for the mossyfiber to Purkinje cell ratio as there is no direct connection between them). Inhibitory neuronsand pathways are indicated in black and excitatory cells are indicated with thin black outlines.Excitatory pathways are indicated in gray. The dendritic branch of the PC is perpendicular to thedirection of the parallel fiber, but has been shown for visualization purposes. The part of the circuitinside the cerebellum is surrounded by a dashed outline. Abbreviations: PN, Pontine nuclei; GrC,Granule cells; PC, Purkinje cells; DCN, Deep cerebellar nuclei; IO, inferior olive; GoC, Golgi cells;BC, basket cells; SC, stellate cells; mf, mossy fiber; pf, parallel fiber; cf, climbing fiber.
There are 3 types of cells along the PF pathway: Golgi cells, basket cells and stellate
cells. All of them receive inputs from the PFs, but differ in where they synapse. Golgi

62
cells synapse on the granule cells, basket cells synapse on the PC somas and the stellate
cells synapse on the PC dendrites. These synapses are all inhibitory. In addition to the
above cells there are unipolar brush cells and Lugaro cells. The brush cells relay MF input
to granule cells in the vermis only. Lugaro cells are inhibited by PC and they in turn
inhibit basket and stellate cells. The DCN cells are the sole output of the cerebellum,
and a significant part of this output reaches cerebral cortex via the thalamus. Within the
cerebellum, one set of DCN cells send inhibitory axons to the IO and another set sends
excitatory collaterals to cerebellar cortex via the pontine nuclei.
The following information is taken from Barlow (2002) and is meant to demonstrate
the massive fan-out at the MF to granule cell projection and the corresponding fan-in at
the PC to DCN projection. Each MF makes contact with roughly 450 granule cells and
the ratio of MFs to PCs is roughly 4:1. The number of PF synapses per PC is estimated at
over 200,000. PFs pass through 450 to 1100 PCs along a folium but synapses are made on
every three to five PCs. There is a ratio of 1 CF to every 15 PCs and when development
is normal, CF synapses on PCs are pruned such that each mature PC is contacted by only
one CF. Each PC contacts roughly 35 DCN cells.
4.2.3 Neurophysiology
Even though the internal architecture of the cerebellum is remarkably similar throughout,
different parts of the cerebellum have been shown to be involved with different aspects
of behavior. The cerebellum can be broadly divided into three phylogenetic subdivisions:
vestibulo- (medial), spino- (intermediate) and cerebro- (lateral) cerebellum as shown in
Figure 4·2 (Kandel et al., 2000). These subdivisions send their output through the fastigial,
interpositus and dentate nuclei respectively.
Lesion studies have demonstrated localized deficits associated with each of these re-
gions. Lesions of the medial cerebellum and the fastigial nucleus impair control of eye
movements and movements requiring the control of balance, such as stance and gait (Thach
and Bastian, 2004; Thach et al., 1992). Damage to the intermediate cerebellum and the

63
Figure 4·2: A schematic diagram showing the phylogenetic divisions of the cerebellum and thecorresponding output nuclei. (From Kandel et al. 2000, p. 835)
interposed nuclei results in lack of coordination between agonist-antagonist muscles and
tremor (Thach et al., 1992; Vilis and Hore, 1980). According to Bracha et al. (1999), “the
interposed nuclei are involved in the control of ipsilateral action primitives” and “inactivat-
ing the interposed nuclei affects several modes of action of these functional units (p. 1).”
The intermediate nuclei appear to control voluntary movement of extremities and project
to frontal cortex through the ventrolateral nucleus of the thalamus.
Lateral cerebellar cortex and dentate nuclei lesions cause synergist muscle incoordina-

64
tion, reach overshoot, uncoordinated hand-eye movements, impaired multijointed move-
ments, delays in motor cortical cell onset and slight impairment of initiation of movements
triggered by sensory stimuli and mental percepts (Thach et al., 1992; Flament and Hore,
1986; Meyer-Lohmann et al., 1975).
In addition to these tasks, recent imaging studies (Fiez and Petersen, 1998) have demon-
strated the involvement of the extreme lateral, posterior and inferior cerebellum in cognitive
tasks that do not involve overt movements. Recent studies demonstrated a temporal order
of activation of cerebellar nuclei and regions of cerebral cortex. Cells in the lateral zone
often lead movement and the onset of activity in motor cortex, while cells in the interme-
diate area fire after motor cortex (Hore et al., 1977; Thach, 1975; Allen and Tsukahara,
1974).
In a study by Thach (1978), there was a predictive order of cell responses following
a light stimulus that triggered movement. The order of activity was as follows: dentate,
motor cortex, interpositus and then muscles. However, when a transient force was ap-
plied to the wrist, the firing order reversed: muscles, interpositus, motor cortex, then
dentate. Based on these observations, the author suggests that the dentate helps to ini-
tiate movements that are triggered by mentally associated stimuli. On the other hand,
the interpositus is more involved in compensatory or corrective movements initiated via
feedback from movement itself (feedback activity starts before a physical movement has
started).
4.3 Classical conditioning, hypothesized functions and the RSL model
On the basis of the anatomical structure and observed neurophysiology, several functional
roles have been hypothesized for the cerebellum. In a review chapter, Bastian and Thach
(2001) summarize a set of roles that includes tonic reinforcement, timing of behavior,
command-feedback comparison, combining and coordinating movements, sensory process-
ing and motor learning. The cerebellum is considered an integral component for learning
temporally conditioned associations (Attwell et al., 2002). This cerebellar function is the

65
key to the utility of the cerebellum in adaptive motor control (e.g., speech production) and
in particular generating signals at an appropriate delay after the onset of a context.
This section is divided into three parts. The first part of this section summarizes
cerebellar involvement in certain experiments of classical conditioning. The second part
describes a set of papers that contribute important insights into the functional role of the
cerebellum. The final part describes the RSL model of the cerebellum. In addition to
explaining various observations of classical conditioning, it forms the basis of the cerebellar
model used in the extended DIVA model.
4.3.1 Cerebellar role in classical conditioning
Classical conditioning provides a clear demonstration of cerebellar involvement in context-
dependent adaptive timing. A stimulus such as an airpuff to the eye causes the eye to
blink. A tone on the other hand would not cause the eye to blink. However, if the subject is
presented with trials where a tone is followed by an airpuff, the subject will eventually start
blinking in anticipation of the airpuff. In the case that this airpuff occurs after a fixed delay
following the presentation of the tone, the subject learns to blink the eye at the appropriate
time to ameliorate the effect of the airpuff. The nervous system has therefore learned to
produce a response (conditioned response) at an appropriate time after the presentation of
a stimulus (conditioned stimulus) in order to suppress the effect of an obnoxious stimulus
(unconditioned stimulus). The conditioned stimulus can be considered the context and the
unconditioned stimulus the teaching signal. The conditioned response is the output of the
system. Several of the timing issues in the DIVA model can be solved using the cerebellum
to implement such functionality. For example, it is generally accepted that the cerebellum is
important for the acquisition and performance of the rabbit nictitating membrane response
(NMR; see Bracha 2004 for a review) and the eyeblink response. However, there seems to
be a lack of agreement on the role of the different parts of the cerebellum. A summary of
experimental observations is presented here.
Several studies have demonstrated that lesions of the cerebellar cortex, DCN, or IO
66
prevent or impair expression of conditioned responses. In addition, reversible cooling or in-
activations of these structures prevent acquisition of conditioning (Bracha, 2004). Attwell
et al. (2002) review the effect on classical conditioning as a result of inactivation of different
cerebellar sites. The review and its associated studies make a strong case that the cerebel-
lum is a necessary component for learning, maintaining and executing a timed response to
a conditioned stimulus. Other studies (Gerwig et al., 2004; Christian and Thompson, 2003;
Gerwig et al., 2003; Dimitrova et al., 2002; Bracha et al., 2000; Blaxton et al., 1996) have
observed the functional characteristics of the cerebellum during eyeblink conditioning in
humans. According to these studies, specific regions of the cerebellum (e.g. regions covered
by the superior cerebral artery) contribute to eyeblink conditioning. However, few studies
have looked at the interaction of the cerebellar circuit with other areas of the brainstem
during conditioning.
Apart from providing an example of timing, explaining certain characteristics of clas-
sical conditioning is a prerequisite for any cerebellar model. The RSL model discussed
later is capable of simulating different types of classical conditioning and hence will be
used as a starting point for a physiological model that can be used to solve the timing and
learning issues in DIVA. The modifications should be such that the model does not lose
the necessary behavior for various classical conditioning tasks.
4.3.2 The functional roles of the cerebellum
For the purposes of this dissertation, it is very important to consider the article by Allen
and Tsukahara (1974) on cerebrocerebellar interaction. While the article details several
aspects of neuroanatomy and neurophysiology of the cerebral cortex and cerebellum, the
more important contribution is the proposal of a two-stage model (Figure 4·3) of movement
consisting of planning and execution. They hypothesized that the lateral cerebellum is
primarily involved with the planning of movement, while the intermediate cerebellum is
primarily involved with the execution of movement. The lateral cerebellum together with
the basal ganglia and association cortices inform the motor cortex of the execution plan.
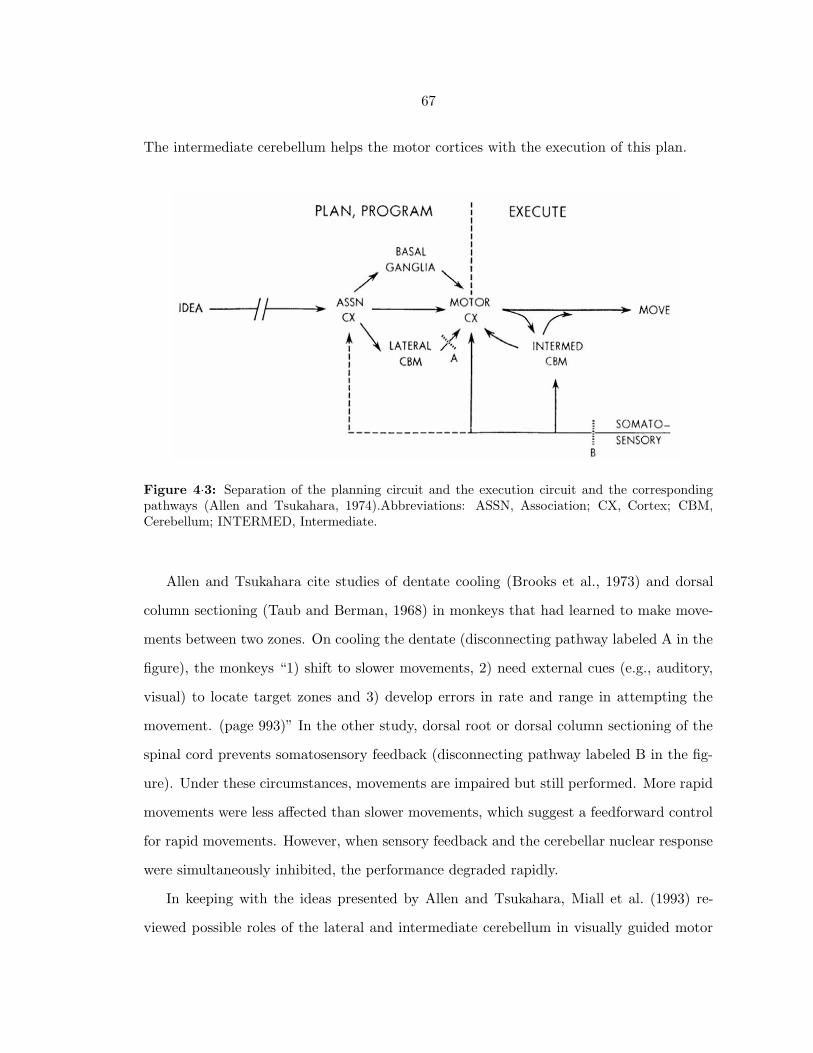
67
The intermediate cerebellum helps the motor cortices with the execution of this plan.
Figure 4·3: Separation of the planning circuit and the execution circuit and the correspondingpathways (Allen and Tsukahara, 1974).Abbreviations: ASSN, Association; CX, Cortex; CBM,Cerebellum; INTERMED, Intermediate.
Allen and Tsukahara cite studies of dentate cooling (Brooks et al., 1973) and dorsal
column sectioning (Taub and Berman, 1968) in monkeys that had learned to make move-
ments between two zones. On cooling the dentate (disconnecting pathway labeled A in the
figure), the monkeys “1) shift to slower movements, 2) need external cues (e.g., auditory,
visual) to locate target zones and 3) develop errors in rate and range in attempting the
movement. (page 993)” In the other study, dorsal root or dorsal column sectioning of the
spinal cord prevents somatosensory feedback (disconnecting pathway labeled B in the fig-
ure). Under these circumstances, movements are impaired but still performed. More rapid
movements were less affected than slower movements, which suggest a feedforward control
for rapid movements. However, when sensory feedback and the cerebellar nuclear response
were simultaneously inhibited, the performance degraded rapidly.
In keeping with the ideas presented by Allen and Tsukahara, Miall et al. (1993) re-
viewed possible roles of the lateral and intermediate cerebellum in visually guided motor

68
control while accounting for feedback delays in the system. They introduced an idea from
process engineering called the “Smith Predictor” (Smith, 1959) into neurophysiological mo-
tor control. According to that model, the cerebellum may contribute in two different ways:
as an internal forward model (Wolpert and Miall, 1996) that simulates the behavior of the
motor system predicting sensory outcomes to motor commands, and as a delay model that
queues these sensory predictions to match with actual sensory feedback. It can use the
mismatch in prediction to tune the forward model. The authors do not clarify the learning
processes that enable the cerebellum to function as a delay model in combination with a
forward model.
In a set of articles (Spoelstra et al., 2000; Schweighofer et al., 1998a,b), an inverse
dynamics model of fast-accurate motor control was proposed that takes into account delays
in the system. In the first paper (Schweighofer et al., 1998a) it was hypothesized that, by
learning aspects of the inverse dynamics model, the cerebellum can possibly “increase
the accuracy of reaching movements by compensating for the interaction torques.” In a
companion paper (Schweighofer et al., 1998b), the model was augmented with realistic
delays and noise in the system. However, Spoelstra et al. (2000) pointed out that the
model needs a lot of training and is incapable of handling rapid movements. To effectively
produce rapid movements, the paper introduced cerebellar learning using eligibility traces
and error signals in the form of muscle spindle feedback in the manner of Contreras-Vidal
et al. (1997). An “eligibility trace” allows synaptic modification to take place at a point
in time in the future while allowing the cell to respond immediately. Although inverse
dynamics is not a part of the speech production model described in this dissertation, the
ideas of learning cerebellar inverse models using eligibility traces to account for delays in
the system are important. Such a system can be used to modulate commands from motor
cortex.

69
4.3.3 RSL model of cerebellar learning
The RSL model (Rhodes and Bullock, 2002) of the cerebellum is an adaptive timing model
derived from the spectral timing model of Fiala et al. (1996). The models share many
common features. The models receive contextual signals on the mossy fiber (MF) pathways
and teaching signals on the corresponding climbing fiber (CF) pathways. The underlying
assumption behind learning in both the models is that a properly timed response from the
deep cerebellar nuclei (DCN) in the presence of a context in the MF eliminates the CF
input. Both models deal with the nature of timing alone rather than with the combination
of timing and amplitude of responses.
Both models also hypothesize that a second messenger cascade in the dendritic spines
of the Purkinje cells (PCs) provides the required variance in timing of cerebellar responses
observed in experimental data from classical conditioning experiments. In Fiala et al.
(1996), each parallel fiber (PF) to PC synapse gives rise to a spectrum of second messenger
cascades each of which peak at a different time (Figure 4·4). In the RSL model, the duration
of the second messenger cascade is dependent on the PF to PC synaptic strength. Shifts
in the peak timing of the response are obtained by modifying this synaptic strength. This
approach is a much more “economical” alternative in that modulating the timing of the
response requires one cascade instead of relying on multiple cascades for a set of timings
and the learning process becomes simpler as described next.
A functional description of the RSL model can be accomplished with a simple cerebellar
circuit consisting of one of each type of cell (GrC, PC, DCN and IO) and connection (MF,
PF and CF) as shown in Figure 4·1 that schematizes the cerebellum. The RSL model
starts off with a large PF to PC synaptic weight that generates a temporally long cascade
in the presence of a PF signal. In this initial state the cascade does not lead to a release
of inhibition by the PC on the DCN. The lack of a response leads to an error/teaching
signal via the CF pathway. This causes long term depression (LTD) in the PF to PC
synapse leading to a decrease in the PF to PC synaptic weight. This decrease causes a
temporal “slide” of the peak of the cascade response towards the onset of the PF signal.

70
10 20 30 40 50 60 70 80 90 100Time [ms]
Figure 4·4: Timing and amplitude of multiple second messenger responses corresponding to PFto PC synaptic activation.
The presence of errors keeps causing LTD, thereby lowering the weight and causing a slide.
The timing changes up until the point when the cerebellar output is made at a “desired”
time. At this point, the system is considered to be “latched” to the appropriate timing
mechanism. This latch and hence the resulting DCN output leads the CF signal onset by
a small duration. Whether this lead is variable in nature within the same circuit or fixed
has not yet been experimentally demonstrated. While the presence of a CF signal during a
cascade causes LTD, the absence of one during the cascade causes long term potentiation
(LTP) in the synapse and thereby a loss of timing.
One characteristic of the RSL model of particular interest is that the synaptic weight
71
modification stops after a certain number of CF presentations and oscillates around that
stabilized value. This is useful in a learning scenario in which the system receives repeated
presentations of MF input and CF input. The system achieves this stability by allowing
weight modification to take place during the concurrent presence of a positive derivative
signal on the cascade output and the presence of a CF signal. The model treats the CF
input as a transient signal, thereby limiting the window in which the synaptic weight can
change. This is useful in simulations of classical conditioning paradigms.
4.4 A revised model of the cerebellum
4.4.1 Issues to address
A revised model of the cerebellum is proposed in the next section, which addresses the
issues that have been raised with respect to timing and learning in DIVA. The specific
needs of the DIVA model that the cerebellar model might be suitable for addressing are:
1. Appropriate temporal learning of feedforward commands based on feedback com-
mands
2. Timed prediction of expected sensory feedback in the sensory cortices in response to
motor output and/or premotor context.
The RSL model can be adapted to make it suitable for the two scenarios. The cere-
bellum may also be involved in other aspects of speech production such as sequencing of
syllabic units and relative timing of agonist-antagonist muscle commands, but a discussion
of these is beyond the scope of this dissertation. Very few cerebellar models have addressed
the issue of transmission delays. As discussed earlier, neuronal transmission is not instan-
taneous. It takes time for the activity to travel from the cerebellum to the motor periphery
and for sensory information to travel back to the cerebellum. In addition, inputs to the
cerebellum via the mossy fiber (MF) pathway are coming from various parts of the brain.
Due to differential lengths of the connections to the pontine nuclei, the signal could be
arriving asynchronously at the PF to PC synapse. Also, different climbing fibers (CFs)

72
coming from different parts of the body could be bringing information to the same region
of the cerebellum at different times.
Spectral timing models and the RSL model have demonstrated that the cerebellum
could be capable of learning and generating a well-timed response using a second messenger
cascade in the PC. The timing of the response depends on the timing of the IO input which
can vary from paradigm to paradigm relative to MF input. The model is therefore adaptive
in nature. At the same time these models have also eliminated the problem of asynchronous
input at the PF to PC junction. Since each synapse can be modified independently of other
synapses, a staggered input can be lined up using different spectral timing responses as
demonstrated in Figure 3.8. The extensions to the RSL model in order to provide support
for DIVA are discussed next.
4.4.2 Proposed modifications
The RSL model, being a comprehensive model of cerebellar timing, is the starting point
for the modifications. This model provides a stable platform in the sense that it has
already been used to explain different aspects of cerebellar function. For the purpose of
this dissertation, the proposed recurrent connection in the model from DCN output back
to cerebellar cortex via the mossy fibers will not be used, that is, only the “State and
Latch” aspects of the model are relevant. There are two different cerebellar options that
one could use to solve the timing issues. The data available currently do not lead to
the selection of either one of these methods. The different methods are discussed in the
following paragraphs.
Option 1: Cerebellum as a delay model
The first option requires no modification to the RSL circuit, and both the issues are resolved
simply by using the cerebellum to model the relevant delays. However, the cortical DIVA
circuit needs to be modified. The cortical modification for the feedforward part of the
circuit is shown in Figure 4·6.
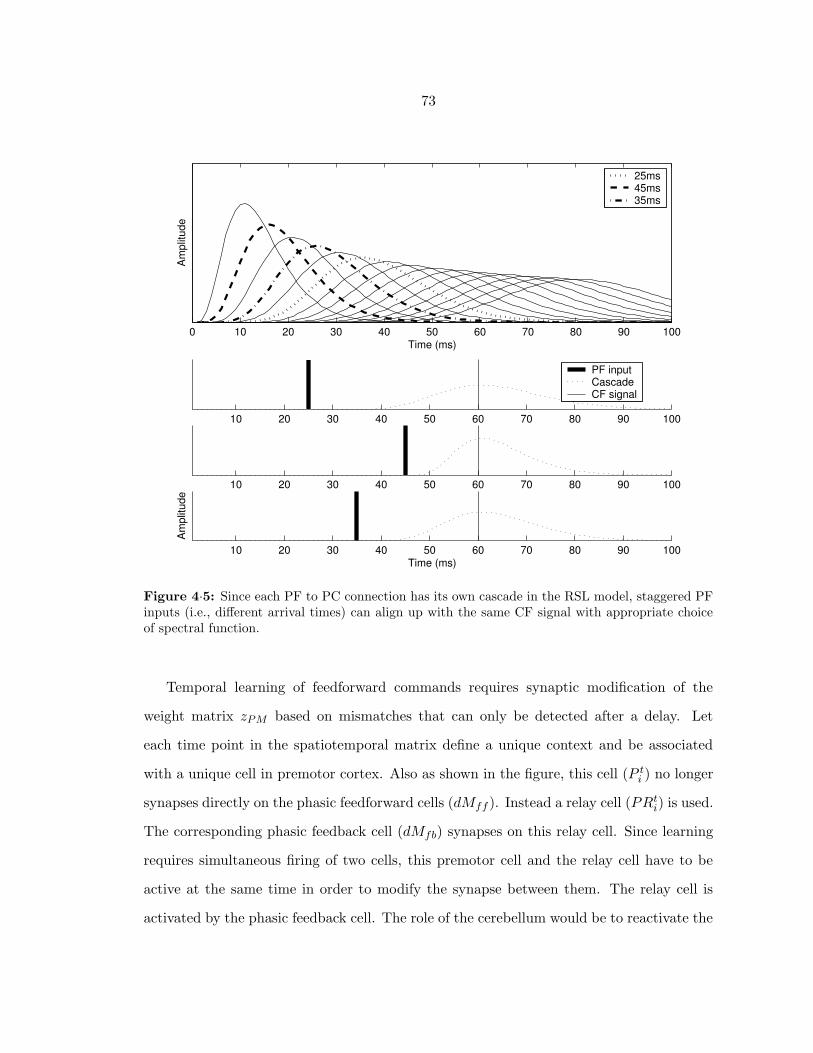
73
0 10 20 30 40 50 60 70 80 90 100
Am
plitu
de
Time (ms)
25ms45ms35ms
10 20 30 40 50 60 70 80 90 100
10 20 30 40 50 60 70 80 90 100
10 20 30 40 50 60 70 80 90 100Time (ms)
Am
plitu
de
PF inputCascadeCF signal
Figure 4·5: Since each PF to PC connection has its own cascade in the RSL model, staggered PFinputs (i.e., different arrival times) can align up with the same CF signal with appropriate choiceof spectral function.
Temporal learning of feedforward commands requires synaptic modification of the
weight matrix zPM based on mismatches that can only be detected after a delay. Let
each time point in the spatiotemporal matrix define a unique context and be associated
with a unique cell in premotor cortex. Also as shown in the figure, this cell (P ti ) no longer
synapses directly on the phasic feedforward cells (dMff ). Instead a relay cell (PRti) is used.
The corresponding phasic feedback cell (dMfb) synapses on this relay cell. Since learning
requires simultaneous firing of two cells, this premotor cell and the relay cell have to be
active at the same time in order to modify the synapse between them. The relay cell is
activated by the phasic feedback cell. The role of the cerebellum would be to reactivate the

74
Figure 4·6: Feedforward learning using the cerebellum as a delay model. The circuit for a singletime point is highlighted in black. The same connections are repeated for every single time point.The double arrows represent the modifiable feedforward weights (zPM ). Black filled circles representinhibitory interneurons. All axonal projections are excitatory except those indicated by open circles.For naming simplicity, P t
i represents a single time point in the duration of the ith speech sound.Abbreviations: CBM, Cerebellum; P t
i , single time slice of speech sound map cell; PRti, relay cell for
the corresponding Pi cell; dMff , phasic feedforward command; dMfb, phasic feedback command;M , tonic motor command.
75
premotor cell at the same time that the feedback activates the relay cell. The cerebellar
output, in addition to reactivating the premotor cortex cell, inhibits the axonal connection
from the relay cell to the phasic feedforward cell. This solution involves re-triggering the
whole spatiotemporal readout at the premotor cell except that the output of the readout
does not reach the phasic feedforward cells. However, since feedback is coming through the
feedback pathway (through dMfb), the feedforward weights can be updated.
The cerebellum needs to associate the premotor cell activity with the feedback signal,
so that the premotor cell can reactivated when the feedback arrives to the relay cell. In the
cerebellum, the climbing fiber input or the teaching signal comes from the phasic feedback
cells, the input context comes from the premotor cell and the output from the DCN goes
back to the same premotor cell completing the loop. To prevent the cerebellum from
going into an infinite reactivation sequence, DCN activity inhibits the projections from the
premotor cell to the cerebellum.
The sensory prediction circuit uses a similar mechanism but the delays in this case are
equal to the two sensory feedback circuits (the auditory feedback and the somatosensory
feedback). As discussed in the previous chapter, the purposes of the premotor to sensory
projections are to align the expectations with the appropriate sensory feedback. As with
the previous case a cerebellar delay model activates the sensory cells at an appropriate time
after the premotor cortical contextual signal, thereby aligning them temporally with the
sensor feedback commands. This is show in Figure 4·7. It is assumed in this functionality
that the baseline firing of the DCN cell in the cerebellum is sufficient to suppress the
sensory relay cell (SR1i ). The premotor cell is responsible for triggering the sensory cell
(S1i ). This in turn sends a context signal to the cerebellum, which waits for an amount of
time equal to the sensor feedback delay and fires the relay cell. The relay cell reads out
the sensory expectation and this is compared with the incoming sensory information to
generate an error signal (dS).
This option can be implemented with no change to the RSL model. The role of the
cerebellum is purely to model delays and nothing else, which is what the RSL model is best

76
Figure 4·7: Temporal alignment of sensory expectations and sensory input using the cerebellum.Outside the shaded box is the circuit from Figure 4·6. Inside the shaded box is the temporal align-ment circuit. The tonic DCN output of the cerebellum inhibits the relay cell SRt
i. However whenthe DCN fires, the cell loses its inhibition and generates the sensory expectation. As before, thedouble arrows represent the modifiable weights. Black filled circles represent inhibitory interneu-rons. All axonal projections are excitatory except those indicated by open circles. For namingsimplicity, P t
i represents a single time point in the duration of the ith speech sound. Abbreviations:CBM, Cerebellum; P t
i , single time slice of speech sound map cell; PRti, relay cell for the corre-
sponding Pi cell; dMff , phasic feedforward command; dMfb, phasic feedback command; M , tonicmotor command; St
i , sinlge time slice of sensory expectation cell; SRti, sensory expectation relay
cell; S sensory signal; dS, sensory discrepancy.

77
suited to do. The importance of the cerebellum in doing interval timing is well established
(e.g., Spencer et al. 2003). As the feedforward command is represented as a succession of
time points, a question arises as to whether repeating the same sound leads to a deadlock.
This is never going to be the case because the feedback delay (50 to 100ms) is shorter
than the duration of the fastest speaking syllable. Therefore if the same syllable were to
repeated continuously, there would not be a scenario where the weights of a time slice
are being updated from a previous utterance simultaneously with that time slice being
activated for a new utterance. The next option shows a way of implementing feedforward
learning with a modified cerebellar circuit.
Option 2: Cerebellar learning of feedback commands
The second option would be to assume that the cerebellum implements eligibility traces and
itself learns the feedback command. This option applies only to solving the learning process
of the feedforward command and cannot solve the sensory prediction issue. However, with
this solution the cerebral circuit would not require a change for learning the feedforward
command. There are three aspects of the error signal that need to be considered when
implementing such a learning scheme with the cerebellum. First, the eligibility trace has to
peak at the appropriate time close to the timing of the error signal. Second, the amplitude
of the error determines the amount of learning. The final aspect is the circuitry of this
error signal. This is shown in the left panel of Figure 4·8. The circuit is very similar to
the feedforward learning circuit discussed in the previous section. The difference is in the
connections of the cerebellum. In this case, the cerebellum gets contextual input through
the mossy fiber pathway from the P cell and a teaching signal through the climbing fiber
pathway from the phasic feedback cell. The output of the cerebellum synapses on the
premotor relay cell. Unlike the previous option one common relay cell can be used by all
the premotor time-slice cells. The right half of the figure shows a functionally equivalent
simplified form of the same circuit.
The RSL model currently is a cerebellar timing model and the rate of climbing fiber
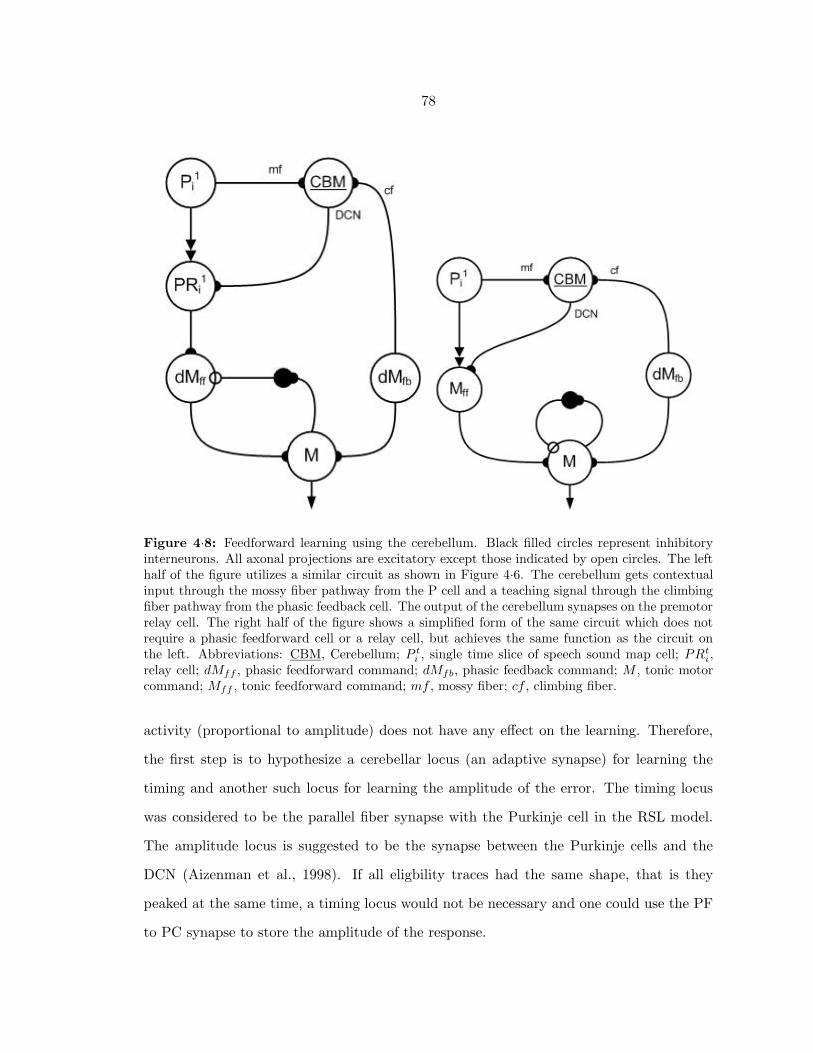
78
Figure 4·8: Feedforward learning using the cerebellum. Black filled circles represent inhibitoryinterneurons. All axonal projections are excitatory except those indicated by open circles. The lefthalf of the figure utilizes a similar circuit as shown in Figure 4·6. The cerebellum gets contextualinput through the mossy fiber pathway from the P cell and a teaching signal through the climbingfiber pathway from the phasic feedback cell. The output of the cerebellum synapses on the premotorrelay cell. The right half of the figure shows a simplified form of the same circuit which does notrequire a phasic feedforward cell or a relay cell, but achieves the same function as the circuit onthe left. Abbreviations: CBM, Cerebellum; P t
i , single time slice of speech sound map cell; PRti,
relay cell; dMff , phasic feedforward command; dMfb, phasic feedback command; M , tonic motorcommand; Mff , tonic feedforward command; mf , mossy fiber; cf , climbing fiber.
activity (proportional to amplitude) does not have any effect on the learning. Therefore,
the first step is to hypothesize a cerebellar locus (an adaptive synapse) for learning the
timing and another such locus for learning the amplitude of the error. The timing locus
was considered to be the parallel fiber synapse with the Purkinje cell in the RSL model.
The amplitude locus is suggested to be the synapse between the Purkinje cells and the
DCN (Aizenman et al., 1998). If all eligbility traces had the same shape, that is they
peaked at the same time, a timing locus would not be necessary and one could use the PF
to PC synapse to store the amplitude of the response.

79
Another modification required for the group of cells implementing this functionality
is that the Purkinje cell changes its firing rate (“activates”) as soon as the parallel fiber
contexts hit the Purkinje cells. Each time slice of the premotor command presents a
different context (as described in the previous option) to the cerebellum and is represented
in the model by different parallel fiber activity. The climbing fiber signal contains the
feedback command.
The cerebellum, in addition to learning the timing of the feedback with respect to
the context, also learns the amplitude of the feedback. The output of the cerebellum
projects to phasic feedforward cells of motor cortex and adds to the command. Since this
corticocerebellocortical loop delay is small, the premotor cortical cells can directly sample
the phasic cells in order to update the spatiotemporal weights.
4.4.3 Summary of revised model
Changes to the RSL model are only required to implement the second option. In option 2,
the PC to DCN synaptic weight update is dependent on the size of the error signal and the
PC to DCN connection fires as soon as the PF volley hits the PC. These modified models
can be used in place of the algorithmic processes in DIVA in order to solve the timing and
learning issues in the model. There are still a lot of assumptions being made about the
role of the cerebellum and further experiments will be required to answer the questions.
The following section summarizes the relevance of the cerebellum to the DIVA model.
4.5 Discussion of cerebellar contributions to DIVA
The role of cerebellum in the timing of motor commands, both speech and non-speech,
has been investigated in many studies (Hore et al., 2002; Ackermann et al., 1999a, 1998;
Penhune et al., 1998; Kent et al., 1979). It has been suggested that the lateral cerebellum
is more involved with internal timing, while the medial cerebellum is more connected to
the timing of execution (Ivry et al., 1988). It has also been suggested that the cerebellum
acts as an internal model, forward or inverse or both (Miall, 2003; Wolpert and Miall,

80
1996; Miall, 1983). Miall (2003) discussed the overlapping concepts of mirror neurons and
forward or internal models and described possible cortical and cerebellar circuits that may
implement the schemes. Prism-adaptation experiments constitute an analogous system
that necessitates a transformation from a new visual space to motor coordinates. The
cerebellum has been shown to be a necessary component for learning this transformation
(Baizer et al., 1999).
For the purpose of this dissertation, it is hypothesized that the cerebellum may con-
tribute in two different ways: as a delay model that delays signals for an appropriate
duration or triggers appropriate parts of cerebral cortex at the proper times and as a locus
for learning feedback commands. All of these contributions can be made with a cerebellar
model as described in the previous section. Whether the cerebellum is involved in trigger-
ing appropriate actions or in a combination of triggering and action modification, remains
to be determined.
The primary idea of cerebellar involvement in speech production is a result of combining
the notions of separate cerebellar roles for planning and execution (Allen and Tsukahara,
1974) and the use of cerebellar timing mechanisms as a Smith Predictor or delay model
(Miall et al., 1993). In the context of the DIVA model, there is a delay between the muscle
activation and the sensory feedback due to the activation. Information needs to be stored
for an appropriate period of time or reactivated at the appropriate time to match the
sensory delay so that error based corrections can be made. This delay is modeled using
a cerebellar timing model. While cerebellar timing has been the focus of most cerebellar
studies, the cerebellum is also an ideal structure for a predictive model. The cerebellum
can also be used as an inverse dynamic model, given the strong associations it has with
motor cortex. Since the thesis does not deal with inverse dynamics, this particular role
will not be presented, but it will be discussed briefly at the end of the thesis.
The target of the modeling component of this dissertation was to understand the pro-
duction of a single multisyllabic word with a focus on the production of a single syllable.
To understand cerebellar contributions to speech, the complex process needs to be teased
81
apart into components of planning, sequencing and coordination. A thorough discussion
of cerebellar contribution to all these different aspects of speech production is beyond the
scope of this dissertation. But, the modeling component of this dissertation has described
a neural model of speech production, highlighted the problems caused by sensory feedback
delays and suggested cerebellar function that can resolve these problems. In the second
part of the dissertation, the neural substrates of speech are explored using fMRI experi-
ments. These experiments were conducted to compare and contrast brain activity during
production of elementary phonetic units such as syllables and syllable-pairs in neurologi-
cally normal subjects and subjects diagnosed with ataxic dysarthria. Based on the results,
extensions to the model will be proposed.

Chapter 5
REVIEW OF ATAXIC DYSARTHRIA
5.1 Introduction
This chapter provides an overview of the characteristics of ataxic dysarthria, first as a
general disorder and then as a speech specific disorder. This information will be used
to discuss the role of the cerebellum in the model and in the general context of speech
production. The material in this section is largely derived from several reviews of ataxic
dysarthria (Freed, 2000; Kent et al., 2000a,b; Schulz et al., 1999; Duffy, 1995; Darley
et al., 1975). This will allow us to better understand the results from the fMRI studies
(Chapter 6) and also to further clarify the role of the cerebellum during speech production.
The chapter concludes with a discussion of how the cerebellum may play different roles at
different levels of the speech production mechanism.
5.2 Ataxic dysarthria: a review
Ataxic dysarthria is neuromuscular motor disorder that results from bilateral or general-
ized damage to the cerebellum as well as pathways leading to and from the cerebellum.
Ataxic dysarthria comprises 13.3% of motor speech disorders and 14.6% of all dysarthrias
(Duffy, 1995). Effective damage to the cerebellum can be caused by a number of different
causes. Various etiologies are listed in Table 5.2. Depending on the location of the prob-
lem, different aspects of behavior may be affected. Also as seen from the table, most of the
causes affect other aspects of the CNS in addition to the cerebellum. This makes it more
difficult to attribute a certain observed deficiency purely to the cerebellum. According to
Darley et al. (1975) localized damage to the cerebellum results in deficits of “equilibrium,
gait, unilateral limb coordination or speech,” while “generalized damage may initially affect
82

83
Etiology Percentage Examples
Degenerative 34 Autosomal dominant cerebellar ataxia of lateonset, idiopathic sporadic late onset cerebellarataxia, Friedreich’s ataxia, olivopontocerebel-lar degeneration
Vascular 16 Cerebellar stroke, cerebellar hemorrhage,blockage of cerebellar arteries
Demyelinating 15 Multiple sclerosis
Undetermined 14
Toxic/Metabolic 7 Medication, alcohol/drug abuse, prolonged vi-tamin E or B12 deficiency
Traumatic 6 Close head injury, penetrating head injury
Inflammatory 5
Tumor 3 Metastatic tumors, Low-grade astrocytoma,Hemangioblastomas
Multiple 3 Stroke+degenerative
Other 1 Depression, personality disorder
Table 5.1: Etiologies of ataxic dysarthria for 107 recorded cases at the MayoClinic from 1969-1990 (Freed, 2000).
only one cerebellar function” but eventually impairs equilibrium, gait, limb coordination
and speech. Freed (2000) described cerebellar ataxia as being synonymous with movement
deficits of timing, force, range and direction. According to Freed, cerebellar damage cre-
ates difficulty in coordinating voluntary movements, controlling the timing and force of
movement especially at initiation and termination of a movement. In addition, cerebellar
dysfunction results in broad-based gait, intention tremors, hypotonia of muscles and prob-
lems with motor learning. While cerebellar dysfunction has been shown to be associated
with a variety of cognitive problems (Schmahmann, 1997), a general discussion of cognitive
deficits is beyond the scope of this thesis.
According to Darley et al. (1975), the speech deficiencies of ataxic dysarthria can
be broadly classified into three categories: articulation inaccuracy, prosodic excess and
phonatory-prosodic insufficiency. This classification scheme has since been used in most
reviews of ataxic dysarthria. Articulation inaccuracy is primarily characterized by im-
precise consonant articulation and distorted vowels. As this imprecision can vary from
utterance to utterance, primarily in multisyllabic words, it is referred to as irregular ar-

84
ticulatory breakdown. From a prosodic perspective, ataxic dysarthria is characterized
by equal and excess stress, prolonged phonemes, prolonged intervals between phonemes,
monopitch, monoloudness and a slow rate. Although a number of these characteristics
affect the prosodic intent of speech, a distinction can be made between control of pitch
and control of timing. The final category, phonatory-prosodic insufficiency is characterized
by a harsh voice quality (possibly caused by decreased muscle tone which prevents full
contraction of the muscles), voice tremor and uncoordinated movements with respect to
respiration. This incoordination can lead to exaggerated or paradoxical movements. Exag-
gerated movements can lead to excessive loudness while paradoxical movements can limit
subglottal air available for speech which causes the person to speak on residual air, which
can lead to an increased rate of speech, decreased loudness and a harsh voice.
A discussion of all the speech specific problems of ataxic dysarthria is beyond the scope
of the dissertation. However, the problems with timing and learning are of particular
interest. The following paragraphs describe in greater detail the nature of these deficiencies
both from a general motor control perspective and from the viewpoint of speech motor
control.
5.2.1 Deficits in timing
Several studies have pointed to the role of the cerebellum in controlling timing parame-
ters (particularly duration) for motor control as well as perception. Cerebellar damage
results in various movement timing disorders. In particular there develops a difficulty with
alternating ballistic movements, delays in movement initiation, increased movement dura-
tions, reduced speed of movement, impairments in rhythmic tapping, discrimination of time
intervals and of determining the velocity of moving targets (Ivry, 1997; Ackermann and
Hertrich, 1994; Keele and Ivry, 1990; Inhoff et al., 1989; Ivry et al., 1988; Meyer-Lohmann
et al., 1977).
Specific to timing in speech production, cerebellar impairment causes increased dura-
tions of sentences, words, syllables and phonemes (Kent et al., 1997; Ackermann and Her-
85
trich, 1994; Schonle and Conrad, 1990; Hirose, 1986; Kent et al., 1979; Kent and Netsell,
1975). Kent and colleagues (Kent et al., 2001, 2000a, 1979) provide an elegant summary of
some of the characteristics of ataxic subjects. Consistent and marked abnormalities of the
normal timing pattern are observed from spectrograms. Various segments are prolonged
and syllable durations are equalized. Vowel formant structures are normal except for tran-
sitional regions suggesting a role of the cerebellum that facilitates consonant production.
Severity of dysarthria correlates with increase in lengthening of segments and the number
of lengthened segments. The changes in syllable timing are accompanied by abnormal
contours of fundamental frequency.
Other speech-timing deficits are generally classified under articulatory hypometria and
include abnormal transitions from consonants to vowels, an inability to increase speech
rate, reduced velocities, and reduced speech movement acceleration (Kent et al., 1997;
Ackermann et al., 1995; Hirose, 1986; Kent and Netsell, 1975). During rapid production
of syllable trains, dysarthric subjects show a homogeneous pattern of movement abnor-
malities, such as prolonged durations and reduced peak velocity to amplitude ratios as
measured with electromagnetic articulography (Jaeger et al., 2000). Ataxic dysarthrics
also show abnormal voice onset time (VOT), increased variability of segment durations,
equalized syllabic durations (Ackermann and Hertrich, 1994; Gentil, 1990b,a; Kent et al.,
1979). Perceptually, they are unable to identify synthetically manipulated German min-
imal pairs differing exclusively in the length of a word-medial stop consonant occlusion
(“Boten” /bot:n/ versus “Boden” /bod:n/; Ackermann et al., 1997). Ataxic dysarthric
subjects preserve vowel length distinctions, but not voicing onset time (VOT), similar to
apraxics and Broca’s aphasics (Ackermann et al., 1999a,b; Ackermann and Hertrich, 1997).
The authors suggested that anterior perisylvian language zones and the cerebellum cooper-
ate with respect to speech timing. Patients with cerebellar atrophy or cerebellar ischemia
showed a reduced categorical separation of the VOT of voiced and unvoiced stops conso-
nants, and vowel length distinctions were only seen as the complexity of the underlying
articulatory pattern increased.

86
Not all temporal aspects of motor control are affected. Reduction in initial limb move-
ment and utterance segment duration was observed in individuals with cerebellar damage
as more segments were added to the movement (Inhoff et al., 1989; Kent et al., 1979). This
behavior was similar to that of control subjects. VOT and tense vowel durations did not
show as much lengthening as other aspects of speech (Kent et al., 1997; Kent and Net-
sell, 1975). An acoustic study revealed that timing dysfunction affected longer utterances
more than short words (Kent et al., 1997). Ziegler and Wessel (1996) show that cerebellar
patients have slower syllable repetition rates but sentence production has normal syllabic
rates suggesting a different scheme of motor control for the two tasks.
5.2.2 Deficits in motor learning
Motor skill learning may be defined objectively in terms of psychophysical measurements
related to increasing speed and accuracy, reducing amplitude and increasing repeatability
or consistency of movements (Nagasaki, 1989; Moore and Marteniuk, 1986; MacKay and
Bankhead, 1983). Increasing speed as a result of learning has been seen across a variety of
movements such as throwing, typewriting and handwriting (Zesiger et al., 1993; Hamstra-
Bletz and Blote, 1990; Moore and Marteniuk, 1986; Normand et al., 1982; Vorro and
Hobart, 1981b,a; Hobart et al., 1975). Handwriting (Zesiger et al., 1993; Hamstra-Bletz
and Blote, 1990; Portier et al., 1990; Meulenbroek and van Galen, 1988) and typewriting
(Gordon et al., 1994; Salthouse, 1986b) tasks demonstrate a reduction in amplitude as a
result of learning and practice. This follows an economy of effort principle, where moving
a shorter distance (lower amplitude) requires less effort. Consistency of movements or
repeatability as measured by a reduction in variability has been shown in a number of
studies (van Galen and Morasso, 1998; Zesiger et al., 1993; Hamstra-Bletz and Blote, 1990;
Moore and Marteniuk, 1986; Salthouse, 1986a; Hobart et al., 1975). Several studies have
investigated variability of speech articulators and have demonstrated increases in movement
speed and reductions in variability with increasing age (Smith, 1995; Smith and Kenney,
1994; Smith, 1992; Smith and McLean-Muse, 1986; Sharkey and Folkins, 1985; Smith and

87
Gartenberg, 1984).
Cerebellar involvement in motor learning has primarily been derived from studies of
classical conditioning (see Attwell et al. 2002, for a review). As discussed in Chapter 4,
deficits in the acquisition, learning, and relearning of classically conditioned responses has
been demonstrated in both animals and humans with cerebellar lesions (Dimitrova et al.,
2002; Topka et al., 1993; Daum et al., 1993; Welsh and Harvey, 1989; Yeo et al., 1985, 1984).
Several types of motor skill learning are dependent on a functional cerebellum (Sanes et al.,
1990; Albus, 1971; Marr, 1969). fMRI and PET studies show that the cerebellum is active
during motor learning including a verbal learning task and that the cerebellum is more
involved in the learning part of motor skill acquisition as compared to the execution of it
(Raichle et al., 1994; Jenkins and Frackowiak, 1993; Friston et al., 1992; Grafton et al.,
1992; Roland et al., 1989). However, the nature of cerebellar involvement is dependent on
the type of motor skill being acquired. As reported by Seidler et al. (2002), in a sequence
learning task the cerebellum is more active during the execution phase compared to the
learning phase. Although the cerebellar role in speech motor learning and control is still
unclear, it can be hypothesized that cerebellar damage is likely to affect speech at different
levels depending on the pathology.
5.2.3 Acoustic analysis of dysarthric speech: some examples
Kent et al. (2000a) contains an extensive review of the acoustic characteristics of ataxic
dysarthric speech. The purpose of the following figure is to highlight some of the timing and
vocal characteristics described in the previous paragraphs. The figure shows comparisons
of acoustic characteristics between a subject diagnosed with ataxic dysarthria and a normal
speaker. These waveforms and spectrograms were generated from a video in a book by
Freed (2000). The spectrograms were generated with Praat (Boersma and Weenink, 2004).
As can be seen from the figure, the primary problem seems to be that of timing and
duration control. In the first example the subject was asked to repeat the three-syllable
word ’pataka’ as fast as possible. Despite the intention, the total duration of the ataxic

88
Figure 5·1: Acoustic comparison of a normal speaker and a dysarthric speaker. In the top half acomparison is shown between a normal speaker on the left and a dysarthric speaker on the rightsaying ’pataka.’ In this comparison, a spectrogram of the utterance is shown below each wavesegment. The dark bands correspond to the resonances of the vocal tract. The energy contourof the wave is plotted in yellow on the spectrogram. The bottom half shows a similar plot withthe normal speaker on the left of the dashed line and the dysarthric speaker on the right saying’tornado.’
dysarthric speaker is nearly twice that of the normal speaker and the duration for each
syllable seems to be equalized. The rapidity of a normal transition, as seen from the normal
speaker’s utterance on the left, from one syllable to the next appears to be hampered. A
similar effect of timing is seen in the second utterance ’tornado.’ As can be seen from the

89
yellow line in the figures, the peak energy output appears to be similar between the two
speakers. While these observations can be made in this multisyllabic utterances, such a
distinction might be lost in comparison of single syllable utterances. Only duration, may
show up as a significant difference.
The cerebellar focus of this thesis has been to understand the role of the cerebellum
in the production of elementary units of speech. It is likely that at this simplest level of
production, there is not much behavioral difference between normal subjects and ataxic
dysarthrics. However as the fMRI studies in the next chapter demonstrate there is a
deviation in brain activation from the pattern observed in normal subjects.
Chapter 6
FMRI STUDIES OF SPEECH PRODUCTION
6.1 Introduction
This chapter presents the results of the fMRI experiments investigating speech produc-
tion. Two different subject populations (neurologically normal individuals and individuals
with ataxic dysarthria) were investigated using very similar experiments. The experiments
were aimed at examining brain responses during speech production of simple phonetic ele-
ments (e.g. vowels /a/ and syllables /ba/) and in particular cerebellar responses in normal
subjects. Several hypotheses were proposed.
The chapter begins with a review of the hypotheses and then proceeds with a discussion
of the data acquisition paradigm and data analysis methods. The details of the experiments
and results of statistical analysis are provided next. The chapter ends with an interpretation
of the results from the perspective of the DIVA model and a review of the hypotheses.
6.2 Review of hypotheses
It was hypothesized that removal of the cerebellar input to cerebral cortex would, among
other things, reduce the total amount of input to primary motor cortex and thereby reduce
motor cortex activity. This would provide an account of why the speech movements of
cerebellar dysarthrics are slow compared to normal speakers.
Another hypothesis was that the cerebellum would be more active during consonant
production compared to vowel production in normal subjects because consonants require
stricter timing. Different consonants have differing timing requirements. For example,
stop consonants (e.g. /g/,/k/) differ in their voicing onset time. It has also been shown
that consonant durations (as measured by transition from a consonant to the following
90

91
phoneme) are significantly less variable than vowel durations.
6.3 Data acquisition and analysis
6.3.1 Data acquisition
The experiments use fMRI to measure BOLD (Blood Oxygenation Level Dependent) sig-
nals (Belliveau et al., 1992) subsequent to speech production. The observed fMRI activity
serves as a correlated measure of the amount of neural activity taking place during speech
production. This technique provides a noninvasive method for producing statistical maps
of brain activity in response to behavior. These maps can then be used to compare activa-
tion of different areas of the brain while the subject performs a task. Typically, looking at
changes in activation during an experimental task compared to a carefully chosen control
task allows the comparison.
A modified event-related paradigm (Engelien et al., 2002; Le et al., 2001; MacSweeney
et al., 2000) was used as opposed to a block design. The paradigm consists of triggering
the scanner to acquire two whole-head image volumes (e.g., two) after each production
as shown in Figure 6·1. Thus acquisition takes place only after the subject has finished
uttering the presented stimulus. The primary advantage of using this modification is to
minimize the susceptibility artifact caused by changes in the air cavity of the mouth. A
second advantage is that of reducing scanner noise artifacts (Amaro Jr et al., 2002). The
BOLD signal takes 5-6s to reach its maximum (Engelien et al., 2002; Amaro Jr et al.,
2002). By collecting data around this period of time, and only for a short while, the
changes caused by the activation of auditory cortex due to scanner noise are not recorded.
Therefore, any activation of the auditory cortex and its surrounding areas to the subjects’
own vocalizations can be seen in the results. The final advantage of the design is in reducing
the predictability of the stimuli, which in turn reduces or eliminates priming effects. As
opposed to a block design, the subjects are not aware of any specific category of stimuli
other than the general nature of the stimuli.

92
Figure 6·1: Event-triggered paradigm. The stimulus presentation and fMRI volume acquisitiontimeline is shown in the figure. Each trial (and acquisition) consists of presenting the stimulus,waiting for a short period of time for the hemodynamic response (shown in white) to increaseand then acquiring a small number of whole-head images (in this case 2) around the peak of theresponse.
6.3.2 Data analysis
Results averaged across subjects were first evaluated in Matlab using the Statistical Para-
metric Mapping (SPM) toolbox (Friston et al., 2002). Such averaging, however, is not
optimal for analysis. This is because there is a significant amount of anatomical variability
across subjects (Nieto-Castanon et al., 2003). Detailed and more accurate analysis was
performed using region of interest (ROI) masks for areas of the brain that are consid-
ered crucial for the task. This was done using a modified version of the SPM toolbox for
Matlab. These modifications have been made to add functionality and a higher degree of
specificity to SPM in an attempt to allow averaging data across subjects. For this purpose,
an SPM-compatible Matlab toolbox for segmentation and parcellation of MR images has
been developed. The structural MR image for each subject was individually segmented and
parcellated into smaller brain regions according to a procedure described in Tourville and

93
Guenther (2003). The cortical parcellation was performed automatically on the brain using
FreeSurfer (Fischl et al., 2004; Dale et al., 1999; Fischl et al., 1999) and the cerebellum
was manually parcellated. The parcellated cortical surface was then converted to a volume
mask and combined with the cerebellar mask for conducting ROI analysis. These ROIs
were then used for functional analysis with the toolbox. The entire process is schematized
in Figure 6·2.
Figure 6·2: Data processing stream for fMRI data analysis. The data acquired from the scanneris converted to Analyze format and preprocessed (realignment, coregistration, normalization andsmoothing) using SPM. Two pipelines are started in the normalization process, one involving full(nonlinear) normalization and another involving affine normalization. The full normalized imagesare then used for fixed effects and random effects analysis using SPM. The affine normalized imagesare masked with ROI masks generated using ASAP or FreeSurfer and analyzed separately usingan ROI analysis toolbox. The results from each stream are then compared to ensure consistencybetween the two methods for the major contrasts (e.g., sound vs silence).
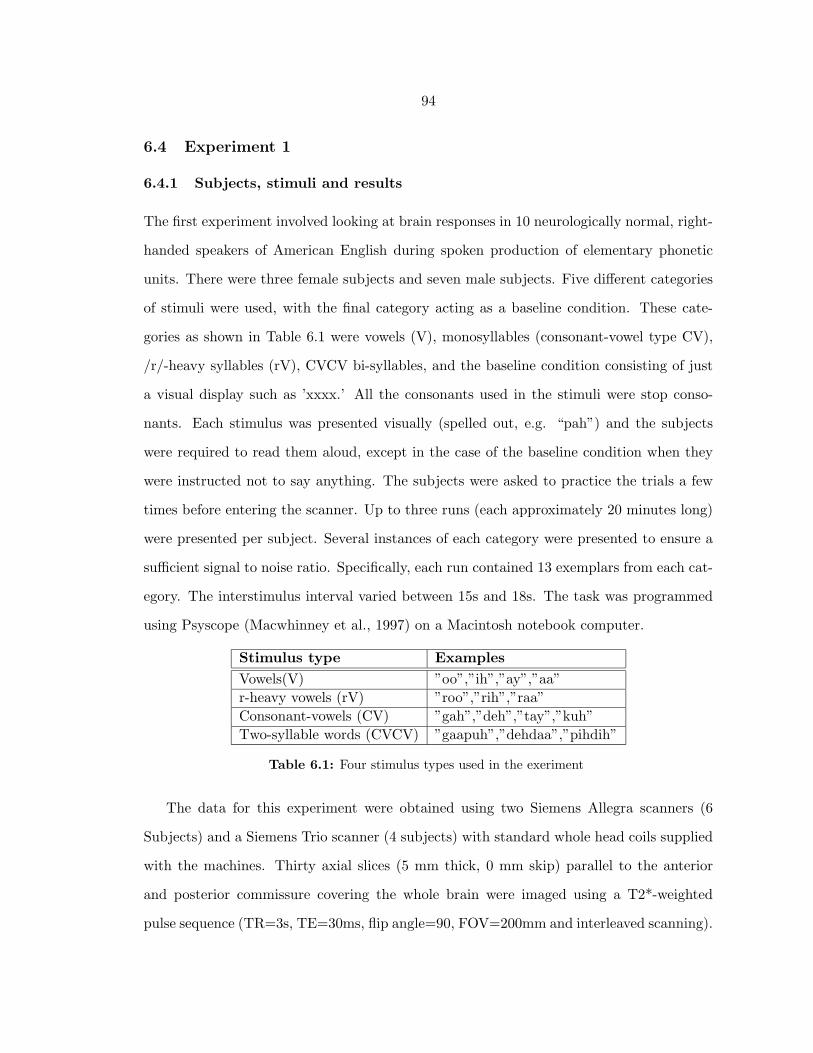
94
6.4 Experiment 1
6.4.1 Subjects, stimuli and results
The first experiment involved looking at brain responses in 10 neurologically normal, right-
handed speakers of American English during spoken production of elementary phonetic
units. There were three female subjects and seven male subjects. Five different categories
of stimuli were used, with the final category acting as a baseline condition. These cate-
gories as shown in Table 6.1 were vowels (V), monosyllables (consonant-vowel type CV),
/r/-heavy syllables (rV), CVCV bi-syllables, and the baseline condition consisting of just
a visual display such as ’xxxx.’ All the consonants used in the stimuli were stop conso-
nants. Each stimulus was presented visually (spelled out, e.g. “pah”) and the subjects
were required to read them aloud, except in the case of the baseline condition when they
were instructed not to say anything. The subjects were asked to practice the trials a few
times before entering the scanner. Up to three runs (each approximately 20 minutes long)
were presented per subject. Several instances of each category were presented to ensure a
sufficient signal to noise ratio. Specifically, each run contained 13 exemplars from each cat-
egory. The interstimulus interval varied between 15s and 18s. The task was programmed
using Psyscope (Macwhinney et al., 1997) on a Macintosh notebook computer.
Stimulus type Examples
Vowels(V) ”oo”,”ih”,”ay”,”aa”
r-heavy vowels (rV) ”roo”,”rih”,”raa”
Consonant-vowels (CV) ”gah”,”deh”,”tay”,”kuh”
Two-syllable words (CVCV) ”gaapuh”,”dehdaa”,”pihdih”
Table 6.1: Four stimulus types used in the exeriment
The data for this experiment were obtained using two Siemens Allegra scanners (6
Subjects) and a Siemens Trio scanner (4 subjects) with standard whole head coils supplied
with the machines. Thirty axial slices (5 mm thick, 0 mm skip) parallel to the anterior
and posterior commissure covering the whole brain were imaged using a T2*-weighted
pulse sequence (TR=3s, TE=30ms, flip angle=90, FOV=200mm and interleaved scanning).

95
The images were reconstructed as a 64 x 64 x 30 matrix with a spatial resolution of
3.1x3.1x5 mm. To aid in the localization of functional data and for generating regions
of interest (ROIs), a high-resolution T1-weighted 3D MRI volume was collected with the
following parameters: TR=6.6ms, TE=2.9ms, flip angle=8, 128 slices in sagittal place,
FOV=256mm. The images were reconstructed as a 256 x 256 x 128 matrix with a 1
x 1 x 1.33 mm spatial resolution. The data from each subject were corrected for head
movement, coregistered with the high-resolution structural image, and normalized to MNI
space. Fixed and random effects analyses were performed on the data using the SPM
toolbox (version 2) and the ROI toolbox. The complete results from the experiment are
provided in Appendix E.
6.4.2 Results
There were 3 main contrasts of interest. The first was a comparison of all areas involved in
speech production when compared to baseline. This contrast is of general interest in iden-
tifying regions of the brain involved in speech production, so that the subtle comparisons
can be made within this list of regions instead of looking at the entire brain. The second
was a comparison of /CV/ and /V/ condition. This compares consonants, which have
strict timing requirements, to vowels. The final contrast was a comparison of the /CVCV/
condition with the /CV/ condition. This compares simple sequencing (of non-repeated
items) /CVCV/ with a single element sequence /CV/. The /rV/ condition did not show
any interesting difference with the /CV/ or /V/ condition and hence is not presented here.
Tables 6.2, 6.3 and 6.4 show the results of these comparisons. The data for the tables
were generated using the Automatic Anatomical Labeling atlas (Tzourio-Mazoyer et al.,
2002). The results were thresholded (listed in the table) and the significant voxels were
then classified and labeled by the atlas.
In order to provide a common coordinate system for reporting activations, most fMRI
analysis software packages convert the data from the subjects’ own coordinate space to
a normalized space. Brains differ significantly in the precise location of sulci and gyri.

96
Regions Peak MNI Coordinates T-values
Caudate L -14 0 16 9.72531
Cerebellum 6 L -16 -64 -20 12.7343
Cerebellum 6 R 16 -64 -22 15.7998
Cerebellum Crus1 L -46 -60 -24 9.29318
Frontal Inf Tri L -48 36 14 8.99106
Frontal Sup Medial L 0 18 40 10.9709
Parietal Inf L -46 -48 58 9.41521
Postcentral L -50 -10 36 29.3207
Postcentral R 60 -4 26 21.3276
Precentral L -34 -6 68 9.50313
Precentral R 50 -8 38 23.512
Putamen L -26 -2 -4 11.2712
Putamen R 30 -2 -6 9.26283
Rolandic Oper L -36 4 14 9.80629
Rolandic Oper R 42 -26 16 10.1295
Supp Motor Area L 0 6 62 16.872
Temporal Sup L -54 -40 14 9.32728
Temporal Sup R 64 -26 2 14.5811
Thalamus L -10 -16 10 13.2471
Thalamus R 12 -14 8 10.297
Vermis 4 5 0 -48 4 9.29856
Vermis 6 -2 -66 -14 9.51267
Table 6.2: Brain areas and coordinates of peak activation during a comparisonof speaking compared to baseline. The data was thresholded using a family-wiseerror (FWE) correction level of p < 1e−10
Programs such as SPM, among others, which perform voxel intensity based normalization
without attention to the geometry of the brain are unable to address these subject specific
features and therefore create a smeared picture of the brain activity during each task (see
Nieto-Castanon et al. 2003 for a demonstration of the problem). In order to better un-
derstand the differential contributions of neighboring regions to the task and differential
activity between tasks, the data were further analyzed using ROI-based methods. Fig-
ures 6·3 and 6·4 shows a comparison between the SPM results and the ROI results for each
of the contrasts being considered.
ROI analysis of the speech compared to baseline contrast revealed (p < 0.0001 region
level) bilateral activity in FO, Hg, PP, PT, aCO, aIns, aSMA, amCB, IFo, pCO, pSMA,

97
Figure 6·3: Comparison of SPM and ROI analysis results in normal subjects during speaking withbaseline. The left panel shows the SPM results while the right panel shows the ROI results.
Figure 6·4: Comparison of SPM and ROI analysis results during production of multisyllable wordswhen compared to single syllable words in normal subjects. The left panel shows the SPM resultswhile the right panel shows the ROI results.
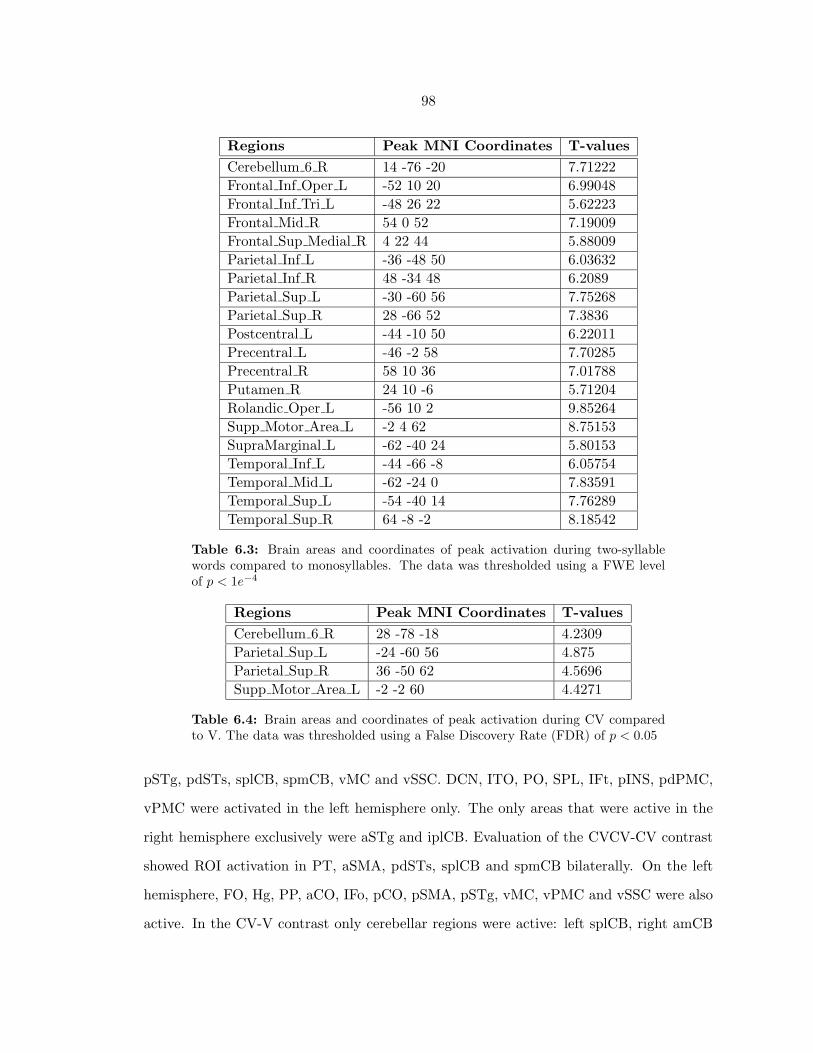
98
Regions Peak MNI Coordinates T-values
Cerebellum 6 R 14 -76 -20 7.71222
Frontal Inf Oper L -52 10 20 6.99048
Frontal Inf Tri L -48 26 22 5.62223
Frontal Mid R 54 0 52 7.19009
Frontal Sup Medial R 4 22 44 5.88009
Parietal Inf L -36 -48 50 6.03632
Parietal Inf R 48 -34 48 6.2089
Parietal Sup L -30 -60 56 7.75268
Parietal Sup R 28 -66 52 7.3836
Postcentral L -44 -10 50 6.22011
Precentral L -46 -2 58 7.70285
Precentral R 58 10 36 7.01788
Putamen R 24 10 -6 5.71204
Rolandic Oper L -56 10 2 9.85264
Supp Motor Area L -2 4 62 8.75153
SupraMarginal L -62 -40 24 5.80153
Temporal Inf L -44 -66 -8 6.05754
Temporal Mid L -62 -24 0 7.83591
Temporal Sup L -54 -40 14 7.76289
Temporal Sup R 64 -8 -2 8.18542
Table 6.3: Brain areas and coordinates of peak activation during two-syllablewords compared to monosyllables. The data was thresholded using a FWE levelof p < 1e−4
Regions Peak MNI Coordinates T-values
Cerebellum 6 R 28 -78 -18 4.2309
Parietal Sup L -24 -60 56 4.875
Parietal Sup R 36 -50 62 4.5696
Supp Motor Area L -2 -2 60 4.4271
Table 6.4: Brain areas and coordinates of peak activation during CV comparedto V. The data was thresholded using a False Discovery Rate (FDR) of p < 0.05
pSTg, pdSTs, splCB, spmCB, vMC and vSSC. DCN, ITO, PO, SPL, IFt, pINS, pdPMC,
vPMC were activated in the left hemisphere only. The only areas that were active in the
right hemisphere exclusively were aSTg and iplCB. Evaluation of the CVCV-CV contrast
showed ROI activation in PT, aSMA, pdSTs, splCB and spmCB bilaterally. On the left
hemisphere, FO, Hg, PP, aCO, IFo, pCO, pSMA, pSTg, vMC, vPMC and vSSC were also
active. In the CV-V contrast only cerebellar regions were active: left splCB, right amCB

99
and right splCB. ROI results for all major contrasts are shown in Appendix E.
6.5 Experiment 2
6.5.1 Subjects, Stimuli and Results
The second experiment involved looking at brain responses in speakers of American En-
glish diagnosed with ataxic dysarthria during spoken production of elementary phonetic
units. The subject population was chosen in consultation with Dr. Jeremy Schmahmann,
Director of the Ataxia Unit at Massachusetts General Hospital, Boston, USA. Six differ-
ent categories of stimuli were used, with the final category acting as a baseline condition.
These categories were vowels (V), monosyllables (consonant-vowel type CV), /r/-heavy
syllables (rV), CVCV bi-syllables, yV syllables (e.g. yee, yah) and the baseline condition
consisting of just a visual display such as ’xxxx’ as before. All the consonants used in
the stimuli were stop consonants and as with the previous experiment each stimulus was
presented visually and the subjects were required to read them aloud, except in the case
of the baseline condition when they were instructed not to say anything. The subjects
were asked to practice the trials a few times before entering the scanner. Upto five runs
(each approximately 10 minutes long) were presented per subject. Several instances of
each category were presented to ensure a sufficient signal to noise ratio. Specifically, each
run contained 8 exemplars from each category. The interstimulus interval was 10s. As be-
fore, the task was programmed using Psyscope (Macwhinney et al., 1997) on a Macintosh
notebook computer.
The data for this experiment were obtained using a Siemens Trio scanner (4 subjects)
with a standard whole head coil supplied with the machine. Thirty two axial slices (5 mm
thick, 0 mm skip) parallel to the anterior and posterior commissure covering the whole brain
were imaged using a T2*-weighted gradient echo pulse sequence (TR=2.25s, TE=30ms, flip
angle=90, FOV=200mm and interleaved scanning). The images were reconstructed as a
64 x 64 x 32 matrix with a spatial resolution of 3.1x3.1x5 mm. To aid in the localization of
functional data and for generating regions of interest (ROIs), a high-resolution T1-weighted

100
3D MRI image was collected with the following parameters: TR=6.6ms, TE=2.9ms, flip
angle=8, 128 slices in sagittal place, FOV=256mm. The images were reconstructed as a
256 x 256 x 128 matrix with a 1 x 1 x 1.33 mm spatial resolution. In addition to collecting
BOLD data, acoustic speech data from each subject for each stimulus were also recorded.
The data from each subject were corrected for head movement, coregistered with the high-
resolution structural image and normalized to MNI space. The data were then analyzed
using the SPM toolbox (version 2) and the ROI toolbox. Since the number of subjects
was small, the data were analyzed using fixed effects analysis. The following figure shows
a comparison of ataxic dysarthics and normal subjects. As can be seen from the figure,
the cerebellar hemispheres of the three ataxic dysarthrics on the left are severely atrophied
compared to the two neurologically normal subjects on the right.
Figure 6·5: Examples of cerebellar atrophy in ataxic dysarthrics. T1 weighted structural scansof three subjects diagnosed with ataxic dysarthria are shown on the left. The scans of two normalsubjects are shown on the right. The T1 images were affine normalized using SPM and the samecorresponding planes (y = 46,49,52) are shown for each of the 5 subjects.

101
6.5.2 Results from standard and ROI analysis
The standard analysis was able to show differences in brain activity during speaking com-
pared to the baseline visual task. However, the standard analysis did not show any differ-
ence between the different speaking conditions. This is likely due to the small number of
subjects in the group. Tables 6.5 and 6.6 show the results from the comparison of speaking
against baseline for two different thresholds the FWE being more conservative than the
FDR.
Region MNI Coordinates T-value
Postcentral L -56 -4 26 8.6607
Postcentral R 66 -16 16 6.0365
Precentral L -50 -2 52 6.7454
Precentral R 44 -14 66 5.3748
Rolandic Oper R 66 -8 12 8.312
Supp Motor Area L -2 10 74 6.5366
Supp Motor Area R 6 0 62 5.1842
SupraMarginal L -52 -26 14 5.3286
Temporal Inf L -52 -52 -20 4.9894
Temporal Pole Sup L -36 6 -20 5.0138
Temporal Sup L -62 -4 6 6.8
Temporal Sup R 60 -10 -4 5.078
Table 6.5: Brain areas and coordinates of peak activation during speaking in theataxic dysarthric group. The data was thresholded using a FWE level of p < 0.05
The ROI analysis showed a few more differences. In the comparison of speech produc-
tion with baseline, bilateral activation of Hg, PO, PT, aINS, aSMA, pCO, pINS, vMC and
vPMC was observed. Left hemisphere only activity was seen in FO, dMC, IFo, pSTg and
vSSC. Right hemisphere only activity was observed in PP, aCO, aSTg and pdSTs. Com-
parison of CV with V revealed activity in left PP, left vMC, right pCO and right vMC.
A comparison of CVCV and CV revealed increased activity only in left aSTg. Results for
other conditions are shown in Appendix E.

102
Region MNI Coordinates T-value
Calcarine L 2 -82 6 3.8238
Frontal Inf Tri L -46 18 2 3.5443
Fusiform L -38 -58 -18 3.5179
Heschl R 46 -18 4 3.5082
Insula R 48 12 -10 3.4054
Pallidum L -20 4 2 4.4103
Paracentral Lobule L -8 -28 78 3.8747
Postcentral L -56 -4 26 8.6607
Postcentral R 66 -16 16 6.0365
Precentral L -50 -2 52 6.7454
Putamen L -26 -2 -4 3.7395
Putamen R 22 8 2 4.6224
Rolandic Oper R 66 -8 12 8.312
Supp Motor Area L -2 10 74 6.5366
Supp Motor Area R 6 0 62 5.1842
SupraMarginal L -48 -42 30 5.0077
SupraMarginal L -52 -36 24 5.2164
Temporal Inf L -52 -52 -20 4.9894
Temporal Inf R 50 -62 -14 3.4666
Temporal Pole Mid L -40 8 -32 3.7608
Temporal Pole Sup L -36 6 -20 5.0138
Temporal Pole Sup R 58 8 0 3.7734
Temporal Sup L -62 -4 6 6.8
Vermis 6 2 -76 -10 3.8532
Table 6.6: Brain areas and coordinates of peak activation during speaking in theataxic dysarthric group with a different threshold (FDR of p < 0.05)
6.6 Interpretations of the results using the DIVA model
The experiments discussed in the previous sections were designed to test various hypotheses
generated by the DIVA model. In addition to testing these hypotheses, the results from
the experiments also formed an exploratory dataset that helps to identify the brain areas
involved in elementary speech production without linguistic influences. In this section,
the results from the experiments are discussed with respect to the model. The section
concludes with a discussion of potential enhancements to the model based on these results.
The model components currently include premotor cortex (BA 6,44), primary motor
cortex (BA 4), somatosensory cortex (BA 1,2,3), supramarginal gyrus (BA 40), primary

103
Figure 6·6: Comparison of SPM and ROI analysis results from the ataxic dysarthria group showingactive regions for speaking compared to baseline.
auditory cortex (BA 41,42), higher-order auditory cortex (BA 22) and the cerebellum. All
these regions except for the supramarginal gyrus (somatosensory error region) were shown
to be active during speaking when compared to the baseline condition. The following
paragraphs will discuss the relevance of these regions to the different stages (programming,
sequencing and coordination) of speech production. These stages are often used in descrip-
tions of skilled motor control, but as Kent et al. (2000b) have pointed out, they are often
not defined precisely and hence have different meanings across publications. For the sake
of consistency and the appropriateness to the current study, their definitions of these terms
are repeated here.
“Programming is a plan [sic] for a motor action (generally a learned, skilledresponse). Although some notions of programming deny any role of feedback,it seems more appropriate to include both motor and sensory components inthe construction of programs. Sequencing refers to the order of succession, as

104
in the case of phonetic segments, movements, or muscle contractions. [ ...] Co-ordination refers to the processes of adjustment by which separate componentsof action are unified in a common motor objective. An implication of thesedefinitions is that programming does not necessarily specify all aspects of se-quencing or coordination. For example, programming may pertain to higherlevels of motor organization, and some details of sequencing or coordinationmay be accomplished separately by lower levels of control. (pp. 286-287)”
The following paragraphs will discuss prominent regions observed in the results of
the experiments, one at time. For each region, the general framework of the following
paragraphs will be, first, to briefly review suggested and observed functional properties of
the region and then, to reiterate the role of the region as hypothesized in the model (if
present). Salient results from the studies will be stated and the normal subject results will
be compared with the results from the ataxic dysarthrics (referred to as the AD group).
The discussion for each region will conclude with a short discussion that may include a
redefinition of the hypothesized role if necessary.
6.6.1 Motor cortex: (BA 4, vMC)
Activity in motor cortex has been observed bilaterally in all word production tasks requir-
ing overt output (minimally movement of articulators without vocalization and maximally
movement with vocalization) (Riecker et al., 2000a; Wise et al., 1999; Wildgruber et al.,
1996) and so motor cortex is considered an essential region for speech production. Small
unilateral lesions can cause temporary impairment while large unilateral and bilateral le-
sions generally cause mutism. There have been reports in the literature (Decety, 1996;
Rao et al., 1993; Lebedev and Nelson, 1995) about the non-involvement of motor cortex
in the absence of behavioral output. However, there seems to be increasing evidence that
suggests that motor cortex is active during a preparatory phase of the movement (Krams
et al., 1998), covert speech and singing (not generating muscle commands; Riecker et al.
2000a) or during motor imagery (Porro et al., 1996). Modulation of motor cortex excitabil-
ity has also been shown using TMS during speech perception tasks (Watkins et al., 2003;
Fadiga et al., 2002) and in monkeys during planning of arm movement (Georgopoulos et al.,

105
1989).
In the model, the motor cortex is the place where feedforward and corrective feed-
back commands are combined. The motor cortex receives input from the premotor cortex
(feedforward command), the cerebellum (feedforward and possibly feedback commands)
and higher order sensory areas (feedback commands). Motor cortical cells in the model
correspond to tonic and phasic cells driving various muscles through their corresponding
motor neurons.
Ventral motor cortex (BA4) is a region that shows the largest signal change while
speaking and this is consistent across the various stimuli. There is no significant difference
(p < 0.05 at the region/cluster level) in activity among the V, CV and rV conditions in
motor cortex. The percentage change in activation in the left motor cortex is roughly 1.5
times that in the right motor cortex. However, in the AD group data, the activation in
left motor cortex is approximately 2.4 times that in the right motor cortex. Relative to
other motor regions, the motor cortex is more active in the AD group than in the normal
subjects. The activity is roughly similar for left hemisphere in both subject groups, but it
is weaker for the AD group in the right hemisphere. The weaker right hemisphere activity
may be due to a lower input level from the cerebellum or lack of modulation by the DCN
cells or competition between hemispheres. In the V-CV contrast, the left and right motor
cortices are seen to be less active in the V condition than in the CV condition for the AD
group, but this was not the case with the normal subjects who showed similar involvement
of motor cortex across the V and CV conditions. This difference might exist because the
cerebellum was involved in generating additional activity in motor cortex to maintain the
timing for the rapid transitions required in consonant production (as seen in the results
for normal subjects) but is no longer available to perform that task in the AD group.
Hence the motor cortex is showing increased activity relative to the other motor regions
in the AD group. It could also be the case that the productions are giving rise to sensory
errors that are sending feedback correction signals to motor cortex, thereby increasing the
activity. Since the absolute level of activity is comparable between the normal group and

106
the AD group and the relative level is higher for the AD group, one possibility is that the
cerebellum does not send much of its output to motor cortex but possibly to the premotor
regions.
Thus the activity of the motor cortex is primarily geared towards execution of the ar-
ticulatory plan generated by other areas although it may also be involved in the generation
of that plan. One would expect to see greater motor cortical activity during a longer utter-
ance than for a shorter utterance. The motor cortex has strong connections with vPMC,
cerebellum and the basal ganglia. These connections help modulate the output of motor
cortex. Observed preparatory activity in motor cortex could reflect an interaction between
motor cortex and the planning areas. It could represent the calculation of the feedforward
command in motor cortex itself or the transfer of positional information from motor to the
planning areas (currently premotor cortex) to enable determination of the phasic muscle
activity. This would also provide a mechanism for internal speech rehearsal without motor
muscle output.
6.6.2 Ventral Premotor cortex (BA 6, vPMC)
The ventrolateral premotor cortex (BA6) has been implicated as being important for speech
primarily by invasive intracranial recordings (Duffau et al., 2003), and by studies involving
non-invasive methods such as fMRI and PET (Heim et al., 2003; Okada et al., 2003; Riecker
et al., 2000b). Didic et al. (1998) suggested that the gradual deterioration of ventral
premotor cortex results in progressive loss of speech through phonetic disintegration. This
region has also been suggested to be part of the “mirror neuron” system (di Pellegrino
et al., 1992). As described earlier, mirror systems in the brain are typically thought of as
linking action perception and action production. It has been suggested that this region with
neural control of orofacial structures could therefore be a substrate for speech development
(Rizzolatti and Arbib, 1998). There also appears to be a sensory somatotopic organization
in premotor cortex in relation to various sensory modalities (Schubotz et al., 2003; Schubotz
and von Cramon, 2003) as well as a motor-perception somatotopy when observing different
107
actions that extends to inferior frontal gyrus (Buccino et al., 2004).
In the model, vPMC along with BA44 is designated as the region where the speech
sound map is located. As such the model does not distinguish between IFo, IFt and
vPMC.
For the normal group, standard SPM results showed activity in this region in the
left hemisphere and none in the right hemisphere. ROI results replicated this finding
when comparing all the conditions against baseline. However, there was significant right
hemisphere vPMC activity during the CVCV condition though the activity (effect size) was
very small. When compared to normal subjects, premotor cortex is activated bilaterally in
the AD group in the comparison of common activity in the V, CV, rV and yV condition to
baseline. Separately, both the CV and the CVCV condition show significant right premotor
cortex activity compared to baseline. It was originally speculated that the premotor cortex
subsumes part of the functionality of the cerebellum when the cerebellum is damaged. This
increased activity on the right is in keeping with this speculation, but the functional role of
this activity is unclear. The model at present does not contain any right premotor cortical
representation and this right hemisphere increase cannot be explained based on the model.
There is a large amount of inter-subject variability in the location of the ventral pre-
central sulcus (Mangin et al 2004, Tomaiuolo et al 1999) and the normal tendency of BA4,
BA6 and BA44 is to form narrow strips at the level of the Sylvian fissure. This makes it
difficult to differentiate activity in this region as belonging to the ventral premotor cortex
or posterior Broca’s area in fMRI or PET studies that involve averaging across subjects
using standard normalization techniques (see Nieto-Castanon et al. 2003 for a related dis-
cussion). The finding that vPMC is primarily active in the left hemisphere is consistent
with the model hypothesis that premotor cortex is associated with the speech sound map
located primarily in the left hemisphere.
Some network of activity involving the premotor region, Broca’s area, the SMA and
anterior insula is likely responsible for the construction of a plan for speech articulation,
rather than the premotor region alone. Recent diffusion imaging studies in humans (Henry
108
et al., 2004) have shown white matter connectivity among these regions, further supporting
the claim of cooperative planning. However, the precise roles played by these regions are
still unclear. Furthermore, it is likely that different motor skills, perhaps even different
speech tasks, involve mirror neurons in different subregions of the premotor cortex and/or
Broca’s area. Another study has demonstrated functional reorganization in this region
after stroke (Riecker et al., 2002) with the right premotor/inferior frontal regions and
left cerebellum showing more activity after functional reorganization than the opposite
hemispheres. Since this change is much quicker than the speech development, based on
this result a new modeling hypothesis is being proposed in the thesis: the units of speech
are not stored only in the left premotor region, but possibly assume a distributed bilateral
representation that includes other areas such as the insula, and that the premotor region
is responsible for accessing these units of speech.
6.6.3 Broca’s area and frontal operculum (BA 44, IFo, IFt, FO)
Some recent studies (Wise et al., 1999) have indicated that the anterior insula much more
so than IFo is involved in articulation of words, and that it is likely a key planning center
for speech (Dronkers, 1996). Raichle (1996) also showed that Broca’s area is not active
during the production of single word nouns. However, a meta-analysis of word production
studies (Indefrey and Levelt, 2004) revealed that the inferior frontal gyrus was significantly
activated in most word and pseudoword reading tasks. As Kent et al. (2000b) suggested, the
role of Broca’s area in speech production cannot be disregarded and damage to the region
and surrounding areas is associated with progressive loss of speech. In their discussion they
alluded to several instances of progressive disorders, and in almost all cases the operculum
was also involved (Broussolle et al., 1996). It has been suggested that Broca’s area might
be primarily involved in the analysis of hierarchical or sequential structure (Zatorre et al.,
1996), that it might be the location for “mirror neurons” (Rizzolatti and Fadiga, 1998) and
be involved in learning new sounds (Golestani and Zatorre, 2004). It has also been pointed
out that Broca’s area is more involved with sequential organization than with phonological

109
processing (Gelfand and Bookheimer, 2003). Broca’s area may therefore function as the link
between phonological coding and articulation (Indefrey and Levelt, 2004; Kent et al., 2000b)
organizing the hierarchical sequential relationship between phonological aspects of speech
and articulatory or phonetic aspects of speech and helping to select articulatory programs in
conjunction with the premotor cortex and the insula. The somatotopic responses that have
been found in Broca’s area and premotor cortex during observation of actions involving
various parts of the body (Buccino et al., 2004) lead to the suggestion that these regions
could indeed be a common interface or association between action and perception.
As was mentioned earlier, in the model, BA44 along with vPMC is designated as the
region where the speech sound map is located. FO is currently not a part of the model.
The ROI results show bilateral activation of inferior frontal gyrus and frontal operculum
in normal subjects but of left IFo and FO only in dysarthric subjects. There is no significant
Right IFt activation in the normal subjects in any of the speaking conditions compared to
baseline. The standard results show that the activity is generally in the inferior part of
IFo with much of the activation being in FO. The ROI results are in agreement with this
result. In the AD group, there was no significant activity in the right hemisphere for these
regions. However, the left hemisphere activity in IFo in the AD group was lower than for
the normal subjects. Relative to motor cortex however, the activity in left IFo in the AD
group was about twice that of the normal subjects. Also in the AD group, IFo activity was
greater than FO, while the opposite was true in the normal subjects.
The exact morphology of Broca’s area and in particular IFo varies a lot from individual
to individual (Tomaiuolo et al., 1999). Often fMRI and PET studies that have observed
activity in the region in group data cannot clarify precisely where the activation is because
of the necessary smoothing involved in the process. In particular, observed activity in this
region could be the result of activity from inferior frontal gyrus, the frontal and anterior
central opercula, the anterior insula and ventrolateral premotor cortex. Golestani and
Zatorre (2004) saw two distinct regions of activity in the frontal lobe during learning of
new non-native sound contrasts. One of these locations was in the FO/ant insula region and

110
the other in superior IFo. Perhaps these locations represent the speech sound map cells.
Currently, the model has no separate function for Broca’s area compared to premotor
cortex. In the light of other results and results from this study, the model should be
augmented to include IFo and FO in the planning stages of articulation, with IFo being
important for hierarchical sequencing of phonetic and phonological structure, FO/anterior
insula providing access to their phonetic codes and with premotor cortex providing access
to their articulatory codes.
6.6.4 Cerebellum
As discussed in Chapter 4 the cerebellum is considered to be a very important locus of
timing and sensory prediction. Cerebellar activity in speech production experiments, had
been reported primarily in the anterior paravermal region of the cerebellum. Based on the
lesion study by Ackermann et al. (1992), this region of the cerebellar cortex appears to play
a role in the motor control of speech. A contribution to speech production by the medial
anterior region of the cerebellum is also supported by the dysarthria lesion study conducted
by Urban et al. (2003). Recent imaging studies (Riecker et al., 2002; Wildgruber et al., 2001;
Riecker et al., 2000a) indicate bilateral cerebellum activation during speech production
that lies posterior and lateral to the anterior paravermal activity. While one would consider
cerebellar damage leading to ataxic dysarthria as an opportunity for determining cerebellar
speech regions, most often this damage is not localized and several parts of the cerebellum
seem to be affected.
The model’s feedforward motor commands involve a cerebellar contribution and it has
been speculated in the model that the cerebellum also plays an important role in aligning
the sensory expectations with the true sensory afference.
The SPM results reveal distinct bilateral activations in normal subjects that lie behind
the primary fissure and lateral to medial cerebellar activity. The fMRI results also show
superior medial cerebellum activation during CV production. The ROI results revealed su-
perior lateral, superior medial and anterior medial cerebellum activity bilaterally in normal

111
subjects when compared to baseline. In addition, the deep cerebellar nuclei were active
when compared to baseline. The CVCV condition elicited much stronger cerebellar activity
than the other conditions. The CV condition had stronger cerebellar activity than either
the V or rV condition. There was hardly any cerebellar activity observed in the AD group.
In the AD group, as expected, the cerebellar hemispheres were not active.
It is speculated that the medial region with stronger connectivity to the interpositus
nuclei is likely strongly connected to the feedforward subsystem controlling motor output,
while the lateral region would have connections to parietal/higher order sensory areas
controlling sensory prediction (Middleton and Strick, 1997). The interpositus output may
be mostly to subcortical brainstem targets, possibly explaining why there is no drop in M1
activity in the AD group due to the loss of cerebellar inputs. In this dissertation, only a
preliminary excursion has been made into the role of the cerebellum in speech production
and the details are not yet clear. A key purpose of any future work would be to identify
specific connection pathways with cerebral cortex and lower brainstem structures for speech
production and then to clarify the involvement of the cerebellum in the different aspects
of speech planning, sequencing and coordination.
6.6.5 Somatosensory cortex and supramarginal gyrus
Somatosensory responses during speech production or other motor activities have been
found in several studies. However, given the location of primary somatosensory cortex and
smoothing of fMRI and PET data, it is difficult to dissociate somatosensory activity from
motor activity (however, see Moore et al. 2000). In a different speech production study
(Guenther et al., 2003), bilateral aSMG activity was observed during a pneumatic pertur-
bation of the jaw while speaking. Xu et al. (2001) showed supramarginal gyrus activity
during processing of pseudowords in a PET study. Unlike auditory areas, where modula-
tion of activity during speech production has been demonstrated, no such modulation of
activity has been found in the somatosensory regions. The role of supramarginal gyrus in
general and in particular during speech production is not clear from published literature.

112
The supramarginal gyrus maybe responsible for converting orthographic symbols to phone-
mic representations (Xu et al., 2001) and there is also evidence that this region (although
likely the posterior part close to angular gyrus) plays a role in phonological processing
that is independent of orthographic conversion (Gelfand and Bookheimer, 2003; Demonet
et al., 1994). A study of frequency effects of Chinese character reading revealed increased
activity in supramarginal gyrus/angular gyrus for the high frequency words but not for the
low frequency words (Kuo et al., 2003).
In the model, the somatosensory cortex receives proprioceptive and tactile information
from the articulators. Supramarginal gyrus has been hypothesized to be an error processing
center in the model. Specifically, the somatosensory error cells in this region compute the
difference between expected somatosensory state and actual somatosensory feedback.
Bilateral somatosensory cortex activity is seen during all tasks compared to baseline
in normal subjects. There is no difference in activity across conditions in the right so-
matosensory cortex. In the left hemisphere, somatosensory activity during rV production
was significantly higher than either V or CV production, but there was no significant dif-
ference compared to CVCV. Bilateral pSMG and right aSMG inactivation was found in all
conditions compared to baseline. Left aSMG did not show any significant change. How-
ever, spatial inspection of ROI results revealed a positive activity in the ventral part of
left aSMG and a negative activity in the dorsal part. In the AD group, right aSMG and
left aSMG were inhibited when conditions were compared to baseline. But left pSMG was
inhibited only in the CVCV condition. Left aSMG did not show any significant change in
activity.
The region pSMG lies anterior to angular gyrus, a region that was consistently and
significantly inhibited when compared to baseline for all conditions in both subject groups.
Therefore the region that was anatomically defined as pSMG might have been functionally
part of angular gyrus. The lack of aSMG activity is not surprising because the task was
made up of very simple speech production units, each of which should have been very easy
to speak and hence unlikely to have caused any error. One of the reasons why no activity

113
was seen in the region could have been the usage of pseudowords as stimuli. These are
infrequent utterances (although common in the language) and can be compared to that of
the low frequency words in the Kuo et al. (2003) study.
6.6.6 Auditory cortex and STG, STS, MTG
Several imaging studies have demonstrated activation of areas of the superior temporal
plane during sound processing (both speech and non-speech) and for linguistic and nonlin-
guistic sounds (Mazoyer et al., 1993; Frith et al., 1991; Petersen et al., 1988; Alavi et al.,
1981). The fMRI studies mostly performed a subtraction between auditory stimulation
in the presence of scanner noise and listening to scanner noise alone. The regions on the
superior temporal plane are active when listening to native and non-native speech sounds
(Mazoyer et al., 1993). Results from the same study also demonstrated left hemisphere
dominance for native sounds and phonological processing being specific to the left middle-
temporal gyrus. The left hemisphere has been shown to respond to rapid transitions more
than the right hemisphere (Belin et al., 1998). The upper bank of the superior temporal
sulcus has been shown to be selective to voice compared to environmental and non-vocal
sounds (Belin et al., 2000), whereas the anterior regions are more responsive to non-vocal
sounds (Belin et al., 2002). These and other findings have corroborated and refined earlier
studies showing superior and middle temporal activation in phonological processing, as well
as activation in the planum temporale (Binder et al., 1997, 1996). Additionally, the right
temporal region (particularly the anterior regions) has been implicated in the processing of
prosodic aspects of the speech signal (Buchanan et al., 2000) and the processing of speaker’s
voices (Belin and Zatorre, 2003). Delayed auditory feedback during speech production has
shown increased activity in pSTG (Hashimoto and Sakai, 2003). This activity was likely
related to performance monitoring or error processing. Several studies (Pinto et al., 2004;
Price et al., 1996; McGuire et al., 1996a,b) have suggested that auditory feedback is a
necessary prerequisite for activation of superior temporal gyrus.
In the model, the auditory state cells correspond to cells in Heschl’s gyrus and planum
114
temporale, while the auditory error cells correspond to posterior superior temporal gyrus
and posterior planum temporale. The auditory error cells compute the difference between
the expected auditory target for the phoneme and the actual sensory afference.
The results show bilateral activation of the superior temporal plane in the sylvian
fissure that includes Heschl’s gyrus, planum polare and planum temporale. The activity
also includes bilateral posterior superior temporal gyrus and bilateral posterior superior
temporal sulcus. The rest of the regions of the superior temporal sulcus and the middle
temporal gyrus are primarily inhibited. The regions did not show any difference across
the V, CV and rV conditions for normal subjects. The CVCV conditions elicited stronger
responses from all of these regions compared to the other three conditions. In normal
subjects and the AD group alike, middle temporal gyrus and superior temporal sulcus
showed reduced activity when compared to baseline. Overall, the pattern of activation
of auditory areas was similar between the two groups. Left Heschl’s showed a stronger
response than right for the AD group but the opposite was seen for the normal group.
pSTG activity was larger for the AD group compared to the normal subjects. This lends
weight to the hypothesis that the AD group produces larger errors in their production and
hence the auditory error cells are more active.
The detailed functions of the auditory regions (especially the secondary regions) remain
unclear at this point. The model also suggests that the same ’auditory representation’ of
words may be used for their perception and production (Buchsbaum et al., 2001; Hickok and
Poeppel, 2000; Guenther et al., 1998). The delayed auditory feedback study (Hashimoto
and Sakai, 2003) demonstrated pSTG activation. The model predicts that error signals
being generated in this region are being used to correct the feedforward command in
the frontal lobe and cerebellum. There does seem to be clear evidence of auditory error
processing in the region. The same region also showed up when subjects were asked to
learn non-native constrasts (Golestani and Zatorre, 2004).
115
6.6.7 SMA
A number of experiments involved with initiation and sequencing show activity in the SMA.
For a long time, the SMA was considered to be a single region. Several functional imaging
and anatomical studies have indicated that the area is in fact made of two different re-
gions: pre-SMA and SMA proper. A vertical line passing through the anterior commissure
perpendicular to the bicommissural line separates these regions (Picard and Strick, 1996).
In the nomenclature used in the description of the results of the experiments conducted
for this dissertation, these regions correspond to anterior and posterior SMA respectively.
However, cytoarchitectonic studies indicate that SMA consists of three separate regions
(Vorobiev et al., 1998). Electrical stimulation mapping of the somatotopic organization of
the human SMA has shown the lower part of the body represented posteriorly, head and
face anteriorly, and the upper limbs between these two regions (Fried et al., 1991). The
authors concluded that vocalization and speech arrest or slowing of speech were evoked
anterior to the SMA representation of the face, namely in the pre-SMA. The aSMA is
activated early in the period of movement preparation, while the pSMA is activated with
movement execution (Lee et al., 1999). However, a recent speech production experiment
(Jason Bohland, personal communication) suggests that both aSMA and pSMA on the left
are active during movement preparation, but only aSMA on the right. Several researchers
have posited that the supplementary motor area is particularly involved for self-initiated
responses (including speech production; Murphy et al. 1997), i.e., responses made in the
absence of external sensory cues, whereas lateral premotor cortex is more involved when
responding to external cues (Passingham, 1993). Deiber et al. (1999) shows that while the
activity is greater in the SMA for self-initiated responses, there is still significant activity
for externally triggered responses. Lesions of the SMA induce speech deficits (Krainik
et al., 2003; Baumgartner et al., 1996; Petersen et al., 1988).
The results of the experiments show bilateral anterior and posterior SMA activation
for normal subjects during each production condition compared to baseline. There is also
greater activity in both aSMA and pSMA when the CVCV condition is compared with

116
all the other conditions. The standard SPM analysis shows greater activation in SMA
when the CV condition is compared with the V condition. The AD group shows significant
activity only in the anterior SMA.
Currently the model contains no SMA representation. In terms of a revision of the
model, the initiation cells might be located in aSMA. The aSMA is strongly connected
with premotor cortex and the insula. Thus the aSMA may be responsible for selection and
initiation of a sequential order of speech sound map cells. It is hypothesized that there
exists a correspondence between units of a sequence and cells in the SMA. These cells
are active during the execution of the unit. The results involved activation in both the
pre-SMA and the SMA proper, and thus were not restricted to the orofacial somatotopy
of the SMA. In the AD group the activity was restricted to aSMA. This suggests the
possibility that pSMA is more involved with coordinating sequencing activities perhaps at
the level of speech units together with the cerebellum, while the aSMA is more involved
with initiating and controlling the temporal order of muscle activations within these units
(Bengtsson et al., 2004). Thus syllable duration equalization in dysarthric speech is a result
of a lack of interaction between the pSMA and the cerebellum.
6.7 Discussion
The results of the fMRI studies confirm the importance of several brain regions to speech
production. A large network of regions interacts to produce verbal output. Several of these
regions are already part of the DIVA model but several are not. The next step would be
to include some of these regions in the model and clarify their interaction. In particular,
the role of the SMA, the basal ganglia, the insula and the opercula should be described.
While the data from the AD group are still preliminary, the original hypotheses proposed
for the experiment can be reviewed.
It was hypothesized that ataxic dysarthrics rely more heavily on premotor cortex than
normals, particularly for consonant-heavy utterances. To the contrary, the results suggest
that the absolute activity is lower in the AD group than in normals subjects. However, a
117
bilateral activation of premotor cortex was observed. This was not the case with normal
subjects. A second hypothesis claimed greater cerebellar activity in normal subjects for
consonant production than for vowels because of stricter timing requirements. In this group
of subjects, there was greater activity in the superior medial and anterior cerebellum on the
right and the superior lateral cerebellum on the left. However, vowels and consonants differ
in temporal and phonetic content. A vowel utterance is produced primarily with a slowly
moving or relatively steady vocal tract whereas a CV utterance involves a rapidly moving
vocal tract. Therefore, the current results cannot confirm that the increase in activity
was due to timing requirements of consonants. It was hypothesized that the AD group
would show greater supramarginal gyrus activity and superior temporal gyrus activity
compared to normals because of larger errors in their production. This is seen in superior
temporal gyrus but not in supramarginal gyrus. These regions were also hypothesized
to show a difference between r-heavy syllables and CV syllables in normal subjects, with
pSTg showing greater activity for rV production and supramarginal gyrus showing greater
activity for CV production. No indication of this was found. The results add data to the
current imaging literature on speech production and also add more weight to some of the
hypotheses made in the DIVA model, while contradicting others.
The next chapter concludes the dissertation with a summary of the work carried out
and proposes future directions of research with the DIVA model, which are based partly on
the experimental results in this dissertation and partly on data that have been published
since the time these experiments were conducted.
Chapter 7
CONCLUSION AND FUTURE DIRECTIONS
This chapter starts with a summary of the research completed in this dissertation. However,
several elements of the model developed in this dissertation remain untested. In addition,
both the experiments that were conducted for this dissertation and those that have been
published in the literature motivate extensions to the model. These possible extensions are
summarized in this chapter. The chapter concludes with suggestions for future experiments
to test certain assumptions of the model, thus identifying directions for future research of
speech production using the DIVA model.
7.1 Summary of research
In this dissertation, a biologically plausible speech model was developed and tested using
functional imaging experiments. In the first part of the dissertation, a neuroanatomically
explicit version of the DIVA model of speech production was presented that introduced
a dual-sensory (both auditory and somatosensory) reference frame for speech production.
In addition to creating a correspondence between model cells and their neuroanatomical
bases, the modeling component of the dissertation incorporated realistic transmission de-
lays between these components. The presence of these delays motivated a new learning
scheme for the DIVA model and suggested a cerebellar role in dealing with these timing
issues. A model of the cerebellum was presented for alleviating the problems of temporal
synchrony and sensorimotor learning in the presence transmission delays. However, for
computational and implementation simplicity, a “functionally equivalent” cerebellum was
embedded, not a complete neurophysiologically plausible model of the cerebellum. Simula-
tions were presented that captured the fundamental functional characteristics of the model
118

119
and the response of the system to perturbations.
The second part of the dissertation explored brain function in neurologically normal
subjects and subjects with cerebellar damage using fMRI during overt speech production.
Specifically it looked at the relative contribution of different areas of the brain. The first
experiment conducted on neurologically normal subjects identified regions of the brain
involved during the production of elementary units of speech. Since these were spoken
overtly (aloud), the brains areas corresponding to their perception were also active. Several
of these areas were already part of the model discussed in the first part of the dissertation,
and the activations from each of these areas were discussed from the perspective of the
model and the functional imaging literature. However several areas that were indicated by
the results are not yet part of the model and possible roles of these additional regions were
discussed from the perspective of an extended framework for the model.
The second experiment was conducted on a small group of ataxic dysarthrics. These
subjects had some form of damage to cerebellar function. The results from these exper-
iments suggested that the loss of cerebellar function was supplanted by either additional
activity in certain regions of the cerebral cortex or the recruitment of additional regions
that were not active during normal production. In addition to the elucidating brain func-
tion during speech, these experiments help establish a successful paradigm for conducting
speech production experiments. Several experiments have been performed using a similar
paradigm as those described in this dissertation. The outcome of these newer experiments
suggest that event-triggered fMRI data acquisition is a powerful tool for exploring the
neural bases of speech.
What remains to be done is to speculate on extensions and alternatives to the model,
to suggest experiments that test yet untested hypotheses of the model and to elucidate
directions for future research.
120
7.2 Future directions
This dissertation has primarily focused on the neural bases of speech production. It has
also addressed sensorimotor learning and the production of learned speech sounds in the
presence and absence of perturbation to the system. However, several other behavioral
aspects of speech have not been considered in the model. These include speaking rate,
coarticulation, sequencing and mimicking. Simplifying assumptions have been made about
the representational units of speech such as the motor, somatosensory and auditory repre-
sentations. Currently the model also assumes that the auditory representation is already
normalized into a speaker independent form as well as being independent of speaking rate.
The aim of this section is to speculate on these issues and to create a modeling framework
that can be developed and experimentally tested.
The model assumed that every unit of motor, somatosensory or auditory representation
had a duration of 1ms, and a clocking signal formed the basis of operation that sequenced
these units one after another. This assumption was made partly for computational conve-
nience and partly to demonstrate that dynamic trajectories can be learned. There are sev-
eral issues with such a representation. The primary drawback of this representation is that
it cannot address variations in speaking rate. Speech output can be considered a sequence
of overlapping muscle activities. In general, the acoustic signal and the acompanying vocal
tract movement can be divided into stationary and non-stationary parts. Conversational
speech is produced at the rate of 3-6 syllables per second. Thus the changes in the vocal
tract are taking place at a much slower rate than 1000Hz. Acoustic features of the signal
do not change that rapidly and therefore there is a large redundancy in representation of
the features with respect to time. It is unlikely that such a representation forms the basis
of human speech production.
Looking at the spectral features of the speech signal, one could define the units of
speech to be a combination of steady states (primarily vowels) and transitions (primarily
consonants). Both of these features have a duration attribute. Changes in speaking rate

121
affect the durations of vowels more than consonants. Specifically, speech can speed up
or slow down by decreasing/increasing vowel durations. While a simple uniform clocking
mechanism could trigger a sequence of features, in this new representation, the system has
to keep track of the duration of each feature so that it can execute the next feature at an
appropriate time. Such a representation also benefits from a mapping of change in sensory
space to a change in motor space.
The cerebellar circuit described in Section 4.4.2 can be used to simulate coarticulatory
effects in addition to providing a feedforward learning solution. There are several issues
about the learning process that need to be resolved. First, it remains to be determined how
much of the learning of the feedforward command is transferred from the cerebellum to
premotor cortex. Second, if the cerebellar circuit is necessary in learning the feedforward
command, the model would predict that people with cerebellar damage may have difficulty
in learning new sounds.
The model currently contains a different sound map cell for each learned sound. This
would imply that a perturbation applied during one sound (/ba/) will not carry over to
another sound (/bi/). To test whether phonemes in different contexts share the same
underlying group of cells or different cells, one can perform a perturbation experiment in
which a particular phoneme (/b/ in /aba/) is perturbed (lip perturbation) till the subject
adapts. If the adaptation to the perturbation carries over to other words which contain
the phoneme (e.g., scribe), then it is likely that there may be a common group of cells
that encode the same phoneme in different contexts or that the perturbation is registered
at the level of the muscles involved in carrying out the action. To dissociate between the
two a non-speech movement task using the same articulators should be performed. If a
response to the perturbation persists, then the adaptation is muscle specific, otherwise
the adaptation is modality dependent. Depending on the outcome of such experiments,
different distributed representations of speech sounds can be incorporated in the model.
Currently, there is no connection and hence no interaction between the auditory and
somatosensory representations. It is also unclear from the data whether there are two sep-

122
arate sensory representations or a combined somatoauditory representation. It is possible
that vowel-like sounds are primarily monitored by the auditory system while sounds from
constrictions are monitored through proprioceptive and tactile feedback. Experiments in-
volving both somatosensory and auditory perturbations during speech may shed light on
this issue. A possible experiment would be one in which auditory and somatosensory per-
turbations are provided either separately or together in the same or opposite perceptual
directions in different sound contexts. To clarify the last part, when provided together they
can either increase the effect of the perturbation (synergistic) or cancel the effect of the
perturbation (antagonistic). If the two spaces are separate and independent of perceptual
outcome, both the synergistic and antagonistic modes would show response to perturba-
tions. However, if the brain uses a common sensory space and monitors the perception,
then the synergistic mode would show a compensation while the antagonistic mode would
not.
Based on the scant literature on the topic of speech perturbation, it appears that
somatosensory perturbations have a more immediate response (within the first few trials)
compared to an auditory perturbation. This needs to be tested further. If the current
conclusion holds, it may imply that somatosensory error correcting commands are directly
fed into the output circuit whereas auditory error correcting commands are primarily used
for learning and the effect is seen as learning progresses.
Although this dissertation presented a mechanistic approach to solving the problems
related to temporal delays, it does not rule out other options that nature may use. As
stated earlier in the dissertation, myelination is one such option that could ensure that
internal expectations matched external delays. However, this would not remain adaptive
beyond development. The brain does not appear to function like a computer circuit with
discrete pulses. Instead the brain employs a gradual recruitment of cells in each area
for a given task. Such a process could also reduce the instability in the system caused by
temporal delays by providing some amount of overlap between delayed populations of cells.
On a final note, a lot of work remains to be accomplished in clarifying the neural

123
processes and regions underlying speech production and perception. A model based frame-
work allows the luxury of running simulations to predict the outcome of various hypotheses
and assumptions made to develop the model. Combining the theoretical foundations of
modeling with experimental work provides a synergistic approach to finding the solution.

Appendix A
PARCELLATION SCHEME
The information contained in this appendix is derived from a technical report (Tourville
and Guenther, 2003) describing the parcellation scheme used. The aim of this appendix
is to familiarize the reader with the names and approximate locations of the brain regions
mentioned throughout the dissertation. Figure A·1 shows the outlines and names of the
regions on a schematic brain. Tables A.1, A.2 and A.3 state the nomenclature of the
regions and where available the corresponding Brodmann’s areas. The first table lists the
primary speech regions. The second table lists the remaining cortical regions that are part
of the parcellation scheme. The final table lists the regions that are part of the cerebellar
parcellation.
124
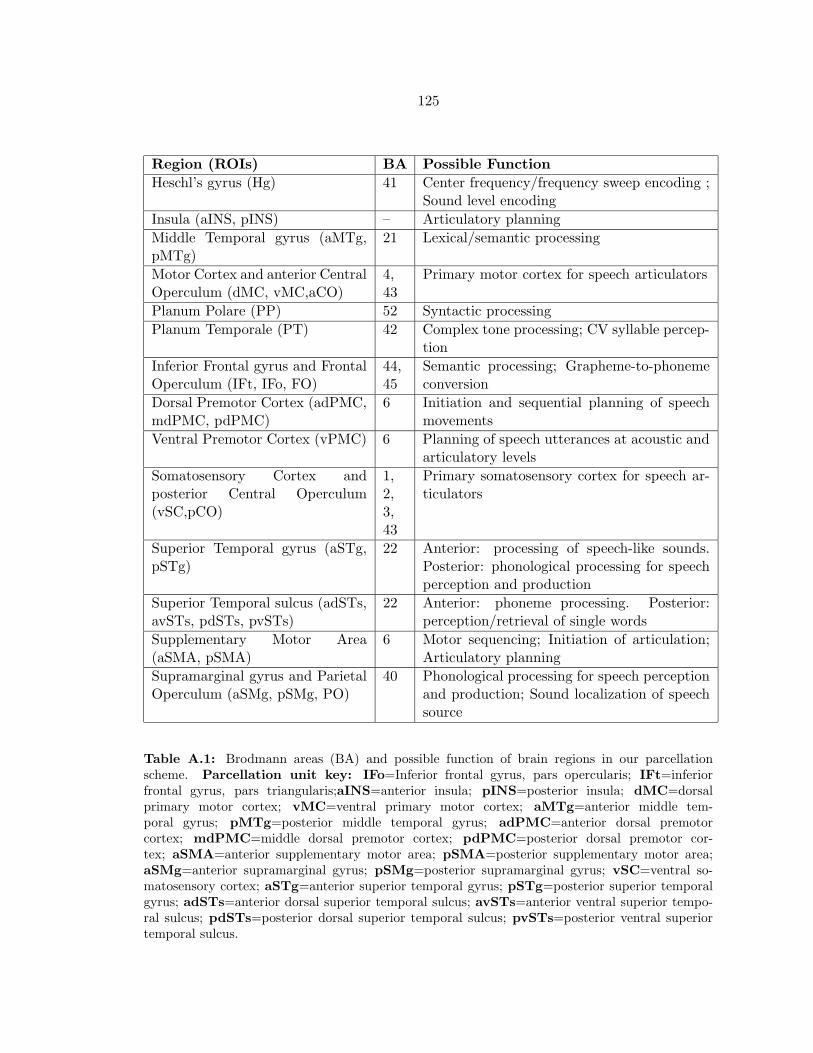
125
Region (ROIs) BA Possible Function
Heschl’s gyrus (Hg) 41 Center frequency/frequency sweep encoding ;Sound level encoding
Insula (aINS, pINS) – Articulatory planning
Middle Temporal gyrus (aMTg,pMTg)
21 Lexical/semantic processing
Motor Cortex and anterior CentralOperculum (dMC, vMC,aCO)
4,43
Primary motor cortex for speech articulators
Planum Polare (PP) 52 Syntactic processing
Planum Temporale (PT) 42 Complex tone processing; CV syllable percep-tion
Inferior Frontal gyrus and FrontalOperculum (IFt, IFo, FO)
44,45
Semantic processing; Grapheme-to-phonemeconversion
Dorsal Premotor Cortex (adPMC,mdPMC, pdPMC)
6 Initiation and sequential planning of speechmovements
Ventral Premotor Cortex (vPMC) 6 Planning of speech utterances at acoustic andarticulatory levels
Somatosensory Cortex andposterior Central Operculum(vSC,pCO)
1,2,3,43
Primary somatosensory cortex for speech ar-ticulators
Superior Temporal gyrus (aSTg,pSTg)
22 Anterior: processing of speech-like sounds.Posterior: phonological processing for speechperception and production
Superior Temporal sulcus (adSTs,avSTs, pdSTs, pvSTs)
22 Anterior: phoneme processing. Posterior:perception/retrieval of single words
Supplementary Motor Area(aSMA, pSMA)
6 Motor sequencing; Initiation of articulation;Articulatory planning
Supramarginal gyrus and ParietalOperculum (aSMg, pSMg, PO)
40 Phonological processing for speech perceptionand production; Sound localization of speechsource
Table A.1: Brodmann areas (BA) and possible function of brain regions in our parcellationscheme. Parcellation unit key: IFo=Inferior frontal gyrus, pars opercularis; IFt=inferiorfrontal gyrus, pars triangularis;aINS=anterior insula; pINS=posterior insula; dMC=dorsalprimary motor cortex; vMC=ventral primary motor cortex; aMTg=anterior middle tem-poral gyrus; pMTg=posterior middle temporal gyrus; adPMC=anterior dorsal premotorcortex; mdPMC=middle dorsal premotor cortex; pdPMC=posterior dorsal premotor cor-tex; aSMA=anterior supplementary motor area; pSMA=posterior supplementary motor area;aSMg=anterior supramarginal gyrus; pSMg=posterior supramarginal gyrus; vSC=ventral so-matosensory cortex; aSTg=anterior superior temporal gyrus; pSTg=posterior superior temporalgyrus; adSTs=anterior dorsal superior temporal sulcus; avSTs=anterior ventral superior tempo-ral sulcus; pdSTs=posterior dorsal superior temporal sulcus; pvSTs=posterior ventral superiortemporal sulcus.

126
Figure A·1: A cortical and cerebellar parcellation scheme based on Caviness et al. (1996) andSchmahmann (2000) parcellation systems. Speech-related cortical regions of interest (ROIs) arehighlighted in gray on the lateral (right) and medial (left) brain surfaces of the left hemisphere.Dashed lines indicated boundaries between adjacent regions. The Intra-Sylvian region and theSuperior Temporal sulcus are schematized as exposed flattened surfaces as indicated by the twosweeping arrows. The detached cerebellum is also shown in the lower left and lower right. SeeTable A.1 for abbreviation definitions of the speech-related ROIs, Table A.2 for remaining corticalROIs and Table A.3 for cerebellar ROIs.
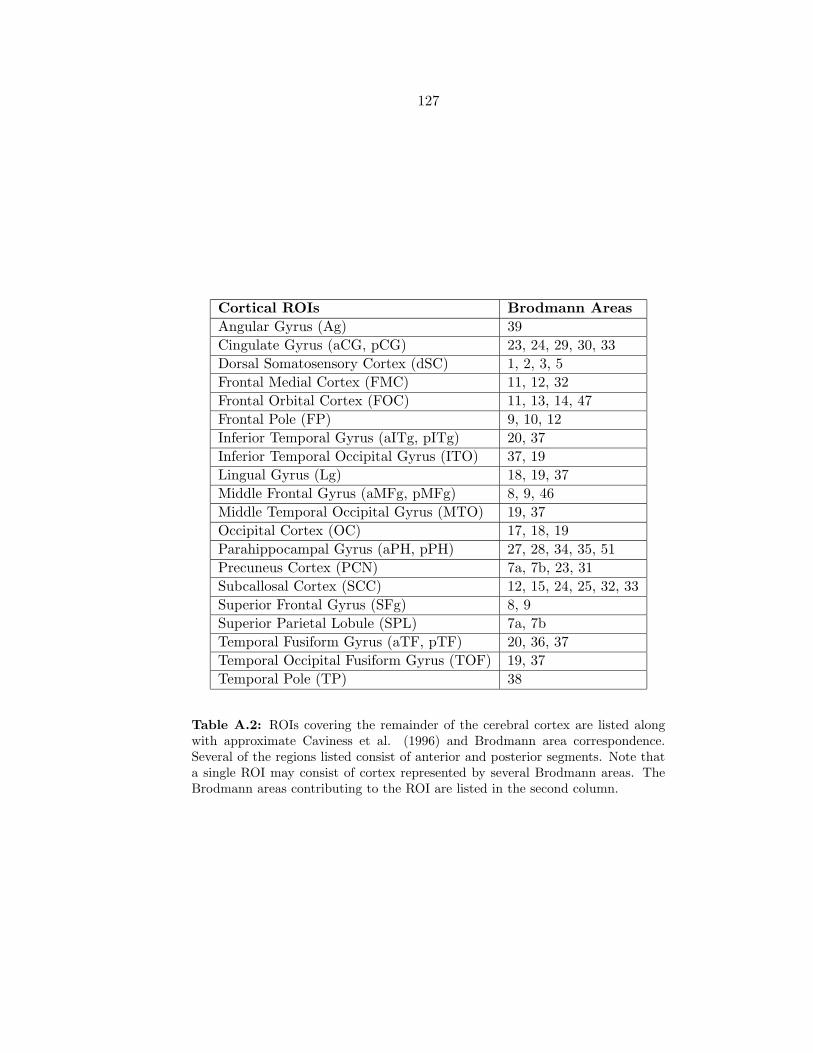
127
Cortical ROIs Brodmann Areas
Angular Gyrus (Ag) 39
Cingulate Gyrus (aCG, pCG) 23, 24, 29, 30, 33
Dorsal Somatosensory Cortex (dSC) 1, 2, 3, 5
Frontal Medial Cortex (FMC) 11, 12, 32
Frontal Orbital Cortex (FOC) 11, 13, 14, 47
Frontal Pole (FP) 9, 10, 12
Inferior Temporal Gyrus (aITg, pITg) 20, 37
Inferior Temporal Occipital Gyrus (ITO) 37, 19
Lingual Gyrus (Lg) 18, 19, 37
Middle Frontal Gyrus (aMFg, pMFg) 8, 9, 46
Middle Temporal Occipital Gyrus (MTO) 19, 37
Occipital Cortex (OC) 17, 18, 19
Parahippocampal Gyrus (aPH, pPH) 27, 28, 34, 35, 51
Precuneus Cortex (PCN) 7a, 7b, 23, 31
Subcallosal Cortex (SCC) 12, 15, 24, 25, 32, 33
Superior Frontal Gyrus (SFg) 8, 9
Superior Parietal Lobule (SPL) 7a, 7b
Temporal Fusiform Gyrus (aTF, pTF) 20, 36, 37
Temporal Occipital Fusiform Gyrus (TOF) 19, 37
Temporal Pole (TP) 38
Table A.2: ROIs covering the remainder of the cerebral cortex are listed alongwith approximate Caviness et al. (1996) and Brodmann area correspondence.Several of the regions listed consist of anterior and posterior segments. Note thata single ROI may consist of cortex represented by several Brodmann areas. TheBrodmann areas contributing to the ROI are listed in the second column.

128
Boundaries
Cerebellar ROIs Anterior Posterior Medial Lateral
Anterior Lateral(alCB)
AnteriorHem.Marg.
PrimaryFissure
Plane Cb LateralHem.Marg.
Anterior Medial(amCB)
AnteriorHem.Marg.
PrimaryFissure
Midline Plane Cb
Inferior Posterior Lat-eral (iplCB)
PosteriorHem.Marg.
PosteriorHem.Marg.
Plane Cb HorizontalFissure
Inferior Posterior Me-dial (ipmCB)
PosteriorHem.Marg.
PosteriorHem.Marg.
Midline Plane Cb
Superior PosteriorLateral (splCB)
PrimaryFissure
PosteriorHem.Marg.
Plane Cb HorizontalFissure
Superior Posterior Me-dial (spmCB)
PrimaryFissure
PosteriorHem.Marg.
Midline Plane Cb
Deep Cerebellar Nuclei(DCN)*
Brainstem,PosteriorEnd
alCB,PosteriorEnd
Midline DentateNuc.,LateralBorder
Table A.3: Cerebellar ROIs listed with their anatomical boundaries. Plane Cbis a sagittal plane one third of the way between the midline of the cerebellum andits lateral extent. H.M. = hemispheric margin. [*] Because the deep cerebellarnuclei are difficult to view on standard structural data sets acquired on 1.5T or 3Tmagnets, these boundaries serve as easily identified overestimates of the extents ofthe deep cerebellar nuclei.

Appendix B
AUGMENTED TACTILE FEEDBACK MODEL
The palato-tactile part of the somatosensory representation was generated using a linear
function of the Maeda parameters as described by Schwartz and Boe (2000). The tactile
feedback was augmented to include tactile information from the lips. In the absence of
experimental data, the area function of the lip opening generated by the vocal tract model
was converted to an approximate tactile representation. 4000 uniform random positions
were generated and the area function of the lip opening was calculated for each position.
The area function was converted into a tactile representation similar to the palatal repre-
sentations using the following function:
Tactilelips =[9(5 − AreaFunctionlips)]
+
5(B.1)
The linear weights were then computed using a pseudioinverse to map the first 5 Maeda
parameters to the tactile lip parameter. Although the function used above is somewhat
arbitrary, the intent of the function was to provide a continuous gradient, which could then
be used in a pseudoinverse calculation to determine the Maeda parameter set corresponding
to a given tactile representation.
129

Appendix C
VOCAL TRACT MODEL
The Maeda vocal tract model (Maeda, 1990) was used as the basis for the extended vocal
tract model. In this extended model the jaw height parameter from the original model
was separated into two components representing upper lip and lower lip positions. The
difference between these positions was then mapped back to the lip aperture parameter for
calculations involving the vocal tract. To maintain consistency between the parameters of
the extended vocal tract, the upper and lower lip positions also used the same range of +/-
3.5 as is the case with the other parameters. This range was mapped to a positional extent
of 2.5cm for each lip with a central overlap of 1cm between the upper lip and lower lip.
The mapping function ensured that the lips did not cross each other in physical space. A
coupling parameter was used between the jaw height parameter and the lower lip position
parameter. This was done to maintain a semblance of physical reality, in that moving the
jaw changes the position of the lower lip. Maintaining lower lip position would therefore
require explicit commands on the part of the controller to decouple the dependence on the
jaw.
130

Appendix D
SIMULATION PARAMETER CHOICES
D.1 Parameter list
Name DefaultValue
Description
αff 1 Contribution of feedforward command to total com-mand
αfb 1 Contribution of feedback command to total command
δMAr 42ms Transmission delay from motor cortex cell activity tophysical movement of articulators
δArS 15ms Transmission delay from movement of articulators tofeedback signals in somatosensory cortex
δArAu 20ms Transmission delay from movement of articulators tofeedback signals in somatosensory cortex
δPM 0ms Transmission delay from premotor to motor cortex
δPS 3ms Transmission delay from premotor to somatosensorycortex
δPAu 3ms Transmission delay from premotor to auditory cortex
δSM 3ms Transmission delay from somatosensory to motor cor-tex
δAuM 3ms Transmission delay from auditory to motor cortex
JawLip 0.4 Coupling of jaw and lower lip parameter for the ex-tended Maeda model
ArSpread 3.5 Range of Maeda parameters [in units of standard de-viation]
MINERT 0.95 Inertial damping of motor output
FBINERT 0.7 Inertial damping of feedback command
Table D.1: The table lists tunable parameters of the model, their default values and a briefdescription of the function of the parameter. Inertial damping is applied using the equation: val =INERT ∗ valold + (1 − INERT ) ∗ valcurrent.
131
132
D.2 Simulation parameters
The first simulation described in Section 3.4 used the default parameters listed in Table D.1.
For the final two simulations, FBINERT was the only parameter modified. The new value
for this parameter was 0.5.

Appendix E
ROI RESULTS
This appendix provides ROI analysis results from the two experiments. Important aspects
of these results have been reported in the main text of the dissertation. In the figures
that follow red corresponds to a significance level of p < 0.001, yellow (p < 0.01), green
(p < 0.05) and blue (p < 0.1). Although blue is typically not considered significant, it was
included to denote borderline regions that may become significant if certain parameters
such as number of subjects or scanner strength was changed. The height of each bar
corresponds to the percentage signal change and the range of the y-axis is the same for
each subplot of a figure. The range is shown on the right of the top row on each figure.
133

134
V−B
CV
−B
CV
CV
−B
rV−B
% S
igna
l Cha
nge
−0.08
3.4
vMC
V−B
CV
−B
CV
CV
−B
rV−B
vPMC
aSMA
pSMA
iFo
iFt
FO
aCO
pCO
PO
aINS
Left Hemisphere
pINS
Right Hemisphere
Figure E·1: ROI results in motor, insular and opercular areas in normal subjects for each conditioncompared to baseline.
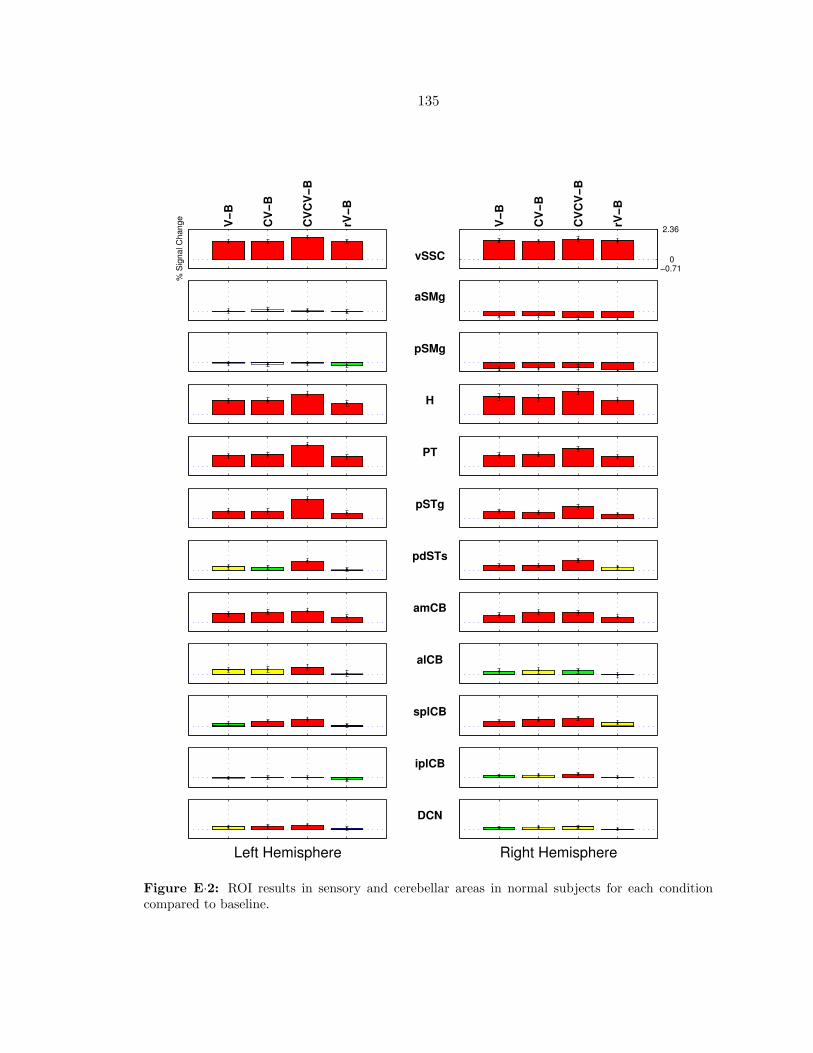
135
V−B
CV
−B
CV
CV
−B
rV−B
% S
igna
l Cha
nge
−0.71 0
2.36
vSSC
V−B
CV
−B
CV
CV
−B
rV−B
aSMg
pSMg
H
PT
pSTg
pdSTs
amCB
alCB
splCB
iplCB
Left Hemisphere
DCN
Right Hemisphere
Figure E·2: ROI results in sensory and cerebellar areas in normal subjects for each conditioncompared to baseline.

136
V−B
CV
−B
CV
CV
−B
rV−B
% S
igna
l Cha
nge
−1.52
0.07
AG
V−B
CV
−B
CV
CV
−B
rV−B
PCN
aMTg
pMTg
pCG
Left Hemisphere
LG
Right Hemisphere
Figure E·3: ROI results in normal subjects for each condition compared to baseline showingreduced activity.
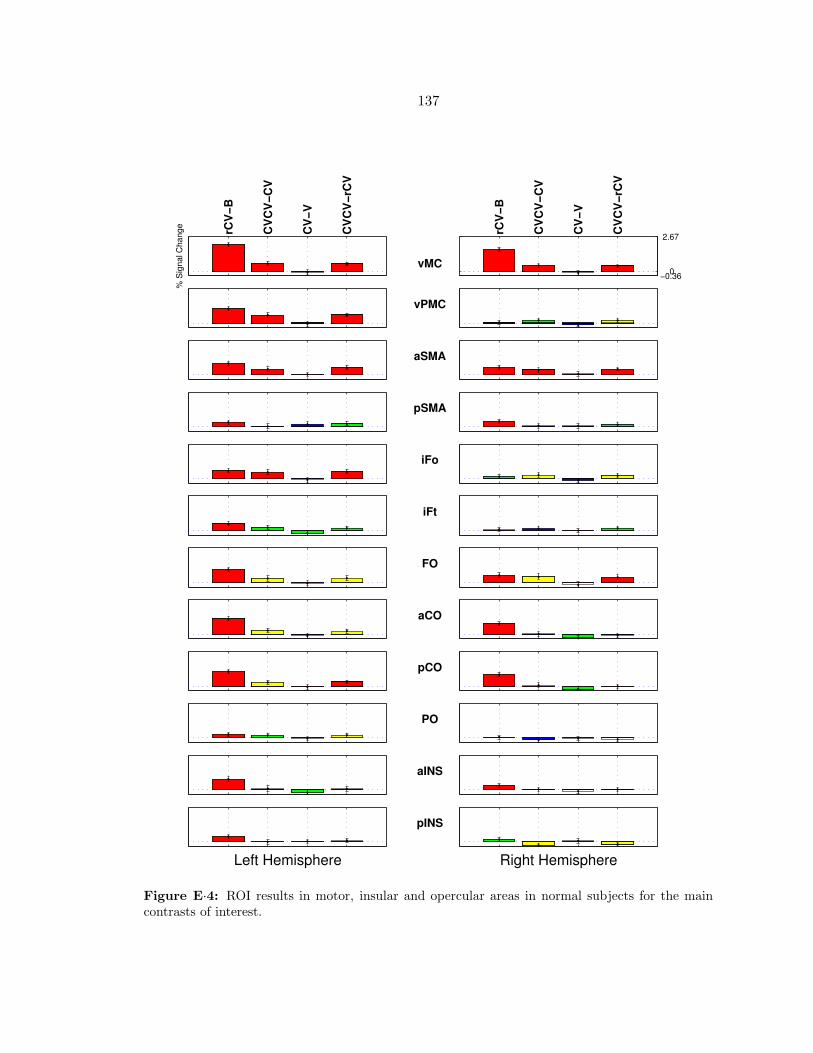
137
rCV
−B
CV
CV
−CV
CV
−V
CV
CV
−rC
V
% S
igna
l Cha
nge
−0.36 0
2.67
vMC
rCV
−B
CV
CV
−CV
CV
−V
CV
CV
−rC
V
vPMC
aSMA
pSMA
iFo
iFt
FO
aCO
pCO
PO
aINS
Left Hemisphere
pINS
Right Hemisphere
Figure E·4: ROI results in motor, insular and opercular areas in normal subjects for the maincontrasts of interest.

138
rCV
−B
CV
CV
−CV
CV
−V
CV
CV
−rC
V
% S
igna
l Cha
nge
−0.59 0
1.86
vSSC
rCV
−B
CV
CV
−CV
CV
−V
CV
CV
−rC
V
aSMg
pSMg
H
PT
pSTg
pdSTs
amCB
alCB
splCB
iplCB
Left Hemisphere
DCN
Right Hemisphere
Figure E·5: ROI results in sensory and cerebellar areas in normal subjects for the main contrastsof interest.

139
V−B
CV
−B
CV
CV
−B
rV−B
yV−B
% S
igna
l Cha
nge
−1.27 0
5.44
vMC
V−B
CV
−B
CV
CV
−B
rV−B
yV−B
vPMC
aSMA
pSMA
iFo
iFt
FO
aCO
pCO
PO
aINS
Left Hemisphere
pINS
Right Hemisphere
Figure E·6: ROI results in motor, insular and opercular areas in ataxic dysarthrics for eachcondition compared to baseline.

140
V−B
CV
−B
CV
CV
−B
rV−B
yV−B
% S
igna
l Cha
nge
−2.12
0
3.99
vSSC
V−B
CV
−B
CV
CV
−B
rV−B
yV−B
aSMg
pSMg
H
PT
pSTg
pdSTs
amCB
alCB
splCB
iplCB
Left Hemisphere
DCN
Right Hemisphere
Figure E·7: ROI results in sensory and cerebellar areas in ataxic dysarthrics for each conditioncompared to baseline.

141
V−B
CV
−B
CV
CV
−B
rV−B
yV−B
% S
igna
l Cha
nge
−3.73
0 0.56
AG
V−B
CV
−B
CV
CV
−B
rV−B
yV−B
PCN
aMTg
pMTg
pCG
Left Hemisphere
LG
Right Hemisphere
Figure E·8: ROI results in ataxic dysarthrics for each condition compared to baseline showingreduced activity.

142
yrC
V−B
CV
CV
−CV
CV
−V
CV
CV
−yrC
V
% S
igna
l Cha
nge
−1.4 0
4.34
vMC
yrC
V−B
CV
CV
−CV
CV
−V
CV
CV
−yrC
V
vPMC
aSMA
pSMA
iFo
iFt
FO
aCO
pCO
PO
aINS
Left Hemisphere
pINS
Right Hemisphere
Figure E·9: ROI results in motor, insular and opercular areas in ataxic dysarthrics for the maincontrasts of interest.
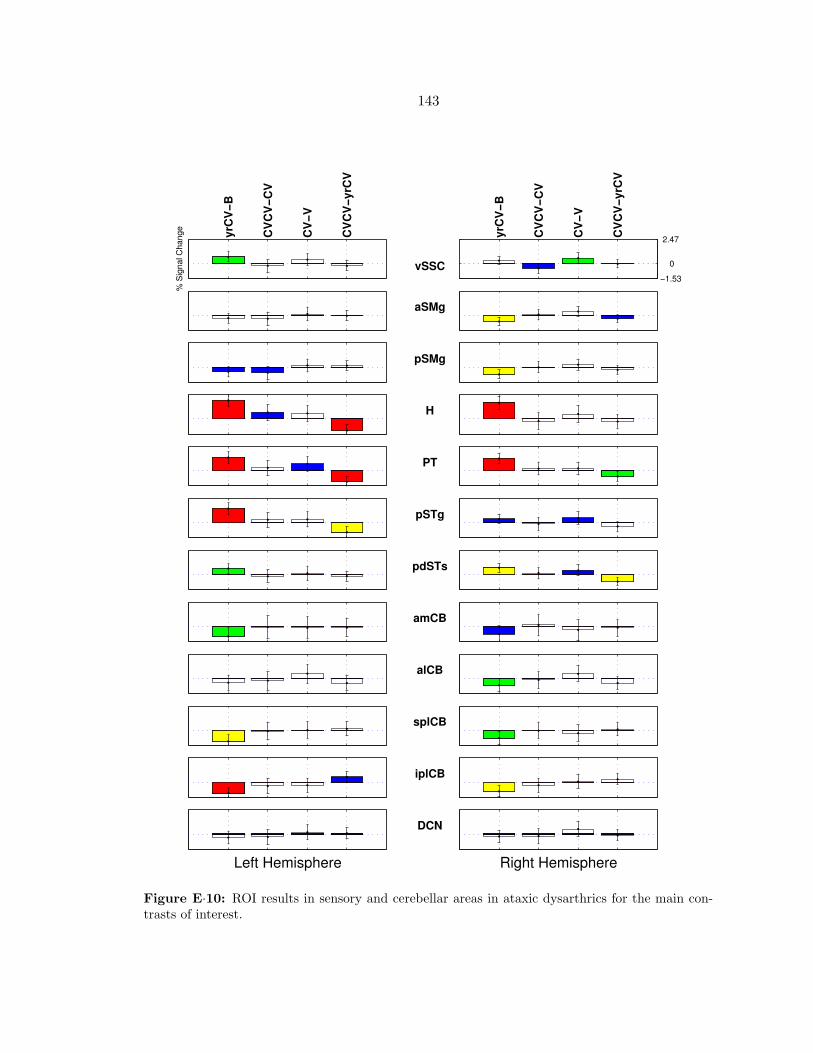
143
yrC
V−B
CV
CV
−CV
CV
−V
CV
CV
−yrC
V
% S
igna
l Cha
nge
−1.53
0
2.47
vSSC
yrC
V−B
CV
CV
−CV
CV
−V
CV
CV
−yrC
V
aSMg
pSMg
H
PT
pSTg
pdSTs
amCB
alCB
splCB
iplCB
Left Hemisphere
DCN
Right Hemisphere
Figure E·10: ROI results in sensory and cerebellar areas in ataxic dysarthrics for the main con-trasts of interest.

REFERENCES
Abbs, J. H. and Gracco, V. L. (1984). Control of complex motor gestures: orofacialmuscle responses to load perturbations of lip during speech. Journal of neurophysiology,51(4):705–723.
Ackermann, H., Graber, S., Hertrich, I., and Daum, I. (1997). Categorical speech percep-tion in cerebellar disorders. Brain and language, 60(2):323–331.
Ackermann, H., Graber, S., Hertrich, I., and Daum, I. (1999a). Cerebellar contributionsto the perception of temporal cues within the speech and nonspeech domain. Brain andlanguage, 67(3):228–241.
Ackermann, H., Graber, S., Hertrich, I., and Daum, I. (1999b). Phonemic vowel lengthcontrasts in cerebellar disorders. Brain and language, 67(2):95–109.
Ackermann, H. and Hertrich, I. (1994). Speech rate and rhythm in cerebellar dysarthria:an acoustic analysis of syllabic timing. Folia phoniatrica et logopaedica, 46(2):70–78.
Ackermann, H. and Hertrich, I. (1997). Voice onset time in ataxic dysarthria. Brain andlanguage, 56(3):321–333.
Ackermann, H., Hertrich, I., and Scharf, G. (1995). Kinematic analysis of lower lipmovements in ataxic dysarthria. Journal of speech and hearing research, 38(6):1252–1259.
Ackermann, H., Vogel, M., Petersen, D., and Poremba, M. (1992). Speech deficits inischaemic cerebellar lesions. Journal of neurology, 239(4):223–227.
Ackermann, H., Wildgruber, D., Daum, I., and Grodd, W. (1998). Does the cerebellumcontribute to cognitive aspects of speech production? A functional magnetic resonanceimaging (fMRI) study in humans. Neuroscience letters, 247(2-3):187–190.
Aizenman, C. D., Manis, P. B., and Linden, D. J. (1998). Polarity of long-term synapticgain change is related to postsynaptic spike firing at a cerebellar inhibitory synapse.Neuron, 21(4):827–835.
Alavi, A., Reivich, M., Greenberg, J., Hand, P., Rosenquist, A., Rintelmann, W., Christ-man, D., Fowler, J., Goldman, A., MacGregor, R., and Wolf, A. (1981). Mapping offunctional activity in brain with 18F-fluoro-deoxyglucose. Seminars in nuclear medicine,11(1):24–31.
Albus, J. S. (1971). A theory of cerebellar function. Mathematical Biosciences, 10:25–61.
144
145
Allen, G. I. and Tsukahara, N. (1974). Cerebrocerebellar communication systems. Physi-ological reviews, 54(4):957–1006.
Amaro Jr, E., Williams, S. C., Shergill, S. S., Fu, C. H., MacSweeney, M., Picchioni, M. M.,Brammer, M. J., and McGuire, P. K. (2002). Acoustic noise and functional magnetic res-onance imaging: current strategies and future prospects. Journal of magnetic resonanceimaging, 16(5):497–510.
Amino, Y., Kyuhou, S., Matsuzaki, R., and Gemba, H. (2001). Cerebello-thalamo-corticalprojections to the posterior parietal cortex in the macaque monkey. Neuroscience letters,309(1):29–32.
Andersen, R. A., Snyder, L. H., Bradley, D. C., and Xing, J. (1997). Multimodal repre-sentation of space in the posterior parietal cortex and its use in planning movements.Annual review of neuroscience, 20:303–330.
Attwell, P. J., Ivarsson, M., Millar, L., and Yeo, C. H. (2002). Cerebellar mechanisms ineyeblink conditioning. Annals of the New York Academy of Sciences, 978:79–92.
Baciu, M., Abry, C., and Segebarth, C. (2000). Equivalence motrice et dominancehemispherique. Le cas de la voyelle [u]. Etude IRMf. In Actes des XXIIIemes Journeesd’Etude sur la Parole, pages 213–216.
Baizer, J. S., Kralj-Hans, I., and Glickstein, M. (1999). Cerebellar lesions and prismadaptation in macaque monkeys. Journal of neurophysiology, 81(4):1960–1965.
Barlow, J. S. (2002). The cerebellum and adaptive control. Cambridge University Press.
Bastian, A. J. and Thach, W. T. (1995). Cerebellar outflow lesions: a comparison ofmovement deficits resulting from lesions at the levels of the cerebellum and thalamus.Annals of neurology, 38(6):881–892.
Bastian, A. J. and Thach, W. T. (2001). Structure and function of the cerebellum. InManto, M. and Pandolfo, M., editors, The cerebellum and its disorders, pages 49–68.Cambridge University Press.
Baum, S. R., McFarland, D. H., and Diab, M. (1996). Compensation to articulatoryperturbation: perceptual data. The Journal of the Acoustical Society of America,99(6):3791–3794.
Baumgartner, C., Flint, R., Tuxhorn, I., Ness, P. C. V., Kosalko, J., Olbrich, A., Almer, G.,Novak, K., and Luders, H. O. (1996). Supplementary motor area seizures: propagationpathways as studied with invasive recordings. Neurology, 46(2):508–514.
Belin, P. and Zatorre, R. J. (2003). Adaptation to speaker’s voice in right anterior temporallobe. Neuroreport, 14(16):2105–2109.
Belin, P., Zatorre, R. J., and Ahad, P. (2002). Human temporal-lobe response to vocalsounds. Cognitive Brain Research, 13(1):17–26.

146
Belin, P., Zatorre, R. J., Lafaille, P., Ahad, P., and Pike, B. (2000). Voice-selective areasin human auditory cortex. Nature, 403(6767):309–312.
Belin, P., Zilbovicius, M., Crozier, S., Thivard, L., Fontaine, A., Masure, M. C., andSamson, Y. (1998). Lateralization of speech and auditory temporal processing. Journalof cognitive neuroscience, 10(4):536–540.
Belliveau, J. W., Kwong, K. K., Kennedy, D. N., Baker, J. R., Stern, C. E., Benson, R.,Chesler, D. A., Weisskoff, R. M., Cohen, M. S., and and, R. B. T. (1992). Magnetic reso-nance imaging mapping of brain function. human visual cortex. Investigative radiology,27 Suppl 2:S59–S65.
Bengtsson, S. L., Ehrsson, H. H., Forssberg, H., and Ullen, F. (2004). Dissociating brainregions controlling the temporal and ordinal structure of learned movement sequences.The European journal of neuroscience, 19(9):2591–2602.
Benson, R. R., Whalen, D. H., Richardson, M., Swainson, B., Clark, V. P., Lai, S., andLiberman, A. M. (2001). Parametrically dissociating speech and nonspeech perceptionin the brain using fMRI. Brain and Language, 78(3):364–396.
Binder, J. R., Frost, J. A., Hammeke, T. A., Cox, R. W., Rao, S. M., and Prieto, T. (1997).Human brain language areas identified by functional magnetic resonance imaging. TheJournal of neuroscience, 17(1):353–362.
Binder, J. R., Frost, J. A., Hammeke, T. A., Rao, S. M., and Cox, R. W. (1996). Functionof the left planum temporale in auditory and linguistic processing. Brain, 119 ( Pt4):1239–1247.
Blaxton, T. A., Zeffiro, T. A., Gabrieli, J. D., Bookheimer, S. Y., Carrillo, M. C., Theodore,W. H., and Disterhoft, J. F. (1996). Functional mapping of human learning: a positronemission tomography activation study of eyeblink conditioning. The Journal of neuro-science, 16(12):4032–4040.
Boersma, P. and Weenink, D. (2004). Praat: doing phonetics by computer. Computersoftware. [http://www.fon.hum.uva.nl/praat/].
Bracha, V. (2004). Role of the cerebellum in eyeblink conditioning. Progress in brainresearch, 143:331–339.
Bracha, V., Kolb, F. P., Irwin, K. B., and Bloedel, J. R. (1999). Inactivation of interposednuclei in the cat: classically conditioned withdrawal reflexes, voluntary limb movementsand the action primitive hypothesis. Experimental brain research, 126(1):77–92.
Bracha, V., Zhao, L., Irwin, K. B., and Bloedel, J. R. (2000). The human cerebellumand associative learning: dissociation between the acquisition, retention and extinctionof conditioned eyeblinks. Brain research, 860(1-2):87–94.
Brodal, A. (1981). Neurological anatomy in relation to clinical medicine, volume 3rd ed.Oxford University Press.

147
Brooks, V. B., Kozlovskaya, I. B., Atkin, A., Horvath, F. E., and Uno, M. (1973). Ef-fects of cooling dentate nucleus on tracking-task performance in monkeys. Journal ofneurophysiology, 36(6):974–995.
Broussolle, E., Bakchine, S., Tommasi, M., Laurent, B., Bazin, B., Cinotti, L., Cohen, L.,and Chazot, G. (1996). Slowly progressive anarthria with late anterior opercular syn-drome: a variant form of frontal cortical atrophy syndromes. Journal of the neurologicalsciences, 144(1-2):44–58.
Buccino, G., Binkofski, F., and Riggio, L. (2004). The mirror neuron system and actionrecognition. Brain and language, 89(2):370–376.
Buchanan, T. W., Lutz, K., Mirzazade, S., Specht, K., Shah, N. J., Zilles, K., and Jancke,L. (2000). Recognition of emotional prosody and verbal components of spoken language:an fMRI study. Brain research Cognitive brain research, 9(3):227–238.
Buchsbaum, B. R., Hickok, G., and Humphries, C. (2001). Role of left posterior supe-rior temporal gyrus in phonological processing for speech perception and production.Cognitive Science, 25(5):663–678.
Cajal, S. (1990). New ideas on the structure of the nervous system in man and vertebrates.MIT Press.
Callan, D. E., Kent, R. D., Guenther, F. H., and Vorperian, H. K. (2000). An auditory-feedback-based neural network model of speech production that is robust to develop-mental changes in the size and shape of the articulatory system. Journal of speech,language, and hearing research, 43(3):721–736.
Caplan, D., Gow, D., and Makris, N. (1995). Analysis of lesions by MRI in stroke patientswith acoustic-phonetic processing deficits. Neurology, 45(2):293–298.
Caviness, V. S., Meyer, J., Makris, N., and Kennedy, D. N. (1996). MRI-based topographicparcellation of human neocortex: an anatomically specified method with estimate ofreliability. Journal of cognitive neuroscience, 8(6):566–587.
Celsis, P., Boulanouar, K., Doyon, B., Ranjeva, J. P., Berry, I., Nespoulous, J. L., andChollet, F. (1999). Differential fMRI responses in the left posterior superior temporalgyrus and left supramarginal gyrus to habituation and change detection in syllables andtones. NeuroImage, 9(1):135–144.
Chapman, C. E., Jiang, W., and Lamarre, Y. (1988). Modulation of lemniscal input duringconditioned arm movements in the monkey. Experimental brain research, 72(2):316–334.
Chouinard, P. A., Werf, Y. D. V. D., Leonard, G., and Paus, T. (2003). Modulating neuralnetworks with transcranial magnetic stimulation applied over the dorsal premotor andprimary motor cortices. Journal of neurophysiology, 90(2):1071–1083.
Christian, K. M. and Thompson, R. F. (2003). Neural substrates of eyeblink conditioning:acquisition and retention. Learning & memory, 10(6):427–455.

148
Clower, D. M., West, R. A., Lynch, J. C., and Strick, P. L. (2001). The inferior parietallobule is the target of output from the superior colliculus, hippocampus, and cerebellum.The Journal of neuroscience, 21(16):6283–6291.
Cole, K. J. and Abbs, J. H. (1987). Kinematic and electromyographic responses to per-turbation of a rapid grasp. Journal of neurophysiology, 57(5):1498–1510.
Contreras-Vidal, J. L., Grossberg, S., and Bullock, D. (1997). A neural model of cerebellarlearning for arm movement control: cortico-spino-cerebellar dynamics. Learning &memory, 3(6):475–502.
Crammond, D. J. and Kalaska, J. F. (2000). Prior information in motor and premotorcortex: activity during the delay period and effect on pre-movement activity. Journalof neurophysiology, 84(2):986–1005.
Creutzfeldt, O., Ojemann, G., and Lettich, E. (1989a). Neuronal-activity in the humanlateral temporal-lobe .1. Responses to speech. Experimental Brain Research, 77(3):451–475.
Creutzfeldt, O., Ojemann, G., and Lettich, E. (1989b). Neuronal-activity in the humanlateral temporal-lobe .2. Responses to the subjects own voice. Experimental BrainResearch, 77(3):476–489.
Dale, A. M., Fischl, B., and Sereno, M. I. (1999). Cortical surface-based analysis. I.Segmentation and surface reconstruction. NeuroImage, 9(2):179–194.
Damasio, H. and Damasio, A. R. (1980). The anatomical basis of conduction aphasia.Brain, 103(2):337–350.
Darley, F. L., Aronson, A. E., and Brown, J. R. (1975). Motor speech disorders. Saunders.
Daum, I., Schugens, M. M., Ackermann, H., Lutzenberger, W., Dichgans, J., and Bir-baumer, N. (1993). Classical conditioning after cerebellar lesions in humans. Behavioralneuroscience, 107(5):748–756.
Decety, J. (1996). Do imagined and executed actions share the same neural substrate?Brain research Cognitive brain research, 3(2):87–93.
Dehaene-Lambertz, G., Dehaene, S., and Hertz-Pannier, L. (2002). Functional neuroimag-ing of speech perception in infants. Science, 298(5600):2013–2015.
Deiber, M. P., Honda, M., Ibanez, V., Sadato, N., and Hallett, M. (1999). Mesial motorareas in self-initiated versus externally triggered movements examined with fMRI: effectof movement type and rate. Journal of neurophysiology, 81(6):3065–3077.
DeJarnette, G. (1988). Formant frequencies (F1, F2) of jaw-free versus jaw-fixed vowels innormal and articulatory disordered children. Perceptual and motor skills, 67(3):963–971.

149
Demonet, J. F., Price, C., Wise, R., and Frackowiak, R. S. (1994). Differential activationof right and left posterior sylvian regions by semantic and phonological tasks: a positron-emission tomography study in normal human subjects. Neuroscience letters, 182(1):25–28.
di Pellegrino, G., Fadiga, L., Fogassi, L., Gallese, V., and Rizzolatti, G. (1992). Un-derstanding motor events: a neurophysiological study. Experimental brain research,91(1):176–180.
Didic, M., Ceccaldi, M., and Poncet, M. (1998). Progressive loss of speech: a neuropsy-chological profile of premotor dysfunction. European neurology, 39(2):90–96.
Dimitrova, A., Weber, J., Maschke, M., Elles, H. G., Kolb, F. P., Forsting, M., Diener,H. C., and Timmann, D. (2002). Eyeblink-related areas in human cerebellum as shownby fMRI. Human brain mapping, 17(2):100–115.
Dow, R. S. and Moruzzi, G. (1958). The physiology and pathology of the cerebellum.University of Minnesota Press.
Dronkers, N. F. (1996). A new brain region for coordinating speech articulation. Nature,384(6605):159–161.
Duffau, H., Capelle, L., Denvil, D., Gatignol, P., Sichez, N., Lopes, M., Sichez, J. P., andEffenterre, R. V. (2003). The role of dominant premotor cortex in language: a studyusing intraoperative functional mapping in awake patients. NeuroImage, 20(4):1903–1914.
Duffy, J. R. (1995). Motor speech disorders substrates, differential diagnosis, and manage-ment, volume 1st ed. Mosby.
Duhamel, J. R., Colby, C. L., and Goldberg, M. E. (1992). The updating of the rep-resentation of visual space in parietal cortex by intended eye movements. Science,255(5040):90–92.
Dum, R. P. and Strick, P. L. (2003). An unfolded map of the cerebellar dentate nucleusand its projections to the cerebral cortex. Journal of neurophysiology, 89(1):634–639.
Eliades, S. J. and Wang, X. (2003). Sensory-motor interaction in the primate auditorycortex during self-initiated vocalizations. Journal of neurophysiology, 89(4):2194–2207.
Engelien, A., Yang, Y., Engelien, W., Zonana, J., Stern, E., and Silbersweig, D. A. (2002).Physiological mapping of human auditory cortices with a silent event-related fMRI tech-nique. NeuroImage, 16(4):944–953.
Etard, O., Mellet, E., Papathanassiou, D., Benali, K., Houde, O., Mazoyer, B., andTzourio-Mazoyer, N. (2000). Picture naming without Broca’s and Wernicke’s area.Neuroreport, 11(3):617–622.

150
Fadiga, L., Craighero, L., Buccino, G., and Rizzolatti, G. (2002). Speech listening specifi-cally modulates the excitability of tongue muscles: a TMS study. The European journalof neuroscience, 15(2):399–402.
Fiala, J. C., Grossberg, S., and Bullock, D. (1996). Metabotropic glutamate receptoractivation in cerebellar purkinje cells as substrate for adaptive timing of the classicallyconditioned eye-blink response. The Journal of neuroscience, 16(11):3760–3774.
Fiez, J. A. and Petersen, S. E. (1998). Neuroimaging studies of word reading. Proceedingsof the National Academy of Sciences of the United States of America, 95(3):914–921.
Fink, G. R., Marshall, J. C., Halligan, P. W., Frith, C. D., Driver, J., Frackowiak, R. S.,and Dolan, R. J. (1999). The neural consequences of conflict between intention and thesenses. Brain, 122 ( Pt 3):497–512.
Fischl, B., Sereno, M. I., and Dale, A. M. (1999). Cortical surface-based analysis. II:Inflation, flattening, and a surface-based coordinate system. NeuroImage, 9(2):195–207.
Fischl, B., van der, K. A., Destrieux, C., Halgren, E., Segonne, F., Salat, D. H., Busa, E.,Seidman, L. J., Goldstein, J., Kennedy, D., Caviness, V., Makris, N., Rosen, B., andDale, A. M. (2004). Automatically parcellating the human cerebral cortex. Cerebralcortex, 14(1):11–22.
Flament, D. and Hore, J. (1986). Movement and electromyographic disorders associatedwith cerebellar dysmetria. Journal of neurophysiology, 55(6):1221–1233.
Fowler, C. A. and Turvey, M. T. (1981). Immediate compensation in bite-block speech.Phonetica, 37(5-6):306–326.
Freed, D. B. (2000). Motor speech disorders diagnosis and treatment. Singular Pub.Group.
Fried, I., Katz, A., McCarthy, G., Sass, K. J., Williamson, P., Spencer, S. S., and Spencer,D. D. (1991). Functional organization of human supplementary motor cortex studiedby electrical stimulation. The Journal of neuroscience, 11(11):3656–3666.
Friston, K. J., Ashburner, J., Holmes, A., and Poline, J. (2002). Statistical parametericmapping. Computer software. [http://www.fil.ion.ucl.ac.uk/spm/].
Friston, K. J., Frith, C. D., Passingham, R. E., Liddle, P. F., and Frackowiak, R. S.(1992). Motor practice and neurophysiological adaptation in the cerebellum: a positrontomography study. Proceedings of the Royal Society of London Series B Biologicalsciences, 248(1323):223–228.
Frith, C. D., Friston, K. J., Liddle, P. F., and Frackowiak, R. S. (1991). A PET study ofword finding. Neuropsychologia, 29(12):1137–1148.
Gelfand, J. R. and Bookheimer, S. Y. (2003). Dissociating neural mechanisms of temporalsequencing and processing phonemes. Neuron, 38(5):831–842.

151
Gentil, M. (1990a). Acoustic characteristics of speech in Friedreich’s disease. Foliaphoniatrica, 42(3):125–134.
Gentil, M. (1990b). Dysarthria in Friedreich disease. Brain and language, 38(3):438–448.
Georgopoulos, A. P., Crutcher, M. D., and Schwartz, A. B. (1989). Cognitive spatial-motorprocesses. 3. Motor cortical prediction of movement direction during an instructed delayperiod. Experimental brain research, 75(1):183–194.
Gerwig, M., Dimitrova, A., Kolb, F. P., Maschke, M., Brol, B., Kunnel, A., Boring, D.,Thilmann, A. F., Forsting, M., Diener, H. C., and Timmann, D. (2003). Comparison ofeyeblink conditioning in patients with superior and posterior inferior cerebellar lesions.Brain, 126(Pt 1):71–94.
Gerwig, M., Dimitrova, A., Maschke, M., Kolb, F. P., Forsting, M., and Timmann, D.(2004). Amplitude changes of unconditioned eyeblink responses in patients with cere-bellar lesions. Experimental brain research.
Geschwind, N. (1965). Disconnexion syndromes in animals and man. II. Brain, 88(3):585–644.
Goffman, L. and Smith, A. (1999). Development and phonetic differentiation of speechmovement patterns. Journal of Experimental Psychology-Human Perception and Per-formance, 25(3):649–660.
Golestani, N. and Zatorre, R. J. (2004). Learning new sounds of speech: reallocation ofneural substrates. NeuroImage, 21(2):494–506.
Gordon, A. M., Casabona, A., and Soechting, J. F. (1994). The learning of novel fingermovement sequences. Journal of neurophysiology, 72(4):1596–1610.
Grafton, S. T., Mazziotta, J. C., Woods, R. P., and Phelps, M. E. (1992). Humanfunctional anatomy of visually guided finger movements. Brain, 115 ( Pt 2):565–587.
Greenlee, J. D., Oya, H., Kawasaki, H., Volkov, I. O., Kaufman, O. P., Kovach, C. K.,Howard, M. A., and Brugge, J. F. (2004). A functional connection between inferiorfrontal gyrus and orofacial motor cortex in human. Journal of neurophysiology.
Guenther, F. H. (1994). A neural network model of speech acquisition and motor equivalentspeech production. Biological cybernetics, 72(1):43–53.
Guenther, F. H. (1995). Speech sound acquisition, coarticulation, and rate effects in aneural network model of speech production. Psychological review, 102(3):594–621.
Guenther, F. H., Espy-Wilson, C. Y., Boyce, S. E., Matthies, M. L., Zandipour, M., andPerkell, J. S. (1999). Articulatory tradeoffs reduce acoustic variability during AmericanEnglish /r/ production. The Journal of the Acoustical Society of America, 105(5):2854–2865.

152
Guenther, F. H. and Ghosh, S. S. (2003). A model of cortical and cerebellar function inspeech. In 15th International Congress of Phonetic Sciences, Barcelona, Spain, pages169–173.
Guenther, F. H., Ghosh, S. S., and Nieto-Castanon, A. (2003). A neural model of speechproduction. In Proceedings of the 6th International Seminar on Speech Production,Sydney, Australia, pages 85–90.
Guenther, F. H., Hampson, M., and Johnson, D. (1998). A theoretical investigation of ref-erence frames for the planning of speech movements. Psychological review, 105(4):611–633.
Haggard, P. and Magno, E. (1999). Localising awareness of action with transcranialmagnetic stimulation. Experimental brain research, 127(1):102–107.
Haggard, P., Newman, C., and Magno, E. (1999). On the perceived time of voluntaryactions. The British journal of psychology, 90 ( Pt 2):291–303.
Hamstra-Bletz, L. and Blote, A. W. (1990). Development of handwriting in primaryschool: a longitudinal study. Perceptual and motor skills, 70(3 Pt 1):759–770.
Hashimoto, Y. and Sakai, K. L. (2003). Brain activations during conscious self-monitoringof speech production with delayed auditory feedback: an fMRI study. Human brainmapping, 20(1):22–28.
Heim, S., Opitz, B., Muller, K., and Friederici, A. D. (2003). Phonological processingduring language production: fMRI evidence for a shared production-comprehension net-work. Brain research Cognitive brain research, 16(2):285–296.
Henry, R. G., Berman, J. I., Nagarajan, S. S., Mukherjee, P., and Berger, M. S. (2004).Subcortical pathways serving cortical language sites: initial experience with diffusiontensor imaging fiber tracking combined with intraoperative language mapping. Neu-roImage, 21(2):616–622.
Hickok, G., Buchsbaum, B., Humphries, C., and Muftuler, T. (2003). Auditory-motorinteraction revealed by fMRI: speech, music, and working memory in area SPT. Journalof cognitive neuroscience, 15(5):673–682.
Hickok, G., Erhard, P., Kassubek, J., Helms-Tillery, A. K., Naeve-Velguth, S., Strupp, J. P.,Strick, P. L., and Ugurbil, K. (2000). A functional magnetic resonance imaging studyof the role of left posterior superior temporal gyrus in speech production: implicationsfor the explanation of conduction aphasia. Neuroscience letters, 287(2):156–160.
Hickok, G. and Poeppel, D. (2000). Towards a functional neuroanatomy of speech percep-tion. Trends in cognitive sciences, 4(4):131–138.
Hirose, H. (1986). Pathophysiology of motor speech disorders (dysarthria). Folia phoni-atrica, 38(2-4):61–88.

153
Hobart, D. J., Kelley, D. L., and Bradley, L. S. (1975). Modifications occurring duringacquisition of a novel throwing task. American journal of physical medicine, 54(1):1–24.
Hore, J., Meyer-Lohmann, J., and Brooks, V. B. (1977). Basal ganglia cooling dis-ables learned arm movements of monkeys in the absence of visual guidance. Science,195(4278):584–586.
Hore, J., Timmann, D., and Watts, S. (2002). Disorders in timing and force of finger open-ing in overarm throws made by cerebellar subjects. Annals of the New York Academyof Sciences, 978:1–15.
Houde, J. F. and Jordan, M. I. (1998). Sensorimotor adaptation in speech production.Science, 279(5354):1213–1216.
Houde, J. F. and Jordan, M. I. (2002). Sensorimotor adaptation of speech i: Compensationand adaptation. Journal of speech, language, and hearing research, 45(2):295–310.
Houde, J. F., Nagarajan, S. S., Sekihara, K., and Merzenich, M. M. (2002). Modulationof the auditory cortex during speech: an MEG study. Journal of cognitive neuroscience,14(8):1125–1138.
Iacoboni, M., Woods, R. P., Brass, M., Bekkering, H., Mazziotta, J. C., and Rizzolatti, G.(1999). Cortical mechanisms of human imitation. Science, 286(5449):2526–2528.
Indefrey, P. and Levelt, W. J. M. (2004). The spatial and temporal signatures of wordproduction components. Cognition, 92(1-2):101–144.
Inhoff, A. W., Diener, H. C., Rafal, R. D., and Ivry, R. (1989). The role of cerebellarstructures in the execution of serial movements. Brain, 112 ( Pt 3):565–581.
Ivry, R. (1997). Cerebellar timing systems. International review of neurobiology, 41:555–573.
Ivry, R. B., Keele, S. W., and Diener, H. C. (1988). Dissociation of the lateral and medialcerebellum in movement timing and movement execution. Experimental brain research,73(1):167–180.
Jaeger, M., Hertrich, I., Stattrop, U., Schonle, P. W., and Ackermann, H. (2000). Speechdisorders following severe traumatic brain injury: kinematic analysis of syllable repeti-tions using electromagnetic articulography. Folia phoniatrica et logopaedica, 52(4):187–196.
Jenkins, I. H. and Frackowiak, R. S. (1993). Functional studies of the human cerebellumwith positron emission tomography. Revue neurologique, 149(11):647–653.
Jiang, W., Chapman, C. E., and Lamarre, Y. (1990a). Modulation of somatosensoryevoked responses in the primary somatosensory cortex produced by intracortical micros-timulation of the motor cortex in the monkey. Experimental brain research, 80(2):333–344.

154
Jiang, W., Chapman, C. E., and Lamarre, Y. (1991). Modulation of the cutaneousresponsiveness of neurones in the primary somatosensory cortex during conditioned armmovements in the monkey. Experimental brain research, 84(2):342–354.
Jiang, W., Lamarre, Y., and Chapman, C. E. (1990b). Modulation of cutaneous corticalevoked potentials during isometric and isotonic contractions in the monkey. Brainresearch, 536(1-2):69–78.
Johnson, P. B., Ferraina, S., Bianchi, L., and Caminiti, R. (1996). Cortical networks forvisual reaching: physiological and anatomical organization of frontal and parietal lobearm regions. Cerebral cortex, 6(2):102–119.
Jusczyk, P. W. (1999). How infants begin to extract words from speech. Trends incognitive sciences, 3(9):323–328.
Kalaska, J. F., Cohen, D. A., Hyde, M. L., and Prud’homme, M. (1989). A comparisonof movement direction-related versus load direction-related activity in primate motorcortex, using a two-dimensional reaching task. The Journal of neuroscience, 9(6):2080–2102.
Kalaska, J. F. and Crammond, D. J. (1995). Deciding not to GO: neuronal correlatesof response selection in a GO/NOGO task in primate premotor and parietal cortex.Cerebral cortex, 5(5):410–428.
Kandel, E. R., Schwartz, J. H., and Jessell, T. M. (2000). Principles of neural science,volume 4th ed. McGraw-Hill, Health Professions Division.
Kawato, M. and Gomi, H. (1992). A computational model of four regions of the cerebellumbased on feedback-error learning. Biological cybernetics, 68(2):95–103.
Keele, S. W. and Ivry, R. (1990). Does the cerebellum provide a common computationfor diverse tasks? A timing hypothesis. Annals of the New York Academy of Sciences,608:179–207.
Kelly, R. M. and Strick, P. L. (2003). Cerebellar loops with motor cortex and prefrontalcortex of a nonhuman primate. The Journal of neuroscience, 23(23):8432–8444.
Kelso, J. A., Tuller, B., Vatikiotis-Bateson, E., and Fowler, C. A. (1984). Functionallyspecific articulatory cooperation following jaw perturbations during speech: evidencefor coordinative structures. Journal of experimental psychology Human perception andperformance, 10(6):812–832.
Kent, R. and Netsell, R. (1975). A case study of an ataxic dysarthric: cineradiographic andspectrographic observations. The Journal of speech and hearing disorders, 40(1):115–134.
Kent, R. D., Duffy, J. R., Slama, A., Kent, J. F., and Clift, A. (2001). Clinicoanatomicstudies in dysarthria: review, critique, and directions for research. Journal of speech,language, and hearing research, 44(3):535–551.

155
Kent, R. D., Kent, J. F., Duffy, J. R., Thomas, J. E., Weismer, G., and Stuntebeck,S. (2000a). Ataxic dysarthria. Journal of speech, language, and hearing research,43(5):1275–1289.
Kent, R. D., Kent, J. F., Rosenbek, J. C., Vorperian, H. K., and Weismer, G. (1997).A speaking task analysis of the dysarthria in cerebellar disease. Folia phoniatrica etlogopaedica, 49(2):63–82.
Kent, R. D., Kent, J. F., Weismer, G., and Duffy, J. R. (2000b). What dysarthrias cantell us about the neural control of speech. Journal of Phonetics, 28(3):273–302.
Kent, R. D., Netsell, R., and Abbs, J. H. (1979). Acoustic characteristics of dysarthriaassociated with cerebellar disease. Journal of speech and hearing research, 22(3):627–648.
Klopf, A. H. (1982). The hedonistic neuron a theory of memory, learning, and intelligence.Hemisphere Pub. Corp.
Kohler, E., Keysers, C., Umilta, M. A., Fogassi, L., Gallese, V., and Rizzolatti, G. (2002).Hearing sounds, understanding actions: action representation in mirror neurons. Sci-ence, 297(5582):846–848.
Krainik, A., Lehericy, S., Duffau, H., Capelle, L., Chainay, H., Cornu, P., Cohen, L., Boch,A. L., Mangin, J. F., Bihan, D. L., and Marsault, C. (2003). Postoperative speechdisorder after medial frontal surgery: role of the supplementary motor area. Neurology,60(4):587–594.
Krams, M., Rushworth, M. F., Deiber, M. P., Frackowiak, R. S., and Passingham, R. E.(1998). The preparation, execution and suppression of copied movements in the humanbrain. Experimental brain research, 120(3):386–398.
Kuo, W. J., Yeh, T. C., Lee, C. Y., Wu, Y. T., Chou, C. C., Ho, L. T., Hung, D. L., Tzeng,O. J., and Hsieh, J. C. (2003). Frequency effects of Chinese character processing in thebrain: an event-related fMRI study. NeuroImage, 18(3):720–730.
Lang, E. J. and Rosenbluth, J. (2003). Role of myelination in the development of a uniformolivocerebellar conduction time. Journal of neurophysiology, 89(4):2259–2270.
Le, T. H., Patel, S., and Roberts, T. P. (2001). Functional MRI of human auditory cortexusing block and event-related designs. Magnetic resonance in medicine, 45(2):254–260.
Lebedev, M. A. and Nelson, R. J. (1995). Rhythmically firing (20-50 hz) neurons in monkeyprimary somatosensory cortex: activity patterns during initiation of vibratory-cued handmovements. Journal of computational neuroscience, 2(4):313–334.
Lee, K. M., Chang, K. H., and Roh, J. K. (1999). Subregions within the supplemen-tary motor area activated at different stages of movement preparation and execution.NeuroImage, 9(1):117–123.

156
Lurie, B. J. and Enright, P. J. (2000). Classical feedback control with MATLAB, volume 6.Marcel Dekker.
MacDonald, P. A. and Paus, T. (2003). The role of parietal cortex in awareness of self-generated movements: a transcranial magnetic stimulation study. Cerebral Cortex,13(9):962–967.
MacKay, D. N. and Bankhead, I. (1983). Fine motor performance in subjects of subnor-mal, normal and superior intelligence. II. Reaction time and warning interval duration.Journal of mental deficiency research, 27 (Pt 2):125–132.
MacSweeney, M., Amaro, E., Calvert, G. A., Campbell, R., David, A. S., McGuire, P.,Williams, S. C. R., Woll, B., and Brammer, M. J. (2000). Silent speechreading in theabsence of scanner noise: an event-related fMRI study. Neuroreport, 11(8):1729–1733.
Macwhinney, B., Cohen, J., and Provost, J. (1997). The psyscope experiment-buildingsystem. Spatial vision, 11(1):99–101.
Maeda, S. (1990). Compensatory articulation during speech: Evidence from the analysisand synthesis of vocal tract shapes using an articulatory model. In Hardcastle, W. J. andMarchal, A., editors, Speech production and speech modeling, pages 131 –149. KluwerAcademic Publishers.
Marr, D. (1969). A theory of cerebellar cortex. The Journal of physiology, 202(2):437–470.
Mattys, S. L. and Jusczyk, P. W. (2001). Phonotactic cues for segmentation of fluentspeech by infants. Cognition, 78(2):91–121.
Mazoyer, B. M., Tzourio, N., Frak, V., Syrota, A., Murayama, N., Levrier, O., Salamon,G., Dehaene, S., Cohen, L., and Mehler, J. (1993). The cortical representation of speech.Journal of Cognitive Neuroscience, 5(4):467–479.
McClean, M. D., Dostrovsky, J. O., Lee, L., and Tasker, R. R. (1990). Somatosensoryneurons in human thalamus respond to speech-induced orofacial movements. Brainresearch, 513(2):343–347.
McGuire, P. K., Silbersweig, D. A., and Frith, C. D. (1996a). Functional neuroanatomyof verbal self-monitoring. Brain, 119:907–917.
McGuire, P. K., Silbersweig, D. A., Murray, R. M., David, A. S., Frackowiak, R. S. J., andFrith, C. D. (1996b). Functional anatomy of inner speech and auditory verbal imagery.Psychological Medicine, 26(1):29–38.
Meulenbroek, R. G. and van Galen, G. P. (1988). Foreperiod duration and the analysis ofmotor stages in a line-drawing task. Acta psychologica, 69(1):19–34.
Meyer, B. U., Werhahn, K., Rothwell, J. C., Roericht, S., and Fauth, C. (1994). Functionalorganisation of corticonuclear pathways to motoneurones of lower facial muscles in man.Experimental brain research, 101(3):465–472.
157
Meyer-Lohmann, J., Conrad, B., Matsunami, K., and Brooks, V. B. (1975). Effects ofdentate cooling on precentral unit activity following torque pulse injections into elbowmovements. Brain research, 94(2):237–251.
Meyer-Lohmann, J., Hore, J., and Brooks, V. B. (1977). Cerebellar participation ingeneration of prompt arm movements. Journal of neurophysiology, 40(5):1038–1050.
Miall, R. C. (1983). Program for the online analysis and display of neuronal activity.Medical & biological engineering & computing, 21(6):771–775.
Miall, R. C. (2003). Connecting mirror neurons and forward models. Neuroreport,14(17):2135–2137.
Miall, R. C., Weir, D. J., Wolpert, D. M., and Stein, J. F. (1993). Is the cerebellum aSmith predictor? Journal of motor behavior, 25(3):203–216.
Middleton, F. A. and Strick, P. L. (1997). Cerebellar output channels. Internationalreview of neurobiology, 41:61–82.
Middleton, F. A. and Strick, P. L. (2000). Basal ganglia and cerebellar loops: motor andcognitive circuits. Brain research Brain research reviews, 31(2-3):236–250.
Miller, J. D. (1989). Auditory-perceptual interpretation of the vowel. The Journal of theAcoustical Society of America, 85(5):2114–2134.
Moore, C. I., Stern, C. E., Corkin, S., Fischl, B., Gray, A. C., Rosen, B. R., and Dale,A. M. (2000). Segregation of somatosensory activation in the human rolandic cortexusing fMRI. Journal of neurophysiology, 84(1):558–569.
Moore, S. P. and Marteniuk, R. G. (1986). Kinematic and electromyographic changesthat occur as a function of learning a time-constrained aiming task. Journal of motorbehavior, 18(4):397–426.
Morasso, P., Sanguineti, V., and Frisone, F. (2001). Cortical maps as topology-representingneural networks applied to motor control: Articulatory speech synthesis. In Master-broek, K. A. H. and Vos, J. E., editors, Plausible neural networks for biological modelling.Kluwer.
Murphy, K., Corfield, D. R., Guz, A., Fink, G. R., Wise, R. J., Harrison, J., and Adams,L. (1997). Cerebral areas associated with motor control of speech in humans. Journalof applied physiology, 83(5):1438–1447.
Nagasaki, H. (1989). Asymmetric velocity and acceleration profiles of human arm move-ments. Experimental brain research, 74(2):319–326.
Nieto-Castanon, A., Ghosh, S. S., Tourville, J. A., and Guenther, F. H. (2003). Region ofinterest based analysis of functional imaging data. NeuroImage, 19(4):1303–1316.

158
Nieto-Castanon, A., Guenther, F. H., Perkell, J. S., and Curtin, H. D. (2004). A modelinginvestigation of articulatory variability and acoustic stability during American English/r/ production. Submitted for publication.
Normand, M. C., Lagasse, P. P., Rouillard, C. A., and Tremblay, L. E. (1982). Modifi-cations occurring in motor programs during learning of a complex task in man. Brainresearch, 241(1):87–93.
Numminen, J. and Curio, G. (1999). Differential effects of overt, covert and replayedspeech on vowel-evoked responses of the human auditory cortex. Neuroscience letters,272(1):29–32.
Numminen, J., Salmelin, R., and Hari, R. (1999). Subject’s own speech reduces reactivityof the human auditory cortex. Neuroscience letters, 265(2):119–122.
O’Brien, J. H., Pimpaneau, A., and Albe-Fessard, D. (1971). Evoked cortical responses tovagal, laryngeal and facial afferents in monkeys under chloralose anaesthesia. Electroen-cephalography and clinical neurophysiology, 31(1):7–20.
Okada, K., Smith, K. R., Humphries, C., and Hickok, G. (2003). Word length mod-ulates neural activity in auditory cortex during covert object naming. Neuroreport,14(18):2323–2326.
Olson, J. M. and Marsh, R. L. (1998). Activation patterns and length changes in hindlimbmuscles of the bullfrog Rana catesbeiana during jumping. The Journal of experimentalbiology, 201 ( Pt 19):2763–2777.
Oomen, C. C., Postma, A., and Kolk, H. H. (2001). Prearticulatory and postarticulatoryself-monitoring in Broca’s aphasia. Cortex, 37(5):627–641.
Papanicolaou, A. C., Eisenberg, H. M., and Levy, R. S. (1983). Evoked potential corre-lates of left hemisphere dominance in covert articulation. The International journal ofneuroscience, 20(3-4):289–293.
Papanicolaou, A. C., Raz, N., Loring, D. W., and Eisenberg, H. M. (1986). Brain stemevoked response suppression during speech production. Brain and language, 27(1):50–55.
Papathanassiou, D., Etard, O., Mellet, E., Zago, L., Mazoyer, B., and Tzourio-Mazoyer, N.(2000). A common language network for comprehension and production: a contributionto the definition of language epicenters with PET. NeuroImage, 11(4):347–357.
Passingham, R. E. (1993). The frontal lobes and voluntary action. Oxford UniversityPress.
Penhune, V. B., Zattore, R. J., and Evans, A. C. (1998). Cerebellar contributions to motortiming: a PET study of auditory and visual rhythm reproduction. Journal of cognitiveneuroscience, 10(6):752–765.

159
Perkell, J. S., Cohen, M. H., Svirsky, M. A., Matthies, M. L., Garabieta, I., and Jackson,M. T. (1992). Electromagnetic midsagittal articulometer systems for transducing speecharticulatory movements. The Journal of the Acoustical Society of America, 92(6):3078–3096.
Petersen, S. E., Fox, P. T., Posner, M. I., Mintun, M., and Raichle, M. E. (1988). Positronemission tomographic studies of the cortical anatomy of single-word processing. Nature,331(6157):585–589.
Picard, N. and Strick, P. L. (1996). Motor areas of the medial wall: a review of theirlocation and functional activation. Cerebral cortex, 6(3):342–353.
Pinto, S., Thobois, S., Costes, N., Bars, D. L., Benabid, A. L., Broussolle, E., Pollak, P.,and Gentil, M. (2004). Subthalamic nucleus stimulation and dysarthria in Parkinson’sdisease: a PET study. Brain, 127(Pt 3):602–615.
Porro, C. A., Francescato, M. P., Cettolo, V., Diamond, M. E., Baraldi, P., Zuiani, C.,Bazzocchi, M., and di Prampero, P. E. (1996). Primary motor and sensory cortex acti-vation during motor performance and motor imagery: a functional magnetic resonanceimaging study. The Journal of neuroscience, 16(23):7688–7698.
Portier, S. J., van Galen, G. P., and Meulenbroek, R. G. (1990). Practice and the dynamicsof handwriting performance: evidence for a shift of motor programming load. Journalof motor behavior, 22(4):474–492.
Postma, A. (2000). Detection of errors during speech production: a review of speechmonitoring models. Cognition, 77(2):97–132.
Pouget, A., Deneve, S., and Duhamel, J. R. (2002). A computational perspective onthe neural basis of multisensory spatial representations. Nature Reviews Neuroscience,3(9):741–747.
Price, C. J., Wise, R. J., Warburton, E. A., Moore, C. J., Howard, D., Patterson, K.,Frackowiak, R. S., and Friston, K. J. (1996). Hearing and saying. The functionalneuro-anatomy of auditory word processing. Brain, 119 ( Pt 3):919–931.
Rack, P. M. H. (1981). Limitations of somatosensory feedback in control of posture andmovement, pages 229–256. American Physiological Society.
Raichle, M. E. (1996). What words are telling us about the brain. Cold Spring Harborsymposia on quantitative biology, 61:9–14.
Raichle, M. E., Fiez, J. A., Videen, T. O., MacLeod, A. M., Pardo, J. V., Fox, P. T., andPetersen, S. E. (1994). Practice-related changes in human brain functional anatomyduring nonmotor learning. Cerebral cortex, 4(1):8–26.
Ramnani, N., Toni, I., Passingham, R. E., and Haggard, P. (2001). The cerebellumand parietal cortex play a specific role in coordination: a PET study. NeuroImage,14(4):899–911.
160
Rao, S. M., Binder, J. R., Bandettini, P. A., Hammeke, T. A., Yetkin, F. Z., Jesmanowicz,A., Lisk, L. M., Morris, G. L., Mueller, W. M., and and, L. D. E. (1993). Functionalmagnetic resonance imaging of complex human movements. Neurology, 43(11):2311–2318.
Rhodes, B. J. and Bullock, D. (2002). A scalable model of cerebellar adaptive timing andsequencing: The recurrent slide and latch (RSL) model. Applied Intelligence, 17(1):35–48.
Riecker, A., Ackermann, H., Wildgruber, D., Dogil, G., and Grodd, W. (2000a). Oppositehemispheric lateralization effects during speaking and singing at motor cortex, insulaand cerebellum. Neuroreport, 11(9):1997–2000.
Riecker, A., Ackermann, H., Wildgruber, D., Meyer, J., Dogil, G., Haider, H., and Grodd,W. (2000b). Articulatory/phonetic sequencing at the level of the anterior perisylviancortex: a functional magnetic resonance imaging (fMRI) study. Brain and language,75(2):259–276.
Riecker, A., Wildgruber, D., Grodd, W., and Ackermann, H. (2002). Reorganization ofspeech production at the motor cortex and cerebellum following capsular infarction: afollow-up functional magnetic resonance imaging study. Neurocase, 8(6):417–423.
Rizzolatti, G. and Arbib, M. A. (1998). Language within our grasp. Trends in neuro-sciences, 21(5):188–194.
Rizzolatti, G. and Fadiga, L. (1998). Grasping objects and grasping action meanings:the dual role of monkey rostroventral premotor cortex (area F5). Novartis Foundationsymposium, 218:81–95.
Rizzolatti, G., Fadiga, L., Gallese, V., and Fogassi, L. (1996a). Premotor cortex and therecognition of motor actions. Brain research Cognitive brain research, 3(2):131–141.
Rizzolatti, G., Fadiga, L., Matelli, M., Bettinardi, V., Paulesu, E., Perani, D., and Fazio,F. (1996b). Localization of grasp representations in humans by PET: 1. Observationversus execution. Experimental brain research, 111(2):246–252.
Roland, P. E., Eriksson, L., Widen, L., and Stone-Elander, S. (1989). Changes in regionalcerebral oxidative metabolism induced by tactile learning and recognition in man. TheEuropean journal of neuroscience, 1(1):3–18.
Rouiller, E. M., Liang, F., Babalian, A., Moret, V., and Wiesendanger, M. (1994). Cerebel-lothalamocortical and pallidothalamocortical projections to the primary and supplemen-tary motor cortical areas: a multiple tracing study in macaque monkeys. The Journalof comparative neurology, 345(2):185–213.
Rushworth, M. F., Krams, M., and Passingham, R. E. (2001). The attentional role of theleft parietal cortex: the distinct lateralization and localization of motor attention in thehuman brain. Journal of cognitive neuroscience, 13(5):698–710.

161
Rushworth, M. F., Nixon, P. D., and Passingham, R. E. (1997). Parietal cortex and move-ment. I. Movement selection and reaching. Experimental brain research, 117(2):292–310.
Sakai, S. T., Inase, M., and Tanji, J. (1996). Comparison of cerebellothalamic and palli-dothalamic projections in the monkey (Macaca fuscata): a double anterograde labelingstudy. The Journal of comparative neurology, 368(2):215–228.
Sakai, S. T., Inase, M., and Tanji, J. (1999). Pallidal and cerebellar inputs to thala-mocortical neurons projecting to the supplementary motor area in macaca fuscata: atriple-labeling light microscopic study. Anatomy and embryology, 199(1):9–19.
Sakai, S. T., Inase, M., and Tanji, J. (2002). The relationship between M1 and SMAafferents and cerebellar and pallidal efferents in the macaque monkey. Somatosensory& motor research, 19(2):139–148.
Salthouse, T. A. (1986a). Effects of practice on a typing-like keying task. Acta psycholog-ica, 62(2):189–198.
Salthouse, T. A. (1986b). Perceptual, cognitive, and motoric aspects of transcriptiontyping. Psychological bulletin, 99(3):303–319.
Sanes, J. N., Dimitrov, B., and Hallett, M. (1990). Motor learning in patients withcerebellar dysfunction. Brain, 113 ( Pt 1):103–120.
Santi, A., Servos, P., Vatikiotis-Bateson, E., Kuratate, T., and Munhall, K. (2003). Per-ceiving biological motion: dissociating visible speech from walking. Journal of cognitiveneuroscience, 15(6):800–809.
Schmahmann, J. D. (1997). The cerebellum and cognition. Academic Press.
Schmahmann, J. D. (2000). MRI atlas of the human cerebellum. Academic Press.
Schmahmann, J. D. and Pandya, D. N. (1989). Anatomical investigation of projectionsto the basis pontis from posterior parietal association cortices in rhesus monkey. TheJournal of comparative neurology, 289(1):53–73.
Schmahmann, J. D. and Pandya, D. N. (1990). Anatomical investigation of projectionsfrom thalamus to posterior parietal cortex in the rhesus monkey: a WGA-HRP andfluorescent tracer study. The Journal of comparative neurology, 295(2):299–326.
Schmahmann, J. D. and Pandya, D. N. (1991). Projections to the basis pontis fromthe superior temporal sulcus and superior temporal region in the rhesus monkey. TheJournal of comparative neurology, 308(2):224–248.
Schmahmann, J. D. and Pandya, D. N. (1997). The cerebrocerebellar system. Interna-tional review of neurobiology, 41:31–60.
Schonle, P. W. and Conrad, B. (1990). Differential effects of automatic versus spontaneousspeech on peak velocity of inspiratory movements. Folia phoniatrica, 42(5):239–244.

162
Schroeder, C. E. and Foxe, J. J. (2002). The timing and laminar profile of converginginputs to multisensory areas of the macaque neocortex. Brain research Cognitive brainresearch, 14(1):187–198.
Schubotz, R. I. and von Cramon, D. Y. (2003). Functional-anatomical concepts of humanpremotor cortex: evidence from fMRI and PET studies. NeuroImage, 20(Supplement1):S120–S131.
Schubotz, R. I., von Cramon, D. Y., and Lohmann, G. (2003). Auditory what, where, andwhen: a sensory somatotopy in lateral premotor cortex. NeuroImage, 20(1):173–185.
Schulz, G. M., Dingwall, W. O., and Ludlow, C. L. (1999). Speech and oral motor learningin individuals with cerebellar atrophy. Journal of speech, language, and hearing research,42(5):1157–1175.
Schwartz, J.-L. and Boe, L.-J. (2000). Predicting palatal contacts from jaw and tonguecommands: a new sensory model and its potential use in speech control. In Proceedingsof the 5th Seminar On Speech Production: Models and Data. Institut fuer Phonetik undSprachliche Kommunikation.
Schweighofer, N., Arbib, M. A., and Kawato, M. (1998a). Role of the cerebellum inreaching movements in humans. I. Distributed inverse dynamics control. The Europeanjournal of neuroscience, 10(1):86–94.
Schweighofer, N., Spoelstra, J., Arbib, M. A., and Kawato, M. (1998b). Role of thecerebellum in reaching movements in humans. II. A neural model of the intermediatecerebellum. The European journal of neuroscience, 10(1):95–105.
Seidler, R. D., Purushotham, A., Kim, S. G., Ugurbil, K., Willingham, D., and Ashe,J. (2002). Cerebellum activation associated with performance change but not motorlearning. Science, 296(5575):2043–2046.
Seitz, R. J., Canavan, A. G., Yaguez, L., Herzog, H., Tellmann, L., Knorr, U., Huang, Y.,and Homberg, V. (1997). Representations of graphomotor trajectories in the humanparietal cortex: evidence for controlled processing and automatic performance. TheEuropean journal of neuroscience, 9(2):378–389.
Sharkey, S. G. and Folkins, J. W. (1985). Variability of lip and jaw movements in childrenand adults: implications for the development of speech motor control. Journal of speechand hearing research, 28(1):8–15.
Shinoda, Y., Sugiuchi, Y., Futami, T., and Izawa, R. (1992). Axon collaterals of mossyfibers from the pontine nucleus in the cerebellar dentate nucleus. Journal of neurophys-iology, 67(3):547–560.
Simonyan, K. and Jurgens, U. (2002). Cortico-cortical projections of the motorcorticallarynx area in the rhesus monkey. Brain research, 949(1-2):23–31.

163
Smith, B. L. (1992). Relationships between duration and temporal variability in children’sspeech. The Journal of the Acoustical Society of America, 91(4 Pt 1):2165–2174.
Smith, B. L. (1995). Variability of lip and jaw movements in the speech of children andadults. Phonetica, 52(4):307–316.
Smith, B. L. and Gartenberg, T. E. (1984). Initial observations concerning developmentalcharacteristics of labio-mandibular kinematics. The Journal of the Acoustical Society ofAmerica, 75(5):1599–1605.
Smith, B. L. and Kenney, M. K. (1994). Variability control in speech production tasksperformed by adults and children. The Journal of the Acoustical Society of America,96(2 Pt 1):699–705.
Smith, B. L. and McLean-Muse, A. (1986). Articulatory movement characteristics of labialconsonant productions by children and adults. The Journal of the Acoustical Society ofAmerica, 80(5):1321–1328.
Smith, B. L. and McLean-Muse, A. (1987). Kinematic characteristics of postvocalic labialstop consonants produced by children and adults. Phonetica, 44(4):227–237.
Smith, O. (1959). A controller to overcome dead time. Instrument Society of AmericaJournal, 6(2):28–33.
Spencer, R. M., Zelaznik, H. N., Diedrichsen, J., and Ivry, R. B. (2003). Disruptedtiming of discontinuous but not continuous movements by cerebellar lesions. Science,300(5624):1437–1439.
Spoelstra, J., Schweighofer, N., and Arbib, M. A. (2000). Cerebellar learning of accuratepredictive control for fast-reaching movements. Biological cybernetics, 82(4):321–333.
Stein, J. F. and Glickstein, M. (1992). Role of the cerebellum in visual guidance ofmovement. Physiological reviews, 72(4):967–1017.
Stuart, A., Kalinowski, J., Rastatter, M. P., and Lynch, K. (2002). Effect of delayedauditory feedback on normal speakers at two speech rates. The Journal of the AcousticalSociety of America, 111(5 Pt 1):2237–2241.
Tai, Y. F., Scherfler, C., Brooks, D. J., Sawamoto, N., and Castiello, U. (2004). The humanpremotor cortex is ’mirror’ only for biological actions. Current biology, 14(2):117–120.
Taub, E. and Berman, A. J. (1968). Movement and learning in the absence of sensoryfeedback, pages 173–192. Dorsey.
Thach, W. T. (1975). Timing of activity in cerebellar dentate nucleus and cerebral motorcortex during prompt volitional movement. Brain research, 88(2):233–241.
Thach, W. T. (1978). Correlation of neural discharge with pattern and force of muscularactivity, joint position, and direction of intended next movement in motor cortex andcerebellum. Journal of neurophysiology, 41(3):654–676.

164
Thach, W. T. and Bastian, A. J. (2004). Role of the cerebellum in the control andadaptation of gait in health and disease. Progress in brain research, 143:353–366.
Thach, W. T., Goodkin, H. P., and Keating, J. G. (1992). The cerebellum and the adaptivecoordination of movement. Annual review of neuroscience, 15:403–442.
Thoenissen, D., Zilles, K., and Toni, I. (2002). Differential involvement of parietal andprecentral regions in movement preparation and motor intention. The Journal of neu-roscience, 22(20):9024–9034.
Tokuno, H., Takada, M., Nambu, A., and Inase, M. (1997). Reevaluation of ipsilateralcorticocortical inputs to the orofacial region of the primary motor cortex in the macaquemonkey. The Journal of comparative neurology, 389(1):34–48.
Tomaiuolo, F., MacDonald, J. D., Caramanos, Z., Posner, G., Chiavaras, M., Evans, A. C.,and Petrides, M. (1999). Morphology, morphometry and probability mapping of the parsopercularis of the inferior frontal gyrus: an in vivo MRI analysis. The European journalof neuroscience, 11(9):3033–3046.
Topka, H., Valls-Sole, J., Massaquoi, S. G., and Hallett, M. (1993). Deficit in classicalconditioning in patients with cerebellar degeneration. Brain, 116 ( Pt 4):961–969.
Tourville, J. A. and Guenther, F. H. (2003). A cortical and cerebellar parcellation systemfor speech studies. Boston University Technical Report CAS/CNS-TR-03-022.
Tremblay, S., Shiller, D. M., and Ostry, D. J. (2003). Somatosensory basis of speechproduction. Nature, 423(6942):866–869.
Tzourio-Mazoyer, N., Landeau, B., Papathanassiou, D., Crivello, F., Etard, O., Delcroix,N., Mazoyer, B., and Joliot, M. (2002). Automated anatomical labeling of activations inSPM using a macroscopic anatomical parcellation of the MNI MRI single-subject brain.NeuroImage, 15(1):273–289.
Urban, P. P., Marx, J., Hunsche, S., Gawehn, J., Vucurevic, G., Wicht, S., Massinger, C.,Stoeter, P., and Hopf, H. C. (2003). Cerebellar speech representation: lesion topographyin dysarthria as derived from cerebellar ischemia and functional magnetic resonanceimaging. Archives of neurology, 60(7):965–972.
van Galen, G. P. and Morasso, P. G. (1998). Neuromotor control in handwriting anddrawing: introduction and overview. Acta psychologica, 100(1-2):1–7.
Vihman, M. M. (1996). Phonological development: the origins of language in the child.Blackwell.
Vilis, T. and Hore, J. (1980). Central neural mechanisms contributing to cerebellar tremorproduced by limb perturbations. Journal of neurophysiology, 43(2):279–291.
Voogd, J. and Glickstein, M. (1998). The anatomy of the cerebellum. Trends in neuro-sciences, 21(9):370–375.
165
Vorobiev, V., Govoni, P., Rizzolatti, G., Matelli, M., and Luppino, G. (1998). Parcella-tion of human mesial area 6: cytoarchitectonic evidence for three separate areas. TheEuropean journal of neuroscience, 10(6):2199–2203.
Vorro, J. and Hobart, D. (1981a). Kinematic and myoelectric analysis of skill acquisition:I. 90cm subject group. Archives of physical medicine and rehabilitation, 62(11):575–582.
Vorro, J. and Hobart, D. (1981b). Kinematic and myoelectric analysis of skill acquisition:II. 150cm subject group. Archives of physical medicine and rehabilitation, 62(11):582–589.
Watkins, K. E., Strafella, A. P., and Paus, T. (2003). Seeing and hearing speech excitesthe motor system involved in speech production. Neuropsychologia, 41(8):989–994.
Welsh, J. P. and Harvey, J. A. (1989). Cerebellar lesions and the nictitating membranereflex: performance deficits of the conditioned and unconditioned response. The Journalof neuroscience, 9(1):299–311.
Westermann, G. and Reck, M. E. (2004). A new model of sensorimotor coupling in thedevelopment of speech. Brain and language, 89(2):393–400.
Wildgruber, D., Ackermann, H., and Grodd, W. (2001). Differential contributions ofmotor cortex, basal ganglia, and cerebellum to speech motor control: effects of syllablerepetition rate evaluated by fMRI. NeuroImage, 13(1):101–109.
Wildgruber, D., Ackermann, H., Klose, U., Kardatzki, B., and Grodd, W. (1996). Func-tional lateralization of speech production at primary motor cortex: a fMRI study. Neu-roreport, 7(15-17):2791–2795.
Wise, R. J., Greene, J., Buchel, C., and Scott, S. K. (1999). Brain regions involved inarticulation. Lancet, 353(9158):1057–1061.
Wise, S. P., Boussaoud, D., Johnson, P. B., and Caminiti, R. (1997). Premotor andparietal cortex: corticocortical connectivity and combinatorial computations. Annualreview of neuroscience, 20:25–42.
Wolpert, D. M., Goodbody, S. J., and Husain, M. (1998). Maintaining internal representa-tions: the role of the human superior parietal lobe. Nature neuroscience, 1(6):529–533.
Wolpert, D. M. and Miall, R. C. (1996). Forward models for physiological motor control.Neural networks, 9(8):1265–1279.
Won, J. and Hogan, N. (1995). Stability properties of human reaching movements. Ex-perimental brain research, 107(1):125–136.
Xu, B., Grafman, J., Gaillard, W. D., Ishii, K., Vega-Bermudez, F., Pietrini, P., Reeves-Tyer, P., DiCamillo, P., and Theodore, W. (2001). Conjoint and extended neuralnetworks for the computation of speech codes: the neural basis of selective impairmentin reading words and pseudowords. Cerebral cortex, 11(3):267–277.
166
Yeo, C. H., Hardiman, M. J., and Glickstein, M. (1984). Discrete lesions of the cerebellarcortex abolish the classically conditioned nictitating membrane response of the rabbit.Behavioural brain research, 13(3):261–266.
Yeo, C. H., Hardiman, M. J., and Glickstein, M. (1985). Classical conditioning of thenictitating membrane response of the rabbit. II. Lesions of the cerebellar cortex. Ex-perimental brain research, 60(1):99–113.
Zatorre, R. J., Meyer, E., Gjedde, A., and Evans, A. C. (1996). PET studies of phoneticprocessing of speech: Review, replication, and reanalysis. Cerebral Cortex, 6(1):21–30.
Zemlin, W. R. (1998). Speech and hearing science anatomy and physiology, volume 4thed. Allyn and Bacon.
Zesiger, P., Mounoud, P., and Hauert, C. A. (1993). Effects of lexicality and trigramfrequency on handwriting production in children and adults. Acta psychologica, 82(1-3):353–365.
Ziegler, W. and Wessel, K. (1996). Speech timing in ataxic disorders: sentence productionand rapid repetitive articulation. Neurology, 47(1):208–214.

167
CURRICULUM VITAE
Satrajit S. Ghosh
Address
50 Vassar StRoom 36-547Cambridge, Massachusetts 02139United StatesPhone: (617) 253-5957Email: [email protected]
Education
Ph.D., Boston University, Cognitive and Neural Systems, 2004B.S. (Honors), National University of Singapore, Computer Science, 1997
Professional Experience
Massachusetts Institute of Technology, Research Laboratory of Electronics, Speech Com-munication Group, Post-doctoral fellow Appointed: 20041999-2000, Teaching Fellow, Boston University, Graduate School of Arts and Sciences, Cog-nitive and Neural Systems, Neural Models of Speech and Hearing1999-2004, Research Assistant, Boston University, Graduate School of Arts and Sciences,Cognitive and Neural Systems, Speech Lab1997-1998, Software Engineer, Kent Ridge Digital Labs, Singapore, Media for Learning1996-1997, Teaching Assistant, National University of Singapore, School of Science, Com-puter Science
Expertise and Research Interests
I am trained to run and analyze fMRI and MEG experiments. I have a strong background insignal processing, neural networks and statistics, nonlinear dynamics and inverse problems.I am familiar with 3D processing of surfaces and visualization using the visualization toolkit(VTK).
I am proficient in several computer languages (C/C++, Java,Matlab) and operatingenvironments (Unix: Linux, Sun, Cygwin Windows: 2000, XP workstation and server). Ihave administered and maintained computer clusters running a mixture of different oper-ating systems.
My interests fall into three separate but interacting categories. First, combining differ-ent forms of medical imaging (fMRI, MEG, TMS) to explore human brain activity during

168
cognitive tasks, particularly speech processing. Using the results to create and refine mod-els of neural control via artificial neural networks. Second, applying the knowledge gainedfrom these experiments towards speech rehabilitation, speech training/retraining and auto-matic speech recognition. Third, bringing together expertise from different disciplines suchas mathematics, signal processing and computer science into the cognitive neurosciencecommunity in order to reduce reinvention of various wheels.
Publications
Guenther FH, Ghosh SS, Nieto-Castanon A, Tourville, JA. (in press). A neural model ofspeech production. In: J. Harrington & M. Tabain (eds.), Speech Production: Models,Phonetic Processes, and Techniques. London: Psychology Press.Guenther FH, Nieto-Castanon A, Ghosh SS, Tourville JA. Representation of sound cat-egories in auditory cortical maps. Journal of Speech, Language, and Hearing Research.47(1): 46-57, Feb 2004Max L, Guenther FH, Gracco VL, Ghosh SS, Wallace ME. Unstable or insufficiently ac-tivated internal models and feedback-biased motor control as sources of dysfluency: Atheoretical model of stuttering. Contemporary Issues in Communication Science and Dis-orders. 31, 2004Guenther FH, Ghosh SS, Nieto-Castanon A. A neural model of speech production. Pro-ceedings of the 6th International Seminar on Speech Production. Dec 2003Nieto-Castanon A, Ghosh SS, Tourville JA, Guenther FH. Region of interest based analysisof functional imaging data. Neuroimage. 19(4): 1303-16, Aug 2003Max L, Gracco VL, Guenther FH, Ghosh S, and Wallace M. A sensorimotor model ofstuttering: Insights from the neuroscience of motor control. Aug 2003Guenther FH and Ghosh SS. A model of cortical and cerebellar function in speech. Aug2003Ghosh SS, Bohland J, Guenther FH. Comparisons of brain regions involved in overt pro-duction of elementary phonetic units. Neuroimage, Human Brain Mapping Conference,New York, USA. 19(2): S57, Jun 2003Guenther FH, Nieto-Castanon A, Tourville JA, and Ghosh SS. The effects of categorizationtraining on auditory perception and cortical representations. 11 Jul 2001Ghosh SS, Nieto-Castanon A, Tourville JA, and Guenther FH. ROI-based Analysis of fMRIData Incorporating Individual Differences in Brain Anatomy. Neuroimage, Human BrainMapping Conference, Brighton, England. Jun 2001Guenther FH, Nieto-Castanon A, Tourville JA, and Ghosh SS. The representation of proto-typical and non-prototypical vowels in peri-sylvian cortical areas. Society for NeuroscienceMeeting, New Orleans, USA. Nov 2000
169
Honors and Awards Information
2000, Graduate Teaching Fellow Award, Boston University1998, Presidential University Graduate Fellowship, Boston University1995, Dean’s List, National University of Singapore1997-1994, SIA/NOL Undegraduate Scholarship, Singapore Airlines/Neptune Orient Lines,National University of Singapore
Membership Information
Acoustical Society of AmericaAmerican Association for the Advancement of Science
Language Skills
Bengali: Reading fluent, Writing fluent, Speaking functionalEnglish: Reading fluent, Writing fluent, Speaking fluentHindi: Reading fluent, Writing fluent, Speaking functional

![Cerebellar Atrophy in Cortical Myoclonic Tremor and Not in ... · presence of head tremor and disease onset represent different ETsubtypes [4, 5], subgroup analyses were performed](https://img.pdfslide.net/doc/110x75/5d66c02588c99356168b4884/cerebellar-atrophy-in-cortical-myoclonic-tremor-and-not-in-presence-of-head.jpg)