Embed Size (px)
Citation preview

LESE204
Depart
ment of
Food a
nd R
esourc
e E
conom
ics
Understanding Food suppliers
: Diversification
LESE204
Depart
ment of
Food a
nd R
esourc
e E
conom
ics
1. Definition
■ Diversifications
producing more than one product (across products)
running more than one business (across businesses)
ex) across the products: different products or similar (related) products
Firm
Product A
Product B
Firm
Product AProduct B
Degree of diversification
LESE204
Depart
ment of
Food a
nd R
esourc
e E
conom
ics
1. Definition
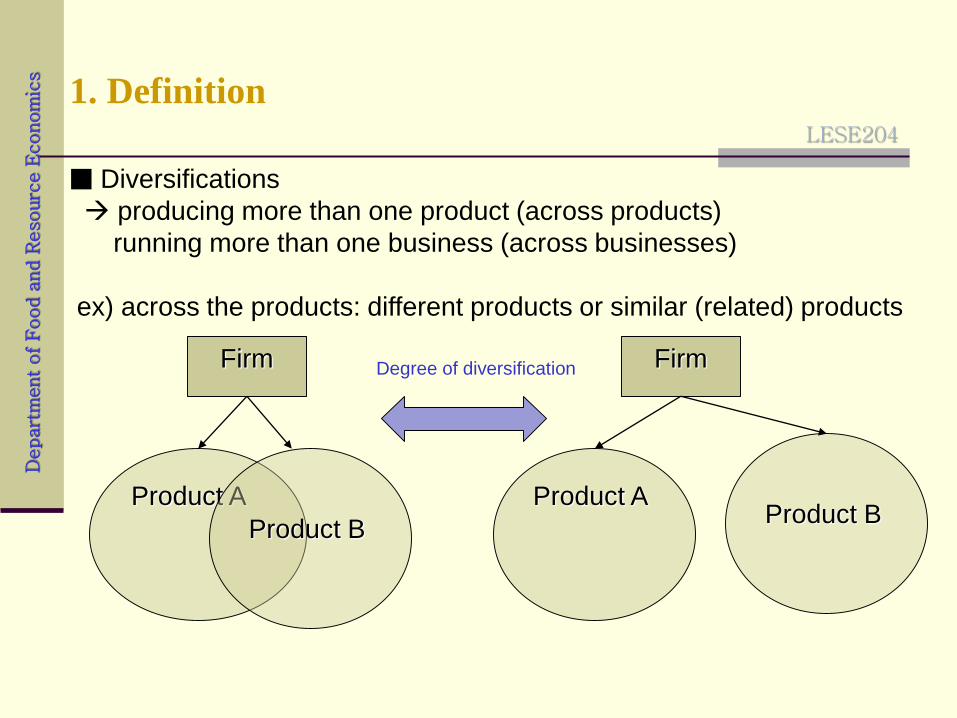
■ Types of diversification (Besanko et al., 2010)
Type of
business
Proportion of Revenue
from Primary business
Examples
Single > 95 % New York Times, DeBeers
Dominant 70 ~ 95% Harley-Davidson
Related > 70 % Abbott Laboratories, RR
Donnelly & Sons
Conglomerate < 70 % 3M, GE
More diversified
LESE204
Depart
ment of
Food a
nd R
esourc
e E
conom
ics
2. Reasons
■ Market power regarding diversification
Increasing market share increased power to control price or
quantity
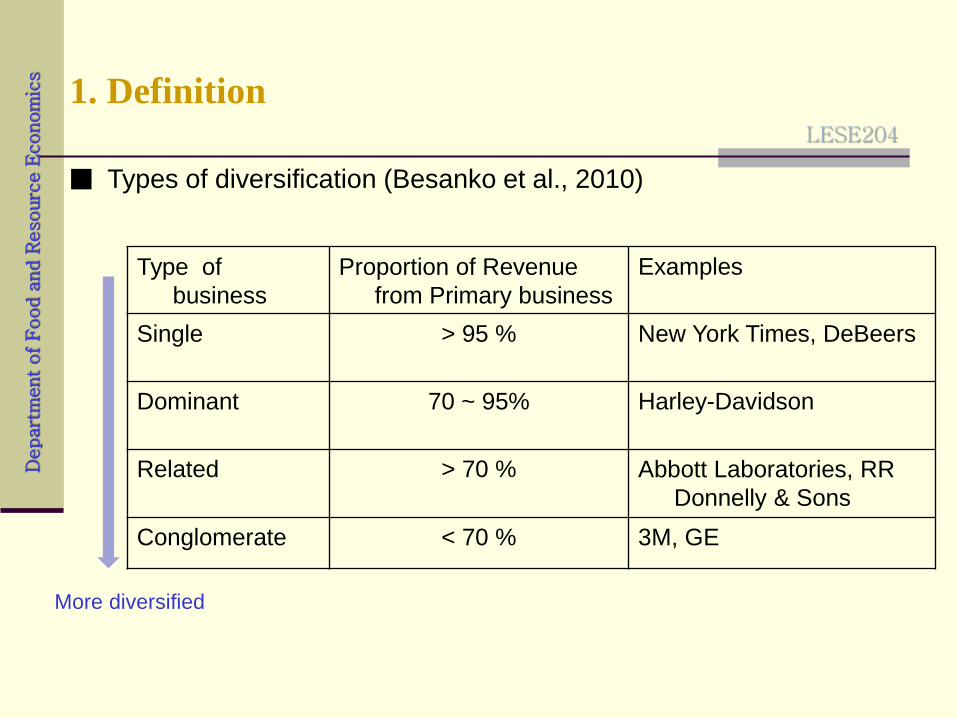
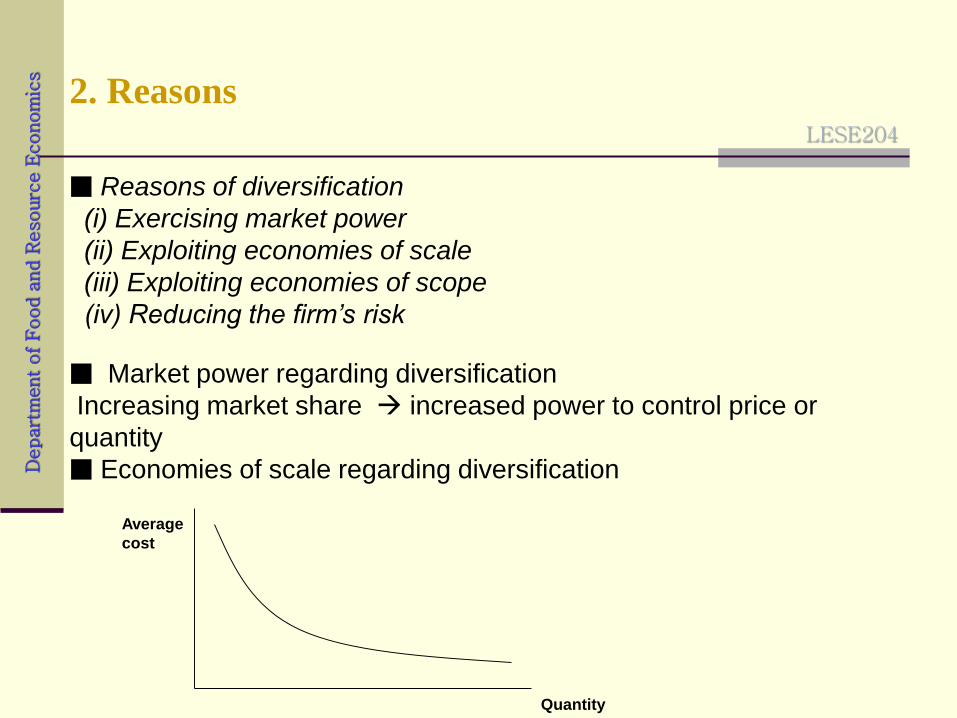
■ Economies of scale regarding diversification
■ Reasons of diversification
(i) Exercising market power
(ii) Exploiting economies of scale
(iii) Exploiting economies of scope
(iv) Reducing the firm’s risk
Average
cost
Quantity
LESE204
Depart
ment of
Food a
nd R
esourc
e E
conom
ics
2. Reasons
P, cost
Quantity
DA
MCAACA
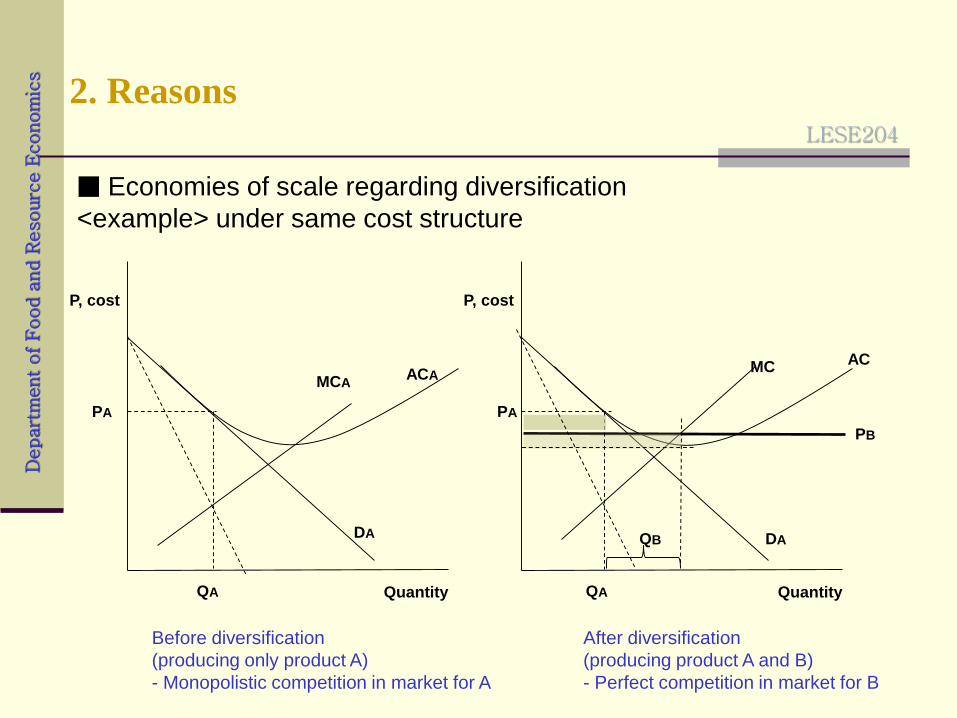
■ Economies of scale regarding diversification
<example> under same cost structure
Before diversification
(producing only product A)
- Monopolistic competition in market for A
P, cost
Quantity
MCAC
After diversification
(producing product A and B)
- Perfect competition in market for B
DA
PB
PA
QA QA
PA
QB
LESE204
Depart
ment of
Food a
nd R
esourc
e E
conom
ics
2. Reasons
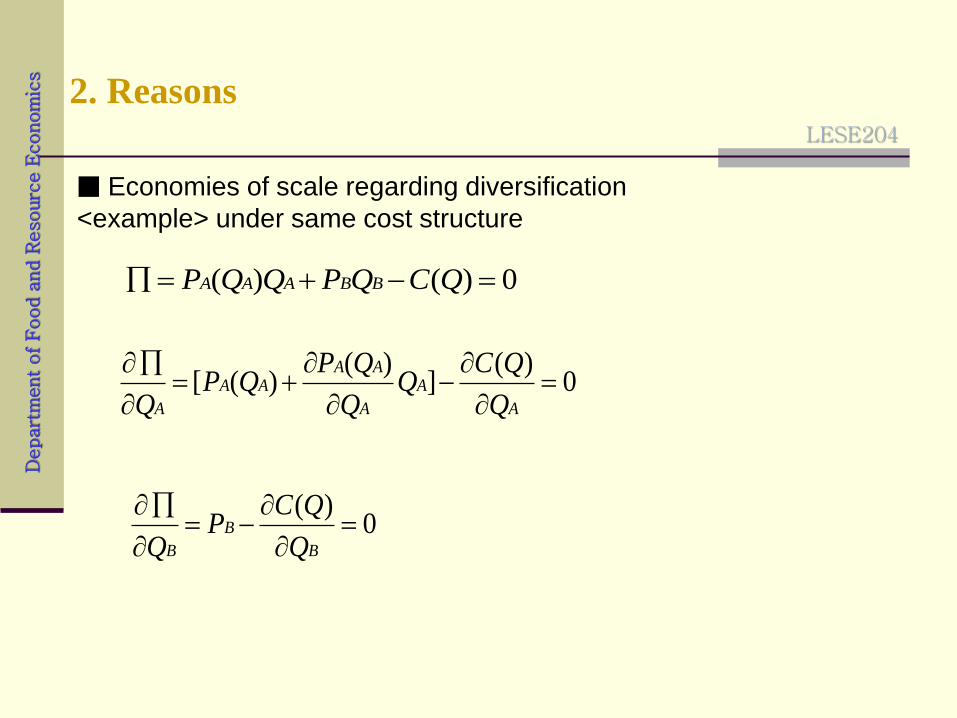
■ Economies of scale regarding diversification
<example> under same cost structure
0)()( QCQPQQP BBAAA
0)(
])(
)([
A
A
A
AAAA
A Q
QCQ
Q
QPQP
Q
0)(
B
B
B Q
QCP
Q
LESE204
Depart
ment of
Food a
nd R
esourc
e E
conom
ics
2. Reasons
P, cost
Quantity
DA
MCAACA
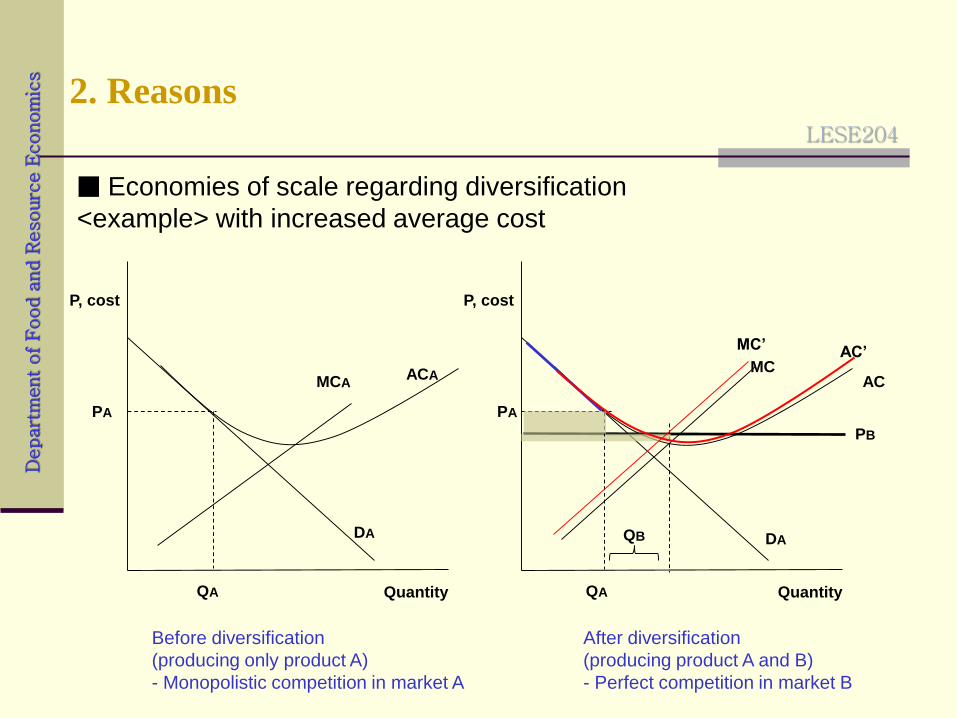
■ Economies of scale regarding diversification
<example> with increased average cost
Before diversification
(producing only product A)
- Monopolistic competition in market A
P, cost
Quantity
MCAC
After diversification
(producing product A and B)
- Perfect competition in market B
DA
PB
PA
QA QA
PA
QB
AC’MC’

LESE204
Depart
ment of
Food a
nd R
esourc
e E
conom
ics
2. Reasons
P, cost
Quantity
DA
MCAACA
■ Economies of scale regarding diversification
<example> under same cost structure
P, cost
Quantity
MCAC
DA DB
Before diversification
(producing only product A)
- Monopolistic competition in market A
After diversification
(producing product A and B)
- Facing downward slopping curve in market B
PA
QA
PA
QA
LESE204
Depart
ment of
Food a
nd R
esourc
e E
conom
ics
2. Reasons
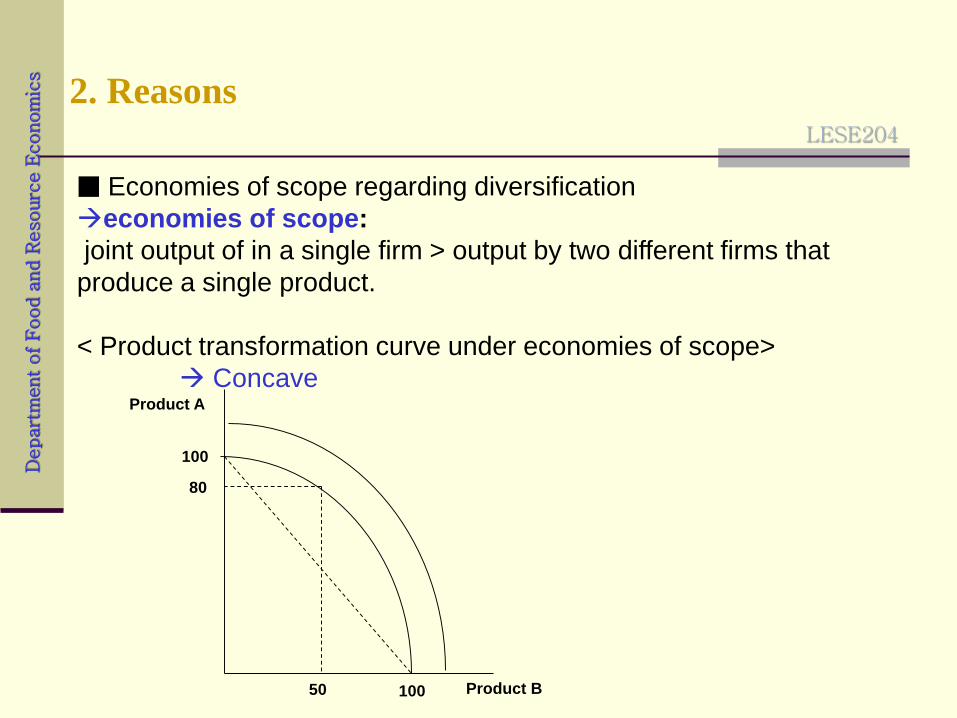
■ Economies of scope regarding diversification
economies of scope:
joint output of in a single firm > output by two different firms that
produce a single product.
< Product transformation curve under economies of scope>
ConcaveProduct A
Product B
100
80
50 100
LESE204
Depart
ment of
Food a
nd R
esourc
e E
conom
ics
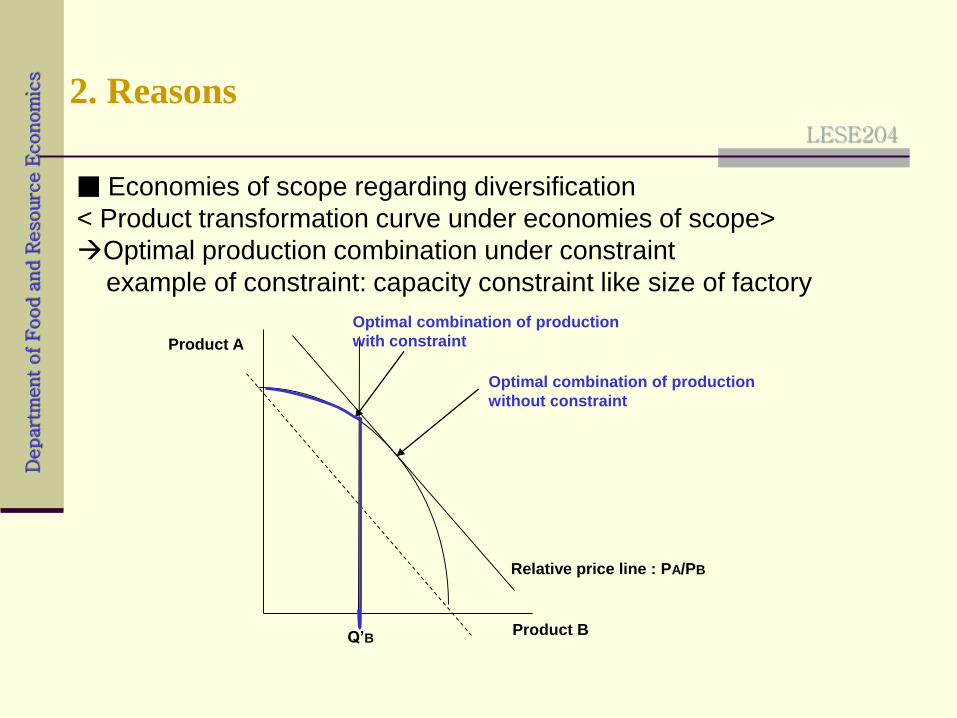
2. Reasons
■ Economies of scope regarding diversification
< Product transformation curve under economies of scope>
Optimal production combination under constraint
example of constraint: capacity constraint like size of factory
Product A
Q’B
Relative price line : PA/PB
Optimal combination of production
without constraint
Optimal combination of production
with constraint
Product B
LESE204
Depart
ment of
Food a
nd R
esourc
e E
conom
ics
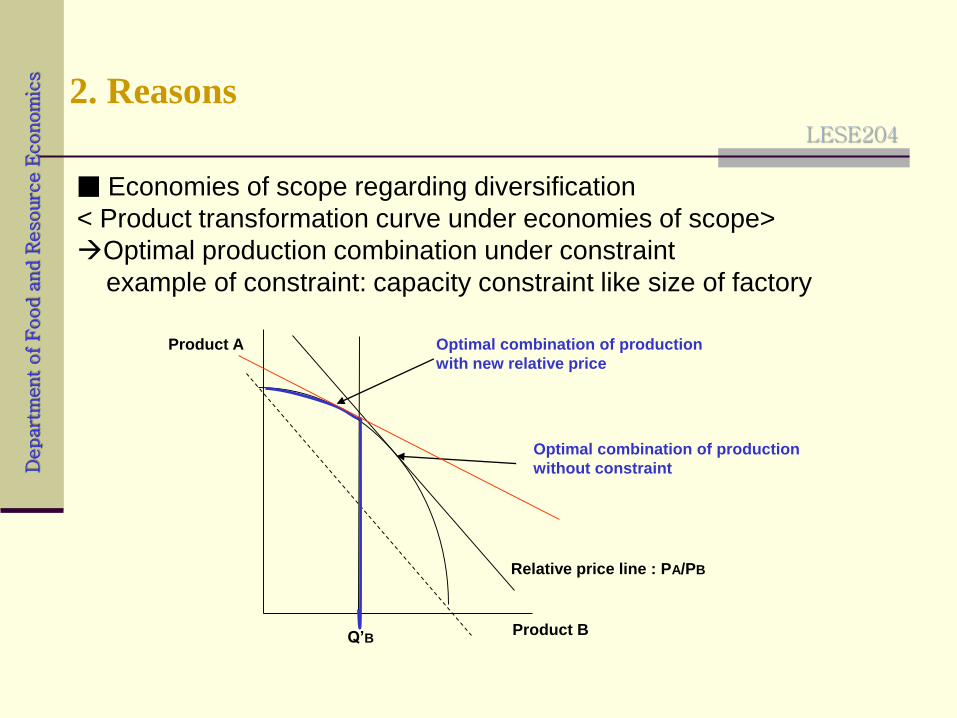
2. Reasons
■ Economies of scope regarding diversification
< Product transformation curve under economies of scope>
Optimal production combination under constraint
example of constraint: capacity constraint like size of factory
Product A
Q’B
Relative price line : PA/PB
Optimal combination of production
without constraint
Optimal combination of production
with new relative price
Product B
LESE204
Depart
ment of
Food a
nd R
esourc
e E
conom
ics
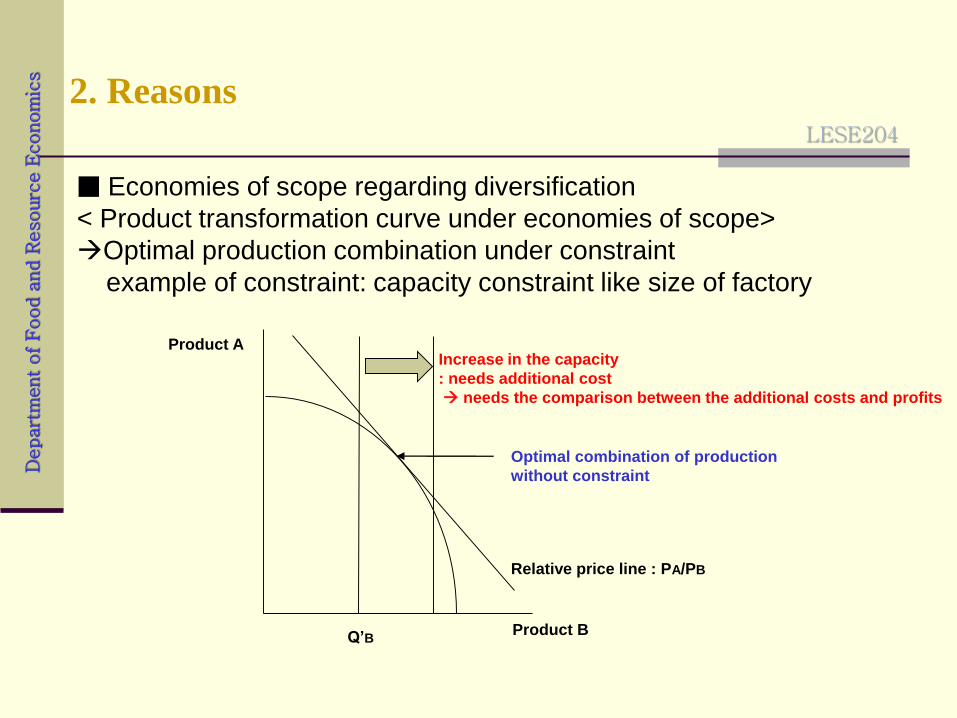
2. Reasons
■ Economies of scope regarding diversification
< Product transformation curve under economies of scope>
Optimal production combination under constraint
example of constraint: capacity constraint like size of factory
Product A
Q’B
Relative price line : PA/PB
Optimal combination of production
without constraint
Product B
Increase in the capacity
: needs additional cost
needs the comparison between the additional costs and profits
LESE204
Depart
ment of
Food a
nd R
esourc
e E
conom
ics
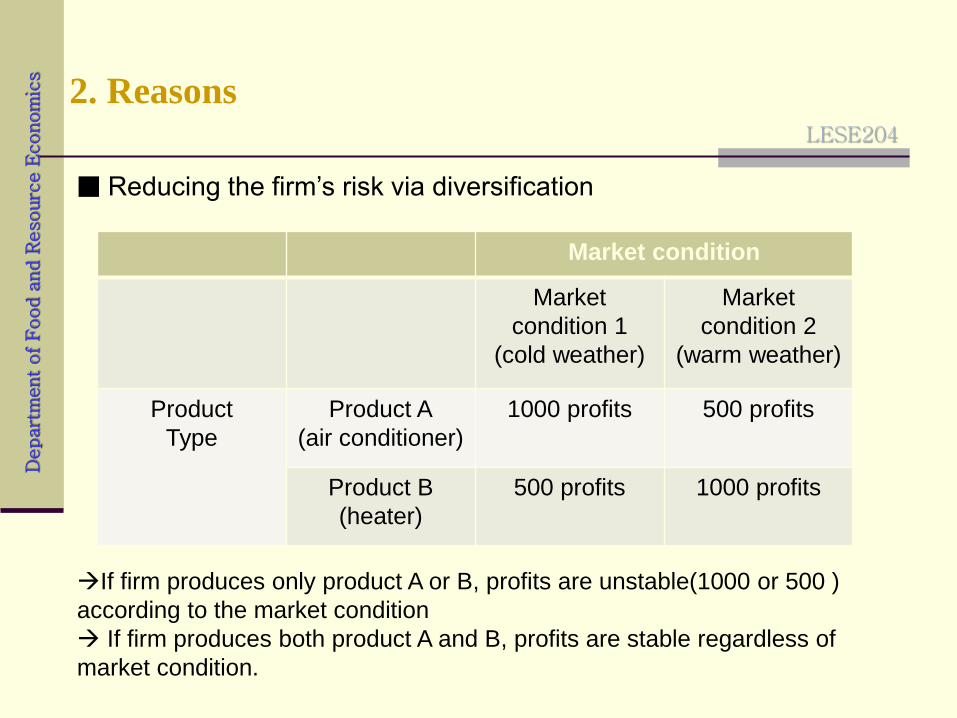
2. Reasons
■ Reducing the firm’s risk via diversification
Market condition
Market
condition 1
(cold weather)
Market
condition 2
(warm weather)
Product
Type
Product A
(air conditioner)
1000 profits 500 profits
Product B
(heater)
500 profits 1000 profits
If firm produces only product A or B, profits are unstable(1000 or 500 )
according to the market condition
If firm produces both product A and B, profits are stable regardless of
market condition.
LESE204
Depart
ment of
Food a
nd R
esourc
e E
conom
ics
3. Measuring the degree of diversification
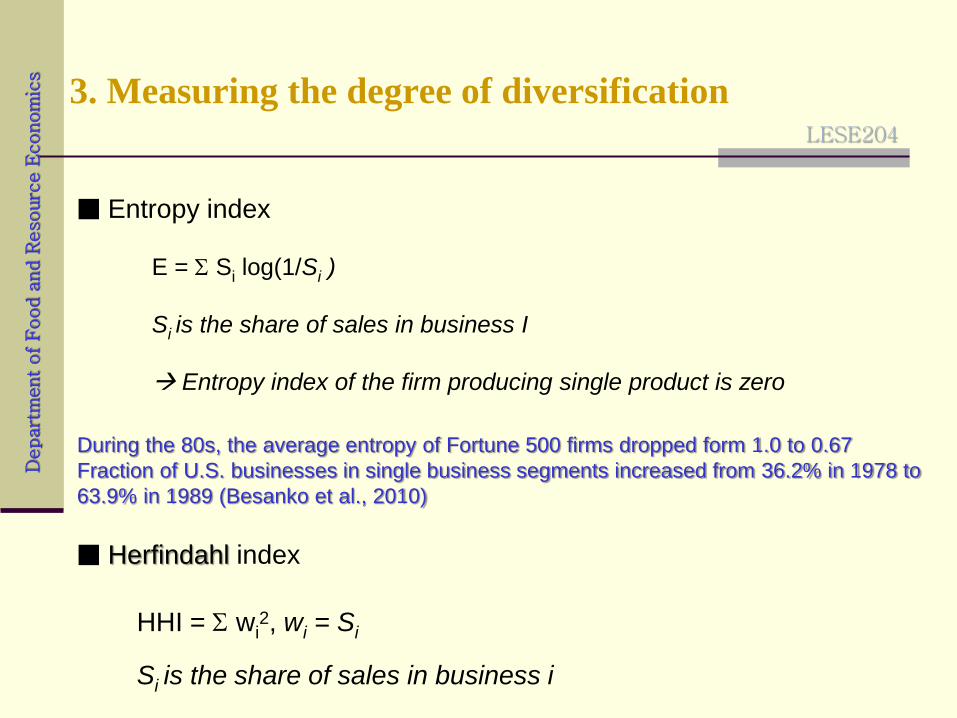
■ Entropy index
■ Herfindahl index
HHI = S wi2, wi = Si
Si is the share of sales in business i
E = S Si log(1/Si )
Si is the share of sales in business I
Entropy index of the firm producing single product is zero
During the 80s, the average entropy of Fortune 500 firms dropped form 1.0 to 0.67
Fraction of U.S. businesses in single business segments increased from 36.2% in 1978 to
63.9% in 1989 (Besanko et al., 2010)
LESE204
Depart
ment of
Food a
nd R
esourc
e E
conom
ics
3. Measuring the degree of diversification
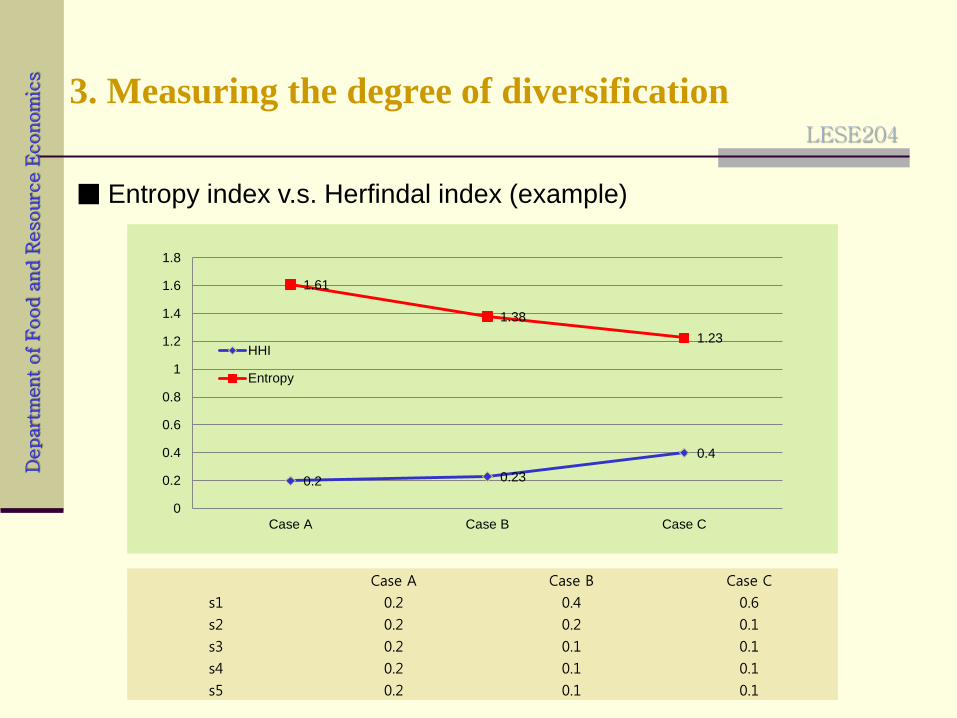
■ Entropy index v.s. Herfindal index (example)
0.2 0.23
0.4
1.61
1.38
1.23
0
0.2
0.4
0.6
0.8
1
1.2
1.4
1.6
1.8
Case A Case B Case C
HHI
Entropy
Case A Case B Case C
s1 0.2 0.4 0.6
s2 0.2 0.2 0.1
s3 0.2 0.1 0.1
s4 0.2 0.1 0.1
s5 0.2 0.1 0.1