Embed Size (px)
Citation preview
Educational Psychology Review, Vol. 4, No. 3, 1992
Understanding g in Terms of Information Processing
Arthur R. Jensen 1
Psychometric g, the general factor in individual differences in all types of tests and performances involving any mental ability, has much wider importance and implications than are encompassed by the field of psychometrics. It is argued that the nature of g must be understood in terms of information proces- ses rather than in terms of the specific knowledge and skills that are seen in the content of conventional mental tests. The wide range of individual dif- ferences in g and disparities in the distribution of g in different subpopulations have important implications for understanding some of the major problems confronting public education.
KEY WORDS: psychometric g; intelligence; information processing; Spearman's hypothesis.
INTRODUCTION
In recent years, the study of general mental ability, or g, has begun to look as a science should. Along with the increasing realization of the tremendous importance of this subject, there has been an unusually rapid growth of theoretical and empirical research, both psychometric and ex- perimental. What seems most significant for the development of a science of human abilities is that all this activity by numerous investigators has not only resulted in the discovery (and re-discovery) of many phenomena im- portantly related to our understanding of g, but key findings have been replicated repeatedly in different laboratories around the world. It is most gratifying to see various items of empirical evidence already fitting together with the kind of consistency and coherence that signify scientific progress. The outlines of the still nascent picture in this jigsaw puzzle become dearer
1Arthur R. Jensen, School of Education, University of California, Berkeley, California 94720.
271
1040-726X/92/09(~0-0271506.50/0 © 1992 Plenum Publishing Corporation
272 Jensen
with almost every issue of the leading research journals in this field -- In- telligence, Behavior Genetics, and Personality and Individual Differences. As this trend continues, it will compel an increasing agreement among scien- tists about the nature of mental ability. Achieving a heightened public awareness of the main points of general agreement among experts is also important for the impact of scientific knowledge on human welfare. My aim here is to sketch briefly some of the most fundamental things re- searchers have learned about mental ability, particularly g. They are relevant to discussions about a number of public concerns: education, col- lege admissions, human resources, job training, selection procedures in employment and in the armed forces, crime, childcare, and public health. It is also essential to recognize the most basic points of current theoretical disagreement and the crucial gaps in our empirical knowledge about the nature of g.
Research on g has four main themes: (a) factor analysis of psychometric tests, (b) information processes (experimental cognitive psychology and chronometric tests), (c) quantitative behavior-genetic analysis (i.e., estima- tion of various genetic and environmental components of the total phenotypic variance of g), and (d) physiological correlates (e.g., neural and synaptic conduction velocity, evoked brain potentials, brain metabolism). Each of these is important for gaining a comprehensive picture of g. The physiological aspect, however, is much less developed than the others. But understanding the physiological basis of g will soon become crucial, as con- flicting theories which appear equally adequate for explaining phenomena at the other levels of analysis cannot be resolved by inference based only on observations of behavior. Investigation will have to encompass neurophysiological data. A preponderance of evidence in behavior genetics indicates that a large component of the variance in g is genetically condi- t ioned and hence mediated by biological structures and processes (Bouchard, Lykken, McGue, Segal, and Tellegen, 1990; Plomin, 1987, 1988, 1990).
Listed below, under various headings, are 22 key points concerning the nature of g that are now well supported by empirical research. Most of the statements about factor analysis per se are not referenced here, as they are included in most modern textbooks on factor analysis (e.g., Gor- such, 1983; Harman, 1976).
FACTOR ANALYSIS AND PSYCHOMETRIC g
1. The g factor arises from the empirical fact of positive manifold, which is the phenomenon of all-positive correlations between mental tests
Understanding g 273
of every description. Correlations between various mental tests range from slightly greater than 0 to slightly less than 1, but they are always positive except for sampling error or statistical artifacts (Jensen, 1987a). Until some- one can devise a cognitive test that has a true negative correlation with other mental tests, which no one has yet succeeded in doing, it can be accepted as a fact that all types of mental tests are positively correlated. Claims to the contrary are based on sampling error and restriction of the range of general ability in the sample of subjects tested (e.g., air force pilots and college students). The probability of finding negative correlations among mental tests of all kinds decreases as a function of increasing sample size and the degree to which the sample represents the distribution of ability in the general population.
2. Given positive manifold, the particular method of factor analysis used to represent the general factor (g) of a correlation matrix of mental tests does not make much difference. The first (unrotated) principal factor, the first principal component, and the single highest-order factor in a hierarchical factor analysis all give highly similar estimates of the g factor. Empirically, the coefficient of congruence between g factors extracted by these different methods is usually very high: above .95. However, there are some good reasons to prefer a hierarchical factor analysis in the ability domain, a point I have argued elsewhere (Jensen, 1987a; Jensen and Weng, in press).
3. Tests differ in their g loadings, or the degree to which they are correlated with the one factor (source of variance) that all mental tests have in common. In various factor analyses of some 120 rather complex mental tests, I have seen g loadings of various tests ranging from about +.30 to +.90 (see Jensen, 1987c).
Those who are not specialists in factor analysis can best think of a given test's g loading as the average of that test's correlations with every other test in a large collection of diverse tests. That would be just a rough approximation to the g loading obtained by factor analysis. But it is probab- ly the best explanation o fg without assuming a knowledge of factor analysis.
4. It is possible to measure g in individuals by obtaining factor scores. Such scores do not constitute an absolute scale like height or weight. They are "norm referenced"; that is, the scores are relative to the particular group of people from which they were derived.
The rank order of a persons' g factor scores is usually so highly cor- related with the rank order of their IQs on conventional "intelligence" tests that, for most practical uses of tests, there is little value in calculating a persons' g factor scores. A g factor score is simply a weighted average of an individual's standardized scores on a number of diverse mental tests, the weights being the g loadings of the various tests. A unit-weighted
274 Jensen
average of the same test scores would usually be quite highly correlated with their g-weighted average (e.g., Jensen and Reynolds, 1982).
5. No actual test or task measures g exclusively. Every real task reflects at least two or more sources of variance, besides error variance. The factorially simplest tasks are g + s (i.e., specificity) + e (error). Specificity is that part of a test's non-error variance (called "true-score" variance) that is not common to any of the other tests that entered into the factor analysis. A reliable test score difference between individuals or a difference between group means may reflect a difference in g, or in s, or in both.
Factor analysis shows that most tests measure other factors in addi- tion to g and s. These other factors are called group factors because their loadings are confined to certain groups or classes of tests, such as verbal, numerical, spatial, and memory tests. Every test reflects g to some extent, but any particular group factor is reflected only by a certain class of tests. By including more and more different tests in a factor analysis, the number of group factors tends to increase while specificity decreases. Theoretically, in an indefinitely large collection of all possible tests, factor analysis would reveal g and a good many group factors, but specificity would be vanishingly small, because what would have been a test's specificity in a more limited sample of tests would become a group factor in an unlimited population of all possible tests. Measurement error (or the complement of test-retest reliability), of course, would still remain in an unlimited population of tests.
6. The g factor is very unlike the group factors because it cannot be described in terms of any particular type of test content, knowledge, or skills. Group factors can be identified and described (in part) by the types of tests in which they have large factor loadings. The verbal factor loads heavily only in verbal tests, the spatial factor in spatial visualization tasks, and so on. But the g factor loads in all mental tests, more in some than in others. But the tests with equal g loadings are so diverse that g cannot be characterized in terms of the knowledge or skills represented in the tests. However, there appears to be a relation between particular tests' g loadings and the relative complexity of the informat ion processing demanded by the test items (Marshalek, Lohman, and Snow, 1983). The most g loaded tests involve relatively complex processes such as abstraction, rule inference, generalization, and mental manipulation or transformation of the test item content. This effect of "complexity" (for want of a better term) on g loadings is seen at every point on the whole continuum of com- plexity of a tasks' information-processing demands. For example, simple reaction time (RT) is less g loaded than 2-choice RT, which is less g loaded than 4-choice RT (Jensen, 1987b). Forward digit span is less g loaded than backward digit span (Jensen and Figueroa, 1975). Arithmetic computation
Understanding g 275
is less g loaded than arithmetic problem solving. Spelling is less g loaded than composition, and word reading is less g loaded than reading com- prehension.
7. Hence it should be emphasized that g itself is not a measure of any kind of knowledge, skills, or strategies. That is one of the most impor- tant things one can know about g. Yet this crucial point is still scarcely understood, even by many psychologists. Many people look at the items of an IQ test and think that knowledge of the particular item content is all that the test really measures. This naive view that a test score reflects no more than a person's knowledge of the specific content of its items is known as the specificity doctrine. I have examined it critically elsewhere (Jensen, 1984). The fact is that the variance of every single mental test item has a very small ratio of g variance to non-g variance. The non-g variance usually consists of group factors, specificity, and measurement error. But in the total score of a test that consists of a large number of items that sample a wide variety of knowledge and skills, g constitutes a very large component of the total variance in test scores. The small g components in each of the single items of the test can cumulate to a large g component. The greater the number and diversity of the items, the more the total test score reflects g. The specific knowledge or skill represented in any single item is, in effect, canceled out in the g factor. Variance associated with the item content per se is represented in the primary (or group) factors and in the test's specificity.
The g factor derives much of its interest and importance from the fact that it is not a measure of knowledge, skill, or strategies for problem solving. It is most important to keep in mind the distinction between cog- nitive content and cognitive processes. At the first level of analysis, g reflects information-processing variables. The knowledge and skill content of per- formance on mental ability tests is merely a vehicle for g, which reflects the overall capacity and efficiency of the information processes by which knowledge and skill are acquired and used. Hence we cannot begin to fathom the causal underpinnings of g by examining merely the item con- tents of psychometric tests.
8. Not every collection of tests yields an equally good g. Assume that all of the tests in a battery are psychometrically appropriate for the age range, ability level, and linguistic and cultural background of all of the sub- jects in the sample tested, and that the subjects are motivated to do their best on the tests. Then the "goodness" of an obtained g will be a function of five variables: (a) the reliability of the tests, (b) the range of ability in the subject sample, (c) the subject sample size, (d) the number of tests entered into the factor analysis, and (e) the diversity of the various tests entered into the factor analysis, with respect to sensory-motor modalities,
276 Jensen
specific task demands, specific information content, and method of ad- ministration (e.g., speeded vs. nonspeeded, group vs. individual administra- tion, paper-and-pencil vs. performance tests, and the like).
Empirically, g is remarkably stable across different batteries of mental tests when the batteries consist of even as few as 9 or 10 tests. Thorndike (1985, 1987), for example, made up six short non-overlapping batteries of nine tests each. The tests in each battery were randomly sampled (without replacement) from a large pool of extremely diverse cognitive tests used by the United States Air Force, including just about every kind of test one can imagine, from discrimination reaction time to vocabulary. Thorndike found highly similar g factors in the six different batteries. Seventeen highly diverse "probe" tests were entered one at a time into each battery. The average correlation of the g loadings of 17 probe tests across the six bat- teries was .85. Hence g does not appear to be a frail or erratic phenomenon, but emerges with a high degree of robustness and consistency from mental test batteries that even rather minimally meet the five criteria for a "good" g listed above.
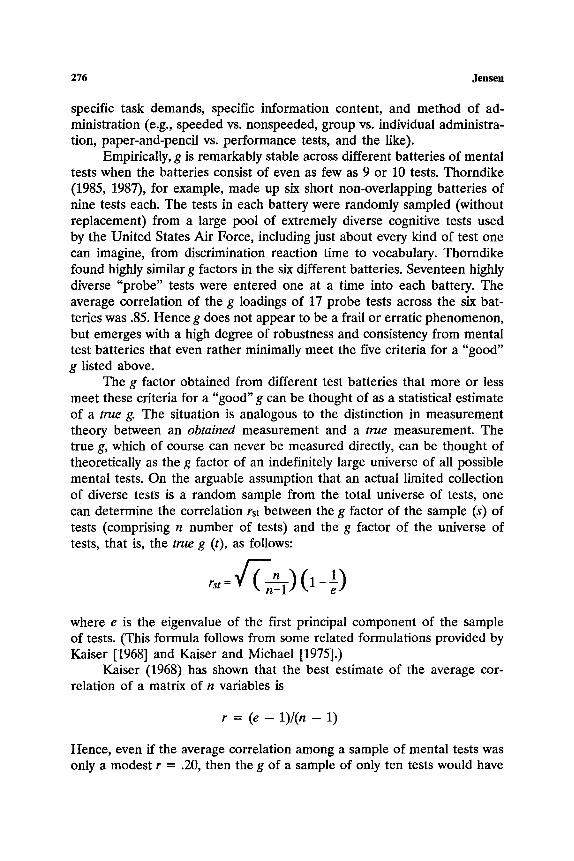
The g factor obtained from different test batteries that more or less meet these criteria for a "good" g can be thought of as a statistical estimate of a true g. The situation is analogous to the distinction in measurement theory between an obtained measurement and a true measurement. The true g, which of course can never be measured directly, can be thought of theoretically as the g factor of an indefinitely large universe of all possible mental tests. On the arguable assumption that an actual limited collection of diverse tests is a random sample from the total universe of tests, one can determine the correlation rst between the g factor of the sample (s) of tests (comprising n number of tests) and the g factor of the universe of tests, that is, the true g (t), as follows:
where e is the eigenvalue of the first principal component of the sample of tests. (This formula follows from some related formulations provided by Kaiser [1968] and Kaiser and Michael [1975].)
Kaiser (1968) has shown that the best estimate of the average cor- relation of a matrix of n variables is
r = ( e - - 1 ) / ( n - 1)
Hence, even if the average correlation among a sample of mental tests was only a modest r = .20, then the g of a sample of only ten tests would have
Understanding g 277
a correlation with the theoretical g of the total universe of tests (i.e., the true g) of rst = .85; for a sample of 20 tests, r~t = .91.
Al though one cannot know the average cor re la t ion among the universe of all possible tests, its limits in terms of the observed correlations among a great many actual tests can probably be estimated. In any case, it is certain that as the number and diversity of mental tests in a given collection increases, sampled without selection in terms of their intercor- relations, the correlation between the g factor of the collection and the true g of the universe of all possible tests increases monotonically. Probably the best short practical measure of g would be a battery consisting of the several tests that have shown the largest g loadings when factor analyzed among a very large sample of diverse tests and that, at the same time, have their largest non-g factor loadings on many different group factors.
9. The nature of the true g that can only be approximated by the g obtained from an actual test battery may nevertheless be inferred in part from observation of g in various test batteries that differ in size and diver- sity. Two things are especially noticeable as the number and diversity of tests increases.
First, the g loading of any given test tends to decrease asymptotically toward some positive value (which differs markedly for various tests). Con- sequently, g accounts for a decreasing percentage of the total variance in a test bat tery as the number and diversity of tests increases. But the asymptote of this decreasing percentage of g variance is some value con- siderably greater than zero. The asymptotic value is the variance at- tributable to true g.
How much of the total variance in a battery of mental tests is ac- counted for by g? This question cannot be given a precise answer, because it depends on the number and diversity of the tests in the battery and on the range-of-talent in the group that is tested. But one can look at what are fairly typical results of the factor analysis of various test batteries. The full factor matrices are shown elsewhere (Jensen, 1980, pp. 217-221). In 60 different Thurstone tests, g accounts for 30.8% of the variance, the sum of six group factors = 21.4%, and the uniqueness (i.e., specificity + error) = 47.8%. In the 11 subtests of the Wechsler Adult Intelligence Scale (WAIS) for the 18-19 age group of the national standardization sample, g = 52.7%, three group factor = 12.8%, and uniqueness = 34.5%. In 13 tests given to 1000 British army recruits, g = 52.5%, four group factors = 15.6%, and uniqueness = 31.9%. In 16 highly diverse tests given to 4925 U.S. Navy recruits, g = 31.3%, four group factors = 31.2%, and uniqueness = 37.5%. In 20 diverse tests given to British school children of ages 10-11, g = 34.3%, four group factors = 21.8%, and uniqueness = 42.9%.
278 Jensen
Because g represents a source of variance among individuals, it is, of course, meaningless to speak in terms of the proportion of any one person's mental abilities that consists of g or of any one of the various group factors. A factor analysis, which is a form of the analysis of variance, obviously cannot be performed on a single individual. However, factor analysis can be used to generate factor scores for individuals, thereby showing their rela- tive standing in the total group of individuals on g and on each of the group factors.
Second, the g itself (and, ipso facto, g factor scores) becomes increas- ingly stripped of variance associated with any kind of knowledge or skill. Even the tests that appear to be the most knowledge-based, such as the Information and Vocabulary subtests of the Wechsler battery when factor analyzed among just the 12 subtests of the Wechsler, have large g loadings which are scarcely contaminated by other sources of variance. Hence other tests outside the Wechsler battery, including those with little resemblance to any of the Wechsler subtests (e.g., Raven's matrices and reaction time tests) are correlated with the various Wechsler subtests in direct relation to the size of the Wechsler subtests' g loadings. The g loadings of Infor- mation and Vocabulary, for example, are among the most g loaded of the Wechsler subtests and also show the largest correlations with the Raven (a nonverbal test of reasoning based on abstract visual patterns) and with measures of choice and discrimination reaction time (Vernon, 1983). If g is statistically regressed out of the Wechsler subtest scores, their canonical correlation with a set of various RT measures is nonsignificant and very near zero. On the other hand, when g is not partialed out, multiple and canonical correlations between Wechsler subtests and various RT measures approach .70. A small battery of various RT tasks with virtually no intel- lectual content can account for about half of the total variance in the Wechsler Full Scale IQ (Vernon, 1983; Kranzler and Jensen, 1991a, b). These RT tasks are so simple that the median RT is less than 1 sec for most of the college students who were tested.
CORRELATES OF g OUTSIDE THE PSYCHOMETRIC DOMAIN
10. Another property that distinguishes g from most, perhaps all, other factors of the mind (independent of g) is the fact that g is correlated with a number of variables which themselves have nothing to do with psychometrics or factor analysis. The scientific and conceptual base of these variables and the methodology of their measurement exist entirely inde- pendently of mental tests and factor analysis.
Understanding g 279
11. I have already mentioned the correlation of g with reaction time (RT) measured in various elementary cognitive tasks (ECTs), but this is a borderline example, because RT is a behavioral variable. Its correlation with psychometric g is especially interesting from a theoretical standpoint, however, because the simple tasks in which RT is measured have so ex- ceedingly little resemblance to conventional psychometric g-loaded tests. Knowledge and skill, by any conventional meaning of these terms, con- tribute virtually nothing to the variance in the RT measurements that are correlated with g. It is also important to realize that speeded psychometric tests are generally less g loaded than non-speeded tests. RT shows larger correlations with non-speeded than with speeded tests. When a speed fac- tor, independent of g, is extracted from a factor analysis of a collection of speeded and non-speeded tests, RT has zero correlation with the speed factor; but it is correlated, usually exclusively, with the g factor (Jensen, 1987d; Vernon and Kantor, 1986; Vernon, Nador, and Kantor, 1985). The degree to which a variety of psychometric tests, such as the subtests of the WAIS, are correlated with RT on any given ECT is directly related to the various tests' g loadings (Smith and Stanley, 1987).
12. Moreover, it is not just the subject's median RT on ECTs that is correlated with g. The intra-individual variability of RTs over a number of trials (measured as the standard deviation of the person's RTs over n trials) is significantly more highly correlated with g than is the median RT over n trials. This measurement of intra-individual variability in RT bears no resemblance to the measurements obtained with any conventional psychometric tests, yet it is correlated with their g factor Jensen, in press a).
13. Inspection time (IT) is another experimental paradigm that shows correlations with g comparable to those of RT. IT is the time required to make a very simple visual or auditory discrimination. Unlike RT, no ef- ferent neural processes or motor response time enters into the measure- ment of IT. The average IT in young adults is only about one-tenth of a second; yet, there are highly reliable individual differences in IT that are correlated with IQ and psychometric g (Nettelbeck, 1987; Raz et aL, 1983; Kranzler and Jensen, 1989).
14. Simple musical tests (e.g., discrimination of pitches, rhythms, tunes, and chords) show substantial g loadings (Lynn, Wilson, and Gault, 1989).
There also are some completely non-behavioral and non-cognitive correlates of g:
15. The heritability coefficients (i.e., the proportion of total variance attributable to genetic factors) of diverse psychometric tests are directly related to the g loadings of the same tests (Jensen, 1987a). Also, the g loadings of median RTs and of intra-individual variability of RT on a
280 Jensen
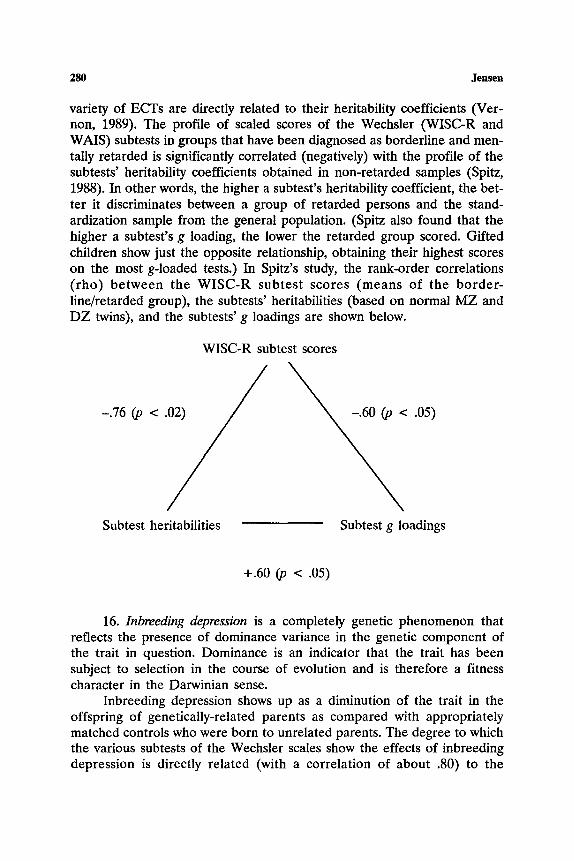
variety of ECTs are directly related to their heritability coefficients (Ver- non, 1989). The profile of scaled scores of the Wechsler (WISC-R and WAIS) subtests in groups that have been diagnosed as borderline and men- tally retarded is significantly correlated (negatively) with the profile of the subtests' heritability coefficients obtained in non-retarded samples (Spitz, 1988). In other words, the higher a subtest's heritability coefficient, the bet- ter it discriminates between a group of retarded persons and the stand- ardization sample from the general population. (Spitz also found that the higher a subtest's g loading, the lower the retarded group scored. Gifted children show just the opposite relationship, obtaining their highest scores on the most g-loaded tests.) In Spitz's study, the rank-order correlations (rho) between the WlSC-R subtest scores (means of the border- line/retarded group), the subtests' heritabilities (based on normal MZ and DZ twins), and the subtests' g loadings are shown below.
WISC-R subtest scores
-.76 6o < .
Subtest heritabilities
.05)
Subtest g loadings
+.60 (p < .05)
16. Inbreeding depression is a completely genetic phenomenon that reflects the presence of dominance variance in the genetic component of the trait in question. Dominance is an indicator that the trait has been subject to selection in the course of evolution and is therefore a fitness character in the Darwinian sense.
Inbreeding depression shows up as a diminution of the trait in the offspring of genetically-related parents as compared with appropriately matched controls who were born to unrelated parents. The degree to which the various subtests of the Wechsler scales show the effects of inbreeding depression is directly related (with a correlation of about .80) to the
Understanding g 281
subtests' g loadings (Jensen, 1983; see also Agrawal, Sinha, and Jensen, 1984; Rushton, 1989). The genetic effect opposite to inbreeding depression is heterosis, or hybrid vigor, which results from outbreeding, as seen in the offspring of cross-racial matings. The degree of increment in test scores attributable to heterosis is also directly related to the tests' g loadings (Nagoshi and Johnson, 1986).
17. Features of the average evoked potential (the brain's electrochemi- cal response to an external stimulus) are related to tests' g loadings but not to any other components of the variance in test scores (studies reviewed by Jensen, 1987a).
18. Persons' rates of glucose metabolism by the brain while taking a highly g-loaded test of abstract reasoning (Raven's Progressive Matrices) is correlated (negatively) with the persons' test scores (Haler et al., 1988). The brain metabolic rates are obtained by intravenous injection of radioac- tive glucose, and the rate of its uptake in the brain is precisely mapped and measured by means of positron emission tomography (PET scan).
19. The speed of neural and synaptic transmission in the visual tract, from the retina to the visual cortex, is significantly correlated with scores on Raven's Progressive Matrices given non-speeded to college students (Reed and Jensen, in press). This finding is of special theoretical impor- tance, because the visual tract, although it is embryologically and neurologi- cally an extension of the brain, is not involved in the higher mental processes of solving complex reasoning problems. Yet the speed of signal transmission in this neural tract evidently reflects the efficiency of the higher neural processes involved in complex reasoning. This fact alone con- tradicts Sir Godfrey Thomson's "sampling theory" of g, which states that g reflects the proportion of the total number of neural elements (or "bonds") that are activated in the performance of a given task. Complex reasoning, by this theory, involves a larger proportion of neural elements than the performance of cognitively simple tasks. Because transmission speed in the visual tract per se is not involved in the reasoning processes demanded by the Progressive Matrices (PM), Thomson's sampling theory would predict a zero correlation between transmission velocity and PM scores. Therefore, it does not explain the observed significant correlation. Hence, Thomson's theory, long thought to be empirically untestable, has now been tested and found to be false.
20. Although IQ tests and other highly g loaded mental tests were never devised to show correlations with physical traits, they nevertheless show small but highly significant correlations with a surprising number of physical measurements, such as stature, head size, and brain size controlled for body size, blood types, blood serum urate level, and myopia. [The evidence and relevant hypotheses have been comprehensively reviewed
282 Jensen
elsewhere (Jensen and Sinha, in press; Johnson, 1991; Vernon, in press)]. This fact further shows that g is somehow related to certain biological vari- ables far removed from psychometrics. But the causal nature of these cor- relations is still largely speculative. Correlation between a physical trait and g that exists only between families (such as the correlation of stature with IQ) requires a fundamentally different causal interpretation than a correla- tion that exists within families (as well as between families), as is the case for myopia, or nearsightedness. The correlation of myopia with g occurs among the full siblings within a family, which means that the correlation is most likely a pleiotropic effect, where one and the same gene affects two (or more) phenotypically distinct traits (Cohn, Cohn, and Jensen, 1988).
THE RELATION OF g TO LEARNING ABILITY AND ACHIEVEMENT
21. My review (Jensen, 1989a) of studies of the relation between measures of learning and psychometric tests of intelligence, or IQ, leads me to the same conclusion arrived at by others (e.g, Estes, 1982; Snow, Kyllonen, and Marshalek, 1984) who have reviewed this field in recent years. Both sets of variables largely reflect one and the same g. There is no evidence of a general learning ability factor independen t of psychometric g. Learning tests, however, generally have greater specificity and are seldom as highly g loaded as are most multiple-item mental tests. But whatever aspects of the information-processing system account for the g of cognitive tests must also account for the general factor of a variety of cognitive learning tasks. Complex cognitive learning that extends over long periods is more highly g loaded than are the kinds of learning tasks com- monly used in the experimental laboratory. For example, the high correla- tion found between IQ and scholastic achievement is well known. It is important to realize that the IQ-Achievement correlation is not the result of the IQ test's containing scholastic content. Highly g-loaded tests, such as Raven's matrices, that have no content in common with the school cur- riculum also are substantially correlated with scholastic achievement, al- though not as highly as most IQ tests that measure a verbal ability factor as well as g. Scholastic aptitude is predominantly g, but it also is loaded on verbal and numerical factors.
22. The g factor is overwhelmingly the chief "active ingredient" in the predictive validity of personnel selection tests used in industry and the armed forces, such as the Wonderlic, the General Aptitude Test Battery (GATB), and the Armed Services Vocational Aptitude Battery (Hunter,
Understanding g 283
1986; Jensen, 1984; Thorndike, 1986). For example, the average predictive validity coefficients of each of the nine GATB subtests, for 300 occupations, are correlated .65 with the g loadings of these subtests (Jensen, 1984). The importance of g in tests' predictive validity is an increasing function of the cognitive complexity demanded by the job. Various jobs differ markedly in the typical information-processing demands, so job requirements differ in their g loadings. The validity of g-loaded tests in personnel selection is highest for jobs that require the integration and coordination of informa- tion; it is next highest for jobs involving compiling or computing data; it is still lower for jobs that involve checking, comparing, and copying infor- mation, or executing only simple routines. But very few if any jobs are so simple as to not involve any g at all.
PSYCHOMETRIC g AND INFORMATION PROCESSING
Although g has been recognized as an empirical phenomenon in psychometrics for many years, theories that attempt to explain it in other than purely descriptive or factor analytic terms have been few, and they have been highly speculative, with scarcely any empirically tested basis. In recent years, however, the chronometric techniques that have figured prominently in experimental cognitive psychology, with its emphasis on in- formation processes, have focused on the study of individual differences in these processes. This has spurred the development of information-process- ing theories of g, with empirically testable theory-driven hypotheses. I will here give a brief review of how information-processing concepts, imple- mented by chronometric techniques, are related to psychometric g.
Information-Processing Models of g
In experimental cognitive psychology, "information processing" refers to how people receive, apprehend, discriminate, select, encode, transform, and store information, and later use it to make decisions and guide their behavior. A number of functionally distinct elementary cognitive processes (ECPs) have been hypothesized to account for these various aspects or components of information processing. Metacognitive processes also have been hypothesized as the "orchestrator" and "conductor" of the various ECPs for the intentional execution of complex mental operations in accord with the person's purpose, plan, or goal.
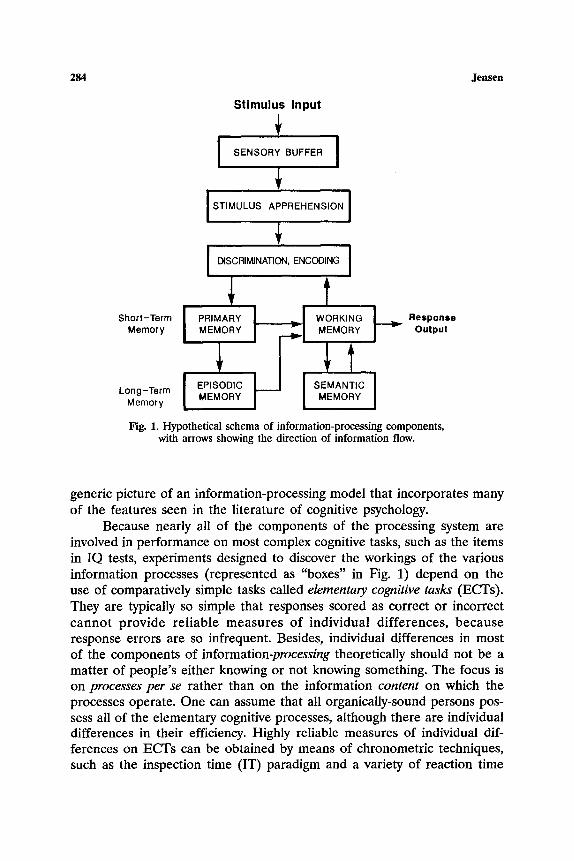
There are various ways of representing the information-processing system. They all have some common features. Figure 1 is intended as a
284 Jensen
Stimulus Input
I SENSORY BUFFER I
I STIMULUS APPREHENSION I
DISCRIMINATION, ENCODING I
t Memory MEMORY MEMORY b Output
Long-Term [ EPISODIC SEMANTIC Memory MEMORY MEMORY Fig. 1. Hypothetical schema of information-processing components,
with arrows showing the direction of information flow.
generic picture of an information-processing model that incorporates many of the features seen in the literature of cognitive psychology.
Because nearly all of the components of the processing system are involved in performance on most complex cognitive tasks, such as the items in IQ tests, experiments designed to discover the workings of the various information processes (represented as "boxes" in Fig. 1) depend on the use of comparatively simple tasks called elementary cognitive tasks (ECTs). They are typically so simple that responses scored as correct or incorrect cannot provide reliable measures of individual differences, because response errors are so infrequent. Besides, individual differences in most of the components of information-processing theoretically should not be a matter of people's either knowing or not knowing something. The focus is on processes per se rather than on the information content on which the processes operate. One can assume that all organically-sound persons pos- sess all of the elementary cognitive processes, although there are individual differences in their efficiency. Highly reliable measures of individual dif- ferences on ECTs can be obtained by means of chronometric techniques, such as the inspection time (IT) paradigm and a variety of reaction time
Understanding g 285
paradigms (Eysenck, 1982; Jensen, 1985c; Vernon, 1987). The most g- loaded ECTs have been those with response times of about one second or less in young adults. With more complex tasks requiring longer response times, subjects are liable to adopt different strategies, which often at- tenuates the correlation of RTs with psychometric g. It is interesting, for example, that individual differences in the quite long response times (averaging 1 to 2 minutes) for solving the complex items of Raven's matrices are even less correlated with IQ than is simple RT. RT averages only about 300 milliseconds, and the subject merely has to lift a finger off a button when a light flashes.
This is not the place to explain how ECTs are used to measure the different components of the processing system. For this, readers are referred to the literature. (A chapter by Jensen [1985c] and a volume edited by Vernon [1987] provide an introduction and bibliographies to this field of research, and a book by Posner [1978] surveys the use of chronometric techniques in experimental cognitive psychology.) To give the reader a sketchy idea of the methods used in this research, probably the clearest example is the difference between choice RT and simple RT. Simple RT is defined as the interval between the onset of a single stimulus (such as a light) and the person's response, such as lifting his index finger off a push- button. Simple RT measures stimulus apprehension (in addition to sense organ lag, afferent neural conduction time, efferent neural conduction time, and muscle lag). In choice RT the person executes the identical response as in simple RT, but there is complete uncertainty (i.e., randomness) as to which one of two (or more) lights will go "on." Thus choice RT measures everything measured by simple RT plus the time needed to make the d/s- crimination and choice that resolve the uncertainty after one of the lights goes "on." The difference between two-choice RT and simple RT, then, provides a measure of the time required for discrimination, or choice, which averages between 30 and 40 milliseconds in young adults. This measure is significantly correlated (negatively) with IQ, and the size of its correlations with the various Wechsler subtests is directly related to their g loadings (Jensen, 1987b; Jensen and Reed, 1990). Hence the time needed to resolve the uncertainty in making even a quite simple sensory discrimination is re- lated to g.
Other components of the processing system shown in Fig. 1 can be similarly assessed with chronometric techniques that measure, for example, the time required to visually scan a short series of letters or digits (ap- prehension, discrimination, and encoding), and a similar series held in short-term memory (retrieval of information from short-term memory), and responding differentially to pairs of highly familiar words depending on whether they are synonyms or antonyms (apprehension, discrimination, en-

286 Jensen
coding, and retrieval of information from long-term (semantic) memory. These very brief time measurements - typically only fractions of a second - are correlated with g. Hence it is assumed that each of the processes reflected by these ECTs, such as stimulus apprehension, encoding, dis- crimination, visual scanning, short-term memory scanning, and retrieval of information in long-term memory, is one of the components of g. That is what is meant by a "process theory" of g (Larson and Saccuzzo, 1989).
No one of these ECT measurements accounts for more than some small fraction of the variance in the psychometric g obtained from the Wechsler battery or from a highly g-loaded test such as the Raven matrices. But RT measurements from a small number of ECTs specially selected to represent as many as three or four distinct processing components have been found to have multiple correlations with psychometric g between .50 and .70 in college samples (Carroll, 1991a,b, 1992; Kranzler and Jensen, 1991a,b; Vernon, 1983). The correlation would probably be even higher in the general population because of its much wider range of ability. Whether RT measurements derived from larger and more diverse batteries of ECTs than have been tried so far would yield an even larger multiple correlation with psychometric g remains to be determined. It no longer seems a far- fetched conjecture that virtually all of the true variance in a "good" psychometric g (as previously defined) could be accounted for by a battery of chronometric tasks in which none of the variance can be attributed to intellectual content. It might even be possible that some combination of strictly physiological indices could account for nearly all of the true variance in a "good" g.
T h e o r e t i c a l I s s u e s
Now I should indicate briefly what seem to be some of the main theoretical questions that currently interest those who do research on the process analysis of g. Although there seems to be no question that in some sense g reflects the overall quality of the information-processing system (and, by inference, of the brain), researchers still wish to discover precisely what constitutes the fundamental nature of this quality in which people differ.
No one has yet identified any ECTs that are not correlated with one another. Nor has there been derived from any ECTs measures of any elementary cognitive processes (ECPs) that are not correlated with one another. In other words, there also is a general factor among ECTs and among ECPs, at least those that have been identified and studied chronometrically. And this general factor of the ECTs is substantially cor-

Understanding g 287
related with psychometric g. Therefore, the all-positive correlations among complex psychometric tests, and hence the emergence of g, cannot be ex- plained solely in terms of cognitive processes: that is, the notion that be- cause at least two or more ECPs are involved in every complex test, all complex tests must be positively correlated with one another. The fact that the simplest ECTs or ECPs that anyone has yet been able to isolate and mea- sure are correlated with one another suggests the more likely hypothesis that psychometric g consists of whatever constitutes the common variance among ECTs plus the common variance among complex tests due to their involving some of the same ECTs, which includes the group factors and specificity of these ECTs as well. If this is indeed true, however, one should expect that besides the general factor extracted from a number of ECTs (reflecting different ECPs) there should be one or more other factors (un- correlated with the general factor of the ECTs) that are correlated with psychometric g. If only the general factor of a number of ECTs is correlated with psychometric g or far outweighs the correlation of all other ECT fac- tors with g, then a process explanation of g will have proven inadequate. This is not to say that the hypothesized processes are nonexistent, but only that they are not an adequate explanation of g, because g is manifested in each of the processes. Hence the unitary nature of g is still in doubt and continues to be a subject of controversy (e.g., Kranzler and Jensen, 1991a,b, 1992; Carroll, 1991a,b, 1992).
Although individual differences in performance on most ECTs are measured by RT and hence represent differences in the speed of informa- tion processing (which is correlated with g), it does not necessarily mean that g can be explained solely as the speed of information processing. This is because the trial-to-trial intraindividual variability in RT, symbolized SDRT (i.e., the standard deviation of a person's RTs over n trials), is more highly correlated (negatively) with g than is median RT (over n trials), despite the fact that SDRT has lower reliability than median RT (Jensen, in press a). And SDRT surely is not a measure of speed. There seems no way to explain how individual differences in speed (or median RT) could directly cause individual differences in SDRT. But a causal connection from SDRT to median RT is quite straightforward. As Eysenck (1987) has hypothesized, individuals may differ in the amount of random "noise," or errors in the transmission of information in the nervous system, so that RTs are randomly variable from trial-to-trial. The amount of inter-trial variability in RT, measured by SDRT, would reflect the "noise" level of the nervous system. "Noise" interferes with information processing, requir- ing repetition of stimulus input or repetition of certain steps in the se- quence of i n f o r m a t i o n processing. It is ana logous to a t e l ephone conversation when there is random noise on the line. Some words or
288 Jensen
phrases are obscured at random and occasionally have to be repeated in order to get the message across, making it take longer than it would if there were a higher signal-to-noise ratio.
If RT is merely an indirect reflection of the nervous system's general signal/noise ratio, for which SDRT is a more basic or direct measure, then one should expect a perfect correlation (after correction for attenuation) between individual differences in median RT and SDRT. A considerably less than perfect correlation (after correction) would suggest that at least two uncorrelated factors are involved in median RT and SDRT, which then prompts the question of whether it is both factors or only the factor that median RT and SDRT have in common that accounts for their correlation with psychometric g. Recent studies indicate that both variables are related to g jointly as well as independently (Jensen, in press a).
The emergence of a g factor from the information-processing system might also be viewed in terms of a hierarchical dependency among the various available processes. A weakness at a more basic level of the process- ing sequence would hinder processing at subsequent levels, much as a par- tial block in a major artery reduces blood flow further down the line in many branches of the arterial system. An interesting phenomenon that seems consistent with this notion is the fact that in multitest batteries, such as the Wechsler tests, there is a larger g factor, in terms of the proportion of the total variance accounted for, in low IQ groups than in high IQ groups (Detterman and Daniel, 1989). The average correlation between subtests for the lower half of the total IQ distribution is nearly twice as large as the average correlation in the upper half of the distribution. High IQ groups appear to have developed more highly differentiated abilities, so that g becomes a less prominent factor in their performance on a wide variety of tests. An economic analogy is that a poor person might spend income on a much smaller variety of things than would a rich person. Be- cause of the greater efficiency of their elementary information processes, high IQ persons can develop and use a variety of higher-order information processes and acquired cognitive skills. Some of these more specialized processes and skills become automatic, which greatly reduces their correla- tion with g, and so they show up as group factors and specificity. Someone once said that money isn't very important if you have enough of it. The same thing could be said about g.
Capacity of Working Memory (WM). If there is a principal locus of g variance in the processing system, most theorists would point to WM. An aspect of short-term memory (STM), WM comprises the functions of focus- ing attention, conscious rehearsal, transformation and mental manipulation of information received from external sources or retrieved from long-term memory (LTM). WM is the active aspect of STM. Some theorists do not
Understanding g 289
distinguish between the passive and active aspects of STM, but it is theoreti- cally useful to do so. Hence the model in Fig. 1 distinguishes between primary memory and WM. Primary Memory is a passive holding station for recent input. WM plays the active role, manipulating or transforming the input. It can be likened to a computer's Central Processing Unit. Marked deficiency in the functions attributed to WM is exemplified in the mentally retarded, with IQs below 70. Their backward digit span, for example, is seldom more than three digits.
Both Primary Memory and Working Memory are labeled STM be- cause the neurally encoded traces of information contained in them un- dergo rapid loss and become inaccessible within a matter of seconds, unless they are continuously rehearsed and "filed" in LTM. Consolidating infor- mation held in STM into LTM is a function of WM. The storage capacity of LTM is practically unlimited. But a crucial characteristic of STM is its very limited capacity. Because of this limitation, WM can act on only a certain amount of information per unit of time, which some theorists ex- press as number of bits per second. (A bit is the binary logarithm of the number of alternative choices in a decision process, or the amount of in- formation needed to reduce uncertainty by one-half.) An excessive rate of information input overloads the capacity of WM, causing a "breakdown" of processing and some loss of information. Who hasn't looked up a telephone number, and just as you are about to dial it, you are asked a question that demands a quick answer? Usually you have to look up the number again.
Empirically there is an intimate relationship between the capacity limitation of WM and the speed of processing as measured by RT tasks. In a so-called dual task paradigm, in which the subject must attend to two distinct tasks either simultaneously or in quick succession, RT appears to be a more sensitive indicator of capacity than is RT on a single task. The RT in dual tasks turns out to be slightly more highly correlated with g than is RT on either of the dual tasks when they are taken as single tasks (Fogar- ty and Stankov, 1982; Jensen, 1987a). For example, if an experimenter presented a person with a set of several digits to retain for later recall, immediately required the person to perform a single choice RT task, and then cued the person to recall the digits, the person's RT would be sig- nificantly longer, on average, than if RT were measured by the same choice RT task alone, unaccompanied by the digit span task. It is as if RT is at least partly a function of the available capacity of WM. The more fully WM is occupied, the slower is the reaction to an external stimulus.
Capacity seems a necessary concept for understanding g, because per- sons do not show the same rank order in ability on tasks that place greater or lesser amounts of strain on WM. If there were just a single cause of
2 ~ ~ n ~ n
individual differences, say, speed of processing, then one should expect a perfect (disattenuated) correlation between single-task RT and dual task RT, for example. Yet there is not a perfect correlation. Another example is the comparison of forward digit span (FDS) and backward digit span (BDS): they are not perfectly correlated. BDS is subjectively harder. Fewer digits can be recalled in the BDS task, and apparently the mental operation of reversing the digit series takes up more of the capacity of WM than is taken up by FDS. Interestingly, BDS has almost double the correlation with IQ as FDS (Jensen and Figueroa, 1975).
Most theorists believe that at least two distinct fundamental variables are needed to explain g: (a) the speed of information processing (which at a more basic level of analysis could be due to neural "noise" as previously explained), and (b) the capacity of WM. But how can we conceptualize the connection between capacity and processing speed? Psychologists in Erlan- gen, Germany have given this problem the most attention so far (e.g., Lehrl and Fischer, 1988). Although their terminology differs from that used here, they argue essentially that the capacity (C) of WM (expressed in bits of in- formation) is the product of the speed (S) of information flow, or processing speed (in bits per second) and the duration time (D) of neural traces in STM. That is, C bits = S bits/see x D sec. Assuming that the parameters S and D are to some degree independent sources of variance, this formulation is con- sistent with the previously described phenomena related to dual tasks and forward and backward digit span. Experiments by the Eflangen psychologists have given estimates of these parameters in average adults, approximately, of S = 15 bits/see, D = 5--6 see, and C = 80 bit. Accordingly, for this theory, a measure of the capacity of WM should be more highly correlated with g than any measure of processing speed alone. Vocabulary tests, which are loaded on a verbal factor, are also known to be even more highly loaded on g. Lehrl and Fisher (1988) reported correlations of .67 and .88 between their experimental measure of STM capacity (as C = S × D) and scores on a vocabulary test in two samples of adults, with Ns of 672 and 66, respectively.
Controlled and Automatic Processing. Two forms of information processing are relevant to understanding the capacity of Working Memory: controlled processing and automatic processing (Shiffren and Schneider, 1.977).
Controlled processing is characterized by all of the previously described limitations of Working Memory. It demands full conscious attention, it can process only a very limited amount of information per unit of time, and attention cannot be divided between two or more tasks or between separate mental operations, which therefore must be performed sequentially, rather than simultaneously or in parallel. Controlled processing also requires con-
Understanding g 291
scious effort; one subjectively experiences increasing mental strain as the rate of information input threatens to exceed the capacity of one's WM.
Automatic processing is practically the opposite of controlled process- ing. It requires little or no conscious attention or effort, it can process rela- tively large amounts of information in a limited time, and it can deal with distinct tasks or mental operations simultaneously in parallel. When auto- matic processing is possible, it frees WM for the controlled processing of information that can be dealt with only in that mode.
Automatic processing becomes possible to the extent that there is consistency in the procedure for performing certain tasks. Hence procedural knowledge (e.g., how to extract the square root of any number), is more amenable to automatization than is specific declarative knowledge (e.g., "pi = 3.1416+" or "Lincoln was our 16th President"). Automatization can be depended on least in the solution of highly novel problems for which no specific procedures or strategies have been previously learned (e.g., Raven's Progressive Matrices).
A mental skill, in contrast to general ability, or g, is automatized pro- cedural knowledge. Automatic processing comes about only through exten- sivepractice and corrective feedback with a fairly specific class of tasks. For example, a digit span test generally reflects the capacity of STM, provided subjects have not had extensive practice on digit span. Rather unexception- al college students, with a forward digit span of only seven digits, have been shown to raise their digit span to 70-100 digits after some 200 or more practice sessions distributed over 2 years (Chase and Ericsson, 1981, 1982). The ability to recall long strings of digits after a single presentation represents an automatized skill rather than an increased capacity of WM. This is evident from the fact that these students show no increase in letter span or word span as a result of extensive practice on digit span. The effects of practicing a particular skill are quite task-specific and show a surprisingly narrow transfer gradient for other tasks. But to the extent that a complex task (such as playing chess or sight-reading music or solving math problems) has certain consistent components that lend themselves to the development of automaticity, the processing load on WM is greatly reduced, thereby freeing it to deal with only the unique or novel aspects of the given task. This largely explains why an expert in a part icular field appears so phenomenally skilled when compared with a novice even though the expert and the novice may not differ in general ability.
Because WM seems to be central to the manifestations of g in task performance, especially when capacity is somewhat strained, and because the development of automatic processing of some of the task components decreases the strain on WM, one should expect cognitive tasks to become less g loaded as per formance on them becomes more automatized.
292 Jensen
Prolonged practice on any specific class of complex tasks that involve con- sistent procedural components lessens their g loading.
What is yet unclear is just how individual differences in the develop- ment of automaticity are related to individual differences in g. The auto- matization of complex skills is seldom seen in mentally retarded persons, with the exception of the remarkable feats seen in rare individuals known as "idiot savants," whose narrowly focused skills are probably extreme in- stances of automatic processing in tasks that call for relatively little general ability (O'Connor and Hermelin, 1984).
The relationship between g and the development of automaticity is exceedingly difficult to study experimentally because of the very extended practice time required for performance to become automatic. But it is pos- sible to study, over a period of 2 or 3 years, the degree of automaticity in tasks to which all school children are exposed, such as number and letter recognition, spelling, simple number facts (e.g., addition, subtraction, and multiplication of single-digit numbers), and the like. Our research on this, with school children in Grades 4--6, indicates that automatization of these skills, assessed by chronometric methods, is correlated with g (Raven IQ), but it is also related to certain forms of scholastic achievement inde- pendently of g (Jensen, in press c; Whang, 1991). Scholastic progress depends not only on the acquisition of declarative knowledge but especially on the automatization of procedural knowledge. This includes quick access to information, pattern recognition, problem-solving strategies, and the like, stored in LTM. For example, individual differences in the speed and auto- matization of processes involved in writing skill have shown that the speed of manipulating information in WM, as measured by simple cognitive tasks, was greater in superior than in poor writers among college students (Ben- ton, Kraft, Glover, and Plake, 1984). The authors suggest that superior writers have automatized various processing programs that operate auto- matically as writing occurs, such as ordering words in a sentence and or- dering the ideas that appear together in a paragraph. An extreme case of numerical processing in one of the most astounding calculating prodigies on record was studied chronometrically, and it was found that her extraor- dinary speed of information processing was quite limited to numerical operations, which were highly automatized (Jensen, 1990).
The Improvability of g
The well-documented history of attempts to raise people's intelligence by educational and psychological means goes back about 100 years. Most efforts have focused on the mentally retarded. A comprehensive review of
Understanding g 293
this literature has concluded that no educational treatment has yet been found that will appreciably raise the level of general ability of children in the retarded and borderline range (Clarke and Clarke, 1989; Spitz, 1986). Attempts to raise general ability in average or above-average persons have been far fewer, of course, but so far there is no consistent positive evidence. A symposium on "How and How Much Can We Raise Intelligence" by leading experts in this field remains silent or openly agnostic on the im- provability of g (Detterman and Sternberg, 1982). Instead the focus is on the improvement of people's abilities through direct training of specific cog- nitive skills. But such training shows remarkably limited transfer beyond the specific class of tasks on which the particular skills were trained. Per- formance on the trained skill does not predict performance on the wide variety of other tasks that are correlated with g.
Thus, cognitive skills training is not g training. Indeed, it seems vir- tually impossible to imagine what g training would consist of. Most likely g itself is not susceptible to influence by educational or psychological means. Claims that this or that form of educational intervention has raised children's "intelligence" by so many IQ points can be explained as examples of "teaching to the test." On critical examination, such claims have never demonstrated that the g factor itself, rather than merely a score on a specific test, has been raised.
The most recent example of this phenomenon is the Milwaukee Project, a multi-million dollar experiment in which scholastically "at risk" Black children from the inner city of Milwaukee were given an unprece- dented degree of cognitive stimulation and training continuously from shortly after birth to six years of age (Garber, 1987). This study is especially instructive, because if such comprehensive treatment as was applied so in- tensively and extensively to the study's experimental group would not un- equivocally effect a rise in g, it seems most doubtful that less strenuous interventions, such as Head Start, would have a practically important effect on g. Just before the experimental group of the Milwaukee Project entered the first grade, their Wechsler IQs averaged about 30 points higher than a control group that was selected in infancy by the same criteria. But by the end of first grade, the experimental and control groups did not differ significantly in scholastic achievement, and by the fourth grade both groups were at approximately the 10th percentile in scholastic achievement - a level of performance commensurate with an IQ of 80. Normally, IQ (as an approximate index of g) is quite highly correlated with scholastic per- formance, and if the training had affected g and not just the specificity of the IQ scores, the treated and untreated groups should have differed markedly in scholastic performance. But they did not. A reasonable inter- pretation of this striking result is that it was the specificity of the IQ test
294 Jensen
that had been raised, while g remained unaffected. Hence, the IQ was "hol- low" with respect to g for the treated group, but was normally predictive for the control group. (The Milwaukee Project has been reviewed in detail elsewhere [Jensen, 1989b].)
The apparent resistance of individual differences in g to psychologi- cal or educational influences is consistent with the theory that variance in g is essentially a function of biological factors, both genetic and con- stitutional. Hence good general physical health (pre- and post-natal), the absence of perinatal trauma and childhood diseases, and optimum nutri- tion throughout the developmental years probably contribute much more of the environmental variance in g than do psychological and educational factors, assuming a normally humane social environment. A fairly con- vincing case has been made that the rather large gains of about 3 IQ points per decade observed in the industrialized world over the past half- century may be largely due to improved nutrition in the general popula- tion, especially with respect to vitamins, minerals, and trace elements (Benton and Cook, 1991; Eysenck and Eysenck 1991; Lynn, 1990). Also, widespread inoculation for childhood diseases and advances in health care could be contributing factors. Attempts to raise the level of g probably would have a better chance for success by focusing on these biological factors, especially nutrition, than could be effected by any strictly behavioral intervention.
Although it appears increasingly unlikely that g itself can be raised by behavioral means, a number of psychological-educational methods have been tried for getting around the educational and employment disad- vantages associated with the enormously wide spread of individual differen- ces in g. I have reviewed these methods in detail elsewhere, with many references to the relevant literature, including other reviews (Jensen, in press b). So here I will only summarize my conclusions regarding these methods. They fall into three main classes: (1) Aptitude x Treatment Inter- action (ATI), (2) Mastery Learning, and (3) Thinking Skills Training.
(1) ATI consists of discovering the distinct optimum type of instruc- tion for each level of ability. Evidence on ATI indicates modest success in improving the scholastic achievement of below-average pupils by means of direct instruction in the specific content and skills of the curriculum, with highly structured lessons designed to minimize the burden of complex in- formation processing for the learner, thereby lessening the importance of g. The effects of ATI generally are not dramatic, but ATI seems preferable to subjecting pupils at every level of ability to the same instruction, which typically results in high failure rates and discouragement among the less able pupils.
Understanding g 295
(2) Mastery Learning requires almost every pupil to attain a high level of mastery (say, at least 90% mastery) of the knowledge or skill content of a given lesson before being permitted to go on to the next lesson in a presumably well-planned sequence. Because time-to-learn is highly correlated with g, and time for study is limited, there is necessarily a trade-off between degree of mastery and amount learned. Mastery learning does not get around this. The result is that low-g pupils will master a relatively small amount of scholastic material in the same amount of time that high-g pupils will master much more. The advantage to slow learners is that the method more or less insures that they will master the basics beyond the level that would occur if they were not al- lowed to achieve mastery at each step. Their educational attainment therefore may extend to a somewhat higher level than would be likely to happen under non-mastery instruction, which engenders a cumulative achievement deficit. A deficit at one stage of learning a subject usually hinders learning at more advanced levels; the resulting cumulative deficit as the pupil is confronted by increasingly advanced material results finally in a lower asymptote of achievement than would be the case under mastery learning. But so great is the range of individual differences in g in the typical school that, under mastery learning, while some high school pupils are still struggling to master fractions and decimals, some others will be learning calculus and Boolean algebra, assuming that the pace of instruction has not hindered the ablest pupils.
(3) Training Thinking Skills is just that. It teaches fairly general strategies for problem solving, critical thinking, analysis and interpretation of written material, self-guidance of learning, and the learner's monitoring his or her own progress. Such training has positive effects on educational achievement, but the greatest beneficiaries have been the abler pupils. That should not be surprising, because the efficiency of acquiring and applying these rather complex thinking tools is predictably related to g.
In summary, although a case can be made that each of these methods has ceratin educationally desirable effects, the evidence also leaves little doubt that they do not come anywhere near to overcoming the problem of the wide range of g in school or the workforce. Consequently, faced with the considerable g demands of a technological society, some sizable proportion of our population, perhaps even more than 20%, unfortunately, suffers a severe limitation in economic productivity and self-sufficiency. Psychological and educational research has not yet discovered, and may never discover, any means that would trivialize this disadvantage. Certainly in the foreseeable future we will have to face the reality of the personal and social problems associated with large differences in g.
296 Jensen
Subpopulation Differences and g
Ability differences between subpopulations - racial and cultural groups and social classes - can be described only statistically, in terms of means, standard deviations, and the percentages falling above or below a specific cut-score or standard of performance.
Group differences in any abilities or traits that are correlated with educational performance, occupational level, and earning capacity become publicly most conspicuous when they are viewed in terms of differences in the proportional representation of various groups above or below a given criterion point on certain ability-related educational, occupational, or socioeconomic variables. These proportional differences often conform to predictions from only two items of information: (a) the known degree of correlation of the criterion variable with IQ, or g, when IQ has an ap- proximately normal distribution within the groups, and (b) the mean dif- ference between groups expressed in units of the average s tandard deviation (SD) of IQ within groups. (Conventionally, the population mean and SD of IQ are 100 and 15, respectively.) For example, if the separate IQ distributions of groups A and B have the same SD and the mean of group A is 1 SD higher than the mean of group B, then a cut-score placed at the mean of group A would proportionally divide group A about .50/.50; the same cut-score would divide group B about .84/.16. In other words, 84% of group B would fall below the same cut-score that 50% of group A falls below. It is a consequence of the bell-shaped form of the normal distribution of IQ. When the means of two groups differ, the proportional disparity between groups falling above or below a given cut-score increases drastically as the cut-score is moved further away from the mean of the higher distribution. Thus a cut-score placed 1 SD above the mean of group A divides its distribution .84/.16 but divides group B's distribution .98/.02. This obviously has far-reaching consequences for any educational or employment selection procedures or job advancement criteria that reflect any of the abilities on which subpopulation distributions happen to differ (Gottfredson, 1988).
The Black-White Difference. In the domain of mental ability, the mean difference between the Black and White populations has received by far the most public attention as well as the most study by psychologists and educators. For over 70 years the Black-White IQ difference has remained fairly constant at 1 to 1.2 SD, the equivalent of 15 to 18 IQ points. The SD of IQ is slightly smaller (by 2 or 3 points) in the Black than in the White population.
The research evidence now permits stronger conclusions about the nature of the average Black-White IQ difference than can be drawn con-
Understanding g 297
cerning any other group differences, such as Asian and Hispanic popula- tions, which have been much less thoroughly studied (Loehlin, Lindzey, and Spuhler, 1975; Nichols, 1987). It is quite well established, however, that the average IQ of Asians in the United States is at least on a par with the White (or so-called Anglo) population, and is slightly higher on non- verbal mental tests (Vernon, 1982). The Hispanic population in the U.S. is so diverse in racial, national, linguistic, and cultural background as to preclude any simple generalization, and a proper analysis here would be a sidetrack. The best available evidence indicates that the mean IQ of the Hispanic population of Mexican and Puerto Rican origin is about inter- mediate between the Black and White populations (Coleman et al., 1966).
Several well-founded generalizations can be made about the nature of the Black-White (technically: Negroid-Caucasoid) IQ difference:
(1) It is not transient. It has shown virtually no change throughout the 80-years history of psychometric testing.
(2) It is not localized. In every state of the United States and in every country in Europe, South America, and Africa where psychometric tests have been used, similar differences have been found on g-loaded culture- reduced nonverbal tests.
(3) In the U.S., at least, the difference is real in the sense that it cannot be attributed in any practically significant degree to cultural bias of the tests or psychometric or procedural artifacts (Jensen, 1980). Psychometric tests of general ability have virtually the same predictive validity for educational and job performance for Blacks as for Whites (Cole and Moss, 1989; Schmidt, 1988; Wigdor and Garner, 1982). The factor structure of test batteries is essentially the same in both populations, as are item charactersitic curves, the rank order of item difficulty, correlation with chronological age, twin and sibling correlations, heritability estimates, and virtually every other psychometric parameter pertinent to test construc- tion and the conventional uses of tests (Jensen, 1980).
(4) It is well known that test scores are correlated with socioeconomic status (SES) within racial groups. But this does not explain Black-White ability differences, although the Black and White populations differ con- siderably in SES. Although discussions of Black-White ability differences often lump them together with SES differences, as if they represented the same phenomena with the same causes, they are not really the same. This is shown most clearly by the fact that the pattern of B-W differences on a variety of tests that differ in factorial composition is significantly different from the pattern of SES differences on the same set of tests in the same individuals within the White and Black groups (Jensen and Reynolds, 1982). For example, within the White population the SES difference on tests of verbal ability is larger than on nonverbal tests involving spatial visualization
298 Jensen
ability. This is just the opposite of the pattern of Black-White differences on verbal and spatial tests. When the g factor is partialed out of a battery of diverse tests, such as the 12 Wechsler subscales, leaving only residualized group factors and specificity, the pattern of subtest differences between high and low SES groups (within races) is strikingly different from the pat- tern of B-W differences. The one study in which socioeconomic status (SES), indexed by father's occupation as rated on a 5-point scale, and race (Black/White quantified as 0/1) were correlated with g (independently of the verbal, performance, and memory factors) in the standardization sample (N = 2,173) of the Wechsler Intelligence Scale for Children- Revised (WISC-R) showed correlations between g and SES of +.357 and between g and race of +.367 (Jensen and Reynolds, 1982). The correlation between g and SES with race partialed out is +.302; the correlation be- tween g and race with SES partialed out is +.315. Of course, no inferences about the direction of causality can be made from the correlations of g with SES in children who were reared by their biological parents, because both the child's level o fg and the quality of its environment are related to paren- tal genotypes. Hence studies of adopted children or of genetically-related children who are reared apart are essential for causal inference. (This is explained more fully in Jensen, 1981, pp. 173-180).
(5) The B-W difference in general ability (or g, as distinct from scores on any particular test) has so far been no more amenable to change by behavioral means than are individual differences of comparable magnitude within any racial group. Results of the two most frequently cited examples of environmentally induced IQ gains are not encouraging. As mentioned previously, the well-known Milwaukee Project succeeded in raising the IQ scores of Black children "at risk" for scholastic problems, but it did not significantly raise scholastic achievement, which normally is highly corre- lated with IQ. Hence it is doubtful that g itself was at all affected by the intensive educational program. The cross-racial adoption study by Scarr and Weinberg (1976), in which Black and inter-racial infants were adopted by white parents, seemed to show some gain in IQ when subjects were first tested at age 7 years. The gain was inferred from the fact that the average of the Black adoptees was 5 or 6 IQ points above the average for Black school children in the same locale, although they were about 20 IQ points below their adoptive parents' biological children. A 10-year follow-up study of the adoptees, who were then in high school and were still in the care of their White adoptive parents, showed a decrease in IQ and an increase in school adjustment problems (Scarr, Weinberg, and Garguilo, 1987; Weinberg, Scarr, and Waldman, 1992).
(6) The B-W difference is largely reflected more in a tests'g loadings than in any of the specific contents or other surface features of
Understanding g 299
psychometric tests. I have termed this important discovery Spearman's hypothesis, because it was first suggested by Charles Spearman (1927, p. 379), the English psychologist who invented factor analysis and discovered g. Spearman noted that the size of the mean B-W difference (expressed in standard score units) varies considerably from one cognitive test to another and that the relative differences are directly related to the g loadings of the particular tests. No other factor or property of a diverse collection of tests has been identified that so consistently predicts the size of the mean B-W difference as does the tests' g loadings. The methodological require- ments for rigorously testing Spearman's hypothesis have been discussed in detail elsewhere (Jensen, in press d,e). Spearman's hypothesis has been tested on at least 13 large representative samples of Blacks and Whites on a wide variety of psychometric tests and has been borne out in every data set (Jensen, 1985a,b,c, 1987c; Humphreys, 1985a,b; Naglieri and Jensen, 1987). Spearman ' s hypothesis also has been tes ted with var ious chronometric tests, yielding a number of RT variables that are correlated to varying degrees with g. The hypothesis was borne out even more strongly with the chronometric variables than with most psychometric batteries (Jen- sen, in press c; Lynn and Holmshaw, 1990). The linear regression of the mean B-W difference on the g loadings of 121 psychometric tests in 11 B-W samples predicts a B-W difference of about 1.2 SDs (equivalent to 18 IQ points) when a test's g accounts for all of its variance (Jensen, 1985a). No data based on fairly representative samples have been found that con- tradict Spearman's hypothesis. Indeed, Spearman's hypothesis is no longer a hypothesis but an empirical fact. It replaces the many often contradictory ad hoc explanations of the B-W difference, usually couched in terms of the peculiarities of a particular test or of single items.
However, among conventional psychometric tests, there are two group factors that consistently cause tests with large loadings on them to deviate from the prediction of Spearman's hypothesis. These are: (a) A spatial- visualization factor (e.g., Block Design, Object Assembly), which causes a larger B-W difference on a test than is predicted by its g loading, and (b) a short-term memory factor (e.g., Digit Span, Coding, [mental] Arithmetic) which causes a smaller B-W difference on a test than is predicted from its g loading (Jensen and Reynolds, 1982; Naglieri and Jensen, 1987). Similar deviations from Spearman's hypothesis among chronometric tests involving RT and movement time (MT) appear to be attributable to a motor-speed factor on which Blacks exceed Whites (Jensen, in press c).
The fact that B-W differences reflect mainly the g fac tor of psychometric and chronometric tests, along with the correlations of g with a number of non-psychometric variables (previously summarized in Sections 10-20), suggests that the B-W difference is probably not superficial. Rush-
300 Jensen
ton (1989), for example, has argued a genetic basis for the difference. He notes the fact that the variable B-W difference on the 11 subtests of the Wechsler Intelligence Scale for Children (WlSC) is correlated with the vari- able effect of inbreeding depression on these subtests, as established inde- pendently in the Japanese population. Inbreeding depression is an effect for which there is no really satisfactory explanation other than a genetic one. It depends on the presence of dominant genes that enhance the phenotypic expression of a characteristic and recessive genes, that, when inherited from both parents, have an opposite effect. Inbreeding depression is evident in all characteristics, or traits, physical and mental, in which some part of the genetic variance is attributable to dominance deviation. Because dominance increases under genetic selection, natural or otherwise, its presence has evolutionary significance. It indicates that a trait with genetic dominance is a fitness character in the Darwinian sense. It is of interest that it is mainly the g factor of present psychometric tests that reflects genetic dominance. I have explained elsewhere the causal genetic mechanism of inbreeding depression and the evidence for its effect on men- tal abilities, particularly g (Agrawal, Sinha, and Jensen, 1984; Jensen 1978, 1983).
From a scientific standpoint, what is most needed is direct study of B-W differences on all of the non-psychometric correlates of g that have already been found in research with White groups, such as average evoked potentials, glucose metabolism in the brain (PET scan), neural conduction velocity in the visual tract, and the like. Magnetic resonance imaging (MRI), which permits precise measurements of selected parts of the brain in living subjects, is another neurological technique that lends itself to this type of investigation. Willerman, Schultz, Rutledge, and Bigler (1991) reported a substantial relationship between MRI measurements of brain size and mental test scores in a college sample, controlling for sex and overall body size. Discovery of the presence or absence of a correlation between brain-size and tests' g loadings within racial groups, along with the presence or absence of consistent group differences on both types of variables, would provide answers to what at present is evidence based only on external measurements of the head (e.g., Rushton, 1988, Rushton, 1991, in press).
The full force of the information-processing model of g also should be brought to bear on Spearman's hypothesis, to discover which, if any, particular aspects of the information-processing system account for group differences in g. Our present knowledge of this is extremely sketchy (Jen- sen, 1988). Researchers should find out, for example, whether the differen- ces reside in particular elementary cognitive processes (ECPs) or in metaprocesses, in the capacity of working memory, in the speed of retrieval
Understanding g 301
of information from long-term memory (LTM), or in the way information is encoded and organized in LTM or in the automaticity of cognitive skills. A beginning to this line of investigation is seen in recent studies using chronometric techniques to test hypotheses about the nature of racial dif- ferences in terms of information-processing components. These studies reveal significant racial differences in chronometric variables derived from certain elementary cognitive tasks that are differentially correlated with g (Jensen, in press c; Jensen and Whang, in press; Lynn and Holmshaw, 1990; Lynn and Shigehisa, 1991).
EDUCATIONAL IMPLICATIONS OF A PROCESS EXPLANATION OF g
As in any other natural science, educational psychology must be properly descriptive and explanatory. Application and prescription are only a part of it. Description of the empirical phenomenon of g and its many correlates outside the realm of psychometrics, along with the endeavor to formulate an explanatory theory of the nature of g in terms of its causal mechanisms, at this point in time must be viewed as largely serving the descriptive and explanatory role of our science. But such a role has a venerable history in the natural sciences, for example, in such nonapplied and nonprescriptive fields as astronomy, cosmology, evolutionary theory, paleontology, and taxonomy. So we should not belittle the study of g simply because at present we are uncertain as to how the knowledge gained there- by might be applied in educational practice. In every field of applied science
- agriculture, engineering, medicine - trial-and-error applications have al- ways run in advance of scientific understanding. Such understanding usually comes later, explaining why some practices are effective and why others fail. Educational psychology is no exception. Description and explanation must be a large part of its function. And it is a necessary function if applied educational research is to amount to more than an endless parade of in- novative fads, each new one turning out to be as disappointing and ephemeral as the last one.
But neither should there be a moratorium on thinking about the pos- sible practical consequences of descriptive and explanatory science. Some of the most visible educational and social correlates and consequences of g, made especially problematic in the United States by the fact of sub- population differences in g, whatever their cause, have been forthrightly discussed elsewhere (e.g., Bereiter, 1987; Jensen, 1991a, in press b; Nichols, 1987). Whether the information-processing analysis of g, as discussed in this article, can have any practical applications in dealing with the problems
302 Jensen
of public education attending the great variability o f g in the population has scarcely been considered so far. Some brainstorming on this point would seem in order, but this article and this journal are not the proper forum. This is mainly because the presently perceived problems of public education are not just a problem of the schools or a problem for educa- tional research per se. They encompass a much larger social context, from which school problems and their solution cannot be theoretically divorced. And g is one of many factors that figures also in this larger social context.
Discussion of the eventual practical importance of what begins as descriptive and explanatory investigation must be frankly speculative. With this caveat, it seems appropriate to suggest some of the avenues for the development of practical applications of the information-processing analysis of g.
First, there is potential usefulness of ECTs and chronometric techni- ques in the psychological assessment of persons with manifest cognitive deficits. Because g-loaded ECTs can be devised that have virtually no in- tellectual content, it is possible with chronometric methods to distinguish between knowledge-based problems and problems directly related to elementary information processes and metaprocesses. (Specific acquired scholastic skills, e.g., the subskills involved in reading and arithmetic, I would class as knowledge-based.) Most conventional psychometric tests, al- though they may be highly g loaded, are poorly suited for this particular purpose because the vehicle for reflecting g consists of test items calling for specific knowledge and skills. These affect the measured level of per- formance of individuals to the extent that they have had unequal oppor- tunities to acquire the called-for knowledge and skills. Also, localization of a g-related deficiency in terms of a certain element in the information- processing system (e.g., stimulus encoding or speed of retrieval of infor- mation from LTM), or detection of a person's not having adequately automatized certain mental operations to prevent their over-crowding working memory, hinders the learning of more complex material that in- corporates those operations. Whether remediation of a particular process- ing deficiency or its circumvention are possible or feasible is open to empirical investigation.
Second, as I have elaborated elsewhere (Jensen, 1991b), measure- ments of g by means of ECTs and chronometric techniques could serve as an "anchor" for psychometric tests of g. The question of secular changes in the level of g in the population cannot be answered with conventional psychometric tests, in which the vehicle for g is based on specific knowledge and skills, the availability of which can change over time. The causal basis of any secular trends revealed by the National Assessment of Educational Progress (NAEP), for example, will remain ambiguous when the tests in-
Understanding g 303
volve exclusively scholastic knowledge and skills. Score increases could be attributable to advances in nutrition and health care, or to changes in the birthrates of different segments of the population that differ in g, rather than to improvements in schooling per se. Chronometric measures of per- formance on a variety of ECTs devised to reflect a number of information processes can be used as the independent variables in a multiple-regression equation to predict a psychometric g derived from a battery of conventional psychometric tests (or of scholastic achievement tests). This regression equation obtained at a given point in time then can be used, along with the same chronometric and psychometric tests, at a future time to assess the secular trends in g and scholastic achievement, analyzed in terms of knowledge-based and process-based changes over time.
Third, quantitative study of the natural development in mental ability from early childhood to maturity would be greatly helped by the use of g-loaded chronometric variables, which are measured on an absolute, or ratio scale. Also, the same set of g-loaded ECTs can be administered to subjects over a very wide age range. Conventional mental tests have neither of these advantages; the scores are seldom an interval scale and are usually no more than ordinal scales; and because the scores are based on the num- ber of correct and incorrect responses on items graded in level of difficulty, the tests must have different item contents for different age groups. The measurement of developmental status is important for educational practice because of maturational changes in a child's readiness for learning certain skills, and because at any given chronological age there is a wide range of individual differences in readiness. Probably the most accessible facilitator of scholastic learning is matching the task-to-be-learned to the child's readi- ness. Matching instruction to readiness is unfortunately problematic in schools where different population groups, on average, show quite different levels of readiness at the same chronological age. Readiness does not in- crease as a linear function of chronological age, least of all in individuals. And it is likely that even the various elementary cognitive processes in- volved in g are not all on the same growth curves. Developmental and educational psychologists as yet have little secure knowledge of what con- stitutes readiness for any particular learning. The necessary prerequisite knowledge and skills can be inferred to some extent, but next to nothing is known about the readiness level of the information processes involved.
Finally, although g is only one of many psychological and social factors that influence scholastic performance, it is demonstrably so central as to warrant the fullest effort of educational psychologists to more fully under- stand its nature and significance for education and society. The endeavor necessarily involves different levels of analysis and an inevitable division of labor, including traditional psychometrics, mental chronometry and ex-
304 Jensen
p e r i m e n t a l cogn i t i ve psycho logy , t h e n e u r o s c i e n c e s , d e v e l o p m e n t a l a n d q u a n t i t a t i v e genet ics , a n d e v o l u t i o n a r y biology. E v e n soc io logy m i g h t b e i nc luded , if sociologists eve r c o m e to a d m i t any b e h a v i o r a l va r i ab l e s t ha t have b io logica l cor re la tes .
R E F E R E N C E S
Agrawal, N., Sinha, S. N., and Jensen, A. R. (1984). Effects of inbreeding on Raven Matrices. Behav. Genet. 14: 579-585.
Benton, D., and Cook, R. (1991). Vitamin and mineral supplements improve the intelligence scores and concentration of 6-year-old children. Personal Indiv. Diff. 12: 1151-1158.
Benton, S. L., Kraft, R. G., Glover, J. A., and Plake, B. S. (1984). Cognitive capacity dif- ferences among writers. Z Educat. PsychoL 76: 820-834.
Bereiter, C. (1987). Jensen and educational differences. In Modgil, S., and Modgil, C. (eds.), Arthur Jensen: Consensus and Controversy, The Falmer Press, New York.
Bouchard, T. J., Jr., Lykken, D. T., McGue, M., Segal, N. L., and Tellegen, A. (1990). Sources of human psychological differences: The Minnesota study of twins reared apart. Science 250: 223-228.
Carroll, J. B. (1991a). No demonstration that g is not unitary, but there's more to the story: Comment of Kranzler and Jensen. Intelligence 15.
Carroll, J. B. (1991b). Still no demonstration that g is not unitary: Further comment on Kranzler and Jensen. Intelligence 15.
Carroll, J. B. (1992). The unitary g problem once more: On Kranzler and Jensen. Intelligence 16.
Chase, W. G., and Ericsson, K. A. (1981). Skilled memory. In Anderson, J. R. (ed.), Cognitive Skills and Their Acquisition, Lawrence Erlbaum Associates, Hillsdale, NJ.
Chase, W. G., and Ericsson, K. A. (1982). Skill and working memory. In Bower, G. H. (ed.), The Psychology of Learning and Motivation (Vol. 16), Academic Press, New York.
Clarke, A. M., and Clarke, A. D. B. (1989). The later cognitive effects of early intervention. Intelligence 13: 289-297.
Cohn, S, J., Cohn, C. M. G., and Jensen, A. R. (1988). Myopia and Intelligence: A pleiotropic relationship? Hum. Genet. 80: 53-58.
Cole, N. S., and Moss, P. A. (1989). Bias in test use. In Linn, R. L. (ed.), Educational Mea- surement (3rd Ed.), Macmillan, New York.
Coleman, J. S., et aL (1966). Equality and Educational Opportunity, U. S. Department of Health, Education and Welfare.
Detterman, D. K., and Daniel, M. H. (1989). Correlations of mental tests with each other and with cognitive variables are highest for low IQ groups. Intelligence 13: 349-359.
Detterman, D. K., & Sternberg, R. J. (eds.) (1982). How and How Much Can Intelligence Be Increased, Ablex, Norwood, NJ.
Estes, W. K. (1982). Learning, memory, and intelligence. In Sternberg, R. J. (ed.), Handbook of Human Intelligence, Cambridge University Press, Cambridge.
Eysenck, H. J. (ed.) (1982). A Model for Intelligence, Springer-Verlag, Heidelberg. Eysenck, H. J. (1987). Speed of information processing, reaction time, and the theory of in-
telligence. In Vernon, P. A. (ed.), Speed of Information Processing and Intelligence, Ablex, Norwood, NJ.
Eysenck, H. J., and Eysenck, S. B. G. (eds.) (1991). Improvement of I. Q. and behavior as a function of dietary supplementation: A symposium. Personal Indiv. Diff. 12: 329-365.
Fogarty, G., and Stankov, L. (1982). Competing tasks as an index of intelligence. Personal Indiv. Diff. 3: 407-422.
Garber, H. L. (1987). The Milwaukee Project: Preventing Mental Retardation in Children at Risk, American Association on Mental Retardation, Washington, D.C.
Understanding g 305
Gorsuch, R. L. (1983). Factor Analysis (2nd Ed.), Erlbaum, Hillsdale, NJ. Gottfredson, L. S. (1988). Reconsidering fairness: A matter of social and ethical priorities. J.
Vocation. Behav. 33: 293-319. Haier, R. J., Siegel, B. V., Nuechterlein, K. H., Hazlett, E., Wu, J. C., Paek, J., Browning, J.
L., and Buchsbaum, M. S. (1988). Cortical glucose metabolic rate correlates of abstract reasoning and attention studied with positron emission tomography. Intelligence 12" 199- 217.
Harman, H. H. (1976). Modem FactorAnabysis (revised 3rd Ed.), University of Chicago Press, Chicago.
Humphreys, L. G. (1985a). Race differences and the Spearman hypothesis. Intelligence 9: 275- 283.
Humphreys, L. G. (1985b). Attenuated hypothesis or attenuated test of hypothesis? Intelligence 9: 291-295.
Hunter, J. E. (1986). Cognitive ability, cognitive aptitudes, job knowledge, and job perfor- mance. J. Vocation. Behav. 29: 340-362.
Jensen, A. R. (1978). Genetic and behavioral effects of nonrandom mating. In Osborne, R. T., Noble, C. E., and Weyl, N. (eds.), Human Variation: The Biopsychology of Age, Race, and Sex, Academic Press, New York.
Jensen, A. R. (1980). Bias in Mental Testin~ The Free Press, New York. Jensen, A. R. (1981). Straight Talk About Mental Tests, The Free Press, New York. Jensen, A. R. (1983). Effects of inbreeding on mental-ability factors. Personal lndiv. Diff. 4:
71-87. Jensen, A. R. (1984). Test validity: g versus the specificity doctrine. Z Soc. Biot Struct. 7:
93-118. Jensen, A. R. (1985a). The nature of the Black-White difference on various psychometric
tests: Spearman's hypothesis. Behav. Brain Sci. 8: 193-219. Jensen, A. R. (1985b). The Black-White difference in g: A phenomenon in search of a theory.
Behavior. Brain Sci. 8: 246-263. Jensen, A. R. (1985c). Methodological and statistical techniques for the chronometric study
of mental abilities. In Reynolds, C. R., Willson, V. L. (eds.), Methodological and Statistical Advances in the Study of Individual Differences, Plenum, New York.
Jensen, A. R. (1985d). Humphreys's attenuated test of Spearman's hypothesis. Intelligence 9: 285 -289.
Jensen, A. R. (1987a). The g beyond factor analysis. In Conoley, J. C., Glover, J. A., and Ronning, R. R. (eds.), The Influence of Cognitive Psychology on Testing and Measurement, Lawrence Erlbaum Associates, Hillsdale, NJ.
Jensen, A. R. (1987b). Individual differences in the Hick reaction time paradigm. In Vernon, P. A. (ed.), Intelligence and Speed of Information Processin~ Ablex, Norwood, NJ.
Jensen, A. R. (1987c). Further evidence for Spearman's hypothesis concerning Black-White differences on psychometric tests. Behavior. Brain Sc~ 10: 512-519.
Jensen, A. R. (1987d). Process differences and individual differences in some cognitive tasks. Intelligence 11: 107-136.
Jensen, A. R. (1988). Speed of information processing and population differences. In Irvine, S. H. and Berry, J. W. (eds.), Human Abilities in Cultural Context, Cambridge University Press, London.
Jensen, A. R. (1989a). The relationship between learning and intelligence. Learn. Indiv. Diff. 1: 37-62.
Jensen, A. R. (1989b). Raising IQ without increasing g? A review of "The Milwaukee Project: Preventing mental retardation in children at risk." Development. Rev. 9: 234-258.
Jensen, A. R. (1990). Speed of information processing in a calculating prodigy. Intelligence 14: 259-274.
Jensen, A. R. (1991a). Spearman's g and the problem of educational equality. Oxford Rev. Educat. 17: 169-187.
Jensen, A. R. (1991b). Speed of elementary cognitive processes: A chronometrie anchor for psychometric tests of g. PsychoL Test. Bull 4: 59-70.
306 Jensen
Jensen A. R. (in press a). The importance of intraindividual variability in reaction time. Per- sonal Indiv. Diff.
Jensen A. R. (in press b). Psychometric g and achievement. In B. R. Gifford (ed.), Current Views of Testing: A Policy Perspective, Klewer Academic Publishing Co., Boston.
Jensen A. R. (in press c). Spearman's hypothesis tested with chronometric information- processing tasks. Intelligence.
Jensen A. R. (in press d). Spearman's hypothesis: Methodology and evidence. Multivariate Behavioral Research.
Jensen A. R. (in press e). More on psychometric g and "Spearman's hypothesis." Multivariate Behavioral Research.
Jensen A. R., and Figueroa, R. A. (1975). Forward and backward digit-span interaction with race and IQ: Predictions from Jensen's theory. J. Educat. PsychoL 67: 882-893.
Jensen A. R., and Reed, T. E. (1990). Simple reaction time as a suppressor variable in the chronometric study of intelligence. Intelligence 14: 375-388.
Jensen A. R., and Reynolds, C. R. (1982). Race, social class, and ability patterns on the WISC-R. Personal Indiv. Diff. 3: 423-438.
Jensen A. R., and Sinha, S. N. (in press). Physical correlates of intelligence. In Vernon, P. A. (ed.), Biological Approaches to the Study of Human Intelligence, Ablex, Norwood, NJ.
Jensen A. R., and Whang, P. A. (in press). Reaction times and intelligence: A comparison of Chinese-American and Anglo-American children. J. Biosoc. Sci.
Jensen A. R., and Weng, L-J. (in press). What is a good g? Intelligence. Johnson, F. W. (1991). Biological factors and psychometric intelligence. Genet. Soc. Gen.
Psychol. Monogr. 117: 313. Kaiser, H. F. (1968). A measure of the average intercorrelation. Educat. Psychol. Meas. 28:
245-247. Kaiser, H. F., and Michael, W. B. (1975). Domain validity and generalizability. Educat. PsychoL
Meas. 35: 31-35. Kranzler, J. H., and Jensen, A. R. (1989). Inspection time and intelligence: A meta-analysis.
Intelligence 13: 329-347. Kranzler, J. H., and Jensen, A. R. (1991a). The nature of psychometric g: Unitary process or
a number of independent processes? Intelligence 15. Kranzler, J. H., and Jensen, A. R. (1991b). Unitary g: Unquestioned postulate or empirical
fact? Intelligence 15. Kranzler, J. H., and Jensen, A. R. (1992). Psychometric g still not unitary after eliminating
supposed "impurities": Further comment on Carroll. Intelligence 16. Larson, G. E., and Saccuzzo, D. P. (1989). Cognitive correlates of general intelligence: Toward
a process theory of g. Intelligence 13: 5-31. Lehrl, S., and Fischer, B. (1988). The basic parameters of human information processing:
Their role in the determination of intelligence. Personal. Indiv. Diff. 9: 883-896. Loehlin, J. C., Lindzey, G., and Spuhler, J. N. (1975). Race Differences in Intelligence, W. H.
Freeman, San Francisco. Lynn, R. (1990). The role of nutrition in secular increases in intelligence. Personal. Indiv. Diff.
11: 273-285. Lynn, R., and Holmshaw, M. (1990). Black-White differences in reaction times and intel-
ligence. Soc. Behav. Personal 18: 299-308. Lynn, R., and Shigehisa, T. (1991). Reaction times and intelligence: A comparison of Japanese
and British children. Z Biosoc. Sci. 23: 409-416. Lynn,, R., Wilson, R. G., and Gault, A. (1989). Simple musical tests as measures of Spearman's
g. Personal. Indiv. Diff. 10: 25-28. Marshalek, B., Lohman, D. F., and Snow, R. E. (1983). The complexity continuum in the
radex and hierarchical models of intelligence. Intelligence 7: 107-127. Naglieri, J. A., and Jensen, A. R. (1987). Comparison of Black-White differences on the
WlSC-R and the K-ABC: Spearman's hypothesis. Intelligence 11: 21-43. Nagoshi, C. T., and Johnson R. C. (1986). The ubiquity ofg. Personal Indiv. Diff. 7: 201-207. Nettelbeck, T. (1987). Inspection time and intelligence. In Vernon, P. A. (ed.), Speed of In-
formation Processing and Intelligence, Ablex, Norwood, NJ.
Understanding g 307
Nichols, R. C. (1987). Racial differences in intelligence. In Modgil, S. and Modgil, C. (eds.), Arthur Jensen: Consensus and Controversy, The Falmer Press, New York.
O'Connor, N., and Hermelin, B. (1984). Idiot savant calendrical calculators: Maths or memory? PsychoL Med. 14: 801-806.
Plomin, R. (1987). Genetics of intelligence. In Modgil, S. and Modgil, C. (eds.), Arthur Jensen: Consensus and Controversy, Falmer Press, New York.
Plomin, R. (1988). The nature and nurture of cognitive abilities. In Sternberg, R. J. (ed.), Advances in the Psychology of Human Intelligence (Vol. 4), Erlbaum, HiUsdale, NJ.
Plomin, R. (1990). The inheritance of behavior. Science 248: 183-188. Posner, M. I. (1978). Chronometric Explorations of Mind, Erlbaum, Hillsdale, NJ. Raz, N., Willerman, L., Ingmundson, P., and Hanlon, M. (1983). Aptitude-related differences
in auditory recognition masking. Intelligence 7: 71-90. Reed, T. E., and Jensen, A. R. (in press). Nerve conduction velocity in a brain pathway:
Correlation with intelligence in normal adults. Intelligence. Rushton, J. P. (1988). Race differences in behavior: A review and evolutionary analysis. Per-
sonal Indiv. Diff. 6: 441-452. Rushton, J. P. (1989). Japanese inbreeding depression scores: Predictors of cognitive dif-
ference between Blacks and Whites. Intelligence 13: 43-51. Rushton, J. P. (1991). Mongoloid-Caucasoid differences in brain size from military samples.
Intelligence 15: 351-359. Rushton, J. P. (in press). Cranial capacity related to sex, rank and race in a stratified random
sample of 6325 U.S. military personnel. Intelligence. Scarr, S., and Weinberg, R. A. (1976). IQ test performance of Black children adopted by
White families. Am. PsychoL 31: 726-739. Scarr, S., Weinberg, R. A., and Gargiulo, J. (June 1987). Transracial Adoption: A Ten-Year
Follow-Up. Abstract in Program of the 17th Annual Meeting of the Behavior Genetics Association, Minneapolis, MN.
Schmidt, F. L. (1988). The problem of group differences in ability test scores in employment selection. Z Vocation. Behav. 33: 272-292.
Shiffrin, R. M., and Schneider, W. (1977). Controlled and automatic human information processing: II. Perceptual learning, automatic attending, and a general theory. Psychol. Rev. 84: 127-190.
Smith, G. A., and Stanley, G. (1987). Comparing subtest profiles ofg loadings and correlations with RT measures. Intelligence, 11, 291-298.
Snow, R. E., Kyllonen, P. C., and Marshalek, B. (1984). The topography of ability and learning correlations. In Sternberg, R. J. (ed.), Advances in the Psychology of Human Intelligence (Vol. 2), Erlbaum, Hillsdale, NJ.
Spearman, C. (1927). The Abilities of Man, Macmillan, London. Spitz, H. H. (1986). The Raising of Intelligence: A Selected History of Attempts to Raise Retarded
Intelligence, Lawrence Erlbaum Associates, Hillsdale, NJ. Spitz, H. H. (1988). Wechsler subtest patterns of mentally retarded groups: Relationship to
g and to estimates of heritability. Intelligence 12: 279-297. Thorndike, R. L. (1985). The central role of general ability in prediction. Multivar. Behav.
Res. 20: 241-254. Thorndike, R. L. (1986). The role of general ability in prediction. J.. Vocation. Behav. 29:
332-339. Thorndike, R. L. (1987). Stability of factor loadings. Personal. Indiv. Diff. 8: 585-586. Vernon, P. A. (1983). Speed of information processing and intelligence. Intelligence 7: 53-70. Vernon, P. A. (ed.) (1987). Speed of Information Processing and Intelligence, Ablex, Norwood,
NJ. Vernon, P. A. (1989). The heritability of measures of speed of information-processing. Per-
sonal Indiv. Diff. 10: 573-576. Vernon, P. A. (ed.) (in press). Biological Approaches to the Study of Human Intelligence, Ablex,
Norwood, NJ. Vernon, P. A., and Kantor, L. (1986). Reaction time correlations with intelligence test scores
obtained under either timed or untimed conditions. Intelligence 10" 315-330.

308 Jensen
Vernon, P. A., Nador, S., and Kantor, L. (1985). Reaction times and speed-of-processing: Their relationship to timed and untimed measures of intelligence. Intelligence 9: 357-374.
Vernon, P. E. (1982). The Abih'ties and Achievements of Orientals in North America, Academic Press, New York.
Weinberg, R. A., Scarr, S., and Waldman, I. D. (1992). The Minnesota transracial adoption study: A follow-up of IQ test performance at adolescence, lnteUigence 16: 117-135.
Whang, P. A. (1991). Cognitive Factors Influencing the Mathematics Achievement of 4th, 5th, and 6th Grade Chinese American Students. Unpublished doctoral dissertation, University of California, Berkeley.
Wigdor, A. K., and Garner, W. R. (eds.) (1982).AbiliO, Testing: Uses, Consequences, and Con- troversies. Part 1: Report of the Committee: Part II: Documentation Section. National Academy Press, Washington D.C.
Willerman, L., Schultz, R., Rutledge, J. N., and Bigler, E. D. (1991). In vivo brain size and intelligence. Intelligence 15: 223-228.