Embed Size (px)
Citation preview
Understanding International Food Consumption Patterns
Yanrui Wu
Economics Program School of Economics and Commerce
University of Western Australia 35 Stirling Highway, Crawley WA 6009
Tel: 08 9380 3964 Fax: 08 9380 1016
This paper is part of the outcome of the project on the comparison of international food consumption patterns. The project is funded by an Australian Centre for International Agricultural Research (ACIAR) grant. I would like to thank Ray Trewin for his support, Kenneth Clements for his encouragement, helpful discussions and comments, and Jing Zhang and Nicole Guok for their excellent research assistance.
2
Summary
International food consumption has attracted a lot of attention in the literature. In
particular, a series of studies have been conducted using the popular International
Comparison Project (ICP) databases (released in the 1970s and 1980s). This paper adds
to the growing literature by presenting an analysis of the 1995 ICP data. It aims to
examine cross-country consumption patterns of individual food items such as cereals,
meat, dairy products and other foods. Especially, it attempts to identify international food
consumption norms and outliers, and gain insight into the impact of country-specific
factors (eg. income, geography, culture etc) on food consumption.
According to this study, as income rises, an average country in the world tends to spend
proportionally less on food and its demand for food becomes less elastic too. This trend is
however not very clear if the focus is the regions instead of income groups. At the
disaggregate level, most food items (eg. cereals, meats, fruits and vegetables, dairy
products and oils and fats) are found to be necessities. Aquatic products, alcoholic and
non-alcoholic beverages however appear to be luxuries for most countries with the
exception of the high-income ones.
Income elasticities of demand in South Asia are found to be high for all food items except
cereals and dairy products. In contrast to South Asia, dairy goods account for a small
budget share in East Asia. It is also found that the Chinese diet mainly consists of cereals,
meats, aquatic products, and fruits and vegetables. There are however considerable
3
variations among the regions in large countries such as India and China. Regional issues
can only be addressed by conducting detailed studies using household or regional data.
4
1 Introduction
International food consumption continuously attracts the attention of researchers and
policy makers not only because it is concerned with a scarce commodity in the world but
also because it is so dynamic and diverse. The pioneers in this field include Working
(1943), Leser (1963), Barten (1977), Clements et al. (1979), and Seale and Theil (1986),
to cite a few. In particular, the analytical framework proposed by Working has been
widely applied in empirical studies due to its simplicity and expanded over time because
of the availability of better statistics. This paper falls into the category of applying the
Working’s model to the latest International Comparison Project (ICP) database. The
objective of this paper is to examine food consumption patterns across the countries and
investigate how country-specific factors such as the geographical location and income
level affect international food consumption patterns. The rest of the paper is organised as
follows. The data issues are described in Section 2. The preliminary analysis of the
database is presented in Section 3. The analytical issues are then discussed in Section 4.
This is followed by the presentation of the estimation results and their interpretation in
Section 5. A more detailed analysis of the Asian economies is reported in Section 6. The
final section presents some concluding remarks.
2 Data Issues
The ICP datasets have been compiled for the years 1970, 1973, 1975, 1980, 1985, 1990
and 1995. Many reports based on pre-1995 databases have been released (eg. Kravis et al.
5
1982, Theil and Clements 1987, Rimmer and Powell 1992). There are however few
studies based on the 1995 dataset. Regmi et al. (2001) and Seale and Regmi (2002) are
two exceptions. Regmi et al. employed a two-stage budgeting process to estimate income
and price elasticities of demand for individual food items. Seale and Regmi applied a
modified Working’s model to examine income and price effects on the consumption of
nine broad categories of food and non-food commodities. The present study employs part
of the 1995 ICP database, ie. the expenditure data which were privately obtained. Due to
the nature of the data available, this study focuses on examining the impact of income on
food consumption patterns in the world. It particularly focuses on the impact of country-
specific factors such as the geographical location and income level. The 1995 ICP
database covers 114 countries. Preliminary checks of the data shows that there are serious
problems with data from thirty countries. As a result, these countries are omitted from the
empirical analysis.1 It is unfortunate that the 1995 ICP dataset does not include the
world’s two most populous countries, ie. India and China. To overcome this problem,
other secondary sources are used to compile data so that India and China are included in
the analysis.2 In order to examine food consumption patterns in the Chinese communities
(eg. Mainland China, Hong Kong and Singapore), Taiwan is also added to the database
by using data from secondary sources.3 As a result, the final sample contains 87
countries. They are divided into seven groups according to their geographical locations
1 The omitted countries are Albania, Belarus, Bulgaria, Congo, Georgia, Grenada, Jamaica, Lebanon, Macedonia, Madagascar, Malawi, Mexico, Moldova, Nigeria, Paraguay, Poland, Romania, Russia, Sierra Leone, St. Vincent & Grenadines, Syria, Tajikistan, Tanzania, Turkey, Turkmenistan, Uruguay, Venezuela, Vietnam, Yemen and Zambia. 2 Indian data are drawn from Statistical Abstract, India, Delhi: Manager of Publications, 1998. Chinese data are weighted average of rural and urban consumption figures derived from China’s Statistical Yearbook 1996 (National Statistical Bureau 1996). 3 Data for Taiwan are derived from the official statistical yearbook (Statistical Yearbook of the Republic of China 1996) and Huang and Bouis (2001).
6
and four categories according to the level of income.4 In particular, 57 developing
countries are included in the sample (see Table 1).
One of the main problems with international comparative studies is the choice of
exchange rates so that national incomes expressed in local currencies can be converted
and become compatible. For this purpose, several approaches have been developed.5 This
paper adopts the concept of the purchasing power parity (PPP) and hence employs the
conversion ratios of local currency over international dollar estimated by the World Bank
(Easterly and Yu 2000). The same ratios are also used to convert household expenditure
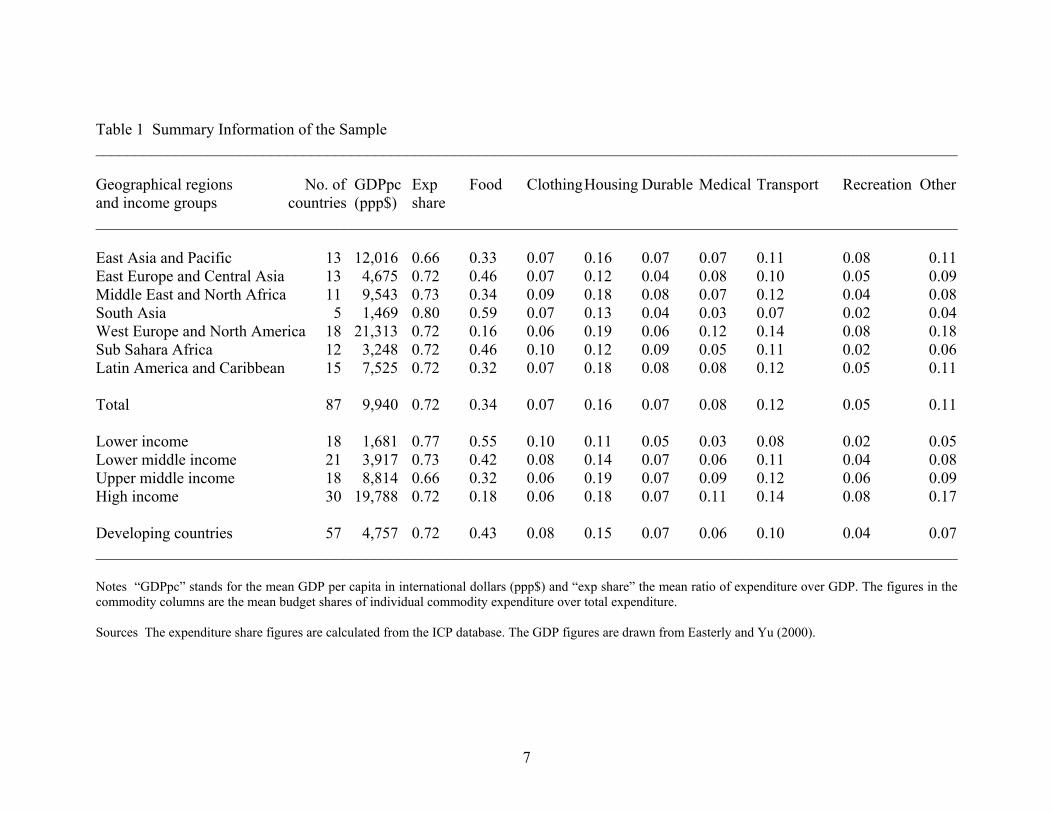
data. Some summary statistics about the sample are presented in Table 1. Several
observations can be made from this table. First, as expected, South Asia and Sub Sahara
Africa are the poorest regions in the world. Second, total expenditure on an average
accounts for more than 70 per cent of GDP among the regions with the exception of East
Asia and the Pacific where an average country tends to save more than those in the rest of
the world. Finally, food is the largest consumption item followed by housing and
transport. On an average, food expenditure amounts to about one third of total
expenditure in the world. However, there are considerable variations among the regions.
Countries in South Asia spend the most on food (59%) and those in West Europe and
North America the least (16%). These observations will be further investigated later by
analyzing cross-country statistics.
4 The lists of the countries are reported in Appendices 1 and 2. 5 For a brief review, see Clements et al. (2003).
7
Table 1 Summary Information of the Sample ____________________________________________________________________________________________________________ Geographical regions No. of GDPpc Exp Food Clothing Housing Durable Medical Transport Recreation Other and income groups countries (ppp$) share ____________________________________________________________________________________________________________ East Asia and Pacific 13 12,016 0.66 0.33 0.07 0.16 0.07 0.07 0.11 0.08 0.11 East Europe and Central Asia 13 4,675 0.72 0.46 0.07 0.12 0.04 0.08 0.10 0.05 0.09 Middle East and North Africa 11 9,543 0.73 0.34 0.09 0.18 0.08 0.07 0.12 0.04 0.08 South Asia 5 1,469 0.80 0.59 0.07 0.13 0.04 0.03 0.07 0.02 0.04 West Europe and North America 18 21,313 0.72 0.16 0.06 0.19 0.06 0.12 0.14 0.08 0.18 Sub Sahara Africa 12 3,248 0.72 0.46 0.10 0.12 0.09 0.05 0.11 0.02 0.06 Latin America and Caribbean 15 7,525 0.72 0.32 0.07 0.18 0.08 0.08 0.12 0.05 0.11 Total 87 9,940 0.72 0.34 0.07 0.16 0.07 0.08 0.12 0.05 0.11 Lower income 18 1,681 0.77 0.55 0.10 0.11 0.05 0.03 0.08 0.02 0.05 Lower middle income 21 3,917 0.73 0.42 0.08 0.14 0.07 0.06 0.11 0.04 0.08 Upper middle income 18 8,814 0.66 0.32 0.06 0.19 0.07 0.09 0.12 0.06 0.09 High income 30 19,788 0.72 0.18 0.06 0.18 0.07 0.11 0.14 0.08 0.17 Developing countries 57 4,757 0.72 0.43 0.08 0.15 0.07 0.06 0.10 0.04 0.07 ____________________________________________________________________________________________________________ Notes “GDPpc” stands for the mean GDP per capita in international dollars (ppp$) and “exp share” the mean ratio of expenditure over GDP. The figures in the commodity columns are the mean budget shares of individual commodity expenditure over total expenditure. Sources The expenditure share figures are calculated from the ICP database. The GDP figures are drawn from Easterly and Yu (2000).
8
3 Preliminary Analysis
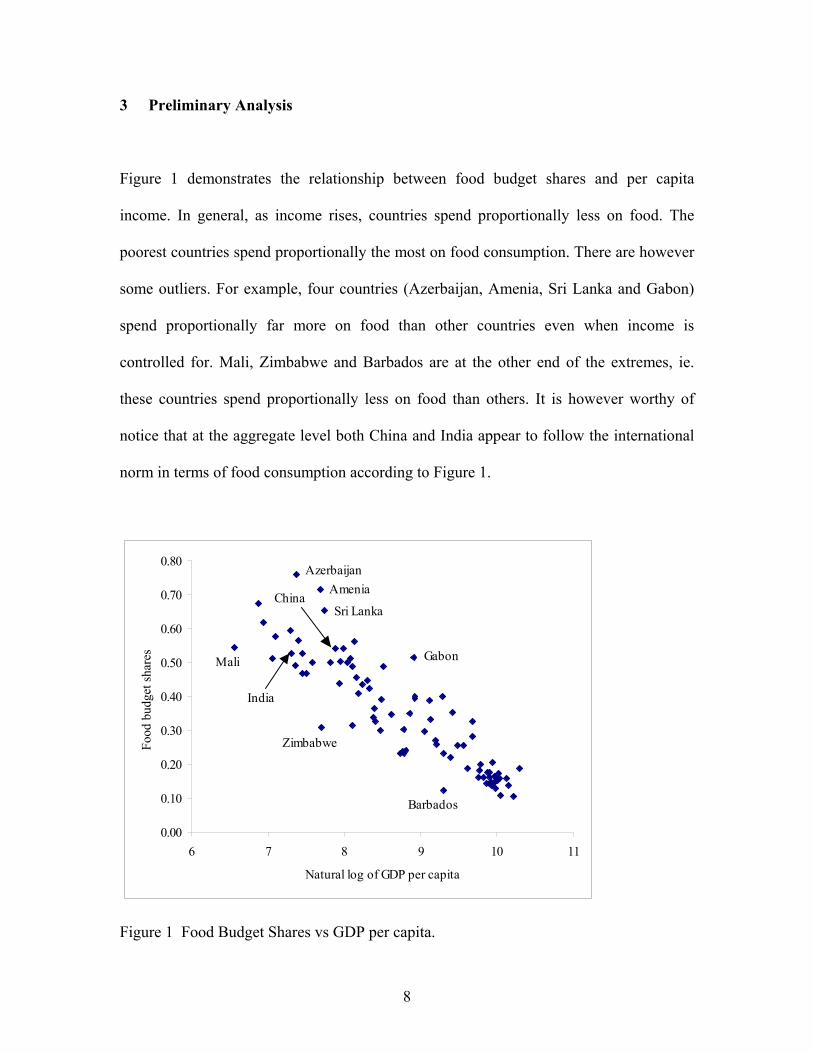
Figure 1 demonstrates the relationship between food budget shares and per capita
income. In general, as income rises, countries spend proportionally less on food. The
poorest countries spend proportionally the most on food consumption. There are however
some outliers. For example, four countries (Azerbaijan, Amenia, Sri Lanka and Gabon)
spend proportionally far more on food than other countries even when income is
controlled for. Mali, Zimbabwe and Barbados are at the other end of the extremes, ie.
these countries spend proportionally less on food than others. It is however worthy of
notice that at the aggregate level both China and India appear to follow the international
norm in terms of food consumption according to Figure 1.
0.00
0.10
0.20
0.30
0.40
0.50
0.60
0.70
0.80
6 7 8 9 10 11
Natural log of GDP per capita
Food
bud
get s
hare
s
Sri Lanka
AzerbaijanAmenia
Gabon
Zimbabwe
China
India
Barbados
Mali
Figure 1 Food Budget Shares vs GDP per capita.
9
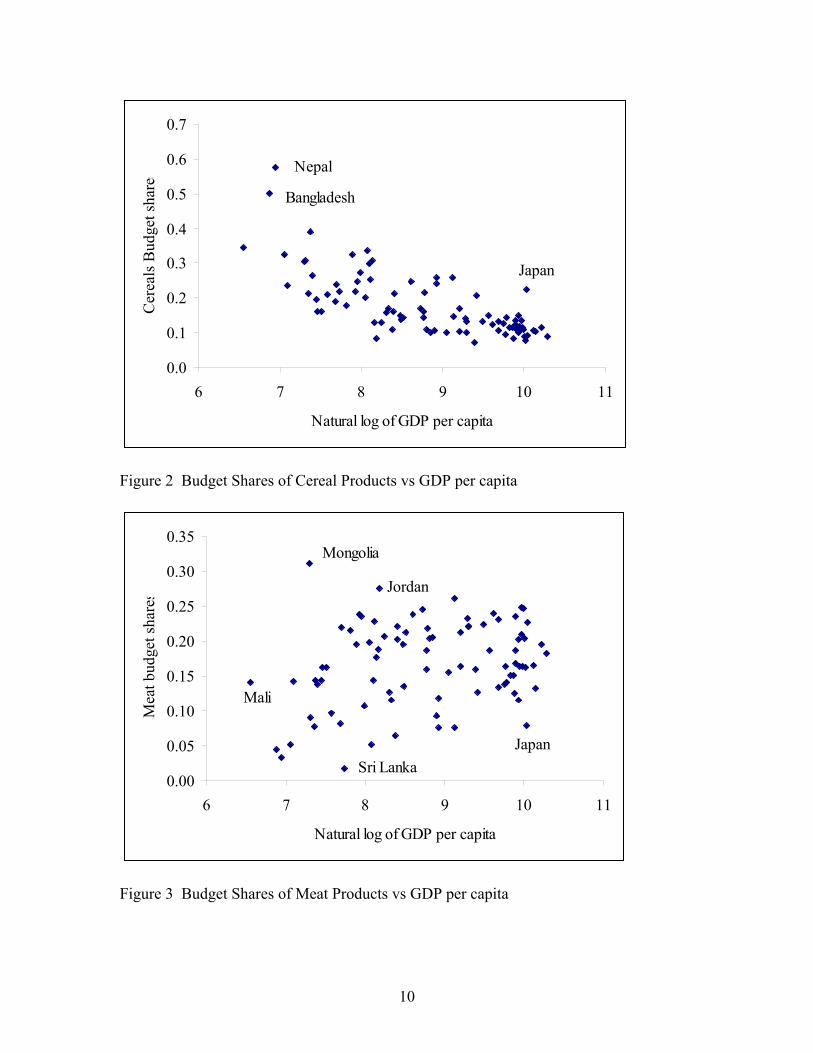
Among individual food items, rich countries tend to consume proportionally less on
cereals but more on meat products (see Figures 2 and 3). In particular, Nepal and
Bangladesh, two of the poorest countries, spend relatively the most on cereals. In the
meantime, Mali, Mongolia and Jordan spend proportionally the most on meat
consumption. Sri Lanka and Japan are also outliers. The former spends proportionally the
least on meat products. The latter, Japan, is an outlier among the developed countries.
Japanese consumers spend proportionally more on cereals and less on meat. This
consumption pattern may be due to two reasons. First, it is well known that the Japanese
agricultural sector has been heavily protected and, as a result, the prices of Japanese
cereal products, eg. rice, are much higher. Second, it appears that fish consumption
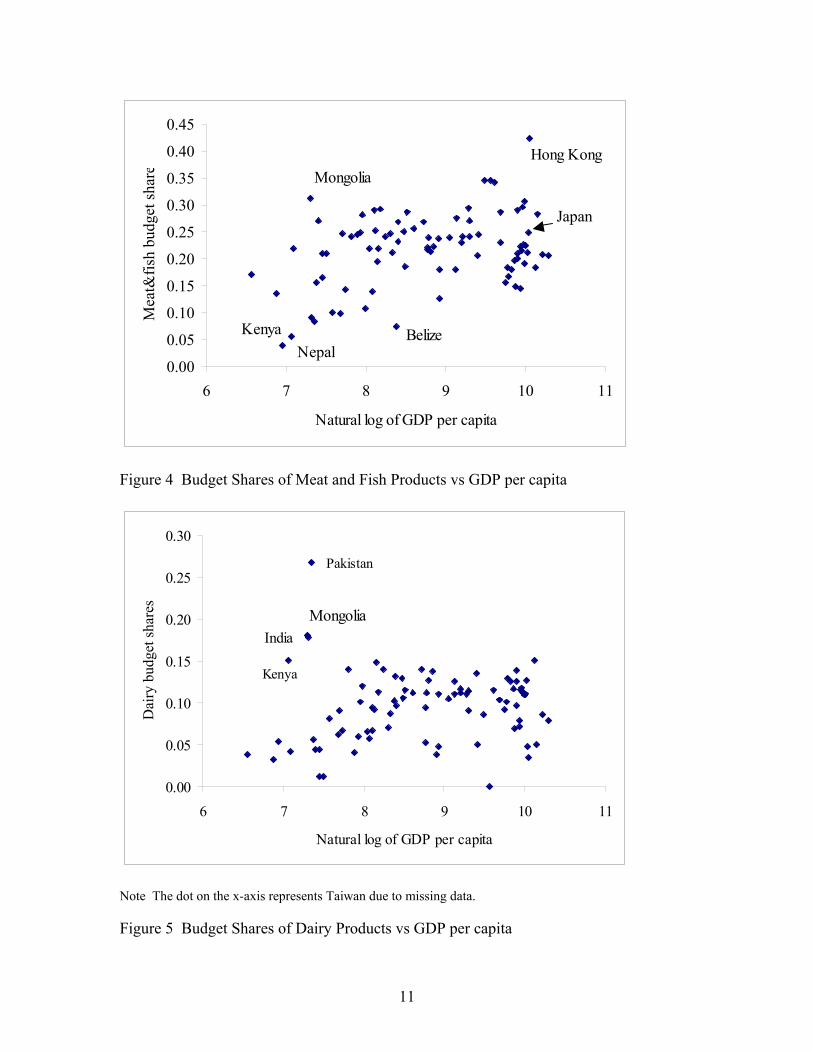
accounts for a significant part of the Japanese diet. This is evident in Figure 4 which
presents the combined budget shares of meat and fish products against the natural log of
GDP per capita. Japan is not an outlier anymore. Mongolia is still an outlier due to its
large consumption of meat. Hong Kong however leads the developed economies and its
citizens spend relatively the most on meat and fish products combined. Among the
developing economies, Nepal and Kenya are two outliers, their citizens spending
proportionally least on meat and fish products. In terms of dairy products, Pakistan, India,
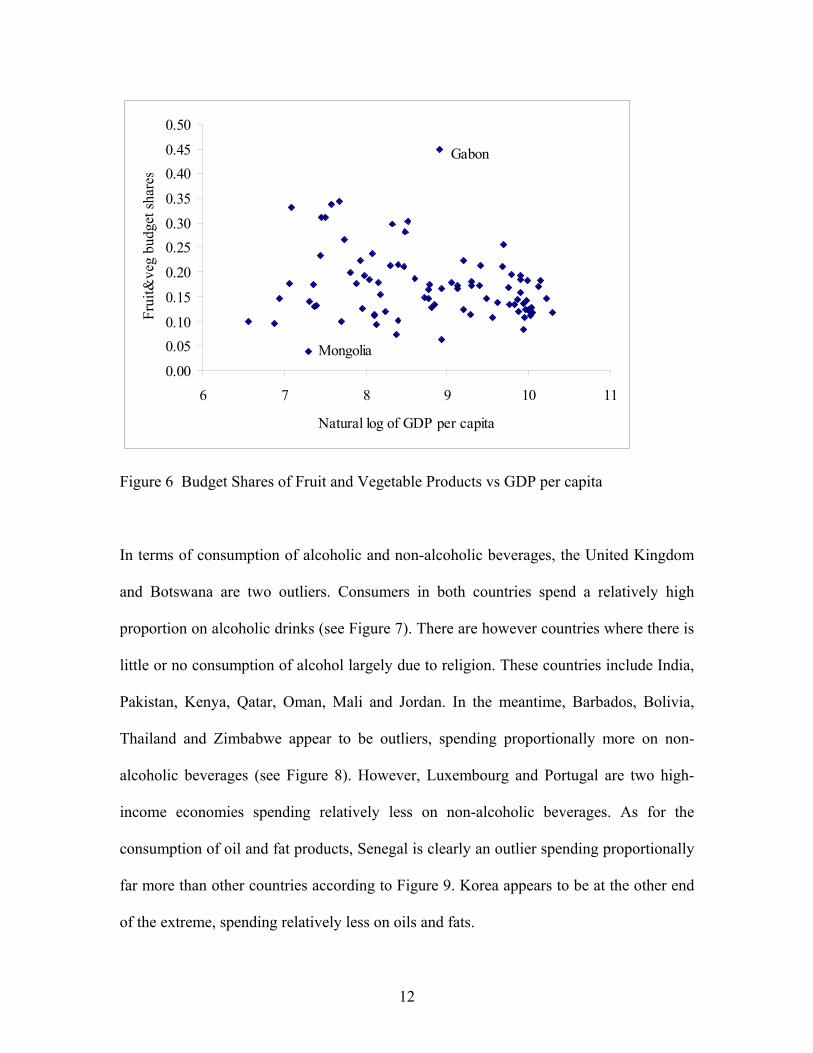
Mongolia and Kenya are clearly the outliers according to Figure 5. As for the
consumption of fruits and vegetables, Gabon appears to be an outlier. Consumers there
spend proportionally much more on fruits and vegetables (see Figure 6). As expected,
Mongolia is at the other end of the extremes. Consumers there spend relatively little on
fruits and vegetables.
10
0.0
0.1
0.2
0.3
0.4
0.5
0.6
0.7
6 7 8 9 10 11
Natural log of GDP per capita
Cer
eals
Bud
get s
hare
s Nepal
Bangladesh
Japan
Figure 2 Budget Shares of Cereal Products vs GDP per capita
0.00
0.05
0.10
0.15
0.20
0.25
0.30
0.35
6 7 8 9 10 11
Natural log of GDP per capita
Mea
t bud
get s
hare
s
Mongolia
Mali
Jordan
JapanSri Lanka
Figure 3 Budget Shares of Meat Products vs GDP per capita
11
0.00
0.05
0.10
0.15
0.20
0.25
0.30
0.35
0.40
0.45
6 7 8 9 10 11
Natural log of GDP per capita
Mea
t&fis
h bu
dget
shar
eHong Kong
Mongolia
KenyaNepal
Belize
Japan
Figure 4 Budget Shares of Meat and Fish Products vs GDP per capita
0.00
0.05
0.10
0.15
0.20
0.25
0.30
6 7 8 9 10 11
Natural log of GDP per capita
Dai
ry b
udge
t sha
res
Pakistan
Kenya
MongoliaIndia
Note The dot on the x-axis represents Taiwan due to missing data.
Figure 5 Budget Shares of Dairy Products vs GDP per capita
12
0.00
0.050.10
0.15
0.20
0.250.30
0.35
0.400.45
0.50
6 7 8 9 10 11
Natural log of GDP per capita
Frui
t&ve
g bu
dget
shar
esGabon
Mongolia
Figure 6 Budget Shares of Fruit and Vegetable Products vs GDP per capita
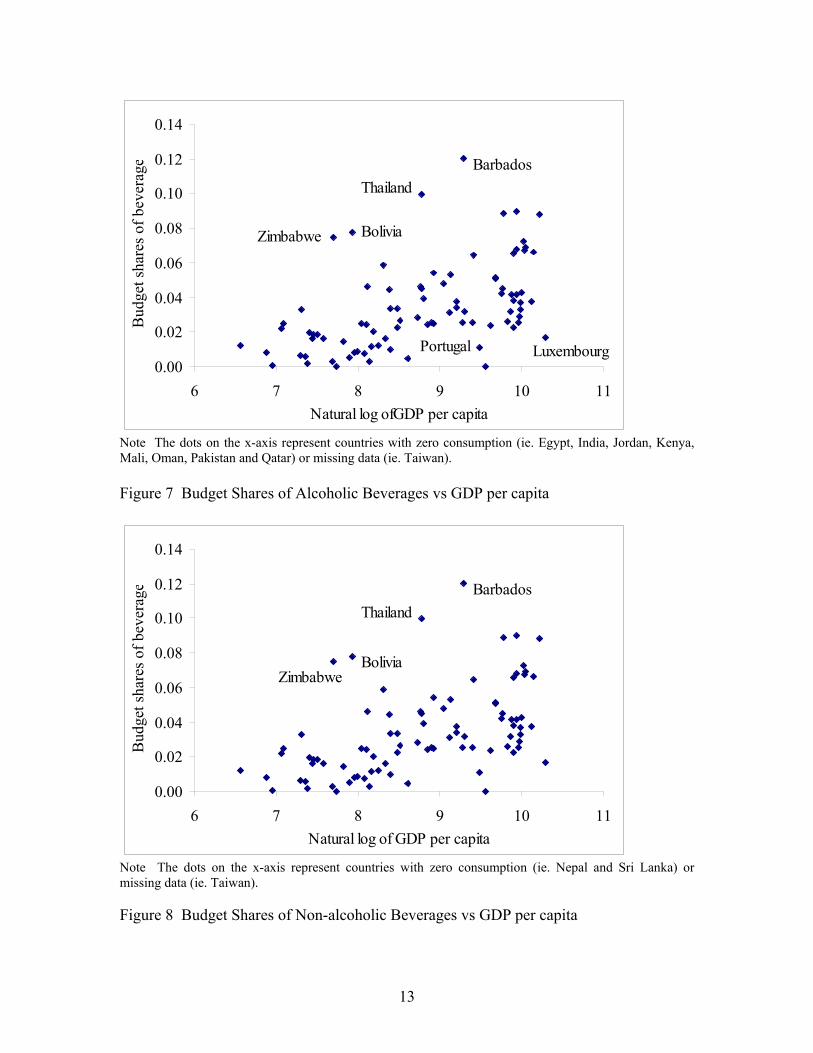
In terms of consumption of alcoholic and non-alcoholic beverages, the United Kingdom
and Botswana are two outliers. Consumers in both countries spend a relatively high
proportion on alcoholic drinks (see Figure 7). There are however countries where there is
little or no consumption of alcohol largely due to religion. These countries include India,
Pakistan, Kenya, Qatar, Oman, Mali and Jordan. In the meantime, Barbados, Bolivia,
Thailand and Zimbabwe appear to be outliers, spending proportionally more on non-
alcoholic beverages (see Figure 8). However, Luxembourg and Portugal are two high-
income economies spending relatively less on non-alcoholic beverages. As for the
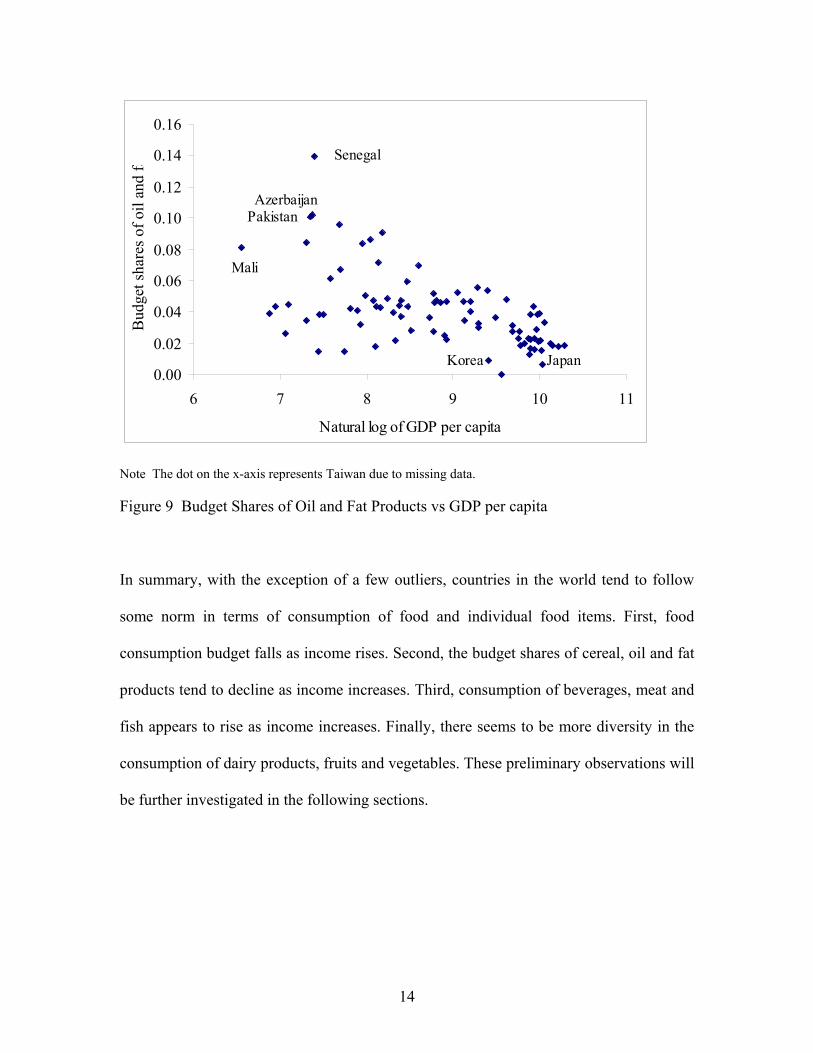
consumption of oil and fat products, Senegal is clearly an outlier spending proportionally
far more than other countries according to Figure 9. Korea appears to be at the other end
of the extreme, spending relatively less on oils and fats.
13
0.00
0.02
0.04
0.06
0.08
0.10
0.12
0.14
6 7 8 9 10 11Natural log ofGDP per capita
Bud
get s
hare
s of b
ever
age Barbados
Thailand
Zimbabwe Bolivia
LuxembourgPortugal
Note The dots on the x-axis represent countries with zero consumption (ie. Egypt, India, Jordan, Kenya, Mali, Oman, Pakistan and Qatar) or missing data (ie. Taiwan). Figure 7 Budget Shares of Alcoholic Beverages vs GDP per capita
0.00
0.02
0.04
0.06
0.08
0.10
0.12
0.14
6 7 8 9 10 11Natural log of GDP per capita
Bud
get s
hare
s of b
ever
age Barbados
Thailand
BoliviaZimbabwe
Note The dots on the x-axis represent countries with zero consumption (ie. Nepal and Sri Lanka) or missing data (ie. Taiwan). Figure 8 Budget Shares of Non-alcoholic Beverages vs GDP per capita
14
0.00
0.02
0.04
0.06
0.08
0.10
0.12
0.14
0.16
6 7 8 9 10 11
Natural log of GDP per capita
Bud
get s
hare
s of o
il an
d fa
Senegal
PakistanAzerbaijan
Mali
JapanKorea
Note The dot on the x-axis represents Taiwan due to missing data.
Figure 9 Budget Shares of Oil and Fat Products vs GDP per capita
In summary, with the exception of a few outliers, countries in the world tend to follow
some norm in terms of consumption of food and individual food items. First, food
consumption budget falls as income rises. Second, the budget shares of cereal, oil and fat
products tend to decline as income increases. Third, consumption of beverages, meat and
fish appears to rise as income increases. Finally, there seems to be more diversity in the
consumption of dairy products, fruits and vegetables. These preliminary observations will
be further investigated in the following sections.
15
4 Analytical Framework
To examine the effect of income and country-specific factors on food consumption across
countries, a set of Engel functions are estimated. The choice of this approach is largely
due to the constraint of the database which we have access to and which only contains
information about expenditures (see Appendix 3). An Engel function relates the budget
share of a commodity to total household expenditure. This concept can also be applied to
a group of countries. Following Working (1943) and Leser (1963), an Engel function can
be expressed as
)log( jiiij Mβαω += (1)
where ijω is the budget share of the ith commodity consumed by the jth country, jM total
expenditure per capita in country j and iα and iβ parameters to be estimated for the ith
commodity. Given equation (1), the income elasticity of demand for the ith commodity,
iη , can be computed as follows
iii ωβη /1+= (2)
where iω is the mean budget share of the ith commodity consumed.
Clements et al. (1995) argued that Model (1) could be treated as a simplified version of
more complicated systems under the assumption of constant prices. This is obviously a
strong assumption. Model (1) can be extended to incorporate country-specific factors
such as geographical grouping and income clustering. Symbolically, the extended model
can be expressed as
16
)log()log( jkikjikikiij MZMZ ββααω Σ++Σ+= (3)
where kZ is the dummy variable which represents the kth country-specific factor. The
above specification implies that the country-specific factors affect both the intercept and
the slope of the Engel function. Given model (3), the income elasticity of demand, ikη ,
for the kth factor and ith commodity can be computed as
iikiik ωββη /)(1 ++= (4)
The empirical analysis follows the conventional approach by adopting a two-stage
budgeting procedure (see Deaton and Muellbauer 1984). In the first stage, consumers
allocate their budget to broad consumption groups (eg. food, clothing etc). In the second
stage, consumers make budget decisions concerning individual items within the food
group. Following this procedure, the income elasticity for the ith individual food item and
kth country-specific factor can be calculated as
ikkik ηηθ = (5)
where ikθ represents the income elasticity for the ith food item, kη the income elasticity
of food and ikη the expenditure elasticity for the ith item within the food group.
5 Empirical Findings
The analytical framework described in the preceding section is applied to the sample
discussed in Section 2. The focus of the analysis is on food consumption patterns of
countries in several geographical regions and at different income levels. For this purpose,
17
the countries are divided into four geographical regions and four income groups,
respectively (see Appendices 1 and 2 for details). The criteria applied to divide the
sample include the number of observations in each group or region, geographical location
and cultural background. In the empirical estimation, the outliers identified in Section 3
together with missing observations are excluded so that the estimated results better reflect
the true pattern of consumption in each group or region. The estimated income elasticities
are presented in Table 2.6
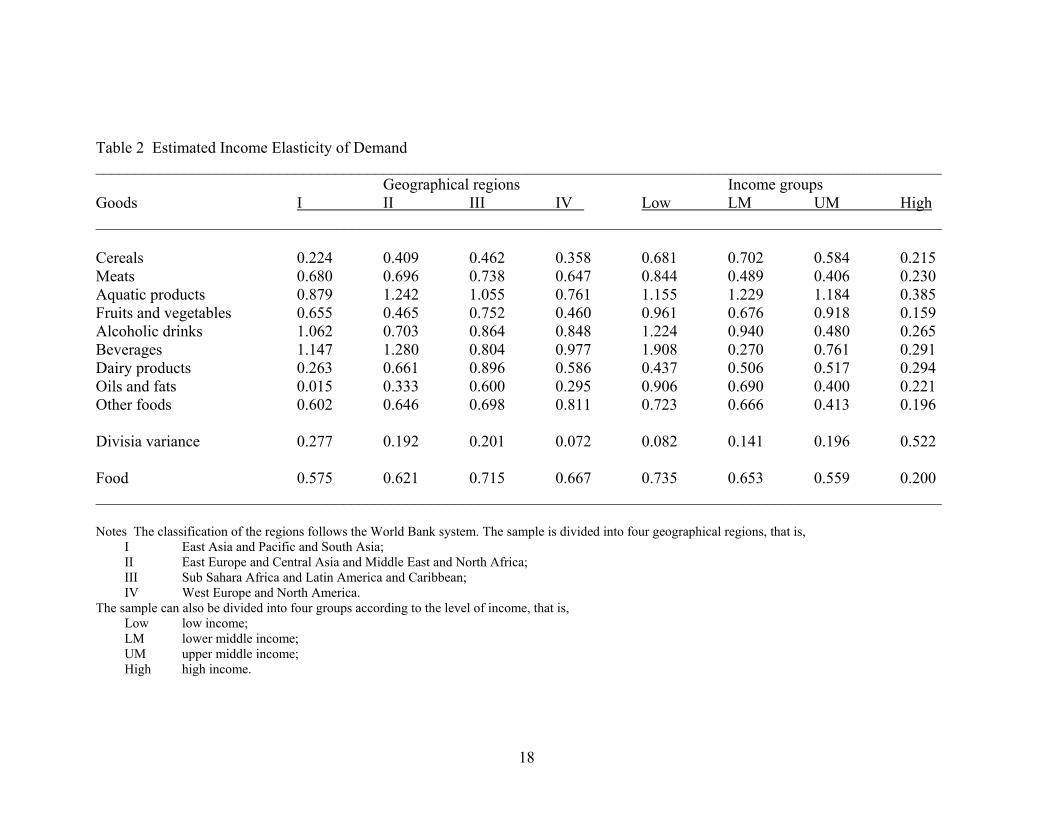
According to Table 2, food at the aggregate level is a normal good for all income groups
and regions. Demand for food however becomes less elastic as income rises, a conclusion
also derived by Regmi (2001). Among the regions, there is not much difference in terms
of food consumption – the income elasticity of demand for food ranges from 0.575 in
East Asia, South Asia and the Pacific to 0.715 in Sub Sahara Africa, Latin America and
the Caribbean. At the disaggregate level, the impact of income level on consumption is
clearly evident in Table 2. According to this table, the estimated income elasticity for all
food items is less than 0.40 for the high income group while those for other three groups
are greater than 0.40 with the exception of income elasticity of demand for beverages in
the lower middle income group. These results are consistent with those in Regmi (2001)
who applied a slightly different grouping. As expected, the estimated income elasticities
of demand for individual food items have the largest values for the low-income group.
However, there is no sharp difference in the food consumption patterns among the four
regions. The possible explanation is that there are poor and rich countries in each region.
6 Regression results are reported in Appendix 4.
18
Table 2 Estimated Income Elasticity of Demand __________________________________________________________________________________________________________ Geographical regions Income groups Goods I II III IV Low LM UM High __________________________________________________________________________________________________________ Cereals 0.224 0.409 0.462 0.358 0.681 0.702 0.584 0.215 Meats 0.680 0.696 0.738 0.647 0.844 0.489 0.406 0.230 Aquatic products 0.879 1.242 1.055 0.761 1.155 1.229 1.184 0.385 Fruits and vegetables 0.655 0.465 0.752 0.460 0.961 0.676 0.918 0.159 Alcoholic drinks 1.062 0.703 0.864 0.848 1.224 0.940 0.480 0.265 Beverages 1.147 1.280 0.804 0.977 1.908 0.270 0.761 0.291 Dairy products 0.263 0.661 0.896 0.586 0.437 0.506 0.517 0.294 Oils and fats 0.015 0.333 0.600 0.295 0.906 0.690 0.400 0.221 Other foods 0.602 0.646 0.698 0.811 0.723 0.666 0.413 0.196 Divisia variance 0.277 0.192 0.201 0.072 0.082 0.141 0.196 0.522 Food 0.575 0.621 0.715 0.667 0.735 0.653 0.559 0.200 __________________________________________________________________________________________________________ Notes The classification of the regions follows the World Bank system. The sample is divided into four geographical regions, that is,
I East Asia and Pacific and South Asia; II East Europe and Central Asia and Middle East and North Africa; III Sub Sahara Africa and Latin America and Caribbean; IV West Europe and North America.
The sample can also be divided into four groups according to the level of income, that is, Low low income; LM lower middle income; UM upper middle income; High high income.
19
The average country in each region is thus not a good representative of individual
countries within the region. Income elasticity based on the regional mean budget shares is
therefore biased. This bias may cause serious problems in demand projections if regional
means are used as the estimates of demand parameters for individual countries. Table 2
also shows that, in general, demand for aquatic, beverage and alcoholic goods is more
elastic than that for other food products. In fact, these three goods seem to be luxuries for
some regions and income groups. In addition, the dispersion of the income elasticities can
be measured by their Divisia (budget share weighted) variance
2)1( −∑= llDV ηω (6)
As shown in Table 2, there is little dispersion in the income elasticities for West Europe
and North America and more dispersion for Asia and the Pacific regions. In terms of
income groups, there is however less dispersion in the income elasticities for the low
income group as income elasticities for this group are close to one. Furthermore, the
Divisia variance for the high-income group is high, reflecting the fact that income
elasticities for this group are generally far smaller than one as shown in Table 2.
6 Food Consumption Patterns in Asia
Food consumption patterns in Asia are of particular interest for several reasons. First, the
world’s two most populous nations, ie. India and China, are located in Asia. Both
countries have recently experienced rapid economic growth and hence rising income. The
rising income and resultant changes in these two countries have important implications
20
for food consumption in the world. Second, Asian countries are highly diverse in terms of
affluence, culture and diets. This section focuses on three particular groups ie. South
Asia, East Asia and the Chinese communities.
South Asia
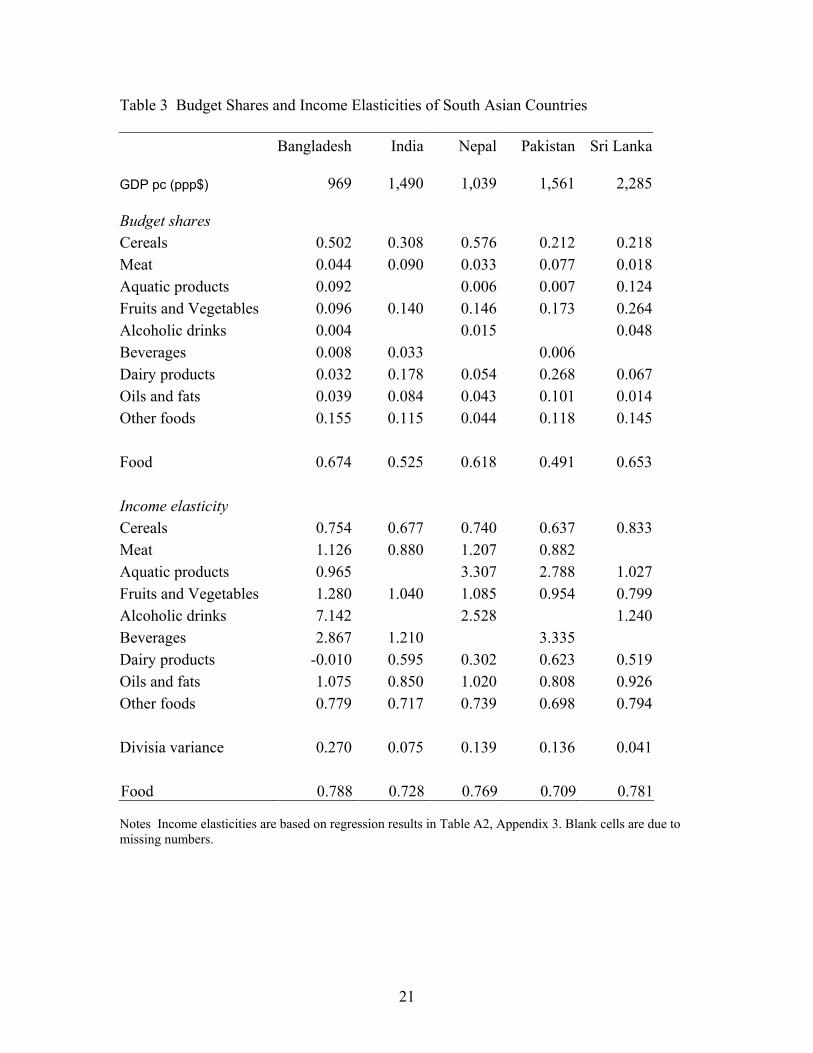
Among the sample, five countries are located in South Asia. Table 3 reports the budget
shares and income elasticities in these countries. It shows that food consumption
expenditure in South Asian countries is dominated by cereals and fruits and vegetables,
and dairy products in the case of India and Pakistan. In addition, food spending accounts
for more than a half of total expenditure. It seems that the income elasticities of all foods
except cereals and dairy products are close to or greater than one – implying that most
food items appear to be luxury goods in the five South Asian countries. This is confirmed
by the small values of the Divisia variance of income elasticities for each country. The
findings showed in Table 3 are generally consistent with the fact that South Asia is one of
the poorest regions in the world.
East Asia
There are nine East Asian economies in the sample. They have gone through different
stages of development, including low-income economies such as China, Indonesia and
the Philippines, middle-income ones of Thailand, Taiwan and Korea and high-income
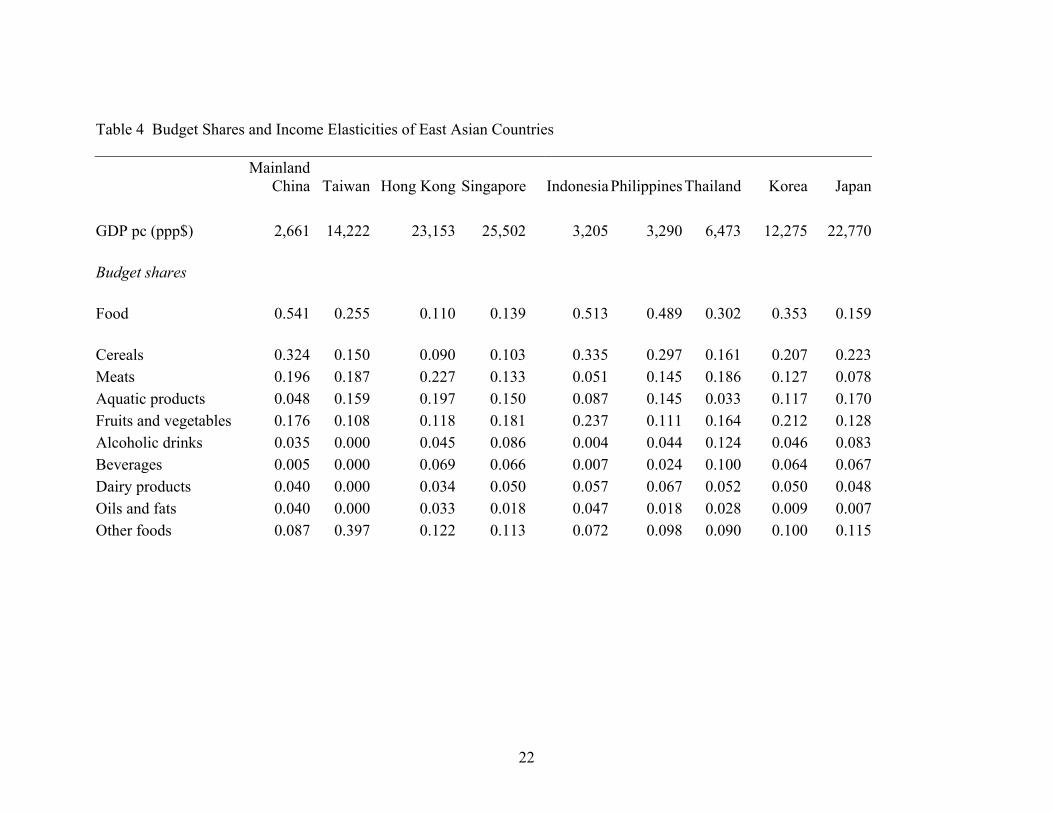
economies such as Japan, Hong Kong and Singapore. Table 4 demonstrates the budget
shares and income elasticities in these economies. It shows that food budget accounts for
21
Table 3 Budget Shares and Income Elasticities of South Asian Countries
Bangladesh India Nepal Pakistan Sri Lanka GDP pc (ppp$) 969 1,490 1,039 1,561 2,285 Budget shares Cereals 0.502 0.308 0.576 0.212 0.218 Meat 0.044 0.090 0.033 0.077 0.018 Aquatic products 0.092 0.006 0.007 0.124 Fruits and Vegetables 0.096 0.140 0.146 0.173 0.264 Alcoholic drinks 0.004 0.015 0.048 Beverages 0.008 0.033 0.006 Dairy products 0.032 0.178 0.054 0.268 0.067 Oils and fats 0.039 0.084 0.043 0.101 0.014 Other foods 0.155 0.115 0.044 0.118 0.145 Food 0.674 0.525 0.618 0.491 0.653 Income elasticity Cereals 0.754 0.677 0.740 0.637 0.833 Meat 1.126 0.880 1.207 0.882 Aquatic products 0.965 3.307 2.788 1.027 Fruits and Vegetables 1.280 1.040 1.085 0.954 0.799 Alcoholic drinks 7.142 2.528 1.240 Beverages 2.867 1.210 3.335 Dairy products -0.010 0.595 0.302 0.623 0.519 Oils and fats 1.075 0.850 1.020 0.808 0.926 Other foods 0.779 0.717 0.739 0.698 0.794 Divisia variance 0.270 0.075 0.139 0.136 0.041 Food 0.788 0.728 0.769 0.709 0.781 Notes Income elasticities are based on regression results in Table A2, Appendix 3. Blank cells are due to missing numbers.
22
Table 4 Budget Shares and Income Elasticities of East Asian Countries
Mainland
China Taiwan Hong Kong Singapore Indonesia Philippines Thailand Korea Japan
GDP pc (ppp$) 2,661 14,222 23,153 25,502 3,205 3,290 6,473 12,275 22,770 Budget shares Food 0.541 0.255 0.110 0.139 0.513 0.489 0.302 0.353 0.159 Cereals 0.324 0.150 0.090 0.103 0.335 0.297 0.161 0.207 0.223Meats 0.196 0.187 0.227 0.133 0.051 0.145 0.186 0.127 0.078Aquatic products 0.048 0.159 0.197 0.150 0.087 0.145 0.033 0.117 0.170Fruits and vegetables 0.176 0.108 0.118 0.181 0.237 0.111 0.164 0.212 0.128Alcoholic drinks 0.035 0.000 0.045 0.086 0.004 0.044 0.124 0.046 0.083Beverages 0.005 0.000 0.069 0.066 0.007 0.024 0.100 0.064 0.067Dairy products 0.040 0.000 0.034 0.050 0.057 0.067 0.052 0.050 0.048Oils and fats 0.040 0.000 0.033 0.018 0.047 0.018 0.028 0.009 0.007Other foods 0.087 0.397 0.122 0.113 0.072 0.098 0.090 0.100 0.115
23
Income elasticities Food 0.735 0.439 0.200 0.200 0.721 0.708 0.527 0.595 0.103 Cereals 0.687 0.460 0.220 0.217 0.675 0.742 0.575 0.616 0.107Meats 0.806 0.330 0.224 0.241 0.985 0.489 0.401 0.377 0.139Aquatic products 1.052 0.642 0.236 0.248 0.893 0.899 1.152 0.969 0.124Fruits and vegetables 0.986 0.913 0.150 0.167 0.903 0.747 0.547 0.921 0.079Alcoholic drinks 1.464 0.355 0.281 7.740 1.169 0.648 0.450 0.146Beverages 3.710 0.262 0.265 2.885 0.295 0.453 0.721 0.136Dairy products 0.142 0.478 0.392 0.310 0.472 0.302 0.509 0.205Oils and fats 0.993 0.217 0.231 0.937 0.815 0.578 -0.092 0.147Other foods 0.721 0.400 0.196 0.196 0.704 0.725 0.541 0.387 0.101 Divisia variance 0.123 0.292 0.556 0.533 0.260 0.106 0.225 0.160 0.714 Notes Income elasticities are based on regression results in Table A2, Appendix 3. Blank cells are due to missing numbers.
24
about a half of total expenditure in low-income countries but less than 20 per cent of total
expenditure in high-income economies. Table 4 also shows that food budget in East Asia
is dominated by cereals and meat or aquatic products. The next major items are fruits and
vegetables.
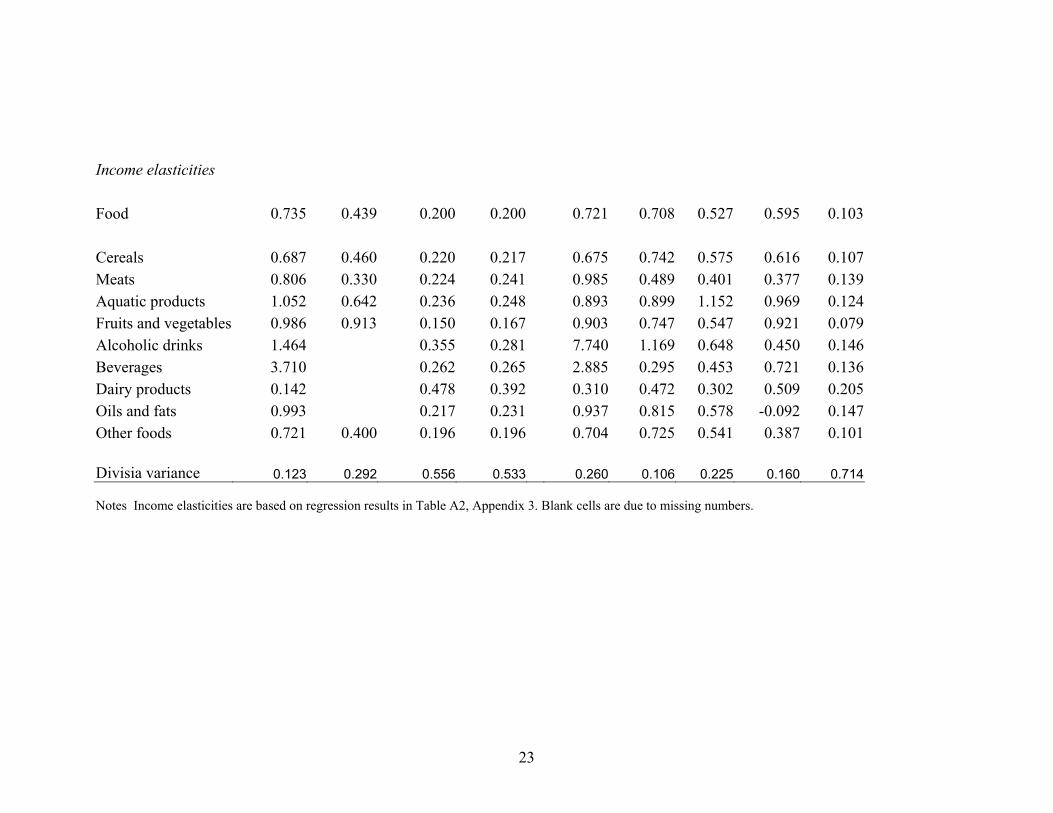
As in other regions, demand for food is highly elastic in low-income East Asia such as
China and Indonesia, but less elastic in high-income economies such as Japan, Singapore
and Hong Kong. The value of Divisia variance shows that there is little dispersion in the
income elasticities of demand in the low-income economies eg. China, Indonesia and the
Philippines, implying that income elasticities in these economies are close to or greater
than one. However, there is more dispersion in the income elasticities of demand in the
high-income economies eg. Japan, Hong Kong and Singapore, an indication of low
income elasticities in these economies.
Chinese Societies
It is interesting to compare food consumption patterns among the four Chinese societies,
ie. Mainland China, Hong Kong, Taiwan and Singapore, as they have gone through
different stages of development and they share a similar cultural background and dietary
habits. In particular, one can speculate what is going to happen if China follows the
patterns of other three Chinese-dominated societies (ie. Taiwan, Singapore and Hong
Kong). The findings could have important implications given China’s sheer size of
population. According to Table 4, it can be anticipated that China’s demand for aquatic
products will increase substantially as income rises. Other potential areas of growth in
25
demand include alcoholic and non-alcoholic beverages. Table 4 also shows that the
budget shares of dairy products in the four Chinese societies are very close. One may
conclude that, in terms of budget share, dairy consumption in China has already reached
its potential level. Future growth will mainly be in the form of an increase in the absolute
quantity. Of course, it has to be noted that there are considerable regional variations
inside China in terms of affluence and dietary traditions. For some regions, there will be
growth in both relative and absolute terms. The same argument can also be applied to
India, the world’s second largest country in terms of population. To gain further insight
into the regional issues, country-specific projects have to be conducted.
7 Conclusions and Comments
This study estimates a series of Engel functions using the 1995 ICP expenditure data. It
particularly incorporates regional grouping and income clustering variables into the Engel
functions. The results are used to derive estimates of income elasticities of demand for
various groups and countries. As stated in the main body of the paper, this study is
constrained by the availability of data. Thus all conclusions in this paper are subjected to
qualifications. However, the findings in this study still confirm some results in the
existing literature and gain fresh insights into cross-country food consumption patterns.
This study particularly points out the importance of country-specific studies in terms of
understanding food consumption patterns. The major points are summarised as follows:
26
• Countries in the world are found to follow some common norm in terms of food
consumption. As income rises, an average country in the world tends to spend
proportionally less on food and its demand for food becomes less elastic too. This
trend is however not very clear if the focus is the regions instead of income
groups. Thus, regions are poor representatives of individual countries.
• At the disaggregate level, most food items (eg. cereals, meats, fruits and
vegetables, dairy products and oils and fats) are found to be necessities for all
groups (by either region or income). Aquatic products, alcoholic and non-
alcoholic beverages however appear to be luxuries for most groups except the
high-income one.
• Food consumption patterns in Asia are of special interest partly because China
and India are in the region and both countries are experiencing rapid
transformation. With the exception of alcoholic and non-alcoholic beverages, all
food items are shown to be necessities in Asia. The value of income elasticity of
demand for cereals in Asia is the smallest among the regions, a reflection of the
importance of cereals in Asian diet.
• There is however considerable diversity in Asia. South Asia has the lowest
income in Asia. Income elasticities of demand in South Asia are found to be high
for all food items except cereals and dairy products. It is however difficult to
speculate how food consumption patterns will evolve in South Asia as the five
27
countries considered in this paper are themselves very diverse. India and Pakistan
seem to follow a similar pattern, with cereals, fruits and vegetables and dairy
products being the dominant food items in their diets. The other three countries ie.
Bangladesh, Nepal and Sri Lanka appear to have different dietary habits,
consuming far less dairy goods than India and Pakistan. Unless country-specific
studies are carried out, it is difficult to draw any conclusion about future
consumption trend.
• Food consumption pattern in East Asia is dominated by the spending on cereals,
meat or aquatic products and fruits and vegetables. In contrast to South Asia,
dairy goods account for a small budget share in East Asia even in the most
developed economy ie. Japan. It is anticipated that growth in the consumption of
dairy products will only be in absolute term in East Asia. In addition, developed
East Asian members consume relatively more aquatic products and beverages
(both alcoholic and non-alcoholic). Demand for these products will certainly
increase in the future.
• The four Chinese-dominated economies offer an interesting case study though it
is subjected to qualifications due to missing observations in Taiwan’s data. It is
found that the Chinese diet mainly consists of cereals, meats, aquatic products,
and fruits and vegetables. If mainland China is to follow the same patterns of the
other three societies, there will be a huge growth in the demand for aquatic goods.
In the meantime, demand for cereals in China will decline relatively. Another area
28
of growth will be demand for beverages (both alcoholic and non-alcoholic) in
China. There are of course considerable variations among the Chinese regions.
Those regional issues can only be addressed by conducting detailed studies using
household or regional data.
29
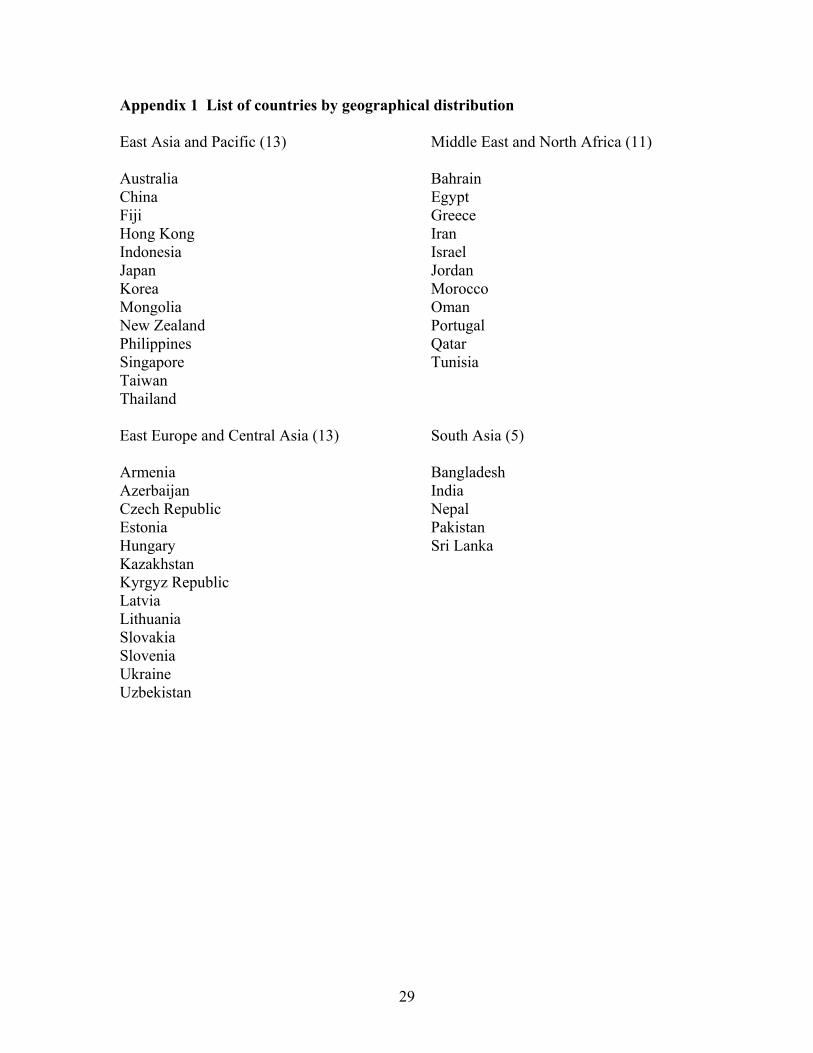
Appendix 1 List of countries by geographical distribution
East Asia and Pacific (13) Australia China Fiji Hong Kong Indonesia Japan Korea Mongolia New Zealand Philippines Singapore Taiwan Thailand East Europe and Central Asia (13) Armenia Azerbaijan Czech Republic Estonia Hungary Kazakhstan Kyrgyz Republic Latvia Lithuania Slovakia Slovenia Ukraine Uzbekistan
Middle East and North Africa (11) Bahrain Egypt Greece Iran Israel Jordan Morocco Oman Portugal Qatar Tunisia South Asia (5) Bangladesh India Nepal Pakistan Sri Lanka
30
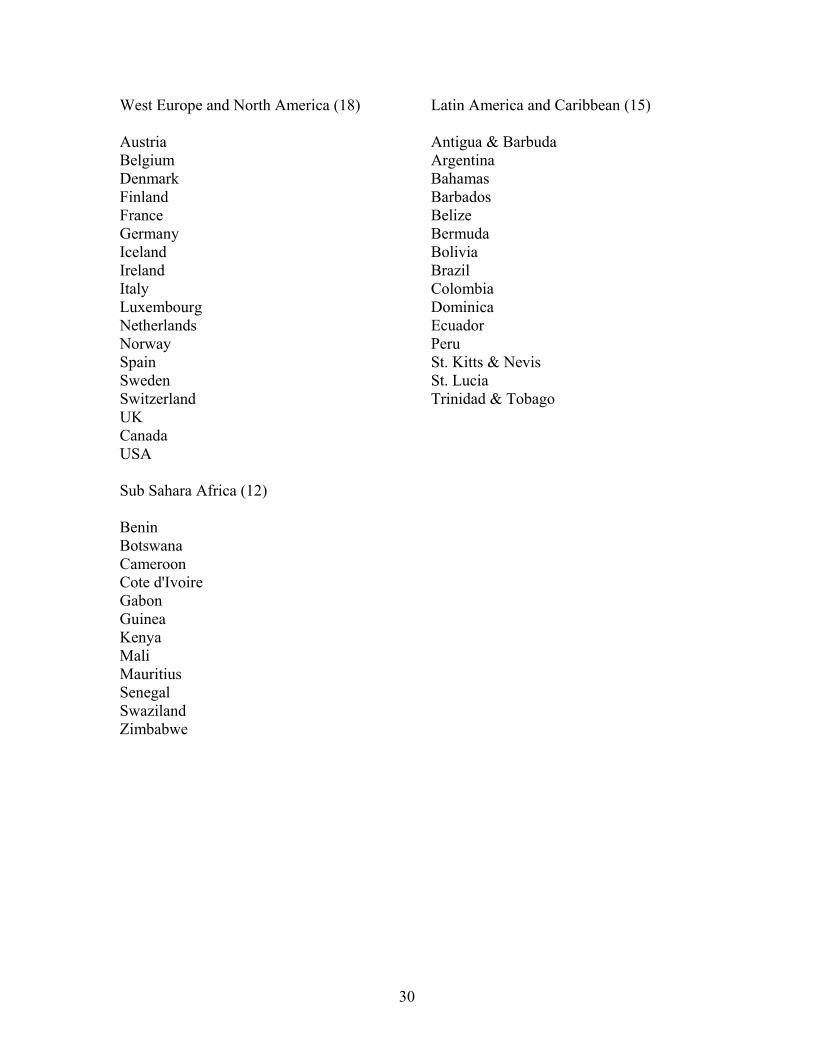
West Europe and North America (18) Austria Belgium Denmark Finland France Germany Iceland Ireland Italy Luxembourg Netherlands Norway Spain Sweden Switzerland UK Canada USA Sub Sahara Africa (12) Benin Botswana Cameroon Cote d'Ivoire Gabon Guinea Kenya Mali Mauritius Senegal Swaziland Zimbabwe
Latin America and Caribbean (15) Antigua & Barbuda Argentina Bahamas Barbados Belize Bermuda Bolivia Brazil Colombia Dominica Ecuador Peru St. Kitts & Nevis St. Lucia Trinidad & Tobago
31
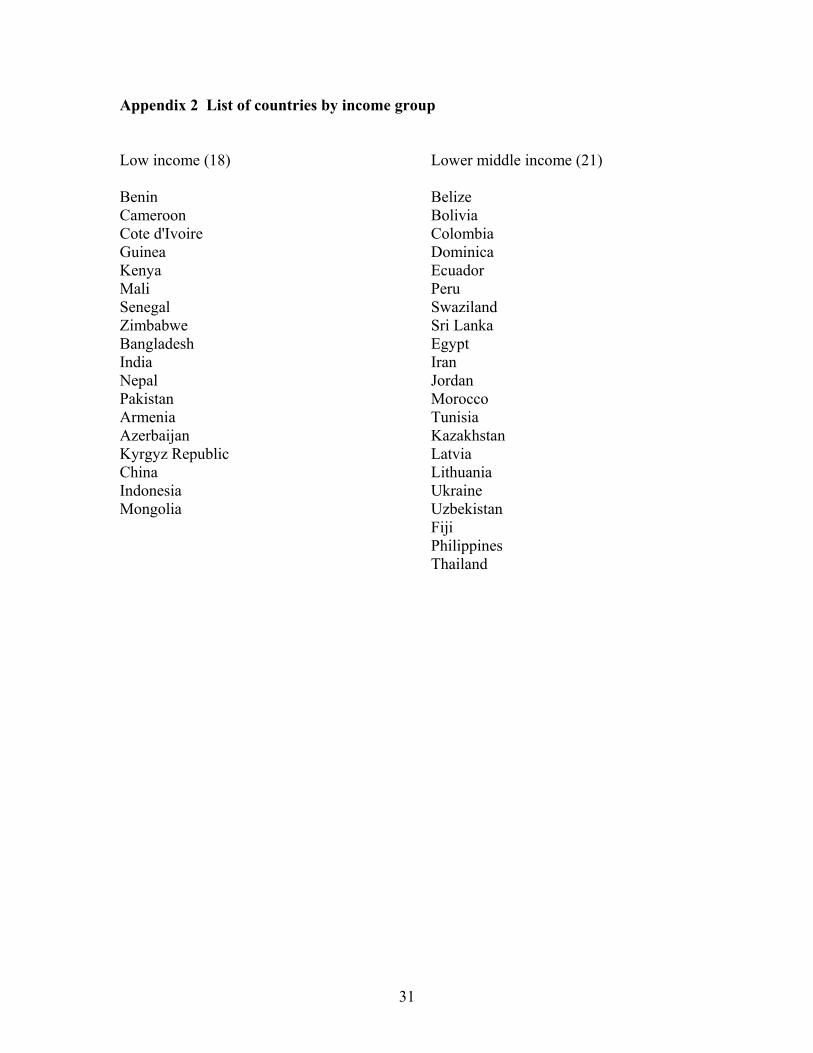
Appendix 2 List of countries by income group Low income (18) Benin Cameroon Cote d'Ivoire Guinea Kenya Mali Senegal Zimbabwe Bangladesh India Nepal Pakistan Armenia Azerbaijan Kyrgyz Republic China Indonesia Mongolia
Lower middle income (21) Belize Bolivia Colombia Dominica Ecuador Peru Swaziland Sri Lanka Egypt Iran Jordan Morocco Tunisia Kazakhstan Latvia Lithuania Ukraine Uzbekistan Fiji Philippines Thailand
32
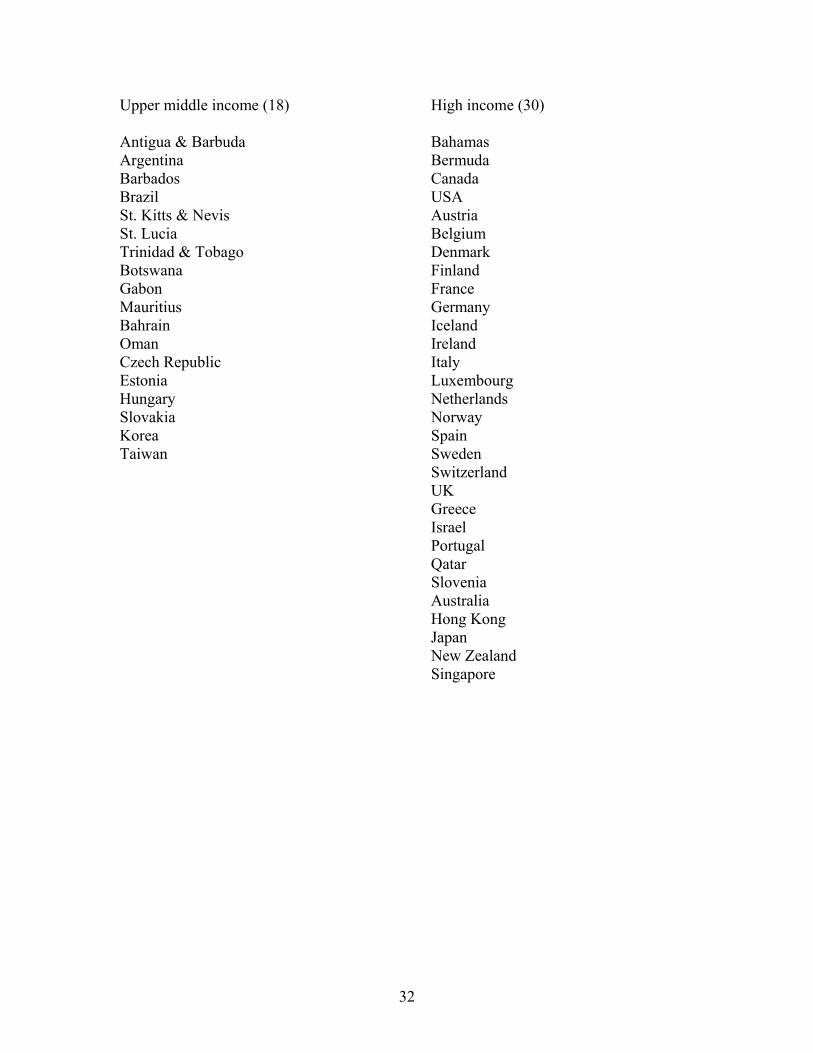
Upper middle income (18) Antigua & Barbuda Argentina Barbados Brazil St. Kitts & Nevis St. Lucia Trinidad & Tobago Botswana Gabon Mauritius Bahrain Oman Czech Republic Estonia Hungary Slovakia Korea Taiwan
High income (30) Bahamas Bermuda Canada USA Austria Belgium Denmark Finland France Germany Iceland Ireland Italy Luxembourg Netherlands Norway Spain Sweden Switzerland UK Greece Israel Portugal Qatar Slovenia Australia Hong Kong Japan New Zealand Singapore
33
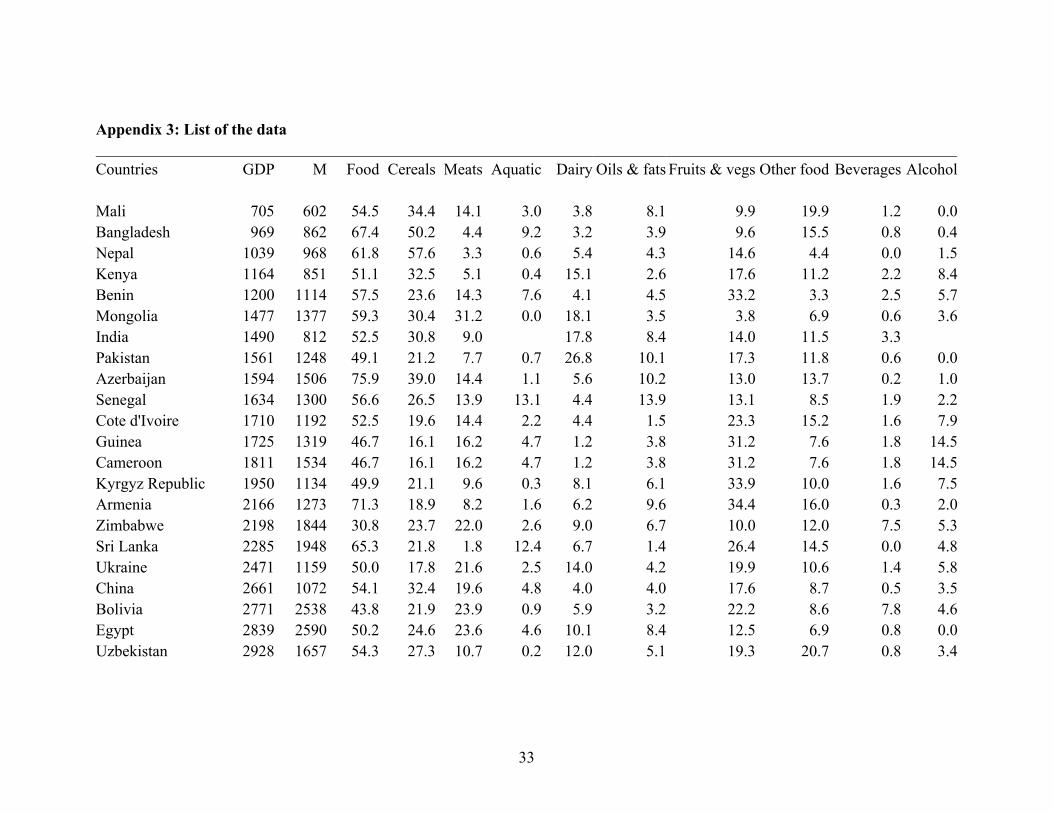
Appendix 3: List of the data
Countries GDP M Food Cereals Meats Aquatic Dairy Oils & fats Fruits & vegs Other food Beverages Alcohol Mali 705 602 54.5 34.4 14.1 3.0 3.8 8.1 9.9 19.9 1.2 0.0Bangladesh 969 862 67.4 50.2 4.4 9.2 3.2 3.9 9.6 15.5 0.8 0.4Nepal 1039 968 61.8 57.6 3.3 0.6 5.4 4.3 14.6 4.4 0.0 1.5Kenya 1164 851 51.1 32.5 5.1 0.4 15.1 2.6 17.6 11.2 2.2 8.4Benin 1200 1114 57.5 23.6 14.3 7.6 4.1 4.5 33.2 3.3 2.5 5.7Mongolia 1477 1377 59.3 30.4 31.2 0.0 18.1 3.5 3.8 6.9 0.6 3.6India 1490 812 52.5 30.8 9.0 17.8 8.4 14.0 11.5 3.3 Pakistan 1561 1248 49.1 21.2 7.7 0.7 26.8 10.1 17.3 11.8 0.6 0.0Azerbaijan 1594 1506 75.9 39.0 14.4 1.1 5.6 10.2 13.0 13.7 0.2 1.0Senegal 1634 1300 56.6 26.5 13.9 13.1 4.4 13.9 13.1 8.5 1.9 2.2Cote d'Ivoire 1710 1192 52.5 19.6 14.4 2.2 4.4 1.5 23.3 15.2 1.6 7.9Guinea 1725 1319 46.7 16.1 16.2 4.7 1.2 3.8 31.2 7.6 1.8 14.5Cameroon 1811 1534 46.7 16.1 16.2 4.7 1.2 3.8 31.2 7.6 1.8 14.5Kyrgyz Republic 1950 1134 49.9 21.1 9.6 0.3 8.1 6.1 33.9 10.0 1.6 7.5Armenia 2166 1273 71.3 18.9 8.2 1.6 6.2 9.6 34.4 16.0 0.3 2.0Zimbabwe 2198 1844 30.8 23.7 22.0 2.6 9.0 6.7 10.0 12.0 7.5 5.3Sri Lanka 2285 1948 65.3 21.8 1.8 12.4 6.7 1.4 26.4 14.5 0.0 4.8Ukraine 2471 1159 50.0 17.8 21.6 2.5 14.0 4.2 19.9 10.6 1.4 5.8China 2661 1072 54.1 32.4 19.6 4.8 4.0 4.0 17.6 8.7 0.5 3.5Bolivia 2771 2538 43.8 21.9 23.9 0.9 5.9 3.2 22.2 8.6 7.8 4.6Egypt 2839 2590 50.2 24.6 23.6 4.6 10.1 8.4 12.5 6.9 0.8 0.0Uzbekistan 2928 1657 54.3 27.3 10.7 0.2 12.0 5.1 19.3 20.7 0.8 3.4
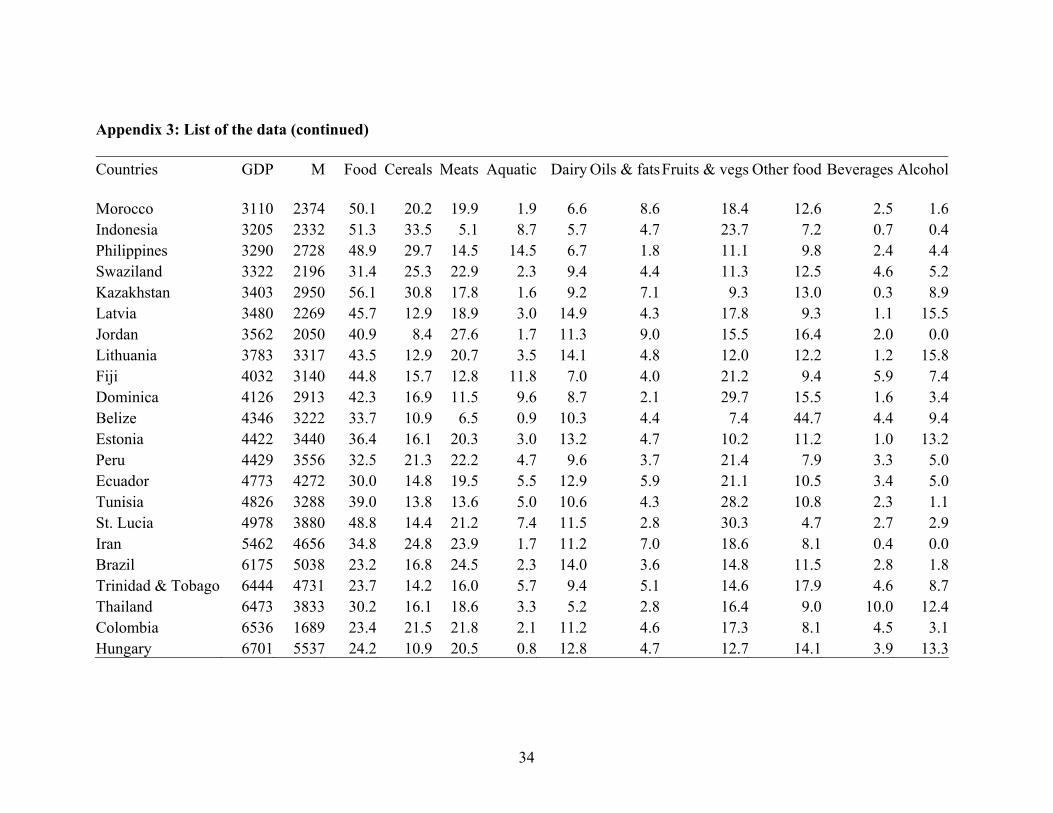
34
Appendix 3: List of the data (continued) Countries GDP M Food Cereals Meats Aquatic Dairy Oils & fatsFruits & vegs Other food Beverages Alcohol Morocco 3110 2374 50.1 20.2 19.9 1.9 6.6 8.6 18.4 12.6 2.5 1.6Indonesia 3205 2332 51.3 33.5 5.1 8.7 5.7 4.7 23.7 7.2 0.7 0.4Philippines 3290 2728 48.9 29.7 14.5 14.5 6.7 1.8 11.1 9.8 2.4 4.4Swaziland 3322 2196 31.4 25.3 22.9 2.3 9.4 4.4 11.3 12.5 4.6 5.2Kazakhstan 3403 2950 56.1 30.8 17.8 1.6 9.2 7.1 9.3 13.0 0.3 8.9Latvia 3480 2269 45.7 12.9 18.9 3.0 14.9 4.3 17.8 9.3 1.1 15.5Jordan 3562 2050 40.9 8.4 27.6 1.7 11.3 9.0 15.5 16.4 2.0 0.0Lithuania 3783 3317 43.5 12.9 20.7 3.5 14.1 4.8 12.0 12.2 1.2 15.8Fiji 4032 3140 44.8 15.7 12.8 11.8 7.0 4.0 21.2 9.4 5.9 7.4Dominica 4126 2913 42.3 16.9 11.5 9.6 8.7 2.1 29.7 15.5 1.6 3.4Belize 4346 3222 33.7 10.9 6.5 0.9 10.3 4.4 7.4 44.7 4.4 9.4Estonia 4422 3440 36.4 16.1 20.3 3.0 13.2 4.7 10.2 11.2 1.0 13.2Peru 4429 3556 32.5 21.3 22.2 4.7 9.6 3.7 21.4 7.9 3.3 5.0Ecuador 4773 4272 30.0 14.8 19.5 5.5 12.9 5.9 21.1 10.5 3.4 5.0Tunisia 4826 3288 39.0 13.8 13.6 5.0 10.6 4.3 28.2 10.8 2.3 1.1St. Lucia 4978 3880 48.8 14.4 21.2 7.4 11.5 2.8 30.3 4.7 2.7 2.9Iran 5462 4656 34.8 24.8 23.9 1.7 11.2 7.0 18.6 8.1 0.4 0.0Brazil 6175 5038 23.2 16.8 24.5 2.3 14.0 3.6 14.8 11.5 2.8 1.8Trinidad & Tobago 6444 4731 23.7 14.2 16.0 5.7 9.4 5.1 14.6 17.9 4.6 8.7Thailand 6473 3833 30.2 16.1 18.6 3.3 5.2 2.8 16.4 9.0 10.0 12.4Colombia 6536 1689 23.4 21.5 21.8 2.1 11.2 4.6 17.3 8.1 4.5 3.1Hungary 6701 5537 24.2 10.9 20.5 0.8 12.8 4.7 12.7 14.1 3.9 13.3
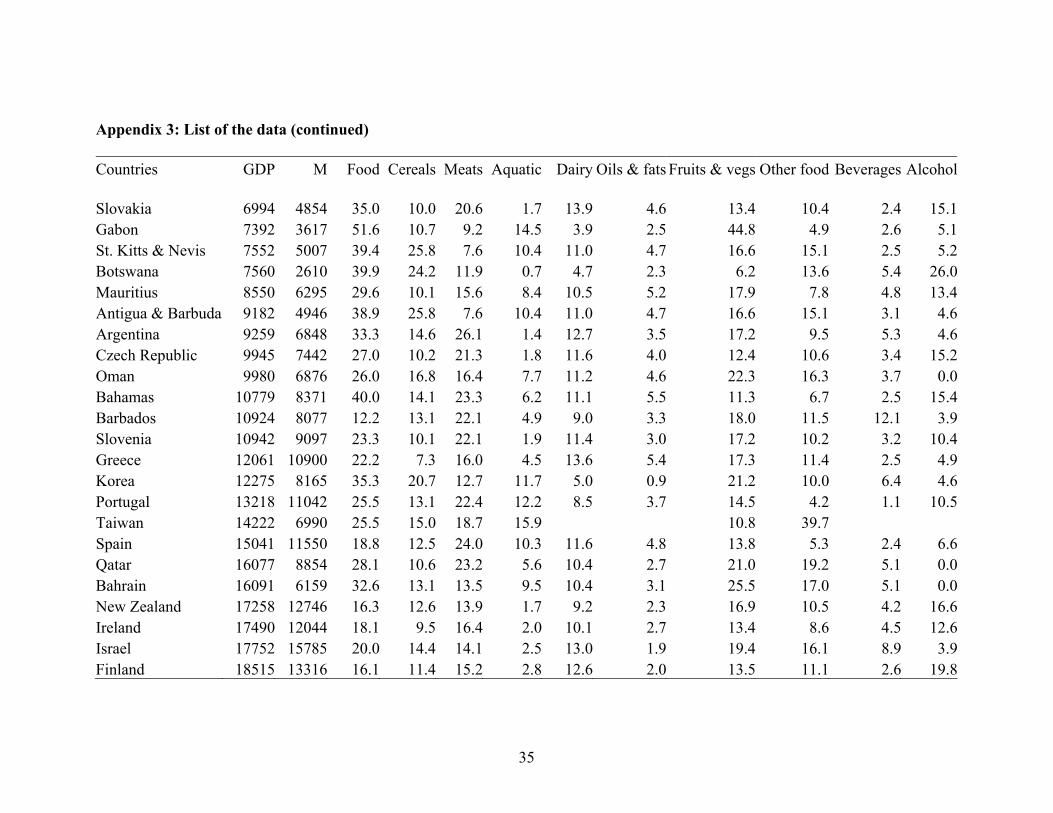
35
Appendix 3: List of the data (continued) Countries GDP M Food Cereals Meats Aquatic Dairy Oils & fats Fruits & vegs Other food Beverages Alcohol Slovakia 6994 4854 35.0 10.0 20.6 1.7 13.9 4.6 13.4 10.4 2.4 15.1Gabon 7392 3617 51.6 10.7 9.2 14.5 3.9 2.5 44.8 4.9 2.6 5.1St. Kitts & Nevis 7552 5007 39.4 25.8 7.6 10.4 11.0 4.7 16.6 15.1 2.5 5.2Botswana 7560 2610 39.9 24.2 11.9 0.7 4.7 2.3 6.2 13.6 5.4 26.0Mauritius 8550 6295 29.6 10.1 15.6 8.4 10.5 5.2 17.9 7.8 4.8 13.4Antigua & Barbuda 9182 4946 38.9 25.8 7.6 10.4 11.0 4.7 16.6 15.1 3.1 4.6Argentina 9259 6848 33.3 14.6 26.1 1.4 12.7 3.5 17.2 9.5 5.3 4.6Czech Republic 9945 7442 27.0 10.2 21.3 1.8 11.6 4.0 12.4 10.6 3.4 15.2Oman 9980 6876 26.0 16.8 16.4 7.7 11.2 4.6 22.3 16.3 3.7 0.0Bahamas 10779 8371 40.0 14.1 23.3 6.2 11.1 5.5 11.3 6.7 2.5 15.4Barbados 10924 8077 12.2 13.1 22.1 4.9 9.0 3.3 18.0 11.5 12.1 3.9Slovenia 10942 9097 23.3 10.1 22.1 1.9 11.4 3.0 17.2 10.2 3.2 10.4Greece 12061 10900 22.2 7.3 16.0 4.5 13.6 5.4 17.3 11.4 2.5 4.9Korea 12275 8165 35.3 20.7 12.7 11.7 5.0 0.9 21.2 10.0 6.4 4.6Portugal 13218 11042 25.5 13.1 22.4 12.2 8.5 3.7 14.5 4.2 1.1 10.5Taiwan 14222 6990 25.5 15.0 18.7 15.9 10.8 39.7 Spain 15041 11550 18.8 12.5 24.0 10.3 11.6 4.8 13.8 5.3 2.4 6.6Qatar 16077 8854 28.1 10.6 23.2 5.6 10.4 2.7 21.0 19.2 5.1 0.0Bahrain 16091 6159 32.6 13.1 13.5 9.5 10.4 3.1 25.5 17.0 5.1 0.0New Zealand 17258 12746 16.3 12.6 13.9 1.7 9.2 2.3 16.9 10.5 4.2 16.6Ireland 17490 12044 18.1 9.5 16.4 2.0 10.1 2.7 13.4 8.6 4.5 12.6Israel 17752 15785 20.0 14.4 14.1 2.5 13.0 1.9 19.4 16.1 8.9 3.9Finland 18515 13316 16.1 11.4 15.2 2.8 12.6 2.0 13.5 11.1 2.6 19.8
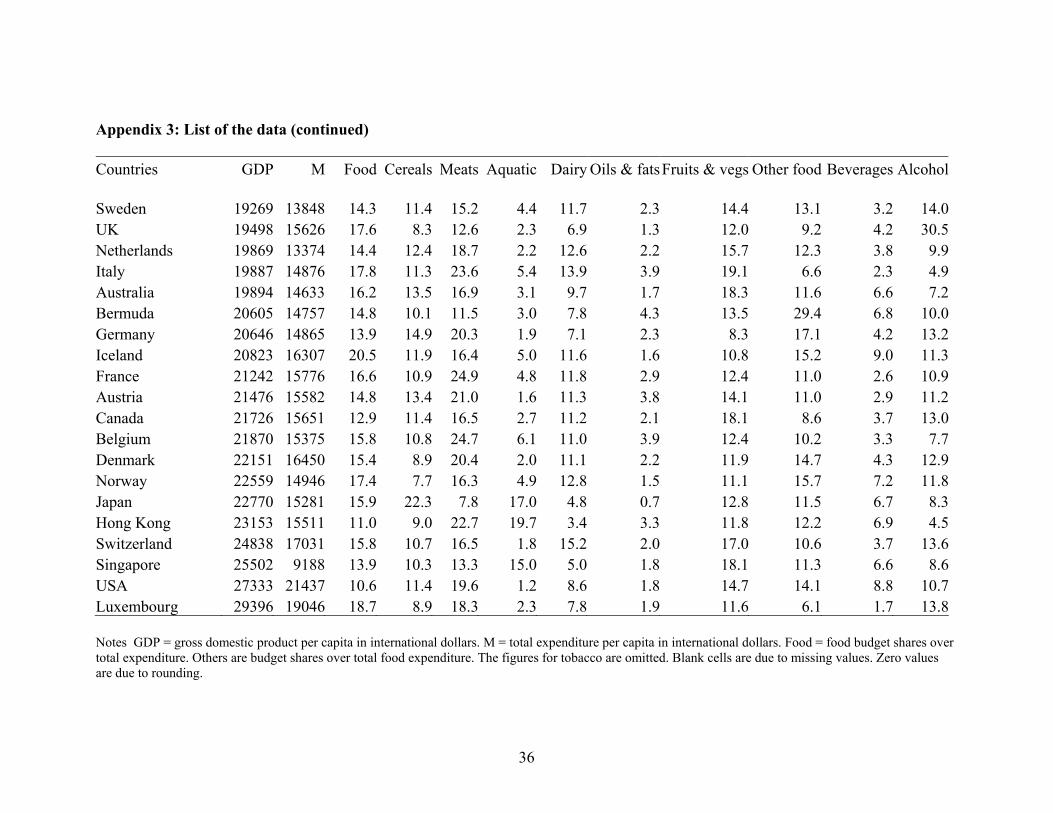
36
Appendix 3: List of the data (continued) Countries GDP M Food Cereals Meats Aquatic Dairy Oils & fatsFruits & vegs Other food Beverages Alcohol Sweden 19269 13848 14.3 11.4 15.2 4.4 11.7 2.3 14.4 13.1 3.2 14.0UK 19498 15626 17.6 8.3 12.6 2.3 6.9 1.3 12.0 9.2 4.2 30.5Netherlands 19869 13374 14.4 12.4 18.7 2.2 12.6 2.2 15.7 12.3 3.8 9.9Italy 19887 14876 17.8 11.3 23.6 5.4 13.9 3.9 19.1 6.6 2.3 4.9Australia 19894 14633 16.2 13.5 16.9 3.1 9.7 1.7 18.3 11.6 6.6 7.2Bermuda 20605 14757 14.8 10.1 11.5 3.0 7.8 4.3 13.5 29.4 6.8 10.0Germany 20646 14865 13.9 14.9 20.3 1.9 7.1 2.3 8.3 17.1 4.2 13.2Iceland 20823 16307 20.5 11.9 16.4 5.0 11.6 1.6 10.8 15.2 9.0 11.3France 21242 15776 16.6 10.9 24.9 4.8 11.8 2.9 12.4 11.0 2.6 10.9Austria 21476 15582 14.8 13.4 21.0 1.6 11.3 3.8 14.1 11.0 2.9 11.2Canada 21726 15651 12.9 11.4 16.5 2.7 11.2 2.1 18.1 8.6 3.7 13.0Belgium 21870 15375 15.8 10.8 24.7 6.1 11.0 3.9 12.4 10.2 3.3 7.7Denmark 22151 16450 15.4 8.9 20.4 2.0 11.1 2.2 11.9 14.7 4.3 12.9Norway 22559 14946 17.4 7.7 16.3 4.9 12.8 1.5 11.1 15.7 7.2 11.8Japan 22770 15281 15.9 22.3 7.8 17.0 4.8 0.7 12.8 11.5 6.7 8.3Hong Kong 23153 15511 11.0 9.0 22.7 19.7 3.4 3.3 11.8 12.2 6.9 4.5Switzerland 24838 17031 15.8 10.7 16.5 1.8 15.2 2.0 17.0 10.6 3.7 13.6Singapore 25502 9188 13.9 10.3 13.3 15.0 5.0 1.8 18.1 11.3 6.6 8.6USA 27333 21437 10.6 11.4 19.6 1.2 8.6 1.8 14.7 14.1 8.8 10.7Luxembourg 29396 19046 18.7 8.9 18.3 2.3 7.8 1.9 11.6 6.1 1.7 13.8 Notes GDP = gross domestic product per capita in international dollars. M = total expenditure per capita in international dollars. Food = food budget shares over total expenditure. Others are budget shares over total food expenditure. The figures for tobacco are omitted. Blank cells are due to missing values. Zero values are due to rounding.
37
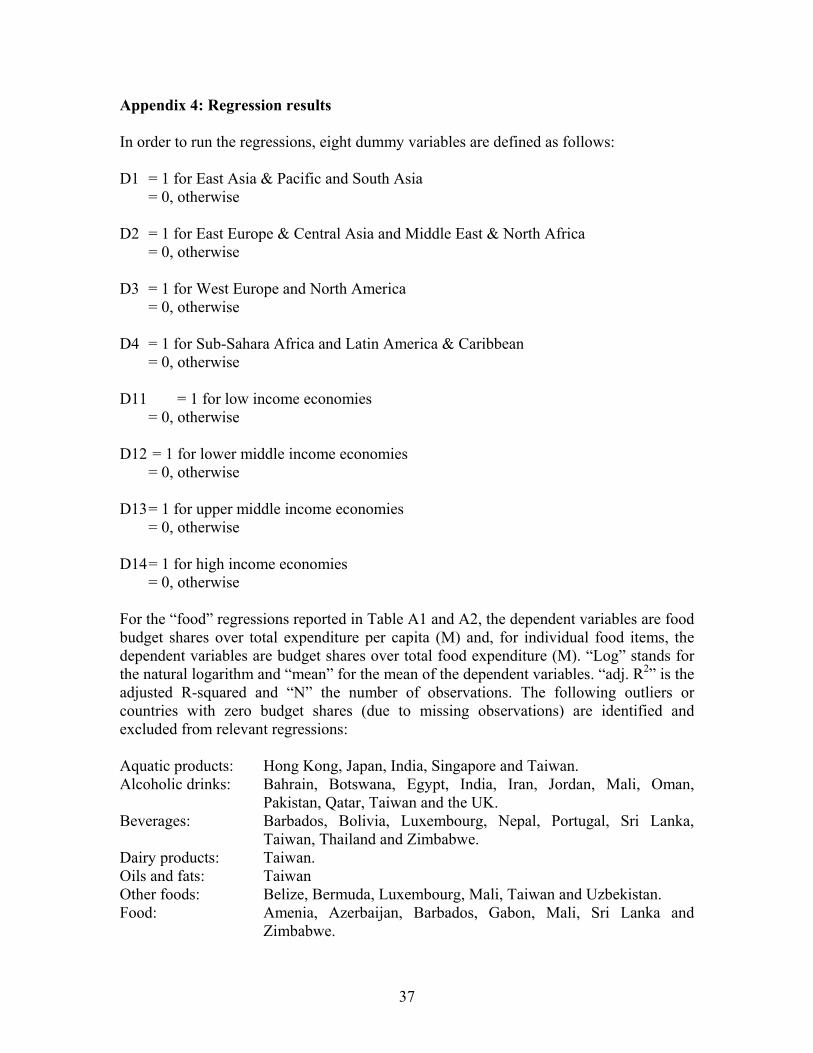
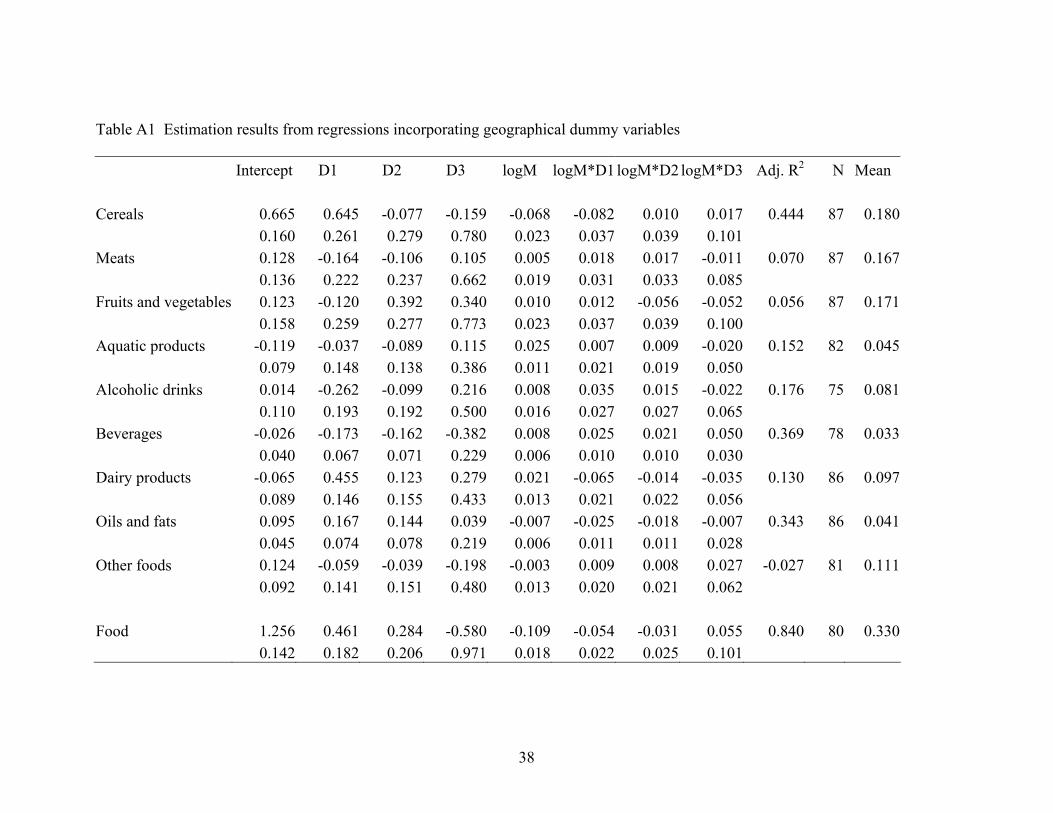
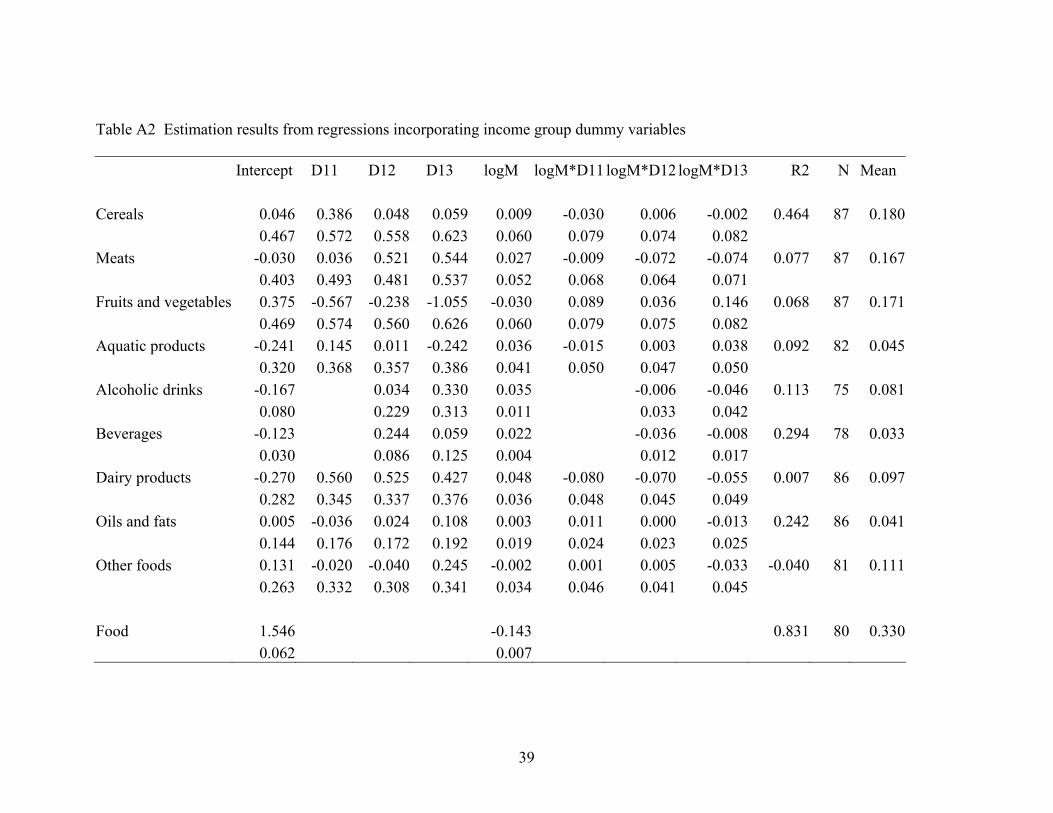
Appendix 4: Regression results
In order to run the regressions, eight dummy variables are defined as follows: D1 = 1 for East Asia & Pacific and South Asia = 0, otherwise D2 = 1 for East Europe & Central Asia and Middle East & North Africa = 0, otherwise D3 = 1 for West Europe and North America = 0, otherwise D4 = 1 for Sub-Sahara Africa and Latin America & Caribbean = 0, otherwise D11 = 1 for low income economies = 0, otherwise D12 = 1 for lower middle income economies = 0, otherwise D13 = 1 for upper middle income economies = 0, otherwise D14 = 1 for high income economies = 0, otherwise For the “food” regressions reported in Table A1 and A2, the dependent variables are food budget shares over total expenditure per capita (M) and, for individual food items, the dependent variables are budget shares over total food expenditure (M). “Log” stands for the natural logarithm and “mean” for the mean of the dependent variables. “adj. R2” is the adjusted R-squared and “N” the number of observations. The following outliers or countries with zero budget shares (due to missing observations) are identified and excluded from relevant regressions: Aquatic products: Hong Kong, Japan, India, Singapore and Taiwan. Alcoholic drinks: Bahrain, Botswana, Egypt, India, Iran, Jordan, Mali, Oman,
Pakistan, Qatar, Taiwan and the UK. Beverages: Barbados, Bolivia, Luxembourg, Nepal, Portugal, Sri Lanka,
Taiwan, Thailand and Zimbabwe. Dairy products: Taiwan. Oils and fats: Taiwan Other foods: Belize, Bermuda, Luxembourg, Mali, Taiwan and Uzbekistan. Food: Amenia, Azerbaijan, Barbados, Gabon, Mali, Sri Lanka and
Zimbabwe.
38
Table A1 Estimation results from regressions incorporating geographical dummy variables
Intercept D1 D2 D3 logM logM*D1 logM*D2 logM*D3 Adj. R2 N Mean
Cereals 0.665 0.645 -0.077 -0.159 -0.068 -0.082 0.010 0.017 0.444 87 0.180 0.160 0.261 0.279 0.780 0.023 0.037 0.039 0.101 Meats 0.128 -0.164 -0.106 0.105 0.005 0.018 0.017 -0.011 0.070 87 0.167 0.136 0.222 0.237 0.662 0.019 0.031 0.033 0.085 Fruits and vegetables 0.123 -0.120 0.392 0.340 0.010 0.012 -0.056 -0.052 0.056 87 0.171 0.158 0.259 0.277 0.773 0.023 0.037 0.039 0.100 Aquatic products -0.119 -0.037 -0.089 0.115 0.025 0.007 0.009 -0.020 0.152 82 0.045 0.079 0.148 0.138 0.386 0.011 0.021 0.019 0.050 Alcoholic drinks 0.014 -0.262 -0.099 0.216 0.008 0.035 0.015 -0.022 0.176 75 0.081 0.110 0.193 0.192 0.500 0.016 0.027 0.027 0.065 Beverages -0.026 -0.173 -0.162 -0.382 0.008 0.025 0.021 0.050 0.369 78 0.033 0.040 0.067 0.071 0.229 0.006 0.010 0.010 0.030 Dairy products -0.065 0.455 0.123 0.279 0.021 -0.065 -0.014 -0.035 0.130 86 0.097 0.089 0.146 0.155 0.433 0.013 0.021 0.022 0.056 Oils and fats 0.095 0.167 0.144 0.039 -0.007 -0.025 -0.018 -0.007 0.343 86 0.041 0.045 0.074 0.078 0.219 0.006 0.011 0.011 0.028 Other foods 0.124 -0.059 -0.039 -0.198 -0.003 0.009 0.008 0.027 -0.027 81 0.111 0.092 0.141 0.151 0.480 0.013 0.020 0.021 0.062 Food 1.256 0.461 0.284 -0.580 -0.109 -0.054 -0.031 0.055 0.840 80 0.330 0.142 0.182 0.206 0.971 0.018 0.022 0.025 0.101
39
Table A2 Estimation results from regressions incorporating income group dummy variables
Intercept D11 D12 D13 logM logM*D11 logM*D12 logM*D13 R2 N Mean
Cereals 0.046 0.386 0.048 0.059 0.009 -0.030 0.006 -0.002 0.464 87 0.180 0.467 0.572 0.558 0.623 0.060 0.079 0.074 0.082 Meats -0.030 0.036 0.521 0.544 0.027 -0.009 -0.072 -0.074 0.077 87 0.167 0.403 0.493 0.481 0.537 0.052 0.068 0.064 0.071 Fruits and vegetables 0.375 -0.567 -0.238 -1.055 -0.030 0.089 0.036 0.146 0.068 87 0.171 0.469 0.574 0.560 0.626 0.060 0.079 0.075 0.082 Aquatic products -0.241 0.145 0.011 -0.242 0.036 -0.015 0.003 0.038 0.092 82 0.045 0.320 0.368 0.357 0.386 0.041 0.050 0.047 0.050 Alcoholic drinks -0.167 0.034 0.330 0.035 -0.006 -0.046 0.113 75 0.081 0.080 0.229 0.313 0.011 0.033 0.042 Beverages -0.123 0.244 0.059 0.022 -0.036 -0.008 0.294 78 0.033 0.030 0.086 0.125 0.004 0.012 0.017 Dairy products -0.270 0.560 0.525 0.427 0.048 -0.080 -0.070 -0.055 0.007 86 0.097 0.282 0.345 0.337 0.376 0.036 0.048 0.045 0.049 Oils and fats 0.005 -0.036 0.024 0.108 0.003 0.011 0.000 -0.013 0.242 86 0.041 0.144 0.176 0.172 0.192 0.019 0.024 0.023 0.025 Other foods 0.131 -0.020 -0.040 0.245 -0.002 0.001 0.005 -0.033 -0.040 81 0.111 0.263 0.332 0.308 0.341 0.034 0.046 0.041 0.045 Food 1.546 -0.143 0.831 80 0.330 0.062 0.007
40
References
Barten, A.P. (1977), “The Systems of Consumer Demand Functions Approach: A
Review”, Econometrica, 45, 23-51.
Clements, K.W., F.E. Suhm and H. Theil (1979), “A Cross-country tabulation of Income
Elasticities of Demand”, Economics Letters, 3, 199-202.
Clements, K.W., S. Selvanathan and E.A Selvanathan (1995), “The Economic theory of
the Consumer”, in E.A. Selvanathan and K.W. Clements (eds.) Recent Development
in Applied Demand Analysis: Alcohol, Advertising and Global Consumption,
Berlin/Heidelberg: Spring-Verlag, chapter 1, 1-72.
Clements, K.W., Y. Wu and J. Zhang (2003), “Comparing International Consumption
Patterns”, unpublished research report, School of Economics and Commerce,
University of Western Australia.
Deaton, A. and J. Muellbauer (1984), Economics and Consumer Behaviour, Cambridge:
Cambridge university Press.
Easterly, W. and H. Yu (2000), “Global Development Network Growth Database”,
unpublished, the World Bank.
Huang, J. and H. Bouis (2001), “Structural Changes in the Demand for Food in Asia:
Empirical Evidence from Taiwan”, Agricultural Economics, 26, 57-69.
Kravis, I.B., A.W. Heston and R. Summers (1982), World Product and Income:
International Comparisons of Real Gross Product, Baltimore: Johns Hopkins
University Press.
Leser, C.E.V. (1963), ‘Forms of Engel functions’, Econometrica, 8, 694-703.
41
National Statistical Bureau, 1996, China’s statistical yearbook 1996, Beijing: Statistical
Publishing House.
Regmi, A., M.S. Deepak, J. Seale and J. Bernstein (2001), “Cross-Country Analysis of
Food Comparison Patterns”, in A. Regmi (ed.) Changing Structure of Global Food
Consumption and Trade, Economic Research Service, US Department of
Agriculture.
Rimmer, M.T. and A.A. Powell (1992), “Demand Patterns Across the Development
Spectrum: Estimates of AIDADS”, IMPACT Working Paper, OP-75, Monash
University.
Seale, J. and A. Regmi (2002), “International Consumption Patterns: Evidence from the
1996 International Comparison Project”, unpublished manuscript, Department of
Food and Resource Economics, University of Florida.
Seale, J. and H. Theil (1986), “Working’s Model for Food in the Four Phases of the
International Comparison Project”, Economics Letters, 22, 103-104.
Statistical Yearbook of the Republic of China 1996, Directorate-General of Budget,
Accounting and Statistics, Executive Yuan, Republic of China.
Theil, H. and K.W. Clements (1987), Applied Demand Analysis: Results from System-
Wide Approaches, Cambridge: Ballinger Publishing Company.
Working, H. (1943), “Statistical laws of family expenditure”, Journal of the American
Statistical Association, 38, 43-56.