Embed Size (px)
Citation preview
PHYSICAL REVIEW MATERIALS 2, 045605 (2018)
Understanding morphology-mobility dependence in PEDOT:Tos
Nicolas Rolland,1 Juan Felipe Franco-Gonzalez,1 Riccardo Volpi,2,3 Mathieu Linares,4,5 and Igor V. Zozoulenko1,*
1Laboratory of Organic Electronics, Department of Science and Technology (ITN), Campus Norrköping, Linköping University,SE-60174 Norrköping, Sweden
2Department of Physics, Chemistry and Biology (IFM), Linköping University, SE-58183 Linköping, Sweden3Machine Learning and Optimization Group, Romanian Institute of Science and Technology (RIST), Cluj-Napoca, Romania
4School of Biotechnology, Division of Theoretical Chemistry & Biology, KTH Royal Institute of Technology, 114 21 Stockholm, Sweden5Swedish e-Science Research Centre, KTH Royal Institute of Technology, 104 50 Stockholm, Sweden
(Received 23 January 2018; revised manuscript received 15 March 2018; published 30 April 2018)
The potential of conjugated polymers to compete with inorganic materials in the field of semiconductor isconditional on fine-tuning of the charge carriers mobility. The latter is closely related to the material morphology,and various studies have shown that the bottleneck for charge transport is the connectivity between well-orderedcrystallites, with a high degree of π -π stacking, dispersed into a disordered matrix. However, at this time thereis a lack of theoretical descriptions accounting for this link between morphology and mobility, hindering thedevelopment of systematic material designs. Here we propose a computational model to predict charge carriersmobility in conducting polymer PEDOT depending on the physicochemical properties of the system. We startby calculating the morphology using molecular dynamics simulations. Based on the calculated morphologywe perform quantum mechanical calculation of the transfer integrals between states in polymer chains andcalculate corresponding hopping rates using the Miller-Abrahams formalism. We then construct a transportresistive network, calculate the mobility using a mean-field approach, and analyze the calculated mobility interms of transfer integrals distributions and percolation thresholds. Our results provide theoretical support forthe recent study [Noriega et al., Nat. Mater. 12, 1038 (2013)] explaining why the mobility in polymers rapidlyincreases as the chain length is increased and then saturates for sufficiently long chains. Our study also providesthe answer to the long-standing question whether the enhancement of the crystallinity is the key to designinghigh-mobility polymers. We demonstrate, that it is the effective π -π stacking, not the long-range order that isessential for the material design for the enhanced electrical performance. This generic model can compare themobility of a polymer thin film with different solvent contents, solvent additives, dopant species or polymercharacteristics, providing a general framework to design new high mobility conjugated polymer materials.
DOI: 10.1103/PhysRevMaterials.2.045605
I. INTRODUCTION
Organic conducting polymers are appealing materials forthe semiconductors industry, which is currently essentiallybased on inorganic semiconductors such as silicon. They arenot only progressively reaching similar material performance,but they also possess many properties that conventional semi-conductors are missing, such as being easily processed, cheap,abundant, and environment friendly and having the mechanicalproperties of plastic, opening the door to the wide field offlexible and printed electronics [1]. They already proved to beefficient in a wide range of applications such as optoelectronics[2], organic field-effect transistors [3], electrochemical transis-tors [4], photovoltaics [5], sensors [6], and thermoelectricity[7], just to name a few. One of the most studied conductingpolymer is poly-(3,4-ethylenedioxythiophene) (best knownas PEDOT), which importance for organic electronics stemsfor its stability, well-developed manufacturing technology,and excellent electronic and optical properties [8–12]. It alsosupports ionic transport and is biocompatible, which makes
it possible to use it for bioelectronic application such as ionpumps [13] and drug delivery systems [14], as well as forenergy storage applications such as supercapacitors, batteries,and fuel cells [15].
Despite considerable experimental progress accumulatedsince the mid-2000s, the development of conducting polymershas been hindered by a lack of fundamental knowledge aboutthe physical processes behind conductivity in these materials,which makes difficult a rational and systematic material design.In particular, the central question on how the electron mobilityin PEDOT can be understood and theoretically predictedfrom the polymer structure and morphology still remainsunanswered and highly controversial. Recent studies showthe premise of a unified model to describe these materials.For example, in a recent review it was stated that the chainlength N has a tremendous impact on the mobility [16]. This,however, is not fully consistent with a recent study of Noriegaet al. [17], where, based on an extensive literature survey,it was demonstrated that the mobility of various conductingpolymers is rather insensitive to the molecular weight (i.e., thechain length) but exhibits a sharp decrease for low weights forsome polymers. This behavior was correlated with the degreeof paracrystallinity (defined as the standard deviation of local
2475-9953/2018/2(4)/045605(9) 045605-1 ©2018 American Physical Society
NICOLAS ROLLAND et al. PHYSICAL REVIEW MATERIALS 2, 045605 (2018)
static lattice fluctuations normalized by the average value ofthe lattice spacing) in the films and has been explained byinvocating the existence of crystalline domains linked by tiemolecules that cross an amorphous polymer matrix. A relatedimportant question which is currently under debate is whetherone needs to improve crystallinity of the polymer in order toenhance its mobility [17–19].
It is remarkable that despite this great interest to unravelthe relation between morphology and electrical performance,there is no reliable model that could guide the design of high-performing PEDOT materials based on its actual morphology.Indeed, so far theoretical description concerned with PEDOTand related systems utilized models not relying on its structuralproperties, which include cubic-grid Monte Carlo models[20,21], semi-analytical approaches [20–23] or idealized mod-els of perfect crystal structure [24–26]. It is also noteworthythat Kang and Snyder [27] reported recently a general de-scription of transport in conducting polymers that can captureessential transport parameters through a phenomenologicalsingle transport function [27]. Interestingly, the latter is a powerlaw with exponent s = 3 for most polymers except for PEDOTdoped with Tosylate (PEDOT:Tos), where s = 1. This makesPEDOT:Tos an interesting and important case study to unravelfundamental transport mechanisms in conducting polymers.
In contrast to the case on the above-mentioned theoreticalapproaches used for PEDOT, transport modeling from realis-tic morphologies obtained by molecular dynamics has beensuccessfully applied to a wide range of organics materialswith various levels of theory [28–40]. The cornerstone ofthese approaches is the calculation of the transfer integralsdistribution in the materials to relate the film morphology tothe carrier mobility, highlighting the bottlenecks for chargetransport. For instance, in discotic liquid crystals the transportis limited by the tail of small transfer integrals (defects) [41],while in amorphous polypyrrole the transport is limited by athreshold transfer integral corresponding to the first peak in thedistribution, rather insensitive to the global morphology [31].
Herein, we present a multiscale computational model topredict the charge carriers mobility in polymer films dependingon their morphologies. The level of theory is kept as simple aspossible so that the link between morphology and mobilityis straightforward, and a general framework is provided todiscuss transport in conducting polymers in terms of transferintegrals distribution and percolation. The model is appliedto PEDOT:Tos, with particular emphasis on the effects ofmolecular weight and solvent content. Our results providetheoretical support of the findings of Noriega et al. [17] ex-plaining why the mobility rapidly increases as the chain lengthis increased and then saturates for sufficiently long chains. Ourstudy also provides the answer to the long-debated questionregarding whether the enhancement of the crystallinity is thekey to designing high-mobility polymers. We demonstrate thatit is the effective π -π stacking, not the long-range order, thatis essential for the material design for enhanced electricalperformance.
The organization of the article is as follows. In Sec. IIwe introduce our model of a resistive network based on thepolymer morphology and we explain how the parameters of themodel are calculated. In Sec. III, we develop the methodologyto solve the model’s equations and we present the results of
the mobility dependence as a function of the chain length andwater content. Finally, the last section is a discussion of theresults that highlights the link between polymer morphology,transfer integral distribution, percolation, and mobility.
II. RESULTS AND DISCUSSION
A. From morphology to resistive network
The different PEDOT:Tos morphologies studied in thiswork were generated by molecular dynamics simulations(MD) following the methodology developed in previous works[42–44]. The initial systems are mixtures of positively chargedPEDOT oligomers, Tosylate anions and water molecules; thesystem has a neutral charge when the total positive chargecarried by the PEDOT oligomers exactly compensate theTosylate anionic charge. The initial water concentration is setto W = 82% w/w, and the crystallization of PEDOT oligomersand evolution of the morphology of the system is investigatedby consequently removing a part of the water molecules anditeratively equilibrating the system at ambient temperaturefrom the initial highly hydrated phase to a dry phase untilno water remains in the same way at this has been done inRef. [42] (see the Supporting Information for details [45]).
In this work, we focused on the systems with W =43%,13%, and 0% w/w (typical water concentration is 10–20% in thin films under ambient conditions). The ratio ofmonomers in PEDOT chains to Tosylate anions is 3 to 1, whichcorresponds to a pristine (i.e., as polymerized) PEDOT with theoxidation level ≈33% [46]. In each system, the chain length N
(number of monomers per chain) is constant, and the number ofPEDOT chains is such that the total monomer number is closeto 600. We investigated the chain length impact on mobilityby considering systems with N = 3,6,9,12,15, and 18. (Notethat the experimental value for PEDOT chain length is notknown exactly and estimated to be N = 5–15 monomer units)[47,48]. A representative morphology obtained through thisprocedure is presented in Fig. 1(a).
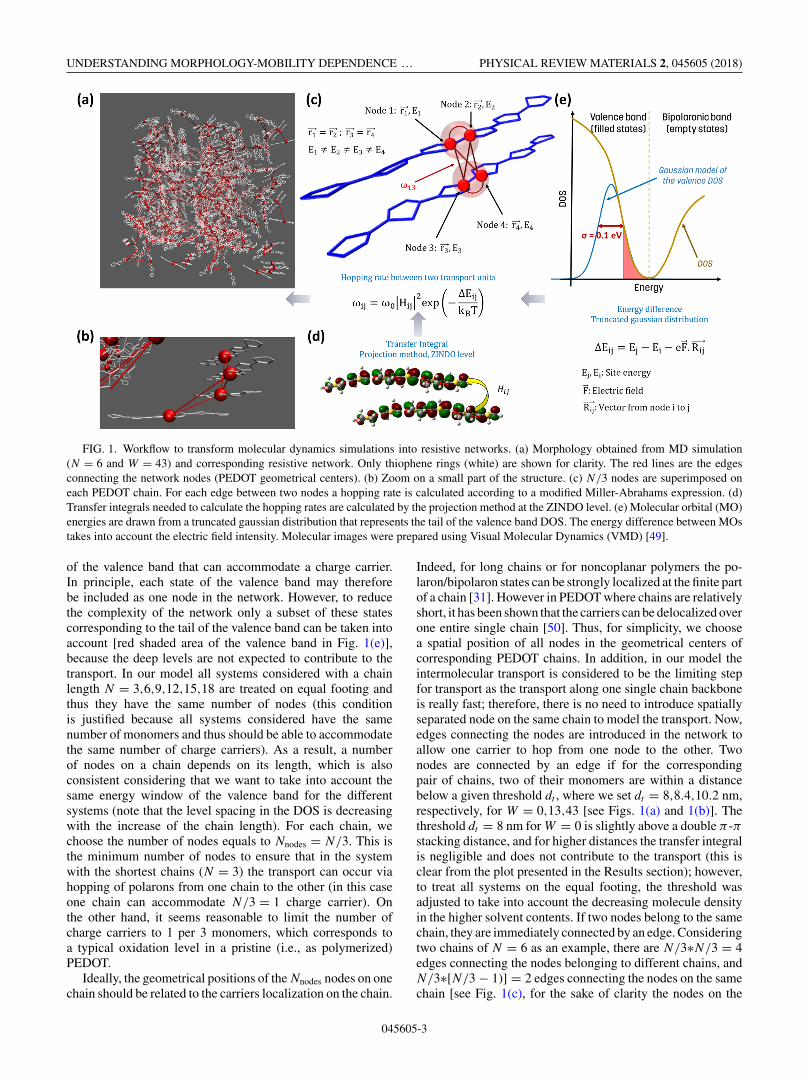
Once the system is equilibrated by MD simulations, itcan be converted into a resistive network with the followingprocedure. To define the network we first have to specify theorigin of charge carriers in PEDOT. As specified above, weconsider a heavily doped PEDOT with oxidation level 33%,where three monomer units accommodate a positive charge+e. (Note that negative Tos counterions compensating positivecharges in the polymer backbone, do not participate in the elec-trical transport). The positive charges correspond to the po-laronic/bipolaronic band of PEDOT’s electronic structure asschematically shown in Fig. 1(e) (for details of the electronicstructure of PEDOT:Tos see Refs. [50,51]). A PEDOT dopedwith negative counterions represents a p-type material whereelectrical transport is due to the thermally assisted hoppingof polarons/bipolarons via the states in the valence band. Thetail of the density of states (DOS) in the valence band canbe approximated by the Gaussian with a typical broadeningσ ∼ 0.1 eV as shown in Fig. 1(e) [23,50,51].
Based on the picture outlined above, a resistive network isbuilt to model the diffusion of the charge carriers through thesystem. Each node of the network (also called a transport unit),belongs to a particular chain and represents an electronic state
045605-2
UNDERSTANDING MORPHOLOGY-MOBILITY DEPENDENCE … PHYSICAL REVIEW MATERIALS 2, 045605 (2018)
FIG. 1. Workflow to transform molecular dynamics simulations into resistive networks. (a) Morphology obtained from MD simulation(N = 6 and W = 43) and corresponding resistive network. Only thiophene rings (white) are shown for clarity. The red lines are the edgesconnecting the network nodes (PEDOT geometrical centers). (b) Zoom on a small part of the structure. (c) N/3 nodes are superimposed oneach PEDOT chain. For each edge between two nodes a hopping rate is calculated according to a modified Miller-Abrahams expression. (d)Transfer integrals needed to calculate the hopping rates are calculated by the projection method at the ZINDO level. (e) Molecular orbital (MO)energies are drawn from a truncated gaussian distribution that represents the tail of the valence band DOS. The energy difference between MOstakes into account the electric field intensity. Molecular images were prepared using Visual Molecular Dynamics (VMD) [49].
of the valence band that can accommodate a charge carrier.In principle, each state of the valence band may thereforebe included as one node in the network. However, to reducethe complexity of the network only a subset of these statescorresponding to the tail of the valence band can be taken intoaccount [red shaded area of the valence band in Fig. 1(e)],because the deep levels are not expected to contribute to thetransport. In our model all systems considered with a chainlength N = 3,6,9,12,15,18 are treated on equal footing andthus they have the same number of nodes (this conditionis justified because all systems considered have the samenumber of monomers and thus should be able to accommodatethe same number of charge carriers). As a result, a numberof nodes on a chain depends on its length, which is alsoconsistent considering that we want to take into account thesame energy window of the valence band for the differentsystems (note that the level spacing in the DOS is decreasingwith the increase of the chain length). For each chain, wechoose the number of nodes equals to Nnodes = N/3. This isthe minimum number of nodes to ensure that in the systemwith the shortest chains (N = 3) the transport can occur viahopping of polarons from one chain to the other (in this caseone chain can accommodate N/3 = 1 charge carrier). Onthe other hand, it seems reasonable to limit the number ofcharge carriers to 1 per 3 monomers, which corresponds toa typical oxidation level in a pristine (i.e., as polymerized)PEDOT.
Ideally, the geometrical positions of the Nnodes nodes on onechain should be related to the carriers localization on the chain.
Indeed, for long chains or for noncoplanar polymers the po-laron/bipolaron states can be strongly localized at the finite partof a chain [31]. However in PEDOT where chains are relativelyshort, it has been shown that the carriers can be delocalized overone entire single chain [50]. Thus, for simplicity, we choosea spatial position of all nodes in the geometrical centers ofcorresponding PEDOT chains. In addition, in our model theintermolecular transport is considered to be the limiting stepfor transport as the transport along one single chain backboneis really fast; therefore, there is no need to introduce spatiallyseparated node on the same chain to model the transport. Now,edges connecting the nodes are introduced in the network toallow one carrier to hop from one node to the other. Twonodes are connected by an edge if for the correspondingpair of chains, two of their monomers are within a distancebelow a given threshold dt , where we set dt = 8,8.4,10.2 nm,respectively, for W = 0,13,43 [see Figs. 1(a) and 1(b)]. Thethreshold dt = 8 nm for W = 0 is slightly above a double π -πstacking distance, and for higher distances the transfer integralis negligible and does not contribute to the transport (this isclear from the plot presented in the Results section); however,to treat all systems on the equal footing, the threshold wasadjusted to take into account the decreasing molecule densityin the higher solvent contents. If two nodes belong to the samechain, they are immediately connected by an edge. Consideringtwo chains of N = 6 as an example, there are N/3∗N/3 = 4edges connecting the nodes belonging to different chains, andN/3∗[N/3 − 1)] = 2 edges connecting the nodes on the samechain [see Fig. 1(c), for the sake of clarity the nodes on the
045605-3
NICOLAS ROLLAND et al. PHYSICAL REVIEW MATERIALS 2, 045605 (2018)
same chain have been spatially separated but their coordinatesare the same]. Hopping rates ωi,j for the charge carriers areassociated to each edge within a modified Miller-Abrahamsformalism [52]:
ωi,j = ω0|Hi,j |2 exp
(−�Ei,j
kBT
), (1)
where ω0 is a prefactor, Hi,j is the so-called transfer integralbetween states corresponding to the nodes i and j , �Ei,j
is the energy difference between states i and j , �Ei,j =Ej − Ei − eF ri,j , with F being the electric field intensity andri,j the distance in the field direction between the center of thechains holding nodes i and j . The Ei are the energies of thevalence band states represented by the nodes: They are drawnfrom a truncated Gaussian distribution of standard deviation0.1 eV as depicted in Fig. 1(e) (only energies above 0.1 eV fromthe Gaussian mean value are taken into account). Here it may bepointed out that the energy levels associated with neighboringnodes might be correlated because the electrostatic potentialaround the PEDOT chain is correlated with the positions ofthe counterions [50,51]. To keep our model on a tractablelevel we do not account for such correlation because thiswould require full quantum mechanical calculation over thewhole system. For calculation of the transfer integral Hi,j
between nodes belonging to different chains, we made theapproximation that it can be treated as the transfer integralbetween the molecular orbitals (MOs) of the neutral statesof the chains. We use the dimer projection method at theZINDO level [53], such that the relative orientation of twomolecules is accounted for in the transfer integral values(as in Ref. [41]), see Fig. 1(d) for illustration. (Note thatall corresponding MOs are calculated using GAUSSIAN09[54] package for PEDOT chains as obtained from the MDsimulations; the transfer integrals are evaluated for the neutralchains for N/3 highest MOs in the valence band.) It shouldbe stressed that ZINDO calculations give the expression forthe transfer integrals that depend not only for a distancebetween the chains ri,j , |Hi,j | ∝ exp (−ri,j ), but also accountsfor relative orientations of two chains. (For additional detailsof ZINDO calculations see the Supporting Information [45].)Note that ZINDO is well known to underestimate the value ofthe transfer integral. However, for a set of geometries the shapeof the distribution of transfer integral looks very similar tothe one obtained at higher level of calculation (see, for instance,Ref. [55]). Regarding rotations and translations, many studieshave investigated those effects on model systems and showthat ZINDO is able to reproduce the trend obtained at higherlevel on rotations and translations (see, for instance, Ref. [56]).In the case where sites i and j belong to the same chain,we arbitrarily set |Hi,j | = 1 eV, which greatly exceed typicalvalues of the intrachain transfer integrals. This is justifiedbecause PEDOT chains are relatively short, and hence the MOsare typically delocalized over significant part of the chain asstated previously. As a result, the intramolecular transfer ratein much higher than the intermolecular one, and the limitingstep for charge transport through the volume is linked to theefficiency of the intermolecular transport.
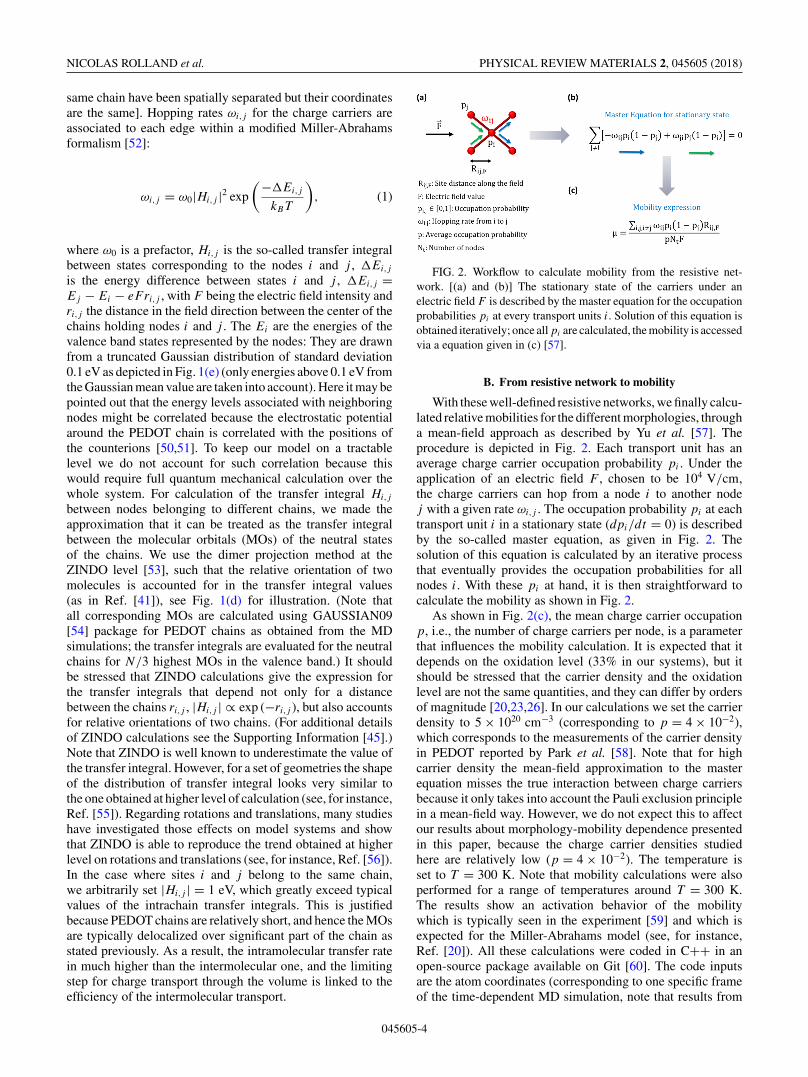
FIG. 2. Workflow to calculate mobility from the resistive net-work. [(a) and (b)] The stationary state of the carriers under anelectric field F is described by the master equation for the occupationprobabilities pi at every transport units i. Solution of this equation isobtained iteratively; once all pi are calculated, the mobility is accessedvia a equation given in (c) [57].
B. From resistive network to mobility
With these well-defined resistive networks, we finally calcu-lated relative mobilities for the different morphologies, througha mean-field approach as described by Yu et al. [57]. Theprocedure is depicted in Fig. 2. Each transport unit has anaverage charge carrier occupation probability pi . Under theapplication of an electric field F , chosen to be 104 V/cm,the charge carriers can hop from a node i to another nodej with a given rate ωi,j . The occupation probability pi at eachtransport unit i in a stationary state (dpi/dt = 0) is describedby the so-called master equation, as given in Fig. 2. Thesolution of this equation is calculated by an iterative processthat eventually provides the occupation probabilities for allnodes i. With these pi at hand, it is then straightforward tocalculate the mobility as shown in Fig. 2.
As shown in Fig. 2(c), the mean charge carrier occupationp, i.e., the number of charge carriers per node, is a parameterthat influences the mobility calculation. It is expected that itdepends on the oxidation level (33% in our systems), but itshould be stressed that the carrier density and the oxidationlevel are not the same quantities, and they can differ by ordersof magnitude [20,23,26]. In our calculations we set the carrierdensity to 5 × 1020 cm−3 (corresponding to p = 4 × 10⁻²),which corresponds to the measurements of the carrier densityin PEDOT reported by Park et al. [58]. Note that for highcarrier density the mean-field approximation to the masterequation misses the true interaction between charge carriersbecause it only takes into account the Pauli exclusion principlein a mean-field way. However, we do not expect this to affectour results about morphology-mobility dependence presentedin this paper, because the charge carrier densities studiedhere are relatively low (p = 4 × 10⁻²). The temperature isset to T = 300 K. Note that mobility calculations were alsoperformed for a range of temperatures around T = 300 K.The results show an activation behavior of the mobilitywhich is typically seen in the experiment [59] and which isexpected for the Miller-Abrahams model (see, for instance,Ref. [20]). All these calculations were coded in C++ in anopen-source package available on Git [60]. The code inputsare the atom coordinates (corresponding to one specific frameof the time-dependent MD simulation, note that results from
045605-4
UNDERSTANDING MORPHOLOGY-MOBILITY DEPENDENCE … PHYSICAL REVIEW MATERIALS 2, 045605 (2018)
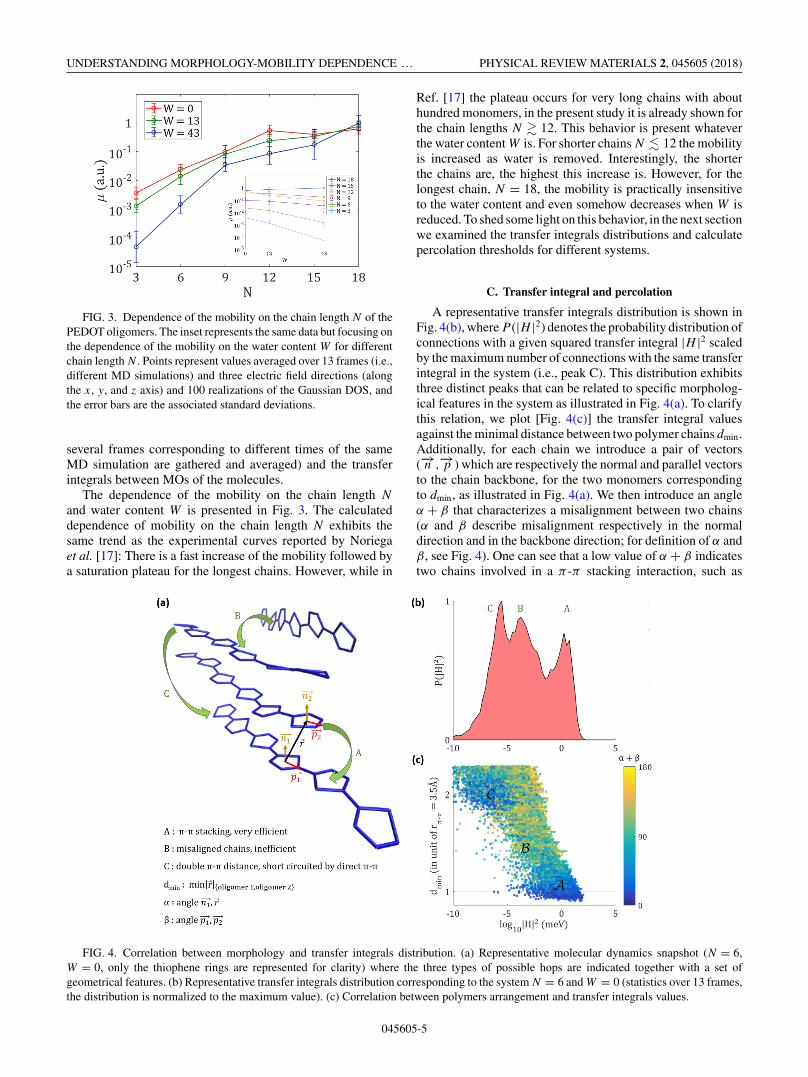
FIG. 3. Dependence of the mobility on the chain length N of thePEDOT oligomers. The inset represents the same data but focusing onthe dependence of the mobility on the water content W for differentchain length N . Points represent values averaged over 13 frames (i.e.,different MD simulations) and three electric field directions (alongthe x, y, and z axis) and 100 realizations of the Gaussian DOS, andthe error bars are the associated standard deviations.
several frames corresponding to different times of the sameMD simulation are gathered and averaged) and the transferintegrals between MOs of the molecules.
The dependence of the mobility on the chain length N
and water content W is presented in Fig. 3. The calculateddependence of mobility on the chain length N exhibits thesame trend as the experimental curves reported by Noriegaet al. [17]: There is a fast increase of the mobility followed bya saturation plateau for the longest chains. However, while in
Ref. [17] the plateau occurs for very long chains with abouthundred monomers, in the present study it is already shown forthe chain lengths N � 12. This behavior is present whateverthe water content W is. For shorter chains N � 12 the mobilityis increased as water is removed. Interestingly, the shorterthe chains are, the highest this increase is. However, for thelongest chain, N = 18, the mobility is practically insensitiveto the water content and even somehow decreases when W isreduced. To shed some light on this behavior, in the next sectionwe examined the transfer integrals distributions and calculatepercolation thresholds for different systems.
C. Transfer integral and percolation
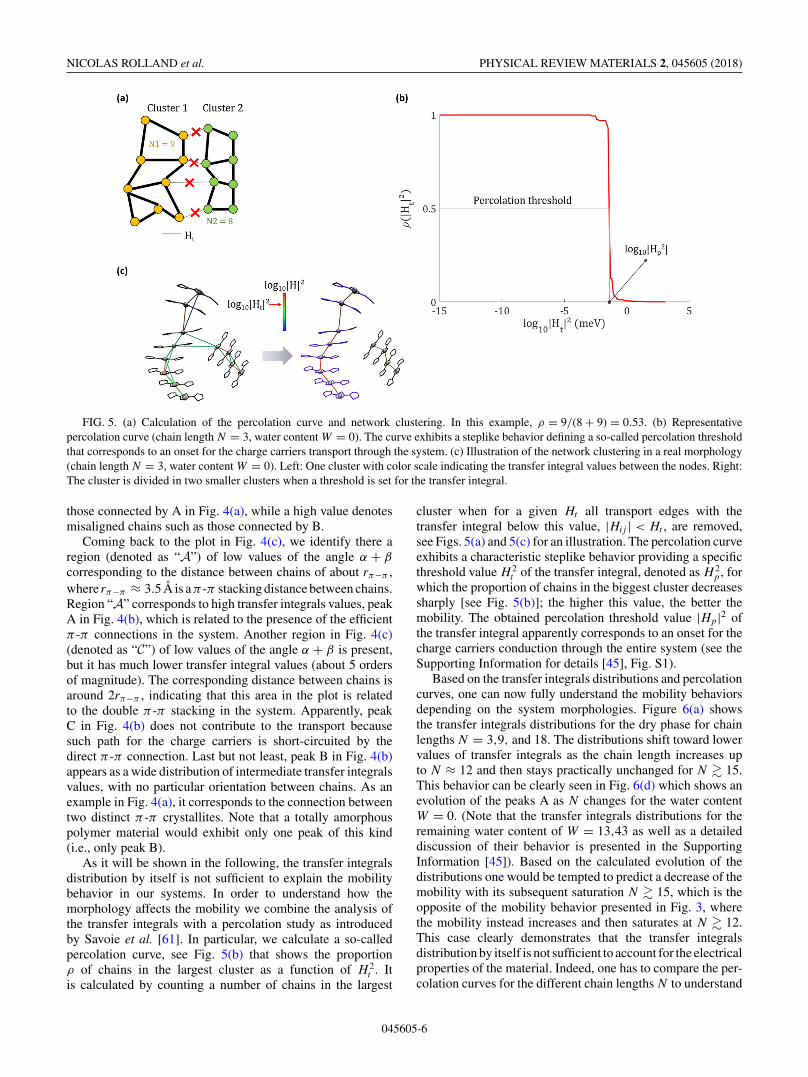
A representative transfer integrals distribution is shown inFig. 4(b), where P (|H |2) denotes the probability distribution ofconnections with a given squared transfer integral |H |2 scaledby the maximum number of connections with the same transferintegral in the system (i.e., peak C). This distribution exhibitsthree distinct peaks that can be related to specific morpholog-ical features in the system as illustrated in Fig. 4(a). To clarifythis relation, we plot [Fig. 4(c)] the transfer integral valuesagainst the minimal distance between two polymer chains dmin.Additionally, for each chain we introduce a pair of vectors(−→n ,
−→p ) which are respectively the normal and parallel vectors
to the chain backbone, for the two monomers correspondingto dmin, as illustrated in Fig. 4(a). We then introduce an angleα + β that characterizes a misalignment between two chains(α and β describe misalignment respectively in the normaldirection and in the backbone direction; for definition of α andβ, see Fig. 4). One can see that a low value of α + β indicatestwo chains involved in a π -π stacking interaction, such as
FIG. 4. Correlation between morphology and transfer integrals distribution. (a) Representative molecular dynamics snapshot (N = 6,W = 0, only the thiophene rings are represented for clarity) where the three types of possible hops are indicated together with a set ofgeometrical features. (b) Representative transfer integrals distribution corresponding to the system N = 6 and W = 0 (statistics over 13 frames,the distribution is normalized to the maximum value). (c) Correlation between polymers arrangement and transfer integrals values.
045605-5
NICOLAS ROLLAND et al. PHYSICAL REVIEW MATERIALS 2, 045605 (2018)
FIG. 5. (a) Calculation of the percolation curve and network clustering. In this example, ρ = 9/(8 + 9) = 0.53. (b) Representativepercolation curve (chain length N = 3, water content W = 0). The curve exhibits a steplike behavior defining a so-called percolation thresholdthat corresponds to an onset for the charge carriers transport through the system. (c) Illustration of the network clustering in a real morphology(chain length N = 3, water content W = 0). Left: One cluster with color scale indicating the transfer integral values between the nodes. Right:The cluster is divided in two smaller clusters when a threshold is set for the transfer integral.
those connected by A in Fig. 4(a), while a high value denotesmisaligned chains such as those connected by B.
Coming back to the plot in Fig. 4(c), we identify there aregion (denoted as “A”) of low values of the angle α + β
corresponding to the distance between chains of about rπ−π ,where rπ−π ≈ 3.5 A is aπ -π stacking distance between chains.Region “A” corresponds to high transfer integrals values, peakA in Fig. 4(b), which is related to the presence of the efficientπ -π connections in the system. Another region in Fig. 4(c)(denoted as “C”) of low values of the angle α + β is present,but it has much lower transfer integral values (about 5 ordersof magnitude). The corresponding distance between chains isaround 2rπ−π , indicating that this area in the plot is relatedto the double π -π stacking in the system. Apparently, peakC in Fig. 4(b) does not contribute to the transport becausesuch path for the charge carriers is short-circuited by thedirect π -π connection. Last but not least, peak B in Fig. 4(b)appears as a wide distribution of intermediate transfer integralsvalues, with no particular orientation between chains. As anexample in Fig. 4(a), it corresponds to the connection betweentwo distinct π -π crystallites. Note that a totally amorphouspolymer material would exhibit only one peak of this kind(i.e., only peak B).
As it will be shown in the following, the transfer integralsdistribution by itself is not sufficient to explain the mobilitybehavior in our systems. In order to understand how themorphology affects the mobility we combine the analysis ofthe transfer integrals with a percolation study as introducedby Savoie et al. [61]. In particular, we calculate a so-calledpercolation curve, see Fig. 5(b) that shows the proportionρ of chains in the largest cluster as a function of H 2
t . Itis calculated by counting a number of chains in the largest
cluster when for a given Ht all transport edges with thetransfer integral below this value, |Hij | < Ht , are removed,see Figs. 5(a) and 5(c) for an illustration. The percolation curveexhibits a characteristic steplike behavior providing a specificthreshold value H 2
t of the transfer integral, denoted as H 2p , for
which the proportion of chains in the biggest cluster decreasessharply [see Fig. 5(b)]; the higher this value, the better themobility. The obtained percolation threshold value |Hp|2 ofthe transfer integral apparently corresponds to an onset for thecharge carriers conduction through the entire system (see theSupporting Information for details [45], Fig. S1).
Based on the transfer integrals distributions and percolationcurves, one can now fully understand the mobility behaviorsdepending on the system morphologies. Figure 6(a) showsthe transfer integrals distributions for the dry phase for chainlengths N = 3,9, and 18. The distributions shift toward lowervalues of transfer integrals as the chain length increases upto N ≈ 12 and then stays practically unchanged for N � 15.This behavior can be clearly seen in Fig. 6(d) which shows anevolution of the peaks A as N changes for the water contentW = 0. (Note that the transfer integrals distributions for theremaining water content of W = 13,43 as well as a detaileddiscussion of their behavior is presented in the SupportingInformation [45]). Based on the calculated evolution of thedistributions one would be tempted to predict a decrease of themobility with its subsequent saturation N � 15, which is theopposite of the mobility behavior presented in Fig. 3, wherethe mobility instead increases and then saturates at N � 12.This case clearly demonstrates that the transfer integralsdistribution by itself is not sufficient to account for the electricalproperties of the material. Indeed, one has to compare the per-colation curves for the different chain lengths N to understand
045605-6
UNDERSTANDING MORPHOLOGY-MOBILITY DEPENDENCE … PHYSICAL REVIEW MATERIALS 2, 045605 (2018)
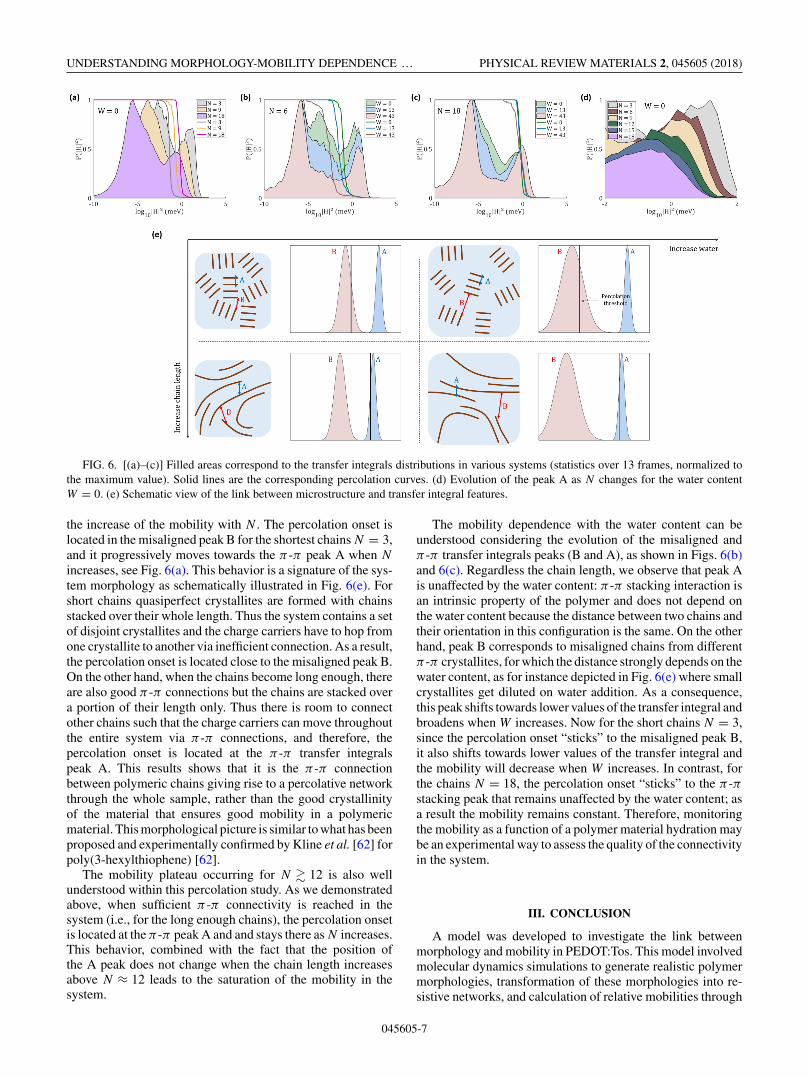
FIG. 6. [(a)–(c)] Filled areas correspond to the transfer integrals distributions in various systems (statistics over 13 frames, normalized tothe maximum value). Solid lines are the corresponding percolation curves. (d) Evolution of the peak A as N changes for the water contentW = 0. (e) Schematic view of the link between microstructure and transfer integral features.
the increase of the mobility with N . The percolation onset islocated in the misaligned peak B for the shortest chains N = 3,and it progressively moves towards the π -π peak A when N
increases, see Fig. 6(a). This behavior is a signature of the sys-tem morphology as schematically illustrated in Fig. 6(e). Forshort chains quasiperfect crystallites are formed with chainsstacked over their whole length. Thus the system contains a setof disjoint crystallites and the charge carriers have to hop fromone crystallite to another via inefficient connection. As a result,the percolation onset is located close to the misaligned peak B.On the other hand, when the chains become long enough, thereare also good π -π connections but the chains are stacked overa portion of their length only. Thus there is room to connectother chains such that the charge carriers can move throughoutthe entire system via π -π connections, and therefore, thepercolation onset is located at the π -π transfer integralspeak A. This results shows that it is the π -π connectionbetween polymeric chains giving rise to a percolative networkthrough the whole sample, rather than the good crystallinityof the material that ensures good mobility in a polymericmaterial. This morphological picture is similar to what has beenproposed and experimentally confirmed by Kline et al. [62] forpoly(3-hexylthiophene) [62].
The mobility plateau occurring for N � 12 is also wellunderstood within this percolation study. As we demonstratedabove, when sufficient π -π connectivity is reached in thesystem (i.e., for the long enough chains), the percolation onsetis located at the π -π peak A and and stays there as N increases.This behavior, combined with the fact that the position ofthe A peak does not change when the chain length increasesabove N ≈ 12 leads to the saturation of the mobility in thesystem.
The mobility dependence with the water content can beunderstood considering the evolution of the misaligned andπ -π transfer integrals peaks (B and A), as shown in Figs. 6(b)and 6(c). Regardless the chain length, we observe that peak Ais unaffected by the water content: π -π stacking interaction isan intrinsic property of the polymer and does not depend onthe water content because the distance between two chains andtheir orientation in this configuration is the same. On the otherhand, peak B corresponds to misaligned chains from differentπ -π crystallites, for which the distance strongly depends on thewater content, as for instance depicted in Fig. 6(e) where smallcrystallites get diluted on water addition. As a consequence,this peak shifts towards lower values of the transfer integral andbroadens when W increases. Now for the short chains N = 3,since the percolation onset “sticks” to the misaligned peak B,it also shifts towards lower values of the transfer integral andthe mobility will decrease when W increases. In contrast, forthe chains N = 18, the percolation onset “sticks” to the π -πstacking peak that remains unaffected by the water content; asa result the mobility remains constant. Therefore, monitoringthe mobility as a function of a polymer material hydration maybe an experimental way to assess the quality of the connectivityin the system.
III. CONCLUSION
A model was developed to investigate the link betweenmorphology and mobility in PEDOT:Tos. This model involvedmolecular dynamics simulations to generate realistic polymermorphologies, transformation of these morphologies into re-sistive networks, and calculation of relative mobilities through
045605-7
NICOLAS ROLLAND et al. PHYSICAL REVIEW MATERIALS 2, 045605 (2018)
a mean-field approach. Different chain lengths ranging fromN = 3 monomers per chain to N = 18 monomers per chainwere investigated, as well as water content W = 0,13 and 43%w/w. An exponential enhancement of the mobility with thechain length has been shown, until a plateau is reached forthe longest chains N � 15. This behavior has been explainedin terms of the transfer integrals distributions and percolationthresholds and confirms the experimental evidence showingthat, on increasing chain length, the morphology evolves froma set of well-defined but disconnected crystallites to a less-ordered material that exhibits an efficient network of π -πstacking extending throughout the material. Interestingly, thewater content affects the mobility depending on the chainlength. For the shortest chains, without good percolativenetworks, increasing the water content drastically reducesthe mobility while the effect of water becomes negligiblewhen sufficient connection through π -π stacking is reachedfor longer chains N � 15. Our study provides an answer tothe long-debated question on the importance of crystallinityand the long-range order for enhancement of the performanceof polymeric materials. Namely, we demonstrate that it isthe π -π connections between polymeric chains giving rise
to a percolative network through the whole sample ratherthan the good crystallinity of the material that ensure goodmobility in conducting polymers. Finally, this study providesa general framework to discuss polymer morphology engineer-ing in term of connectivity, transfer integral, and percolationonset, and the generic model presented opens the door tofurther investigations, including complex chain length distri-butions, other dopant and solvent species, and other polymersystems.
ACKNOWLEDGMENTS
This work was supported by the Swedish Energy Agency(Grants No. 38332—1 and No. 43561—1) and the Knut andAlice Wallenberg Foundation through the project The Tail ofthe Sun. I.V.Z. thanks the Advanced Functional Material centerat Linköping University. We acknowledge the support from theSwedish Research Council via “Research Environment grant”(Grant No. 2016—05990). The computations were performedon resources provided by the Swedish National Infrastructurefor Computing (SNIC) at NSC and HPC2N. M.L. thanks SeRC(Swedish e-Science Research Center) for funding.
[1] S. R. Forrest, Nature 428, 911 (2004).[2] Z. He, C. Zhong, S. Su, M. Xu, H. Wu, and Y. Cao, Nat. Photon.
6, 591 (2012).[3] H. Sirringhaus, Adv. Mater. 26, 1319 (2014).[4] J. Rivnay, P. Leleux, M. Ferro, M. Sessolo, A. Williamson, D.
A. Koutsouras, D. Khodagholy, M. Ramuz, X. Strakosas, R. M.Owens, C. Benar, J.-M. Badier, C. Bernard, and G. G. Malliaras,Sci. Adv. 1, e1400251 (2015)
[5] O. Inganas, Nat. Photon. 5, 201 (2011).[6] Z.-T. Zhu, J. T. Mabeck, C. Zhu, N. C. Cady, C. A. Batt, and G.
G. Malliaras, Chem. Commun. 13, 1556 (2004).[7] O. Bubnova, Z. U. Khan, A. Malti, S. Braun, M. Fahlman, and
M. X. Berggren, Nat. Mater. 10, 429 (2011).[8] H. Shi, C. Liu, Q. Jiang, and J. Xu, Adv. Electr. Mater. 1, 1500017
(2015).[9] N. Kim, H. Kang, J.-H. Lee, S. Kee, S. H. Lee, and K. Lee, Adv.
Mater. 27, 2317 (2015).[10] O. Bubnova et al. ,Nat. Mater. 13, 190 (2014).[11] N. Kim, B. H. Lee, D. Choi, G. Kim, H. Kim, J.-R. Kim, J. Lee,
Y. H. Kahng, and K. Lee, Phys. Rev. Lett. 109, 106405 (2012).[12] M. V. Fabretto, D. R. Evans, M. Mueller, K. Zuber, Hojati-P.
Talemi, R. D. Short, G. G. Wallace, and P. J. Murphy, Chem.Mater. 24, 3998 (2012).
[13] A. Williamson, J. Rivnay, L. Kergoat, A. Jonsson, S. Inal, I.Uguz, M. Ferro, A. Ivanov, T. A. Sjöström, D. T. Simon, M.Berggren, G. G. Malliaras, and C. Bernard, Adv. Mater. 27, 3138(2015).
[14] A. Jonsson, Z. Song, D. Nilsson, B. A. Meyerson, D. T. Simon,B. Linderoth, and M. Berggren, Sci. Adv. 1, e1500039 (2015).
[15] A. Malti, J. Edberg, H. Granberg, Z. U. Khan, J. W. Andreasen,X. Liu, D. Zhao, H. Zhang, Y. Yao, J. W. Brill, I. Engquist, M.Fahlman, L. Wågberg, X. Crispin, and M. Berggren, Adv. Sci.3, 1500305 (2016).
[16] A. M. Bryan, L. M. Santino, Y. Lu, S. Acharya, and J. M. D’Arcy,Chem. Mater. 28, 5989 (2016).
[17] R. Noriega, J. Rivnay, K. Vandewal, F. P. V. Koch, N.Stingelin, P. Smith, M. F. Toney, and A. Salleo, Nat. Mater. 12,1038 (2013).
[18] X. Zhang, H. Bronstein, A. J. Kronemeijer, J. Smith, Y. Kim, R. J.Kline, L. J. Richter, T. D. Anthopoulos, H. Sirringhaus, K. Song,M. Heeney, W. Zhang, I. McCulloch, and D. M. DeLongchamp,Nat. Commun. 4, 2238 (2013)..
[19] S. Wang, S. Fabiano, S. Himmelberger, S. Puzinas, X. Crispin,A. Salleo, and M. Berggren, Proc. Natl. Acad. Sci. U.S.A. 112,10599 (2015).
[20] S. Ihnatsenka, X. Crispin, and I. V. Zozoulenko, Phys. Rev. B92, 035201 (2015).
[21] D. Mendels and N. Tessler, J. Phys. Chem. C 117, 3287 (2013).[22] R. Schmechel, J. Appl. Phys. 93, 4653 (2003).[23] G. Kim and K. P. Pipe, Phys. Rev. B 86, 085208 (2012).[24] E.-G. Kim and J.-L. Brédas, J. Am. Chem. Soc. 130, 16880
(2008).[25] B. Zhang, K. Wang, D. Li, and X. Cui, RSC Adv. 5, 33885
(2015).[26] W. Shi, T. Zhao, J. Xi, D. Wang, and Z. Shuai, J. Am. Chem.
Soc. 137, 12929 (2015).[27] S. D. Kang and G. J. Snyder, Nat. Mater. 16, 252 (2017).[28] J. Kirkpatrick, V. Marcon, J. Nelson, K. Kremer, and D.
Andrienko, Phys. Rev. Lett. 98, 227402 (2007).[29] A. Troisi, Adv. Mater. 19, 2000 (2007).[30] J. Nelson, J. J. Kwiatkowski, J. Kirkpatrick, and J. M. Frost, Acc.
Chem. Res. 42, 1768 (2009).[31] V. Rühle, J. Kirkpatrick, and D. Andrienko, J. Chem. Phys. 132,
134103 (2010).[32] T. Vehoff, B. Baumeier, A. Troisi, and D. Andrienko, J. Am.
Chem. Soc. 132, 11702 (2010).
045605-8
UNDERSTANDING MORPHOLOGY-MOBILITY DEPENDENCE … PHYSICAL REVIEW MATERIALS 2, 045605 (2018)
[33] L. Wang, Q. Li, Z. Shuai, L. Chen, and Q. Shi, Phys. Chem.Chem. Phys. 12, 3309 (2010).
[34] L. Wang, G. Nan, X. Yang, Q. Peng, Q. Li, and Z. Shuai, Chem.Soc. Rev. 39, 423 (2010).
[35] V. Rühle, A. Lukyanov, F. May, M. Schrader, T. Vehoff, J.Kirkpatrick, B. Baumeier, and D. Andrienko, J. Chem. TheoryComput. 7, 3335 (2011).
[36] M. Jakobsson, M. Linares, and S. Stafström, J. Chem. Phys. 137,114901 (2012).
[37] Z. Shuai, H. Geng, W. Xu, Y. Liao, and J.-M. André, Chem. Soc.Rev. 43, 2662 (2014).
[38] R. Volpi, S. Stafström, and M. Linares, J. Chem. Phys. 142,094503 (2015).
[39] R. Volpi, S. Kottravel, M. S. Nørby, S. Stafström, and M. Linares,J. Chem. Theory Comput. 12, 812 (2016).
[40] I. Yavuz, B. N. Martin, J. Park, and K. N. Houk, J. Am. Chem.Soc. 137, 2856 (2015).
[41] X. Feng, V. Marcon, W. Pisula, M. R. Hansen, J. Kirkpatrick, F.Grozema, D. Andrienko, K. Kremer, and K. Müllen, Nat. Mater.8, 421 (2009).
[42] J. F. Franco-Gonzalez and I. V. Zozoulenko, J. Phys. Chem. B121, 4299 (2017).
[43] J. Felipe Franco-Gonzalez, E. Pavlopoulou, E. Stavrinidou, R.Gabrielsson, T. D. Simon, M. Berggren, and I. V. Zozoulenko,Nanoscale 9, 13717 (2017).
[44] S. Rudd, J. F. Franco-Gonzalez, K. S. Singh, Z. U. Khan, X.Crispin, J. W. Andreasen, I. Zozoulenko, and D. Evans, J. Polym.Sci. Part B: Polym. Phys. 56, 97 (2017).
[45] See Supplemental Material at http://link.aps.org/supplemental/10.1103/PhysRevMaterials.2.045605 for computational detailsto obtain the morphologies generated with molecular dynam-ics simulations and computational details to solve the masterequation for transport and to generate the percolation curves.Figure S1 illustrates the percolation concept and gives detailsabout the transfer integral calculation. Figure S2 comparestransfer integral distributions obtained with different levels oftheory. Figure S3 shows the saturation of the - shift when N
increases. We also provide a movie showing a morphology andthe resistive network for a system with N = 6 and W = 13.
[46] I. Petsagkourakis, E. Pavlopoulou, G. Portale, B. A. Kuropatwa,S. Dilhaire, G. Fleury, and G. Hadziioannou, Sci. Rep. 6, 30501(2016).
[47] A. Elschner, PEDOT: Principles and Applications of an Intrin-sically Conductive Polymer (CRC Press, Boca Raton, FL, 2011)
[48] A. Ugur, F. Katmis, M. Li, L. Wu, Y. Zhu, K. K. Varanasi, andK. K. Gleason, Adv. Mater. 27, 4604 (2015).
[49] W. Humphrey, A. Dalke, and K. Schulten, J. Molec. Graph. 14,33 (1996).
[50] W. A. Muñoz, S. K. Singh, J. F. Franco-Gonzalez, M. Linares,X. Crispin, and I. V. Zozoulenko, Phys. Rev. B 94, 205202(2016).
[51] W. A. Muñoz, X. Crispin, M. Fahlman, and I. V. Zozoulenko,Macromolec. Rapid Commun. 39, 1700533 (2017).
[52] A. Miller and E. Abrahams, Phys. Rev. 120, 745 (1960).[53] J. Kirkpatrick, Int. J. Quantum Chem. 108, 51 (2008)[54] M. J. Frisch et al., Gaussian09 Revision E.01 (Gaussian Inc.,
Wallingford CT, 2009).[55] L. Sousa, R. Volpi, D. A. da Silva Filho, and M. Linares, Chem.
Phys. Lett. 689, 74 (2017).[56] R. C. I. MacKenzie, J. M. Frost, and J. Nelson, J. Chem. Phys.
132, 064904 (2010).[57] Z. G. Yu, D. L. Smith, A. Saxena, R. L. Martin, and A. R. Bishop,
Phys. Rev. B 63, 085202 (2001).[58] H.-S. Park, S.-J. Ko, J.-S. Park, J. Y. Kim, and H.-K. Song, Sci.
Rep. 3, 2454 (2013).[59] O. Bubnova, M. Berggren, and X. Crispin, J. Am. Chem. Soc.
134, 16456 (2012).[60] https://github.com/nicro31/LOE-CTP.[61] B. M. Savoie, K. L. Kohlstedt, N. E. Jackson, L. X. Chen, M.
O. d. l. Cruz, G. C. Schatz, T. J. Marks, and M. A. Ratner, Proc.Natl. Acad. Sci. U.S.A. 111, 10055 (2014).
[62] R. J. Kline, M. D. McGehee, E. N. Kadnikova, J. Liu, J.M. J. Fréchet, and M. F. Toney, Macromolecules 38, 3312(2005).
045605-9