Embed Size (px)
Citation preview

Understanding Mountain Poverty in the Hindu Kush-HimalayasRegional report for Afghanistan, Bangladesh, Bhutan, China, India, Myanmar, Nepal, and Pakistan


i
Kiran HunzaiJean-Yves GerlitzBrigitte Hoermann
Understanding Mountain Poverty in the Hindu Kush-HimalayasRegional report for Afghanistan, Bangladesh, Bhutan, China, India, Myanmar, Nepal, and Pakistan
International Centre for Integrated Mountain Development, Kathmandu, Nepal, November 2011

ii
Published byInternational Centre for Integrated Mountain Development GPO Box 3226, Kathmandu, Nepal
Copyright © 2011
International Centre for Integrated Mountain Development (ICIMOD)All rights reserved. Published 2011
ISBN 978 92 9115 212 4 (printed)
978 92 9115 213 1 (electronic)
LCCN 2011-312011
Photos: Cover, Kiran Hunzai; facing p1, Nabin Baral; all others, Alex Treadway
Printed and bound in Nepal by
Sewa Printing Press, Kathmandu, Nepal
Production team
A Beatrice Murray (Consultant editor)Andrea Perlis (Senior editor)Dharma R Maharjan (Layout and design)Asha Kaji Thaku (Editorial assistant)
Note
This publication may be reproduced in whole or in part and in any form for educational or non-profit purposes without special permission from the copyright holder, provided acknowledgement of the source is made. ICIMOD would appreciate receiving a copy of any publication that uses this publication as a source. No use of this publication may be made for resale or for any other commercial purpose whatsoever without prior permission in writing from ICIMOD.
The views and interpretations in this publication are those of the author(s). They are not attributable to ICIMOD and do not imply the expression of any opinion concerning the legal status of any country, territory, city or area of its authorities, or concerning the delimitation of its frontiers or boundaries, or the endorsement of any product.
This publication is available in electronic form at www.icimod.org/publications
Citation: Hunzai, K; Gerlitz, JY; Hoermann, B (2011) Understanding mountain poverty in the Hindu Kush-Himalayas: Regional report for Afghanistan, Bangladesh, Bhutan, China, India, Myanmar, Nepal, and Pakistan. Kathmandu: ICIMOD

iii
Contents
Acknowledgements vAcronyms and Abbreviations v
1 Introduction 1Poverty in the Hindu Kush-Himalayan Mountains 1Measuring Mountain Poverty 2
2 Afghanistan 7Data Source 8Poverty Trends 8Determinants of Poverty 9Distribution of Consumption Quintiles 11Contribution of Different Determinants of Poverty 11
3 Bangladesh 13Data Source 14Poverty Trends 14Determinants of Poverty 15Distribution of Consumption Quintiles in the Mountain Areas 17Contribution of Different Determinants of Poverty 17
4 Bhutan 19Data Source 20Poverty Trends 20Determinants of Poverty in Eastern Bhutan 21Distribution of Consumption Quintiles in Eastern Bhutan 22Contribution of Different Determinants of Poverty in Eastern Bhutan 23
5 China 25Data Source 26Poverty Trends 26Determinants of Poverty in the Mountains 28
6 India 31Data Source 31Poverty Trends 32Differences Within the Indian Himalayan Region 32Determinants of Poverty in Rural Uttarakhand and Rural Himalayan West Bengal 32Distribution of Consumption Quintiles in the Indian Himalayan Region 34Contribution of Different Determinants of Poverty in Rural Uttarakhand, Rural Himalayan West Bengal, and the Rest of the Rural Indian HKH region 35

iv
7 Myanmar 37Data Source 37Poverty Trends 38Determinants of Poverty 39
8 Nepal 43Data Source 44Poverty Trends in the Mountains and Hills 44Differences Within the Mountains and Hills 45Determinants of Poverty in the Mountains and Hills 45Distribution of Consumption Quintiles in the Mountains and Hills 47Contribution of Different Determinants of Poverty in the Mountains and Hills 47
9 Pakistan 49Data Source 50Poverty Trends 50Differences Within the Mountain Region 50Determinants of Poverty in the Mountains 50Distribution of Consumption Quintiles in the Mountain Areas 52Contribution of Different Determinants of Poverty in the Mountains 52
10 Regional Overview 53Distribution of Poverty in the Hindu Kush-Himalayan Region 53Mountain Specificity of Determinants of Poverty 54Contribution of Different Determinants of Poverty 55
11 Conclusion 57Mountain Poverty is Higher and More Persistent 57Causes of Poverty in Mountain Areas Differ from Those in Other Areas 57Contribution of Different Determinants of Poverty Differs Among Mountain Areas and Between the Mountains and the Plains 58In Summary 58
Bibliography 59
Annex Measurement Model Tables for Different Factors and Logistic Regression Tables for Poverty 63

v
Acknowledgements
The authors express their gratitude to the International Fund for Agricultural Development (IFAD) for its financial support and encouragement for this research and for the strategic partnership with ICIMOD. This study is an outcome of collaborative efforts and many discussions on the specificities of mountain poverty with many individuals at ICIMOD. Their support, encouragement, and insightful ideas paved the way for this research. Particular appreciation goes to Dr Michael Kollmair, Dr Dhrupad Choudhury, and Mr Daan Boom.
The authors are particularly grateful for the guidance and comments provided by Dr Hermann Kreutzmann, Chair of Human Geography at the Centre for Development Studies, Freie Universitaet Berlin; Dr RS Tolia, Chief Information Commissioner, Uttarakhand; Ms Lynn Bennet, Lead Social Scientist, The World Bank; Dr Krishna Phari, GIS Advisor, World Food Programme; Dr Bishwa Nath, Advisor for Monitoring and Evaluation, UNDP; and Mr Shib Shah, Senior Statistical Officer, Central Bureau of Statistics, Nepal.
Finally, gratitude also goes to the ICIMOD editorial and layout team under the lead of Ms Andrea Perlis and Dr A Beatrice Murray.
Acronyms and Abbreviations
BLSS Bhutan Living Standard SurveyHH householdHKH Hindu Kush-Himalayan/s ICIMOD International Centre for Integrated Mountain DevelopmentLGPR Leading Group for Poverty ReductionMPCC monthly per capita consumption PSLM Pakistan Social and Living Standards Measurement SurveyUNDP United Nations Development Programme YPCC yearly per capita consumption

vi

1
1 Introduction
Poverty in the Hindu Kush-Himalayan Mountains
The Hindu Kush-Himalayan (HKH) region extends across parts of eight countries: Afghanistan, Bangladesh, Bhutan, China, India, Myanmar, Nepal, and Pakistan. The mountain people of this region often belong to indigenous groups, remain at the periphery of socioeconomic and geopolitical opportunities, and live at the margins of society. It is believed that even if the Millennium Development Goal of halving poverty by 2015 is largely achieved at the national level in these countries, poverty will still be prevalent among people living in the remote and unfavourable mountain areas.
Mountain areas are characterised by so-called ‘mountain specificities’: inaccessibility, fragility, marginality, diversity, biological niches, and human adaptation mechanisms (Jodha 1992,1995). These result from a combination of spatial characteristics such as remoteness, coupled with weak and fragile agricultural ecosystems (Farrington and Gill 2002). A significant proportion of mountain people live in difficult terrain, far from the centres of commerce and power, and exert little influence over the policies and decisions that influence and shape their lives (Khalid and Kaushik 2008).
An in-depth analysis of mountains and their inhabitants by the Food and Agriculture Organization of the United Nations (FAO) (Huddleston et al. 2003) provides a comprehensive look at the environmental conditions, land use patterns, and farming systems of six classes of mountain areas. According to the study, up to 88% of mountain people in developing countries are rural poor whose livelihoods are mainly dependent on agriculture and livestock. The increase in population is putting stress on the limited resources on which mountain farmers depend and contributing to growing food insecurity, while placing mountain ecosystems under increased environmental pressure.
Mountain people are increasingly exposed to growing physical, social, and economic risks and vulnerabilities. In the face of such a complex set of mountain poverty characteristics, it is no surprise that sustainable development in these areas has often been a challenge and not produced desirable outcomes. In retrospect, this can be explained partly by mistargeted development policies and programmes that were not created specifically for the mountain context. Furthermore, interventions have tended to be directed to areas of high potential and the ‘easy to reach’ poor, with the assumption that this would create so-called growth poles and generate positive spill-over effects and multipliers to draw in and benefit people living in more remote areas (Bird et al. 2002). This approach has failed to achieve homogenous development, with people residing in remote mountain areas falling behind. Without specific programmes targeted to counter the disadvantages and to build on the opportunities of mountainous areas, regional inequality in many countries has grown rather than declined.
Research suggests that development interventions that do not take mountain specificities into account may threaten rather than facilitate development for the inhabitants in a sustainable mountain environment (Farrington and Gill 2002). There is now a sense of urgency associated with growing population pressure and lack of growth in economic sectors, which collectively accelerate the depletion of natural resources with potentially grave environmental and socioeconomic consequences. Increasing socioeconomic inequalities can also strain the fragile upstream-downstream linkages and structural conflict, which could further destabilise the situation for mountain inhabitants. This could have severe effects because the inhabitants in these areas are already at a greater risk of poverty, and remain so for longer periods of time. It is important to explore the nature of poverty in mountain areas and how it differs from that in non-mountain areas of the same country in order to provide a relevant alternative for generalised national and regional poverty estimates. Thus, there is an urgent need to define, analyse, and understand mountain poverty so that relevant and effective development policies and programmes can be designed that address the specific needs and capacities of mountain people.

Understanding Mountain Poverty in the Hindu Kush-Himalayas
2
Measuring Mountain Poverty
The World Bank (2000) defines poverty as “pronounced deprivation in wellbeing”. Conventionally, wellbeing is described as command over commodities and is measured in monetary terms in the form of income or consumption. In this sense, those who are not able to afford a certain standard of living are considered to be poor. Poverty can be described in terms of ‘relative poverty’, i.e., having fewer goods than others within a society, and ‘absolute poverty’, i.e., being unable to afford basic human needs like nutrition. Although the concept of relative poverty is more commonly used to measure poverty in developed countries, the concept of absolute poverty was chosen for this analysis as a significant proportion of people in Afghanistan, Bangladesh, Bhutan, India, Nepal, and Pakistan are unable to afford basic human necessities.
Human development is multi-faceted. It is generally considered that a combination of monetary and non-monetary indicators that reflect the specific dimensions of mountain poverty are needed to measure and monitor poverty in mountain areas. These indicators can also be used to explore the characteristics of this poverty. Poverty measures such as the Human Development Index (HDI), Human Poverty Index (HPI), and the recent Multidimensional Poverty Index (MPI) have succeeded in defining poverty as a multidimensional phenomenon. However, as a result of the lack of available comparable data across countries, these new approaches do not take into account the geographic implications of different indicators and do not incorporate the specific factors that contribute to mountain poverty, such as inaccessibility, social status, and lack of access to basic facilities. Thus the existing indicators do not fully reflect the realities within the mountain system.
Most national household survey data show significant regional disparities in the incidence of poverty, with greater proportions of poor households living in remote, less-favoured, weakly integrated, or conflict-affected areas. Poverty alleviation programmes often use aggregated poverty rates to identify and target the poor in developing countries. Following a new conceptualisation of poverty by the World Bank, Prennushi (1999) stated that the expression or experience of wellbeing is context and situation dependent, reflecting local physical, social, and personal factors such as geography, environment, and culture. Aggregate estimations of poverty at the national level do not provide an in-depth account of the distribution of the poor across geographical areas, or of the determinants of poverty for these areas. Hence, the processes of impoverishment need to be disaggregated to show specific differences as well as those linked to particular ecological conditions (Forsyth et al. 1998).
In this report, the determinants of economic poverty in mountain areas are analysed using nationally representative livelihood data at the household level. Economic poverty has a central position, because it is perceived to be at the very core of the poverty definition: the inability to fulfil basic needs. Other poverty dimensions, for example a lack of basic facilities and lack of education, are included in the form of predictors of economic poverty, together with other socioeconomic indicators. This approach makes it possible to analyse the relationship between, and impact of, different forms of poverty on the lack of economic resources. The overall aim of the poverty analysis was to identify, understand, and substantiate the specificity of mountain poverty. The framework highlights particular aspects of the causes of poverty in mountains and how they differ from those in the plains. The specific aim of this analysis was to explore the following questions:
Is there strong evidence of mountain specific poverty? How does poverty in mountain areas differ from that in other geographical areas? How do the causes of poverty differ according to geographical area? Are the triggers of mountain poverty more intense than those in the rest of the same country? Are there disparities, or different triggers of poverty, within the mountain system? Can we identify regional characteristics for mountain specific poverty across the Hindu Kush-Himalayas?
Analytical research framework
An analytical mountain research framework was created to analyse the causes of poverty in mountain areas and to identify indicators for these causes. The framework seeks to identify the general predictors of poverty and combines these with the special socioeconomic and infrastructural conditions that exist in mountain areas in order to explain the different elements of poverty in mountain and non-mountain areas of a country.

1 Introduction
3
Two broad dimensions, ’infrastructure’ and ‘household characteristics’, were identified. These were divided into sub-dimensions and measured using the indicators shown in the Box above. Indicators were selected to explain overall poverty and to identify the mountain specific determinants of poverty. For example, indicators such as accessibility and access to basic facilities were selected based on their relevance in the mountain context. Hence, this research framework explores both the existing determinants of poverty within a country and the mountain specificities. As the aim of the research was to prepare a comparative regional overview of the determinants of poverty in the Hindu Kush-Himalayan region, it was essential to use indicators from international standardised surveys.
The framework was tested through comparative analysis using national representative livelihood data for Afghanistan, Bangladesh, Bhutan, India, Nepal, and Pakistan, disaggregated at the regional level. In all six countries, data were used, where possible, to identify differences in poverty between different regions of the country, to identify differences within the mountain regions of the same country, and to explore the contribution of different determinants of poverty within the mountain areas. The findings are empirically significant for mountain specific policy advocacy and development planning. They can help policy makers to design targeted policies more effectively by taking into account aspects of poverty in the individual countries and drawing on the similarities and disparities that exist among them.
Methodology
In this study, poverty was measured by total per capita consumption. Based on the underlying assumption that there is a basket of basic goods, a person is defined as poor if their spending is lower than the amount of money necessary to purchase these goods. Differentiation between food and non-food items was considered in some countries where relevant data were available.
The methodology used to construct poverty lines for all six countries was the cost of basic needs (CBN) approach. This method provides a pragmatic way of incorporating basic food and non-food consumption requirements into the poverty line and is set by the statistical bureaus of each country. For food, the process involves selecting a minimum nutritional calorie intake requirement; choosing a food basket that consists of grains and cereals, pulses and lentils, eggs and milk products, cooking oil, vegetables, fruit, fish and meat, salt, and tea; scaling the quantities in the food basket to correspond to the calorie requirements of individuals; and calculating the cost of the basket to develop a
Analytical mountain research framework within the context of the overall causes and effects of poverty
Household Characteristics
Assets and liabilities Area of land owned Land fragmentation Number of livestock Loans obtained
Household composition Female head of household Dependency rate Percentage of household members in non-agricultural profession
Socioeconomic status Ethnicity Education of head of household Percentage of literate household members >5 years old
Infrastructure
Access to basic facilities Availability of improved source of drinking water Availability of electricity Availability of toilet facilities
Accessibility Distance to next paved road Distance to next market centre Distance to next bus stop Distance to next bank Distance to next cooperative

Understanding Mountain Poverty in the Hindu Kush-Himalayas
4
food poverty line (when spending is insufficient to purchase basic food items). The food poverty lines constructed in this study are based on the value of everything consumed, rather than direct expenditure, and include consumption of home produce. A non-food poverty line (when spending is insufficient to purchase basic non-food items) was constructed by estimating the cost of purchasing a basic set of non-food items for households, including housing expenses, fuel, clothing, and personal care items; accessing a range of services like education, medical services, and public transport; and acquiring household appliances and other durable goods. Finally, a total poverty line was constructed by aggregating the food and non-food poverty lines. This differentiation allowed us to analyse not only total poverty, but also food poverty and non-food poverty.
In order to identify the causes of overall poverty within a country, multivariate regression models were used to analyse the per capita food, non-food, and total consumption, as well as the corresponding probability of falling below these poverty lines. In the case of accessibility and lack of basic facilities, indicators were combined into a single index, extracted by factor analysis. Descriptive statistics helped to understand how poverty determinants in the mountain areas differ in relation to those in the rest of the country.
The framework was tested for Afghanistan, Bangladesh, Bhutan, India, Nepal, and Pakistan to provide a comparative analysis. The pilot studies for these six countries integrated additional indicators such as inaccessibility, access to basic facilities, and the dependency rate – indicators that are missing in most poverty measures.
Challenges and limitations of the study
The collection and organisation of relevant datasets for the six countries proved to be an extensive process due to delays in receiving the appropriate datasets. Nevertheless, national living standards surveys were obtained for Bangladesh, Bhutan, Nepal, and Pakistan which to a great extent allowed direct comparison. For India, socioeconomic surveys carried out by the National Sample Survey Organization (2002 and 2003) were used, and
Figure 1: The Hindu Kush-Himalayan region and study area
!
!
!
!!!
!
!
!
!
!!
!!
!!
!!
!
!
!!
!
Xinjiang
Xizang
Qinghai
Sichuan
Gansu
Yunnan
Indu
sMekong
Yangtze
Salween
Ganges
Huang He
Amu Darya
Irraw
addy
Brahmaputra
Tarim
Tarim
Tarim
Haka
SimlaQuetta
Xining
Aizawl
BasseinRangoon
Karachi Kunming
ThimphuPokhara
Chengdu
Taunggyi
Shillong
Peshawar Srinagar
New Delhi
Myitkyina
KathmanduNepalganj
Islamabad
Chaghcharan
±
0 500 1,000 1,500250
Kilometres
I N D I A
C H I N A
NEPALBHUTAN
Bay of Bengal
PAKISTAN
AFGHANISTAN
MYANMARArabian Sea
BANGLADESH
Legend
HKH region boundaryMajor river
HKH study area (Based on ICIMOD Analysis)HKH study area (Based on Secondary Analysis)

2 Afghanistan
5
for Afghanistan data collected for the National Risk and Vulnerability Assessment (NRVA) 2007/08. Adjustments were carried out for comparative analysis across all countries to account for differences in sample design and survey methods.
To make the report comprehensive and cover all eight regional countries (Figure 1), China and Myanmar were included using available secondary data.
Official poverty lines exist for all countries except India, which is in the process of revising its poverty lines. For India, it was not possible to rely on government food and non-food poverty lines; instead, the analysis used the internationally accepted poverty line of 1 USD a day as a base.
In Nepal, it was possible to look at trends using the Nepal Living Standards Surveys (NLSS) from the years 1995/96 and 2003/04. It was not possible to carry out a trend analysis for the other countries studied either due to the lack of comparative data or because of the different measurement concepts.
Most of the findings of this study were statistically significant and the regression models are robust. The detailed statistical tables are shown in the Annex. However, as in any empirical analysis, the findings depend on the quality and the range of indicators included in the available datasets; additional conclusions could be drawn if an extended set of indicators was used to explain mountain poverty. Indicators were selected based on their relevance in explaining overall poverty; specific additional indicators were included based on their relevance in the mountain context. The selection of indicators was limited, however, by the availability of data from international standardised surveys for the six countries.

Understanding Mountain Poverty in the Hindu Kush-Himalayas
6

2 Afghanistan
7
2 Afghanistan
Poverty in Afghanistan is multidimensional, involving a complex interplay between asset deficits (physical, financial, and human), years of insecurity and drought, indebtedness, poor infrastructure and public services, traditional roles, and lack of economic opportunities. The state of poverty in Afghanistan characterises and constrains the lives of a large proportion of the Afghan people, reflecting the socioeconomic and political dynamics (UNDP 2008a).
Throughout its history, Afghanistan has been affected by political and economic upheaval, and natural disasters. Following a succession of authoritarian regimes and the collapse of several government institutions and their substitution with rule by force over the past quarter of a century, it is of little surprise that Afghanistan is one of the poorest nations in the world. In addition, almost three decades of conflict have exacerbated poverty and impeded efforts aimed at its reduction, while leaving much of Afghanistan’s human, physical, and institutional infrastructure devastated. As a result, poverty in Afghanistan is widespread throughout the country. According to a recent Oxfam study, armed conflict has impacted the lives of almost all Afghans, 96% of the population (Oxfam International 2009). This includes deaths, injuries, disability, and destruction of homes, assets, and livelihoods.
Agriculture is traditionally the major activity for a large portion of the population, more than 84% at present. However, the sector has suffered from years of conflict, low investment, and natural disasters; moreover, a basic lack of resources affects those who depend on agriculture for their livelihood. There is little arable land per capita, precipitation is scarce, and climatic conditions are difficult in many parts of the country. Since 1999, regular droughts have severely affected the livelihoods of rural households. The harsh climatic and geographical conditions
Farah
Herat
NimruzHelmand
Ghowr
Quandahar
Oruzgan
Zabol
BadakhshanFaryab Jowzjan
Badghis
Ghazni
Paktika
Bamian
BalkhTakhar
Baghlan
Samangan
Paktia
Konarha
Vardak
Konduz
Kapisa
Kabol
Parvan
NangarharLowgar
Laghman
±
0 250 500125
Kilometres
T U R K M E N I S T A N
P A K I S T A N
I R A N
Location map
HKHAfghanistan
U Z B E K I S T A N T A J I K I S TA N
CHINA
HKH study focus area
LegendHKH study area
Boundaries are for guidance only and do not imply any opinion concerning the legal status of any country or territory or the delimitation of its frontiers or boundaries.
Administrative map of Afghanistan
Country Profile
Afghanistan is a landlocked and mountainous country in central Asia, with plains in the north and southwest. It is bordered by Pakistan to the south and east, Iran to the south and west, Turkmenistan, Uzbekistan, and Tajikistan to the north, and China to the far northeast. The population in 2009 was 29.8 million. Afghanistan was ranked 155 out of 169 countries in the Human Development Index (HDI) in 2010 and is thus the 14th poorest country in the world (UNDP 2010a).
Total population 2009* 29.8 millionPopulation living in poverty** 9.8 millionLife expectancy at birth* 44 yearsYouth (15–24 years) literacy rate*** male 49%; female 18%
Source: *World Bank 2009; **ICIMOD analysis based on data from NRVA 2007/08 datasets; ***UNICEF 2009
Understanding Mountain Poverty in the Hindu Kush-Himalayas
8
combined with the long years of conflict and followed by rapid population growth have led to uncontrolled and unsustainable use of natural resources. The lack of employment opportunities, non-existent market linkages, lack of access to financing and technology options, and weak framework for enabling the private sector are major barriers to promoting the private sector and hence job creation. Many rural households are poor because they have incurred heavy debts, live in remote and disadvantaged areas, and/or have lost the male head of household (UNDP 2008a).
Afghanistan has one of the lowest life expectancy rates in the world (44 years). The literacy rate is 43% for men and 13% for women. Unemployment and factors such as corruption, security, and shortage of skilled workers constrain development and the conduct of business (IMF 2009).
The estimated 1.5 million Kuchis are nomadic herders whose livelihood depends heavily on livestock and migration patterns. Some 15% of Kuchi families have been forced to settle in recent years because they have lost their livestock and migration routes as a result of conflict and insecurity. They are now among the poorest households in Afghanistan.
Data Source
The analysis is based on data collected by the Central Statistics Organisation of Afghanistan for the National Risk and Vulnerability Assessment (NRVA) 2007/08. The nationwide representative survey covered 20,577 households and included information about the socioeconomic characteristics of each household member, agriculture and livestock, and household expenditure.
The information on infrastructure and access to services and facilities was based on the Community Survey 2007/08 which covered 2,522 communities.
Poverty Trends
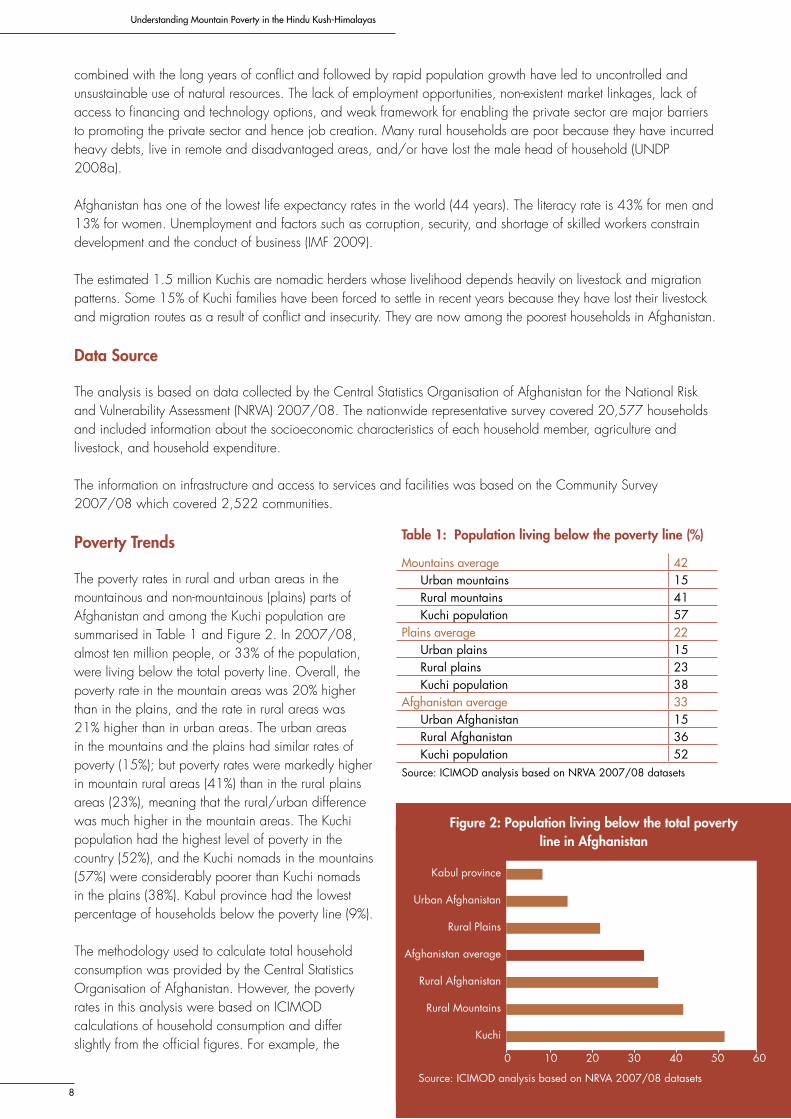
The poverty rates in rural and urban areas in the mountainous and non-mountainous (plains) parts of Afghanistan and among the Kuchi population are summarised in Table 1 and Figure 2. In 2007/08, almost ten million people, or 33% of the population, were living below the total poverty line. Overall, the poverty rate in the mountain areas was 20% higher than in the plains, and the rate in rural areas was 21% higher than in urban areas. The urban areas in the mountains and the plains had similar rates of poverty (15%); but poverty rates were markedly higher in mountain rural areas (41%) than in the rural plains areas (23%), meaning that the rural/urban difference was much higher in the mountain areas. The Kuchi population had the highest level of poverty in the country (52%), and the Kuchi nomads in the mountains (57%) were considerably poorer than Kuchi nomads in the plains (38%). Kabul province had the lowest percentage of households below the poverty line (9%).
The methodology used to calculate total household consumption was provided by the Central Statistics Organisation of Afghanistan. However, the poverty rates in this analysis were based on ICIMOD calculations of household consumption and differ slightly from the official figures. For example, the
Table 1: Population living below the poverty line (%)
Mountains average 42Urban mountains 15Rural mountains 41Kuchi population 57
Plains average 22Urban plains 15Rural plains 23Kuchi population 38
Afghanistan average 33Urban Afghanistan 15Rural Afghanistan 36Kuchi population 52
Source: ICIMOD analysis based on NRVA 2007/08 datasets
0 10 20 30 40 50 60
Kuchi
Rural Mountains
Rural Afghanistan
Afghanistan average
Rural Plains
Urban Afghanistan
Kabul province
Figure 2: Population living below the total poverty line in Afghanistan
Source: ICIMOD analysis based on NRVA 2007/08 datasets

2 Afghanistan
9
official estimate of the poverty rate for the whole of Afghanistan is 36% compared to the ICIMOD estimate of 33%. The difference in estimates was mainly caused by a difference in estimation of poverty in urban areas; while the Central Statistics Organisation of Afghanistan finds an urban poverty of 29%, our own estimate was 15%. Presumably different criteria were used in making the estimates, but no information was available on the detailed estimates made by the Central Statistics Organisation of Afghanistan. Our estimate for rural areas matched the official figure of 36%, while our estimate for the poverty rate of the Kuchi (52%) was slightly lower than the official estimated of 54%.
Differences within the mountain region
Figure 3 shows the poverty rates in different parts of the mountain area. The central (16%), southwest (20%) and northern (38%) regions were comparatively better off than the total mountain average (42%); the northeast and south regions (44%) were close to the average; and the east (50%), west (51%), and west-central (61%) regions had significantly higher populations below the poverty line.
Determinants of Poverty
The distribution of the determinants of poverty in the different regions was analysed to help understand which components contribute most to the rates of poverty in the two regions. The results are summarised in Table 2. They show that unlike in other countries in the region, poverty determinants overall were evenly distributed between the mountain and plains areas. This is probably the result of the thirty years of conflict which has affected the entire country with the same intensity. The individual components are discussed in the following.
Access to basic facilities
Access to basic facilities consisted of three indicators: population with improved source of drinking water; population with toilet facilities; and population with access to electricity. Access to these basic facilities had a strong positive effect on wellbeing; lack of access explained 3% of the probability of falling below the poverty line (see Annex).
There was no significant difference between the mountain and plains regions in access to improved sources of drinking water (1.4% less in the mountains) and only a small difference in access to electricity (4.8% less in the plains), but almost 20% less households in mountain areas had toilet facilities than in the plains.
Accessibility
A combination of sub-indicators was combined in a single factor which measures the latent concept of accessibility. Accessibility had a strong impact on poverty and explained 2% of the probability of falling below the poverty line. It was found that almost all factors of accessibility were more prevalent in the mountain areas compared to the plains.
Assets and liabilities
A poorer situation for agricultural assets and liabilities explained 2% of the probability of falling below the poverty line. More land and number of livestock owned per capita reduced the poverty risk; whereas obtaining a loan had a negative effect on poverty. According to the findings, one hectare per head more land decreased the total poverty
0 10 20 30 40 50 60 70
West-central
West
East
South
Northeast
Mountain average
North
Southwest
Central
Figure 3: Poverty rates within the mountain region of Afghanistan
Source: ICIMOD analysis based on NRVA 2007/08 datasets

Understanding Mountain Poverty in the Hindu Kush-Himalayas
10
Table 2: Determinants of poverty in the mountains and plains of Afghanistan
Mountains Plains
Individual poverty indicators
Population under the total poverty line (%) 42.4 22.5
Access to basic facilities
Population with improved source of drinking water (%) 14.5 15.9
Population with toilet facilities (%) 66.9 86.5
Population with electricity (%) 36.8 32.0
Basic facility factor (mean) -0.09 -0.04
Accessibility
Distance to nearest drivable road in km (mean) 4.0 3.9
Time to get to nearest permanent food market >1h (%) 43.7 38.7
Time to get to nearest health service provider >1h (%) 33.2 21.7
Distance to nearest school in km (mean) 5.1 8.0
Accessibility factor (mean) -0.29 -0.13
Assets and liabilities
Owned land in ha per head (mean) 0.13 0.17
Livestock per head (mean) 1.9 2.0
Loans obtained (%) 62.2 55.3
Household composition
HH with female head (%) 1.3 1.1
Dependency rate (mean) 1.36 1.42
Percentage of HH members in non-agricultural professions (mean) 26.3 26.8
Social status
Kuchi/nomads (%) 6.6 5.9
Uneducated head of HH (%) 74.9 80.7
Head of HH with primary education (%) 9.9 9.7
Head of HH with secondary education (%) 5.7 3.8
Head of HH with higher education (%) 9.5 5.7
Percentage of literate HH members >5 years (mean) 26.7 19.9Note: The region where the poverty indicator was stronger is highlighted in each rowSource: ICIMOD analysis based on NRVA 2007/08 datasets
risk by 5%, and a one unit increase in livestock per head decreased the poverty risk by 1%. Households who had obtained loans had a 9% higher probability of being below the poverty line than households without loans.
On average, households in the mountain areas of Afghanistan owned less land and had taken out more loans per head than those living in the plains, whereas livestock ownership was similar. This is likely to be in part a result of the widespread and protracted drought which has affected the lives and livelihoods of the mountain poor, with negative outcomes including reduced production, lost income, lost assets, and unemployment, and hence increased debt. The increase in debt burden has led to loss of land through mortgage forfeiture and sale. The impact of repeated shocks has contributed to asset depletion of the poorer households, leaving them with fewer land assets, thus pushing them to derive a higher proportion of their diminished income from diversified non-farm sources.
Household composition
The three indicators for household composition explained 1% of the probability of falling below the poverty line. The dependency rate had a negative influence on wellbeing; the higher rate increased the probability of falling below the poverty line by 4%. There was a 5% lower probability for a household to be below the poverty line when all working members were employed in non-agricultural occupations.

2 Afghanistan
11
In contrast to the other countries studied, having a female household head had no significant effect on wellbeing; equally, the number of female-headed households was very low. There were no significant differences between the mountains and the plains in two of the indicators (population of female headed households and percentage of household members in non-agriculture professions), but the households in the plains had statistically significant higher dependency rates compared to the mountains.
Social Status
Social status consisted of six indicators. Social status explained 1% of the probability of falling below the poverty line. The probability of falling below the poverty line was 16% higher for Kuchi people than for the rest of the population; a household with a head who had received higher education was 9% less likely to fall below the poverty line, and one with secondary education 3% less likely to fall below the poverty line, than a household with a head with no education. The percentage of literate household members five years old and above had no significant effect on the probability of being below the poverty line. Interestingly, the mountain areas were overall better off in terms of social status than the plains.
Distribution of Consumption Quintiles
Table 3 shows the distribution of national per capita consumption quintiles in the mountain area in 2007/08, excluding Kabul province. By definition, the percentage of the population in each quintile is the same over the country as a whole (20%); any variation in this distribution within a particular area indicates a difference in the distribution of wealth groups within that area compared to the whole country. The poorest and second poorest groups (1st and 2nd quintiles) were overrepresented in the mountain region, whereas the two wealthiest consumption groups were underrepresented.
Contribution of Different Determinants of Poverty
The previous section focused on identifying the poverty determinants that are specific to the mountain and plains in Afghanistan. This section considers the comparative impact of the different determinants on the overall poverty rate. Figure 4 shows the proportional impact of the different determinants of poverty in the mountain region. Household composition had the highest impact (48%), followed by assets and liabilities (28%), access to basic facilities (13%), and accessibility (8%); social status had the least impact (3%). Although these determinants are not specific to this region; the different level of impact of the determinants and their significance need to be addressed to help development interventions in the mountain areas of Afghanistan to be effective.
Table 3: Monthly per capita consumption (MPPC) quintiles living in the mountains of AfghanistanMPCC quintile Per capita
consumption (AFN)aPopulation in the mountains (%)
1st <1,142 26.9
2nd 1,142 to 1,464 23.4
3rd 1,464 to 1,811 20.2
4th 1,811 to 2,355 16.3
5th >2,355 13.2
Total 100.0a Exchange rate in 2010: 43 AFN (Afghan Afghani) = 1 USD Source: ICIMOD analysis based on NRVA 2007/08 datasets
InaccessibilityLack of access to basic facilities
Social status
HH compositionAssets and liabilities
Source: ICIMOD analysis based on NRVA 2007/08 datasets
Figure 4: Contribution of different determinants to poverty in the mountain areas of Afghanistan (%)
Understanding Mountain Poverty in the Hindu Kush-Himalayas
12

3 Bangladesh
13
3 Bangladesh
Bangladesh is one of the poorest and most densely populated countries in the world. Since its independence in 1971, Bangladesh has made important progress in the fight against poverty. However, despite specific areas of progress, aggregate poverty rates in the country remain strikingly high. Bangladesh’s many development challenges include poor quality health and education services, weak public sector institutions, and environmental difficulties due to frequent floods and increasing population density.
The economy of Bangladesh depends primarily on agriculture. Approximately 77% of the total population and more than 85% of the poor in Bangladesh live in rural areas and are directly or indirectly engaged in a wide range of agricultural activities. On average, per capita income in rural areas is around 40% lower than the national average (World Bank 2006). The rural population has a literacy rate lower than the national average and has less access to education. This is a result of the limited income of the parents, poor access to schools, non-availability of teachers, and the extensive involvement of children in household and income generating activities in rural areas (World Bank 2006).
Bangladesh is also widely recognised as one of the countries most vulnerable to climate change. Natural disasters such as cyclones and severe flooding occur with regular frequency causing damage, disease, and loss of food crops. Natural hazards due to increased rainfall, rising sea levels, and tropical cyclones are expected to increase in intensity and frequency in the coming years, further affecting agriculture, water and food security, human health, and shelter.
Country Profile
With a population of 162 million people, Bangladesh is the eighth most densely populated country in the world; it was ranked 129 out of 169 countries in the Human Development Index (HDI) in 2010 (UNDP 2010a).
Bangladesh is bordered to the west, north, and east by India and to the southeast by Myanmar. The physical geography is varied and characterised by two distinctive features: a broad deltaic plain subject to frequent flooding, and a small hilly region in the southeast – the Chittagong Hill Tracts. The only other exceptions to Bangladesh’s low elevations are the low hills of Sylhet in the northeast, and highland areas in the north and northwest. The Chittagong hills constitute the only significant hill system in the country.
Total population in 2009* 162 millionPopulation living below the poverty line** 60 millionLife expectancy at birth in 2009* 67 yearsAdult literacy rate in 2009* 56%
Source: *World Bank 2009; **ICIMOD analysis based on HIES 2005/06 datasets
RANGAMATI
SYLHET
TANGAIL
BOGRA
PABNA
COMILLA
DINAJPUR
NAOGAON
MYMENSINGH
SUNAMGANJ
JESSORE
RAJSHAHINATORE
RANGPUR
FENI
FARIDPUR
GAZIPUR
JAMALPUR
KUSHTIA
RAJBARI
BANDARBAN
KHULNA
NOAKHALI
CHITTAGONG
HABIGANJ
B.BARIA
SATKHIRA
NETRAKONA
SIRAJGONJ
DHAKA
KURIGRAM
KHAGRACHARI
BAGERHAT
MAULVIBAZAR
BHOLA
GAIBANDHA
KISHOREGANJ
JHENAIDAH
CHANDPUR
LAXMIPUR
COX'S BAZAR
NARAIL
SHERPUR
NILPHAMARI
NAWABGANJ
THAKURGAON
GOPALGANJ
MANIKGANJ
MAGURA
NARSINGDI
MADARIPUR
CHUADANGA
SHARIATPUR
JOYPURHAT
MUNSHIGANJ
MEHERPUR
PATUAKHALI
BARGUNA
NARAYANGANJ
PIROJPUR
JHALKATI
±
0 75 15037.5
Kilometres
MYANMAR
I N D I A
I N D I A
Bay of Bengal
Location map
Legend
HKH study focus area
HKH study area
HKH
Myanmar
I N D I A
Administrative map of Bangladesh
Boundaries are for guidance only and do not imply any opinion concerning the legal status of any country or territory or the delimitation of its frontiers or boundaries.

Understanding Mountain Poverty in the Hindu Kush-Himalayas
14
Population pressure and underemployment are challenges increasingly faced by the government, especially with the growing number of landless rural people, who already account for about half of the rural labour force.
As a result of such challenges, pockets of extreme poverty are persistent and inequality is a rising concern. Poverty is also characterised by long-standing and deeply entrenched social inequalities.
Data Source
The analysis is based on data collected by the Bangladesh Bureau of Statistics (BBS) for the Household Income and Expenditure Survey (HIES) 2005/06. The nationwide representative survey covered 10,080 households and included information about the socioeconomic characteristics of each household member, agriculture and livestock, and household expenditure.
The information on infrastructure and access to services and facilities was based on the Community Survey 2005/06, which was conducted alongside the HIES in 2005/06. However, it was not possible to obtain the community level data from the Bangladesh Bureau of Statistics. Therefore the analysis does not include the effect of accessibility on poverty in the country.
Poverty Trends
The Chittagong Hill Tracts is a hill area in southeastern Bangladesh. Over 80% of rural households in this area are involved in agriculture, mainly for subsistence; this is mainly field-based agriculture on flat and mildly sloping land and shifting cultivation on steeper land. Only a small number of households have a secondary income, land is thus a critical resource. However, 40% of families do not own their homestead land and of those who do own land, only 35% own cultivatable cereal land. As a result of high dependency on agricultural activities in these areas coupled with limited land ownership and exposure to natural disasters, food insecurity is widespread and of growing concern.
The poverty rates in rural and urban areas in the mountain and plains of Bangladesh are summarised in Table 4. In 2005/06, approximately 59 million people, or 37% of the population, were living below the total poverty line. Overall, the poverty rate in the mountain areas was 9% higher than in the plains, and the rate in rural areas was 14% higher than in urban areas. The urban areas in the mountains and the plains had similar rates of poverty; but poverty rates were markedly higher in mountain rural areas (58%), the poorest part of the country, than in the rural plains areas (41%).
The methodology used to calculate the total household consumption was provided by the Bangladesh Bureau of Statistics. However, the poverty rates in the analysis were based on ICIMOD calculations of household consumption and differ slightly from the official figures (e.g., ICIMOD estimate for overall poverty rate in Bangladesh was 37%, whereas the Bangladesh Bureau of Statistics estimate was 40%).
Food and non-food poverty
Food and non-food poverty was analysed separately. The food basket for Bangladesh included cereals and pulses, dairy products, fish, meat, fruit, vegetables, cooking oil, spices, tea, and coffee. The percentage of different groups living in food poverty is shown in Figure 5. Overall, two-thirds of the population in the country as a whole, and in both mountain and plains areas, were unable to afford sufficient food. Food poverty in rural areas was higher (71%)
Table 4: Population living below the poverty line (%)
Mountains average 46
Urban mountains 28
Rural mountains 58
Plains average 37
Urban plains 27
Rural plains 41
Bangladesh average 37
Urban Bangladesh 27
Rural Bangladesh 41Source: ICIMOD analysis based on HIES 2005/06 datasets

3 Bangladesh
15
than in urban areas (54%), highest of all in the rural mountains (80%), and lowest in the urban mountains (54%).
The non-food basket for Bangladesh included housing expenses, clothing and personal care items, and a range of services like educational services, medical services, and public transport. Figure 6 shows the percentage of different groups living in non-food poverty. The low non-food poverty rate suggests a very conservative estimate for the value of the non-food basket. Overall 5% of the population was unable to purchase basic non-food items and services, with rural areas (4%) slightly better off than urban areas (7%), and mountain areas worse off (9%) than plains areas (5%). The highest rates were in urban mountain areas and the lowest in rural plains areas.
Determinants of Poverty
The distribution of the determinants of poverty in the mountains and plains was analysed to help understand which components contribute most to the rates of poverty in the two regions and why the mountainous areas are poorer than the plains. The results are summarised in Table 5. They show that most poverty determinants were higher in the mountain regions. The individual components are discussed in the following.
Access to basic facilities
Access to basic facilities consisted of three indicators: population with improved source of drinking water; with improved toilet facilities; and with access to electricity. Access to basic facilities had a strong impact on poverty. One unit increase on the index decreased the probability of falling below the poverty line by 17%. The population in the mountain areas had less access to improved toilet facilities and electricity compared to the plains. Sanitation systems are poor and about 80% of the households in the mountain areas use open latrines or open spaces. The supply of services such as electricity varies with socioeconomic status and remains a privilege for those who can afford to pay. However, even where electricity is available, multiple daily blackouts interrupt businesses, factories, and households alike (World Bank 2006).
Households in the mountain areas had better access to improved sources of drinking water. It is believed that the widespread arsenic contamination of groundwater has effectively lowered the availability of safe drinking water in the plains, which is compounded by various adverse sanitation issues increased by high population. In the mountain areas, improved sources of drinking water are less affected by contamination (UNICEF 2007).
Assets and liabilities
Land area per head had a strong correlation with movement on the poverty line. It was found that an additional hectare of land per head decreased the risk of falling below the poverty line by as much as 41%. Unfortunately, land ownership, land availability for agriculture, and the quality of land per capita is in decline, largely as a result of the growing population but also because of unequal land inheritance patterns in Bangladesh as a whole (Knudsen and
0 1 2 3 4 5 6 7 8 9 10
Urban mountains
Mountains average
Rural mountains
Urban plains
Bangladesh average
Plains average
Rural plains
Figure 6: Population below the non-food poverty line (%)
Source: ICIMOD analysis based on HIES 2005/06 datasets
0 10 20 30 40 50 60 70 80
Rural mountains
Rural plains
Mountains average
Bangladesh average
Plains average
Urban plains
Urban mountains
Figure 5: Population living below the food poverty line (%)
Source: ICIMOD analysis based on HIES 2005/06 datasets

Understanding Mountain Poverty in the Hindu Kush-Himalayas
16
Khan 2002). Landholding is an overall concern in the country and there were no significant differences between the mountains and the plains.
Household composition
The three indicators for household composition were number of female-headed households, dependency rate, and the percentage of household members in non-agricultural professions.
Overall, households headed by women had an 18% lower probability of falling below the poverty line. There were fewer female-headed households in the mountains than in the plains, in line with the higher rates of poverty. Female-headed households are believed to have better access to opportunities than their male counterparts as many development agencies and microfinance activities focus more on this segment of society building their resilience. Furthermore, female-headed households are more likely to receive remittances; 15% of female-headed households depend on remittances as their primary income earning strategy, hence reducing their risk of falling below the poverty line (Haque 2005).
Households in the mountain districts also had a higher dependency rate and fewer working members involved in the non-agricultural sector. The higher number of dependents in these areas can be attributed to social and cultural pressures. Having more household members depending on resources accumulated only through agriculture increases the probability of falling below the poverty line.
Table 5: Determinants of poverty in Bangladesh
Mountains Plains
Individual poverty indicators
Population under the total poverty line (%) 45.8 36.6
Population under the food poverty line (%) 67.7 65.9
Population under the non-food poverty line (%) 8.6 5.0
Access to basic facilities
Population with improved source of drinking water (%) 15.1 7.4
Population with improved toilet facilities (%) 20.4 30.5
Population with electricity (%) 28.7 45.0
Basic facility factor (mean) 0.18 0.03
Assets and liabilities
Owned land in ha per head (mean) 0.07 0.06
Value of livestock per head (mean) 1.30 1.68
Household composition
HH with female head (%) 7.9 10.5
Dependency rate (mean) 0.87 0.83
Percentage of HH members in non-agricultural professions (mean) 19.5 31.6
Social status
Uneducated head of HH (%) 61.6 54.1
Head of HH with primary education (%) 26.1 24.8
Head of HH with secondary education (%) 10.0 15.6
Head of HH with higher education (%) 2.3 5.5
Percentage of literate HH members >5 years (mean) 38.5 49.2
Note: The region where the poverty indicator was stronger is highlighted in each rowSource: ICIMOD analysis based on HIES 2005/06 datasets

3 Bangladesh
17
Social status
Social status was based on five indicators (uneducated head of household, head of household with primary, secondary, or higher education, and percentage of literate household members). All indicators except ‘head of household with primary education’ were lower in the mountains than in the plains.
Sociocultural attitudes, distances to secondary school, lack of transportation facilities or commitment to pay for transportation, and early marriage all contribute to a lower educational attainment in the mountain districts of Bangladesh than in other parts of the country. Furthermore, distances to schools tend to be greater, which further discourages parents from sending their children, especially girls, to school. Lack of or limited access to schooling reduces the occupational opportunities for households hence creating a poverty cycle (World Bank 2006).
Distribution of Consumption Quintiles in the Mountain Areas
Table 6 shows the distribution of national total per capita consumption quintiles in the mountain area of Bangladesh in 2005/06. By definition, the percentage of the population in each quintile is the same over the country as a whole (20%); any variation in this distribution within a particular area indicates a difference in the distribution of wealth groups within that area compared to the whole country. The findings showed a marked deviation in the distribution of consumption quintiles from the national average: the second poorest and middle group (2nd and 3rd quintiles) comprised 60% of the population in the mountains, while the two richest groups were underrepresented. At the same time, there were only half as many as expected of the poorest group.
Contribution of Different Determinants of Poverty
The previous section focused on identifying the poverty determinants that are specific to the mountains and plains in Bangladesh. This section considers the comparative impact of the different determinants on the overall poverty rate. Figure 7 shows the proportional impact of the different determinants of poverty in the mountain region. Household composition had the highest impact (46%) reflecting the high dependency rate, followed by social status (33%), with uneducated heads of households playing the greatest role, and then assets and liabilities (11%), and lack of access to basic facilities (10%). These impacts are not specific to the mountain region; however, the different level of impact of the poverty determinants and their significance need to be addressed to help development interventions in the mountains of Bangladesh to be successful.
Table 6: Monthly per capita consumption quintiles living in the mountains of Bangladesh
MPCC quintile Per capita consumption(BDT)a
Population in the mountains(%)
1st <677 10.6
2nd 677 to 872 32.8
3rd 872 to 1,127 27.1
4th 1,227 to 1,586 17.0
5th >1,586 12.5
Total 100.0a Exchange rate in 2010: 74.6 BDT (Bangladeshi Taka) = 1 USD Source: ICIMOD analysis based on HIES 2005/06 datasets
Figure 7: Contribution of different determinants to poverty in the mountain region (%)
Lack of access to basic facilities
Social status
HH composition
Assets and liabilities
Source: ICIMOD analysis based on HIES 2005/06 datasets

Understanding Mountain Poverty in the Hindu Kush-Himalayas
18

4 Bhutan
19
4 Bhutan
Unlike India and Nepal, Bhutan is an entirely mountainous country and an ideal model for exploring disparities and the unequal distribution of poverty within a mountain system. Bhutan began to monitor poverty in 2003 as the need to measure poverty became more compelling following the requirement to monitor poverty statistics as part of the United Nations’ Millennium Development Goals (MDGs). Bhutan measured its level of poverty for the first time in 2003 with a comprehensive household survey, the Bhutan Living standard Survey (BLSS); which was repeated with some changes in 2007.
The Government of Bhutan provides free health care services to people living in remote areas, universal free education at all levels, and an entitlement of agricultural land given freely for subsistence purposes. Notwithstanding these efforts to combat poverty, the first Poverty Analysis Report (PAR 2004), which was based on the 2003 BLSS data, identified approximately 32% of the population as living below the poverty line, almost all in rural areas; this dropped to 23% in 2007.
A number of variables were found to correlate closely with poverty in the BLSS 2007, especially physical infrastructure and educational level. Many of the remote rural communities in Bhutan are only poorly connected to urban centres, where people have better access to vital infrastructural services. In line with this, poverty was much more widespread in rural Bhutan (38%) than in the urban areas (4%). While basic education is free in Bhutan, affordability of uniforms and text books and loss of labour are still important reasons for not attending school. Enrolment rates are far higher in urban than in rural areas. Lack of education is more pervasive among the poor;
Country Profile
Bhutan is situated towards the east of the Himalayas bordered by India to the south and China to the north. Unlike Nepal, Bhutan is entirely mountainous. According to the Bhutan Census 2007, the country has a total population of 630,000 people in 125,000 households, with 80% of the population residing in rural areas Almost 70% of the total land is under forest cover and only 8% is available for agriculture. Timber is the country’s most abundant natural resource. The unemployment rate is 3.7%, with only 10,600 people unemployed (UNDP 2005a).
Bhutan began to open up to the outside world in the 1960s and has since adopted a policy of cautious modernisation. Bhutan was ranked 134 out of 177 countries in the Human Development Index (HDI) in 2005 (UNDP 2005a); it was not listed in 2010. Bhutan’s development philosophy is based on the concept of Gross National Happiness, focusing on sustainable and equitable socioeconomic development, conservation of the environment, preservation and promotion of culture, and promotion of good governance, as the four main pillars of growth.
Total population 2009* 0.69 millionPopulation living below the poverty line** 0.15 millionLife expectancy at birth 2009* 67 yearsAdult literacy rate 2005* 56%
Source: *World Bank 2009; **ICIMOD analysis based on BLSS 2007 datasets
Gasa
Haa
Lhuentse
Paro
Bumthang
Zhemgang
Trongsa
Monggar
Dagana
Wangduephodrang
Chhukha
Thimphu
Trashigang
Sarpang
Yangtse
Samtse
Punakha
SamdrupjongkharTsirangPemagatshel
±
0 50 10025
Kilometres
C H I N A
Location map
HKHBhutan
I N D I A
I N D I A
Legend
HKH study focus area
HKH study area
Administrative map of Bhutan
Boundaries are for guidance only and do not imply any opinion concerning the legal status of any country or territory or the delimitation of its frontiers or boundaries.

Understanding Mountain Poverty in the Hindu Kush-Himalayas
20
with a higher educational difference between the poor and the non-poor in urban areas. Similarly, although huge investments have been made in health facilities, the rugged and difficult terrain, remoteness, sparse population, and lack of reliable communication facilities is still hindering the delivery of health care services in rural areas. Some demographic characteristics of households are also relevant. For example, households with a higher dependency ratio tend to be poorer.
Data Source
The National Statistics Bureau of Bhutan collected data for the nationwide representative Bhutan National Living Standard Survey (BLSS) in 2003 (covering 4,007 households) and in 2007 (covering 9,798 households). The BLSS includes information about the socioeconomic characteristics of each household member, agriculture and livestock, and household expenditure. The National Statistics Bureau of Bhutan notes that due to the different sample size and an additional food consumption section in the questionnaire in 2007, it is not possible to compare the two surveys directly. Thus in this study, the poverty analysis for Bhutan was based on the data from the 2007 survey only. It was used to highlight differences between the four regions within the country, from east to west.
Poverty Trends
The poverty rates in different parts of Bhutan in 2007 are summarised in Table 7 and illustrated graphically in Figure 8. There were strong regional differences along a west-east gradient. Although there are poor people living in remote villages scattered throughout the country, poverty was most prevalent in the country’s eastern region. Almost a quarter (23%) of the population overall was living below the total poverty line, with rates ranging from 17 and 18% in western and central Bhutan, to 26 and 34% in southern and eastern Bhutan. The rate was much higher in rural Bhutan (31%) than in urban Bhutan (1.7%).
Food and non-food poverty
Food and non-food poverty was analysed separately. Figure 9 shows the levels of food poverty by district and overall. More than a third (38%) of the total population was unable to afford sufficient food, with lower rates in western and central than in southern and eastern Bhutan (34 and 32% compared to 44 and 45%, respectively).
Table 7: Population living below the poverty line (%)
Western Bhutan 17
Central Bhutan 18
Southern Bhutan 26
Eastern Bhutan 34
Bhutan average 23
Rural Bhutan 31
Urban Bhutan 1.7Source: ICIMOD analysis based on BLSS 2007 datasets
0 5 10 15 20 25 30 35
Eastern
Southern
Bhutan average
Central
Western
Figure 8: Population living below the total poverty line (%)
Source: ICIMOD analysis based on BLSS 2007 datasets
0 10 20 30 40 50
Eastern
Southern
Bhutan average
Western
Central
Figure 9: Population living below the food poverty line in 2007 (%)
Source: ICIMOD analysis based on BLSS 2007 datasets

4 Bhutan
21
Non-food poverty was less severe overall than food poverty; nevertheless one in every five Bhutanese (22%) was not able to purchase basic non-food items and services. The rate increased from west to east, with rates of 14%, 18%, and 21% in western, central, and southern Bhutan, and a markedly higher rate of 35% in eastern Bhutan (Figure 10).
Determinants of Poverty in Eastern Bhutan
Regionally equitable development is one of the stated objectives of the government and serious efforts have been made to achieve regional balance. Nevertheless, the results showed that the people in eastern Bhutan are still markedly poorer than those in the rest of the country in terms of food, non-food, and total poverty. The distribution of the determinants of poverty in eastern Bhutan and the remainder of the country was analysed to help understand which components contribute to these higher rates of poverty. The results are summarised in Table 8. They show that almost all poverty determinants were higher in eastern Bhutan. The individual components are discussed in the following.
Access to basic facilities
Access to basic facilities was the strongest predictor of wellbeing, and the people in eastern Bhutan were significantly poorer in this regard than in the rest of the country. Households in eastern Bhutan had less access to electricity (11% less), to improved sources of drinking water (27% less), and to improved toilet facilities (22% less) than in the rest of the country. This hinders development as people are unable to use communication services and are more exposed to illness and disease.
Accessibility
Accessibility also had a strong impact on poverty. Eastern Bhutan is characterised by a lack of infrastructure, and as a result people in this area had to spend between one and four hours longer on average than in the rest of Bhutan to reach a road, market centre, telephone, bus stop, or bank. This is reflected in the very low average score for the accessibility factor. The lack of infrastructure was one of the key reasons for poverty in this region.
Furthermore, one of the reasons for the persistent disparity in poverty rates in the country lies in the fact that some parts are still unconnected, especially to the centres of administration and commerce. In line with this, greater proximity to roads was associated with a lower incidence of poverty.
Assets and liabilities
Assets and liabilities had the least impact on poverty, although all three indicators were significant and contributed to poverty overall. People in eastern Bhutan had slightly fewer livestock and a lower percentage of loans compared to those in the rest of the country, but average landholding size was similar.
Household composition
There was a strong correlation between employment in agriculture and poverty. In eastern Bhutan, 13% fewer households on average worked in non-agricultural sectors than in the rest of the country. The region also had a higher dependency rate, with households supporting more dependents from their income. As mentioned for Bangladesh, the proportion of female-headed households correlates with lower rates of poverty in the Hindu Kush-Himalayan region. In line with this, the proportion of female-headed households was 4% lower in the east than in the rest of Bhutan.
0 5 10 15 20 25 30 35 40
Eastern
Bhutan average
Southern
Central
Western
Figure 10: Population living below the non-food poverty line in 2007 (%)
Source: ICIMOD analysis based on BLSS 2007 datasets

Understanding Mountain Poverty in the Hindu Kush-Himalayas
22
Social status
There were 19% more uneducated heads of household and 9% fewer literate household members on average in eastern Bhutan than in the rest of the country. This has a negative impact on both income generation and occupational potential, as well as on household management strategies. Low social status also correlates strongly with poverty.
Distribution of Consumption Quintiles in Eastern Bhutan
Table 9 shows the distribution of national per capita consumption quintiles in eastern Bhutan in 2007.
Table 8: Determinants of poverty in eastern Bhutan and the rest of the country
Eastern Bhutan Rest of Bhutan
Individual poverty indicators
Population under the food poverty line (%) 45.1 35.3
Population under the non-food poverty line (%) 34.5 16.4
Population under the total poverty line (%) 33.5 19.1
Access to basic facilities
Population with improved source of drinking water (%) 45.7 72.3
Population with improved toilet facilities (%) 29.6 51.7
Population with electricity (%) 58.5 69.8
Basic facility factor (mean) 0.35 0.07
Accessibility
Hours to next paved road (mean) 3.8 1.9
Hours to next market centre (mean) 2.6 1.8
Hours to next telephone (mean) 2.4 .9
Hours to next bus stop (mean) 5.4 2.1
Hours to next agricultural centre (mean) 1.7 1.3
Hours to next bank (mean) 6.2 2.7
Accessibility factor (mean) 0.38 0.09
Assets and liabilities
Owned land in ha per head (mean) 0.38 0.39
Number of livestock per head (mean) 1.3 1.5
Loans obtained (%) 35.6 39.7
Household composition
HH with female head (%) 27.4 31.8
Dependency rate (mean) 0.89 0.77
Percentage of HH members in non-agricultural professions (mean) 14.5 27.3
Social status
Uneducated head of HH (%) 84.6 66.0
Percentage of literate HH members >5 years (mean) 48.5 57.9Note: The region where the poverty indicator was stronger is highlighted in each rowSource: ICIMOD analysis based on BLSS 2007 datasets
Table 9: Percentage of monthly total per capita consumption quintiles living in the mountains of eastern Bhutan
MPCC quintile Per capita consumption (BTN)a
Population in eastern Bhutan
1st <1,327 31.1
2nd 1,327 to 1,965 26.6
3rd 1,965 to 2,837 19.4
4th 2,837 to 4,399 14.0
5th >4,399 8.9
Total 100.0a Exchange rate in 2010: 44.9 BTN (Bhutanese ngultrum) = 1 USD Source: ICIMOD analysis based on BLSS 2007 datasets

4 Bhutan
23
By definition, the percentage of the population in each quintile is the same over the country as a whole (20%); any variation in this distribution within a particular area indicates a difference in the distribution of wealth groups within that area compared to the whole country. The poorest and second poorest groups (1st and 2nd quintiles) were overrepresented in eastern Bhutan; whereas the two wealthiest consumption groups were underrepresented.
Contribution of Different Determinants of Poverty in Eastern Bhutan
The previous section focused on identifying the poverty determinants that are specific to eastern Bhutan. This section considers the comparative impact of the different determinants on the overall poverty rate in this area. Figure 11 shows that social status had the highest impact on poverty (43%), followed by assets and liabilities, and lack of access to basic facilities. Contrary to the general assumption, inaccessibility had a low impact (5%), only slightly higher than household composition (2%). These impacts are not specific to eastern Bhutan; however, the different level of impact of the poverty determinants and their significance need to be addressed to help development in this area to be successful.
InaccessibilityLack of access to basic facilities
Social status
HH compositionAssets and liabilities
Source: ICIMOD analysis based on BLSS 2007 datasets
Figure 11: Contribution of different determinants to poverty in Eastern Bhutan (%)

Understanding Mountain Poverty in the Hindu Kush-Himalayas
24

5 China
25
5 China
China has experienced a remarkable period of rapid growth spanning three decades and became the world’s second largest economy in 2010. Since shifting from a centrally planned to a market based economy, China is increasingly playing an important and influential role in the global economy.
China adopted a series of economic reforms starting in 1978 leading to rapid economic growth and an unprecedented decline in poverty. Official estimates by China’s National Bureau of Statistics (NSB) indicate that the number of rural poor dropped from 250 million in 1978 (30.7% of the population) to 125 million in 1985 (14.8% of the population). This has been widely considered to be the most successful era of poverty reduction in China’s history (Wang and Ren 2004). During the 1990s, almost two-thirds of the rural population was lifted out of poverty, with the number of poor according to this definition falling from 85 million in 1990 to 32.1 million in 2000. A possible reversal of the trend was encountered between 2002 and 2003 when rural poverty rose 3% according to official estimates, despite GDP growth of 8%.
However, available evidence indicates that not all parts of China have experienced growth with the same consistency and hence inequalities and productivity gaps between different regions have increased over time. Income inequality has deepened between coastal and interior provinces as well as between rural and urban areas. Often such areas are remote and far from growth centres, of low agro-ecological potential, and have large ethnic minority populations. A number of factors have contributed to this widening disparity in regional development including differences in natural resource endowments, in infrastructure, and in human capital development.
Country Profile
The People’s Republic of China is the most populous country in the world, with over 1.3 billion citizens, the second largest country in the world by land area, and the third largest by total area.
China was ranked 89 out of 169 countries in the Human Development Index (HDI) in 2010; while the per capita income increased 21-fold over the last four decades. The country was not among the region’s top performers in improving school enrolment and life expectancy (UNDP 2010b).
Total population 2009* 1,331 millionPopulation living below the poverty line 2001** 213.3 million Life expectancy 2009* 73 yearsAdult literacy rate 2009** 94%
Source: *World Bank 2009; **Chen and Ravallion 2004; based on the population in 2001 of 1,285 million
Tibet
Xinjiang
Nei Mongol
Qinghai
Sichuan
Gansu
Jilin
Yunnan
Heilongjiang
Hebei
Hubei
Hunan
Guangxi
ShaanxiHenan
Anhui
Shanxi
JiangxiGuizhou
Liaoning
Fujian
Shandong
Guangdong
Zhejiang
Jiangsu
Ningxia
Hainan
BeijingTianjin
Shanghai
Hong Kong
±
0 1,000 2,000500
Kilometres
N E P A L
Location map
HKHChinaM Y A N M A R
B A N G L A D E S HI N D I A
Bay of Bengal South China Sea
S O U T H K O R E A
M O N G O L I AK A Z A K H S T A N
Legend
HKH study focus areaHKH study area
Administrative map of China
Boundaries are for guidance only and do not imply any opinion concerning the legal status of any country or territory or the delimitation of its frontiers or boundaries.

Understanding Mountain Poverty in the Hindu Kush-Himalayas
26
With a per capita gross national income in 2010 of about 4,260 USD, China is an upper middle-income country that has complex development needs. With the second largest number of consumption-poor in the world after India, poverty reduction remains a fundamental challenge. Rapid economic ascendance has also brought on many challenges, including demographic issues related to both an aging population and internal migration of labour, high inequality, rapid urbanisation, challenges to environmental sustainability, and external imbalances. Significant policy adjustments will be required in order for China’s growth to be sustainable (World Bank 2010).
In its 11th Five-Year Plan (2006-2010), the Government of China set forth a ‘people centred’ strategy aiming to achieve a ‘harmonious society’ that balances economic growth with distributional and ecological concerns. Considerable progress was made under this plan in improving basic public services in social protection, education, and health, but structural issues remain under the strong momentum of China’s traditional pattern of growth. China has long pursued a subjective development policy, with the largest portion of public investment concentrated in the coastal regions and in urban areas. Thus it is of little surprise that the difference in economic growth rates between the coastal and inland regions, and regional inequality for China as a whole, increased significantly. Moreover, in 2002, rural per capita income was only one-third of the urban per capita income. Therefore poverty is highest in rural areas and is particularly concentrated in the northwest, west and south-west areas, away from the dynamic coastal region.
The growing provincial inequalities in economic growth rates and per capita incomes are matched by increasing differences in social indicators. It is likely that poverty is greatest in the counties officially classed as ‘poor’; the government increased the number of these from 258 in 1986 to 592 in 2003. However, evidence is emerging of the large numbers of people trapped in poverty in ‘non-poor’ counties. The growing economic and social inequality of rural China means that substantial numbers of chronically poor people live in areas that have been prospering at the same rate as other areas of the country.
Data Source
There is a lack of publicly accessible household survey data for China representative at the national level, hence this report draws on secondary data, which merged underlying national rural and urban household surveys. Thus the findings for China were not analysed by ICIMOD using primary national datasets, rather they provide an overview of poverty trends based on secondary research. With the available datasets, it was only possible to look at mountain/hill regions overall, including but not limited to the HKH region.
Poverty Trends
Rural-urban discrepancies
China remains marked by strong imbalances throughout its 31 regions. The strongest development is mainly concentrated in the coastal and central regions; substantial development gaps are observed between urban and rural areas as well as between the eastern and western regions.
A study by Park and Wang (2001) argued that the official figures of the rural poverty statistics heavily underestimate rural poverty. Official statistics indicate a reduction in rural poverty headcount ratios of 27 percentage points between 1978 and in 2000. The authors argue that increases in the rural cost of living are inadequately accounted for, due to insufficient efforts to capture changes in prices and a failure to adequately account for regional price differences. They also suggest that urban poverty requires a careful assessment that has been lacking, and that the exclusive focus on rural poverty might provide a very incomplete picture of poverty in China.
An estimated 5% of the urban population (approximately 14 million people) experience 1 USD per day income poverty – confirming the broad consensus that poverty in China remains mainly a rural problem. Poverty is lower in urban areas, and much more likely to be transitory. However, there is evidence that the ‘old’ urban long-term poor are now joined and even outnumbered by significant numbers of ‘new poor’ – those who have moved to cities

5 China
27
but are unable to meet their minimum needs because they are forced into low paid casual work and have very limited access to state-provided services. In areas away from the coastal zone, factory closures have created deep concentrations of persistent poverty.
The first attempt to calculate human development indices for both rural and urban areas was made by the United Nations Development Programme (UNDP) Human Development Report in 2005, which demonstrates that although rural areas experienced development, they are nevertheless behind urban areas. In rural areas, the Human Development Index (HDI) was 0.685 while in urban areas it was considerably higher at 0.816 (UNDP 2005b). Different development indicators demonstrate the disparities between rural and urban, but also between different regions in China. For example, rural income is particularly low in Gansu, Guizhou, Heilongjiang, Ningxia, Shaanxi, Tibet AR, and Yunnan. The largest gap between rural and urban income is reported for Tibet, where urban households had more than five times the income of rural households in 2003. Other regions with strong gaps between rural and urban incomes were Changquing, Gansu, Guangxi, Guizou, Qinghai, Shaanxi, and Yunnan (Heilig et al. 2005). Life expectancy also shows large discrepancies between rural and urban areas. According to the 2000 national census, rural citizens have a life expectancy of 69.6 years compared to 75.2 years for urban citizens. In the Himalayan mountain regions of Guizhou, Tibet, and Yunnan the life expectancy was even lower, at 65 years (UNDP 2005b).
The rural urban imbalances were considerably reduced in the first decade of the economic reforms from the late 1970s to 1980s. In 1978, the urban income was almost 2.6 times higher than the rural income, whereas in 1988 it was only 1.5 times higher. However, since then the rural-urban income gap has again increased. In 2003, urban income was 2.4 times higher than rural income (Heilig et al. 2005). Estimates from the World Bank show that China’s Gini coefficient for income distribution rose from 0.3 in 1982 to 0.45 in 2002, which is a 50% increase (UNDP 2005b; Chen and Ravallion 2005).
The mountain regions
The State Council’s Leading Group for Poverty Reduction (LGPR), established in 1986, is China’s principal advocate for the rural poor. In its year of foundation, LGPR commissioned the Chinese Academy of Sciences to analyse rural poverty within China. Jiang (1989) identified 21 core poor zones and pointed out that rural poverty was concentrated in mountain and hill counties; at least 90% of the rural population of the poverty zones were identified as living in mountain counties. As a result, LGPR focused government support for poverty alleviation in mountain areas (LGPR 2001). This trend, in terms of both poverty frequency and policy emphasis, is still prevalent today as most of the rural poor in China remain in the more remote upland regions. Figure 12 shows the counties highlighted by the LGPR to receive special support for poverty alleviation. Most of the affected counties lie along a line from northeast to southwest and a line from the centre of China to the province of Southern Xinjiang. Most of these poor counties are located in mountain or hill areas (Heilig et al. 2005).
Poverty in China was closely related to the steepness of the terrain (Table 10). Almost twice as many poverty counties were covered with gentle to steep slopes (8 to 30 degrees), as were non-poverty counties. In other words, poverty counties were more commonly found in hill and mountain areas.
Figure 12: Key counties for poverty alleviation and development, 2001
Source: The State Council Leading Group, Office of Poverty Alleviation and Development cited in Heilig et al. 2005
Note: The areas marked in red are the 592 key counties for poverty alleviation and development, that in light red shows the 74 counties of Tibet Autonomous Region.

Understanding Mountain Poverty in the Hindu Kush-Himalayas
28
Table 11 shows the human development indicators for the 31 regions in China, together with the rank in terms of GDP per capita. The mountainous regions of the Himalayas all lie within the lowest third in terms of human development indicators, and all except one within the lowest third for GDP per capita.
Determinants of Poverty in the Mountains
The determinants of poverty in the mountain regions of China relative to the remainder of the country are shown in Table 12, and the relative levels of various indicators in poverty and non-poverty counties in Table 13. The remote mountain areas are characterised by weak infrastructure. The outreach of roads, electricity, and telecommunication is poor and facilities for education and health care are limited. Agro-climatic conditions are another determinant of poverty. For example, high altitude and/or steep areas such as those in Qinghai, Tibet AR, or Yunnan face several combined natural disadvantages. It is believed that limited agricultural productivity is a result of cold temperatures, high altitudes, labour intensity, costly slope cultivation and erosion, and/or chemical soil constraints (Heilig et al. 2005). Furthermore, consumer markets tend to be far away and transportation infrastructure is weak. Fertile plains areas do not face such a combination of constraints and as a result are substantially better off than the rural mountain areas (LGPR 2001). Minority groups are another determinant of poverty which is addressed by the LGPR (LGPR 2001). As in other HKH country studies, the level of education and dependency rate also show a relationship with poverty incidence.
Table 11: Human Development Index (HDI) (2008 values)
HDI Rank Region HDI GDP per capita rank
High human development
1 Shanghai 0.908 1
2 Beijing 0.891 2
3 Tianjin 0.875 3
4 Guandong 0.844 6
5 Zhejiang 0.841 4
6 Jiangsu 0.837 5
7 Liaoning 0.835 9
8 Shandong 0.828 7
9 Jilin 0.815 11
10 Hebei 0.810 12
11 Heilongjjang 0.808 13
12 Fujian 0.807 10
Medium human development
13 Inner Mongolia 0.803 8
14 Shanxi 0.800 14
15 Henan 0.787 17
16 Hubei 0.784 16
17 Hainan 0.784 23
18 Chongqing 0.783 19
19 Hunan 0.781 21
20 Guangxi 0.776 25
21 Xinjiang 0.774 15
22 Shaanxi 0.773 18
23 Ningxia 0.766 20
24 Sichuan 0.763 24
25 Jiangxi 0.760 26
26 Anhui 0.750 27
27 Qinghai 0.720 22
28 Yunnan 0.710 29
29 Gansu 0.705 30
30 Guizhou 0.690 31
31 Tibet AR 0.630 28Note: Highlighting indicates counties in the Himalayan region Source: UNDP 2010b; data source National Bureau of Statistics of China 2003, values extrapolated
Table 10: Poverty in China in terms of topography
Topography Non-Poverty Counties
Poverty Counties
Slope above 8 degrees (%) 36.1 72.2
Slope above 15 degrees (%) 29.2 60.3
Slope above 30 degrees (%) 14.6 29.3Source: Heilig 2005

5 China
29
Table 13: Selected indicators in poverty and non-poverty counties in 2001
Indicator Poverty counties Non-poverty counties
Economy
GDP (Yuan per capita) 2,690 5,050
Non-agricultural population (% ) 11.7 24.3
Infrastructure
Road length (m per km2 of land area) 68 99
Hospital beds (per km2 of land area) 0.2 0.7
Households without tap water (%) 7.4 5.3
Households with toilets (%) 5.9 6.6
Agriculture
Cultivated land (%) 20.7 40.1
Per capita cultivated land 0.195 0.201
Education
Non-literate population – age 15 years and above (%) 20.7 9.6
Population with no schooling, age 6 years and above (%) 16.4 7.5
Demography
Ethnic minority population (%) 39.3 10.7
Birth rate (births per 1,000 of the population) 15.6 11.6
Natural growth rate (per 1,000 of the population) 8.6 5.7
Total fertility rate 1.71 1.27Source: Adapted from Heilig et al. 2005
Table 12: Selected determinants of poverty in the HKH part of China and the rest of the country
Mountain region Rest of China
Individual poverty indicators
HDI 2008* 0.739 0.804
Per capita total expenditure (mean in Yuan) 10,143 11,944
Per capita food expenditure (mean in Yuan) 4,120 4,341
Per capita total income (mean in Yuan) 14,825 18,476
Access to basic facilities
Per capita electricity consumption (kWh) 2,079 2,893
Accessibility
Length of highway (m per km2 of total area) 172 651
Length of railway (m per km2 of total area) 3 15
Assets and liabilities
Cultivated land (% of total land area) 4.5 21.5
Per capita cultivated land (hectare per person) 0.12 0.09
Household composition
Dependency ratio 0.41 0.36
Population employed in non-agricultural sector (% of all employed) 48.5 62.1Source: China Statistical Yearbook 2009; *UNDP 2010

Understanding Mountain Poverty in the Hindu Kush-Himalayas
30

6 India
31
6 India
India is an emerging economy and has witnessed unprecedented economic expansion in the last decade. The country has benefited greatly from outsourcing of work by developed countries, and a strong manufacturing and export oriented industrial framework. However, it still faces numerous problems including a substantial level of poverty and large income gaps between wealth groups. The inequality between rich and poor is expected to increase further, the middle class is projected to increase tenfold by 2025 and to exceed 500 million (38% of the total population) and command 60% of the country’s spending power by 2025 (Rajuladevi 2001). The rising income gap is creating, and will continue to create, an increased urban-rural divide and north-south imbalance in the country.
A quarter of India’s population lives below the poverty line and a significant proportion lives on small farms with little access to new technology. As almost 70% of Indians still reside in rural areas, there is a large mass of people who lack the skills needed to participate in the new economy and benefit from its current and future prosperity (Shashanka and Mehta 2003).
Data Source
The poverty analysis for India was based on data from 1992 and 2003 collected by the National Sample Survey Organisation for the National Sample Survey (NSS). The yearly nationwide representative survey is split into various thematic topics and alternating modules which are conducted within their own samples. This analysis uses data from
Country Profile
The vast and diverse country of India is the second most populous country in the world after China, with a population of 1.1 billion in 2009, and is expected to become the most populous country by 2040 (World Bank 2009). India occupies much of the South Asian subcontinent, and the Indian mainland stretches from Pakistan in the west to Bangladesh and Myanmar in the east. To the north, India borders China, Bhutan, and Nepal. Geographically, India is often divided into the Indo-Gangetic Plain and the Himalayas, collectively known as North India, and the Peninsula, or South India. The diverse physiological regions include highlands, plains, deserts, and river valleys.
India was ranked 121 out of 169 countries in the Human Development Index in 2010 (UNDP 2010a).
Total population 2009* 1,155 millionPopulation living below the poverty line 2003** 415 millionLife expectancy at birth 2009* 64 yearsAdult literacy rate 2006 63%
Source: *World Bank 2009; **ICIMOD analysis based on NSS 2003 datasets
RAJASTHANUTTAR PRADESH
MADHYA PRADESH
BIHAR
ORISSA
ASSAM
JAMMU & KASHMIR
MAHARASHTRA
CHATTISGARH
JHARKHAND
PUNJAB
WEST BENGAL
HARYANA ARUNACHAL PRADESH
GUJARAT
HIMACHAL PRADESH
MANIPUR
MEGHALAYA
MIZORAM
NAGALAND
TRIPURA
SIKKIM
DELHI
CHANDIGARH
DISPUTED
ADJACENT COUNTRIES
±
0 250 500125
Kilometres
C H I N A
Location map
HKH
India
PAKISTAN
N E P A L
I N D I A
Desputed area
Bay of Bengal
Legend
HKH study focus area
HKH study area
B H U T A N
Desputed area
Administrative map of the Indian Himalayan region
Boundaries are for guidance only and do not imply any opinion concerning the legal status of any country or territory or the delimitation of its frontiers or boundaries.

Understanding Mountain Poverty in the Hindu Kush-Himalayas
32
the sections on ‘Consumer Expenditure’ and ‘Land and Livestock Holdings’ in 1992 and 2003, and the section ‘Village Facilities’ conducted in 1991 and 2002. The Consumer Expenditure module covered 13,137 and 41,013 households in 1992 and 2003, respectively, the Land and Livestock Holdings module covered 53,881 and 82,160 households in 1992 and 2003, respectively; and the Village Facilities section covered 4,298 and 4,646 communities in 1991 and 2002, respectively.
The analysis measured poverty in terms of the total monthly per head consumption in Indian rupees (INR). There is no official holistic (food and non-food) poverty line for India. The Government of India has set up an expert commission to revise the old poverty line, but this process is still ongoing. The following analysis relied on the internationally accepted poverty line of 1 USD per day.
The data from India were used to explore disparities between mountain and non-mountain areas, and specifically between the Indian Himalayan region and the country as a whole; the results are shown in Table 14.
Poverty Trends
Unlike the other country studies in this report, the total poverty rate in the mountainous Indian Himalayan region (34%) was slightly lower than in the rest of the country (36%), and declined 2% faster than the national average between 1992 and 2003. However, there was a marked difference between poverty in rural and urban regions, and this difference was even greater in the Himalayan region. The proportion of people living in poverty in the rural parts of the Indian Himalayas (38%) was slightly higher than in rural India as a whole (37%), whereas the proportion of people living in poverty in urban areas of the Indian Himalayas (19%) was considerably lower than in the urban areas of the country as a whole (30%).
Differences Within the Indian Himalayan Region
Figure 13 shows the poverty rates in 2003 in the 14 different mountain and hill states (and parts of states) within the Indian Himalayan region. There are large differences among these areas, with poverty levels ranging from less than 2% in Nagaland to 49% in Uttarakhand and 56% in Himalayan West Bengal. Poverty levels in the latter two areas were well above the average for the Indian Himalayan region as a whole, whereas all other areas had rates below the average.
Determinants of Poverty in Rural Uttarakhand and Rural Himalayan West Bengal
Differences between the conditions in Uttarakhand and Himalayan West Bengal and those in the rest of the Indian Himalayan region were analysed to help understand the reason for the higher poverty rates in these two states. The analysis first looked at the differences between rural and urban areas (Figure 14). Poverty in the rest of the Indian Himalayan region was higher in rural (17%) than in urban areas (12%). In Uttarakhand, poverty rates in rural and urban areas were similar (49%), but considerably higher than in the rest of the region. In the Himalayan part of West Bengal, the poverty rate
Table 14: Population living below the poverty line
Indian Himalayan region 34
Rural Indian Himalayan region 38
Urban Indian Himalayan region 19
India average 36
Rural India 37
Urban India 30Source: ICIMOD analysis based on NSS 2003 datasets
0 10
20
30
40
50
60
West Bengal-Himalayan
Uttarakhand
Indian Himalayan region average
Tripura
Assam Hills
Jammu and Kashmir-Outer Hills
Himal Pradesh
Manipur Hills
Sikkim
Arunachal Pradesh Meghalaya Jammu and Kashmir-Mountainous
Jammu and Kashmir-Jhelam Valley Mizoram
Nagaland
Figure 13: Population living below the total poverty line in different parts of the Indian Himalayan region (%)
Source: ICIMOD analysis based on NSS 2003 datasets

6 India
33
was significantly higher in the rural (59%) than in the urban part (29%), and both were considerably higher than the average in the remainder of the region. Rural poverty was 10% higher in West Bengal than in Uttarakhand, but urban poverty was 20% lower.
The distribution of the determinants of poverty was analysed to help understanding of which components contribute to the higher rates of poverty in rural Uttarakhand and rural West Bengal compared to the remainder of the rural Indian Himalayan region. The results are summarised in Table 15. They show that almost all poverty determinants were higher in rural Uttarakhand or rural West Bengal. The individual components are discussed below.0 10 20 30 40 50 60 70
Himalayan West Bengal
Uttarakhand
Rest of Indian Himalayan region
Urban
Rural
Figure 14: Population living below the total poverty line in the Indian Himalayan region (%)
Source: ICIMOD analysis based on NSS 2003 datasets
Table 15: Determinants of poverty in the Indian Himalayan Region
Rural Uttarakhand Rural Himalayan West Bengal
Rest of Rural Indian Himalayan Region
Individual poverty indicators
Population under the total poverty line (%) 49.1 59.2 16.9
Access to basic facilities
Population with electricity (%) 53.3 21.7 77.1
Accessibility
HH 10 km or more from next paved road (%) 24.5 0.8 11.0
HH 10 km or more from next market centre (%) 56.4 2.2 36.0
HH 10 km or more from next fair price shop (%) 6.6 11.1 8.8
HH 10 km or more from next bus stop (%) 17.0 2.1 10.1
HH 10 km or more from next agricultural centre (%) 36.2 26.3 33.4
HH 10 km or more from next bank (%) 30.2 29.5 39.8
Accessibility factor (mean) 0.87 0.41 0.54
Assets and liabilities
Owned land in ha per head (mean) 0.06 0.10 0.12
Number of plots owned (mean) 4.2 2.1 3.5
Household composition
HH with female head (%) 24.7 9.6 12.5
Dependency rate (mean) 0.91 0.77 0.75
Percentage of HH members in non-agriculture (mean) 15.2 10.6 20.0
Social status
Population of scheduled tribes (%) 4.7 11.3 30.1
Population of scheduled castes (%) 21.7 49.6 13.3
Population of other backward castes (%) 10.5 6.3 12.9
Uneducated head of HH (%) 49.8 60.7 52.2
Percentage of literate HH members (mean) 65.8 65.6 71.0Source: ICIMOD analysis based on NSS 2003 datasets Note: The region where the poverty indicator was stronger is highlighted in each rowHH = Households

Understanding Mountain Poverty in the Hindu Kush-Himalayas
34
Access to basic facilities
Electricity was the only measure available to assess lack of access to basic facilities. Households in rural Uttarakhand and rural Himalayan West Bengal had significantly lower access to electricity than in the rural parts of the rest of the Indian Himalayan region (53 and 22% compared to 77%).
Accessibility
Accessibly was worse in rural Uttarakhand than in rural Himalayan West Bengal and the rest of rural Indian Himalayan region, both overall and individually for all indicators except distance to a fair price shop and a bank. In contrast, accessibility was better in rural Himalayan West Bengal than in the rest of the rural Indian Himalayas for all except one of the indicators. Rural Uttarakhand is characterised by a lack of infrastructure which contributes to the poverty in the region as people have to spend more time to reach the next road, bus stop, and market centre.
Assets and liabilities
Total landholdings per head in rural Uttarakhand were lower, and the degree of fragmentation higher, than in both rural Himalayan West Bengal and the rest of the rural Indian Himalayas. Land owned per head was lower in rural Himalayan West Bengal than in the rest of the rural Indian Himalayas, but the degree of fragmentation was less. Smaller landholdings mean having less area to grow food and cash crops; whereas a higher degree of fragmentation generally means that cultivating the land is more time consuming and labour intensive.
Household composition
Household composition proved to be another important factor. Both the percentage of household members employed outside the agriculture sector and the dependency rate had a strong predictive power. The percentage of households employed in non-agricultural sectors was significantly lower in rural Himalayan West Bengal (11%) and rural Uttarakhand (15%) than in the rest of the rural Indian Himalayan region (20%). The dependency rate was higher in rural Uttarakhand than in rural Himalayan West Bengal and the rural Indian Himalayas. The proportion of female-headed households was lower in rural Himalayan West Bengal and higher in rural Uttarakhand than in the rest of the rural Indian Himalayan region.
Social status
Social status was measured in terms of the population of ‘scheduled tribes’, ‘scheduled castes’, and ‘other backward castes’, and education and literacy levels. The population of scheduled castes (50%) was much higher in rural Himalaya West Bengal than in rural Uttarakhand (22%) or the rest of the rural Indian Himalayan region as a whole (13.3%). The population of scheduled tribes and other disadvantaged castes was higher in the rest of the rural Indian Himalayan region as a whole than in either of the two poorest states. The proportion of uneducated heads of household was significantly higher in rural Himalayan West Bengal (61%) than in rural Uttarakhand (50%) or the rural Indian Himalayan region as a whole (52%). The number of literate household members was also lower in the two states (66%) than in the rest of the rural Himalayan region as a whole (71%). These two factors affect employment opportunities and hence reduce household income.
Distribution of Consumption Quintiles in the Indian Himalayan Region
Table 16 shows the distribution of national total per capita consumption quintiles within the Indian Himalayan region in 2003. By definition, the percentage of the population in each quintile is the same over the country as a whole (20%); any variation in this distribution within a particular area indicates a difference in the distribution of wealth groups within that area compared to the whole country. There were small deviations in the distribution of consumption quintiles from the national average, with 3% less of the poorest group (1st quintile) and 3% more of the second poorest group, but the differences were not marked.

6 India
35
Contribution of Different Determinants of Poverty in Rural Uttarakhand, Rural Himalayan West Bengal, and the Rest of the Rural Indian HKH region
The previous section focused on identifying the poverty determinants that are specific to rural Uttarakhand and rural Himalayan West Bengal, this section considers the comparative impact of the different determinants on the overall poverty rate. Figure 15 shows the proportional impact of the different determinants of poverty in rural Uttarakhand, rural Himalayan West Bengal, and the rest of the rural Indian HKH region. In rural Uttarakhand, household composition (29%) and assets and liabilities (27%) contributed the most to overall poverty; in rural Himalayan West Bengal household composition was also the most important factor (48%) followed by assets and liabilities (17%); in the rest of the rural Indian HKH region, household composition also had the most impact on poverty (30%) followed closing by lack of access to basic facilities (29%). Although these determinants are not specific to this region, the different level of impact of the determinants and their significance need to be addressed to help development interventions to be effective.
0 10 20 30 40 50 60
Assets and liabilities
HH composition
Inaccessibility
Lack of access to basic facilities
Social status Rest of rural Indian HKH region average
Rural Indian Himalayan West Bengal
Rural Indian Uttarakhand
Source: ICIMOD analysis based on NSS 2003 datasets
Figure 15: Contribution of different determinants to povertyin rural Uttarakhand, rural Himalayan West Bengal the rest of the Indian rural HKH Region (%)
Table 16: Monthly per capita consumption quintiles in the Indian Himalayan region
MPCC quintilesPer capita consumption(INR)a
Population in Himalayan region(%)
1st <445 16.8
2nd 445 to 580 22.6
3rd 580 to 741 21.0
4th 741 to 1,022 20.7
5th >1,022 19.0
Total 100.0a Exchange rate in 2010: 44.4 INR (Indian Rupee) = 1 USD Source: ICIMOD analysis based on NSS 2003 datasets

Understanding Mountain Poverty in the Hindu Kush-Himalayas
36

7 Myanmar
37
7 Myanmar
For more than five decades, Myanmar has been subject to a political and economic crisis. As a result the country remains one of the poorest in Southeast Asia. A lack of adequate infrastructure and access to resources continues to affect millions of people. Lack of access to health and education services means that poverty remains one of the major challenges in the country. Similar to other country studies in this report, poverty in Myanmar is predominantly a rural phenomenon. This is particularly true for the remote and border areas. Agriculture is the dominant sector in these areas, accounting for over 50% of gross domestic product (UNDP 2007a). About 70% of the population lives in rural areas and the majority of rural households work in the primary sector, where inadequate land holdings hamper poverty alleviation (Kyaw and Routray 2006).
Myanmar is divided into three zones: western ranges, central plains, and eastern hilly regions. The mountainous Himalayan ranges of Myanmar lie mainly within four states: Chin and Rakhine in the northwest and Kachin and Shan in the northeast.
Data Source
Appropriate datasets could not be obtained and analysed for Myanmar. Therefore the analysis draws on available secondary research.
Country Profile
Myanmar is located in the eastern part of the Asian continent and is the largest country in Southeast Asia in terms of total land area. Myanmar shares borders with five countries, Bangladesh, China, India, Laos, and Thailand. The country is characterised by great diversity in terms of topography, ecological zones, ethnicity, and livelihood patterns.
Myanmar is one of the least developed nations in the world and one of the poorest in Southeast Asia. Myanmar was ranked 132 out of 169 countries in the Human Development Index (HDI) in 2010 (UNDP 2010a).
Total population 2009 49.8 millionLife expectancy at birth 2009 62 yearsAdult literacy rate 2006 92%
Source: World Bank 2009
Shan
Kachin
Sagaing
Chin
Bagu
Magwe
Karen
Rakhine
Mandalay
Kayah
Tanintharyi
Ayeyarwaddy
Mon
Yangon
±
0 200 400100
Kilometres
T H A I L A N D
I N D I A C H I N A
L A O S
I N D I A
Bay of Bengal
B A N G L A D E S H
Location map
Legend
HKH study focus area
HKH study area
HKH
Myanmar
Administrative map of Myanmar
Boundaries are for guidance only and do not imply any opinion concerning the legal status of any country or territory or the delimitation of its frontiers or boundaries.

Understanding Mountain Poverty in the Hindu Kush-Himalayas
38
In 2004/05, Myanmar conducted a nationwide Integrated Household Living Conditions Assessment (IHLCA) covering 18,660 households from both urban and rural areas across all 17 states and divisions. This was the first survey of its kind and provided data on living conditions, food poverty, overall poverty, and a wide range of socioeconomic indicators.
The methodology used by the Ministry of National Planning and Economic Development for the Living Standards Measurement Survey (LSMS) for IHLCA was similar to that used by UNDP, which is the same as for the other HKH countries in this report and thus allows a certain level of comparison.
The IHLCA assessment provided poverty estimates for Myanmar which are comparable at an international level. The survey covered areas such as living conditions, including monetary poverty (household income and expenditures) and related factors (agricultural, off farm, and urban activities; employment; and access to land, markets, and credit), health (health outcome as well as access, utilisation, and coverage of health interventions), education (access and attainment), housing conditions (including water and sanitation), gender disaggregated data, maternal and reproductive health, environmental concerns, and other dimensions of wellbeing relevant for Myanmar (UNDP 2011).
The IHLCA of 2004/05 provided national representative data to calculate a poverty line for Myanmar. The ‘cost of basic needs’ was used as the methodological approach to calculate two poverty lines: a food poverty line based on minimum food expenditures (the amount of kyats necessary to purchase a consumption basket that satisfies the caloric requirements of a household); and a total poverty line, which is a combination of minimum food expenditures and non-food expenditures to meet basic needs (UNDP 2011). Extensive analysis of the IHLCA is documented in three major reports from 2007 and 2008: Myanmar Poverty Profile (UNDP 2007b), MDG Relevant Information (UNDP 2007a), and Vulnerability Relevant Information (UNDP 2008b).
Poverty Trends
According to the IHLCA, the food poverty line for Myanmar in 2004/05 was 118,402 MMK per adult per year and the total poverty line was 162,136 MMK per adult per year (exchange rate: 6.5 MMK [kyat] = 1 USD) .The average poverty incidence for Myanmar was 32% with a significant urban-rural differential of 22% and 36%, respectively (UNDP 2011). The poverty levels in different states and divisions is discussed in the following, with particular emphasis on the four mountain states of Chin, Rakhine, Kachin, and Shan (divided into Shan North, South, and East).
Food poverty
The food poverty headcount index represents those individuals whose consumption is lower than the food poverty line. At national level, 10% of the population of Myanmar fell below the food poverty line; but there were large disparities between states/divisions as shown in Table 17 and Figure 16 (UNDP 2007b).
All mountain states had higher levels of food poverty than the rest of the country except for two states. Chin State had the highest food poverty headcount index in the country (40%), followed by Shan North and Shan East (21 and 20%); Kachin, Shan South, and Rakhine also had high levels of food poverty (14, 13, and 12%) (UNDP 2007b).
Total Poverty Headcount Index
The total poverty headcount index represents those individuals whose consumption is lower than the total poverty line. Households which fall under the national poverty line have insufficient means to cover basic food and non-food needs. At national level, the average poverty headcount index was 32%. As with food poverty, there were considerable disparities between states and divisions (Table 18).
Again, all mountain states had higher levels of poverty than in the rest of the country except for two states. Chin was the poorest state in terms of total poverty as well as food poverty, with about three-quarters of the population living

7 Myanmar
39
below the poverty line, followed by Shan East and North with poverty incidences of 52 and 51%, and Kachin with a poverty incidence of 44%.
Determinants of Poverty
The Poverty Profile (UNDP 2007b) presents an extensive empirical analysis of the determinants of poverty in Myanmar based on the data of the IHLCA 2004/05. Referring to the analytical framework used by UNDP, selected determinants of the analysis are presented below.
Access to basic facilities
The indicator ‘access to drinking water’ is defined as the proportion of the population with access to a safe drinking water source within one kilometre of the user’s dwelling (UNDP et al. 2007). On average, 62% of the Myanmar population has access to a safe drinking water source. Differences between rural and urban areas are substantial, with about 55% of the rural population having access to water compared to about 90% of the urban population. Access to drinking water is more difficult for poor households. Among the rural states, access to drinking water is a particular problem for mountainous Shan South and Rakhine, with only 46 and 34% of the population, respectively, having access to safe water.
Table 17: Food poverty headcount index (%)
Rural Urban Total
State/Division and Union Incidence (%) Rank Incidence (%) Rank Incidence (%) Rank
Chin 49 17 5 6 40 17Shan North 22 15 16 17 21 16Shan East 23 16 8 12 20 15Kachin 17 13 9 13 14 14Magwe 14 11 7 8 13 13Shan South 14 12 8 10 13 12Kayah 17 14 5 4 13 11Rakhine 13 9 7 9 12 10Tanintharyi 12 8 9 14 11 9Mandalay 13 10 6 7 11 8Ayeyarwaddy 10 7 9 15 10 7Sagaing 8 6 4 3 8 6Bago West 7 5 5 5 7 5Bago East 5 3 12 16 6 4Mon 4 2 8 11 5 3Yangon 5 4 4 2 4 2Kayin 2 1 0 1 2 1Note: Highlighted lines show the four Himalayan mountain states Data source: IHLCA 2004/05 cited in UNDP 2011
Source: adapted from UNDP 2007b
Boundaries are for guidance only and do not imply any opinion concerning the legal status of any country or territory or the delimitation of its frontiers or boundaries.
±
0 200 400100
Kilometres
Shan
Sagaing
Pegu
Kachin
Magwe
Mandalay
Chin
Irrawaddy
Tenasserim
Karen
Rakhine
Rangoon
Kayah
Mon
21 - 40
14 - 21
10 - 14
5 - 10
2 - 5
Headcount index
Figure 16: Food poverty headcount index (%)

Understanding Mountain Poverty in the Hindu Kush-Himalayas
40
Lack of access to improved sanitation is a concern for poor households throughout Myanmar. Overall, about 67% of households had access to improved sanitation, with 59% of poor households compared to 71% of non-poor households. The rate was higher in urban than rural areas (76 and 64% respectively), and particularly low in Shan East and Shan North (58%) and Rakhine (36%).
Access to electricity is also challenge all over the country. On average 38% of households had access to electricity, with 80% having access in urban areas and only 20% in rural areas. Similarly, 20% of poor households had access to electricity compared to 45% of non-poor households. The lowest access to electricity nationwide was in the mountain state of Chin where only 15% of households had access to electricity.
Agricultural assets and activities
The average area farmed per household is calculated from the total area farmed divided by the total number of agricultural households (UNDP 2007a). The index showed great differences across the country. During the rainy season, 2.8 ha (6.9 acres) are farmed on average per agricultural household. The smallest farmed areas were in the mountain states. In Chin, on average only 0.6 ha (1.5 acres) were farmed, followed by Shan East with 1.2 ha (2.9 acres) and Shan North with 1.5 ha (3.6 acres). Although the majority of the population of these states works in agriculture, the mountainous terrain makes access to farmland difficult. Analysis showed that there is a high correlation between average area farmed and poverty. Overall, the areas farmed by poor households were significantly lower than those of non-poor households (UNDP 2007a).
Overall, the average agricultural land ownership was 2.5 ha (6.1 acres). Land ownership also shows direct correlation with poverty (UNDP 2007a). On average, poor households owned much less land (1.7 ha, or 4.1 acres) compared to non-poor households (2.8 ha, or 6.9 acres). Land ownership was lowest in the mountain states, with 0.2 ha (0.6 acres) in Chin and 0.9 ha (2.2 acres) in Shan.
Table 18: Total poverty headcount index (%)
Rural Urban Total
S/D and Union Incidence (%) Rank Incidence (%) Rank Incidence (%) Rank
Chin 81 17 46 17 73 17
Shan East 56 16 37 15 52 16
Shan North 55 15 35 13 51 15
Kachin 47 14 38 16 44 14
Magwe 44 11 26 10 42 13
Shan South 44 12 26 11 40 12
Mandalay 45 13 24 7 39 11
Rakhine 41 10 26 9 38 10
Tanintharyi 37 8 21 3 34 9
Kayah 38 9 26 12 34 8
Bago West 34 7 23 6 33 7
Bago East 30 5 35 14 31 6
Ayeyarwaddy 30 6 24 8 29 5
Sagaing 27 4 22 4 27 4
Mon 21 3 23 5 22 3
Yangon 17 2 14 2 15 2
Kayin 12 1 8 1 12 1
Data Source: IHLCA 2004/05, cited in UNDP 2011

7 Myanmar
41
Household composition
As in other countries, household size in Myanmar was an important indicator of poverty. On average, poor households had 6.1 family members. The mountainous states had particularly large household numbers, with Rakhine, Kachin, and Chin all averaging about six members per household (UNDP et al. 2007).
In other parts of the HKH, having a female-headed household decreased the probability of falling below the poverty line, but the relationship was less significant in Myanmar. The proportion of poor households headed by women was only slightly lower than the proportion of non-poor households headed by women (18.3% compared to 19.1%) (UNDP 2007a). At national level, about 19% of households were female-headed with a higher proportion in urban than in rural areas. The lowest proportion of female-headed households was found in the mountain states of Chin, with about 10%, and Shan, with about 12%.
Similarly, the dependency ratio also has direct implications on falling below the poverty line in other parts of the HKH region, but was less important in Myanmar (UNDP 2007a). Dependency rates in the two mountain states Chin and Rakhine were the highest in the country at 0.7 compared to the national average of 0.58, but were still relatively low compared to the rest of the countries in the HKH region. In other words, the number of dependants per person belonging to the labour force is relatively low.
Social status
Having an educated head of household had a strong impact on poverty. Illiteracy rates for poor household heads were almost double those for non-poor household heads (UNDP (UNDP 2007a). Overall, about 20% of household heads were illiterate with a higher proportion in rural areas (23%) than in urban areas (11%). The lowest level of education of household heads was found in the mountain state of Shan (East), where 65% of household heads were not literate.

Understanding Mountain Poverty in the Hindu Kush-Himalayas
42

8 Nepal
43
8 Nepal
Nepal is the poorest country in South Asia and the 15th poorest country in the world (World Bank 2008). One in three people live in poverty and half of all children are malnourished. Inequalities based on ethnicity, caste, and religion exacerbate exclusion and poverty in the country.
Despite significant improvements in the socioeconomic indicators over the past two decades, poverty is still prevalent and widespread. There are considerable inequalities across geographic regions and ecological zones, and between urban and rural areas. Poverty in Nepal is influenced by many factors including high levels of illiteracy, poor health, and poor access to basic services. The level of social and economic infrastructure in Nepal is low even by South Asian standards. The concentration of public infrastructure in and around urban areas, and lack of basic services in most rural areas, is seen to be among the major determinants of poverty. In much of the hill and mountain areas, which makes up more than three-quarters of the country, the terrain aggravates the problems of access to essential services such as health, education, and livelihood support. As a result, the prevalence and intensity of poverty in these regions greatly exceeds the national average. In general, the Terai (plains) region is better equipped with social and economic infrastructure. Most parts of the Terai are linked to adjoining Indian towns by roads and the border is easily accessible allowing goods and services to flow freely from India. As a result, the range of income and employment opportunities available in the plains is broader than in most parts of the hills and mountains. In addition, Prennushi (1999) suggests that the rural poor in Nepal suffer not only from an insufficient level of educational and health services, but also from the relatively poor quality and high cost of the services that are available. Significant parts of the population can be described as poor overall, and extremely poor in terms of food poverty.
Country Profile
Nepal is a landlocked country bordered by China to the north and India to the south, east, and west. It is divided into three ecological zones – the plains (Terai) along the southern belt, the hills (Pahad) in the centre, and the mountains (Himal) along the northern belt.
Agriculture is the major driver of the economy, contributing 34% of GDP in 2007, and employing two-thirds of the workforce. Nepal was ranked 138 out of 169 countries in the Human Development Index (HDI) in 2010 and is the poorest country in the South Asian region (UNDP 2010a).
Total population 2009* 29 millionPopulation living below the poverty line** 9 millionLife expectancy at birth 2009* 67 yearsAdult literacy rate 2009* 59%
Source: *World Bank 2009; **ICIMOD estimates based on NLSS 2003/04 datasets
±
0 100 20050
Kilometres
C H I N A
Location map
HKHBhutan
I N D I A
Mountain region
Hill region
Terai regionMountain region
Legend
HKH study focus area
HKH study area
Administrative map of Nepal
Boundaries are for guidance only and do not imply any opinion concerning the legal status of any country or territory or the delimitation of its frontiers or boundaries.

Understanding Mountain Poverty in the Hindu Kush-Himalayas
44
In 1995/96, 41% of the population was living below the poverty line. This figure dropped to 31% in 2003/04, but the reduction was not consistent across the country; the decline in the mid and far-western hills and mountains was less than the national average.
The geographical diversity, and the three clearly identified regions of mountains, hills, and plains, provided a model case for this analysis, with a scenario for differentiating the determinants of poverty in the mountains and hills compared to the plains and identifying the factors that lead to such disparities.
Data Source
The poverty analysis was based on data collected by the Central Bureau of Statistics for the Nepal Living Standards Surveys (NLSS) in 1995/96 and 2003/04. These nationwide representative surveys covered 3,373 households in 1995/96 and 3,913 households in 2003/04. The surveys included information on the socioeconomic characteristics of each household member, agriculture and livestock, and household expenditure, as well as other information.
The analysis measured poverty by total annual consumption per head (in Nepali rupees). In Nepal, the basket of goods and the value of the goods (poverty line) are defined by the Central Bureau of Statistics.
Poverty Trends in the Mountains and Hills
In Nepal significant parts of the population can be described as absolute poor. This was still true following the relatively strong reduction of poverty in the eight years between the surveys. However, the differentiation for regions shows that not all parts of the country are affected with the same intensity (Table 19 and Figure 17a). The rate of total poverty declined nationally from 42 to 31% between 1995/96 and 2003/04; with a 32% reduction in the plains and 16% in the mountains and hills. In other words, the mountain and hill areas are by far poorer than the rest of the country and this difference in the poverty rates has increased. While food poverty declined in the mountain and hills (as in the rest of the country), non-food poverty increased slightly.
Table 19: Population living below the total poverty line 2003/04 (%)
Mountains and hills average 40
Plains average 28
Nepal average 31Source: ICIMOD analysis based on NLSS 2003/04 datasets
Source: ICIMOD analysis based on NLSS 1995/96 and 2003/04 datasets
Figure 17: Population living below the poverty line in Nepal (%)
0
10
20
30
40
50
60
1995/96 2003/04
a) Total poverty
0
10
20
30
40
50
60
1995/96 2003/04
b) Food poverty
0
10
20
30
40
50
60
1995/96 2003/2004
Mountains and Hills TeraiKTM ValleyNepal average
c) Non-food poverty

8 Nepal
45
Food poverty
Food poverty was measured by selecting a minimum nutritional calorie intake requirement, choosing an appropriate food basket, scaling the quantities to correspond to the calorie requirements of an individual, and calculating the cost of the basket. The proportion of people living below the food poverty line dropped from close to 48% to 32% between 1995/96 and 2003/04, but the level of food poverty overall was still significantly high and there were marked disparities within the country (Figure 17b). Food poverty was still much higher in the mountains and hills and much lower in the Kathmandu Valley (38 and 13% compared to 32% in the country overall).
Non-food poverty
The non-food poverty line was constructed by estimating the cost of consuming a basic set of non-food items for a household. The national average of non-food poverty declined by 14% between 1995/96 and 2003/04, much less than the decline in food poverty. In 2003/04, more than one-third of the population was unable to purchase basic non-food items and services (Figure 17c). The decrease was non-uniform, with a marked decrease in the plains but slight increase in the mountains and hills, where close to half of the population was unable to purchase basic non-food items. In other words, the inequality in terms of non-food poverty is increasing.
Differences Within the Mountains and Hills
The analysis also looked at differences within the mountain and hill areas. Considerable differences were observed in the distribution of food, non-food, and total poverty across the region with greater differences in the separate food and non-food indicators. Some regions had higher than average food poverty, but lower non-food poverty, and some vice versa, effectively reducing the differences in total poverty. For example, in the central mountains, non-food poverty was twice as high as food poverty, while in the far-west mountains, food poverty was 30% higher than non-food poverty. In terms of total poverty (Figure 18), two mountain and two hill regions had rates at or slightly below the national average, and five had rates above the national average. These differences show the complexity of poverty in mountain and hill areas. Several drivers influenced the variation. For example, the central hills include the Kathmandu Valley with the capital city; tourism plays an important role and provides wider employment opportunities in the eastern mountains; and dispersed populations and a high degree of isolation contribute to higher rates of poverty in the western hills.
Determinants of Poverty in the Mountains and Hills
The distribution of the determinants of poverty in the different regions was analysed to help understand which components contribute to the higher rates of poverty in the mountains and hills. The results, summarised in Table 20, show that most poverty determinants were higher in the mountain and hill regions, and only a few were higher in the plains. The combination of these determinants, rather than any one factor alone, is believed to lead to the poverty in the mountain and hill regions. The individual components are discussed here.
Access to basic facilities
Multivariate analysis indicated that lack of access to basic facilities is a strong predictor for poverty in Nepal. The factor for basic facilities combined three indicators (access to water, toilet facilities, and electricity). The mean (basic facility factor) for the
0 10 20 30 40 50 60
Far-western Hills
Eastern Hills
Mid-western Hills
MId-western Mountains
Mountain and hills average
Central Mountains
Nepal average
Far-western Mountains
Central Hills
Eastern Mountains Western Hills
Figure 18: Population living in total poverty within the mountains and hills of Nepal
Source: ICIMOD analysis based on NLSS 1995/96 and 2003/04 datasets
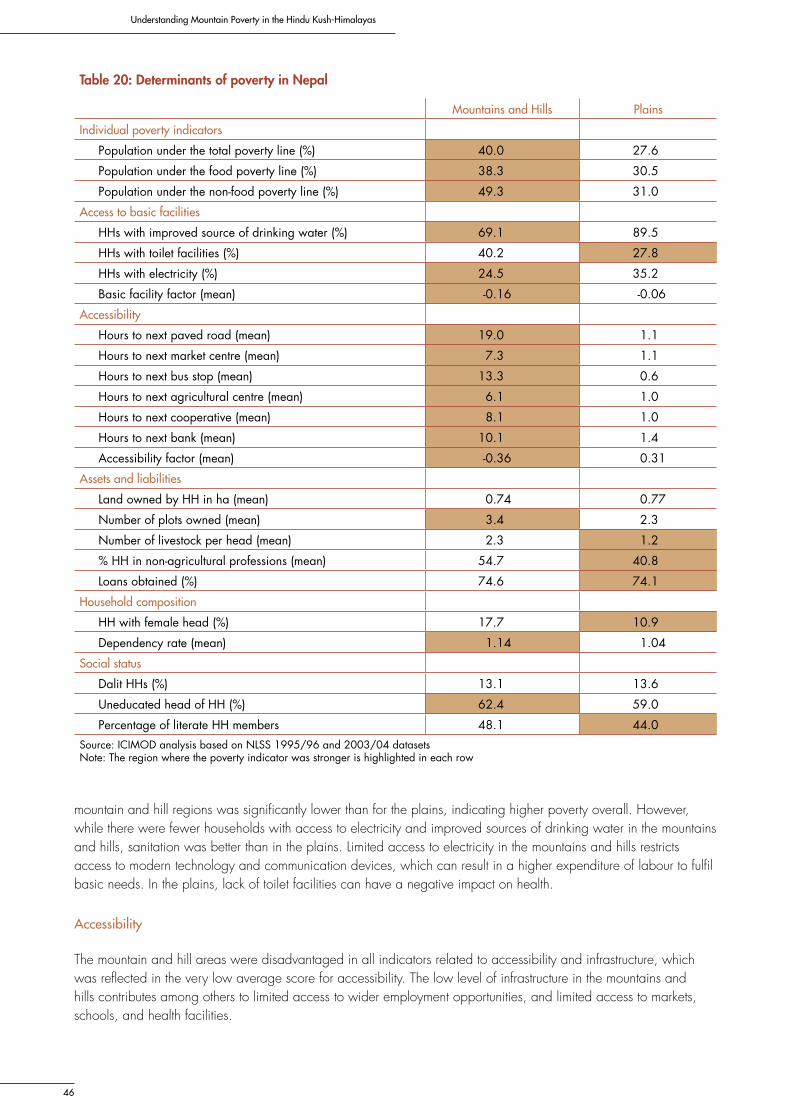
Understanding Mountain Poverty in the Hindu Kush-Himalayas
46
mountain and hill regions was significantly lower than for the plains, indicating higher poverty overall. However, while there were fewer households with access to electricity and improved sources of drinking water in the mountains and hills, sanitation was better than in the plains. Limited access to electricity in the mountains and hills restricts access to modern technology and communication devices, which can result in a higher expenditure of labour to fulfil basic needs. In the plains, lack of toilet facilities can have a negative impact on health.
Accessibility
The mountain and hill areas were disadvantaged in all indicators related to accessibility and infrastructure, which was reflected in the very low average score for accessibility. The low level of infrastructure in the mountains and hills contributes among others to limited access to wider employment opportunities, and limited access to markets, schools, and health facilities.
Table 20: Determinants of poverty in Nepal
Mountains and Hills Plains
Individual poverty indicators
Population under the total poverty line (%) 40.0 27.6
Population under the food poverty line (%) 38.3 30.5
Population under the non-food poverty line (%) 49.3 31.0
Access to basic facilities
HHs with improved source of drinking water (%) 69.1 89.5
HHs with toilet facilities (%) 40.2 27.8
HHs with electricity (%) 24.5 35.2
Basic facility factor (mean) -0.16 -0.06
Accessibility
Hours to next paved road (mean) 19.0 1.1
Hours to next market centre (mean) 7.3 1.1
Hours to next bus stop (mean) 13.3 0.6
Hours to next agricultural centre (mean) 6.1 1.0
Hours to next cooperative (mean) 8.1 1.0
Hours to next bank (mean) 10.1 1.4
Accessibility factor (mean) -0.36 0.31
Assets and liabilities
Land owned by HH in ha (mean) 0.74 0.77
Number of plots owned (mean) 3.4 2.3
Number of livestock per head (mean) 2.3 1.2
% HH in non-agricultural professions (mean) 54.7 40.8
Loans obtained (%) 74.6 74.1
Household composition
HH with female head (%) 17.7 10.9
Dependency rate (mean) 1.14 1.04
Social status
Dalit HHs (%) 13.1 13.6
Uneducated head of HH (%) 62.4 59.0
Percentage of literate HH members 48.1 44.0Source: ICIMOD analysis based on NLSS 1995/96 and 2003/04 datasets Note: The region where the poverty indicator was stronger is highlighted in each row
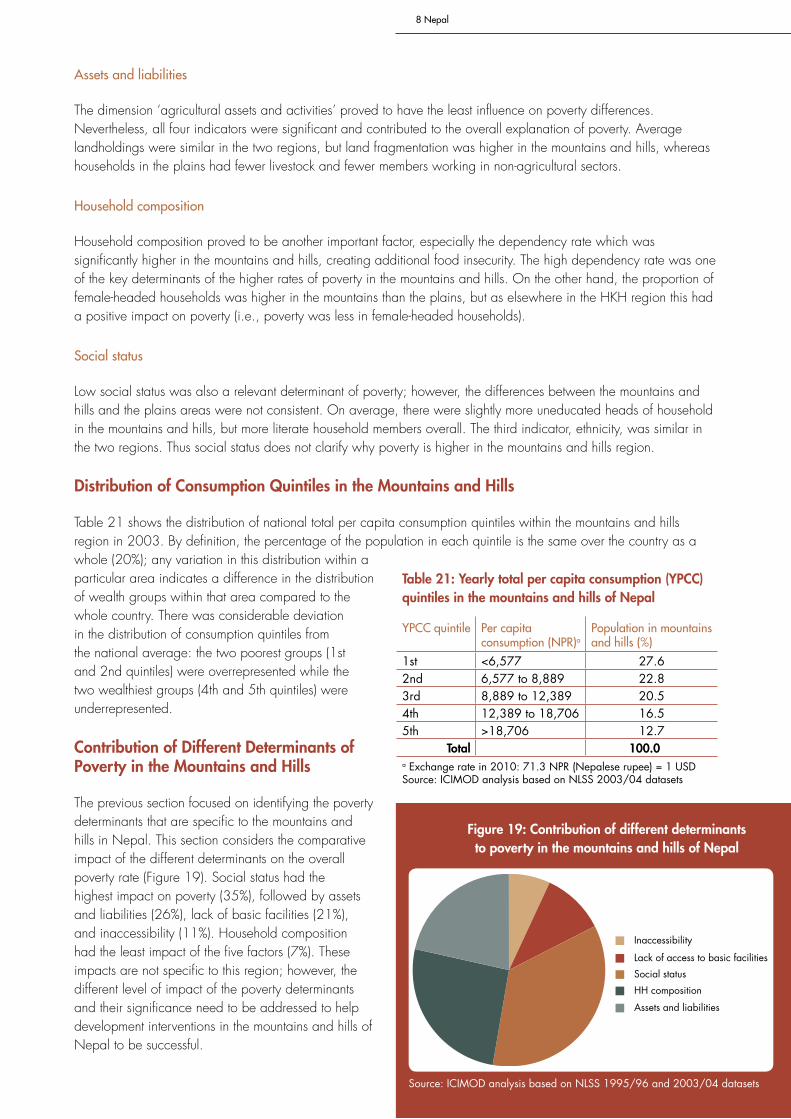
8 Nepal
47
Assets and liabilities
The dimension ‘agricultural assets and activities’ proved to have the least influence on poverty differences. Nevertheless, all four indicators were significant and contributed to the overall explanation of poverty. Average landholdings were similar in the two regions, but land fragmentation was higher in the mountains and hills, whereas households in the plains had fewer livestock and fewer members working in non-agricultural sectors.
Household composition
Household composition proved to be another important factor, especially the dependency rate which was significantly higher in the mountains and hills, creating additional food insecurity. The high dependency rate was one of the key determinants of the higher rates of poverty in the mountains and hills. On the other hand, the proportion of female-headed households was higher in the mountains than the plains, but as elsewhere in the HKH region this had a positive impact on poverty (i.e., poverty was less in female-headed households).
Social status
Low social status was also a relevant determinant of poverty; however, the differences between the mountains and hills and the plains areas were not consistent. On average, there were slightly more uneducated heads of household in the mountains and hills, but more literate household members overall. The third indicator, ethnicity, was similar in the two regions. Thus social status does not clarify why poverty is higher in the mountains and hills region.
Distribution of Consumption Quintiles in the Mountains and Hills
Table 21 shows the distribution of national total per capita consumption quintiles within the mountains and hills region in 2003. By definition, the percentage of the population in each quintile is the same over the country as a whole (20%); any variation in this distribution within a particular area indicates a difference in the distribution of wealth groups within that area compared to the whole country. There was considerable deviation in the distribution of consumption quintiles from the national average: the two poorest groups (1st and 2nd quintiles) were overrepresented while the two wealthiest groups (4th and 5th quintiles) were underrepresented.
Contribution of Different Determinants of Poverty in the Mountains and Hills
The previous section focused on identifying the poverty determinants that are specific to the mountains and hills in Nepal. This section considers the comparative impact of the different determinants on the overall poverty rate (Figure 19). Social status had the highest impact on poverty (35%), followed by assets and liabilities (26%), lack of basic facilities (21%), and inaccessibility (11%). Household composition had the least impact of the five factors (7%). These impacts are not specific to this region; however, the different level of impact of the poverty determinants and their significance need to be addressed to help development interventions in the mountains and hills of Nepal to be successful.
Table 21: Yearly total per capita consumption (YPCC) quintiles in the mountains and hills of Nepal
YPCC quintile Per capita consumption (NPR)a
Population in mountains and hills (%)
1st <6,577 27.62nd 6,577 to 8,889 22.83rd 8,889 to 12,389 20.54th 12,389 to 18,706 16.55th >18,706 12.7
Total 100.0a Exchange rate in 2010: 71.3 NPR (Nepalese rupee) = 1 USD Source: ICIMOD analysis based on NLSS 2003/04 datasets
Figure 19: Contribution of different determinants to poverty in the mountains and hills of Nepal
Source: ICIMOD analysis based on NLSS 1995/96 and 2003/04 datasets
Inaccessibility
Lack of access to basic facilities
Social status
HH composition
Assets and liabilities
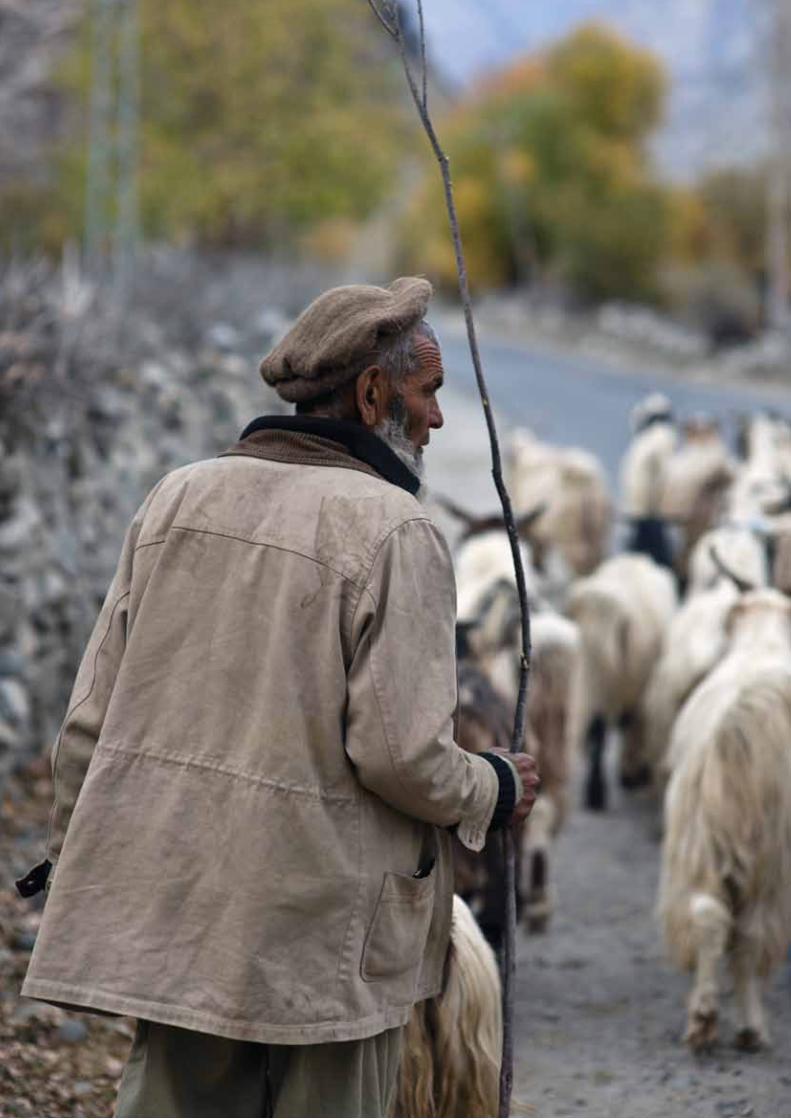
Understanding Mountain Poverty in the Hindu Kush-Himalayas
48

9 Pakistan
49
9 Pakistan
Poverty is widespread in Pakistan and is particularly predominant in rural areas. Nearly one quarter of the population lives below the poverty line, almost 43 million people across the country. Two-thirds of the population, and 80% of the country’s poor, live in rural areas and depend on agriculture as the prime source of income (World Bank 2007). Poverty is widespread in the many mountainous parts of the country where communities are small, scattered, and isolated. The rugged terrain and fragile ecosystems together with lack of access to markets and services make cultivation and agriculture difficult and contribute to chronic poverty in these areas. Additional causes of poverty include lack of education, poor access to health services, high dependency rates, gender discrimination, vulnerability to environmental degradation, and deterioration of the natural resource base. Although women play a major role in the household economy and in caring for their families, they are particularly vulnerable. Women own fewer assets, and have limited economic options and less access to social services.
Since 2008, a rapid rise in prices for basic food commodities coupled with the deteriorating economic and political situation have aggravated poverty in the country. It is estimated that more than 12 million to 14 million people may have fallen below the poverty line in Pakistan as a result of the high cost of food and fuel prices (State Bank of Pakistan 2009). Furthermore, in the wake of floods in 2010 which affected 20 million people across Pakistan and severely damaged infrastructure and agricultural land, it is probable that a larger number of the population has fallen into poverty since 2010. As agriculture provides employment to over 80% of the rural poor, it is further thought that households solely involved in this sector have been and will continue to be affected in the coming years.
Country Profile
Pakistan is the sixth most populous country in the world, with over 169 million inhabitants. It was ranked 127 of 169 countries in the Human Development Index in 2010 (UNDP 2010). Health and education indicators remained low in comparison with other countries in South Asia and socioeconomic indicators for women were the lowest anywhere in the sub-region.
Total population 2009* 169 millionPopulation living below the poverty line** 42 millionLife expectancy at birth 2009* 67 yearsAdult literacy rate 2008 56%
Source: *World Bank 2009; **ICIMOD analysis based on PSLM 2005/06 datasets
Administrative map of Pakistan
Sind
Balochistan
Punjab
FATA
Gilgit Baltistan
Khyber Pakhtunkhwa
AJKIslamabad
±
0 250 500125
Kilometres
A F G H A N I S T A N
I N D I A
Arabian Sea
I R A N
C H I N A
P A K I S T A N
Location map
HKHPakistan
Legend
HKH study focus area
HKH study area
HKH, data not available
Boundaries are for guidance only and do not imply any opinion concerning the legal status of any country or territory or the delimitation of its frontiers or boundaries.

Understanding Mountain Poverty in the Hindu Kush-Himalayas
50
Data Source
The analysis was based on data collected by the Federal Bureau of Statistics of Pakistan for the Pakistan Social and Living Standards Measurement Survey (PSLM) 2005/06. The nationwide representative survey covered 15,450 households. The PSLM survey includes information on the socioeconomic characteristics of each household member, household expenditure, and agriculture and livestock. The Rural Community Survey 2005/06, which covered 570 communities, was used for information about infrastructure and access to services and basic facilities.
Poverty Trends
Table 22 shows the poverty rates in mountain and non-mountain rural and urban areas and in Pakistan overall. Approximately 25% of Pakistan’s population was living below the poverty line, with a higher proportion in the mountain areas (32% of the population, or 11 million people), and lower in the plains (24%). The poverty rate was lower overall in urban areas than in rural areas (13% compared to 31% respectively), but considerably higher in urban mountain areas than in urban plains areas, in line with the overall trend. The rural mountains had the largest proportion of the population living below the poverty line (34%).
Differences Within the Mountain Region
Considerable differences were observed within the mountain and hill area (Figure 20), with the three divisions of Hazara, Kohat, and Quetta better off than the mountain average, and the three divisions of Makran, Kalat, and Zhob considerably worse off. Kalat and Zhob had almost twice the proportion of households living below the poverty line as the mountain average (58 and 60% compared to 32% overall) and close to four times the proportion in the best off division of Hazara (15%).
Determinants of Poverty in the Mountains
The distribution of the determinants of poverty in the different regions was analysed to help understand which components contribute to the higher rates of poverty in the mountains. The results, summarised in Table 23, show that most poverty determinants were higher in rural mountain areas than in the rural plains. The individual components are discussed here.
Access to basic facilities
Overall the basic facilities had a strong positive effect on wellbeing. The households in rural mountain areas had better access to basic facilities than those in the plains. It is likely that the poorer access to sanitation, drinking water, and other services in the plains can be explained by the rapid influx of people to both rural and urban plains areas which is burdening infrastructure provision (Ali 2005). Furthermore, more people in the mountains have access to electricity because there are a large number of small-scale hydroelectric generators in these areas operated by local individuals and local community groups. In the plains, the population is solely dependent on electricity provided by the government (Gazdar 2007).
Table 22: Population living below the poverty line (%)
Mountains average 32
Urban mountains 20
Rural mountains 34
Plains 24
Urban plains 12
Rural plains 30
Pakistan 25
Urban Pakistan 12
Rural Pakistan 31Source: ICIMOD analysis based on PSLM 2005/06 datasets
0 10 20 30 40 50 60
Zhob
Kalat
Makran
Makaland
Mountains average
Quetta
Kohat
Hazara
Figure 20: Population living in poverty within the mountain region of Pakistan (%)
Source: ICIMOD analysis based on PSLM 2005/06 datasets

9 Pakistan
51
Accessibility
Poor access increased the probability of falling below the poverty line. All the indicators of inaccessibility were higher in the rural mountains. Rural mountain people had to travel 14 km on average to use a phone, compared to less than 2 km in the rural plains, and 11 km to a mill, compared with less than 1 km in the plains.
Assets and liabilities
Agricultural assets explained 3% of the probability of falling below the poverty line. The value of livestock per head had a negative effect on poverty. Livestock assets equivalent to PKR 1,000 in market value lowered the risk of falling below the poverty line by 1%. However, the amount of land owned per head had no significant impact.
Household composition
Having a woman head of household decreased the probability of falling below the poverty line by 22%. This may be partly because female-headed households are more likely to receive remittances from migrant members. There were more female-headed households in the rural mountains (11%) than the rural plains (9%), possibly because lack
Table 23: Determinants of poverty in Pakistan
Rural mountains Rural plains
Individual poverty indicators
Population under the total poverty line (%) 33.7 30.3Access to basic facilities
Population with improved source of drinking water (%) 56.3 41.5Population with improved toilet facilities (%) 60.2 55.6Population with electricity (%) 20.3 12.2Basic facility factor (mean) -0.15 -0.37
Accessibility
Distance to nearest bank in km (mean) 27.8 9.2Distance to nearest fertiliser depot in km (mean) 26.3 8.5Distance to nearest mill in km (mean) 11.2 0.9Distance to nearest place to use a phone in km (mean) 14.3 1.7Distance to nearest post office in km (mean) 17.0 5.0Distance to nearest railway station in km (mean) 208.0 27.7Distance to nearest tractor rental in km (mean) 8.1 0.8Distance to nearest union council in km (mean) 11.0 5.0Accessibility factor (mean) -0.57 0.27
Assets and liabilities
Owned land in ha per head (mean) 1.49 0.94Value of livestock per head in PKRa (mean) 2,184 6,832
Household composition
HH with female head (%) 11.0 9.1Dependency rate (mean) 1.21 1.17Percentage of HH members in non-agricultural professions (mean) 25.4 25.9
Social status
Uneducated head of HH (%) 60.7 56.0Head of HH with primary education (%) 20.3 27.0Head of HH with secondary education (%) 14.3 14.3Head of HH with higher education (%) 4.7 2.7Percentage of literate HH members > 5 years (mean) 42.0 40.8
a Exchange rate in 2010: 86 PKR (Pakistani rupee) = 1 USD

Understanding Mountain Poverty in the Hindu Kush-Himalayas
52
of alternative opportunities encourages more men to migrate for work. Having a high number of dependents within a household puts additional strain on the earners; high dependency rates increased the probability of falling below the poverty line by 15%, but the dependency rate was only slightly higher in the rural mountains than elsewhere. In conrast with other countries in the region, having household members engaged in non-agricultural occupations did not influence the probability of falling below the poverty line.
Social status
There were more uneducated heads of household in rural mountains than in the rural plains. Access to schooling is more restricted in the mountain areas, and poor households are often faced with the difficult choice between spending on schooling and covering other basic household needs. As in other countries in the region, there is also an opportunity cost in sending children to school instead of using their time to help out with the household and agricultural workload (Mughal 2007). Having a household with no literate household members increased the probability of falling below the poverty line by 21% compared to a household with one or more literate members, while a household headed by a person with secondary education was 10% less likely to fall below the poverty line compared to one with an uneducated head of a household. The education of the head of the household has a direct positive impact on reducing poverty as it helps in the fulfilment of basic needs such as water, sanitation, utilisation of health facilities, and shelter, and also affects women’s behaviour in fertility decisions and family planning.
Distribution of Consumption Quintiles in the Mountain Areas
Table 24 shows the distribution of national total per capita consumption quintiles within the mountain area of Pakistan in 2005/06. By definition, the percentage of the population in each quintile is the same over the country as a whole (20%); any variation in this distribution within a particular area indicates a difference in the distribution of wealth groups within that area compared to the whole country. There was considerable deviation in the distribution of consumption quintiles from the national average: the two poorest groups (1st and 2nd quintiles) were overrepresented while the two wealthiest groups (4th and 5th quintiles) were underrepresented.
Contribution of Different Determinants of Poverty in the Mountains
The previous section focused on identifying the poverty determinants that are specific to the mountains in Pakistan. This section considers the comparative impact of the different determinants on the overall poverty rate in the mountains (Figure 21). Household composition had the highest impact on poverty (42%), which was a direct result of the high dependency rate; followed by social status (31%), mainly reflecting the number of uneducated heads of household. These were followed by inaccessibility (17%), assets and liabilities (6%), and lack of access to basic facilities (4%). These impacts are not specific to the mountain region; however, the different level of impact of the poverty determinants and their significance need to be addressed to help development interventions in the area to be successful.
Table 24: Monthly total per head consumption quintiles in the mountains of Pakistan in 2005/06
MPCC quintile Per capita consumption(PKR)a
Proportion of mountain population(%)
1st <884 26.0
2nd 884 to 1,146 24.3
3rd 1,146 to 1,494 19.0
4th 1,494 to 2,113 17.4
5th >2,113 13.3
Total 100.0a Exchange rate in 2010: 86 PKR (Pakistani rupee) = 1 USDSource: ICIMOD analysis based on PSLM 2005/06 datasets
Source: ICIMOD analysis based on PSLM 2005/06 datasets
Figure 21: Contribution of different determinants to poverty in the mountain region of Pakistan (%)
InaccessibilityLack of access to basic facilitiesSocial statusHH compositionAssets and liabilities

10 Regional Overview
53
10 Regional Overview
Distribution of Poverty in the Hindu Kush-Himalayan Region
The poverty profile of the different countries in the region and their mountainous parts is summarised in Table 25, which shows the population figures and the proportion of the population identified as living below the poverty line.
Comparison of the values given in the table, and total approximations are based on broad assumptions as the methodologies used to estimate the poverty line varies in different countries and population figures and the percentage of the poor below the poverty line were also extracted from different sources referring to different years and were thus not strictly comparable. Nevertheless they are sufficiently similar to allow a broad overview to be made.
Approximately 2.9 billion people lived in the eight countries of the Hindu Kush-Himalayan region in 2009, out of which an estimated 771 million were living below the national poverty lines. Approximately 200 million people live in the HKH portion of these countries, of whom some 61 million people were below the poverty line. On average 31% of the HKH population (excluding China and Myanmar) was below the poverty line compared to 26% of the population of the countries as a whole.
Bangladesh had the highest proportion of poor people in the mountain areas (46%) followed by Afghanistan (42%), Nepal (40%), India (34%), Pakistan (32%), and Bhutan (23%). In all cases except India, poverty rates were higher in the HKH areas than in the country as a whole (Figure 22). In absolute numbers, the Indian Himalayan region had the most poor people residing in the mountain areas (24 million) followed by Pakistan (12.5 million), Afghanistan (11.3 million), Nepal (4.7 million), Bangladesh (0.6 million), and Bhutan (0.19 million).
Table 25: Regional poverty profile
Total population(million)
Population below the poverty linea (millions)
Population below the poverty line (%)
Whole country*
HKH part** Whole country
HKH part Whole country
HKH part
Afghanistan 2010 24.5 15.1 8.0 6.3 33 42
Bangladesh 2009 162 1.33 59.9 0.6 37 46
Bhutan 2009b 0.69 0.69 0.19 0.19 23 23
China 2009 1,331 29.4 220 na 16.6 na
India 2009 1,155 72.3 415 24 36 34
Myanmar 2009 49.8 11 15.9 na 32 na
Nepal 2009 29.3 11.8 9 4.7 31 40
Pakistan 2009 169.7 39.3 42.4 12.5 25 32
HKH region total/ average 2,921 181 771 61c 26 31d
Sources: *Total population from World Bank 2009 except Afghanistan, from the Central Statistics Organisation of Afghanistan; **HKH population from G Rasul (personal communication) updated from ICIMOD estimates (www.icimod.org/?q=1137); portion of population below the poverty line from ICIMOD analysis based on NLSS 2003/04, BLSS 2007, NSS 2003, PSLM 2005/06, HIES 2005/06 and NRVA 2007/08, except for China and Myanmar from secondary sources given in the relevant chapters a Note: The figures for the population below the poverty line are based on estimates and provide an overview only b Bhutan lies entirely within the HKH, thus the figures for the country and the HKH part are the same.c Accurate figures were not available for China and Myanmar, figures were estimated using the same value for the proportion of the population below the poverty line as for each country overall. This is likely to be an underestimate.d Average of those known and excluding China and Myanmar

Understanding Mountain Poverty in the Hindu Kush-Himalayas
54
Table 26 shows the distribution of the per capita consumption quintiles found within the mountain areas of each country. By definition, the percentage of the population in each quintile is the same over the country as a whole (20%) and any deviation from this indicates a difference in the distribution of wealth groups within the mountain area compared to the whole country.
The two poorest quintiles together were overrepresented in all seven of the mountain areas considered, and each was overrepresented individually except in Bangladesh, where the poorest group was underrepresented. In three areas, the proportion of the poorest group was close to or more than 50% higher than in the country as a whole. Both the two wealthiest quintiles were underrepresented in all areas, with the proportion of the wealthiest quintile in Himalayan West Bengal only a quarter of that in the country as a whole.
Mountain Specificity of Determinants of Poverty
Similarities between the findings for the seven study areas (in six countries) were examined in order to identify specificities of mountain poverty. Table 27 summarises which of the five dimensions of the analytical framework were prominent in each of the study areas (marked with X) as compared to other parts of the same country.
0 5 10 15 20 25 30 35 40 45 50
Bangladesh
Afghanistan
Nepal
India
Pakistan
HKH region
Bhutan National average
Mountain region
Figure 22: Population below the poverty line in countries of the Hindu Kush-Himalayan region (%)
Table 27: Mountain specific determinants of poverty
Access to basic facilities
Accessibility Assets and liabilities
Household composition
Social status
Afghanistan mountains X X X
Bangladesh mountains X na X
Eastern Bhutan X X X X
Rural Uttarakhand X X X
Rural Himalayan West Bengal X X X
Nepal mountains and hills X X X
Rural Pakistan mountains X XSource: ICIMOD analysis based on NLSS 2003/04, BLSS 2007, NSS 2003, PLSM 2005/06, HIES 2005/06, NRVA 2007/08 datasets
Table 26: Distribution of per capita consumption quintiles (% of the population)
1st quintile 2nd quintile 3rd quintile 4th quintile 5th quintile
Afghanistan mountains 26.9 23.4 20.2 16.3 13.2
Bangladesh mountains 10.6 32.8 27.1 17.0 12.5
Eastern Bhutan 31.1 26.6 19.4 14.0 8.9
Nepal mountains and hills 27.6 22.8 20.5 16.5 12.7
Pakistan mountains 26.0 24.3 19.0 17.4 13.3
Uttarakhand 29.1 23.3 18.6 14.0 15.0
Himalayan West Bengal 33.6 30.0 17.3 14.7 4.4Source: ICIMOD analysis based on NLSS 2003/04, BLSS 2007, NSS 2003, PLSM 2005/06, HIES 2005/06, NRVA 2007/08 datasets

10 Regional Overview
55
Lower access to basic facilities was a common determinant of poverty in all of the study areas except Pakistan. This confirms the link between high levels of remoteness and low levels of public and private investment with a high incidence of poverty. In many less-favoured remote areas, low population densities drive up the costs of extending physical infrastructure and providing basic services in comparison with densely populated urban areas, where there is also more effective lobbying for investment.
Poor accessibility was also a determinant of poverty in all areas except Rural Himalayan West Bengal. Inadequate physical infrastructure restricts access to markets and results in political, social, and economic marginality. Thus the link between poverty and inaccessibility is associated with limited economic opportunities due to lack of infrastructure and connectivity to wider markets. Poor infrastructure is a common characteristic of the poorest areas in the HKH region.
Unfavourable household composition (specifically high dependency rates), social status, and assets and liabilities were all determinants of poverty in three of the seven study areas. In the poorest areas, household members who belong to the labour force have to support a relatively high number of dependents. This not only intensifies the workload on the bread winner, it also places stress on household resources. The pressure on those who do work is intensified by the lack of job opportunities in these remote parts.
Contribution of Different Determinants of Poverty
The previous section focused on identifying which poverty determinants are specific to mountain areas. This section focuses on the comparative impact of the major determinants of poverty in the seven study areas. These impacts are not specific to mountain areas; however, the different level of impact of the poverty determinants and their significance need to be addressed to help development interventions within the mountain context to be successful.
Figure 23 shows the overall proportional contribution of the different determinants of poverty in the different study areas in the HKH region. The mountain specific determinants of poverty – lack of access to basic facilities, poor accessibility, and household composition – were significant contributors to poverty in most of the study areas.
It is often assumed that high levels of mountain poverty are likely to be a direct result of inaccessibility. However, the empirical analysis given here shows that social status, access to basic facilities, and household composition are also determining factors across the HKH region; hence, a focus on improving conditions on these determinants may have a greater impact on poverty alleviation than a sole emphasis on infrastructure development.
The overall impact of the dimension ‘household composition’ played a significant role in explaining poverty especially in the mountain areas of Afghanistan and rural Himalayan West Bengal (both 48%), closely followed by mountain areas of Bangladesh (46%) and Pakistan (42%). In rural Uttarakhand (29%) and the mountains and hills of Nepal (25%) the impact of this dimension on poverty was also quite significant.
0 20
40 60
80
100
Pakistan rural mountains
Pakistan rural plains
Nepal mountains
Nepal plains
India-rural Himalayan West Bengal
India-rural Uttarakhand
Bhutan-Eastern Region
Rest of Bhutan
Bangladesh mountains
Bangladesh plains
Afghanistan mountains
Afghanistan plains
Access to basic facilities Accessibility Assets and liabilities
HH composition
Social status
Figure 23: Regional comparison of the impact of different determinants of poverty (%)
Source: ICIMOD analysis based on NLSS 1995/96, 2003/04; BLSS 2007; NSS 2003; NRVA 2007/08; PLSM 2005/06; HIES 2005/06 datasets

Understanding Mountain Poverty in the Hindu Kush-Himalayas
56
Assets and liabilities played a more important role in explaining mountain poverty than the combined effect of accessibility and access to basic facilities (with the exception of Pakistan and rural Himalayan West Bengal). The impact was highest in eastern Bhutan (31%), followed by Afghanistan (28%), rural Uttarakhand (27%), and Nepal (21%). The influence of ‘social status’ was not evenly distributed, with a contribution ranging from 43% in Eastern Bhutan, to 35% in Nepal, 33% in the mountain areas of Bangladesh, and 31% in Pakistan, to as low as 11% in rural Uttarakhand, 8% in rural West Bengal, and 3% in Afghanistan.
Lack of access to basic facilities contributed the most in eastern Bhutan (20%) and least in in Pakistan (4%) with some slight variations among the other mountain areas in between. Poor accessibility had the highest impact on poverty in rural Uttarakhand (18%) and the least in eastern Bhutan (5%).

11 Conclusion
57
11 Conclusion
Cohesive information is lacking on the socioeconomic status of the around 211 million people who reside in the greater Himalayan region. The reasons for the disparities that exist between mountain and non-mountain areas, as well as within the mountain system, have not yet been fully explored. The specificities of mountain poverty are not well understood, thus poverty alleviation for mountain people may be inappropriately addressed.
The overall aim of this report was to identify, understand, and statistically substantiate the specificity of mountain poverty. Livelihood survey data from Afghanistan, Bangladesh, Bhutan, India, Nepal, and Pakistan was collected and analysed to provide empirical evidence that mountain poverty is different, and to explain how and why it differs. Existing secondary data sources for China and Myanmar were used to provide a comprehensive overview for the HKH region.
The main conclusions are summarised below. Since the results are based on national representative data they are empirically significant and provide a strong base for mountain specific policy advocacy and planning.
Mountain Poverty is Higher and More Persistent
Existing national poverty indicators have not fully captured the multifaceted aspects and specificities of the root causes of mountain poverty. The present study aims to fill this gap by providing the first empirical evidence of differences in mountain poverty across six different nations of the Himalayas. The study showed that, with the exception of India, poverty levels in remote mountain areas are higher than in other parts of the same country. Furthermore, where data allowed trend analysis, poverty in these areas tends to be persistent. Due to data constraints, this could only be clearly illustrated in the case of Nepal, where it was possible to analyse trends. In Nepal, poverty reduction rates in mountain areas were found to be lower than elsewhere, leading to a further increase in the inequality between people in mountain areas and those in the remainder of the country.
High rates of poverty and low poverty reduction rates in the mountains compared to national levels are a serious concern in terms of inequalities within both nations and the region as a whole. The case of Nepal illustrates that higher and more persistent poverty in the mountains can contribute to increasing inequality within Nepalese society. Poor communities in other areas ‘outgrew’ total poverty twice as fast. The effect of increasing inequality can result in unsustainable upstream-downstream linkages such as increased outmigration and pressure on already overburdened urban centres, as well as structural conflict.
Causes of Poverty in Mountain Areas Differ from Those in Other Areas
The research presents policy makers and development planners with statistically significant results which show that the concentration of poverty determinants in the mountainous parts of the study areas were higher than in other areas of the same country.
The causes of poverty in mountain areas were identified using multivariate statistical analysis. The analysis showed a higher concentration and combined prevalence of indicators in mountain areas in all the study areas. Parameters such as lower access to basic facilities, poor physical access, and higher dependency rates were more prominent in remote mountain areas than in other areas.
There is a clear link between high levels of remoteness, low levels of public and private investment, and high incidence of poverty. In less-favoured remote areas, low population densities can drive up the cost of extending physical infrastructure and providing basic services. Inadequate physical infrastructure restricts access to markets,

Understanding Mountain Poverty in the Hindu Kush-Himalayas
58
and results in political, social, and economic marginality. Thus the link between poverty and inaccessibility is associated with limited economic opportunity due to the lack of infrastructure and connectivity to wider markets. High dependency rates also played a crucial role. In the poorest areas, working household members had to support a relatively high number of dependents, which put an intense workload on the bread-winners, and also stress on the household resources.
The two dimensions ‘lack of access to basic facilities’ and ‘poor physical access’ are strong indicators in understanding and explaining the specificities of mountain poverty. At the same time, some causes of poverty in the mountain areas also apply to non-mountainous areas; these include household composition, socioeconomic status, and assets and liabilities. Mountain areas are poorer because of the combination of both the common and the mountain specific factors, which ultimately leads to higher and more persistent poverty rates. Hence, mountain poverty alleviation programmes need to consider the mountain specific causes of poverty, while simultaneously addressing triggers of poverty that are prevalent in all areas.
Contribution of Different Determinants of Poverty Differs Among Mountain Areas and Between the Mountains and the Plains
The analysis showed that the impact of different determinants of poverty was different in the seven mountain areas studied in the six countries in the region. The results provide substantial evidence that although the specificities of mountain poverty may be evident across the HKH region, the different determinants of poverty have varying impact in each country, and different impact in the mountains than in the other geographic areas within the country.
In Summary
Empirical findings showed that poverty is higher in mountains and has different causes in comparison with other geographic areas within the same country. This report highlights the immediate need to address poverty in mountain areas with a separate lens in order to tackle the particular determinants which are unique to the geographic conditions within a country.
The report presents a regional overview of mountain poverty. However, further research needs to be done in order to build a comprehensive database using longitudinal surveys at the regional and country level. This would further strengthen, complement, and substantiate the macro level findings, which are based solely on the nationally representative datasets. Furthermore, the quantitative assessments could be used to create a unified survey format which would support direct regional comparisons across all the HKH countries. Future assessments could be used to identify and document pockets of persistent poverty and vulnerable communities in the RMCs through a long-term monitoring system.

Bibliography
59
Bibliography
Ali, R (2003) ‘How urban is Pakistan.’ In Zaidi, SA (ed) Continuity and change: Socio-political and institutional dynamics in Pakistan. Karachi, Pakistan: City Press
Bhide, S; Mehta, AK (2004) ‘Chronic poverty in rural India using panel data: Issues and findings.’ Journal of Human Development 5(2): 195–209
Bhutan Census (2007), cited in GoB (2007b) Poverty analysis report. Thimphu, Bhutan: National Statistics Bureau, Royal Government of Bhutan
Bird, KD; Hulme, K; Moore, K; Shepherd, A (2002) Chronic poverty and remote rural areas, Working Paper No 13. Manchester, UK: Chronic Poverty Research Centre, University of Manchester
Central Statistics Office and UNICEF (2004) Moving beyond two decades of war: Progress of provinces – multiple indicator cluster survey 2003 Afghanistan. Kabul, Afghanistan: Central Statistics Office and UNICEF Country Office
Chen, S; Ravallion, M (2004) How have the world’s poorest fared since the early 1980s? World Bank Policy Research Working Paper No 3341. Washington, DC: World Bank
Chen, S; Ravallion, M (2005) ‘China’s (uneven) progress against poverty.’ Journal of Development Economics 82(1): 1-42
CPRC (2004) The chronic poverty report 2004-05. Manchester, UK: Chronic Poverty Research Centre, University of Manchester
Farrington, J; Gill, GJ (2002) Combining growth and social protection in weakly integrated rural areas, Natural Resource Perspectives No 79. London, UK: Overseas Development Institute
Forsyth, T; Leach, M; Scoones, I (1998) Poverty and environment: Priorities for research and policy. Brighton, UK: Institute of Development Studies
Gazdar, H (2007) Rural economy and livelihoods in Pakistan, TA-4319-PAK. Islamabad, Pakistan: Pakistan Resident Mission, Asian Development Bank. www.adb.org/Documents/Reports/Consultant/37711-PAK/RuralEconomy.pdf (accessed 22 September 2011)
GoB (2003) Bhutan living standard report. Thimphu, Bhutan: National Statistics Bureau, Royal Government of Bhutan
GoB (2004) Poverty analysis report. Thimphu, Bhutan: National Statistics Bureau, Royal Government of Bhutan
GoB (2007a) Bhutan living standard report. Thimphu, Bhutan: National Statistics Bureau, Royal Government of Bhutan
GoB (2007b) Poverty analysis report. Thimphu, Bhutan: National Statistics Bureau, Royal Government of Bhutan
Haque, S (2005) ‘Migration Trends and Patterns in South Asia and Management Approaches and Initiatives, Asia-Pacific Population journal 20(3) pp 39–60
Heilig, G; Ming, Z; Hualou, L; Xiubin, L; Xiuqin, W (2005) Poverty alleviation in China; A lesson for the Developing World? Paper presented at the International Conference on the West Development and Sustainable Development 2-4 August 2005, Urumqi, China
HMGN (1996) Nepal living standards survey household questionnaire 1995/96. Kathmandu, Nepal: Central Bureau of Statistics, His Majesty’s Government of Nepal
HMGN (2004) Nepal living standards survey 2003/2004, Volume 1 and Volume 2. Kathmandu, Nepal: Central Bureau of Statistics, His Majesty’s Government of Nepal
HMGN (2005) Poverty trends in Nepal (1995-96 and 2003-04). Kathmandu, Nepal: Central Bureau of Statistics, His Majesty’s Government of Nepal
HMGN (2006) Analysis of panel households. Kathmandu, Nepal: Central Bureau of Statistics, His Majesty’s Government of Nepal
Huddleston, B; Ataman, E; d’Ostiani, LF (2003) Towards a GIS-based analysis of mountain environments and populations, Environment and Natural Resources Working Paper No 10. Rome, Italy: FAO www.fao.org/sard/common/ecg/1126/en/Y4558E00.pdf (accessed 5 March 2011)
Hulme, D; McKay A (2005) Identifying and understanding chronic poverty: Beyond monetary measures (zero draft). Manchester, UK: Chronic Poverty Research Centre, University of Manchester
IMF (2009) Afghanistan National Development Strategy: First Annual Report (2008/09) Washington DC, USA: International Monetary Fund
Jiang, D (1989) Classification and development of China’s poor areas. Beijing, China: Tourism and Education Press
Jodha NS (1992) ‘Mountain perspective and sustainability: A framework for development strategies.’ In Jodha, NS; Banskota, M; Partap, T (eds) Sustainable mountain agriculture, Volume 1: Perspectives and issues, pp 41-82. New Delhi, India: Oxford and IBH

Understanding Mountain Poverty in the Hindu Kush-Himalayas
60
Jodha, NS (1995) Global change and environmental risks in mountain ecosystems. Tokyo: United Nations University Press
Khalid, MA; Kaushik, G (2008) Food security in mountains: Challenges and sustainable strategies (unpublished). www.mtnforum.org/rs/ol/counter_docdown.cfm?fID=1850.pdf (accessed 11 December 2010)
Knudsen, JL; Khan, NA (2002) ‘An exploration of the problems and prospects of integrated watershed development in the CHT’. In Khan, NA; Alam, MK, Khisa; SK; Millat-e-Mustafa, M (eds) Farming practices and sustainable development in the Chittagong Hill Tracts, pp 165–180. Chittagong, Bangladesh: CHTDB and VFFP-IC, Government of Bangladesh
Kyaw, D; Routray, J (2006) ‘Rural poverty assessment with gender dimension in Myanmar.’ Asia-Pacific Journal of Rural Development 16(2): 5–34
Mughal, WH (2007) ‘Human capital investment and poverty reduction strategy in Pakistan.’ Labour and Management in Development 7(4): 61–77
LGPR (2001) National report on the development-oriented poverty reduction program for Rural China. Beijing, China: Leading Group for Poverty Reduction
Mughal, SM (2007) Achieving sustainable pulses production in Pakistan. Islamabad, Pakistan: Agricultural Foundation of Pakistan, NARC
National Bureau of Statistics of China (2003) China statistical yearbook. Beijing, China: China Statistical Press
Oxfam International (2009) The Costs of War: Afghan Experiences of Conflict, 1979–2009. Available at: at www.oxfam.org/sites/www.oxfam.org/files/afghanistan-the-cost-of-war.pdf
Park, A; Wang, S (2001 ‘China’s Poverty Statistics.’ China Economic Review 12(4): 384-398
Prennushi, G (ed) (1999) Nepal: Poverty at the turn of the twenty-first century, Main report and background studies, Internal Discussion Paper 174. Washington DC, USA: World Bank
Rajuladevi, AK (2001) ‘Food poverty and consumption among landless labourers.’ Economic and Political Weekly 36(25): 2656-2664
Ravallion, M; Chen, S (2004) China’s (uneven) progress against poverty. Washington DC, USA: World Bank
Sharma, S (2005) ‘Food security in Nepal.’ In Babu, S; Gulati, A (eds) Economic reforms and food security: The impact of trade and technology in South Asia, pp 395-407. New York, USA: The Haworth
Shashanka, B; Mehta, AK (2003) Issues in chronic poverty: Panel data based analysis, CPRC Working Paper 6. New Delhi, India: Chronic Poverty Research Centre, Indian Institute of Public Administration (CPRC-IIPA). www.chronicpoverty.org/uploads/publication_files/CPRC-IIPA_6.pdf (accessed 22 September 2011)
State Bank of Pakistan (2009) Annual Report 2008/09. Islamabad, Pakistan: State Bank of Pakistan. www.sbp.org.pk/reports/annual/arFY09/Chp-8.pdf (accessed 20 December 2010)
UNDP (2005a) Human development report 2005: International cooperation at the crossroads. New York, USA: United Nations Development Programme
UNDP (2005b) China human development report 2005. Beijing, China: United Nations Development Programme
UNDP (2007a) Integrated household living conditions survey in Myanmar: MDG relevant information. Yangon, Myanmar: United Nations Development Programme
UNDP (2007b) Integrated household living conditions survey in Myanmar: Poverty profile. Yangon, Myanmar: United Nations Development Programme
UNDP (2008a) Human development report 2008. New York, USA: United Nations Development Programme
UNDP (2008b) The Human Development Initiative of UNDP Myanmar: Targeting the most vulnerable. Yangon, Myanmar: United Nations Development Programme
UNDP (2010a) Human development report 2010. New York, USA: United Nations Development Programme
UNDP (2010b) China human development report 2009/10: Towards a low carbon economy and sustainable society. Beijing, China: United Nations Development Programme
UNDP (2010c) Myanmar, country profile of human development indicators. New York, USA: United Nations Development Programme (online only) http://hdrstats.undp.org/en/countries/profiles/MMR.html (accessed 20.05.2011).
UNDP (2011) Integrated household living conditions assessment (IHLCA) survey in Myanmar. Yangon, Myanmar: United Nations Development Programme. www.mm.undp.org/HDI/Household.html (accessed 19 May 2011)
UN/DESA (1999) Studies in social deprivation in Myanmar. Yangon, Myanmar: United Nations Department of Economic and Social Affairs
UNICEF (2007) Water, hygiene and sanitation annual report. New York, USA: UNICEF
UNICEF (2009) Afghanistan country statistics. New York, USA: UNICEF (online only) http://www.unicef.org/infobycountry/afghanistan_statistics.html#73 (accessed 10 January 2011)
Wang, P; Ren, T (2004) Development-oriented poverty alleviation and monitoring in China. Paper presented at the Regional Conference on Poverty Monitoring in Asia, Asian Development Bank, 24-26 March 2004, Manila, Philippines

Bibliography
61
World Bank (2000) World development report 2000/2001: Attacking poverty. Washington DC, USA: World Bank
World Bank (2001) China: Overcoming rural poverty. Washington DC, USA: World Bank
World Bank (2006) Economics and governance of nongovernmental organizations in Bangladesh. Washington DC, USA: World Bank
World Bank (2006) Poverty in Nepal. Washington DC, USA: World Bank (online only). http://web.worldbank.org/WBSITE/EXTERNAL/COUNTRIES/SOUTHASIAEXT/EXTSAREGTOPPOVRED/0,,contentMDK:20574069~menuPK:493447~pagePK:34004173~piPK:34003707~theSitePK:493441,00.html (accessed 14 December 2010)
World Bank (2007) Pakistan – Promoting rural growth and poverty reduction, Report No. 39303-PK. Washington DC, USA: World Bank
World Bank (2008) Agriculture for development: World development report 2008. Washington DC, USA: World Bank
World Bank (2009) Data – countries and economies. Washington DC, USA: World Bank (online only). http://data.worldbank.org/country (accessed 10 January 2011)
World Bank (2010) China overview. Washington DC, USA: World Bank (online only). www.worldbank.org/en/country/china/overview (Accessed 15 January 2011)

Understanding Mountain Poverty in the Hindu Kush-Himalayas
62

Annex
63
Table A1: Measurement model of factor ‘accessibility’ for Afghanistan
Indicator Factor loadings Uniqueness
Distance to nearest drivable road 0.18 0.97
Time to get to nearest permanent food market 0.92 0.15
Time to get to nearest health service provider 0.54 0.71
Distance to nearest school 0.23 0.95
Variance explained 1.23N = 2,522 communities; maximum likelihood factor analysis; percentage of explained variance = 31; log likelihood (1 factor) = -32; likelihood-ratio-test independent vs. saturated X2
(6) = 902.75, px2 = 0.000; BIC 1 factor = 31.96; data source NRVA 2007/08
Annex: Measurement Model Tables for Different Factors and Logistic Regression Tables for Poverty
Table A2: Measurement model of factor ‘access to basic facilities’ for Afghanistan
Indicator Factor loadings Uniqueness
Improved source of drinking water 0.25 0.94
Toilet facilities 0.37 0.87
Electricity 0.63 0.61
Variance explained 0.59N = 20,577 HH; maximum likelihood factor analysis; percentage of explained variance = 0.20; log likelihood (1 factor) = -5.42e-07; likelihood-ratio-test independent vs. saturated X2
(3) = 1,667.90, px2 = 0.000; BIC 1 factor = 29.80; data source NRVA 2007/08
Table A3: Robust logistic regression on total poverty for Afghanistan
Indicator Total poverty
Inaccessibility 0.147*** (0.019)
Access to basic facilities -0.658*** (0.030)
Kuchi/nomads (ref. non-nomads) 0.414*** (0.105)
Education head of HH (ref. no education)
Primary -0.027 (0.056)
Secondary -0.169** (0.077)
Higher -0.525*** (0.070)
% of literate HH members 0.135* (0.075)
Female head of HH (ref. male) 0.106 (0.115)
Dependency rate 0.267*** (0.018)
% in non-agricultural occupations -0.340*** (0.068)
Owned land in ha per head -0.617** (0.281)
Livestock per head -0.041*** (0.010)
Loans obtained (ref. no loans) 0.393*** (0.033)
Constant -1.104*** (0.059)
Pseudo R-squared 0.08N = 19,926; weighted analysis; standard errors in parentheses; reference categories in square brackets; robust Huber-White sandwich estimates; ***p<0.01, **p<0.05, *p<0.1; data source NRVA 2007/08

Understanding Mountain Poverty in the Hindu Kush-Himalayas
64
Table A4: Measurement model of factor ‘access to basic facilities’ for Bangladesh
Indicator Factor loadings Uniqueness
Improved source of drinking water 0.41 0.83
Improved toilet facilities 0.54 0.70
Electricity 0.59 0.65
Variance explained 0.81N = 10,080 HH; maximum likelihood factor analysis; percentage of explained variance = 0.27; log likelihood (1 factor) = -2.60e-07; likelihood-ratio-test independent vs. saturated X2
(3) = 1,946.88, px2 = 0.000; BIC 1 factor = 27.66; data source HIES 2005/06
Table A5: Logistic regressions on total poverty, food poverty, and non-food poverty for Bangladesh
Indicator Total poverty Food poverty Non-food poverty
Access to basic facilities -0.735*** (0.041) -0.584*** (0.037) -0.247*** (0.082)
Education head of HH (no ed.)
Primary -0.287*** (0.072) -0.452*** (0.075) -0.180 (0.148)
Secondary -0.887*** (0.100) -0.816*** (0.088) -0.893*** (0.269)
Higher -1.581*** (0.212) -1.224*** (0.123) -0.844* (0.478)
% of literate HH members -0.714*** (0.102) -0.309*** (0.105) -1.272*** (0.199)
Female head of HH (ref. male) -0.823*** (0.085) -0.591*** (0.079) -0.587*** (0.166)
Dependency rate 0.762*** (0.037) 0.699*** (0.042) 0.721*** (0.055)
% in non-agricultural occupations -0.002 (0.088) -0.022 (0.090) 0.180 (0.151)
Owned land in ha per head -6.743*** (0.454) -2.979*** (0.228) -8.314*** (10.392)
Livestock per head -0.011** (0.005) -0.012*** (0.004) -0.020 (0.017)
Constant -0.317*** (0.064) 0.972*** (0.067) -2.723*** (0.117)
Pseudo R-squared 0.22 0.17 0.14N = 9.868; standard errors in parentheses; reference categories in square brackets; ***p<0.01, **p<0.05, *p<0.1; data source HIES 2005/06
Table A6: Measurement model of factor ‘accessibility’ for Bhutan
Indicator Factor loadings Uniqueness
Hours to next paved road 0.86 0.26
Hours to next market centre 0.74 0.45
Hours to next telephone 0.60 0.65
Hours to next bus stop 0.88 0.22
Hours to next agricultural centre 0.41 0.83
Hours to next bank 0.94 0.13
Variance explained 3.47N = 13,805 HH; maximum likelihood factor analysis; percentage of explained variance = 0.58; log likelihood (1 factor) = -2,117.57; likelihood-ratio-test independent vs. saturated X2
(15) = 5.3e+04, px2 = 0.000; BIC 1 factor = 4,292.34, 2 factors = 1,037.72; data source BLSS 2003, BLSS 2007

Annex
65
Table A7: Measurement model of factor ‘access to basic facilities’ for Bhutan
Indicator Factor loadings Uniqueness
Improved source of drinking water 0.53 0.72
Improved toilet facilities 0.69 0.53
Electricity 0.60 0.64
Variance explained 1.11N = 13,805 HH; maximum likelihood factor analysis; percentage of explained variance = 0.37; log likelihood (1 factor) = -4.15e-07; likelihood-ratio-test independent vs. saturated X2
(3) = 5,052.02, px2 = 0.000; BIC 1 factor = 28.60; data source BLSS 2003, BLSS 2007.
Table A8: Logistic regressions on total poverty, food poverty, and non-food poverty for Bhutan
Indicator Total poverty Food poverty Non-food poverty
Year 2007 (ref. year 2003) 0.202*** (0.062) 0.181*** (0.050) 0.234*** (0.062)
Inaccessibility 0.159*** (0.023) 0.099*** (0.021) 0.161*** (0.023)
Access to basic facilities -0.722*** (0.043) -0.356*** (0.034) -0.798*** (0.042)
Education head of HH (no ed.)
Primary -0.307* (0.088) -0.390*** (0.064) -0.127 (0.088)
Secondary -2.620*** (0.507) -0.713*** (0.118) -1.628*** (0.364)
Higher -3.656*** (1.004) -1.182*** (0.149) -3.331*** (1.005)
% of literate HH members -0.937*** (0.105) 0.256*** (0.085) -1.688*** (0.105)
Female head of HH (ref. male) -0.607*** (0.065) -0.486*** (0.053) -0.449*** (0.063)
Dependency rate 0.480*** (0.037) 0.411*** (0.031) 0.379*** (0.037)
% in non-agricultural occupations -2.103*** (0.140) -1.616*** (0.094) -1.893*** (0.134)
Owned land in ha per head -0.386*** (0.053) -0.333*** (0.041) -0.173*** (0.041)
Livestock per head -0.110*** (0.015) -0.034*** (0.010) -0.101*** (0.014)
Loans obtained (ref. no loans) -0.098* (0.056) 0.086*** (0.044) -0.221*** (0.056)
Constant -0.936*** (0.087) -0.851*** (0.070) -0.652*** (0.084)
Pseudo R-squared 0.23 0.12 0.25N = 13,394; Z values ; weighted analysis; standard errors in parentheses; reference categories in squared brackets; ***p<.01, **p<0.05, *p<0.1; data source BLSS 2003, BLSS 2007
Table A9: Measurement model of factor ‘accessibility’ for India
Indicator Factor loadings Uniqueness
Distance to next paved road 0.58 0.66
Hours to next market centre 0.50 0.75
Hours to next fair price shop 0.46 0.79
Hours to next bus stop 0.56 0.69
Hours to next agricultural centre 0.69 0.53
Hours to next bank 0.75 0.44
Variance explained 2.15N = 4,616 communities; maximum likelihood factor analysis; percentage of explained variance = 0.36; log likelihood (1 factor) = -609.16; likelihood-ratio-test independent vs. saturated X2
(15) = 6,855.46, px2 = 0.000; BIC 1 factor = 1,268.94, 2 factors = 123.41; data source NSS 2003

Understanding Mountain Poverty in the Hindu Kush-Himalayas
66
Table A10: Robust logistic regressions on total poverty (1 USD per day) for India
Indicator Total poverty
Inaccessibility 0.234*** (0.035)
Access to electricity -0.953*** (0.032)
Ethnicity (ref. forward cast)
Scheduled tribe 0.310*** (0.053)
Scheduled caste 0.685*** (0.049)
Other backward caste 0.292*** (0.039)
Education head of HH (no ed.)
Primary -0.251*** (0.041)
Secondary -0.803*** (0.061)
Higher -1.245*** (0.115)
% of literate HH members -0.908*** (0.059)
Female head of HH (ref. male) -0.308*** (0.060)
Dependency rate 0.651*** (0.022)
% in non-agricultural occupations -0.373*** (0.070)
Owned land in ha per head -2.279*** (0.094)
Number of owned plots 0.151*** (.013)
Constant -0.491*** (.064)
Pseudo R-squared 0.20N = 25,688; weighted analysis; standard errors in parentheses; reference categories in squared brackets; robust Huber-White sandwich estimates; ***p<0.01, **p<0.05, *p<0.1; data source NSS 2003
Table A11: Measurement model of factor ‘accessibility’ for Nepal
Indicator Factor loadings Uniqueness
Hours to next paved road 0.76 0.42
Hours to next market centre 0.73 0.46
Hours to next bus stop 0.74 0.46
Hours to next agricultural centre 0.78 0.40
Hours to next cooperative 0.90 0.20
Hours to next bank 0.90 0.20
Variance explained 3.86N = 7,186 HH; maximum likelihood factor analysis; percentage of explained variance = 0.64; log likelihood (1 factor) = -4,756.21; likelihood-ratio-test independent vs. saturated X2
(15) = 3.8e+04, px2 = 0.000; BIC 1 factor = 9,565.78, 2 factors = 679.61; data source NLSS 1995/96, NLSS 2003/04
Table A12: Measurement model of factor ‘access to basic facilities’ for Nepal
Indicator Factor loadings Uniqueness
Improved source of drinking water 0.31 0.91
Toilet facilities 0.69 0.52
Electricity 0.83 0.30
Variance explained 1.27N = 7,285 HH; maximum likelihood factor analysis; percentage of explained variance = 0.42; log likelihood (1 factor) = -4.93e-11; likelihood-ratio-test independent vs. saturated X2
(3) = 3,486.11, px2 = 0.000; BIC 1 factor = 26.68; data source NLSS 1995/96, NLSS 2003/04

Annex
67
Table A13: Robust logistic regressions on total poverty, food poverty, and non-food poverty for Nepal
Indicator Total poverty Food poverty Non-food poverty
Year 2003 (ref.: year 1996) 0.093 (0.076) -0.178*** (0.068) 0.442*** (0.074)
Inaccessibility 0.132*** (0.030) 0.083*** (0.029) 0.323*** (0.037)
Access to basic facilities -0.945*** (0.058) -0.624*** (0.049) -0.992*** (0.055)
Ethnicity (ref. Newari)
Dalit 0.651*** (0.177) 0.215 (0.142) 0.255 (0.165)
Janajati 0.497*** (0.159) -0.038 (0.121) 0.355** (0.146)
Middle castes -0.794*** (0.222) -1.017*** (0.187) -0.858*** (0.205)
Chetri/Brahmin 0.242 (0.163) -0.197 (0.123) -0.081 (0.150)
Education head of HH (no ed.)
Primary -0.141* (0.082) -0.185** (0.076) -0.203** (0.079)
Secondary -0.767*** (0.182) -0.454*** (0.139) -0.864*** (0.174)
Higher -1.250*** (0.319) -0.979*** (0.216) -1.511*** (0.329)
% of literate HH members -1.414*** (0.125) -0.920*** (0.114) -1.440*** (0.120)
Female head of HH (ref. male) -0.608*** (0.094) -0.343*** (0.085) -0.588*** (0.090)
Dependency rate 0.566*** (0.038) 0.527*** (0.036) 0.456*** (0.037)
% in non-agricultural occupations -0.437*** (0.103) -0.392*** (0.094) -0.312*** (0.100)
Owned land in ha per head -0.881*** (0.184) -1.411*** (0.205) -0.498*** (0.151)
Number of owned plots 0.028** (0.011) 0.048*** (0.011) -0.014 (0.011)
Livestock per head -0.102*** (0.019) -0.141*** (0.019) 0.009 (0.017)
Loans obtained (ref. no loans) 0.014 (0.067) 0.016 (0.062) 0.011 (0.066)
Constant -1.078*** (0.172) -0.295** (0.133) -0.796*** (0.159)
Pseudo R-squared 0.26 0.19 0.27N = 7,148; Z values ; weighted analysis; standard errors in parentheses; reference categories in squared brackets; ***p<0.01, **p<0.05, *p<0.1; data source NLSS 1995/96, NLSS 2003/04
Table A14: Measurement model of factor ‘accessibility’ for Pakistan
Indicator Factor loadings Uniqueness
Distance to nearest bank 0.82 0.32
Distance to nearest fertiliser depot 0.67 0.55
Distance to nearest mill 0.75 0.45
Distance to nearest place to use a phone 0.88 0.23
Distance to nearest post office 0.75 0.44
Distance to nearest railway station 0.45 0.80
Distance to nearest tractor rental 0.41 0.83
Distance to nearest union council 0.63 0.61
Variance explained 3.79N = 570 communities; maximum likelihood factor analysis; percentage of explained variance = 0.47; log likelihood (1 factor) = -61.87; likelihood-ratio-test independent vs. saturated X2
(28) = 2,03.31, px2 = 0.000; BIC 1 factor = 174.51, 2 factors = 144.82; data source PSLM 2005/06
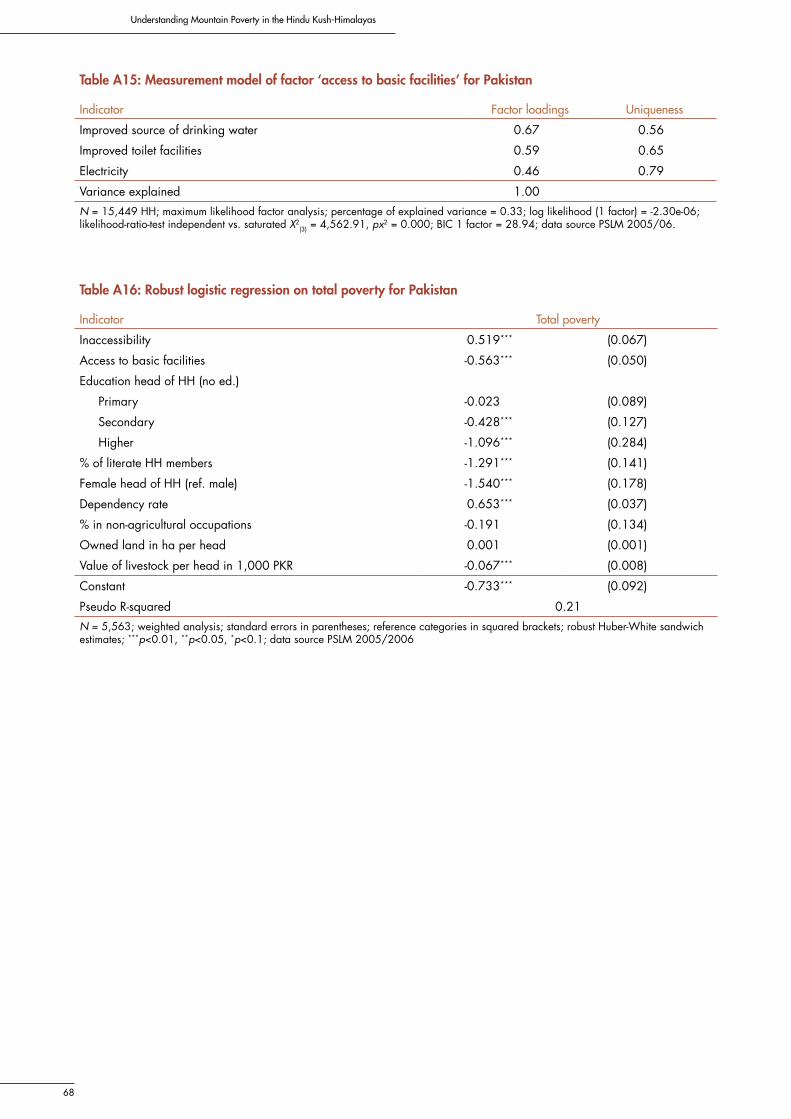
Understanding Mountain Poverty in the Hindu Kush-Himalayas
68
Table A15: Measurement model of factor ‘access to basic facilities’ for Pakistan
Indicator Factor loadings Uniqueness
Improved source of drinking water 0.67 0.56
Improved toilet facilities 0.59 0.65
Electricity 0.46 0.79
Variance explained 1.00N = 15,449 HH; maximum likelihood factor analysis; percentage of explained variance = 0.33; log likelihood (1 factor) = -2.30e-06; likelihood-ratio-test independent vs. saturated X2
(3) = 4,562.91, px2 = 0.000; BIC 1 factor = 28.94; data source PSLM 2005/06.
Table A16: Robust logistic regression on total poverty for Pakistan
Indicator Total poverty
Inaccessibility 0.519*** (0.067)
Access to basic facilities -0.563*** (0.050)
Education head of HH (no ed.)
Primary -0.023 (0.089)
Secondary -0.428*** (0.127)
Higher -1.096*** (0.284)
% of literate HH members -1.291*** (0.141)
Female head of HH (ref. male) -1.540*** (0.178)
Dependency rate 0.653*** (0.037)
% in non-agricultural occupations -0.191 (0.134)
Owned land in ha per head 0.001 (0.001)
Value of livestock per head in 1,000 PKR -0.067*** (0.008)
Constant -0.733*** (0.092)
Pseudo R-squared 0.21N = 5,563; weighted analysis; standard errors in parentheses; reference categories in squared brackets; robust Huber-White sandwich estimates; ***p<0.01, **p<0.05, *p<0.1; data source PSLM 2005/2006

About ICIMOD
The International Centre for Integrated Mountain Development, ICIMOD, is a regional knowledge development and learning centre serving the eight regional member countries of the Hindu Kush-Himalayas – Afghanistan, Bangladesh, Bhutan, China, India, Myanmar, Nepal, and Pakistan – and based in Kathmandu, Nepal. Globalisation and climate change have an increasing influence on the stability of fragile mountain ecosystems and the livelihoods of mountain people. ICIMOD aims to assist mountain people to understand these changes, adapt to them, and make the most of new opportunities, while addressing upstream-downstream issues. We support regional transboundary programmes through partnership with regional partner institutions, facilitate the exchange of experience, and serve as a regional knowledge hub. We strengthen networking among regional and global centres of excellence. Overall, we are working to develop an economically and environmentally sound mountain ecosystem to improve the living standards of mountain populations and to sustain vital ecosystem services for the billions of people living downstream – now, and for the future.

Understanding Mountain Poverty in the Hindu Kush-Himalayas
70
International Centre for Integrated Mountain DevelopmentGPO Box 3226, Kathmandu, NepalTel +977-1-5003222 Fax +977-1-5003299Email [email protected] Web www.icimod.org
ISBN 978 92 9115 212 4