Embed Size (px)
Citation preview

Understanding Nonfarm Payroll
Dr. Raymond StonePrinciple of Stone & McCarthy Research AssociatesApril 9, 2008

Nonfarm Payroll Futures & Options
John W. Labuszewski
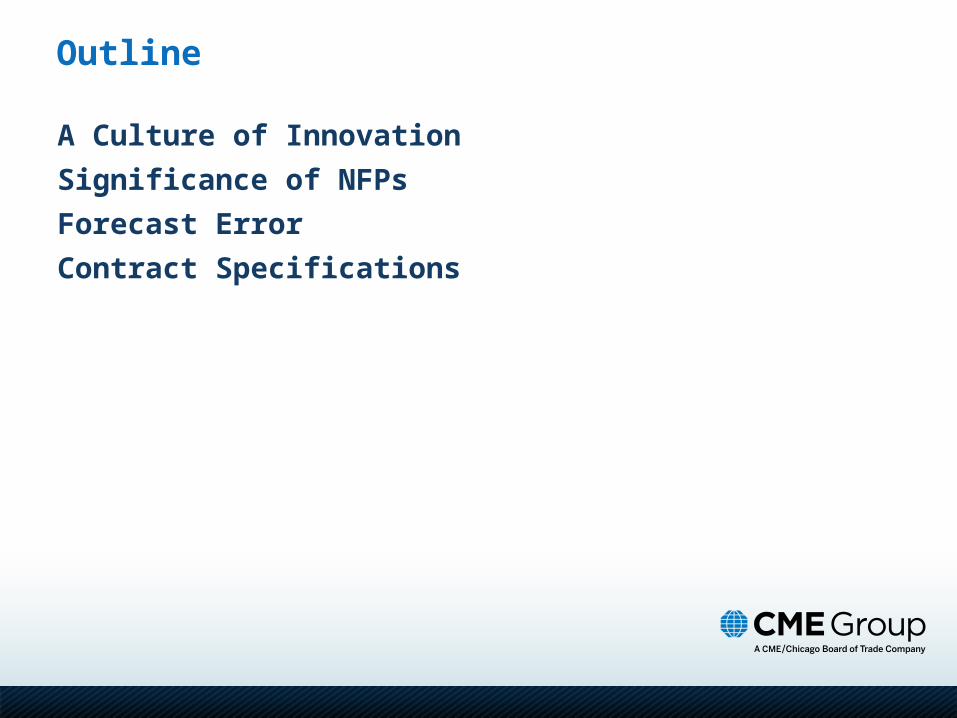
Outline
A Culture of Innovation
Significance of NFPs
Forecast Error
Contract Specifications

1st financial futures … CME currency futures
•1st successful stock index … S&P 500
•1st successful cash-settled futures … CME Eurodollars
•1st global electronic trading system in CME Globex®
•E-miniTM S&P 500 futures
•1st US financial exchange to demutualize
•1st US financial exchange to IPO
•CBOT Common Clearing Link
•Hosting NYMEX on CME Globex®
•CME / CBOT merger creating CME Group
•CME / NYMEX merger announcement
1990s1990s 2000s2000s1970s1970s 1980s1980s
CME’s history of innovation …
A Culture of Innovation

Innovative new product offerings … • CME Group is dedicated to offering its customers “benchmark” derivative
products in all major asset classes
• This includes interest rates, equities, currencies, commodities and alternate
investments
• Latest addition to CME Group alternate investment catalog• Product catalog includes ground-breaking offerings in … weather, hurricanes,
real estate and economic indicators (e.g., HICP)
• No economic indicator is more significant than NFPs
A Culture of Innovation

Nonfarm Payrolls (NFP) … • NFPs (generally) released at 7:30 am on 1st Friday of each month by
Bureau of Labor Statistics (BLS)
• BLS generates 2 reports … (i) Establishment Survey of ~375,000 businesses used
for NFPs; (ii) Household Survey of ~60,000 households used for unemployment
rate
• Focus on Establishment Survey and seasonally adjusted change in NFPs
• Nonfarm payrolls (NFPs) represent the most significant of domestic economic indicators
• FOMC keenly regards NFPs as (generally) the first economic release that
provides information regarding economic activity in previous month
• Note that FOMC’s mission is to balance inflation risks with goal of maximum
possible stable growth and employment
• BUT … no way to gain direct exposure to NFPs
• Until now … contract launches April 27, 2008 based on May 2, 2008 release
Significance of NFPs
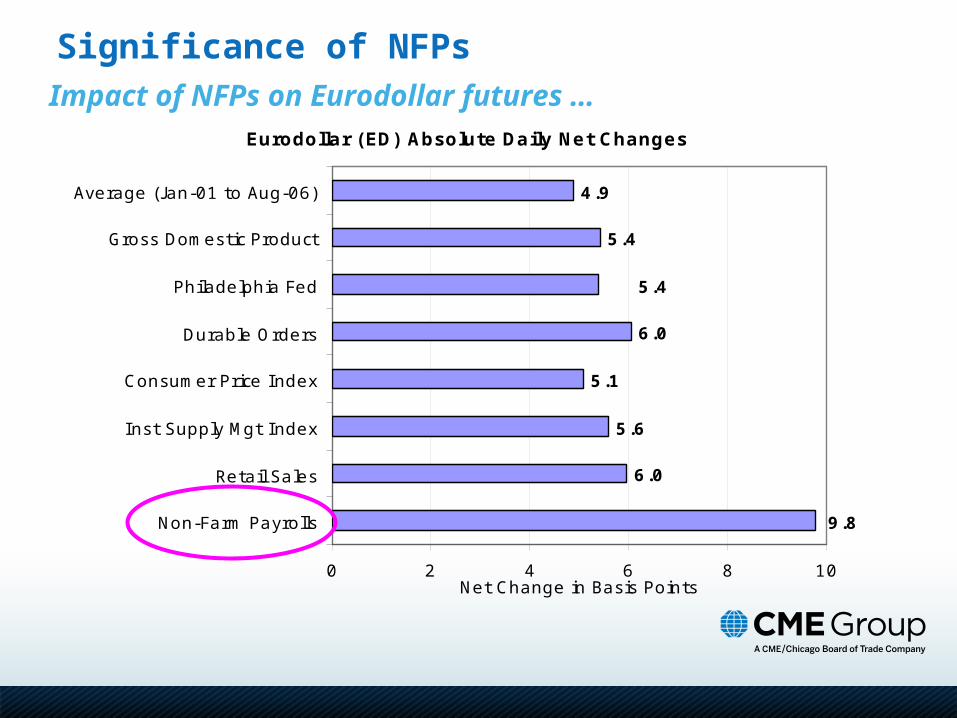
Impact of NFPs on Eurodollar futures …
Significance of NFPs
Eurodollar (ED) Absolute Daily Net Changes
6.0
5.6
5.1
6.0
5.4
4.9
5.4
9.8
0 2 4 6 8 10
Non-Farm Payrolls
Retail Sales
Inst Supply Mgt Index
Consumer Price Index
Durable Orders
Philadelphia Fed
Gross Domestic Product
Average (Jan-01 to Aug-06)
Net Change in Basis Points

Impact of NFPs on Eurodollar futures …
Significance of NFPs
Eurodollar (ED) Average Daily High-Low Range
15.5
7.9
8.2
10.9
10.9
4.7
7.3
9.5
0 2 4 6 8 10 12 14 16 18
Non-Farm Payrolls
Retail Sales
Inst Supply Mgt Index
Consumer Price Index
Durable Orders
Philadelphia Fed
Gross Domestic Product
Average (Jan-01 to Aug-06)
High-Low Range in Basis Points

Impact of NFPs on Eurodollar futures …Significance of NFPs
Eurodollar (ED) Average Daily Volume
1,743,380
1,335,394
1,276,760
1,544,413
1,154,967
1,322,170
1,234,967
1,139,767
0
20
0,0
00
40
0,0
00
60
0,0
00
80
0,0
00
1,0
00
,00
0
1,2
00
,00
0
1,4
00
,00
0
1,6
00
,00
0
1,8
00
,00
0
2,0
00
,00
0
Non-Farm Payrolls
Retail Sales
I nst Supply Mgt I ndex
Consumer Price I ndex
Durable Orders
Philadelphia Fed
Gross Domestic Product
Average (J an-01 to Aug-06)

Ranking major economic releases …
Significance of NFPs
Economic Indicator Briefing.com Rating
Non-Farm Payrolls (NFP) A
Institute for Supply Mgt (ISM) Index A-
Retail Sales A-
Consumer Price Index (CPI) B+
Chicago Purchasing Managers Index (PMI) B
Durable Orders B
Gross Domestic Product (GDP) B
Philadelphia Fed Index B
Consumer Confidence B-
Housing Starts and Building Permits B-
Industrial Production B-
Non-Manufacturing ISM Index B-
Producer Price Index (PPI) B-
…

Measuring forecast error• From Jan-00 to Jan-08 in
thousands of jobs …
Forecast Error
Consensus Actual Difference
1/31/2008 70 -17 -87
12/31/2007 70 18 -52
11/30/2007 80 94 14
10/31/2007 84.5 166 81.5
9/30/2007 100 110 10
8/31/2007 100 -4 -104
7/31/2007 127 92 -35
6/30/2007 125 132 7
5/31/2007 131.5 157 25.5
4/30/2007 100 88 -12
3/31/2007 130 180 50
2/28/2007 95 97 2
1/31/2007 150 111 -39
12/31/2006 100 167 67
11/30/2006 100 132 32
…
Average = 70.4
Std Dev = 60.6
Maximum = 318
Minimum = 2

Nonfarm Payroll futures and options … Contract Specifications
Futures Options
Contract Size
$25 x change in Total Nonfarm Payrolls (NFPs) as published by BLS
One (1) futures contract
QuoteQuoted in 1,000s, e.g., May 2007 contract would have settled at +157, or change in NFPs (in 000s) from April to May 2007.
Minimum tick of 1 point (1,000 jobs) = $25
Quoted in 500 jobs or minimum fluctuation of 0.5 (=$12.50)
Months All monthly NFP releases, listed on the Monday after the previous month’s release
Hours Offered on CME Globex® on Sundays-Thursdays from 5:00 p.m. to 4:00 p.m. CT
Last DayTrading in an expiring contract concludes at 7:25 a.m. CT on the first Friday of the contract month
or such other day on which NFP figures are scheduled to be released by the BLS
Final Settlement
Settled in cash to change in seasonally adjusted total NFPs reported by U.S. Dept. of Labor, Bureau of Labor Statistics
Table B-1., Employees on nonfarm payrolls by industry sector and selected industry detail, seasonally adjusted
change in total NFPs for month prior to named month
American style options may be exercised into one (1) futures
contract
Strike Prices
Na10 point (or 10,000 jobs) intervals
from -500,000 to +500,000 jobs
Price LimitPrice limit of ±200 points (200,000 jobs = $5,000) applied to
final settlement price from previous business day’s settlement price
Movement in value effectively limited by futures price limit

Understanding Nonfarm Payroll
Dr. Raymond Stone

Research has revealed that the U.S. Nonfarm Payroll Numbers have the most profound impact of all high frequency economic reports on not only the U.S. debt markets, but also upon foreign sovereign bond markets.
• See: What Moves Sovereign Bond Markets?The Effects of Economic News on U.S. and German Yields , (Goldberg and Leonard) Current Issues in Economics and Finance, September 2003, Federal Reserve Bank of New York http://www.newyorkfed.org/research/current_issues/ci9-9/ci9-9.html

Actually the monthly Employment Report includes data from two separate surveys:
• Household Survey—A survey of roundly 60,000 households. The “Unemployment Rate” is compiled from this survey.
• Establishment Survey (or Payroll Survey)—Captures payroll counts from roundly 330,000 business and governmental establishments. From this survey the monthly change in Nonfarm Payrolls is estimated.

Why do markets place such enormous
emphasis on the payroll data?
• Timing —usually released the first Friday of the month, capturing employment conditions of the prior month.
• Comprehensive — providing significant industry specific detail regarding payrolls, hours worked, and earnings.

Payroll data serve as important inputs into other key macroeconomic data.
• Personal Income—Wages & Salaries, the largest component of PI, are derived from the earnings data from the establishment survey.
• Industrial Production—Production-worker hours account for nearly ½ of the input to the monthly IP report.
• Productivity—Hours worked serve as the denominator in the Productivity equation: Productivity = Output/Hours
• Unit Labor Costs—Earnings serve as the basis for computing compensation costs.

More Generally, Payrolls Tend to be Aligned with other Measures of Macro-activity

How Does the BLS Estimate Payrolls?The three components:
• (1) Sample-Based Estimate
• (2) Births/Deaths Estimate
• (3) Seasonal Adjustment Estimate

Sample-Based Estimate
• Sample of roundly 300,000 private sector and 30,000 public sector establishments.
• Survey is based on the pay-period that includes the 12th of the month.
• Only respondents that report in consecutive months are included.
• Typical response rate for the first estimate of payrolls is around 66%.

More than ½ of the responses are collected by touch-tone data entry (TDE) or via computer assisted telephone interviews (CATI).
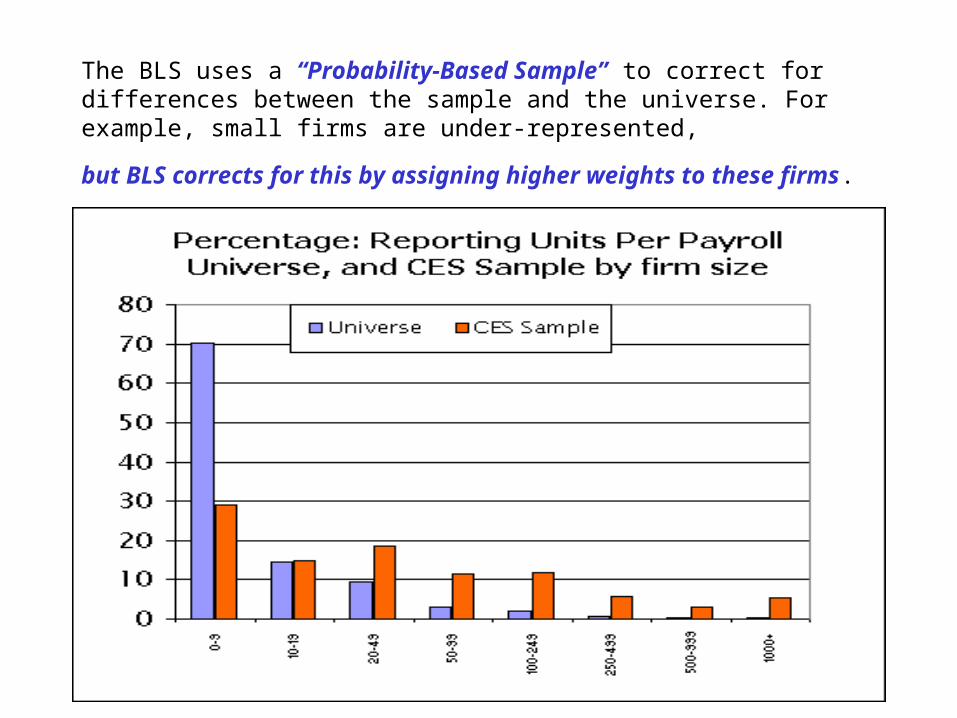
The BLS uses a “Probability-Based Sample” to correct for differences between the sample and the universe. For example, small firms are under-represented,
but BLS corrects for this by assigning higher weights to these firms.

Payroll survey is skewed towards larger firms

Births/Deaths Model (BDM)
• The BLS’s sample cannot account for new firms (Births) or firms going out of business (Deaths).
• As a consequence, the sample-based estimate of payrolls would typically understate payroll growth.
• To account for this shortfall the BLS employs a time-series model to provide current estimates of net payroll changes associated with Births and Deaths of businesses

The BDM tends to render a recurring pattern of estimated net payroll changes associated with Births and Deaths of firms—The so-called “BDM adjustment” is added to the sample-based estimate of payrolls

Because the BDM is a “Times-Series Model” it doesn’t do well in picking up turns or inflection points in the underlying series.
• During economic downturns or slowdowns the BDM adjustments tend to add too many jobs
• During periods of economic acceleration the BDM adjustment may understate net new jobs associated with Births and Deaths of firms
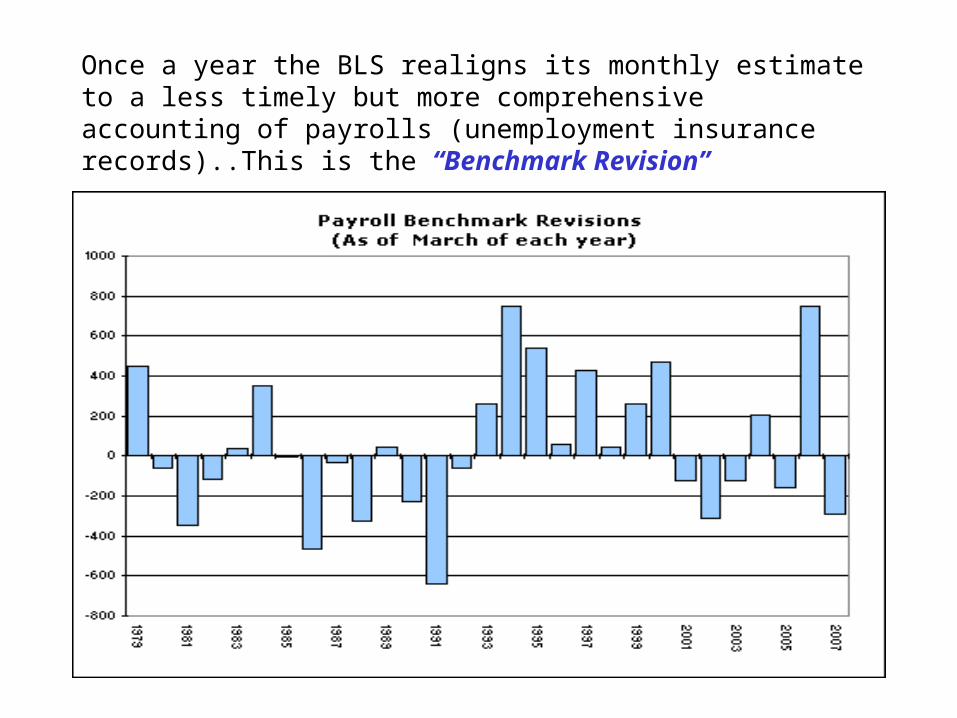
Once a year the BLS realigns its monthly estimate to a less timely but more comprehensive accounting of payrolls (unemployment insurance records)..This is the “Benchmark Revision”

Seasonally Adjusting The Payroll DataNot An Easy Task
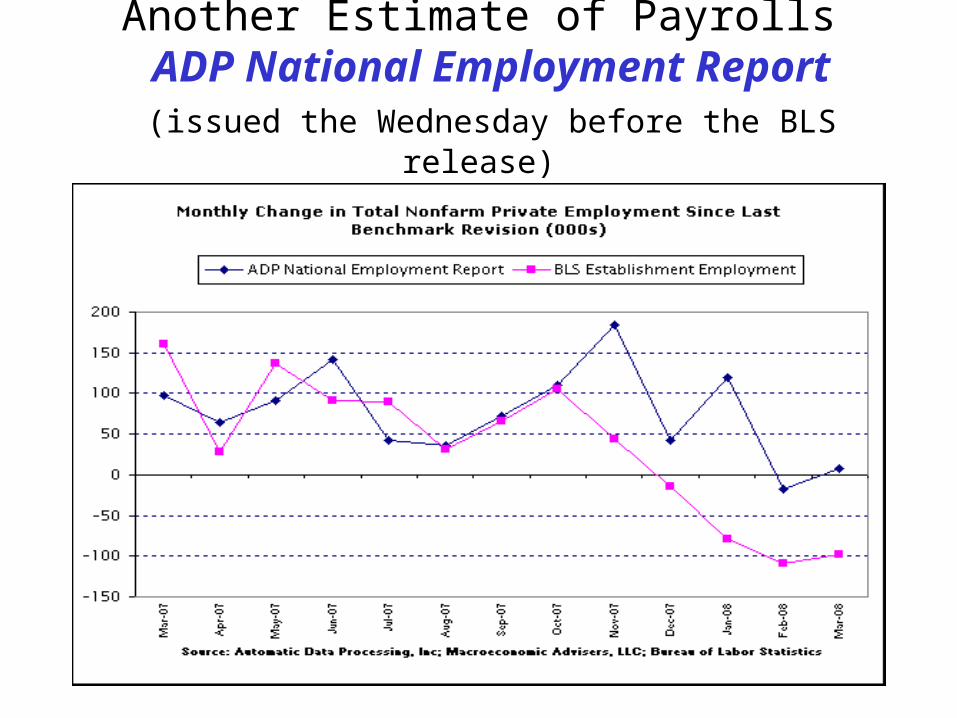
Another Estimate of Payrolls ADP National Employment Report (issued the Wednesday before the BLS release)

Approaches Used to Forecast Payrolls
• Model-Based approach—recession models using Initial Unemployment Claims, ISM Employment Indices, etc as independent variables
• Naïve or Adaptive approach—typically based on the extension of recent trends: looking at moving averages, etc.
• Judgmental—combines model based, adaptive, weather considerations, and a variety of other factors in developing a payroll forecast

Evolution of Market Expectations
• Estimates of the next payroll release begin to surface about 2 weeks prior to the report.
• Estimates tend to be revised based on incoming data, including the Thursday release of Initial Unemployment Insurance Claims.
• Estimates are further revised by the Employment Indexes from the ISM Manufacturing (1st business day of month) and the ISM Non-manufacturing reports (3rd business day).
• The ADP National Employment Report (Wednesday prior to BLS release) often tends to either reshape or reaffirm market estimates.

Forecasters do better in some months than others
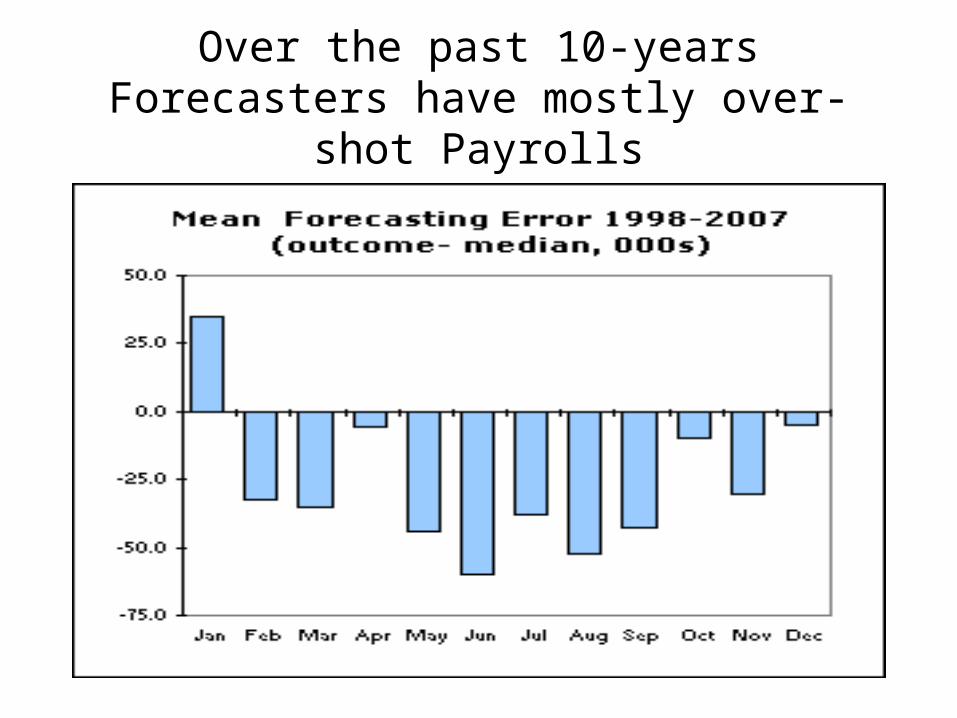
Over the past 10-years Forecasters have mostly over-shot Payrolls
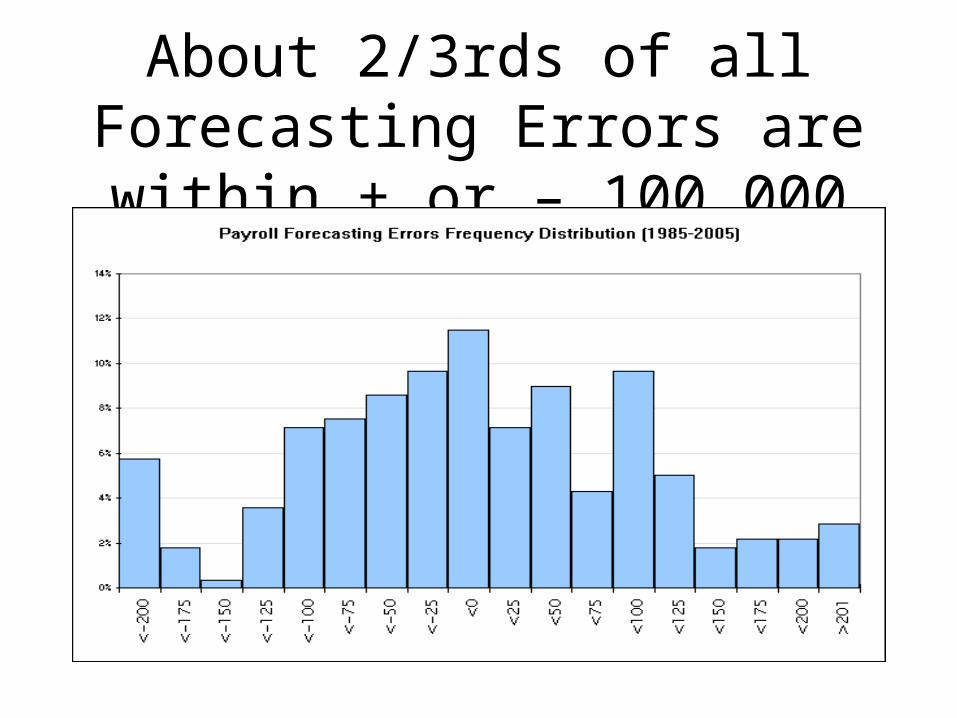
About 2/3rds of all Forecasting Errors are within + or – 100,000

Often Weather Related Swings Account for Forecasting Errors
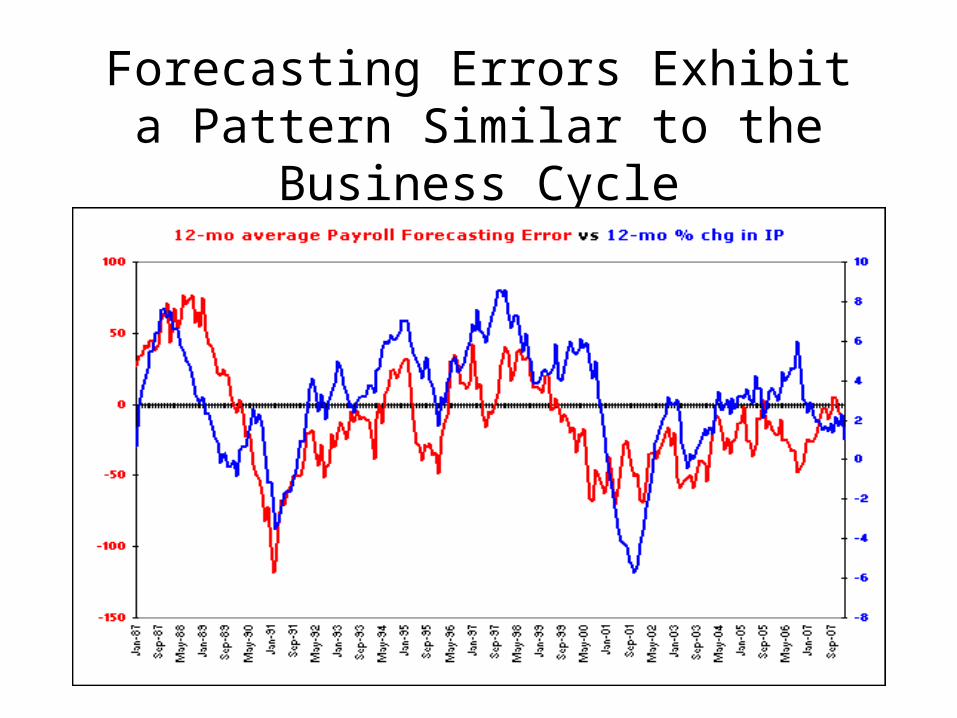
Forecasting Errors Exhibit a Pattern Similar to the Business Cycle

Some Forecasters Do Better Than Others, But Over Time the Median Forecast Has Out-Performed All Forecasters in the Sample

Understanding Nonfarm Payroll
Dr. Raymond StonePrinciple of Stone & McCarthy Research AssociatesApril 9, 2008