Embed Size (px)
Citation preview

Understanding Nutritional Challenges Faced by Older Americans in Rural
Areas: the Role of the Food Environment and Neighborhood Characteristics
Joseph R. Sharkey Scott Horel
Cassandra M. Johnson Rodolfo M. Nayga, Jr.
Texas Healthy Aging Research Network (TxHAN), Center for Community Health Development, and Program for Research in Nutrition and Health Disparities
Funded by the Food Assistance and Nutrition Research Innovation and Development Grants in Economics (RIDGE) Program
Grant Awarded by the Southern Rural Development Center, Mississippi State University

Introduction
The economic burden posed by nutrition-related chronic health conditions, such as
obesity, cardiovascular disease, cancer, and diabetes, is tremendous. Good nutrition (i.e., healthy
eating) is now recognized as one modifiable determinant of the prevention and management of
chronic diseases.1 However, as life expectancy increases and the proportion of older adults with
chronic diseases increases, the burden of chronic health conditions, functional decline, and
diminished independence place an unprecedented strain on individuals, families, caregivers,
communities, the health care system, and service providers.2, 3 Older adults in rural areas
disproportionately grapple with problems that affect functional decline and loss of independence:
high levels of chronic conditions, low levels of available health support, limited personal and
community resources, geographic isolation, and poor nutritional health, among others.4-12
Personal, structural, and neighborhood characteristics influence differential access to
health resources, serving either as barriers or enhancements to lifestyle behaviors such as
physical activity or healthy eating.13, 14 Healthy dietary patterns – fruits, vegetables, low fat
dairy products, and diets low in total and saturated fat, cholesterol, and sodium – have been
associated with primary prevention and management of nutrition-related health conditions.15-21
However, these healthy foods are often not easily accessible.22
Residents of rural and poor areas face the greatest structural and neighborhood
disadvantages,4 with older adults in these regions being particularly challenged to make or
maintain lifestyle changes that are critical for the prevention or management of disease. The
conceptual model in Figure 1 provides a framework for food access and shows that access to
healthful food is the result of the relationship between the food environment and potential
consumers, and suggests that food choices are influenced by shopping opportunities that are
available (potential access) and the shopping opportunities that are utilized (realized access).23-27
The food environment is
characterized by the number and
type of food stores; availability of
food categories, such as fresh fruit;
and variety of different items within
a category. Senior consumers are
characterized by their neighborhood
of residence, availability of a
vehicle, public transportation,
financial resources, home
environment, household size,
employment, and health. Barriers or
facilitators associated with the food
environment and/or consumer
influence the selection of food purchase opportunity at a given time.
Physical access is a major problem for people in deprived communities; those without
cars, the elderly, and people on low incomes.28-31 There is strong evidence that residents of rural
areas are affected by poor access to supermarkets and health food items.32-38 However, little is
known about the spatial challenges to good nutrition faced by seniors who reside in rural areas.
Nutritional disparities faced by seniors in rural areas make understanding access to a variety of
fruits and vegetables especially critical. In order for rural seniors to be food secure and have
access to fruit and vegetables, food resources need to be accessible (located near neighborhoods,
Figure 1

especially low-income or rural areas, or with transportation available) and available (include a
variety of fruits and vegetables in local stores. In this report, data from the Brazos Valley Food
Environment Project (BVFEP) are combined with the Brazos Valley Health Assessment
(BVHA) and 2000 U.S. census data to examine objective and perceived access to fruits and
vegetables. BVFEP data include identification and geocoding of food stores in six rural counties
in Texas, using ground-truthed methods,32 and on-site assessment of the availability and variety
of fresh and processed (canned, frozen, and 100% juice) fruits and vegetables in all food stores,
using an observational survey.38 Thus, the goals of this study were (a) to identify and assess the
availability of fruits and vegetables through direct observation in a large rural area of six
counties in Texas; (b) examine the characteristics of perceived access to food stores by 645
seniors who participated in the Brazos Valley Health Assessment (BVHA); and (c) evaluate the
associations among neighborhood characteristics, perceived and objective measures of food
access, and nutrition-related outcomes of the BVHA seniors.
Methods
Rural setting
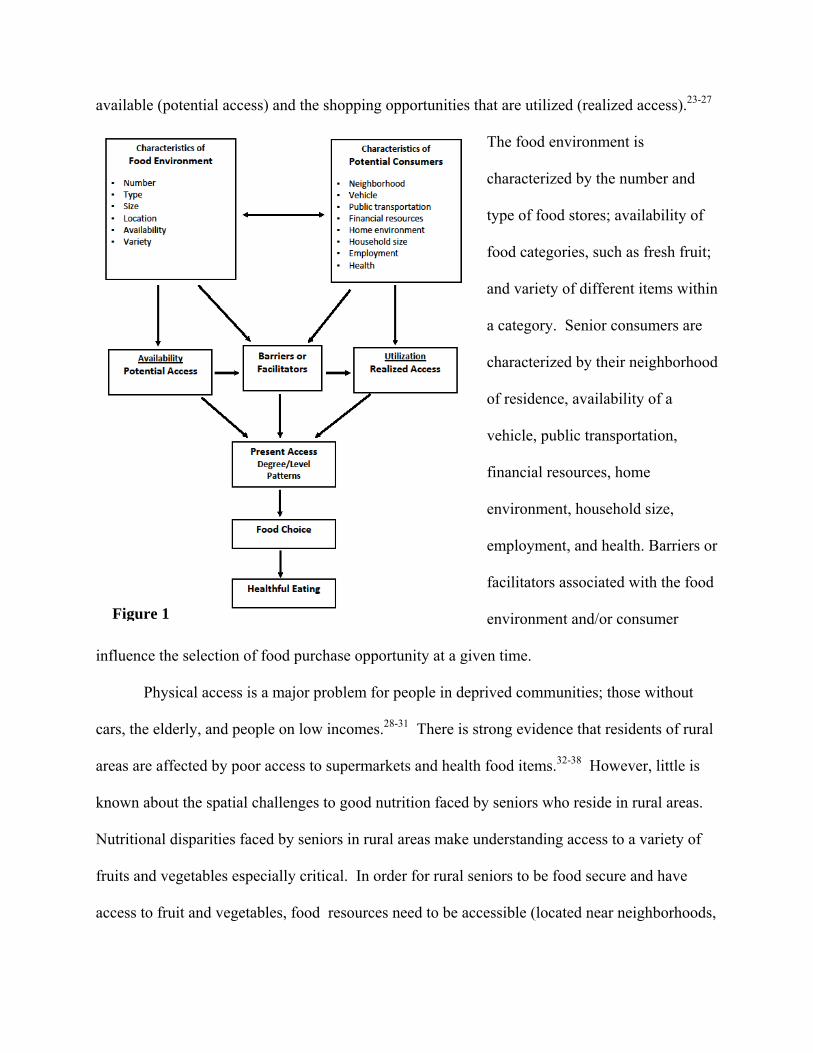
The Brazos Valley is a 7-county region in Central Texas (see Figure 2) consisting of the
urban center of Brazos County and six rural counties. The 6-county study area included 101
census block groups, a rural land area of approximately 4,500 square miles, and a population of
more than 119,650 people. The six counties also include five urban clusters (i.e., population
>2,500), several smaller towns (population 156-1,555), and many unincorporated areas.32, 39 The
five urban clusters, which comprise all or parts of 26 CBG, were located in five of the six
counties; the populations for the five urban clusters were 3,181, 3,569, 5,132, 6,296, and

11,952.39 Regular public transportation
services, such as fixed route, commuter, or
taxi services, were not available in the study
area.40, 41 Three databases, specific to the
study area, were linked: 1) Brazos Valley
Food Environment Project (BVFEP), 2)
BVHA, and 3) 2000 U.S. Census Summary
File 3 (SF-3).
Brazos Valley Food Environment Project (BVFEP)
This study used food store data from the 2006-2007 Brazos Valley Food Environment
Project (BVFEP), which was approved by the Institutional Review Board at Texas A&M
University. BVFEP data included the on-site identification and geocoding of all supermarkets,
grocery stores, convenience stores, dollar stores, mass merchandisers, and pharmacies; and
completion of an observational survey of the availability and variety of fresh and processed
(canned, frozen, and juice) fruits and vegetables in 185 food stores.32, 38 Specifically, the BVFEP
used ground-truthed methods in a two-stage approach to determine the access to and availability
of fruit and vegetables to residents of the 101 CBG in six rural counties in the Brazos Valley of
Texas. As previously described,32 trained observers systematically drove all highways
(Interstate, U.S., and State), farm-to-market roads, and city or town streets/roads within the study
area (see Figure 3). All traditional (supercenters, supermarkets, and grocery stores), convenience
(convenience stores and food marts), and non-traditional (dollar stores, mass merchandisers, and
pharmacies) food stores were enumerated through direct observation and on-site determination
Madison
Grimes
Washington
Burleson
Brazos
Robertson
Leon
Brazos Valley Counties
Figure 2

of geographic coordinates using a
Bluetooth Wide Area Augmentation
System (WAAS)-enabled portable
Global Positioning System (GPS)
receiver and the World Geodetic System
1984 datum.42 Following the
enumeration of food stores, an
observational survey instrument was
developed, tested, and administered in all food stores by trained observers to determine the
availability and selection of fruits and vegetables.38
Measurement of fruit and vegetable availability
The availability of fruits and vegetables was separately determined from an observational
survey of the presence and variety of fresh and processed fruits and vegetables.38 Processed
fruits and vegetables included canned, frozen, and juice.43 Healthier processed fruit included fruit
canned in natural juice, fruit canned in light syrup, frozen fruit without added sugar, and 100%
fruit juice. Healthier processed vegetables included vegetables canned and frozen without a
sauce and 100% vegetable juice. Variety was operationalized as the number of different food
items within a fruit or vegetable category (e.g., number of different fresh fruits).
Overall fruit score. Separate scores were constructed from a total of different fruit for
fresh fruit (0 = none, 1 = 1-3, and 2 = ≥ 4); canned fruit in natural juice (0 = none, 1 = 1-4, and 2
= ≥ 5); canned fruit in light syrup (0 = none, 1 = 1-4, and 2 = ≥ 5); frozen fruit (0 = none, 1 = 1-
4, and 2 = ≥ 5); and 100% fruit juice (0 = none, 1 = any). A summary score for overall fruit was
created by summing the category scores for fresh fruit, canned fruit in natural juice, canned fruit
Brazos County
0 4020 Miles
Brazos Valley Roads
Figure 3

in light syrup, frozen fruit, and 100% fruit juice. Overall fruit scores range from 0 (worst
availability of fruit) to 9 (best availability of fruit). Because the overall fruit score was highly
skewed, a three-category variable was constructed for level of overall fruit availability: poor
availability (fruit score: 0-1), medium availability (fruit score: 2-3), and good availability (fruit
score: 4-9).
Overall vegetable score. The overall vegetable availability score combines variety and
the presence of a dark green vegetable (e.g., broccoli, collard greens, kale, spinach, or turnip
greens).78 Separate scores were constructed from a total of different vegetables for fresh
vegetables (0 = none, 1 = 1-4 and no dark green, 2 = ≥5 and no dark green or 1-4 and a dark
green, 3 = ≥5 and a dark green); canned vegetables (0 = none, 1 = 1-4 and no dark green, 2 = ≥5
and no dark green or 1-4 and a dark green, 3 = ≥5 and a dark green); frozen vegetables (0 = none,
1 = 1-4, and 2 = ≥ 5); and 100% vegetable juice (0 = none, 1 = any). Overall vegetable scores
range from 0 (worst availability of vegetables) to 9 (best availability of vegetables). A four-
category variable was constructed for level of overall vegetable availability: no availability
(vegetable score: 0), poor availability (vegetable score: 1-2), medium availability (vegetable
score: 3-4), and good availability (vegetable score: 5-9).
Brazos Valley Health Assessment (BVHA)
The BVHA was a joint effort of the Brazos Valley Health Partnership and the Center for
Community Health Development at the School of Rural Public Health. The assessment was
conducted in all seven of the Brazos Valley counties and included more than 2,500 adults.
Questions were included to address demographics, height and weight, health status, chronic
diseases and conditions, transportation, neighborhood, food and nutrition, and community issues.
A professional survey company was contracted to collect survey data. Using random-digit

dialing, community residents were called, and respondents were randomized by asking for the
adult resident of the household who had the next birthday. Then, that person was informed of the
purpose of the survey and if they agreed to participate, a survey packet was mailed to them
(including survey instrument in English or Spanish, instructions, a $2 incentive, and a self-
addressed stamped envelope). Of those who could be reached by telephone, 32 percent agreed to
participate, and of those, 52 percent (n = 2,582) returned completed surveys. Although the
completed surveys were representative of the population distribution geographically (rural versus
urban) and persons with a household income below the poverty threshold, women and older
adults were overrepresented and race/ethnic minorities (African Americans and Hispanics) and
individuals with limited education (completed less than 9th grade) were underrepresented in the
survey sample. Of the 2,539 who provided their age, 952 (37.5%) were seniors (60 years or
older); and 663 of these seniors resided in the six rural counties. Rural seniors with addresses (n
= 645) were geocoded; and this was the final sample for inclusion in this study.
Food and nutrition survey questions
The adequacy of community food resources was assessed using three items asked on a 5-
point Likert scale (e.g., 1=strongly agree to 5= strongly disagree): 1) little variety in types of
foods that can be purchased; 2) few grocery stores or supermarkets; and 3) food prices are high.
Adequacy of home food resources was assessed using two items on a 3-point scale (1=often true,
2= sometimes true, and 3=never true): 1) the food we bought last month didn’t last and we didn’t
have enough money to buy more; and 2) we couldn’t afford to eat balanced meals. Three dietary
behavior questions were asked to determine the number of servings of fruit consumed each day;
the number of servings of vegetables; and the number of days a week that a regular breakfast

meal was consumed. Perceptions about the store where most of the groceries were purchased
was assessed using three questions on a 5-point Likert scale (e.g., 1=excellent 5=poor): 1) how
would you rate the variety of fruits and vegetables at this store; 2) how would you rate the
freshness of fruits and vegetables; and 3) how would you rate the price of fruits and vegetables?
perceptions of the store where they purchase most groceries, and access to affordable, healthful
food. Additional BVHA data included sample sociodemographic characteristics and
neighborhood activity. Respondents were also asked how far in miles they travel for groceries
and usually how long (in minutes) it usually takes.
Senior congregate meal sites
Data were obtained from the Brazos Valley Area Agency on Aging to identify all
locations for senior congregate meals programs in the six rural counties. Eleven locations were
identified and geocoded to their street address. There were two locations in each of five of the
counties and one in the sixth county.
Potential Spatial Access
Neighborhoods were characterized by census block group (CBG), which represent the
smallest geographic unit of the census from which detailed “long form” social and economic data
are tabulated.44, 45 The population-weighted centroid for each of the 101 CBG was calculated
using the ArcGIS Desktop tool Mean Center (Version 9.2, Environmental Systems Research
Institute). This tool constructs the CBG mean center based on the mean-weighted x and y values
of the block population centroids.32 Proximity measure was used as the criterion for spatial
access. ESRI’s Network Analyst extension in ArcInfo 9.2 was used to calculate the shortest

network distance along the road network between two sets of paired point data. For
neighborhood access, distance was calculated from the population-weighted centroid to the
nearest corresponding food store within the six-county study area; for senior access, distance
was calculated from the address of each BVHA senior participant to the nearest corresponding
food store. Separate distances were calculated from each CBG to the nearest food store
(supercenter, supermarket, grocery store, convenience store, mass merchandiser, dollar store, and
pharmacy), nearest food store with a good variety of fresh fruits or vegetables, and to the nearest
food store with a good variety of fresh and processed fruits or vegetables. Spatial access to the
nearest senior congregate meal site was determined from each CBG and from each BVHA
participant.
Neighborhood socioeconomic characteristics
Socioeconomic characteristics were extracted from the SF-3 for all 101 CBG in the rural
study area to describe socioeconomic deprivation, minority composition, and population
density.32 Deprivation represented unemployment (persons age 16 y and older in the labor force
who were unemployed and actively seeking work), poverty (persons with incomes below the
federal poverty level), low education attainment (persons age 25 y and older, with less than a
10th-grade education), household crowding (occupied households with more than one person per
room), public assistance (households receiving public assistance), vehicle availability (occupied
housing with no vehicle available), and telephone service (occupied housing with no telephone
service). Established procedures were used to merge the SF-3 data for the six rural counties,
conduct iterated principal factor analysis, and construct a standardized index of neighborhood
socioeconomic deprivation.32, 46, 47 Based on the distribution of scores for index, a three-
category variable for overall neighborhood socioeconomic deprivation: low deprivation (highest

overall socioeconomics and lowest quartile of deprivation scores), middle deprivation (middle
two quartiles), and high deprivation (lowest overall socioeconomics and highest quartile of
deprivation scores).32 In addition, percent of residents over the age of 60 years was extracted
from SF-3 for each CBG.
Statistical analysis
Release 9 of Stata Statistical Software was used for all statistical analyses; p <0.05 was
considered statistically significant. Descriptive statistics were estimated for the accessibility,
neighborhood characteristics, and availability and variety of fresh and processed fruit or
vegetables. Distances from the population-weighted centroid of each CBG to the nearest FS
(supermarket or supercenter, convenience store, dollar store, and mass merchandiser) were
calculated, as were distances to the nearest senior congregate meal site and food store with a
good selection of fruit or vegetables. Descriptive statistics were estimated for BVHA data for
senior participants. Network distances were then calculated to the nearest food store type, as well
as nearest food store with a good selection of fresh or processed fruit or vegetables. Finally,
multiple regression models were estimated to determine the variables associated with food store
or congregate meal site distance.
FINDINGS AND DISCUSSION
Neighborhood characteristics and access to food stores
The rural food environment included 186 food stores and 11 senior meal sites: there were
one supercenter, 11 supermarkets, 12 grocery stores, 141 convenience stores, 16 dollar stores,

four mass merchandisers, and one pharmacy. The food store sample for this study included 185
food stores; one convenience store was excluded because of refusal for an in-store survey of food
items. Table 1 shows the distribution of individual socioeconomic characteristics and percentage
of seniors from the 2000 U.S. Census SF-3 among the 101 CBG. On average, seniors comprised
21.5% of neighborhood populations. In data not shown, the senior composition in each of more
than 26% of CBG (n = 27) was greater than 25%. Table 1 also the shows the distribution of
distances from the population-weighted centroid of each CBG to the nearest supermarket,
grocery store, convenience store, and senior meal site. Neighborhood socioeconomic deprivation
was calculated from SF-3 data.32 In a test of trend across ordered groups of increasing senior
composition, the distance to the nearest supermarket/supercenter increased significantly
(p=0.003). In a multiple variable regression model (data not show), an increase in neighborhood
percentage of seniors was associated with greater distance to the nearest supermarket/supercenter
(p <0.01); and an increase in population density and socioeconomic deprivation were associated
with shorter distance to the nearest supermarket/supercenter (p <0.001). The overall model R2
was 0.41. In the 27 neighborhoods with the largest concentration of senior residents, the average
distance to the nearest supermarket was 14.0 miles (median = 13.0 mi), with a range of 0.25 mi –
33.6 mi; the nearest senior meal site was 8.9 miles (median = 9.6 mi), with range of 0.6 – 20.6
miles. Table 2 shows the percentage of neighborhoods (CBG) with at least one
supermarket/supercenter or senior meal site within a specific network distance of the population-
weighted centroid of the 101 CBG (e.g., < 1mi, 1-2.9 mi, 3-4.9 mi, 5-9.9 mi, and ≥10 mi).
Residents in more than 47% (n = 48) of the rural neighborhoods (CBG) had to travel at least 10
miles one-way to reach a supermarket/supercenter; residents in 32.7% of neighborhoods (n = 33)
had to travel at least 10 miles to reach the nearest senior meal site. Adjusted regression model

(data not shown) revealed that an increased percentage of seniors in a neighborhood was
associated with increased distance to the nearest supermarket (p <0.01); increased population
density and neighborhood deprivation were associated with decreasing distance (p <0.001). The
R-squared for this model was 0.412.
Neighborhood access to fruits and vegetables
Table 3 shows the availability and variety of fresh and processed fruits and vegetables by
type of food store. The data show that
variety of fresh or processed fruits and
vegetables was better in supermarkets
compared with grocery stores, and in
dollar stores compared with
convenience stores. Table 4 shows the
level of availability and variety of fruit
and vegetables. Overall poor
availability of fruits and no availability
of vegetables were found exclusively in
convenience stores. Good selection of
fruits or vegetables could be found
among six of the seven types of food stores. Neighborhood distances to the nearest food store
with fruits or vegetables were calculated (see Table 5). Table 2 shows the percentage and number
of neighborhoods with at least one opportunity for a good selection of fresh or processed fruits or
vegetables within specific distances from population-weighted neighborhood center. Overall
Figure 4

access was better for fresh fruit compared with fresh vegetables. In the 33 neighborhoods that
were at least 10 miles from nearest food store for fresh fruit (see Figure 4), seniors were 21.4%
of the population; median percentage of seniors in these neighborhoods was 22.2%. Percentage
of seniors remained about the same in the 16 neighborhoods that were at least 10 miles from
fresh or processed fruit (22.4±7.6; median 24.2%). There were 38 neighborhoods, with an
average of 21.7% seniors that were at least 10 miles from the nearest food store for a good
selection of fresh vegetables. For fresh or processed vegetables, 12 neighborhoods (24.6±5.6;
median 27.3% seniors) were at least 10 miles in distance.
Brazos Valley Health Assessment (BVHA) seniors
Table 6 shows sociodemographic and health characteristics for the BVHA seniors.
Almost 35% of the seniors reported a household income below 200% of the Federal Poverty
Level. In data not shown, 21.5% reported their health as being better than the previous year;
59.3% about the same; and 19.2% worse than the previous year. Almost 26% reported that they
did not have hypertension, diabetes, heart disease, or obesity. At the same time, 38.5% reported
that they had at least two of these health conditions. Individual evaluations of community food
resources, household food security, stores where most of the household groceries are purchased,
and access to healthful food are presented in Table 7. For 60% of the seniors, there were few
grocery stores or supermarkets in their community; there was little variety of foods (32.7%); and
food prices were high for more than 80% of seniors. For many seniors, there were problems with
variety, freshness, or price of fruits and vegetables in the stores where most of their groceries
were purchased. Eating habits for the 645 BVHA seniors are shown in Table 8. In data mot
shown, more than 45% of seniors traveled at least 13 miles to purchase groceries for the
household. Few of the BVHA seniors consumed the recommended intakes of fruits or

vegetables; 14.4% consumed at least three daily servings of fruit; and 4.5% consumed at least
five daily servings of vegetables. More than 60% of seniors consumed at least one fast food meal
each week; 28% ate a regular breakfast meal two or fewer times per week. Regression models
were used to determine BVHA characteristics associated with daily intake fruit or vegetables.
Seniors who reported a low income (101%-200% FPL), traveling farther distances to the grocery
store, and household food not lasting last month were at greater risk of lower daily intakes of
fruit; only food not lasting last month was associated with lower vegetable intake. Using logistic
regression model to examine characteristics associated with seniors who reported that the food
they purchased the previous month did not last (pseudo R2 0.245), this study identified poverty
level income (OR 6.8, 95% CI 3.7-12.6; p<0.001), low income (OR 7.0, 95% CI 3.7-13.2;
p<0.001), living alone (OR 1.8, 95% CI 1.1-3.1; p<0.05), and being African American or
Hispanic (OR 6.1, 95% CI 3.5-10.7; p<0.001).
BVHA senior access to food stores
Table 9 shows the distribution of distance from BVHA seniors to nearest food store,
senior congregate meal site, and fruit or vegetables. Table 10 shows the percentage and number
of BVHA seniors with access within a specified distance. More than 36% of the sample resided
at least 10 miles from the nearest senior congregate meal site; and almost 45% were at least 10
miles from the nearest supermarket. About one-fourth of the sample was within one mile of a
good selection of fresh fruit or vegetables. This increased to at least one-third of BVHA seniors
within a mile of a good selection of fresh or processed fruit or vegetables. At the other extreme,
at least one-fourth were at least 10 miles from fresh fruit or vegetables. Spatial depiction of
BVHA seniors and neighborhood access to fruits and vegetables is shown in Figures 5-8.

Conclusion
This study is the first step in understanding the spatial challenges to nutrition health faced
by seniors in a large rural area that lacks public transportation. This study linked two
contemporaneous datasets (BVFEP and BVHA) with the 2000 U.S. Census. Although individual
and community concerns with food security and nutritional status are receiving increased focus,
there has been limited attention to environmental factors that may influence food security and
food choice among rural seniors. This study goes beyond prior studies by simultaneously
examining neighborhood and individual access to food stores, senior congregate meal sites, and
availability and variety of fresh and processed fruit and vegetables. Indeed, it is difficult to
initiate or maintain healthful eating habits without access to healthful foods. Indeed, the
preparation for policy change to strengthen food assistance programs or program delivery
activities, or interventions to improve nutritional health should include an understanding of the
community – where people live and where they shop for food.48

REFERENCES 1. World Health Organization. Diet, nutrition and the prevention of chronic disease. Report
of a Joint WHO/FAO Expert Consultation. 2003. Technical Report Series 916.
2. Guralnik JM, Alecxih L, Branch LG, Wiener JM. Medical and Long-Term Care Costs
When Older Persons Become More Dependent. Am J Public Health 2002;92(8):1244-
1245.
3. Federal Interagency Forum on Aging-Related Statistics. Older Americans 2008: Key
Indicators of Well-Being. 2008. Washington, DC: U.S. Government Printing Office.
4. Auchincloss AH, Van Nostrand JF, Ronsaville D. Access to Health Care for Older
Persons in the United States: Personal, Structural, and Neighborhood Characteristics. J
Aging Health 2001;13(3):329-354.
5. Frazão E. High Costs of Poor Eating Patterns in the United States. 1999. Report Number
AIB-750. Washington, DC: U.S. Department of Agriculture (USDA), Economic
Research Service (ERS.
6. Gesler WM, Rabiner DJ, DeFriese GH. Introduction to Research on Rural Health and
Aging Issues. In: Gesler WM, Rabiner DJ, DeFriese GH, editors. Rural Health and Aging
Research: Theory, Methods and Practical Applications. Amityville, NY: Baywood
Publishing Company, Inc; 1998. p. 1-13.
7. Sharkey JR, Giuliani C, Haines PS, Branch LG, Busby-Whitehead J, Zohoori N. A
Summary Measure of Dietary Intake of Musculoskeletal Nutrients (Calcium, Vitamin D,
Magnesium, and Phosphorus) is Associated with Lower-Extremity Physical Performance
in Homebound Older Men and Women. Am J Clin Nutr 2003;77:847-856.

8. Lee JS, Frongillo EA. Nutritional and Health Consequences Are Associated with Food
Insecurity among U.S. Elderly Persons. J Nutr 2001;131:1503-1509.
9. Sharkey JR. Risk and Presence of Food Insufficiency Are Associated with Low Nutrient
Intakes and Multimorbidity among Homebound Older Women Who receive Home-
Delivered Meals. J Nutr 2003;133:3485-3491.
10. Jensen GL, Kita K, Fish J, Heydt DF, Carolin. Nutrition risk screening characteristics of
rural older persons: relation to functional limitations and health care charges. Am J Clin
Nutr 1997;66:819-828.
11. Friedmann J, Jensen G, Smiciklas-Wright H, McCamish M. Predicting early nonelective
hospital readmission in nutritionally compromised older adults. Am J Clin Nutr
1997;65:1714-20.
12. Sharkey JR. Longitudinal Examination of Homebound Older Adults Who Experience
Heightened Food Insufficiency: Effect of Diabetes Status and Implications for Service
Provision. The Gerontologist 2005;45(6):773-782.
13. Booth SL, Sallis JF, Ritenbaugh C, Hill JO, Birch LL, Frank LD, et al. Environmental
and Societal Factors Affect Food Choice and Physical Activity: Rationale, Influences,
and Leverage Points. Nutr Rev 2001;59(3):S21-S39.
14. Casey AA, Elliott M, Glanz K, Haire-Joshu D, Lovegreen SL, Saelens BE, et al. Impact
of the food environment and physical activity environment on behaviors and weight
status in rural U.S. communities. Preventive Medicine 2008;47:600-604.
15. Ard J, Coffman C, Lin P, Svetkey L. One-year follow-up study of blood pressure and
dietary patterns in dietary approaches to stop hypertension (DASH)-sodium participants.
American Journal of Hypertension 2004;17:1156-1162.

16. U.S. Department of Health and Human Services, U.S. Department of Agriculture. Dietary
Guidelines for Americans 2005. 2005 [cited 2005 January 14]; Available from:
http://www.health.gov/dietaryguidelines/dga2005/document/pdf/DGA2005.pdf
17. VanDuyn MA, Pivonka E. Overview of the health benefits of fruit and vegetable
consumption for the dietetics professional: selected literature. J Am Diet Assoc
2000;100:1511-1521.
18. Ness AR, Powles JW. Fruit and vegetables, and cardiovascular disease: a review. Int J
Epidemiol 1997;26:1-13.
19. Steinmetz KA, Potter JD. Vegetables, fruit, and cancer prevention: a review. J Am Diet
Assoc 1996;96:1027-1039.
20. Hu FB, Manson JE, Stampfer MJ, Colditz G, Liu S, C GS, et al. Diet, lifestyle, and the
risk of type 2 diabetes mellitus in women. N Engl J Med 2001;345(11):790-7.
21. Joshipura KJ, Hu FB, Manson JE, Stampfer MJ, Rimm EB, Speizer FE, et al. The effect
of fruit and vegetable intake on risk for coronary heart disease. Ann Intern Med
2001;134(12):1106-14.
22. Shaw HJ. Food Deserts: Towards the Development of a Classification. Geogr Ann
2006;88 B(2):231-247.
23. Sharkey JR, Horel SA. Characteristics of Potential Spatial Access to a Variety of Fruits
and Vegetables in a Large Rural Area. 2009, unpublished work.
24. Morland K, Wing S, Roux AD. The Contextual Effect of the Local Food Environment on
Residents' Diets: The Atherosclerosis Risk in Communities Study. Am J Public Health
2002;92(11):1761-1767.

25. Morland K, Wing S, Roux AD, Poole C. Neighborhood Characteristics Associated with
the Location of Food Stores and Food Service Places. Am J Prev Med 2002;22(1):23-29.
26. Furst T, Connors M, Bisogni CA, Sobal J, Falk LW. Food Choice: A Conceptual Model
of the Process. Appetite 1996;26:247-266.
27. Andreyeva T, Blumenthal DM, Schwartz MB, Long MW, Brownell KD. Availability and
Prices of Foods Across Stores and Neighborhoods: The Case of New Haven,
Connecticut. Health Affairs 2008;27(5):1381-1388.
28. Clarke G, Eyre H, Guy C. Deriving Indicators of Access to Food Retail Provision in
British Cities: Studies of Cardiff, Leeds and Bradford. Urban Studies 2002;39(11):2041-
2060.
29. Clifton KJ. Mobility Strategies and Food Shopping for Low-Income Families. Journal of
Planning Education and Research 2004;23:402-413.
30. O'Dwyer LA, Coveney J. Scoping supermarket availability and accessibility by socio-
economic status in Adelaide. Health Promotion Journal of Australia 2006;17(3):240-6.
31. Sharkey JR, Horel S, Han D, Huber JC. Association between Neighborhood Need and
Spatial Access to Food Stores and Fast Food Restaurants in Neighborhoods of Colonias
Int J Health Geogr 2009;in press.
32. Sharkey J, Horel S. Neighborhood Socioeconomic Deprivation and Minority
Composition Are Associated with Better Potential Spatial Access to the Food
Environment in a Large Rural Area. J Nutr 2008;138:620-627.
33. Powell LM, Slater S, Mirtcheva D, Bao Y, Chaloupka FJ. Food store availability and
neighborhood characteristics in the United States. Preventive Medicine 2007;44:189-195.

34. Larson NI, Story MT, Nelson MC. Neighborhood Environments: Disparities to Access to
Healthy Foods in the U.S. Am J Prev Med 2009;36(1):74-81.
35. Morton LW, Blanchard TC. Starved for Access: Life in Rural America's Food Deserts.
Rural Realities 2007;1(4):1-10.
36. Kaufman PR. Rural Poor Have Less Access to Supermarkets, Large grocery Stores. Rural
Development Perspectives 1998;13(3):19-26.
37. Liese AD, Weis KE, Pluto D. Food store types, availability and cost of foods in a rural
environment. J Am Diet Assoc 2007;107:1916-1923.
38. Bustillos BD, Sharkey JR, Anding J, McIntosh A. Availability of healthier food
alternatives in traditional, convenience, and non-traditional types of food stores in two
rural Texas counties. J Am Diet Assoc 2009;109(5):in press.
39. U.S. Census Bureau. State and County QuickFacts. [February 18, 2007]; Available
from: http://quickfacts.census.gov/qfd/states/48/48215.html
40. Brazos Transit District. Brazos Transit District. [ 8/10/2007]; Available from:
http://www.btd.org/
41. Brazos Valley Council of Governments. "Here to There" Coordinated Regional Public
Transportation Plan, Brazos Valley Region, Texas; 2006.
42. Sharkey JR. Measuring Potential Access to Food Stores and Food Service Places in Rural
Areas in the United States. Am J Prev Med 2009;in press.
43. Rickman JC, Barrett DM, Bruhn CM. Nutritional comparison of fresh, frozen and canned
fruits and vegetables. Part 1. Vitamins C and B and phenolic compounds. J Sci Food
Agric 2007;87:930-944.

44. Winkleby M, Cubbin C, Ahn D. Effect of Cross-Level Interaction Between Individual
and Neighborhood Socioeconomic Status on Adult Mortality Rates. Am J Public Health
2006;96:2145-2153.
45. U.S. Census Bureau. Geographic Areas Reference Manual. [November 18, 2006];
Available from: http://www.census.gov/geo/garm.html
46. Messer LC, Laraia BA, Kaufman JS, Eyster J, Holzman C, Culhane J, et al. The
Development of a Standardized Neighborhood Deprivation Index. Journal of Urban
Health: Bulletin of the New York Academy of Medicine 2006;83(6):1041-1062.
47. Kim J-o, Mueller CW. Factor analysis: Statistical methods and practical issues. Beverly
Hills, CA: Sage Publications; 1978.
48. Gesler WM, Hayes M, Arcury TA, Skelly AH, Nash S, Soward AC. Use of mapping
technology in health intervention research. Nurs Outlook 2004;52:142-146.