Embed Size (px)
Citation preview

8/6/2019 Understanding Ping Trace Route
http://slidepdf.com/reader/full/understanding-ping-trace-route 1/22
Understanding the Ping and
Traceroute Commands
Contents
Introduction Prerequisites
Requirements Components Used Conventions
Background Information The Ping Command Why Can't I Ping?
Routing Issue Interface Down Access-list Command Address Resolution Protocol (ARP) Issue Delay Correct Source Address High Input Queue Drops
The Traceroute Command Performance
Use the Debug Command Cisco Support Community - Featured Conversations Related Information
Introduction
This document illustrates the use of the ping and traceroute commands. With the aid of some debug commands, this document captures a more detailed view of how these commands work.
Note: Enabling any debug commands on a production router may cause serious problems. Werecommend that you carefully read the Use the Debug Command section before you issue debug commands.
Prerequisites
Requirements
TAC Notice: What'sChanging on TAC Web
Help us help you.
Please rate thisdocument.
Excellent
Good
Average
Fair
Poor
This document solvedmy problem.
Yes
No
Just browsing
Suggestions forimprovement:
(256 character limit)
Send

8/6/2019 Understanding Ping Trace Route
http://slidepdf.com/reader/full/understanding-ping-trace-route 2/22
There are no specific requirements for this document.
Components Used
This document is not restricted to specific software and hardware versions.
The information in this document was created from the devices in a specific lab environment. All of thedevices used in this document started with a cleared (default) configuration. If your network is live,make sure that you understand the potential impact of any command.
Conventions
For more information on document conventions, refer to the Cisco Technical Tips Conventions.
Background Information
In this document, we use the basic configuration shown below as a basis for our examples:
The Ping Command
The ping command is a very common method for troubleshooting the accessibility of devices. It uses aseries of Internet Control Message Protocol (ICMP) Echo messages to determine:
Whether a remote host is active or inactive.
The round-trip delay in communicating with the host.
Packet loss.
The ping command first sends an echo request packet to an address, then waits for a reply. The ping issuccessful only if:
the echo request gets to the destination, and
the destination is able to get an echo reply back to the source within a predetermined time called atimeout. The default value of this timeout is two seconds on Cisco routers.
For all the options about this command, see "Ping" under Troubleshooting Commands.
The TTL value of a ping packet cannot be changed.

8/6/2019 Understanding Ping Trace Route
http://slidepdf.com/reader/full/understanding-ping-trace-route 3/22
Here is an output example showing the ping command after enabling the debug ip packet detail command:
Warning: Using the debug ip packet detail command on a production router can cause highCPU utilization. This may result in a severe performance degradation or a network outage. We
recommend that you carefully read Use the Debug Command before issuing debug commands.
Router1#debug ip packet detailIP packet debugging is on (detailed)
Router1# ping 12.0.0.2
Type escape sequence to abort.
Sending 5, 100-byte ICMP Echos to 12.0.0.2, timeout is 2 seconds:
!!!!!
Success rate is 100 percent (5/5), round-trip min/avg/max = 4/6/8 ms
Router1#
Jan 20 15:54:47.487: IP: s=12.0.0.1 (local), d=12.0.0.2 (Serial0), len 100,
sending
Jan 20 15:54:47.491: ICMP type=8, code=0
!--- This is the ICMP packet 12.0.0.1 sent to 12.0.0.2.
!--- ICMP type=8 corresponds to the echo message.
Jan 20 15:54:47.523: IP: s=12.0.0.2 (Serial0), d=12.0.0.1 (Serial0), len 100,
rcvd 3
Jan 20 15:54:47.527: ICMP type=0, code=0
!--- This is the answer we get from 12.0.0.2.
!--- ICMP type=0 corresponds to the echo reply message.
!--- By default, the repeat count is five times, so there will be five
!--- echo requests, and five echo replies.
The table below lists possible ICMP-type values.
ICMPType
Literal
0 echo-reply
3
destination unreachable
code 0 = net unreachable
1 = host unreachable
2 = protocol unreachable
3 = port unreachable
4 = fragmentation needed and DF set

8/6/2019 Understanding Ping Trace Route
http://slidepdf.com/reader/full/understanding-ping-trace-route 4/22
The table below lists the possible output characters from the ping facility:
5 = source route failed
4 source-quench
5
redirect
code 0 = redirect datagrams for the network
1 = redirect datagrams for the host
2 = redirect datagrams for the type of service andnetwork
3 = redirect datagrams for the type of service andhost
6 alternate-address
8 echo
9 router-advertisement10 router-solicitation
11
time-exceeded
code 0 = time to live exceeded in transit 1 =fragment reassembly time exceeded
12 parameter-problem
13 timestamp-request
14 timestamp-reply
15 information-request
16 information-reply
17 mask-request
18 mask-reply
31 conversion-error
32 mobile-redirect
Character Description
!Each exclamation point indicates receipt of areply.
.Each period indicates the network server timedout while waiting for a reply.
UA destination unreachable error PDU was

8/6/2019 Understanding Ping Trace Route
http://slidepdf.com/reader/full/understanding-ping-trace-route 5/22
Why Can't I Ping?
If you are not able to successfully ping to an address, consider these causes:
Routing Issue
Here are examples of unsuccessful ping attempts, determining the problem, and what to do to resolve theproblem.
This scenario is explained using the network topology diagram below:
Router1#
!!
interface Serial0
ip address 12.0.0.1 255.255.255.0
no fair-queue
clockrate 64000
!
!
Router2#!
!
interface Serial0
ip address 23.0.0.2 255.255.255.0
no fair-queueclockrate 64000
!
interface Serial1
ip address 12.0.0.2 255.255.255.0
!
!
Router3# !
received.
Q Source quench (destination too busy).
M Could not fragment.
? Unknown packet type.
& Packet lifetime exceeded.

8/6/2019 Understanding Ping Trace Route
http://slidepdf.com/reader/full/understanding-ping-trace-route 6/22
!
interface Serial0
ip address 34.0.0.3 255.255.255.0
no fair-queue
!
interface Serial1
ip address 23.0.0.3 255.255.255.0
!
!
Router4# !
!
interface Serial0
ip address 34.0.0.4 255.255.255.0
no fair-queue
clockrate 64000
!
!
Let us try to ping Router4 from Router1:
Router1# ping 34.0.0.4
Type escape sequence to abort.
Sending 5, 100-byte ICMP Echos to 34.0.0.4, timeout is 2 seconds:
.....
Success rate is 0 percent (0/5)
Let us have a closer look at what has happened:
Router1#debug ip packet IP packet debugging is on
Warning: Using the debug ip packet command on a production router can cause high cpuutilization. This may result in a severe performance degradation or a network outage. We recommendthat you carefully read Use the Debug Command before issuing debug commands.
Router1# ping 34.0.0.4
Type escape sequence to abort.
Sending 5, 100-byte ICMP Echos to 34.0.0.4, timeout is 2 seconds:
Jan 20 16:00:25.603: IP: s=12.0.0.1 (local), d=34.0.0.4, len 100, unroutable.
Jan 20 16:00:27.599: IP: s=12.0.0.1 (local), d=34.0.0.4, len 100, unroutable.
Jan 20 16:00:29.599: IP: s=12.0.0.1 (local), d=34.0.0.4, len 100, unroutable.
Jan 20 16:00:31.599: IP: s=12.0.0.1 (local), d=34.0.0.4, len 100, unroutable.
Jan 20 16:00:33.599: IP: s=12.0.0.1 (local), d=34.0.0.4, len 100, unroutable.
Success rate is 0 percent (0/5)
Since no routing protocols are running on Router1, it does not know where to send its packet and we getan "unroutable" message.
Now let us add a static route to Router1:

8/6/2019 Understanding Ping Trace Route
http://slidepdf.com/reader/full/understanding-ping-trace-route 7/22
Router1#configure terminal Enter configuration commands, one per line. End with CNTL/Z.
Router1(config)#ip route 0.0.0.0 0.0.0.0 Serial0
We now have:
Router1#debug ip packet detail
IP packet debugging is on (detailed)
Router1# ping 34.0.0.4Type escape sequence to abort.
Sending 5, 100-byte ICMP Echos to 34.0.0.4, timeout is 2 seconds:
U.U.U
Success rate is 0 percent (0/5)
Jan 20 16:05:30.659: IP: s=12.0.0.1 (local), d=34.0.0.4 (Serial0), len 100,
sending
Jan 20 16:05:30.663: ICMP type=8, code=0
Jan 20 16:05:30.691: IP: s=12.0.0.2 (Serial0), d=12.0.0.1 (Serial0), len 56,
rcvd 3
Jan 20 16:05:30.695: ICMP type=3, code=1
Jan 20 16:05:30.699: IP: s=12.0.0.1 (local), d=34.0.0.4 (Serial0), len 100,sending
Jan 20 16:05:30.703: ICMP type=8, code=0
Jan 20 16:05:32.699: IP: s=12.0.0.1 (local), d=34.0.0.4 (Serial0), len 100,
sending
Jan 20 16:05:32.703: ICMP type=8, code=0
Jan 20 16:05:32.731: IP: s=12.0.0.2 (Serial0), d=12.0.0.1 (Serial0), len 56,
rcvd 3
Jan 20 16:05:32.735: ICMP type=3, code=1
Jan 20 16:05:32.739: IP: s=12.0.0.1 (local), d=34.0.0.4 (Serial0), len 100,
sending
Jan 20 16:05:32.743: ICMP type=8, code=0
Now let us examine what is wrong on Router2:
Router2#debug ip packet detail IP packet debugging is on (detailed)
Router2#
Jan 20 16:10:41.907: IP: s=12.0.0.1 (Serial1), d=34.0.0.4, len 100, unroutable
Jan 20 16:10:41.911: ICMP type=8, code=0
Jan 20 16:10:41.915: IP: s=12.0.0.2 (local), d=12.0.0.1 (Serial1), len 56, send
Jan 20 16:10:41.919: ICMP type=3, code=1
Jan 20 16:10:41.947: IP: s=12.0.0.1 (Serial1), d=34.0.0.4, len 100, unroutable
Jan 20 16:10:41.951: ICMP type=8, code=0
Jan 20 16:10:43.943: IP: s=12.0.0.1 (Serial1), d=34.0.0.4, len 100, unroutable
Jan 20 16:10:43.947: ICMP type=8, code=0Jan 20 16:10:43.951: IP: s=12.0.0.2 (local), d=12.0.0.1 (Serial1), len 56, send
Jan 20 16:10:43.955: ICMP type=3, code=1
Jan 20 16:10:43.983: IP: s=12.0.0.1 (Serial1), d=34.0.0.4, len 100, unroutable
Jan 20 16:10:43.987: ICMP type=8, code=0
Jan 20 16:10:45.979: IP: s=12.0.0.1 (Serial1), d=34.0.0.4, len 100, unroutable
Jan 20 16:10:45.983: ICMP type=8, code=0
Jan 20 16:10:45.987: IP: s=12.0.0.2 (local), d=12.0.0.1 (Serial1), len 56, send
Jan 20 16:10:45.991: ICMP type=3, code=1
Router1 is correctly sending its packets to Router2, but Router2 doesn't know how to access address

8/6/2019 Understanding Ping Trace Route
http://slidepdf.com/reader/full/understanding-ping-trace-route 8/22
34.0.0.4. Router2 sends back an "unreachable ICMP" message to Router1.
Now let's enable Routing Information Protocol (RIP) on Router2 and Router3:
Router2#
router rip
network 12.0.0.0
network 23.0.0.0
Router3#
router rip
network 23.0.0.0
network 34.0.0.0
Now we have:
Router1#debug ip packet IP packet debugging is on
Router1# ping 34.0.0.4
Type escape sequence to abort.Sending 5, 100-byte ICMP Echos to 34.0.0.4, timeout is 2 seconds:
Jan 20 16:16:13.367: IP: s=12.0.0.1 (local), d=34.0.0.4 (Serial0), len 100,
sending.
Jan 20 16:16:15.363: IP: s=12.0.0.1 (local), d=34.0.0.4 (Serial0), len 100,
sending.
Jan 20 16:16:17.363: IP: s=12.0.0.1 (local), d=34.0.0.4 (Serial0), len 100,
sending.
Jan 20 16:16:19.363: IP: s=12.0.0.1 (local), d=34.0.0.4 (Serial0), len 100,
sending.
Jan 20 16:16:21.363: IP: s=12.0.0.1 (local), d=34.0.0.4 (Serial0), len 100,
sending.
Success rate is 0 percent (0/5)
This is slightly better. Router1 is sending packets to Router4, but is not getting any answer fromRouter4.
Let us see what the problem could be on Router4:
Router4#debug ip packet IP packet debugging is on
Router4#
Jan 20 16:18:45.903: IP: s=12.0.0.1 (Serial0), d=34.0.0.4 (Serial0), len 100,
rcvd 3
Jan 20 16:18:45.911: IP: s=34.0.0.4 (local), d=12.0.0.1, len 100, unroutableJan 20 16:18:47.903: IP: s=12.0.0.1 (Serial0), d=34.0.0.4 (Serial0), len 100,
rcvd 3
Jan 20 16:18:47.907: IP: s=34.0.0.4 (local), d=12.0.0.1, len 100, unroutable
Jan 20 16:18:49.903: IP: s=12.0.0.1 (Serial0), d=34.0.0.4 (Serial0), len 100,
rcvd 3
Jan 20 16:18:49.907: IP: s=34.0.0.4 (local), d=12.0.0.1, len 100, unroutable
Jan 20 16:18:51.903: IP: s=12.0.0.1 (Serial0), d=34.0.0.4 (Serial0), len 100,
rcvd 3
Jan 20 16:18:51.907: IP: s=34.0.0.4 (local), d=12.0.0.1, len 100, unroutable
Jan 20 16:18:53.903: IP: s=12.0.0.1 (Serial0), d=34.0.0.4 (Serial0), len 100,

8/6/2019 Understanding Ping Trace Route
http://slidepdf.com/reader/full/understanding-ping-trace-route 9/22
rcvd 3
Jan 20 16:18:53.907: IP: s=34.0.0.4 (local), d=12.0.0.1, len 100, unroutable
Router4 receives the ICMP packets, and tries to answer to 12.0.0.1, but because it does not have a routeto this network, it simply fails.
Let us add a static route to Router4:
Router4(config)#ip route 0.0.0.0 0.0.0.0 Serial0
Now it works perfectly, and both sides can access each other:
Router1# ping 34.0.0.4
Type escape sequence to abort.
Sending 5, 100-byte ICMP Echos to 34.0.0.4, timeout is 2 seconds:
!!!!!
Success rate is 100 percent (5/5), round-trip min/avg/max = 32/35/36 ms
Interface Down
This is a situation where the interface stops working. In the example below, we try to ping Router4 fromRouter1:
Router1# ping 34.0.0.4
Type escape sequence to abort.
Sending 5, 100-byte ICMP Echos to 34.0.0.4, timeout is 2 seconds:
U.U.U
Success rate is 0 percent (0/5)
Since the routing is fine, we will do the troubleshooting step-by-step. First, let us try to ping Router2:
Router1# ping 12.0.0.2
Type escape sequence to abort.
Sending 5, 100-byte ICMP Echos to 12.0.0.2, timeout is 2 seconds:
!!!!!
Success rate is 100 percent (5/5), round-trip min/avg/max = 4/4/4 ms
From the above, we see that the problem lies between Router2 and Router3. One possibility is that theserial interface on Router3 has been shut down:
Router3#show ip interface brief
Serial0 34.0.0.3 YES manual up upSerial1 23.0.0.3 YES manual administratively down down
This is quite simple to fix:
Router3#configure terminal Enter configuration commands, one per line. End with CNTL/Z.
Router3(config)#interface s1 Router3(config-if)#no shutdown
Router3(config-if)#

8/6/2019 Understanding Ping Trace Route
http://slidepdf.com/reader/full/understanding-ping-trace-route 10/22
Jan 20 16:20:53.900: %LINK-3-UPDOWN: Interface Serial1, changed state to up
Jan 20 16:20:53.910: %LINEPROTO-5-UPDOWN: Line protocol on Interface Serial1,
changed state to up
Access-list Command
In this scenario, we want to allow only telnet traffic to enter Router4 through interface Serial0 .
Router4(config)# access-list 100 permit tcp any any eq telnetRouter4(config)#interface s0
Router4(config-if)#ip access-group 100 in
Router1#configure terminal
Enter configuration commands, one per line. End with CNTL/Z.
Router1(config)#access-list 100 permit ip host 12.0.0.1 host 34.0.0.4
Router1(config)#access-list 100 permit ip host 34.0.0.4 host 12.0.0.1 Router1(config)#end
Router1#debug ip packet 100 IP packet debugging is on
Router1#debug ip icmp
ICMP packet debugging is on
Refer to the Use the Debug Command section for using access lists with debug commands.
When we now try to ping Router4, we have the following:
Router1# ping 34.0.0.4
Type escape sequence to abort.
Sending 5, 100-byte ICMP Echos to 34.0.0.4, timeout is 2 seconds:
U.U.U
Success rate is 0 percent (0/5)
Jan 20 16:34:49.207: IP: s=12.0.0.1 (local), d=34.0.0.4 (Serial0), len 100,
sending
Jan 20 16:34:49.287: IP: s=34.0.0.4 (Serial0), d=12.0.0.1 (Serial0), len 56,
rcvd 3
Jan 20 16:34:49.291: ICMP: dst (12.0.0.1) administratively prohibited unreachabrcv from 34.0.0.4
Jan 20 16:34:49.295: IP: s=12.0.0.1 (local), d=34.0.0.4 (Serial0), len 100,
sending
Jan 20 16:34:51.295: IP: s=12.0.0.1 (local), d=34.0.0.4 (Serial0), len 100,
sending
Jan 20 16:34:51.367: IP: s=34.0.0.4 (Serial0), d=12.0.0.1 (Serial0), len 56,
rcvd 3
Jan 20 16:34:51.371: ICMP: dst (12.0.0.1) administratively prohibited unreachabrcv from 34.0.0.4
Jan 20 16:34:51.379: IP: s=12.0.0.1 (local), d=34.0.0.4 (Serial0), len 100,
sending
At the end of an access-list command, we always have an implicit "deny all". This means that the ICMPpackets that are entering the Serial 0 interface on Router4 are denied, and Router 4 sends an ICMP"administratively prohibited unreachable" message to the source of the original packet as shown in thedebug message. The solution is to add the following line in the access-list command:

8/6/2019 Understanding Ping Trace Route
http://slidepdf.com/reader/full/understanding-ping-trace-route 11/22
Router4(config)#access-list 100 permit icmp any any
Address Resolution Protocol (ARP) Issue
Here is a scenario with an Ethernet connection:
Router4# ping 100.0.0.5
Type escape sequence to abort.
Sending 5, 100-byte ICMP Echos to 100.0.0.5, timeout is 2 seconds:
Jan 20 17:04:05.167: IP: s=100.0.0.4 (local), d=100.0.0.5 (Ethernet0), len 100,
sending
Jan 20 17:04:05.171: IP: s=100.0.0.4 (local), d=100.0.0.5 (Ethernet0), len 100,
encapsulation failed.Jan 20 17:04:07.167: IP: s=100.0.0.4 (local), d=100.0.0.5 (Ethernet0), len 100,
sending
Jan 20 17:04:07.171: IP: s=100.0.0.4 (local), d=100.0.0.5 (Ethernet0), len 100,
encapsulation failed.
Jan 20 17:04:09.175: IP: s=100.0.0.4 (local), d=100.0.0.5 (Ethernet0), len 100,
sending
Jan 20 17:04:09.183: IP: s=100.0.0.4 (local), d=100.0.0.5 (Ethernet0), len 100,
encapsulation failed.
Jan 20 17:04:11.175: IP: s=100.0.0.4 (local), d=100.0.0.5 (Ethernet0), len 100,
sending
Jan 20 17:04:11.179: IP: s=100.0.0.4 (local), d=100.0.0.5 (Ethernet0), len 100,
encapsulation failed.
Jan 20 17:04:13.175: IP: s=100.0.0.4 (local), d=100.0.0.5 (Ethernet0), len 100,
sending
Jan 20 17:04:13.179: IP: s=100.0.0.4 (local), d=100.0.0.5 (Ethernet0), len 100,
encapsulation failed.
Success rate is 0 percent (0/5)
Router4#
In this example, the ping is not working due to "encapsulation failed". This means that the router knowson which interface it has to send the packet, but does not know how to do it. In this case, you need tounderstand how Address Resolution Protocol (ARP) works. See Configuring Address ResolutionMethods for a detailed explanation.

8/6/2019 Understanding Ping Trace Route
http://slidepdf.com/reader/full/understanding-ping-trace-route 12/22
Basically, ARP is a protocol used to map the Layer 2 address (MAC address) to a Layer 3 address (IPaddress). You can check this mapping using the show arp command:
Router4#show arp Protocol Address Age (min) Hardware Addr Type Interface
Internet 100.0.0.4 - 0000.0c5d.7a0d ARPA Ethernet0
Internet 100.0.0.1 10 0060.5cf4.a955 ARPA Ethernet0
Return to the "encapsulation failed" problem. We get a better idea of the problem using this debug command:
Router4#debug arpARP packet debugging is on
Router4# ping 100.0.0.5
Type escape sequence to abort.
Sending 5, 100-byte ICMP Echos to 100.0.0.5, timeout is 2 seconds:
Jan 20 17:19:43.843: IP ARP: creating incomplete entry for IP address: 100.0.0.
interface Ethernet0Jan 20 17:19:43.847: IP ARP: sent req src 100.0.0.4 0000.0c5d.7a0d,
dst 100.0.0.5 0000.0000.0000 Ethernet0.
Jan 20 17:19:45.843: IP ARP: sent req src 100.0.0.4 0000.0c5d.7a0d,
dst 100.0.0.5 0000.0000.0000 Ethernet0.
Jan 20 17:19:47.843: IP ARP: sent req src 100.0.0.4 0000.0c5d.7a0d,
dst 100.0.0.5 0000.0000.0000 Ethernet0.
Jan 20 17:19:49.843: IP ARP: sent req src 100.0.0.4 0000.0c5d.7a0d,
dst 100.0.0.5 0000.0000.0000 Ethernet0.
Jan 20 17:19:51.843: IP ARP: sent req src 100.0.0.4 0000.0c5d.7a0d,
dst 100.0.0.5 0000.0000.0000 Ethernet0.
Success rate is 0 percent (0/5)
The above output shows that Router4 is broadcasting packets by sending them to the Ethernet broadcastaddress FFFF.FFFF.FFFF. Here, the 0000.0000.0000 means that Router4 is looking for the MACaddress of the destination 100.0.0.5. Since it does not know the MAC address during the ARP request inthis example, it uses 0000.0000.000 as a placeholder in the broadcast frames sent out of interfaceEthernet 0, asking which MAC address corresponds to 100.0.0.5. If we do not get an answer, thecorresponding address in the show arp output is marked as incomplete:
Router4#show arpProtocol Address Age (min) Hardware Addr Type Interface
Internet 100.0.0.4 - 0000.0c5d.7a0d ARPA Ethernet0
Internet 100.0.0.5 0 Incomplete ARPA
Internet 100.0.0.1 2 0060.5cf4.a955 ARPA Ethernet0
After a predetermined period, this incomplete entry is purged from the ARP table. As long as thecorresponding MAC address is not in the ARP table, the ping fails as a result of "encapsulation failed".
Delay
By default, if you do not receive an answer from the remote end within two seconds, the ping fails:
Router1# ping 12.0.0.2

8/6/2019 Understanding Ping Trace Route
http://slidepdf.com/reader/full/understanding-ping-trace-route 13/22
Type escape sequence to abort.
Sending 5, 100-byte ICMP Echos to 12.0.0.2, timeout is 2 seconds:.....
Success rate is 0 percent (0/5)
On networks with a slow link or a long delay, two seconds are not enough. You can change this defaultusing an extended ping:
Router1# pingProtocol [ip]:
Target IP address: 12.0.0.2
Repeat count [5]:
Datagram size [100]:
Timeout in seconds [2]: 30Extended commands [n]:
Sweep range of sizes [n]:
Type escape sequence to abort.
Sending 5, 100-byte ICMP Echos to 12.0.0.2, timeout is 30 seconds:
!!!!!
Success rate is 100 percent (5/5), round-trip min/avg/max = 1458/2390/6066 ms
In the example above, increasing the timeout has led to a successful ping.
Note: The average round-trip time is more than two seconds.
Correct Source Address
Here is an example of a typical situation:
We add a LAN interface on Router1:
Router1(config)#interface e0 Router1(config-if)#ip address Router1(config-if)#ip address 20.0.0.1 255.255.255.0
From a station on the LAN, you can ping Router1. From Router1 you can ping Router2. But from astation on the LAN, you cannot ping Router2.
From Router1, you can ping Router2 because, by default, you use the IP address of the outgoinginterface as the source address in your ICMP packet. Router2 has not information about this new LAN.

8/6/2019 Understanding Ping Trace Route
http://slidepdf.com/reader/full/understanding-ping-trace-route 14/22
If it has to reply to a packet coming from this network, it does not know how to handle it.
Router1#debug ip packet IP packet debugging is on
Warning: Using the debug ip packet command on a production router can cause high cpu utilization.This may result in a severe performance degradation or a network outage. We recommend that you
carefully read Use the Debug Command before issuing debug commands.
Router1# ping 12.0.0.2
Type escape sequence to abort.
Sending 5, 100-byte ICMP Echos to 12.0.0.2, timeout is 2 seconds:
!!!!!
Success rate is 100 percent (5/5), round-trip min/avg/max = 4/7/9 ms
Router1#
Jan 20 16:35:54.227: IP: s=12.0.0.1 (local), d=12.0.0.2 (Serial0), len 100, sen
Jan 20 16:35:54.259: IP: s=12.0.0.2 (Serial0), d=12.0.0.1 (Serial0), len 100, r
The output example above works because the source address of the packet we are sending is s=12.0.0.1.If we want to simulate a packet coming from the LAN, we have to use an extended ping:
Router1# ping Protocol [ip]:
Target IP address: 12.0.0.2
Repeat count [5]:
Datagram size [100]:
Timeout in seconds [2]:
Extended commands [n]: y
Source address or interface: 20.0.0.1Type of service [0]:
Set DF bit in IP header? [no]:
Validate reply data? [no]:Data pattern [0xABCD]:
Loose, Strict, Record, Timestamp, Verbose[none]:
Sweep range of sizes [n]:
Type escape sequence to abort.
Sending 5, 100-byte ICMP Echos to 12.0.0.2, timeout is 2 seconds:
Jan 20 16:40:18.303: IP: s=20.0.0.1 (local), d=12.0.0.2 (Serial0), len 100,
sending.
Jan 20 16:40:20.303: IP: s=20.0.0.1 (local), d=12.0.0.2 (Serial0), len 100,
sending.
Jan 20 16:40:22.303: IP: s=20.0.0.1 (local), d=12.0.0.2 (Serial0), len 100,
sending.
Jan 20 16:40:24.303: IP: s=20.0.0.1 (local), d=12.0.0.2 (Serial0), len 100,sending
Jan 20 16:40:26.303: IP: s=20.0.0.1 (local), d=12.0.0.2 (Serial0), len 100,
sending.
Success rate is 0 percent (0/5)
This time, the source address is 20.0.0.1, and it is not working! We are sending our packets, but we arenot receiving anything. To fix this issue, we simply have to add a route to 20.0.0.0 in Router2.
The basic rule is that the pinged device should also know how to send the reply to the source of the ping.
8/6/2019 Understanding Ping Trace Route
http://slidepdf.com/reader/full/understanding-ping-trace-route 15/22
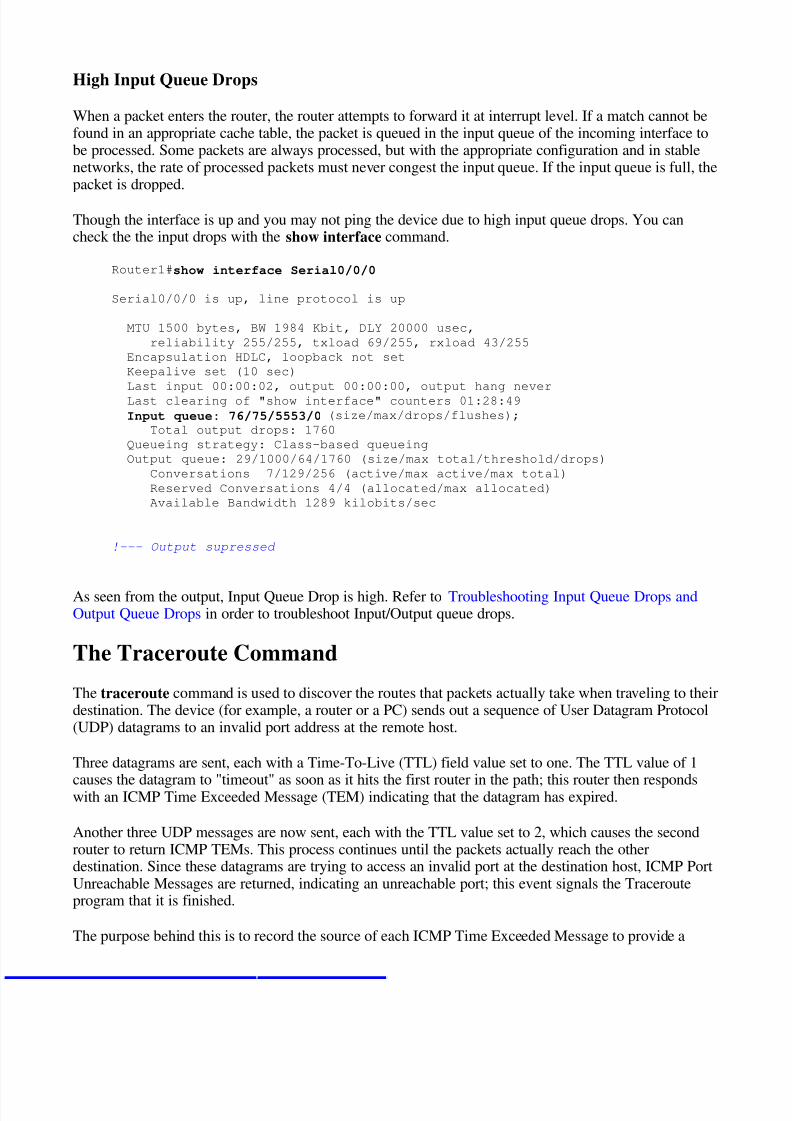
High Input Queue Drops
When a packet enters the router, the router attempts to forward it at interrupt level. If a match cannot befound in an appropriate cache table, the packet is queued in the input queue of the incoming interface tobe processed. Some packets are always processed, but with the appropriate configuration and in stablenetworks, the rate of processed packets must never congest the input queue. If the input queue is full, thepacket is dropped.
Though the interface is up and you may not ping the device due to high input queue drops. You cancheck the the input drops with the show interface command.
Router1#show interface Serial0/0/0
Serial0/0/0 is up, line protocol is up
MTU 1500 bytes, BW 1984 Kbit, DLY 20000 usec,
reliability 255/255, txload 69/255, rxload 43/255
Encapsulation HDLC, loopback not set
Keepalive set (10 sec)
Last input 00:00:02, output 00:00:00, output hang never
Last clearing of "show interface" counters 01:28:49
Input queue: 76/75/5553/0 (size/max/drops/flushes);
Total output drops: 1760
Queueing strategy: Class-based queueing
Output queue: 29/1000/64/1760 (size/max total/threshold/drops)
Conversations 7/129/256 (active/max active/max total)
Reserved Conversations 4/4 (allocated/max allocated)
Available Bandwidth 1289 kilobits/sec
!--- Output supressed
As seen from the output, Input Queue Drop is high. Refer to Troubleshooting Input Queue Drops andOutput Queue Drops in order to troubleshoot Input/Output queue drops.
The Traceroute Command
The traceroute command is used to discover the routes that packets actually take when traveling to theirdestination. The device (for example, a router or a PC) sends out a sequence of User Datagram Protocol(UDP) datagrams to an invalid port address at the remote host.
Three datagrams are sent, each with a Time-To-Live (TTL) field value set to one. The TTL value of 1
causes the datagram to "timeout" as soon as it hits the first router in the path; this router then respondswith an ICMP Time Exceeded Message (TEM) indicating that the datagram has expired.
Another three UDP messages are now sent, each with the TTL value set to 2, which causes the secondrouter to return ICMP TEMs. This process continues until the packets actually reach the otherdestination. Since these datagrams are trying to access an invalid port at the destination host, ICMP PortUnreachable Messages are returned, indicating an unreachable port; this event signals the Tracerouteprogram that it is finished.
The purpose behind this is to record the source of each ICMP Time Exceeded Message to provide a
8/6/2019 Understanding Ping Trace Route
http://slidepdf.com/reader/full/understanding-ping-trace-route 16/22
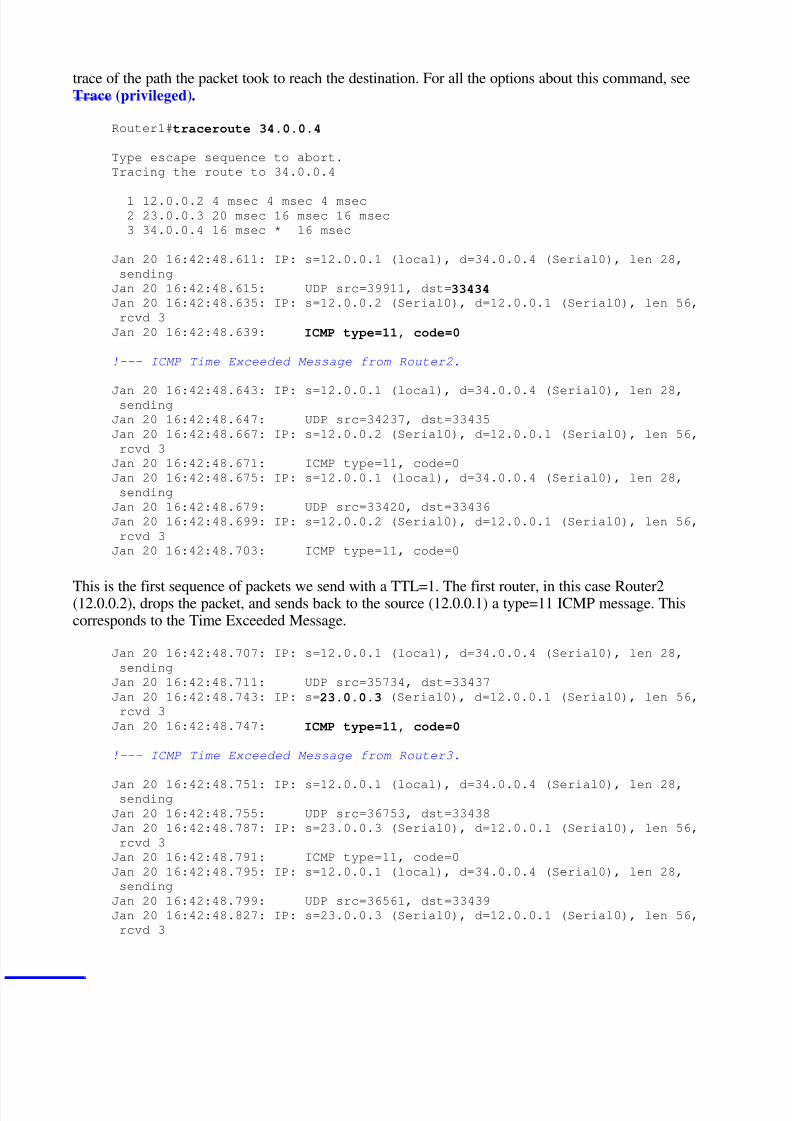
trace of the path the packet took to reach the destination. For all the options about this command, seeTrace (privileged).
Router1#traceroute 34.0.0.4
Type escape sequence to abort.
Tracing the route to 34.0.0.4
1 12.0.0.2 4 msec 4 msec 4 msec
2 23.0.0.3 20 msec 16 msec 16 msec
3 34.0.0.4 16 msec * 16 msec
Jan 20 16:42:48.611: IP: s=12.0.0.1 (local), d=34.0.0.4 (Serial0), len 28,
sending
Jan 20 16:42:48.615: UDP src=39911, dst=33434 Jan 20 16:42:48.635: IP: s=12.0.0.2 (Serial0), d=12.0.0.1 (Serial0), len 56,
rcvd 3
Jan 20 16:42:48.639: ICMP type=11, code=0
!--- ICMP Time Exceeded Message from Router2.
Jan 20 16:42:48.643: IP: s=12.0.0.1 (local), d=34.0.0.4 (Serial0), len 28,sending
Jan 20 16:42:48.647: UDP src=34237, dst=33435
Jan 20 16:42:48.667: IP: s=12.0.0.2 (Serial0), d=12.0.0.1 (Serial0), len 56,
rcvd 3
Jan 20 16:42:48.671: ICMP type=11, code=0
Jan 20 16:42:48.675: IP: s=12.0.0.1 (local), d=34.0.0.4 (Serial0), len 28,
sending
Jan 20 16:42:48.679: UDP src=33420, dst=33436
Jan 20 16:42:48.699: IP: s=12.0.0.2 (Serial0), d=12.0.0.1 (Serial0), len 56,
rcvd 3
Jan 20 16:42:48.703: ICMP type=11, code=0
This is the first sequence of packets we send with a TTL=1. The first router, in this case Router2(12.0.0.2), drops the packet, and sends back to the source (12.0.0.1) a type=11 ICMP message. Thiscorresponds to the Time Exceeded Message.
Jan 20 16:42:48.707: IP: s=12.0.0.1 (local), d=34.0.0.4 (Serial0), len 28,
sending
Jan 20 16:42:48.711: UDP src=35734, dst=33437
Jan 20 16:42:48.743: IP: s=23.0.0.3 (Serial0), d=12.0.0.1 (Serial0), len 56,
rcvd 3
Jan 20 16:42:48.747: ICMP type=11, code=0
!--- ICMP Time Exceeded Message from Router3.
Jan 20 16:42:48.751: IP: s=12.0.0.1 (local), d=34.0.0.4 (Serial0), len 28,sending
Jan 20 16:42:48.755: UDP src=36753, dst=33438
Jan 20 16:42:48.787: IP: s=23.0.0.3 (Serial0), d=12.0.0.1 (Serial0), len 56,
rcvd 3
Jan 20 16:42:48.791: ICMP type=11, code=0
Jan 20 16:42:48.795: IP: s=12.0.0.1 (local), d=34.0.0.4 (Serial0), len 28,
sending
Jan 20 16:42:48.799: UDP src=36561, dst=33439
Jan 20 16:42:48.827: IP: s=23.0.0.3 (Serial0), d=12.0.0.1 (Serial0), len 56,
rcvd 3

8/6/2019 Understanding Ping Trace Route
http://slidepdf.com/reader/full/understanding-ping-trace-route 17/22
Jan 20 16:42:48.831: ICMP type=11, code=0
The same process occurs for Router3 (23.0.0.3) with a TTL=2:
Jan 20 16:42:48.839: IP: s=12.0.0.1 (local), d=34.0.0.4 (Serial0), len 28,
sending
Jan 20 16:42:48.843: UDP src=34327, dst=33440
Jan 20 16:42:48.887: IP: s=34.0.0.4 (Serial0), d=12.0.0.1 (Serial0), len 56,
rcvd 3
Jan 20 16:42:48.891: ICMP type=3, code=3
!--- Port Unreachable message from Router4.
Jan 20 16:42:48.895: IP: s=12.0.0.1 (local), d=34.0.0.4 (Serial0), len 28,
sending
Jan 20 16:42:48.899: UDP src=37534, dst=33441
Jan 20 16:42:51.895: IP: s=12.0.0.1 (local), d=34.0.0.4 (Serial0), len 28,
sending
Jan 20 16:42:51.899: UDP src=37181, dst=33442
Jan 20 16:42:51.943: IP: s=34.0.0.4 (Serial0), d=12.0.0.1 (Serial0), len 56,
rcvd 3
Jan 20 16:42:51.947: ICMP type=3, code=3
With a TTL=3, we finally reach Router4. This time, since the port is not valid, Router4 sends back toRouter1 an ICMP message with type=3, a Destination Unreachable Message, and code=3 meaning portunreachable.
The table below lists the characters that can appear in the traceroute command output.
Performance
IP Traceroute Text Characters
Character Description
nn msecFor each node, the round-trip time inmilliseconds for the specified number of probes
* The probe timed out
AAdministratively prohibited (example, access-list)
Q Source quench (destination too busy)
I User interrupted test
U Port unreachable
H Host unreachable
N Network unreachable
P Protocol Unreachable
T Timeout
? Unknown packet type

8/6/2019 Understanding Ping Trace Route
http://slidepdf.com/reader/full/understanding-ping-trace-route 18/22
Using the ping and traceroute commands, we obtain the round-trip time (RTT). This is the timerequired to send an echo packet, and get an answer back. This can be useful to have a rough idea of thedelay on the link. However, these figures are not precise enough to be used for performance evaluation.
When a packet destination is the router itself, this packet has to be process-switched. The processor hasto handle the information from this packet, and send an answer back. This is not the main goal of arouter. By definition, a router is built to route packets. Answering a ping is offered as a best-effort
service.
To illustrate this, here is an example of a ping from Router1 to Router2:
Router1# ping 12.0.0.2
Type escape sequence to abort.
Sending 5, 100-byte ICMP Echos to 12.0.0.2, timeout is 2 seconds:
!!!!!
Success rate is 100 percent (5/5), round-trip min/avg/max = 4/4/4 ms
The RTT is approximately four milliseconds. After you enable some process-intensive features on
Router2, try to ping Router2 from Router1.
Router1# ping 12.0.0.2
Type escape sequence to abort.
Sending 5, 100-byte ICMP Echos to 12.0.0.2, timeout is 2 seconds:
!!!!!
Success rate is 100 percent (5/5), round-trip min/avg/max = 24/25/28 ms
The RTT has dramatically increased here. Router2 is quite busy, and answering the ping is not its mainpriority.
A better way to test router performance is with traffic going through the router:
The traffic is then fast-switched, and is handled by the router with the highest priority. To illustrate this,let us go back to our basic network:

8/6/2019 Understanding Ping Trace Route
http://slidepdf.com/reader/full/understanding-ping-trace-route 19/22
Let us ping Router3 from Router1:
Router1# ping 23.0.0.3
Type escape sequence to abort.
Sending 5, 100-byte ICMP Echos to 23.0.0.3, timeout is 2 seconds:
!!!!!
Success rate is 100 percent (5/5), round-trip min/avg/max = 32/32/32 ms
The traffic is going through Router2, and is now fast-switched.
Now let us enable the process-intensive feature on Router2:
Router1# ping 23.0.0.3
Type escape sequence to abort.
Sending 5, 100-byte ICMP Echos to 23.0.0.3, timeout is 2 seconds:
!!!!!
Success rate is 100 percent (5/5), round-trip min/avg/max = 32/32/36 ms
There is almost no difference. This is because, on Router2, the packets are now handled at interruptlevel.
Use the Debug CommandBefore issuing debug commands, please see Important Information on Debug Commands.
The different debug commands we have used so far gives us an insight into what happens when we usea ping or traceroute command. They can also be useful for troubleshooting. However, in a productionenvironment, debugs should be used with caution. If your CPU is not powerful, or if you have a lot of process-switched packets, they can easily stall your device. There are a couple of ways to minimize theimpact of the debug command on the router. One way is to use access lists to narrow down the specifictraffic that you want to monitor. Here is an example:
Router4#debug ip packet ?
<1-199> Access list<1300-2699> Access list (expanded range)
detail Print more debugging detail
Router4#configure terminal
Router4(config)#access-list 150 permit ip host 12.0.0.1 host 34.0.0.4Router4(config)#^Z
Router4#debug ip packet 150IP packet debugging is on for access list 150

8/6/2019 Understanding Ping Trace Route
http://slidepdf.com/reader/full/understanding-ping-trace-route 20/22
Router4#show debugGeneric IP:
IP packet debugging is on for access list 150
Router4#show access-list Extended IP access list 150
permit ip host 12.0.0.1 host 34.0.0.4 (5 matches)
With this configuration, Router4 only prints the debug message that matches the access-list 150. A pingcoming from Router1 causes the following message to be displayed:
Router4#
Jan 20 16:51:16.911: IP: s=12.0.0.1 (Serial0), d=34.0.0.4 (Serial0), len 100,
rcvd 3
Jan 20 16:51:17.003: IP: s=12.0.0.1 (Serial0), d=34.0.0.4 (Serial0), len 100,
rcvd 3
Jan 20 16:51:17.095: IP: s=12.0.0.1 (Serial0), d=34.0.0.4 (Serial0), len 100,
rcvd 3
Jan 20 16:51:17.187: IP: s=12.0.0.1 (Serial0), d=34.0.0.4 (Serial0), len 100,
rcvd 3
Jan 20 16:51:17.279: IP: s=12.0.0.1 (Serial0), d=34.0.0.4 (Serial0), len 100,
rcvd 3
We no longer see the answer from Router4 because, these packets do not match the access-list. To seethem, we should add the following:
Router4(config)#access-list 150 permit ip host 12.0.0.1 host 34.0.0.4Router4(config)#access-list 150 permit ip host 34.0.0.4 host 12.0.0.1
We then have:
Jan 20 16:53:16.527: IP: s=12.0.0.1 (Serial0), d=34.0.0.4 (Serial0), len 100,
rcvd 3
Jan 20 16:53:16.531: IP: s=34.0.0.4 (local), d=12.0.0.1 (Serial0), len 100,sending
Jan 20 16:53:16.627: IP: s=12.0.0.1 (Serial0), d=34.0.0.4 (Serial0), len 100,
rcvd 3
Jan 20 16:53:16.635: IP: s=34.0.0.4 (local), d=12.0.0.1 (Serial0), len 100,
sending
Jan 20 16:53:16.727: IP: s=12.0.0.1 (Serial0), d=34.0.0.4 (Serial0), len 100,
rcvd 3
Jan 20 16:53:16.731: IP: s=34.0.0.4 (local), d=12.0.0.1 (Serial0), len 100,
sending
Jan 20 16:53:16.823: IP: s=12.0.0.1 (Serial0), d=34.0.0.4 (Serial0), len 100,
rcvd 3
Jan 20 16:53:16.827: IP: s=34.0.0.4 (local), d=12.0.0.1 (Serial0), len 100,
sendingJan 20 16:53:16.919: IP: s=12.0.0.1 (Serial0), d=34.0.0.4 (Serial0), len 100,
rcvd 3
Jan 20 16:53:16.923: IP: s=34.0.0.4 (local), d=12.0.0.1 (Serial0), len 100,
sending
Another way of minimizing the impact of the debug command is to buffer the debug messages andshow them using the show log command once the debug has been turned off:
Router4#configure terminal
Router4(config)#no logging console

8/6/2019 Understanding Ping Trace Route
http://slidepdf.com/reader/full/understanding-ping-trace-route 21/22
Router4(config)#logging buffered 5000Router4(config)#^Z
Router4#debug ip packet
IP packet debugging is on
Router4# ping 12.0.0.1
Type escape sequence to abort.
Sending 5, 100-byte ICMP Echos to 12.0.0.1, timeout is 2 seconds:!!!!!
Success rate is 100 percent (5/5), round-trip min/avg/max = 36/36/37 ms
Router4#undebug allAll possible debugging has been turned off
Router4#show logSyslog logging: enabled (0 messages dropped, 0 flushes, 0 overruns)
Console logging: disabled
Monitor logging: level debugging, 0 messages logged
Buffer logging: level debugging, 61 messages logged
Trap logging: level informational, 59 message lines logged
Log Buffer (5000 bytes):
Jan 20 16:55:46.587: IP: s=34.0.0.4 (local), d=12.0.0.1 (Serial0), len 100,
sending
Jan 20 16:55:46.679: IP: s=12.0.0.1 (Serial0), d=34.0.0.4 (Serial0), len 100,
rcvd 3
As you can see, the ping and traceroute commands are very helpful utilities that you can use totroubleshoot network access problems. They are also very easy to use. As these two commands are themost widely used commands by network engineers, understanding them is very crucial fortroubleshooting network connectivity.
Cisco Support Community - Featured Conversations
Cisco Support Community is a forum for you to ask and answer questions, share suggestions, andcollaborate with your peers. Below are just some of the most recent and relevant conversationshappening right now.
Ping but not traceroute 21.09.2009 09:40
Understanding commands 14.12.2007 12:45
ping or traceroute 04.09.2003 15:48
Ping & traceroute 14.04.2009 06:53
Want to see more? Join us by clicking here
suryakant.chavan 3 Replies
skhirbash 2 Replies
duyngo 3 Replies
suthomas1 1 Reply

8/6/2019 Understanding Ping Trace Route
http://slidepdf.com/reader/full/understanding-ping-trace-route 22/22
Related Information
Using the Extended ping and Extended traceroute Commands Technical Support - Cisco Systems
Contacts & Feedback | Help | Site Map © 2009 - 2010 Cisco Systems, Inc. All rights reserved. Terms & Conditions | Privacy Statement | Cookie Policy | Trademarksof Cisco Systems, Inc.
ping and traceroute 16.06.2006 10:02
traceroute and ping 17.05.2008 19:25
Re: Understanding traceroute results ... 12.05.2010 00:08
traceroute vs. ping 31.05.2008 13:26
Ping and traceroute 02.02.2009 03:00
Ping/Traceroute interpretation27.09.2004 18:41
rangap26. 9 Replies
olakunle06 3 Replies
sanjay.nadarajah 1 Reply
axfalk 15 Replies
itdsmartnet 2 Replies
https://supportforums.cisco.com/people/bigeric%40hknet.com 1 Reply
Subscribe Start A New Discussion