Embed Size (px)
DESCRIPTION
Understanding Service Needs. Objectives. To examine the context of service delivery in local government To examine how we can understand service needs To look at techniques for understanding service costs and demand patterns - PowerPoint PPT Presentation
Citation preview
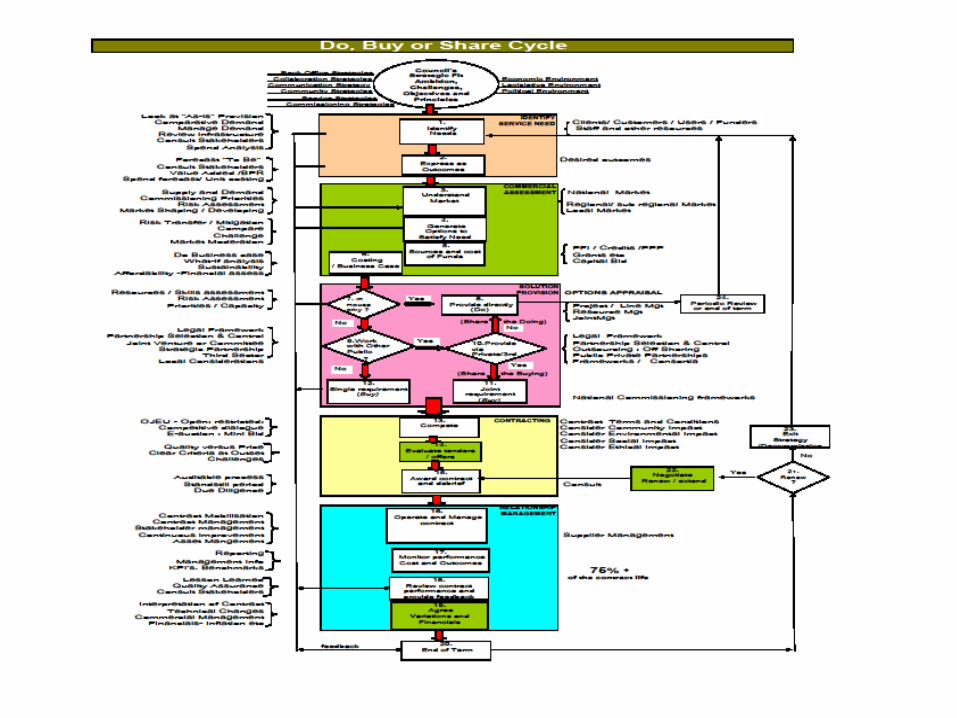
Buy
Share
Do
Understanding Service Needs
To examine the context of service delivery in local government To examine how we can understand service needs To look at techniques for understanding service costs and demand
patterns To revisit stakeholder consultation in the light of political initiatives
such as Localism and the Big Society To examine stools for service delivery optimisation
Objectives
This programme is the 1st Module in a series covering every aspect of the Do Buy Share approach
Completion of all the modules will provide the knowledge required for the ILM Level 3 Award in Service Improvement
A work based assignment is required to be awarded the qualification
Further details will be available on the Do Buy Share website A link will be mailed to you shortly
Links to other procurement programmes
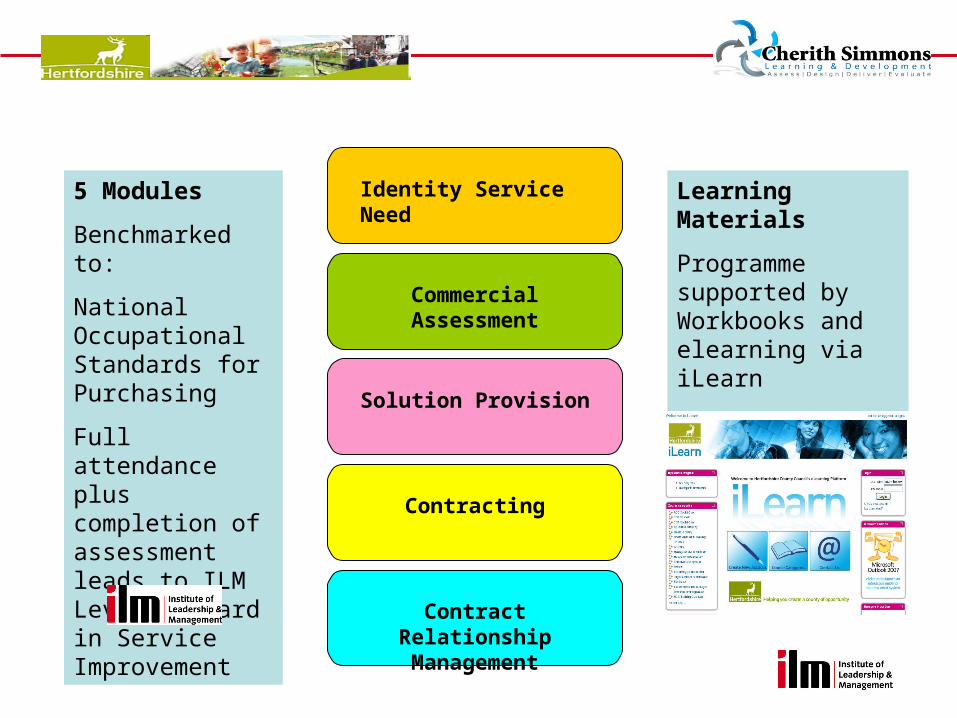
Contract Relationship Management
Contracting
Solution Provision
Commercial Assessment
Identity Service Need5 Modules
Benchmarked to:
National Occupational Standards for Purchasing
Full attendance plus completion of assessment leads to ILM Level 3 Award in Service Improvement
Learning Materials
Programme supported by Workbooks and elearning via iLearn
Dedicated Client service manager
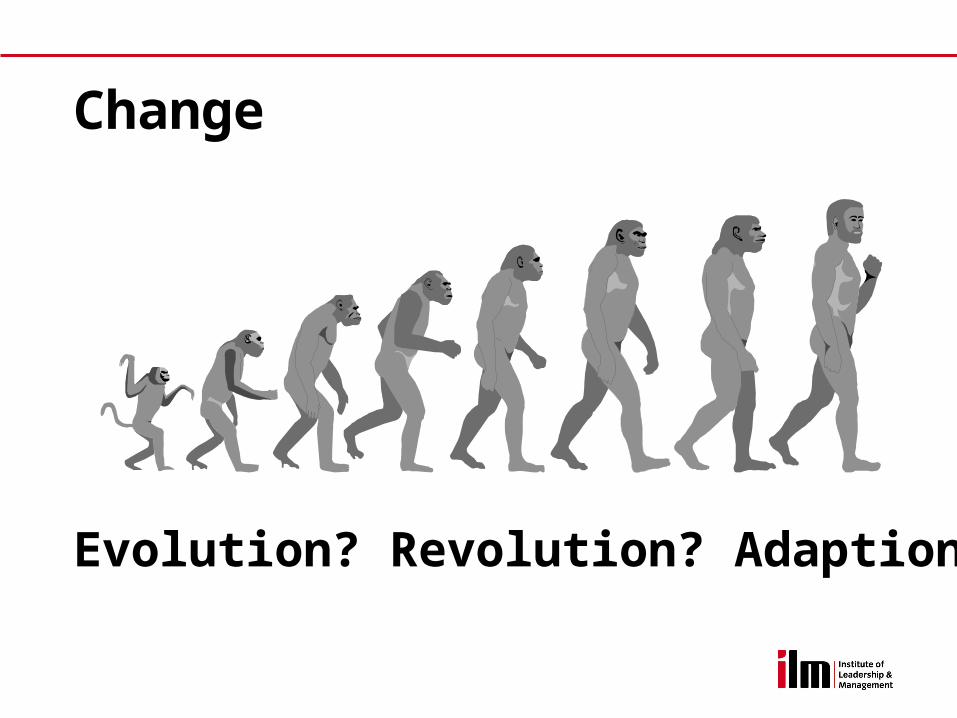
Change
Evolution? Revolution? Adaption?
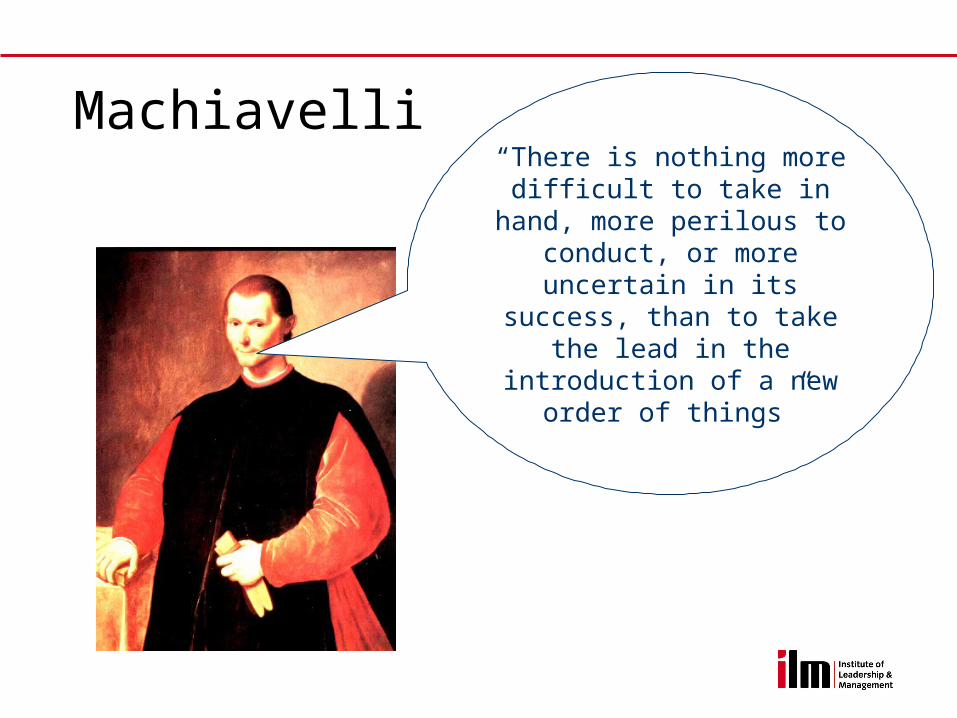
Machiavelli“There is nothing more difficult to take in hand,
more perilous to conduct, or more uncertain in its
success, than to take the lead in the introduction of
a new order of things”
Sir Winston Churchill
“To improve is to change;
to be perfect is to change often”
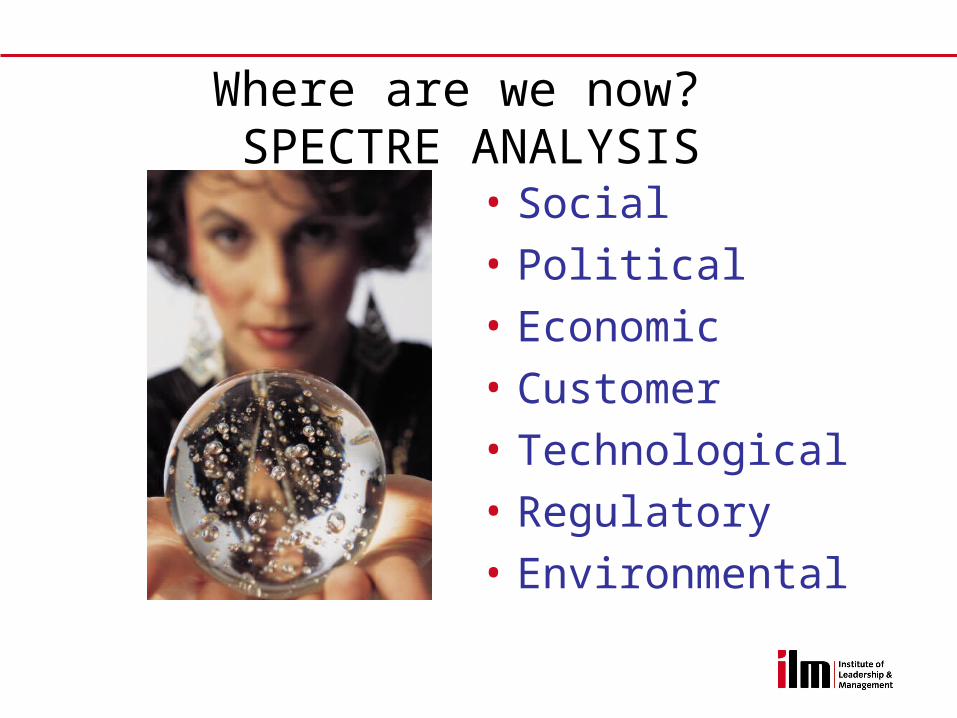
Where are we now? SPECTRE ANALYSIS
• Social
• Political
• Economic
• Customer
• Technological
• Regulatory
• Environmental
“We trained hard, but it seemed that every time we were beginning to form up
into teams we would be reorganised. I was to learn later in life that we tend to meet any new situation by
reorganising, and a wonderful method it can be for creating the illusion of progress, while producing confusion, inefficiency and
demoralisation.”
Caius Petronius AD 66
Single loop learning tries to keep up!
Double Loop Learning – seeks to create
Demand MappingHow can we make the service fit the demand?
Understanding patterns in demand
SMART resourcing
Thinking outside the square
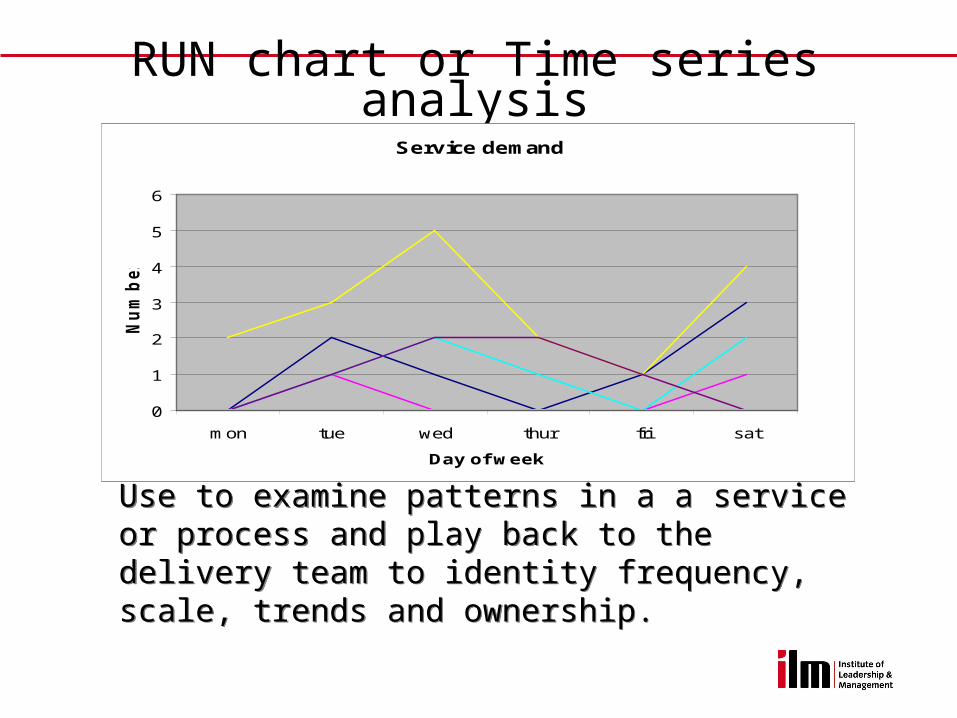
RUN chart or Time series analysis
Use to examine patterns in a a service or process and play back to the delivery team to identity frequency, scale, trends and ownership.
Use to examine patterns in a a service or process and play back to the delivery team to identity frequency, scale, trends and ownership.
Service demand
0
1
2
3
4
5
6
mon tue wed thur fri sat
Day of week
Nu
mb
ers
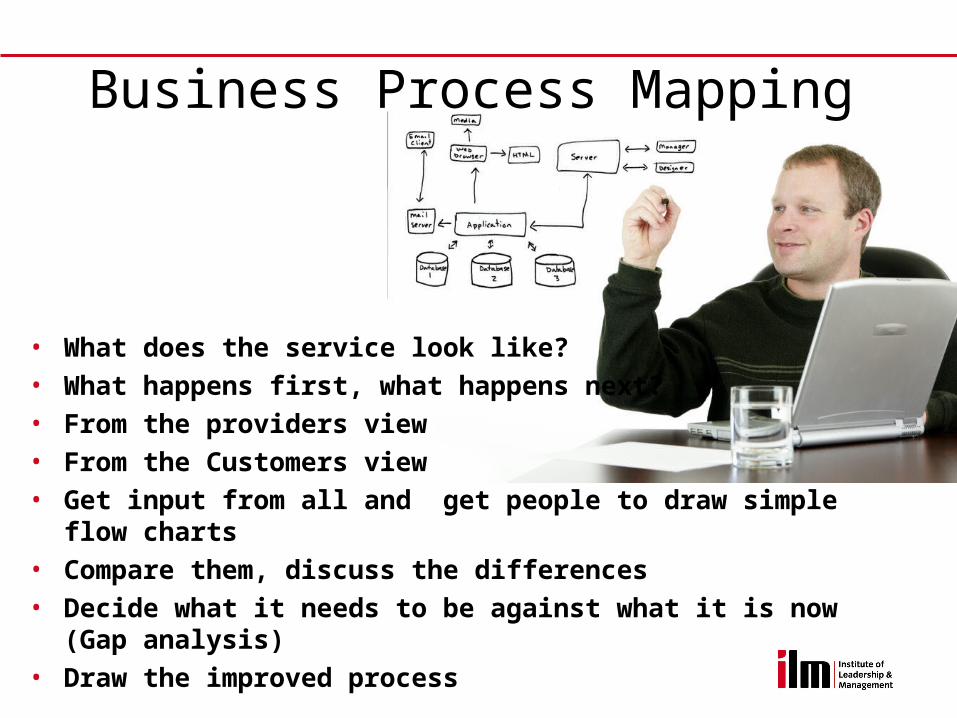
Business Process Mapping
• What does the service look like?• What happens first, what happens next?• From the providers view• From the Customers view • Get input from all and get people to draw simple flow charts• Compare them, discuss the differences• Decide what it needs to be against what it is now (Gap
analysis)• Draw the improved process
The Service Chain – looking for the weak links
The Kano Questionnaire
What value is added at each stage of the process?
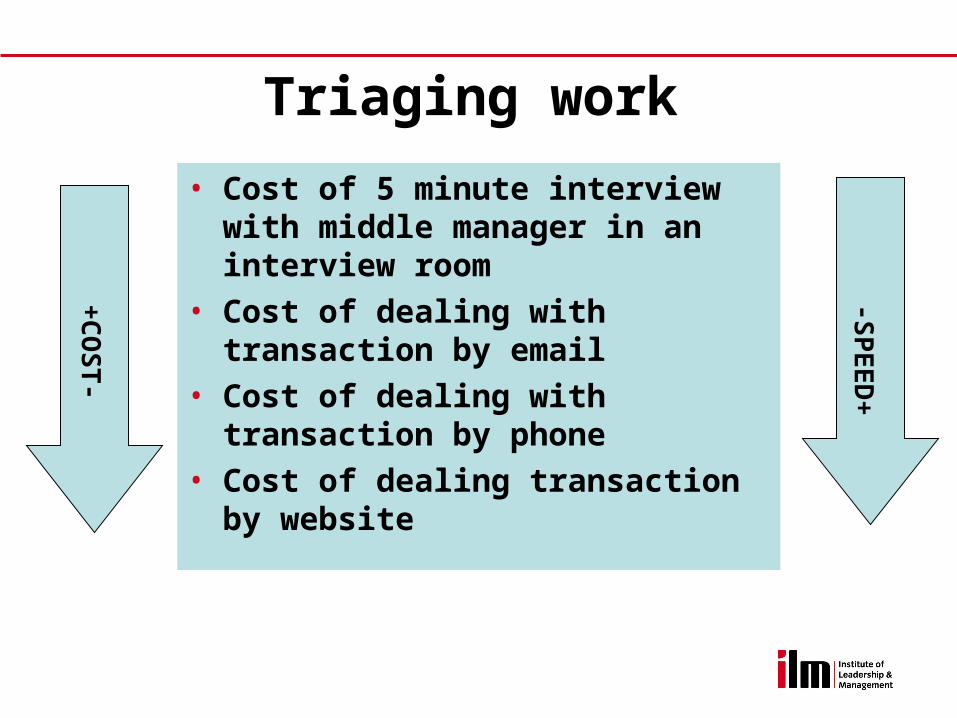
Triaging work
• Cost of 5 minute interview with middle manager in an interview room
• Cost of dealing with transaction by email
• Cost of dealing with transaction by phone
• Cost of dealing transaction by website
+C
OS
T-
-SP
EED
+
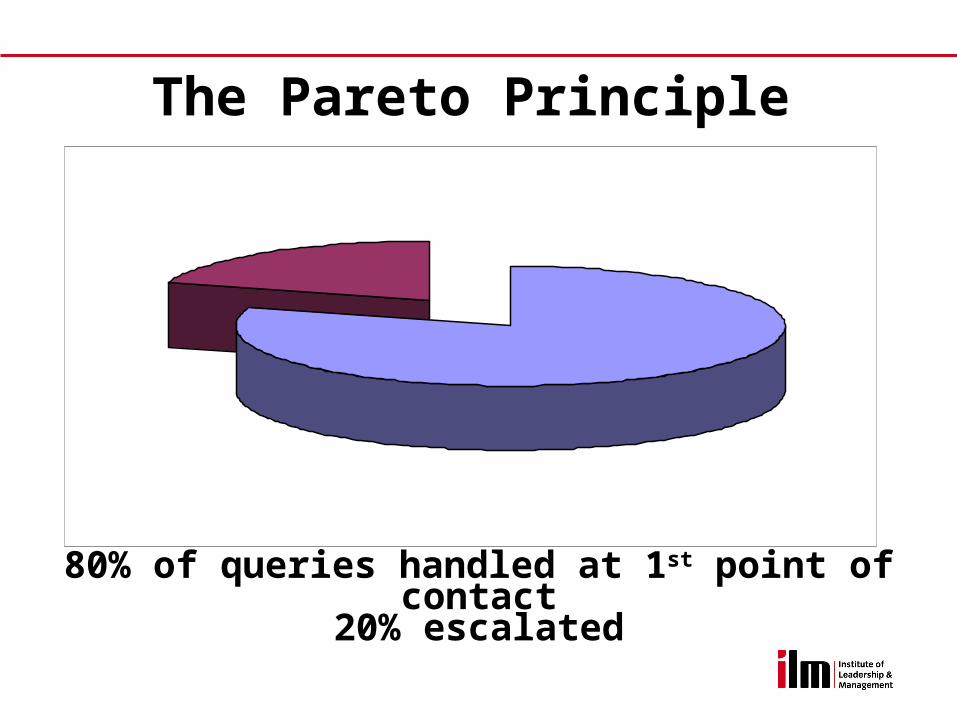
The Pareto Principle
80% of queries handled at 1st point of contact20% escalated
The Concept of Fast FixesOrganisations may have several departments that have direct interaction with the customer.
These include :
– Those on the front line - 1st level support
– Those who try to fix the problem initially – 2nd level support
– Those to whom the problem is sent if it can't be fixed- 3rd level support
– Managers who may get involved if the customer is irate
– Design for minimum customer handling – Why can’t the first point of contact fix the problem ?
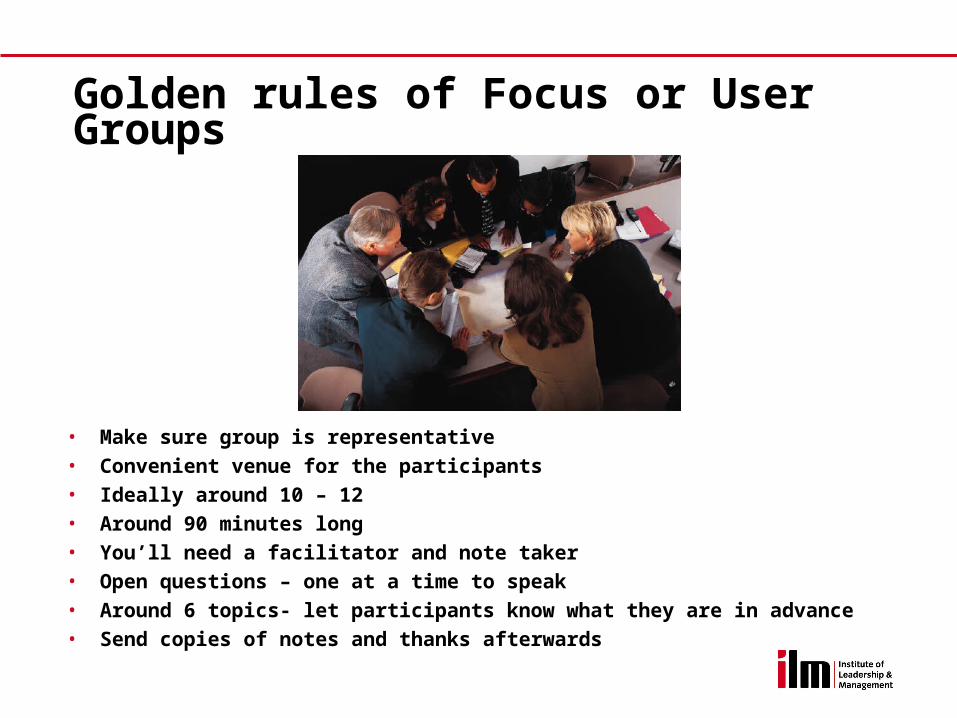
Golden rules of Focus or User Groups
• Make sure group is representative• Convenient venue for the participants• Ideally around 10 – 12 • Around 90 minutes long• You’ll need a facilitator and note taker • Open questions – one at a time to speak• Around 6 topics- let participants know what they are in advance• Send copies of notes and thanks afterwards
• Make sure sample is representative
• One side of A4 printed on yellow paper
• Minimum questions to increase response, ideally 10
• Measure degrees of satisfaction and dissatisfaction (disagree strongly/disagree/agree/agree strongly)
• Use 4 tick boxes per question - simple language
• Allow room for comment
• Design for easy compilation of results
Golden Rules of Surveys
23
A Questionable QuestionnaireSuppose that a summer camp director had prepared the
following questionnaire to use in interviewing the parents of prospective campers.
1. What is your income to the nearest £100 ?People don’t usually know their income to the
nearest 100 nor do they want to reveal their income that closely. Moreover, a researcher should never open a questionnaire with such a personal question.
2. Are you a strong or weak supporter of overnight summer camping for your children ?
What do strong and weak mean ?
24
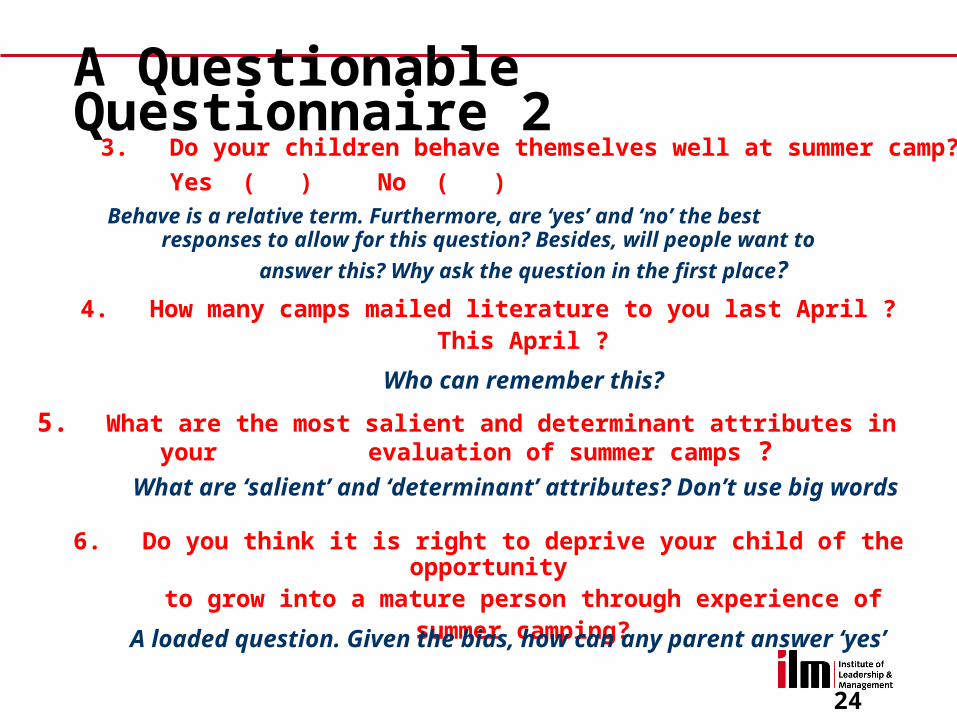
A Questionable Questionnaire 2 3. Do your children behave themselves well at summer camp?
Yes ( ) No ( )Behave is a relative term. Furthermore, are ‘yes’ and ‘no’ the best
responses to allow for this question? Besides, will people want to
answer this? Why ask the question in the first place?4. How many camps mailed literature to you last April ?
This April ?
Who can remember this?
5. What are the most salient and determinant attributes in your evaluation of summer camps ?
What are ‘salient’ and ‘determinant’ attributes? Don’t use big words
6. Do you think it is right to deprive your child of the opportunityto grow into a mature person through experience of
summer camping?A loaded question. Given the bias, how can any parent answer
‘yes’
Impressions
About your organisation
What would you like your customers
to say about your organisation and
the way it deals with them ?
About You
What would you like your customers
to say about you and the way you
deal with them ?
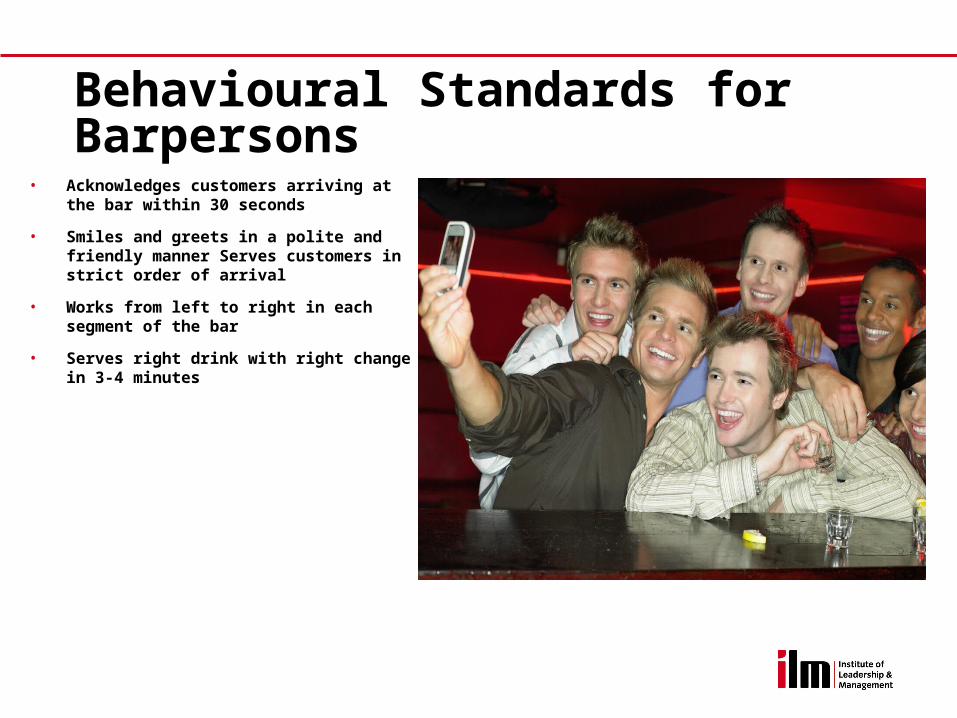
Behavioural Standards for Barpersons
• Acknowledges customers arriving at the bar within 30 seconds
• Smiles and greets in a polite and friendly manner Serves customers in strict order of arrival
• Works from left to right in each segment of the bar
• Serves right drink with right change in 3-4 minutes
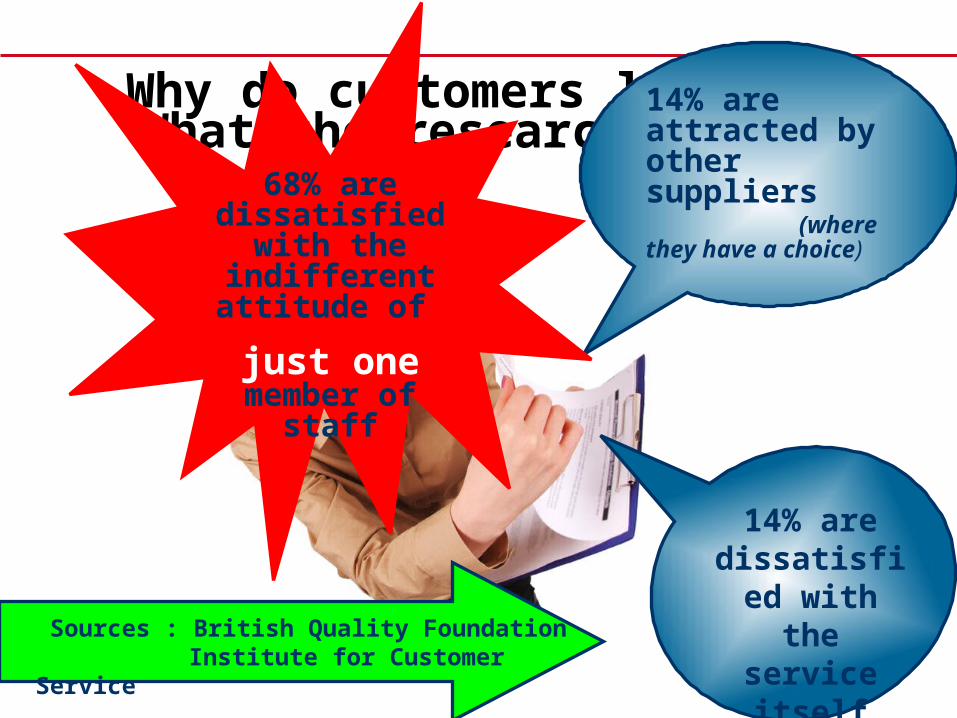
Why do customers leave?–What the research says
14% are attracted by other suppliers (where they have a choice)
14% are dissatisfied
with the service itself Sources : British Quality Foundation
Institute for Customer Service
68% are dissatisfied with
the indifferent attitude of
just one member of staff
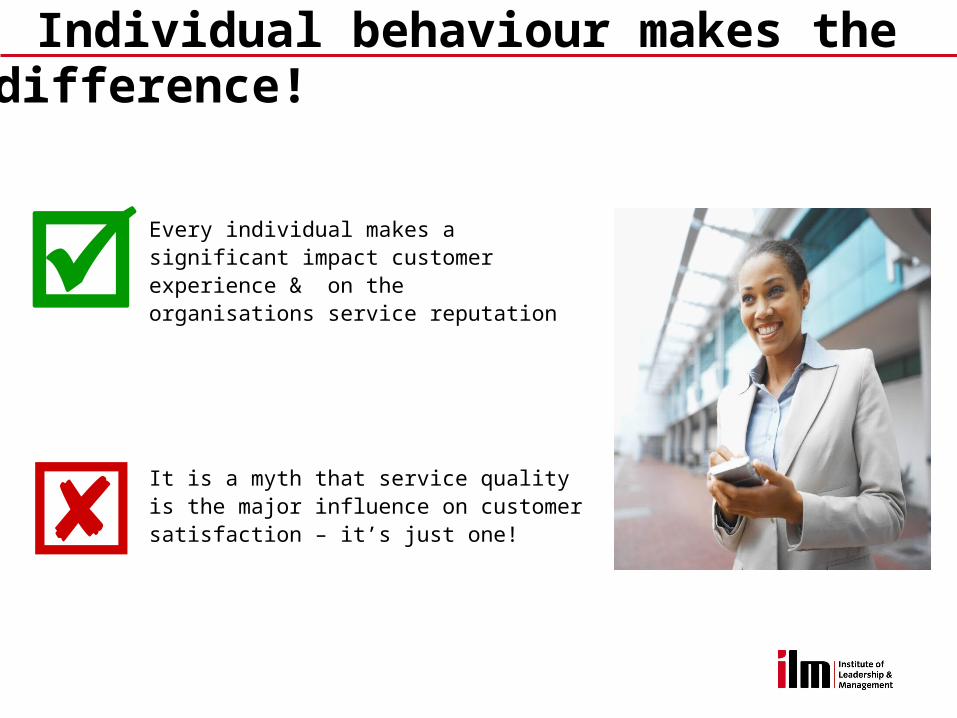
Individual behaviour makes the
It is a myth that service quality is the major influence on customer satisfaction – it’s just one!
Every individual makes a significant impact customer experience & on the organisations service reputation
difference!
Why are people and organisations
often resistant to change?
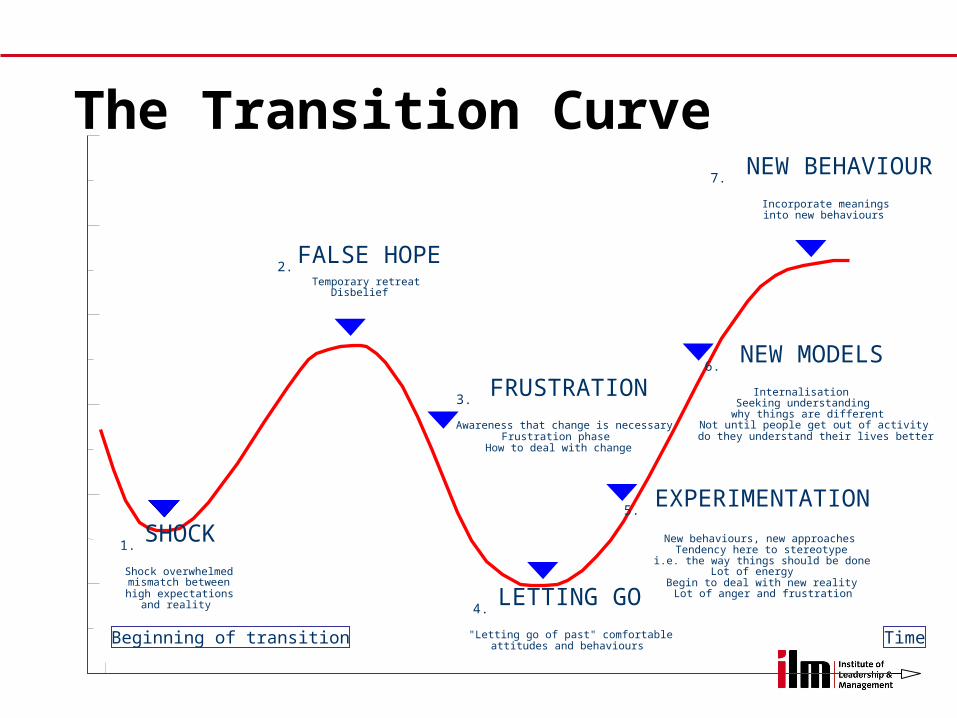
The Transition Curve
1. SHOCK
Shock overwhelmedmismatch betweenhigh expectations
and reality
6. NEW MODELS
InternalisationSeeking understandingwhy things are different
Not until people get out of activitydo they understand their lives better
5. EXPERIMENTATION
New behaviours, new approachesTendency here to stereotype
i.e. the way things should be doneLot of energy
Begin to deal with new realityLot of anger and frustration
4. LETTING GO
"Letting go of past" comfortable attitudes and behaviours
3. FRUSTRATION
Awareness that change is necessaryFrustration phase
How to deal with change
2. FALSE HOPE
Temporary retreatDisbelief
7. NEW BEHAVIOUR
Incorporate meaningsinto new behaviours
TimeBeginning of transition
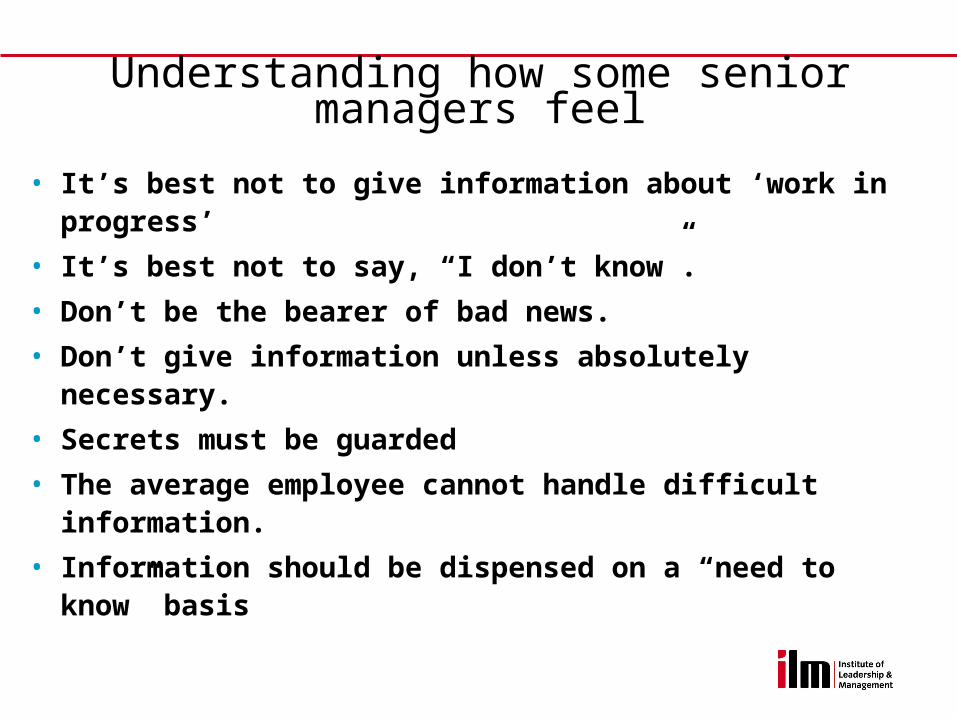
Understanding how some senior managers feel
• It’s best not to give information about ‘work in progress’
• It’s best not to say, “I don’t know”.
• Don’t be the bearer of bad news.
• Don’t give information unless absolutely necessary.
• Secrets must be guarded
• The average employee cannot handle difficult information.
• Information should be dispensed on a “need to know” basis
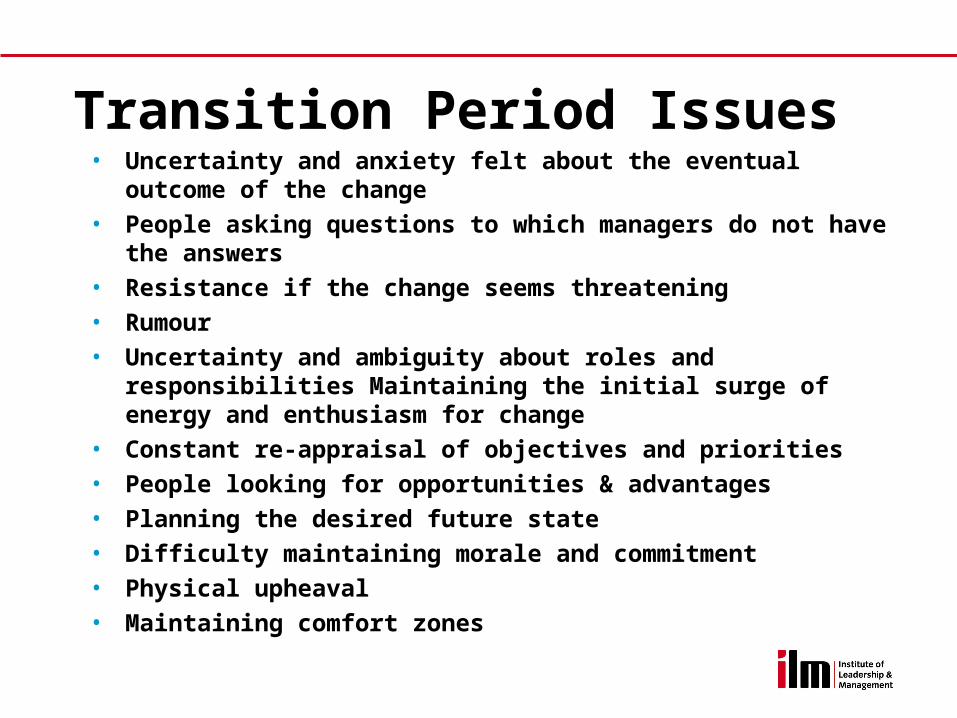
Transition Period Issues• Uncertainty and anxiety felt about the eventual outcome of the
change
• People asking questions to which managers do not have the answers
• Resistance if the change seems threatening
• Rumour
• Uncertainty and ambiguity about roles and responsibilities Maintaining the initial surge of energy and enthusiasm for change
• Constant re-appraisal of objectives and priorities
• People looking for opportunities & advantages
• Planning the desired future state
• Difficulty maintaining morale and commitment
• Physical upheaval
• Maintaining comfort zones
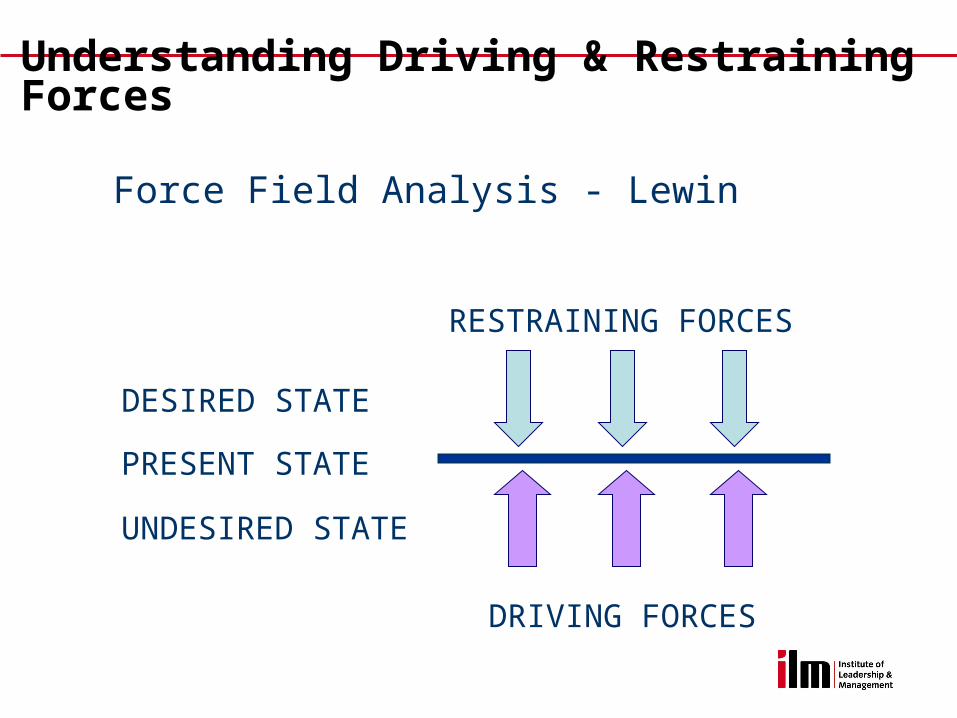
Force Field Analysis - Lewin
RESTRAINING FORCES
DRIVING FORCES
DESIRED STATE
PRESENT STATE
UNDESIRED STATE
Understanding Driving & Restraining Forces
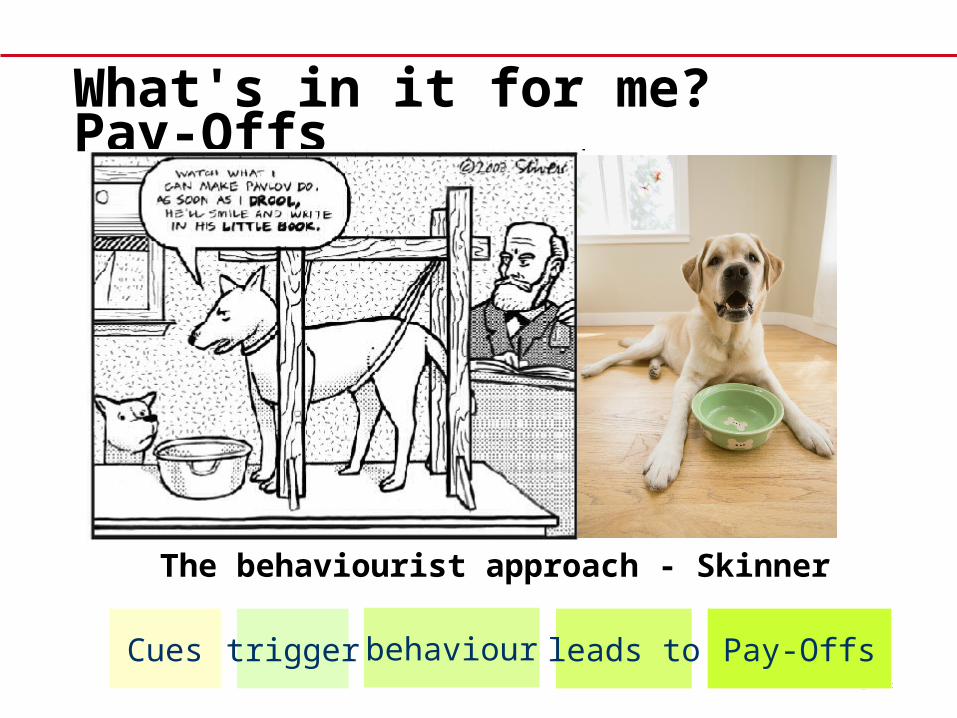
behaviourCues trigger leads to Pay-Offs
What's in it for me? Pay-Offs
The behaviourist approach - Skinner
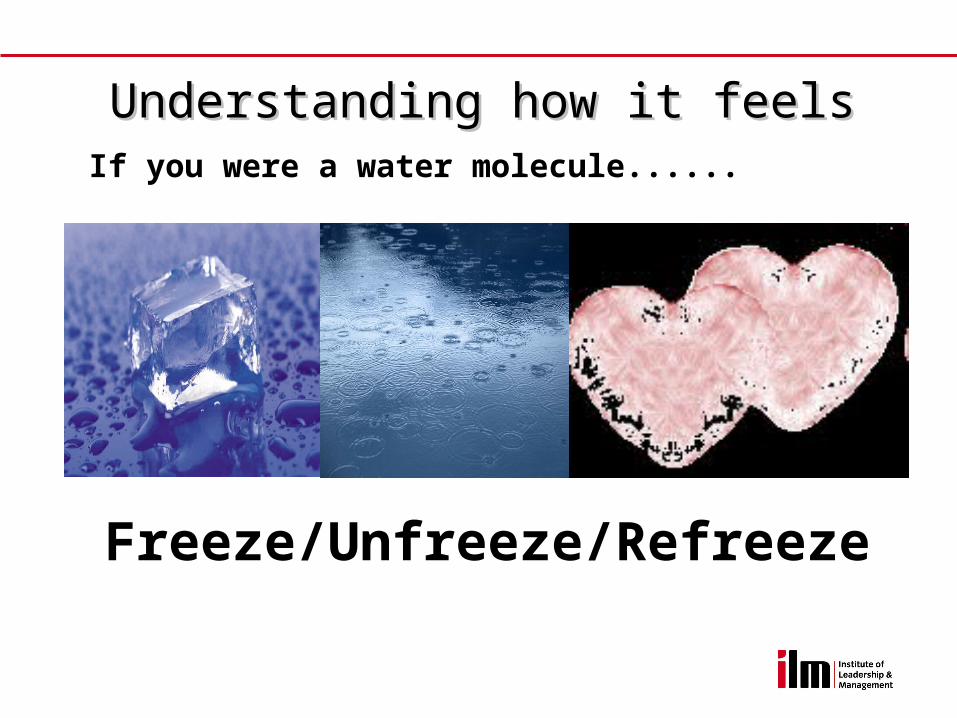
Freeze/Unfreeze/Refreeze
If you were a water molecule......
Understanding how it feelsUnderstanding how it feels
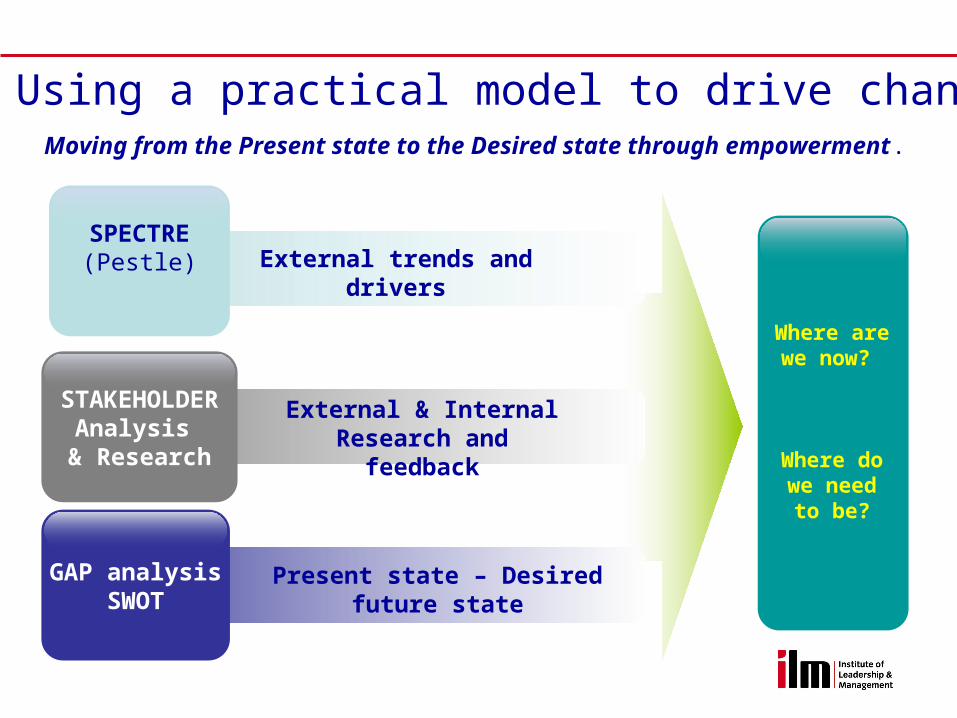
External & Internal Research and feedback
Present state – Desired future state
External trends and driversSPECTRE
(Pestle)
STAKEHOLDERAnalysis
& Research
GAP analysisSWOT
Where are we now?
Where do we need to
be?
Moving from the Present state to the Desired state through empowerment.
Using a practical model to drive change
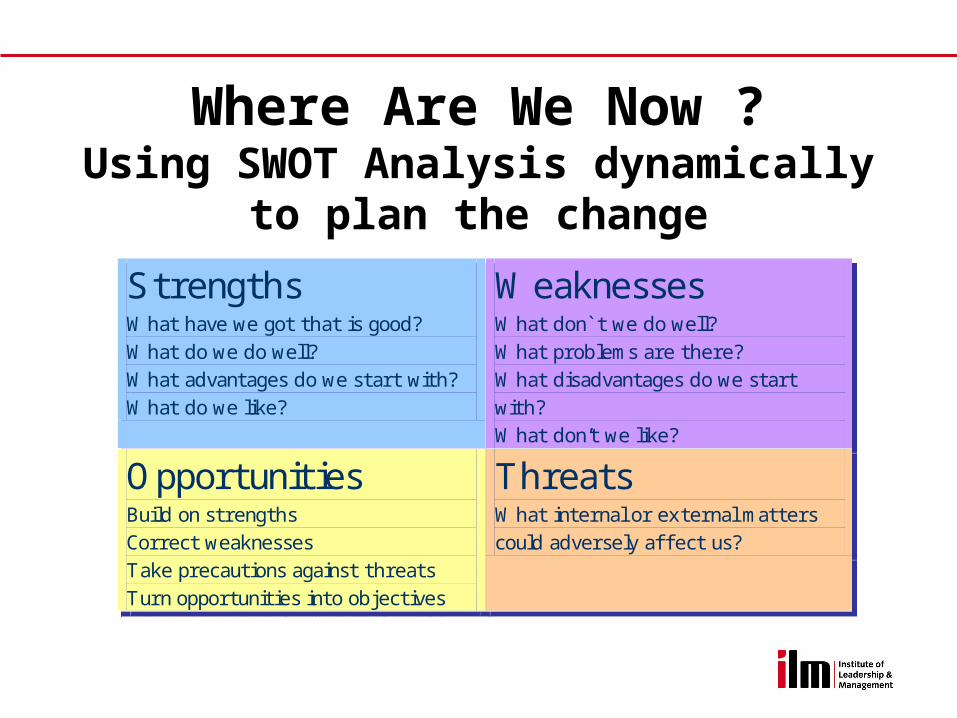
Strengths What have we got that is good? What do we do well? What advantages do we start with? What do we like?
Weaknesses What don t we do well? What problems are there? What disadvantages do we start with? What don’t we like?
Opportunities Build on strengths Correct weaknesses Take precautions against threats Turn opportunities into objectives
Threats What internal or external matters could adversely aff ect us?
Where Are We Now ?Using SWOT Analysis dynamically to
plan the change
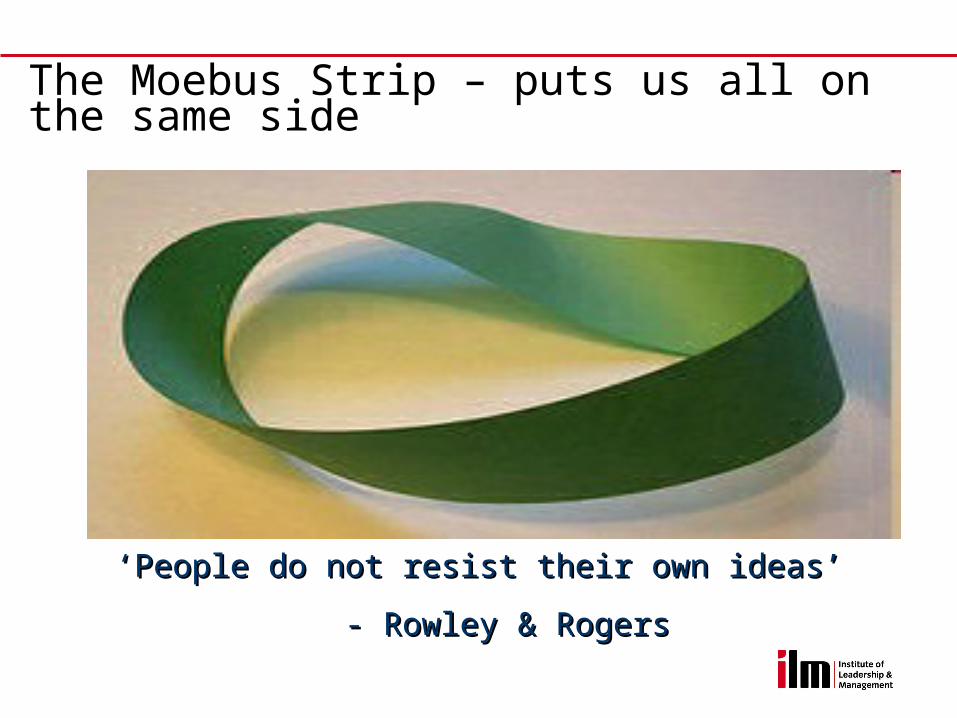
The Moebus Strip – puts us all on the same side
‘‘People do not resist their own ideas’People do not resist their own ideas’
- Rowley & Rogers- Rowley & Rogers
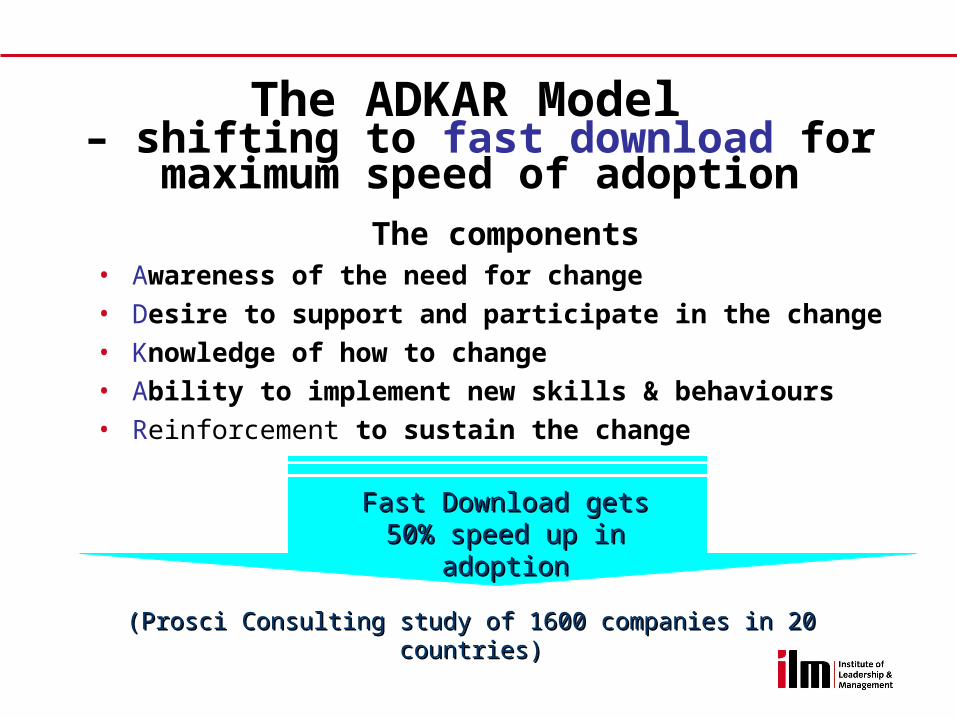
The ADKAR Model – shifting to fast download for maximum
speed of adoptionThe components
• Awareness of the need for change• Desire to support and participate in the change• Knowledge of how to change• Ability to implement new skills & behaviours• Reinforcement to sustain the change
Fast Download gets Fast Download gets 50% speed up in 50% speed up in
adoptionadoption
(Prosci Consulting study of 1600 companies in 20 countries)(Prosci Consulting study of 1600 companies in 20 countries)
Where Are We Going?
“Our ongoing mission, toseek out new worlds and new civilisations. To boldly go where no onehas gone before!”

Rich PicturesWhat does your ideal future look like?
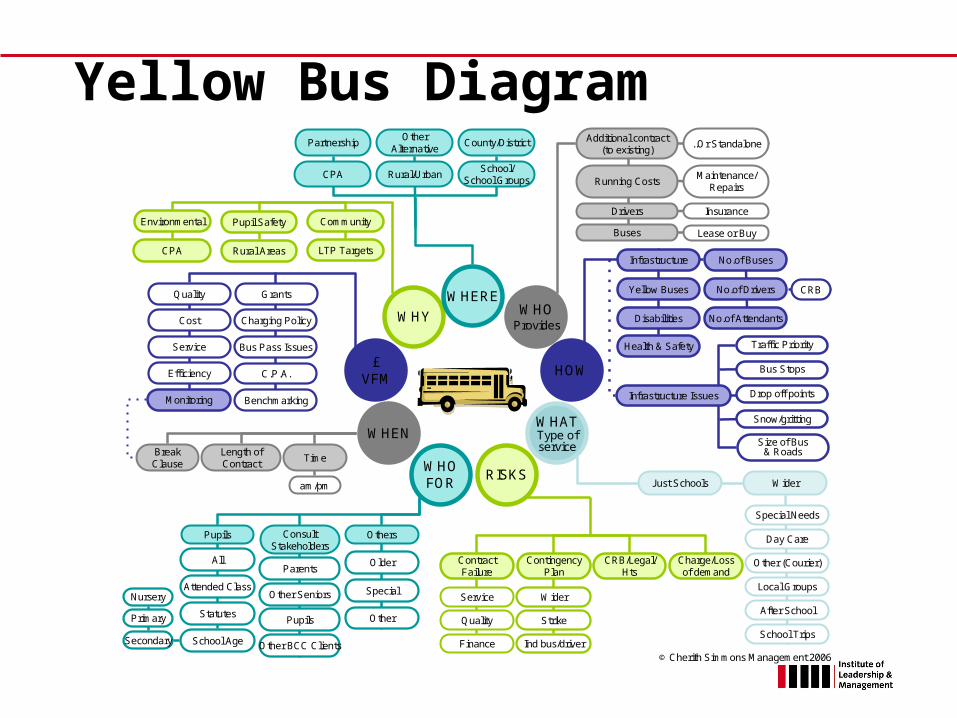
WHY
£VFM
WHEN
WHOFOR
WHATType ofservice
HOW
WHOProvides
WHERE
Just Schools Wider
Special Needs
Day Care
Other (Courier)
Local Groups
After School
School Trips
RISKS
ConsultStakeholders
Other Seniors
Pupils
Other BCC Clients
Parents
Others
Older
Special
Other
Pupils
All
Attended Class
Statutes
School Age
Nursery
Primary
Secondary
Time
am/pm
BreakClause
Length ofContract
Monitoring
Quality
Cost
Service
Efficiency
Charging Policy
Bus Pass Issues
C.P.A.
Benchmarking
Grants
Charge/Lossof demand
CRB/Legal/Hts
ContractFailure
Service
Quality
Finance
ContingencyPlan
Wider
Strike
Ind bus/driver
CPASchool/
School Groups
Partnership County/DistrictOther
Alternative
Rural/Urban
Lease or Buy
..Or Standalone
Maintenance/Repairs
Insurance
Running Costs
Drivers
Buses
Additional contract(to existing)
CRBNo.of Drivers
No.of AttendantsDisabilities
Health & Safety
Infrastructure No.of Buses
Yellow Buses
Infrastructure Issues
Snow/gritting
Size of Bus& Roads
Drop off points
Traffic Priority
Bus Stops
CPA LTP Targets
Environmental CommunityPupil Safety
Rural Areas
© Cherith Simmons Management 2006
Yellow Bus Diagram
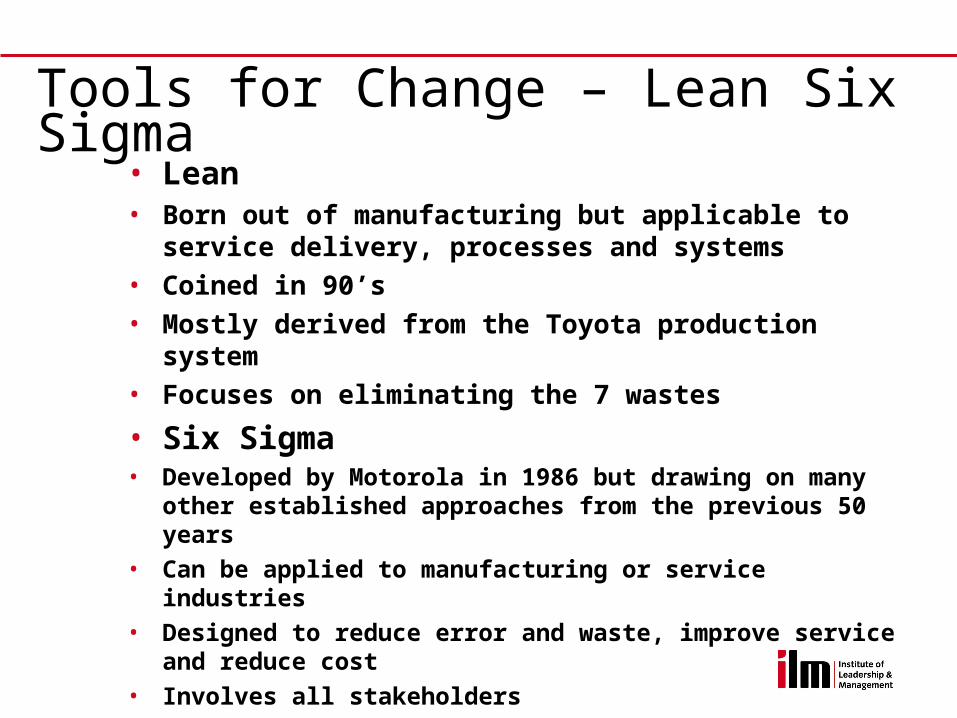
Tools for Change – Lean Six Sigma• Lean• Born out of manufacturing but applicable to service
delivery, processes and systems• Coined in 90’s• Mostly derived from the Toyota production system• Focuses on eliminating the 7 wastes
• Six Sigma• Developed by Motorola in 1986 but drawing on many other
established approaches from the previous 50 years
• Can be applied to manufacturing or service industries
• Designed to reduce error and waste, improve service and reduce cost
• Involves all stakeholders
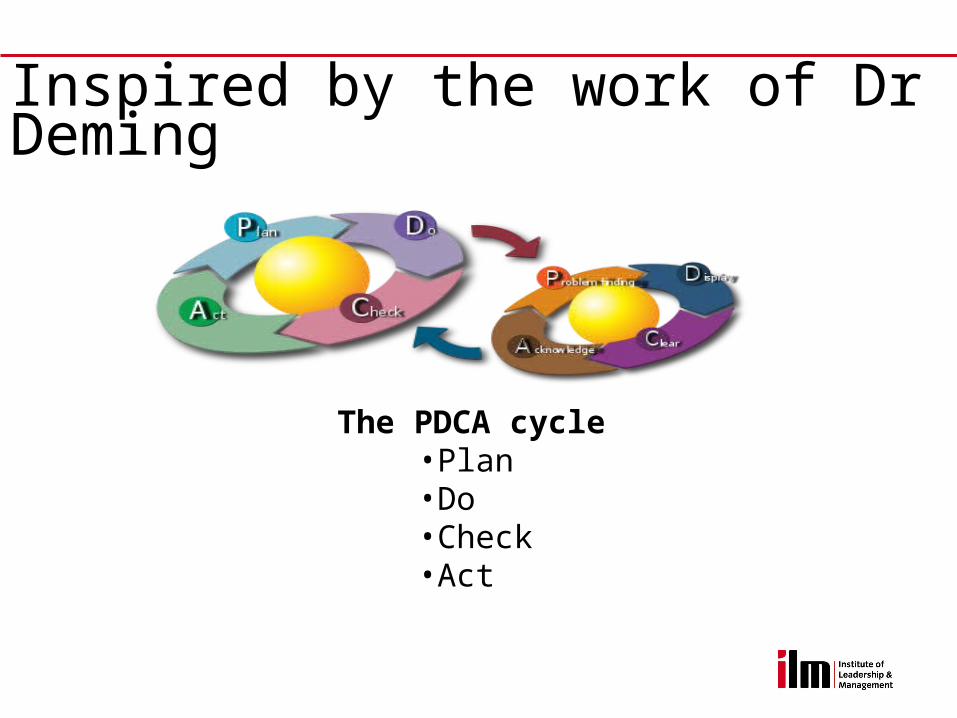
Inspired by the work of Dr Deming
The PDCA cycle•Plan •Do •Check •Act
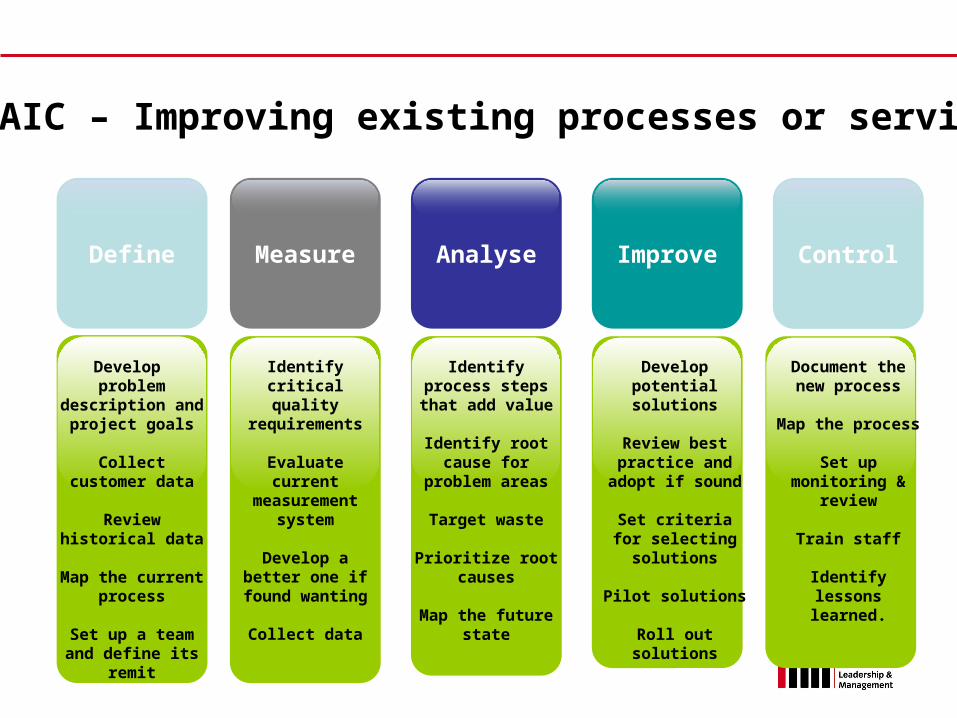
Develop problem
description and project goals
Collect customer data
Review historical data
Map the current process
Set up a team and define its
remit
Identify critical quality
requirements
Evaluate current
measurement system
Develop a better one if
found wanting
Collect data
Identify process steps that add
value
Identify root cause for
problem areas
Target waste
Prioritize root causes
Map the future state
Develop potential solutions
Review best practice and
adopt if sound
Set criteria for selecting solutions
Pilot solutions
Roll out solutions
Define Measure Analyse Improve Control
Document the new process
Map the process
Set up monitoring &
review
Train staff
Identify lessons learned.
DMAIC – Improving existing processes or services
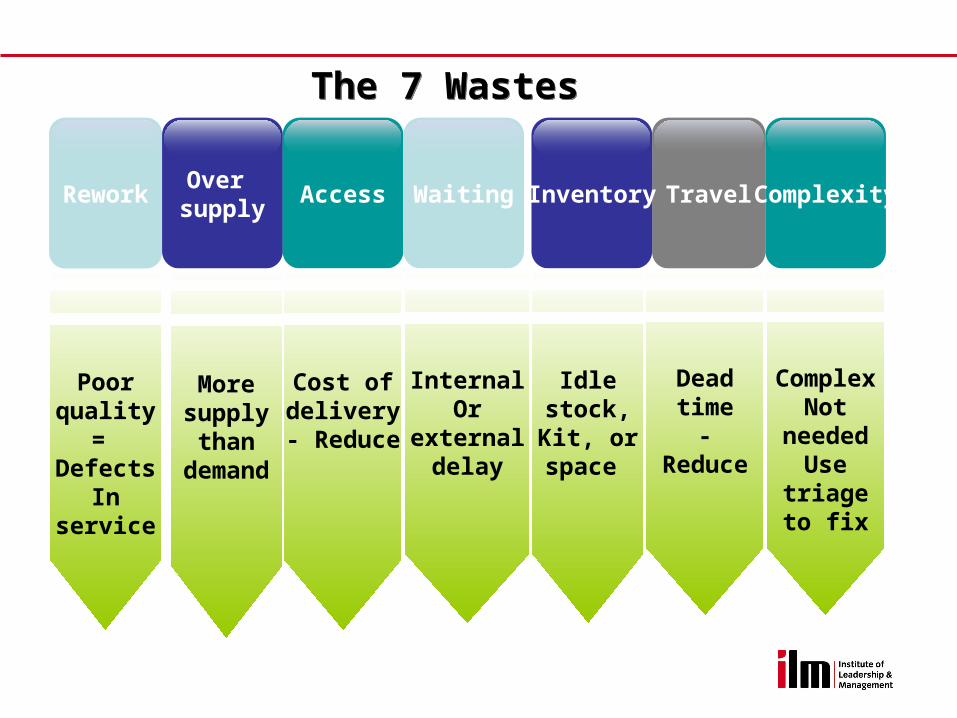
Poor quality
= Defects
In service
Rework TravelOver
supplyAccess
The 7 WastesThe 7 Wastes
Waiting Inventory Complexity
More supply than
demand
Cost of delivery
- Reduce
Idle stock,Kit, or space
InternalOr
external delay
Dead time
-Reduce
ComplexNot
neededUse
triage to fix
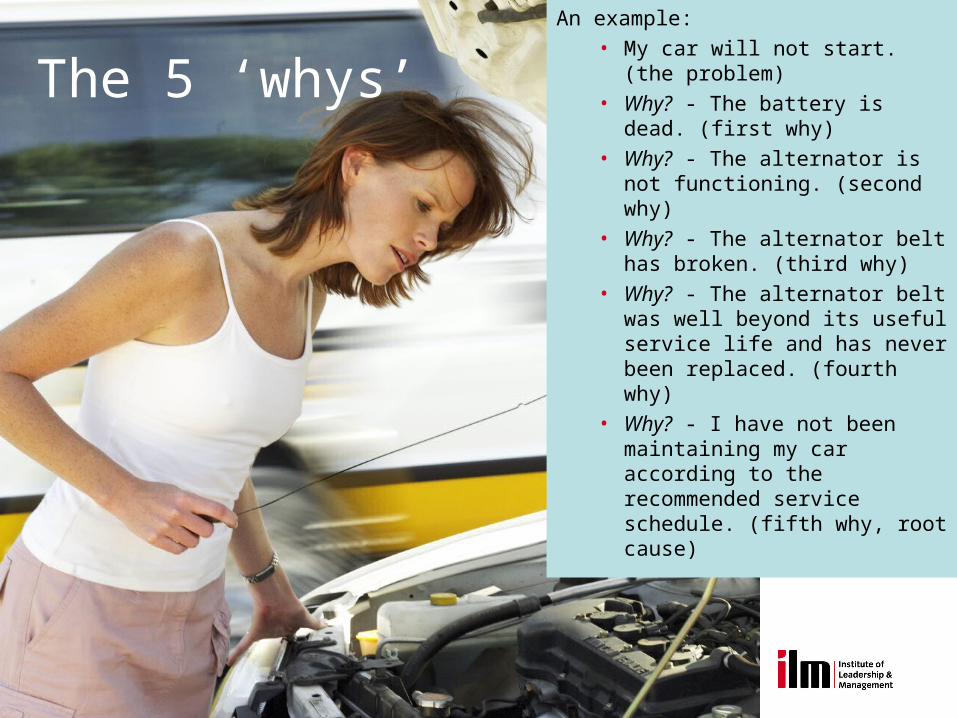
The 5 ‘whys’An example:
• My car will not start. (the problem)
• Why? - The battery is dead. (first why)
• Why? - The alternator is not functioning. (second why)
• Why? - The alternator belt has broken. (third why)
• Why? - The alternator belt was well beyond its useful service life and has never been replaced. (fourth why)
• Why? - I have not been maintaining my car according to the recommended service schedule. (fifth why, root cause)
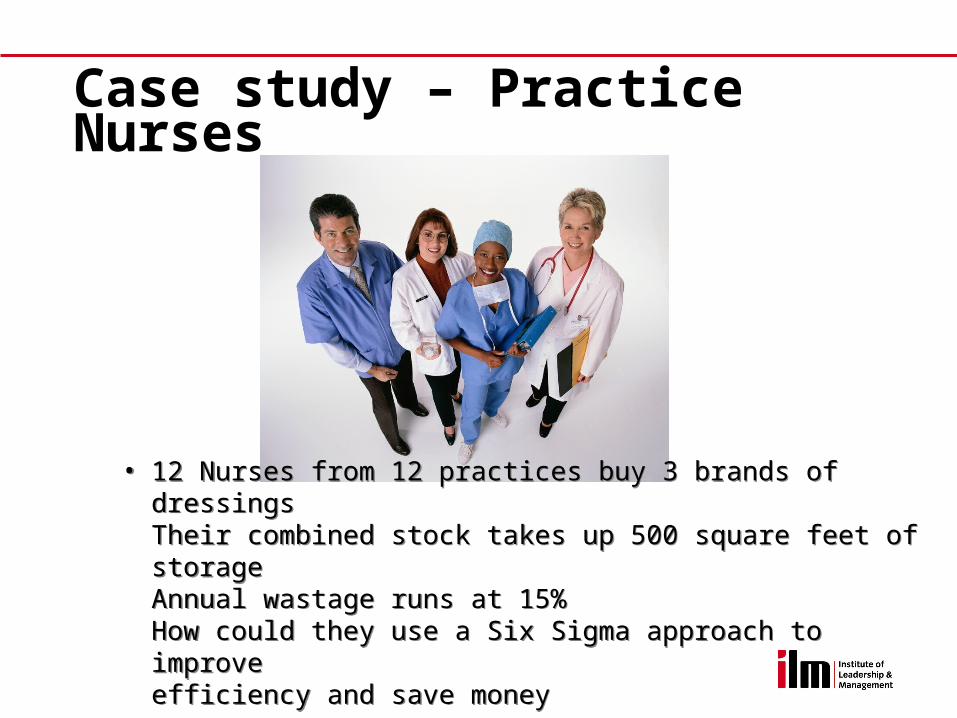
Case study – Practice Nurses
• 12 Nurses from 12 practices buy 3 brands of dressings Their combined stock takes up 500 square feet of storageAnnual wastage runs at 15%How could they use a Six Sigma approach to improve efficiency and save money
• 12 Nurses from 12 practices buy 3 brands of dressings Their combined stock takes up 500 square feet of storageAnnual wastage runs at 15%How could they use a Six Sigma approach to improve efficiency and save money
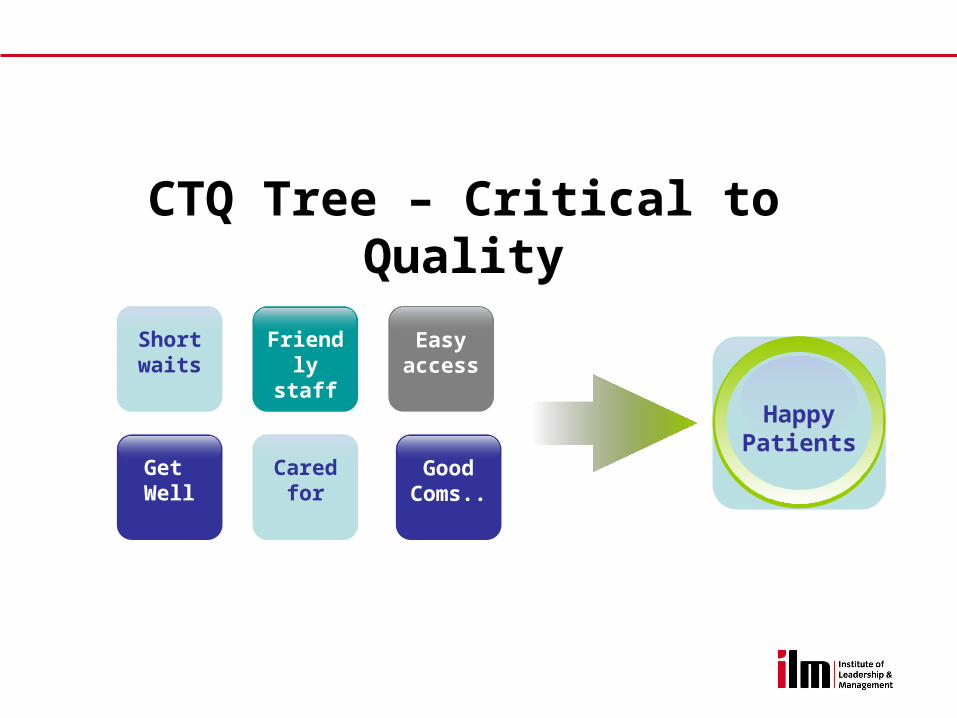
CTQ Tree – Critical to Quality
Short waits
Happy Patients
Easy access
Cared for
Get Well
Friendly staff
GoodComs..
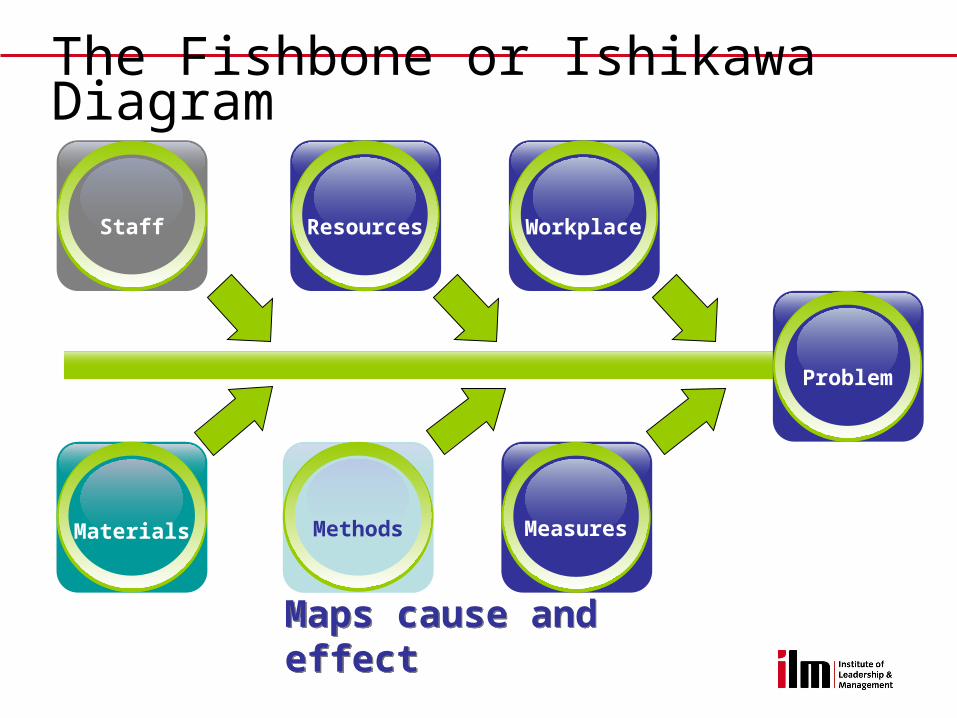
Staff
Materials
Resources
Methods
The Fishbone or Ishikawa Diagram
Measures
Workplace
Problem
Maps cause and effectMaps cause and effect
Robustification
• No – George did not invent it!• It’s a quality process where you
make your service less prone to random variability
• How would you make sure your delivery drivers had equal skills and did not waste time on delivery runs?
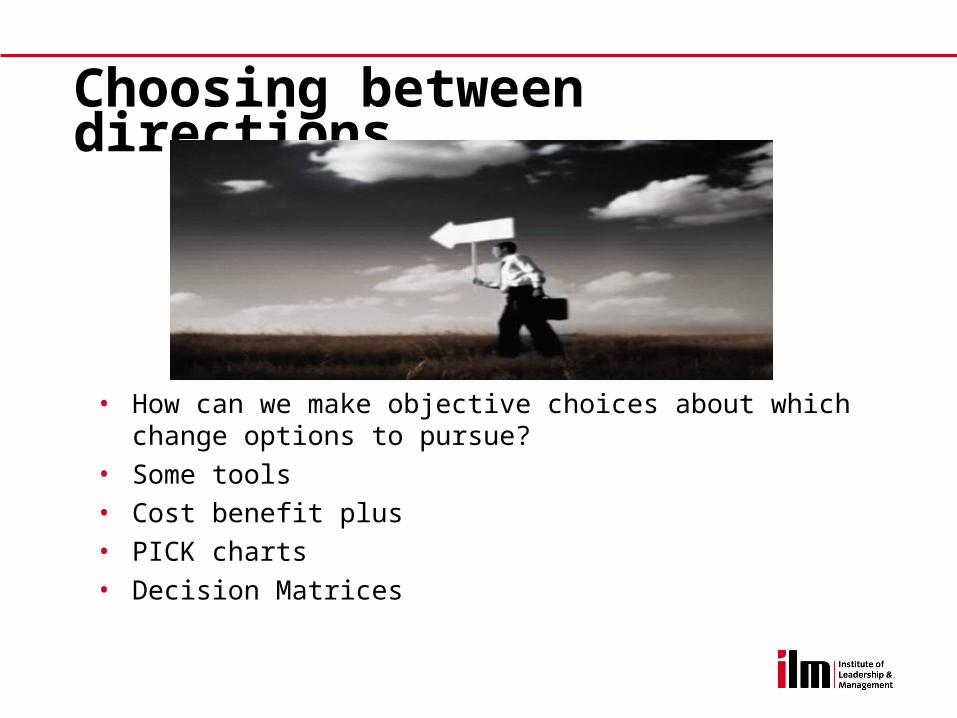
Choosing between directions
• How can we make objective choices about which change options to pursue?
• Some tools• Cost benefit plus• PICK charts• Decision Matrices
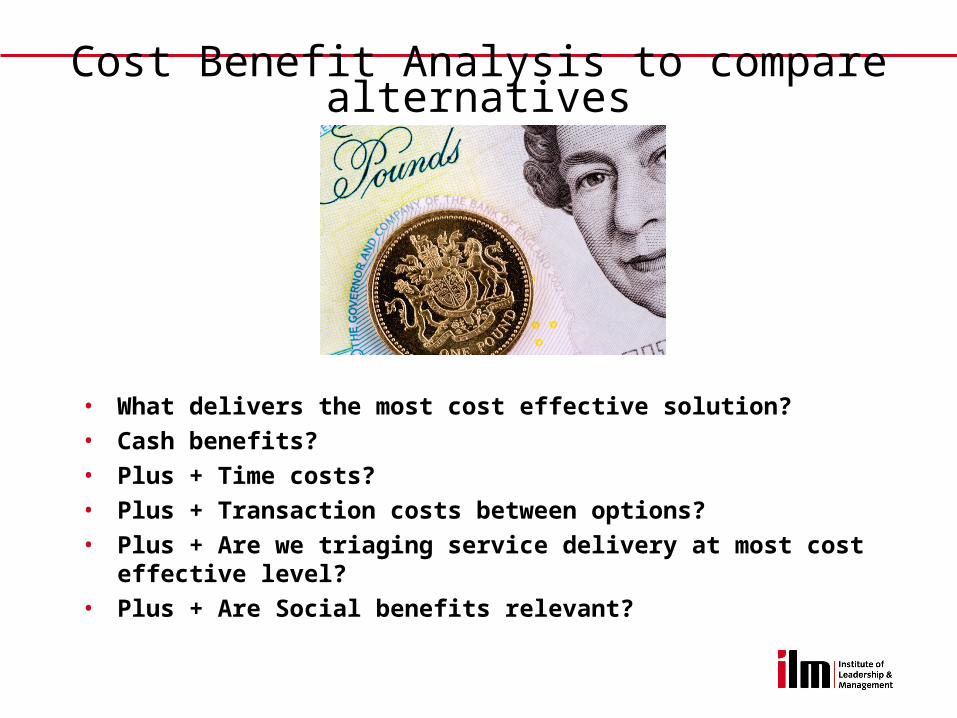
Cost Benefit Analysis to compare alternatives
• What delivers the most cost effective solution?
• Cash benefits?
• Plus + Time costs?
• Plus + Transaction costs between options?
• Plus + Are we triaging service delivery at most cost effective level?
• Plus + Are Social benefits relevant?
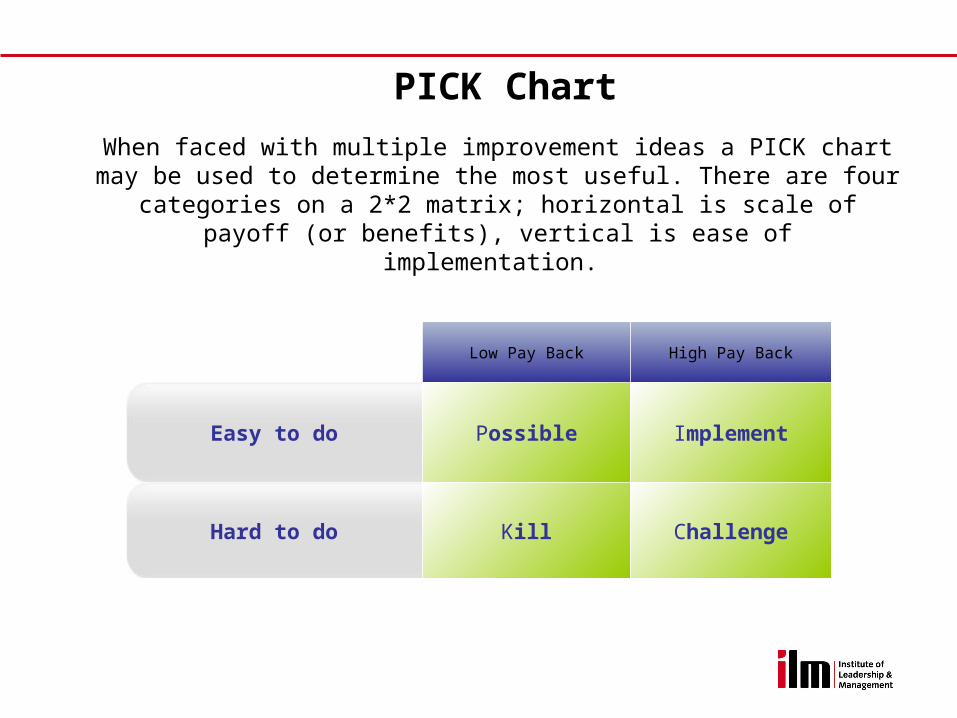
Low Pay Back High Pay Back
Easy to do Possible Implement
Hard to do Kill Challenge
When faced with multiple improvement ideas a PICK chart may be used to determine the most useful. There are four categories on a 2*2 matrix;
horizontal is scale of payoff (or benefits), vertical is ease of implementation.
PICK Chart
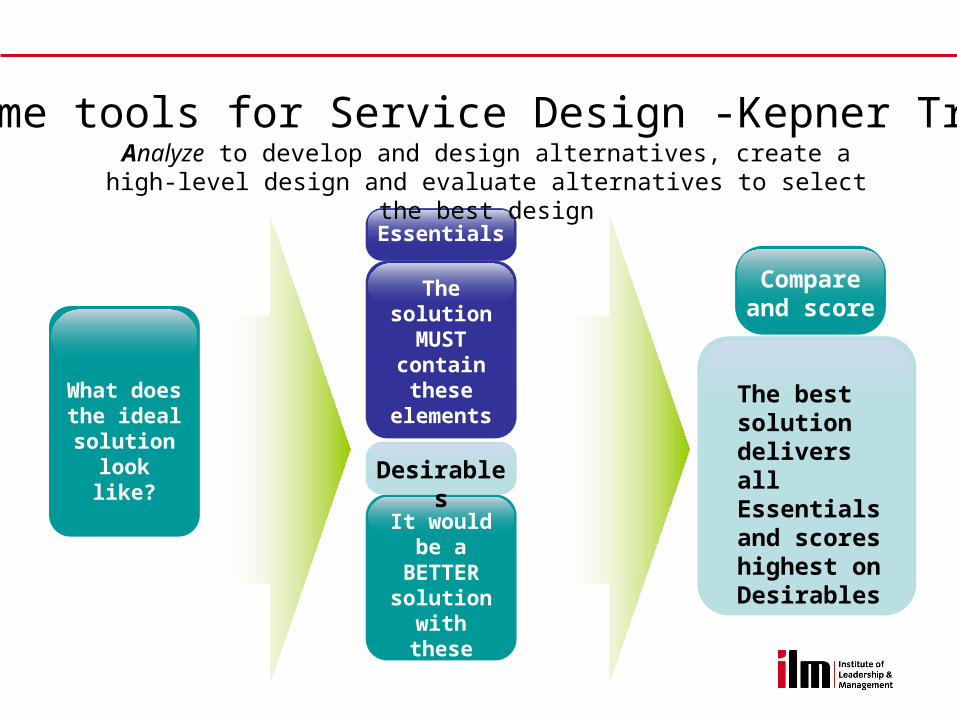
The solution MUST
contain these
elements
It would be a BETTER solution
with these elements
The best solution delivers all Essentials and scores highest on Desirables
Essentials
Desirables
Compare and score
Some tools for Service Design -Kepner TregoeAnalyze to develop and design alternatives, create a high-level design and
evaluate alternatives to select the best design
What does the ideal solution
look like?

Questions?Questions?