Embed Size (px)
Citation preview
Understanding Strategic Coastal
Blue Carbon Opportunities in the Seas of East Asia
Report byPartnerships in Environmental Management for the Seas of
East Asia (PEMSEA), Conservation International and The Nature Conservancy
Report Authors:Silvestrum Climate Associates, LLC.

Front cover photos clockwise from the top left: Mark Godfrey/TNC, PEMSEA, Kyle P. Miller, SCA/Crooks and Marjo Aho/TNC
Understanding Strategic Coastal Blue Carbon Opportunities in the Seas of
East Asia
Report byPartnerships in Environmental Management for the Seas of
East Asia (PEMSEA), Conservation International and The Nature Conservancy
Report Authors:Silvestrum Climate Associates, LLC.

Understanding Strategic Coastal Blue Carbon Opportunities in the Seas of East Asia
May 2017
This publication may be reproduced in whole or in part and in any form for educational or non-profit purposes or to provide wider dissemination for public response, provided prior written permission is obtained from the PEMSEA Resource Facility Executive Director, acknowledgment of the source is made and no commercial usage or sale of the material occurs. PEMSEA would appreciate receiving a copy of any publication that uses this publication as a source.
No use of this publication may be made for resale, any commercial purpose or any purpose other than those given above without a written agreement between PEMSEA and the requesting party. Crooks, S., von Unger, M., Schile, L., Allen, C. & Whisnant, R. (2017) Understanding Strategic Blue Carbon Opportunities in the Seas of East Asia. Report by Silvestrum Climate Associates for Partnerships in Environmental Management for the Seas of East Asia (PEMSEA), Conservation International and The Nature Conservancy, with support from the Global Environment Facility and United Nations Development Program.
ISBN 978-971-812-040-8
The contents of this publication do not necessarily reflect the views or policies of PEMSEA Country Partners and its other participating organizations, Conservation International or The Nature Conservancy. The designation employed and the presentation do not imply expression of opinion, whatsoever on the part of PEMSEA concerning the legal status of any country or territory, or its authority or concerning the delimitation of its boundaries.
Published byPartnerships in Environmental Management for the Seas of East Asia (PEMSEA) P.O. Box 2502, Quezon City 1165, Philippines Tel: (+632) 929-2992 Fax: (+632) 926-9712 Email: [email protected] www.pemsea.org
ii
Partnerships in Environmental Management for the Seas of East Asia (PEMSEA) is an intergovernmental organization operating in East Asia to foster and sustain healthy and resilient oceans, coasts, communities and economies through integrated management solutions and partnerships. For over two decades, PEMSEA has provided solutions for effective management of coasts and oceans across the shared seas of East Asia. As the regional coordinating mechanism for the Sustainable Development Strategy for the Seas of East Asia (SDS-SEA), a shared marine strategy among 14 countries in the region, PEMSEA works with national and local governments, companies, research and science institutions, communities, international agencies, regional programs, investors and donors towards implementation of the SDS-SEA.
Conservation International (CI) is a nonprofit environmental organization with the goal to protect nature as a source of food, fresh water, livelihoods and a stable climate. For nearly 30 years, CI has been protecting nature for the benefit of all through science, policy and partnerships with countries, communities and companies. CI works with more than 2,000 partners in 30 countries and has helped support 1,200 protected areas and interventions across 77 countries, safeguarding more than 601 million hectares of land, marine and coastal areas.
The Nature Conservancy is a conservation organization working around the world to protect the lands and waters on which all life depends. With more than 1 million members and 600 scientists, the Conservancy has protected 120 million acres of land and 5,000 miles of rivers worldwide and operates more than 100 marine conservation projects globally.
Silvestrum Climate Associates is a consultancy providing technical analysts and practitioners in the fields of environmental science and policy, coastal engineering and carbon project development, with a mission to assist public and private sector clients tackle challenges of climate change and sustainable development.
The International Blue Carbon Initiative is a coordinated, global program focused on mitigating climate change through the conservation and restoration of coastal and marine ecosystems. The Initiative comprises a global network of scientists, practitioners and policy advisors collaborating to advance improved management of blue carbon ecosystems.
Acknowledgements
The authors of this report thank the World Conservation Monitoring Center, Dr. Daniel Friess at the National University of Singapore and The Nature Conservancy for sharing data files that supported this analysis. Dr. Miguel Fortes of the University of the Philippines provided helpful comments on regional seagrass status and trends. We thank also Dr. Emily Pidgeon of Conservation International and Emily Landis of The Nature Conservancy for review of document drafts.
iii

Acronyms and Abbreviations v
Executive Summary 1
I. Introduction 5
II. Status of Coastal Blue Carbon Ecosystems in East Asia 7
Mangrove Ecosystems 7
Tidal Marsh Ecosystems 11
Seagrass Ecosystems 13
Historic Loss of Blue Carbon Ecosystems 15
III. Blue Carbon as a Climate Intervention Concept: UNFCCC, Kyoto Protocol and the Paris Agreement
17
History I: Between Mitigation and Adaptation 18
History II: Blue Carbon Accounting Rules and Practice 18
CDM: Mangrove Afforestation and Reforestation Approaches 19
Voluntary Carbon Markets 19
REDD: Overlapping Concepts 20
Blue Carbon and NAMAs 21
IV. Implementing Blue Carbon Under Nationally Determined Contributions (NDCs) 23
NDC Commitments by Countries in East Asia 23
Moving Forward Under NDCs in the Region 28
Policy Opportunities for PEMSEA Partner Countries 30
Linking Climate Finance and Blue Carbon Investment 33
V. Practical Steps to Advance Blue Carbon Interventions 35
VI. Addendum: Blue Carbon Ecosystems as Part of an East Asia Blue Economy 39
Private Investment for Conserving and Restoring Blue Carbon Ecosystems 39
Blue Carbon and the Blue Economy 41
VII. Appendices 43
Appendix A: Definitions 43
Appendix B: Maps of Mangrove Extent and Tidal Wetland Losses 45
Appendix C: Bibliography 53
Table of Contents
iv

CDM Clean Development Mechanism
CER Certified Emission Reduction
CI Conservation International
FLEGT+ Forest Law Enforcement Governance and Trade
GHG Greenhouse Gas
ha Hectare
ICM Integrated Coastal Management
IPCC Intergovernmental Panel on Climate Change
JCM Joint Crediting Mechanism
LULUCF Land Use, Land-Use Change and Forestry
MoU Memorandum of Understanding
Mha Million Hectares
MMt C Million Metric Tons of Carbon
MMt CO2 Million Metric Tons of Carbon Dioxide
MPA Marine Protected Area
NAMA National Appropriate Mitigation Action
NC National Communication
NDC Nationally Determined Contribution
OECD Organisation for Economic Co-operation and Development
PEMSEA Partnerships in Environmental Management for the Seas of East Asia
REDD+ Reducing Emissions from Deforestation and forest Degradation, the Conservation of Forest Carbon Stocks, Sustainable Management of Forests, and Enhancement of Forest Carbon Stocks
SBSTA “Subsidiary Body for Scientific and Technological Advice” to the UNFCCC
SCA Silvestrum Climate Associates LLC
SDGs Sustainable Development Goals
SDS-SEA Sustainable Development Strategy for the Seas of East Asia
TNC The Nature Conservancy
UNEP United Nations Environment Programme
UNFCCC United Nations Framework Convention on Climate Change
VCS Verified Carbon Standard
Acronyms and Abbreviations
v

Photo by TNC
Photo by SCA/Crooks

1
Understanding Strategic Coastal Blue Carbon Opportunities in the Seas of East Asia
Coastal blue carbon is a term that recognizes the role of coastal wetlands in the global carbon cycle. Mangroves, tidal marshes and seagrass meadows (collectively called coastal blue carbon ecosystems) sequester carbon dioxide from the atmosphere con-tinuously over thousands of years, building stocks of carbon in biomass and organic rich soils. This ecosys-tem service is in addition to other ecosystem services provided by coastal wetlands that underpin fish stocks, maintain food security and contribute to filtration of sediment, protecting coral reefs and popu lated coastal lowlands from erosion and flooding.1
Despite their importance, coastal wetlands are some of the most threatened ecosystems on Earth, with up to 800,000 hectares destroyed each year, approxi-mately 1.5% of global coverage. When degraded or destroyed, the services provided by these coastal blue carbon ecosystems are not only lost, but notably, they can become a significant source of greenhouse gas emissions, with thousands of years of sequestered carbon released over a period of years to decades.2
Although the combined global area of mangroves, tidal marshes and seagrass meadows equates to only 2-6% of the total area of terrestrial tropical forest, its ongo-ing losses accounts for up to 10-20% of the emissions from global deforestation–a total of 0.5 billion tons of carbon dioxide emissions annually.3
Over the past 10 years, researchers, policymakers and practitioners have built a strong foundation of science, policy, finance and coastal management approaches for integrating the conservation and restoration of blue carbon ecosystems into the global effort to address cli-mate change. Such efforts reflect a growing awareness of the importance of coastal blue carbon ecosystems in terms of global climate regulation and adaptation for local communities. Protecting and restoring blue carbon ecosystems are a key link to achieving sustain-able development goals, growing blue economy and meeting national commitments to the Paris Climate Agreement.
East Asia is a global hotspot for remaining coastal blue carbon ecosystems, but it is experiencing high rates of loss. Many East Asian countries are also home to some of the most vulnerable coastal communi-ties to the impacts of climate change and declining coastal ecosystem services. There is an opportunity to improve management of coastal blue carbon ecosys-tems towards achieving climate change commitments, sustainable development goals and the well-being of coastal communities.
This report seeks to better understand the status of coastal blue carbon ecosystems in East Asia and raise awareness of the opportunities to include improved
1 Costanza, R. et al. 2014. “Changes in the global value of ecosystem services.” Global Environmental Change, 26:152-158.2 Crooks, S. et al. 2011. “Mitigating climate change through restoration and management of coastal wetlands and near-shore marine ecosystems: challenges and opportunities.” Environment Department Paper 121. World Bank, Washington, DC.3 Pendleton, L. et al. 2012. “Estimating global “blue carbon” emissions from conversion and degradation of vegetated coastal ecosystems.” PloS One, 7.9:e43542.
Executive SummaryPhoto by SCA/Crooks
2
Understanding Strategic Coastal Blue Carbon Opportunities in the Seas of East Asia
management of these ecosystems within climate mitigation and adaptation actions and commit-ments, including opportunities to access new forms of financing. It geographic focus is on countries with coastal ecosystems that have signed the Sustainable Development Strategy for the Seas of East Asia (SDS-SEA), specifically: Brunei Darussalam, Cambodia, China, DPR Korea, Indonesia, Japan, Malaysia, Philippines, RO Korea, Singapore, Thailand, Timor-Leste and Viet Nam.
All three blue carbon ecosystems—mangroves, tidal marshes and seagrass meadows—occur in East Asia. Mangroves are the dominant tidal wetland ecosystem type at latitudes between approximately 30°N and 30°S, covering most of East Asia. RO Korea or DPR Korea are the only two countries in this study with no mangrove cover due to their northern extent. Tidal marshes are found at latitudes that are too cold for mangroves to tolerate, typically latitudes greater than 30°N and 30°S. Therefore, in East Asia, tidal marshes occur primarily in China, Japan, DPR Korea and RO Korea. Seagrasses, though extensive, remain very poorly mapped with estimates of extent and rates of loss being derived from experts with knowledge of field surveys and reports.
In all, there are 4 million ha of mangroves in the region, representing around 30% of the global total. Five of the top 11 mangrove-holding countries globally are in East Asia: Indonesia (2.71 Mha), Malaysia (0.56 Mha), the Philippines (0.26 Mha), Thailand (0.25 Mha) and Viet Nam (0.22 Mha). Applying regional forestry models and IPCC default values for soil carbon stocks, it is estimated that the region’s mangroves hold 8.8 billion tons of CO2 vulnerable to release by human activities. Each year, these mangroves remove approximately, 22.4 MMt CO2 from the atmosphere.
The full extent of tidal marshes is not known. China held 57,344 ha in 1995,4 perhaps representing less than 10% of what once existed across temperate areas of East Asia. Remaining vulnerable tidal wetland carbon stocks are estimated to be between 180-660 MMt CO2. Each year, these wetlands sequester 0.19 MMt CO2.
It is estimated that there may be 3 million ha of sea-grasses across the region, holding 1.3 billion tons CO2 within soils and sequestering 4.7 MMt CO2 each year. The lack of data on distribution and carbon stocks in tidal wetland and seagrass ecosystems are critical data gaps that have the potential to be filled. Efforts are underway in the Philippines and Indonesia to quantify and model seagrass carbon stocks and fluxes through the BlueCARES project.
The historic extent of all blue carbon ecosystem area now converted to diked coastal floodplain is calcu-lated to be 3.36 million ha across the region. The five countries with the greatest extent of these subsided coastal lands are China (1.81 Mha), Viet Nam (0.85 Mha), the Philippines (0.68 Mha), Indonesia (0.30 Mha) and Japan (0.23 Mha). As a first approximation, using IPCC default values for soil carbon loss, it is estimated that some 3.7 billion tons CO2 have emitted from con-verted mangroves and tidal marshes across the region, and annual carbon sequestration of around 6 MMt CO2 has been lost. These emissions are likely to be underestimates, since areas where drained organic soil remain, emissions will be continuing to this day.5
While losses of tidal marshes and seagrasses have not been assessed, over the period 2000 to 2012 the greatest rates of mangrove loss are found in Malaysia, Cambodia, Indonesia, Thailand and China. The primary causes for mangrove loss are conversion to aqua-culture (33,721 ha), oil palm plantations (18,456 ha),
4 Shi-Jun, Y. and C. Ji-yu. 1995. “Coastal salt marshes and mangrove swamps in China.” Chinese Journal of Oceanology and Limnology, 13: 318-324.5 Crooks, S. et al. 2011. “Mitigating climate change through restoration and management of coastal wetlands and near-shore marine ecosystems: challenges and opportunities.”

3
Understanding Strategic Coastal Blue Carbon Opportunities in the Seas of East Asia
deforestation (5,483 ha) and urbanization (4,476 ha). Across the region, some 17,496 ha of new mangrove growth was identified, representing potential building of new mangrove in delta regions and reforestation on abandoned lands.
The potential to restore blue carbon ecosystems depends upon site specific consideration. Some sites are readily restorable; for others, recovering from former conditions is not possible due to the degree of envi-ronmental change.6 While the needed experience and expertise to assess restoration potential and enact recovery exists, in most cases, failure is typically due to poor site selection and planning. Restoration of sea-grass meadows can often be more challenging than tidal marshes or mangroves though, again, there is an established scientific and restoration practice.
Several opportunities exist for countries to improve management of coastal blue carbon ecosystems. Many countries, including PEMSEA partner countries, recog-nize the importance of mangroves, if not all blue carbon ecosystems. However, conservation and restoration policies often lack effectiveness. Enforcement capaci-ties are minimal, activities within various government departments are heterogeneous (fisheries as opposed to nature conservation, for instance) and uncertain land tenure hampers the capacity to identify relevant stakeholders, plan with them and secure sustainable investment.
International climate policy offers an opportunity to restate the importance of coastal ecosystems and establish effective mitigation and adaptation tools. The emerging framework of nationally determined contributions (NDC)–country commitments on cli-mate change–creates powerful incentives for action. Almost all PEMSEA countries have started addressing blue carbon ecosystems in their NDCs. While to date, the
mitigation opportunities have often been overlooked, future rounds of NDC restatements will permit greater and more comprehensive focus. This includes an openness for greater bilateral and regional coopera-tion between economically developed and developing countries; between countries that operate or plan to operate domestic emissions trading systems and those that are willing to generate international offset credits; and between countries that already employ more advanced and comprehensive inventories and others that require capacity building and technologi-cal assistance.
Recommendations
There are a number of steps that PEMSEA partner countries can take to build awareness, facilitate knowledge exchange and accelerate practical action on blue carbon. These include:
1) Improved tracking of blue carbon ecosystem gains and losses (noting particularly a lack of data on tidal marshes and seagrasses), quanti-fication and reporting of greenhouse emissions and removals following guidance provided in the IPCC Wetland Supplement;7
2) Including coastal blue carbon ecosystems within NDCs and related policies under national mitiga-tion and adaptation commitments to the Paris Agreement;
3) Measuring and weighing the significance of coastal blue carbon ecosystems across policy areas and planning documents, including on trade, aid and integrated coastal management;
4) Developing climate change vulnerability assess-ments, adaptation and resilience plans, and
6 Ibid.7 Hiraishi, Takahiko, et al. 2014. 2013 supplement to the 2006 IPCC guidelines for national greenhouse gas inventories: Wetlands. IPCC, Switzerland.
4
Understanding Strategic Coastal Blue Carbon Opportunities in the Seas of East Asia
promoting the role of coastal blue carbon ecosys-tems as a vehicle for sustainable environmental infrastructure;
5) Building on bilateral and regional cooperation of PEMSEA countries to work towards joint planning and implementation of the NDC framework;
6) Engaging in programs and demonstration activi-ties that build public–private initiatives or support international financing for coastal blue carbon eco-system conservation and restoration.
While there are actions that each country can take within national borders to support coastal blue carbon ecosystems and their climate benefits, there are addi-tional benefits to be gained through transboundary
collaboration. Sharing of knowledge and experience builds regional capacity (e.g., development of GHG inventories, NDCs, NAMAs, science and restoration experience). Countries advancing carbon finance trade infrastructure may serve as hubs for regional market interventions. Those seeking partners to reduce in-country emissions may engage with other coun-tries requiring support. Donor countries may provide scientific and technical development assistance to regional neighbors. Many of the threats facing coastal blue carbon ecosystems are transboundary in nature (e.g., water quality, sediment delivery, trade impacts) and would benefit from international cooperation to address as part of regional sustainability actions. Regional coordinating mechanisms, such as PEMSEA, can offer institutional framework for enhanced regional planning and implementation.

5
Understanding Strategic Coastal Blue Carbon Opportunities in the Seas of East Asia
Coasts and oceans are some of the most productive ecosystems on the planet, providing a rich array of ecosystem services that maintain human survival and quality of life, supporting local communities and national economies. More than half of the world’s population lives within 200 km of the coast, drawn to environmental and economic resources that support large populations.8
Consequently, coastal ecosystems are among the most threatened, under pressure from destruction and degradation. Since the turn of the 19th century, it is estimated that 50% of all mangroves and tidal marshes globally have been converted to other land uses, and area of seagrass meadows have been reduced by 29%.9 The loss of these wetlands has resulted in a forfeiture of the beneficial ecosystems services they provided,10,11 including food provision, storm protection, climate regulation and local ocean acidification buffering, as well as aesthetic and spiri-tual benefits.
One key service provided by coastal ecosystems, but historically overlooked, is the regulation of the global climate by coastal ecosystems. The concept of “coastal blue carbon” has emerged to recognize the need for improved management of coastal eco-systems to support this important climate regulating service. Within just a few years, coastal blue carbon has evolved from a mostly scientific interest into a cross-cutting policy tool linking greenhouse gas (GHG) accounting for coastal environments—a major global emissions source—with short- and long-term commitments of a wide range of countries, climate finance (for both mitigation and adaptation) and fund-ing opportunities for developed countries, private investors and coastal communities.
The concept of coastal blue carbon recognizes the role of the ocean’s biological systems in buffering the world’s atmospheric CO2 levels. This service is provided through the extraction of CO2 by plants directly from the atmosphere and surface waters.12
Introduction
8 Creel, Liz. 2003. “Ripple Effects: Population and Coastal Regions.” http://www.prb.org/Publications/Reports/2003/RippleEffectsPopulationand CoastalRegions.aspx. Accessed 2016 November 3.9 Pendleton, L. et al. 2012. “Estimating global “blue carbon” emissions from conversion and degradation of vegetated coastal ecosystems.”10 Costanza, R. et al. 1997. “The value of the world’s ecosystem services and natural capital.” Nature, 387:253–260.11 Costanza, R. et al. 2014. “Changes in the global value of ecosystem services.”12 Pidgeon, E. 2009. “Carbon sequestration by coastal marine habitats: important missing sinks.” In The management of natural coastal carbon sinks. Edited by Laffoley, D. and Grimsditch, G. IUCN, Gland.
1Photo by SCA/Crooks

6
Understanding Strategic Coastal Blue Carbon Opportunities in the Seas of East Asia
Coastal blue carbon is the contribution to climate mitigation made by coastal ecosystems, particularly mangroves, tidal marshes (salt, brackish, and fresh-water marshes) and seagrasses.13 These ecosystems directly extract CO2 from the atmosphere and coastal waters and store it as solid form carbon in biomass and soil material. The soil carbon pool is particularly important because low-oxygen conditions created by wet soils significantly decrease decomposition rates, allowing build-up of carbon stocks that exceed those of upland soils.
Approximately 48% of carbon sequestration of the entire ocean occurs within just 2% of its area, through transfer of atmospheric CO2 to the soil carbon pool.14 Not recognized in this calculation, but also valuable, is the flux of dissolved and particulate carbon from coastal ecosystems to support food webs in coastal and ocean areas.15 Some of this “lateral carbon flux” eventually becomes buried in offshore marine sedi-ments, but is difficult to track and not currently included directly in climate mitigation calculations. Thus, while conserving and improving all coastal ecosystems and marine ecological conditions is beneficial to carbon sequestration, blue carbon interventions for meeting quantified GHG mitigation goals are focused on man-agement of mangroves, tidal marshes and seagrasses.
When coastal blue carbon ecosystems are drained or excavated and converted to other land uses, carbon sequestration is halted. More significantly, stored soil carbon stocks are released and, together with the bio-mass carbon stock (e.g., removed mangrove trees), are returned to the atmosphere. Soil carbon stocks that had accumulated over thousands of years may
be returned within just a few decades.16,17,18 It is estimated that some 450 MMt CO2 of soil carbon from blue carbon ecosystems are released from land use change each year with an annual economic impact of $18 billion USD.19 Such levels equate to 10-20% of total CO2 emissions from global deforestation and rise to a level at which economic instruments may be brought to bear to reduce or reverse environmental losses.20
Blue carbon ecosystems are heavily concentrated in a few countries and regions, including the seas of East Asia, with Southeast Asia as the unambiguous geographic global center. Covering over 7 million km2 of sea area and 235,000 km of coastline, East Asia is home to some of the most economically and ecologically important sea areas of the world. With a growing population and ongoing coastal migration, pressure continues to mount on coastal and ocean resources in the region. The environmental and social impact of these activities threatens a decline in coastal ecosystems that form the basis of the economic growth and well-being of the region, and the planet. Many East Asian countries—home to the world’s largest coastal carbon stocks and some of the most vulnerable coastal communities to the impacts of climate change—have embraced the blue carbon concept and are seeking to implement it in the years to come.
This report outlines the status and trends of coastal blue carbon ecosystems in the seas of East Asia and sum-marizes their relevance to developing climate mitigation commitments, blue carbon interventions and financ-ing options. Finally, recommendations for interventions on policy advancement and direct actions to support management, climate adaptation and development of a regional blue economies are provided.
13 Howard, J. et al. 2017. “Clarifying the role of coastal and marine systems in climate mitigation.” Frontiers in Ecology and the Environment, 15:42-50.14 Duarte, C.M. et al. 2005. “Major role of marine vegetation on the oceanic carbon cycle.” Biogeosciences, 2:1–8.15 Twilley, R. et al. 1992. “Carbon sinks in mangroves and their implications to carbon budget of tropical coastal ecosystems.” In Natural Sinks of CO2. Springer, Netherlands, pp. 265-288.16 Crooks, S. et al. 2011. “Mitigating climate change through restoration and management of coastal wetlands and near-shore marine ecosystems: challenges and opportunities.” 17 Kauffman, J. B. and D. Donato. 2012. Protocols for the measurement, monitoring and reporting of structure, biomass and carbon stocks in mangrove forests. (CIFOR Working Paper no. 86, p. 40p). Center for International Forestry Research (CIFOR), Bogor, Indonesia. 18 Fourqurean, J.W. et al. 2012. “Seagrass ecosystems as a globally significant carbon stock.” Nature Geoscience, 5:505-509.19 Pendleton, L. et al. 2012. “Estimating global “blue carbon” emissions from conversion and degradation of vegetated coastal ecosystems.”20 Murray, B. et al. 2011. Green payments for blue carbon: Economic incentives for protecting threatened coastal habitats. Nicholas Institute for Environmental Policy Solutions, Report NI 11.04.
7
Understanding Strategic Coastal Blue Carbon Opportunities in the Seas of East Asia
21 In 1999, the Landsat 7 satellite was launched, which captured moderate resolution (30m) imagery across the world at a 16-day interval. In many cases, this was the first imagery of its kind to be collected in many parts of the world and enabled systematic image analysis, such as mapping mangroves, at a global scale.22 Giri, C. et al. 2011. “Status and distribution of mangrove forests of the world using earth observation satellite data.” Global Ecology and Biogeo chemistry, 20: 154-159.23 Spalding, M. 2010. World atlas of mangroves. Routledge.24 Hamilton, S. and D. Casey. 2016. “Creation of a high spatio-temporal resolution global database of continuous mangrove forest cover for the 21st century (CGMFC-21).” Global Ecology and Biogeochemistry, 25: 729-738.
Coastal wetlands, which include mangroves, tidal marshes and seagrasses, are found in a narrow elevation range along the coast. Mangroves and tidal marshes occupy the top half of the tidal range, not occurring below mean tide elevations or above the highest tides. Seagrasses are found predomi-nantly below the tides with their lowest depth range determined by water clarity. The following section summarizes current knowledge of each ecosys-tem’s distribution in East Asia, estimated carbon stocks and estimated emissions due to ecosystem loss.
Mangrove Ecosystems
Mangroves are the dominant tidal wetland eco-system type at latitudes between approximately 30°N and 30°S. This latitudinal range covers most of East Asia. RO Korea or DPR Korea are the only two countries in this study with no mangrove cover due to their northern extent. There are at least 41
mangrove species found within East Asia, making it a significant hotspot for mangrove diversity.
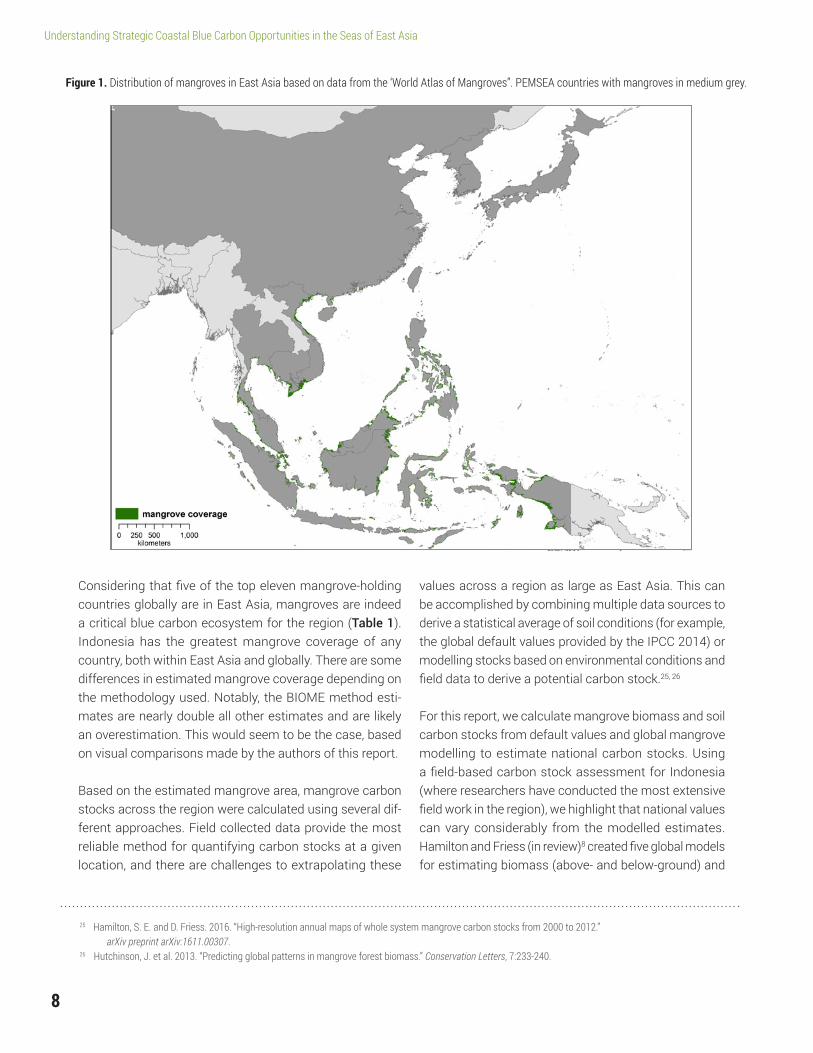
Over the past several years, several efforts have been undertaken to map mangroves globally. In 2000, for instance, four separate approaches were used to assess baseline mangrove cover.21 Two estimates were based on mangrove presence/absence in a given area from classified Landsat satellite imagery: Giri et al. (2011)22 and the World Atlas of Mangroves23 (Figure 1; Appendix Figures 1-11). The other estimates were based on mangrove cover within a given area (instead of presence/absence) and were derived from a com-bination of previous mangrove and forest mapping efforts (Giri et al. 2011 – ‘Mangrove Forests of the World’ [MFW] and ‘Terrestrial Forest of the World’ [BIOME]). Mangrove cover was assessed between 2000 and 2012 using imagery and estimated for 2014 based on rates of change.24 None of these methods account for mangrove loss prior to 2000 and thus are only an estimate of recent change.
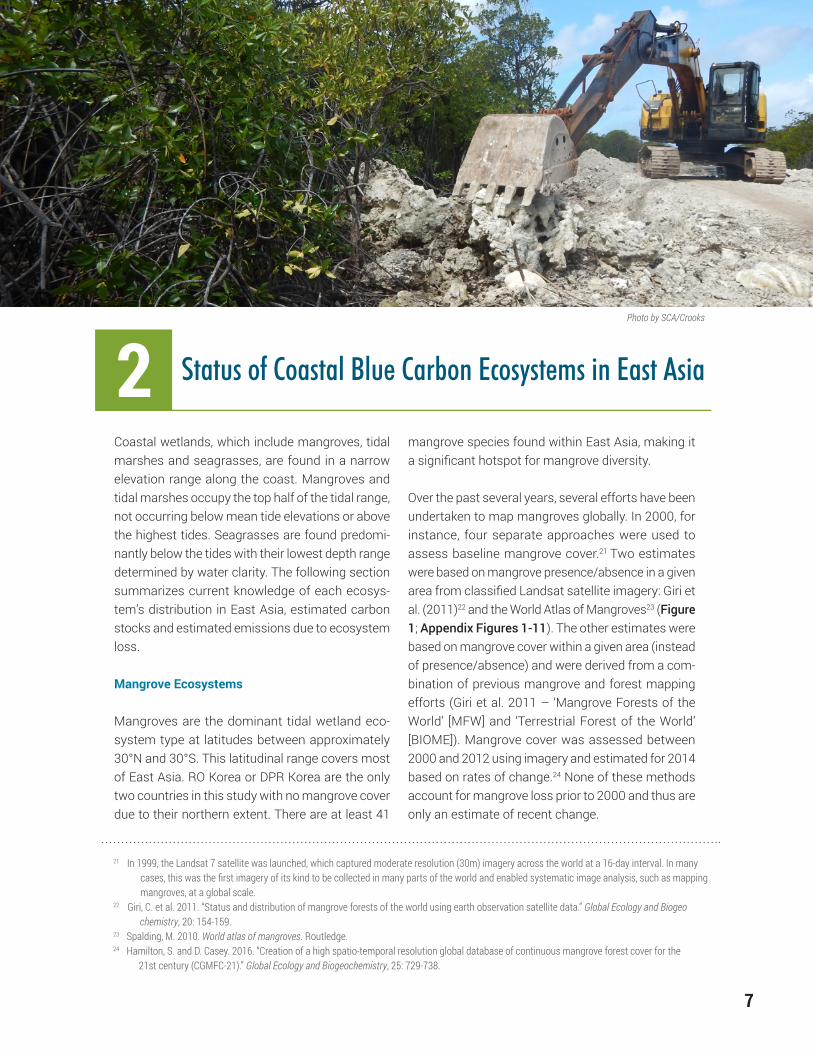
Status of Coastal Blue Carbon Ecosystems in East Asia2Photo by SCA/Crooks
8
Understanding Strategic Coastal Blue Carbon Opportunities in the Seas of East Asia
Figure 1. Distribution of mangroves in East Asia based on data from the ‘World Atlas of Mangroves”. PEMSEA countries with mangroves in medium grey.
Considering that five of the top eleven mangrove-holding countries globally are in East Asia, mangroves are indeed a critical blue carbon ecosystem for the region (Table 1). Indonesia has the greatest mangrove coverage of any country, both within East Asia and globally. There are some differences in estimated mangrove coverage depending on the methodology used. Notably, the BIOME method esti-mates are nearly double all other estimates and are likely an overestimation. This would seem to be the case, based on visual comparisons made by the authors of this report.
Based on the estimated mangrove area, mangrove carbon stocks across the region were calculated using several dif-ferent approaches. Field collected data provide the most reliable method for quantifying carbon stocks at a given location, and there are challenges to extrapolating these
values across a region as large as East Asia. This can be accomplished by combining multiple data sources to derive a statistical average of soil conditions (for example, the global default values provided by the IPCC 2014) or modelling stocks based on environmental conditions and field data to derive a potential carbon stock.25, 26
For this report, we calculate mangrove biomass and soil carbon stocks from default values and global mangrove modelling to estimate national carbon stocks. Using a field-based carbon stock assessment for Indonesia (where researchers have conducted the most extensive field work in the region), we highlight that national values can vary considerably from the modelled estimates. Hamilton and Friess (in review)8 created five global models for estimating biomass (above- and below-ground) and
25 Hamilton, S. E. and D. Friess. 2016. “High-resolution annual maps of whole system mangrove carbon stocks from 2000 to 2012.” arXiv preprint arXiv:1611.00307.26 Hutchinson, J. et al. 2013. “Predicting global patterns in mangrove forest biomass.” Conservation Letters, 7:233-240.
9
Understanding Strategic Coastal Blue Carbon Opportunities in the Seas of East Asia
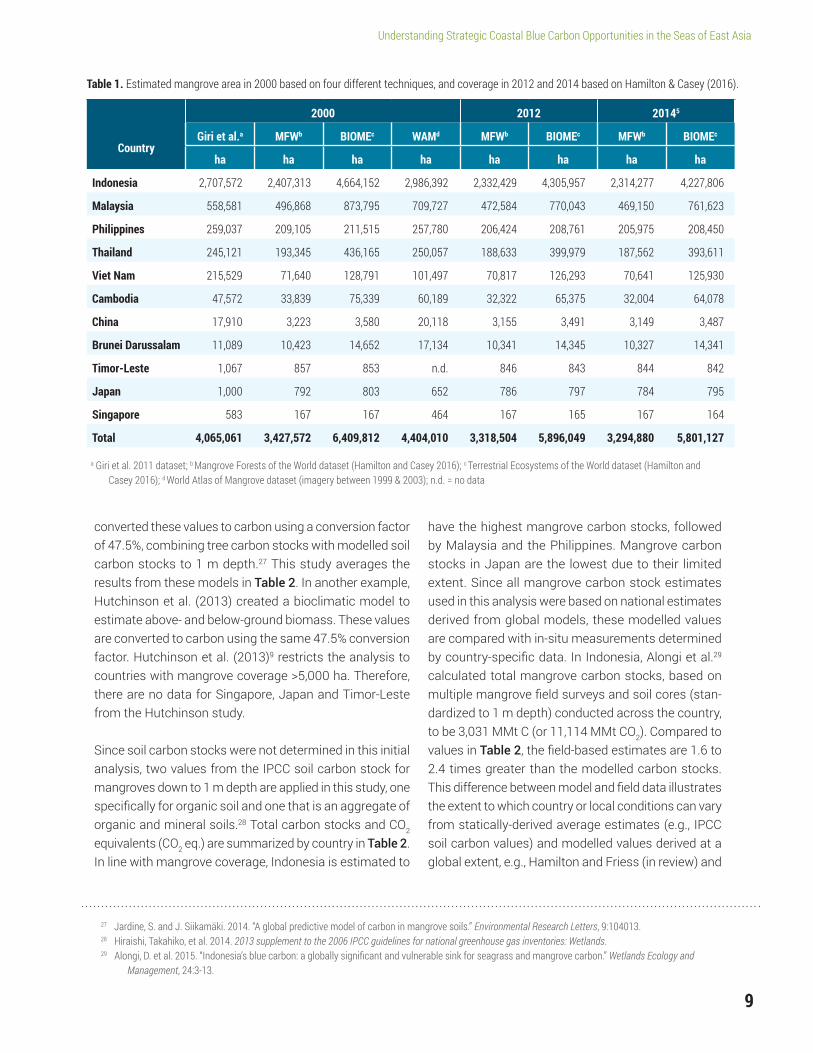
Table 1. Estimated mangrove area in 2000 based on four different techniques, and coverage in 2012 and 2014 based on Hamilton & Casey (2016).
2000 2012 20145
CountryGiri et al.a MFWb BIOMEc WAMd MFWb BIOMEc MFWb BIOMEc
ha ha ha ha ha ha ha ha
Indonesia 2,707,572 2,407,313 4,664,152 2,986,392 2,332,429 4,305,957 2,314,277 4,227,806
Malaysia 558,581 496,868 873,795 709,727 472,584 770,043 469,150 761,623
Philippines 259,037 209,105 211,515 257,780 206,424 208,761 205,975 208,450
Thailand 245,121 193,345 436,165 250,057 188,633 399,979 187,562 393,611
Viet Nam 215,529 71,640 128,791 101,497 70,817 126,293 70,641 125,930
Cambodia 47,572 33,839 75,339 60,189 32,322 65,375 32,004 64,078
China 17,910 3,223 3,580 20,118 3,155 3,491 3,149 3,487
Brunei Darussalam 11,089 10,423 14,652 17,134 10,341 14,345 10,327 14,341
Timor-Leste 1,067 857 853 n.d. 846 843 844 842
Japan 1,000 792 803 652 786 797 784 795
Singapore 583 167 167 464 167 165 167 164
Total 4,065,061 3,427,572 6,409,812 4,404,010 3,318,504 5,896,049 3,294,880 5,801,127
a Giri et al. 2011 dataset; b Mangrove Forests of the World dataset (Hamilton and Casey 2016); c Terrestrial Ecosystems of the World dataset (Hamilton and Casey 2016); d World Atlas of Mangrove dataset (imagery between 1999 & 2003); n.d. = no data
27 Jardine, S. and J. Siikamäki. 2014. “A global predictive model of carbon in mangrove soils.” Environmental Research Letters, 9:104013.28 Hiraishi, Takahiko, et al. 2014. 2013 supplement to the 2006 IPCC guidelines for national greenhouse gas inventories: Wetlands.29 Alongi, D. et al. 2015. “Indonesia’s blue carbon: a globally significant and vulnerable sink for seagrass and mangrove carbon.” Wetlands Ecology and Management, 24:3-13.
converted these values to carbon using a conversion factor of 47.5%, combining tree carbon stocks with modelled soil carbon stocks to 1 m depth.27 This study averages the results from these models in Table 2. In another example, Hutchinson et al. (2013) created a bioclimatic model to estimate above- and below-ground biomass. These values are converted to carbon using the same 47.5% conversion factor. Hutchinson et al. (2013)9 restricts the analysis to countries with mangrove coverage >5,000 ha. Therefore, there are no data for Singapore, Japan and Timor-Leste from the Hutchinson study.
Since soil carbon stocks were not determined in this initial analysis, two values from the IPCC soil carbon stock for mangroves down to 1 m depth are applied in this study, one specifically for organic soil and one that is an aggregate of organic and mineral soils.28 Total carbon stocks and CO2 equivalents (CO2 eq.) are summarized by country in Table 2. In line with mangrove coverage, Indonesia is estimated to
have the highest mangrove carbon stocks, followed by Malaysia and the Philippines. Mangrove carbon stocks in Japan are the lowest due to their limited extent. Since all mangrove carbon stock estimates used in this analysis were based on national estimates derived from global models, these modelled values are compared with in-situ measurements determined by country-specific data. In Indonesia, Alongi et al.29 calculated total mangrove carbon stocks, based on multiple mangrove field surveys and soil cores (stan-dardized to 1 m depth) conducted across the country, to be 3,031 MMt C (or 11,114 MMt CO2). Compared to values in Table 2, the field-based estimates are 1.6 to 2.4 times greater than the modelled carbon stocks. This difference between model and field data illustrates the extent to which country or local conditions can vary from statically-derived average estimates (e.g., IPCC soil carbon values) and modelled values derived at a global extent, e.g., Hamilton and Friess (in review) and

10
Understanding Strategic Coastal Blue Carbon Opportunities in the Seas of East Asia
Hutchinson et al. (2013). While model-based values may be sufficient for a regional estimate of carbon stocks, more accurate carbon stocks and carbon stock change are obtained through country-specific data. Addressing this discrepancy is a key consider-ation for future blue carbon research, highlighting the need to obtain better country-specific stock values, which ultimately will help to better calibrate global models.
To assess how rapidly mangroves are being lost across the region, two approaches are applied. The first approach calculates total percent of mangrove area change between 2000 and 2012 and yearly rates of change based on the Hamilton and Casey (2016) dataset (Table 3). Malaysia, Cambodia and Indonesia have the largest percentage loss of man-groves, ranging from 3 to 5%. Singapore, Japan and Brunei Darussalam had the lowest mangrove loss, with less than 1% lost over a 12-year period.
Table 3. Estimates of mangrove loss between 2000 and 2012.
Country
Percent Mangrove Loss
MFWa BIOMEb
2000 - 2012 Annually 2000 - 2012 Annually
Malaysia 4.89% 0.41% 13.23% 1.10%
Cambodia 4.48% 0.37% 11.87% 0.99%
Indonesia 3.11% 0.26% 7.68% 0.64%
Thailand 2.44% 0.20% 0.75% 0.06%
China 2.11% 0.18% 2.49% 0.21%
Philippines 1.28% 0.11% 2.10% 0.17%
Timor-Leste 1.28% 0.11% 1.20% 0.10%
Viet Nam 1.15% 0.10% 3.37% 0.28%
Brunei Darussalam
0.79% 0.07% 7.68% 0.64%
Japan 0.76% 0.06% 1.94% 0.16%
Singapore 0.00% 0.00% 2.46% 0.21%
a Mangrove Forests of the World dataset; b Terrestrial Ecosystems of the World dataset (Hamilton and Casey 2016)
Table 2. Estimates of mangrove and soil (1 m depth) carbon stocks in 2012.
Country Hamilton mangrove and soil model (MMt C)
Hutchinson biomass model w/ IPCC SO mangrove, organic (MMt C)
Hutchinson biomass model w/ IPCC SO mangrove, aggregate (MMt C)
Hamilton mangrove and soil model (MMt CO2 eq.)
Hutchinson biomass model w/ IPCC SO mangrove, organic (MMt CO2 eq.)
Hutchinson biomass model w/ IPCC SO mangrove, aggregate (MMt CO2 eq.)
Indonesia 1,253.8 (14.9) 1,900.3 1,646.4 4,597.3 (54.6) 6,967.6 6,036.8
Malaysia 254.2 (3.1) 455.8 395.5 932.0 (11.2) 1,671.2 1,450.0
Philippines 102.3 (0.9) 157.2 135.3 375.2 (3.4) 576.5 496.1
Thailand 90.0 (1.1) 148.7 127.5 330.0 (4.0) 545.4 467.5
Viet Nam 33.0 (0.5) 58.0 49.4 121.0 (2.0) 212.7 181.1
Cambodia 15.1 (0.1) 35.9 30.8 55.4 (0.5) 131.5 112.8
China 5.2 (0.1) 10.7 9.0 18.9 (0.4) 39.2 32.9
Brunei Darussalam 0.3 (0.007) 11.6 10.2 1.3 (0.03) 42.7 37.4
Timor-Leste 0.2 (0.002) n.d. n.d. 0.9 (0.006) n.d. n.d.
Japan 0.1 (0.007) n.d. n.d. 0.4 (0.03) n.d. n.d.
Singapore 0.07 (0.008) n.d. n.d. 0.2 (0.03) n.d. n.d.
Total 1,754 2,778 2,404 6,433 10,187 8,815
Note: Values in parentheses represent standard error; n.d. = no data.

11
Understanding Strategic Coastal Blue Carbon Opportunities in the Seas of East Asia
A second approach developed by Richards and Friess is also applied.30 The analysis incorporates global forest change data from 2000 to 2012 com-bined with analysis of satellite imagery to describe the extent of mangrove deforestation and the type of land uses created with deforestation through-out East Asia. China, Singapore and Japan were not included in their analysis.31 As with the prior approach, most mangrove deforestation identified occurred in Malaysia and Indonesia. This loss was primarily due to oil palm plantations and aquacul-ture, respectively. Across all countries examined,
Tidal Marsh Ecosystems
Tidal marshes are found at latitudes that are too cold for mangroves to tolerate, typically latitudes greater than 30°N and 30°S. Therefore, in East Asia, tidal marshes occur primarily in China, Japan, DPR Korea and RO Korea. The term “tidal marsh” includes salt, brackish and freshwater marshes, though most tidal marsh research has occurred in salt marshes and thus is the focus of this study.
aquaculture was the primary driver of mangrove deforestation, followed by oil palm plantations (Table 4).
In summary, East Asia has some of the largest coverage and biomass of mangroves globally due to the location and climate of its countries. Indonesia and Malaysia are two of the top man-grove-holding countries globally, and have some the greatest deforestation rates as such, primarily for aquaculture but also palm oil where mangroves meet terrestrial peatlands.
Tidal marsh ecosystems across East Asia are far less well mapped and studied than mangroves, and few academic papers or reports have been published regarding their distribution and carbon stocks. The technologies exist to map tidal marshes but, to date, no comprehensive datasets have been assembled within the region.32 This study was unable to find any documentation on tidal marsh distribution, carbon stocks or losses for Japan, DPR Korea and RO Korea. This is a significant information gap, yet capacity exists to fill the gap.
30 Richards, D. & D. Friess. 2016. “Rates and drivers of mangrove deforestation in Southeast Asia, 2000-2012.” PNAS, 113:344-349.31 Hansen, M. et al. 2013. “High-resolution global maps of 21st century forest cover change.” Science, 342:850-853.32 Zuo, P. et al. 2012. “Distribution of Spartina spp. along China’s coast.” Ecological Engineering, 40:160-166.
Note: no data are available for China, Singapore, and Japan.
Table 4. Type and amount of mangrove change (in hectares) between 2000 and 2012.9
Country
Type and amount of change (ha)
Aquaculture Recent deforestation
Oil palm Rice Erosion Urban New Growth Mangrove
New Terrestrial Forest
Indonesia 29,591 3,123 9,578 45 2,433 1,127 13,768 1,241
Malaysia 2,764 1,272 7,193 15 163 2,412 3,316 1,701
Thailand 379 151 1,403 195 1 503 179 693
Philippines 523 465 158 12 12 38 105 111
Cambodia 338 457 108 18 1 56 119 122
Viet Nam 112 8 3 55 17 332 3 1
Brunei Darussalam 14 7 13 0 0 8 6 0
Timor-Leste 0 0 0 1 2 0 0 0
12
Understanding Strategic Coastal Blue Carbon Opportunities in the Seas of East Asia
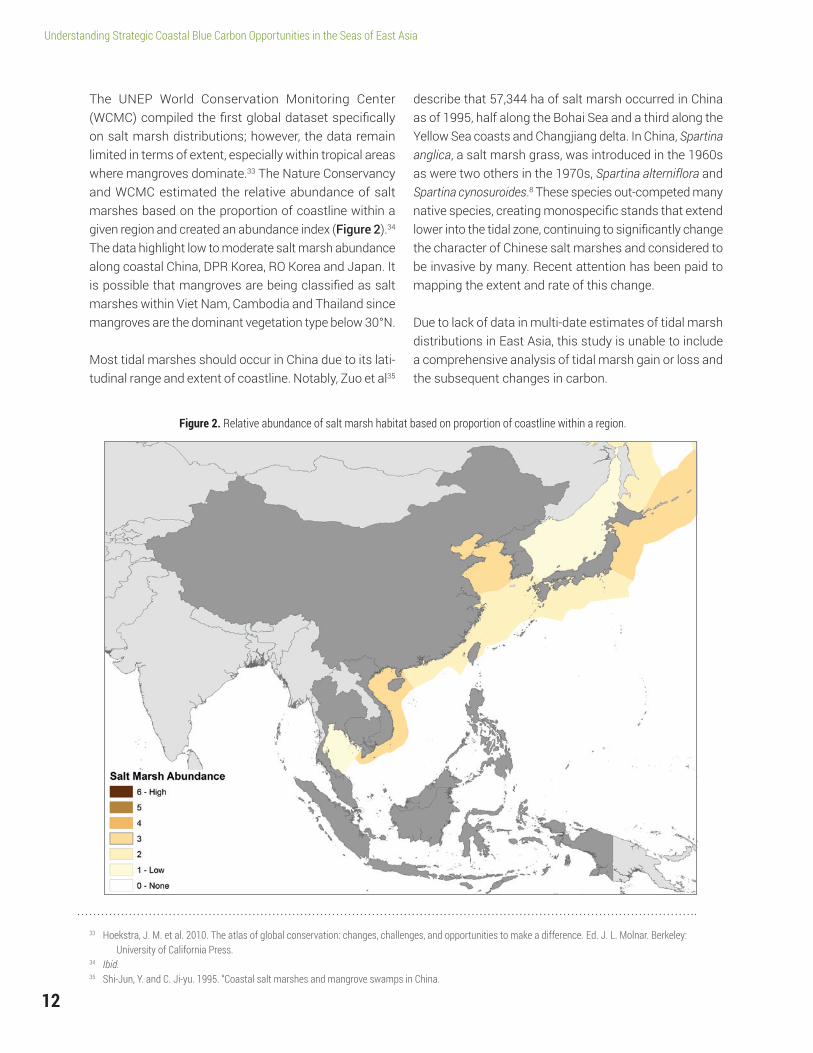
The UNEP World Conservation Monitoring Center (WCMC) compiled the first global dataset specifically on salt marsh distributions; however, the data remain limited in terms of extent, especially within tropical areas where mangroves dominate.33 The Nature Conservancy and WCMC estimated the relative abundance of salt marshes based on the proportion of coastline within a given region and created an abundance index (Figure 2).34 The data highlight low to moderate salt marsh abundance along coastal China, DPR Korea, RO Korea and Japan. It is possible that mangroves are being classified as salt marshes within Viet Nam, Cambodia and Thailand since mangroves are the dominant vegetation type below 30°N.
Most tidal marshes should occur in China due to its lati-tudinal range and extent of coastline. Notably, Zuo et al35
describe that 57,344 ha of salt marsh occurred in China as of 1995, half along the Bohai Sea and a third along the Yellow Sea coasts and Changjiang delta. In China, Spartina anglica, a salt marsh grass, was introduced in the 1960s as were two others in the 1970s, Spartina alterniflora and Spartina cynosuroides.8 These species out-competed many native species, creating monospecific stands that extend lower into the tidal zone, continuing to significantly change the character of Chinese salt marshes and considered to be invasive by many. Recent attention has been paid to mapping the extent and rate of this change.
Due to lack of data in multi-date estimates of tidal marsh distributions in East Asia, this study is unable to include a comprehensive analysis of tidal marsh gain or loss and the subsequent changes in carbon.
Figure 2. Relative abundance of salt marsh habitat based on proportion of coastline within a region.
33 Hoekstra, J. M. et al. 2010. The atlas of global conservation: changes, challenges, and opportunities to make a difference. Ed. J. L. Molnar. Berkeley: University of California Press.34 Ibid.35 Shi-Jun, Y. and C. Ji-yu. 1995. “Coastal salt marshes and mangrove swamps in China.

13
Understanding Strategic Coastal Blue Carbon Opportunities in the Seas of East Asia
In the absence of data, it is speculated that no more than 60,000 ha of tidal marsh remains across the region. There is a critical need for a tidal marsh change detection analysis to occur, similar to the mangrove analyses in the previous section, spanning at least a ten-year period. However, specifically in China, it was reported that 708,200 ha of salt marshes have been drained, diked or otherwise modified for aquaculture, rice cultivation and development.36 While data are not available for tidal marsh plant carbon stocks, applying IPCC default values for soil organic carbon to tidal marshes with a mixture of organic and mineral soil,37
total soil carbon emissions are estimated to be 180.6 MMt C (or 662.2 MMt CO2).
Seagrass Ecosystems
Seagrass beds in the South China and Java Seas are some of the most diverse globally (Figure 3).38,39 Throughout the seas of East Asia, 19 species of seagrass have been iden-tified, or roughly a third of the total number of seagrass species worldwide. But, of all blue carbon ecosystems, seagrass beds are the least documented and mapped within East Asia. This represents a major information gap.
Figure 3. Number of seagrass species located in coastal waters of East Asia.
36 Ibid.37 255 t C ha-1;(95% CI: 254, 297); IPCC 201438 Hoekstra, J. M. et al. 2010. The atlas of global conservation: Changes, challenges, and opportunities to make a difference.39 Hutomo, M. and M. Moosa. 2005. “Indonesian marine and coastal biodiversity: present status.” Indian Journal of Marine Sciences, 34:88-97.
14
Understanding Strategic Coastal Blue Carbon Opportunities in the Seas of East Asia
Seagrass beds provide food and habitat for many species including sea turtles, dugongs and sea-horses and many commercially important fish species, and they are some of the most threatened habitats due to their close proximity to the shore. Not only are they affected by natural events, such as typhoons and other storms, they are also heavily impacted by suspended sediment, eutrophication, heavy metals, aquaculture and fishing and trawling.
Seagrass beds are also the most difficult blue carbon ecosystem to determine distributions for due to their subtidal location (i.e., they are underwa-ter). Remote sensing techniques commonly used for mapping terrestrial and wetland habitats gener-ally do not work for seagrasses due to the constant presence of water, which inhibits use of most satel-lite or airborne sensors. Therefore, most seagrass surveys are conducted through field observation, often using SCUBA diving and manual delineation with GPS units.
Some of the largest areas of seagrass beds located within the South China Sea occur near Cape Bolinao, Philippines (22,400 ha); Kampot Province, Cambodia (25,200 ha); Phu Quoc, Viet Nam (12,500 ha); and East Bintan, Indonesia (2000 ha).40 Along coastal southern China, seagrass beds totalling 2,400 ha have been surveyed: 910 ha, 690 ha and 871 ha in Guangdong, Guangxi and Hainan provinces, respectively, with very small patches in Hong Kong.41 Approximately 78 seagrass beds have been identified in Malaysia,42 with 316 ha identified in peninsular Malaysia.43 Thailand and Viet Nam have at least 6,850 and 44,000 ha of known sea-
grass beds. In the Philippines, a country-wide survey is currently underway (M. Fortes, personal commu-nication). No nationwide studies on seagrass area in RO Korea have been conducted, but estimates of eelgrass coverage are between 5,500 and 7,000 ha along the southern coast. In Japan, eelgrass bed coverage was estimated to be 49,600 ha. Estimates of 3,000,000 ha of seagrass beds occur throughout Indonesia, although these have not been thoroughly mapped.44 No area estimates are known for DPR Korea, Timor-Leste or Brunei Darussalam. More field-based surveys are needed, along with research into newly-developed remote sensing techniques that could aid in more accurately and extensively identify-ing seagrass beds.
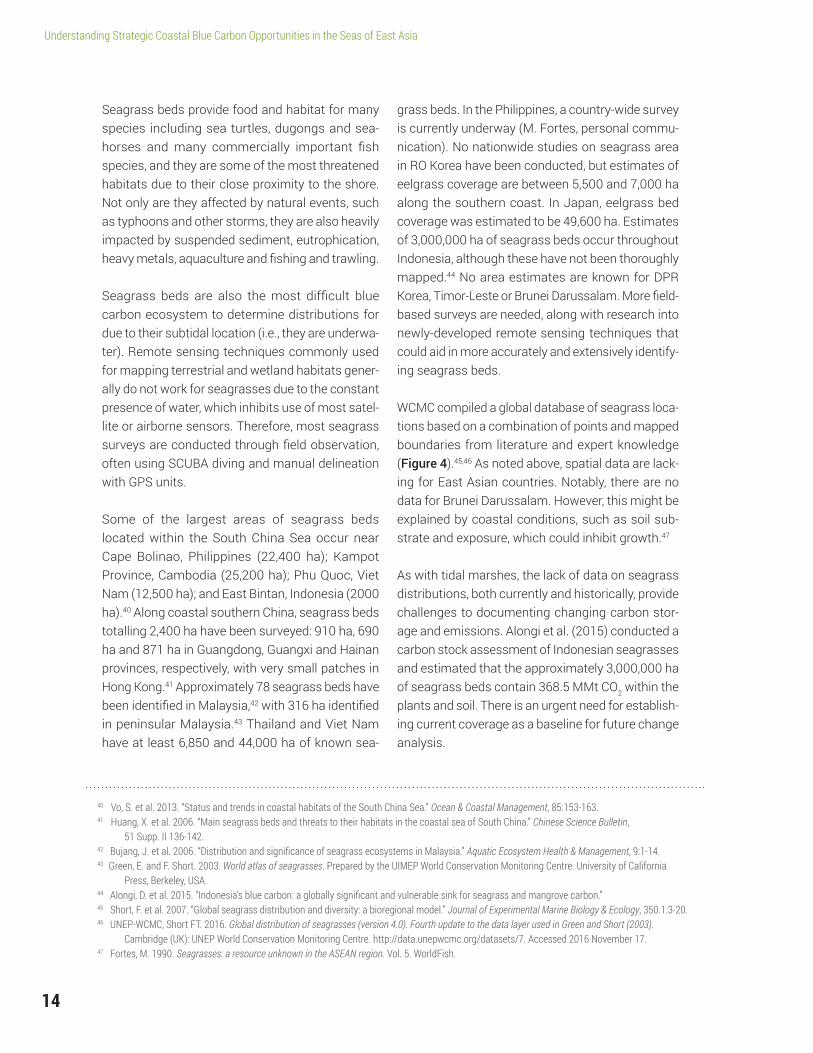
WCMC compiled a global database of seagrass loca-tions based on a combination of points and mapped boundaries from literature and expert knowledge (Figure 4).45,46 As noted above, spatial data are lack-ing for East Asian countries. Notably, there are no data for Brunei Darussalam. However, this might be explained by coastal conditions, such as soil sub-strate and exposure, which could inhibit growth.47
As with tidal marshes, the lack of data on seagrass distributions, both currently and historically, provide challenges to documenting changing carbon stor-age and emissions. Alongi et al. (2015) conducted a carbon stock assessment of Indonesian seagrasses and estimated that the approximately 3,000,000 ha of seagrass beds contain 368.5 MMt CO2 within the plants and soil. There is an urgent need for establish-ing current coverage as a baseline for future change analysis.
40 Vo, S. et al. 2013. “Status and trends in coastal habitats of the South China Sea.” Ocean & Coastal Management, 85:153-163.41 Huang, X. et al. 2006. “Main seagrass beds and threats to their habitats in the coastal sea of South China.” Chinese Science Bulletin, 51 Supp. II 136-142.42 Bujang, J. et al. 2006. “Distribution and significance of seagrass ecosystems in Malaysia.” Aquatic Ecosystem Health & Management, 9:1-14.43 Green, E. and F. Short. 2003. World atlas of seagrasses. Prepared by the UIMEP World Conservation Monitoring Centre. University of California Press, Berkeley, USA.44 Alongi, D. et al. 2015. “Indonesia’s blue carbon: a globally significant and vulnerable sink for seagrass and mangrove carbon.”45 Short, F. et al. 2007. “Global seagrass distribution and diversity: a bioregional model.” Journal of Experimental Marine Biology & Ecology, 350.1:3-20.46 UNEP-WCMC, Short FT. 2016. Global distribution of seagrasses (version 4.0). Fourth update to the data layer used in Green and Short (2003). Cambridge (UK): UNEP World Conservation Monitoring Centre. http://data.unepwcmc.org/datasets/7. Accessed 2016 November 17.47 Fortes, M. 1990. Seagrasses: a resource unknown in the ASEAN region. Vol. 5. WorldFish.

15
Understanding Strategic Coastal Blue Carbon Opportunities in the Seas of East Asia
48 The calculated area is a reasonable approximation of former tidal wetland area. It will include some areas of former unvegetated tidal and subtidal wetlands that could accentuate the estimate, but also filled tidal wetland areas now above high tides that would detract from the calculated area.49 Shuttle Radar Topography Mission (SRTM) with 90m resolution and vertical accuracy of 1m. SRTM-derived water bodies and mangrove areas (per Giri et al. 2011) were masked from the dataset so as not to overestimate the floodplain level area.50 Crooks, S. et al. 2016. Bringing Coastal Wetlands into the U.S. Inventory of Greenhouse Gas Emissions and Sinks. Presentation at Restore America’s Estuaries Summit, New Orleans December 11, 2016.51 Syvitskiet, J. et al. 2009. “Sinking Deltas Due to Human Activities. Nature Geoscience, 2:681-686.52 Arnell, N.W. and Gosling, S. N. 2016. “The impact of climate change on river flood risk at the global scale.” Climate Change, 134(1):387-401.
Historic Loss of Blue Carbon Ecosystems
While distributions over time are not mapped for most blue carbon ecosystems in East Asia, long-term historic loss of mangroves and tidal marshes can be estimated.48 Using satellite-derived elevation data,49 the area of land now at or below mean sea level that was not already classified
increase in delta areas. This is due to a combination diked areas being isolated from river sediment supply that once compensated for natural high rates of subsidence that occur across delta areas, coupled with rising water levels as sea level rises and river flood flows increase due to climate change.51,52
Figure 4. Seagrass beds that have been mapped in East Asia.
as intertidal or subtidal habitat can be derived. Much of this area will once have been tidal wetlands historically, now con-verted through human actions to other lands uses, such as agriculture or settle-ment. Total area by country is given in Table 5 and country-specific maps are available in the Appendix. Notably, China contains the largest extent of coastal floodplain.
At 3,359,041 ha, the total area of con-verted and diked former tidal wetlands across East Asia is substantial (by com-parison, the drained coastal wetland area of the conterminous United States is 529,551 ha).50
Large rivers flowing from the Himalayas carry sediment, building vast deltas and coastal floodplains, notably at the mouths of rivers Yellow, Yangtze, Pearl, Red and Mekong. Expansive coastal plains also formed at the mouth of smaller rivers, such as the Chao Phraya, and along the island coastal margins of Indonesia. These low-lying flat lands are both highly attractive for human occupa-tion, but they are also highly vulnerable to, and costly to protect from, flooding. Over time, vulnerability to flooding will
16
Understanding Strategic Coastal Blue Carbon Opportunities in the Seas of East Asia
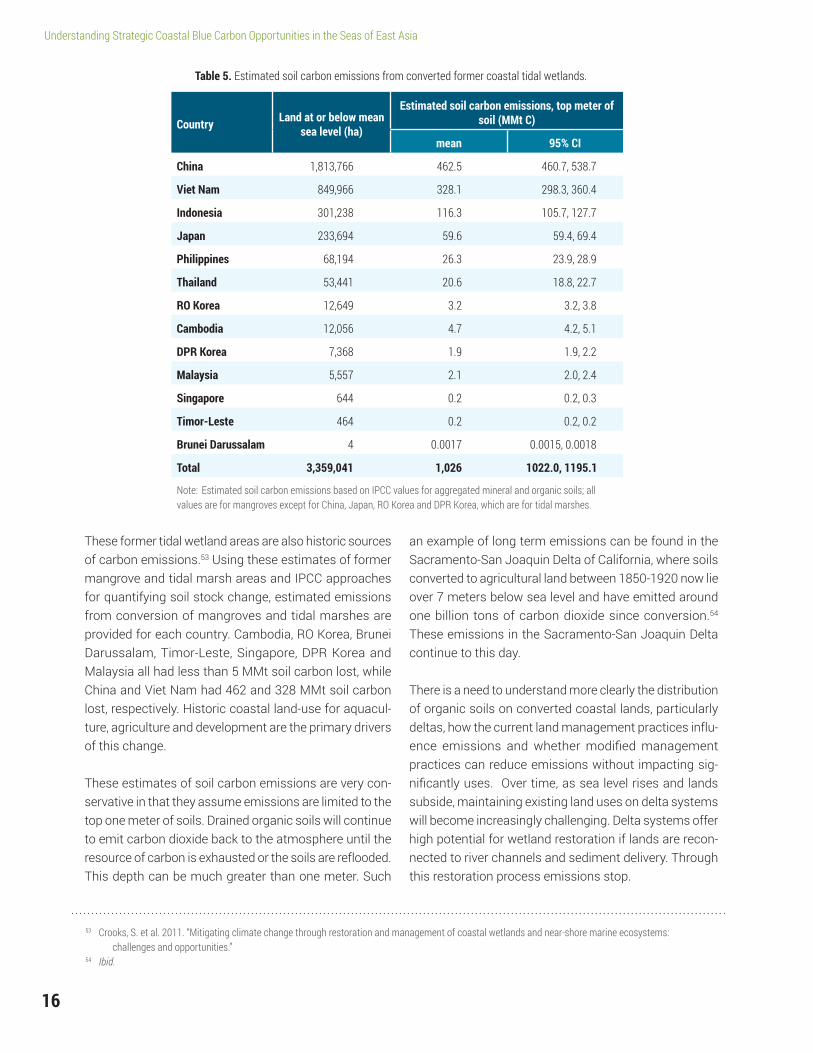
These former tidal wetland areas are also historic sources of carbon emissions.53 Using these estimates of former mangrove and tidal marsh areas and IPCC approaches for quantifying soil stock change, estimated emissions from conversion of mangroves and tidal marshes are provided for each country. Cambodia, RO Korea, Brunei Darussalam, Timor-Leste, Singapore, DPR Korea and Malaysia all had less than 5 MMt soil carbon lost, while China and Viet Nam had 462 and 328 MMt soil carbon lost, respectively. Historic coastal land-use for aquacul-ture, agriculture and development are the primary drivers of this change.
These estimates of soil carbon emissions are very con-servative in that they assume emissions are limited to the top one meter of soils. Drained organic soils will continue to emit carbon dioxide back to the atmosphere until the resource of carbon is exhausted or the soils are reflooded. This depth can be much greater than one meter. Such
an example of long term emissions can be found in the Sacramento-San Joaquin Delta of California, where soils converted to agricultural land between 1850-1920 now lie over 7 meters below sea level and have emitted around one billion tons of carbon dioxide since conversion.54 These emissions in the Sacramento-San Joaquin Delta continue to this day.
There is a need to understand more clearly the distribution of organic soils on converted coastal lands, particularly deltas, how the current land management practices influ-ence emissions and whether modified management practices can reduce emissions without impacting sig-nificantly uses. Over time, as sea level rises and lands subside, maintaining existing land uses on delta systems will become increasingly challenging. Delta systems offer high potential for wetland restoration if lands are recon-nected to river channels and sediment delivery. Through this restoration process emissions stop.
Table 5. Estimated soil carbon emissions from converted former coastal tidal wetlands.
Country Land at or below mean sea level (ha)
Estimated soil carbon emissions, top meter of soil (MMt C)
mean 95% CI
China 1,813,766 462.5 460.7, 538.7
Viet Nam 849,966 328.1 298.3, 360.4
Indonesia 301,238 116.3 105.7, 127.7
Japan 233,694 59.6 59.4, 69.4
Philippines 68,194 26.3 23.9, 28.9
Thailand 53,441 20.6 18.8, 22.7
RO Korea 12,649 3.2 3.2, 3.8
Cambodia 12,056 4.7 4.2, 5.1
DPR Korea 7,368 1.9 1.9, 2.2
Malaysia 5,557 2.1 2.0, 2.4
Singapore 644 0.2 0.2, 0.3
Timor-Leste 464 0.2 0.2, 0.2
Brunei Darussalam 4 0.0017 0.0015, 0.0018
Total 3,359,041 1,026 1022.0, 1195.1
Note: Estimated soil carbon emissions based on IPCC values for aggregated mineral and organic soils; all values are for mangroves except for China, Japan, RO Korea and DPR Korea, which are for tidal marshes.
53 Crooks, S. et al. 2011. “Mitigating climate change through restoration and management of coastal wetlands and near-shore marine ecosystems: challenges and opportunities.”54 Ibid.

17
Understanding Strategic Coastal Blue Carbon Opportunities in the Seas of East Asia
International climate policy has long been concerned with formulating emission reduction objectives and (to a lesser extent) resilience goals, but it has also provided an ever-increasing number of instruments– some specifically designed for non-government entities and some triggering considerable funding– that help achieve the objectives and goals set.
The importance of mangroves for designing climate change adaptation instruments has long been recog-nized by scientists, policymakers and civil society groups across countries.55 It was not until recently, however, that the specific value and role of man-groves, tidal marshes and seagrasses for climate change mitigation were addressed by climate policy experts).
Widely regarded as one of its greatest weaknesses, the Kyoto Protocol focused almost exclusively on cli-mate change mitigation, yet without providing for any instruments to combat emissions from deforestation and ecosystem degradation.56 Twenty years on, with the Paris Agreement freshly entered into force, the situation is quite different. The constructive syner-gies and overlaps between blue carbon interventions
and adaptation efforts are beginning to inform poli-cymakers worldwide. Conservation, restoration and sustainable use of sensitive coastal ecosystems are increasingly understood in their multiple roles to sup-port livelihoods, store carbon and increase resilience against climate change. In its preamble, the Paris Agreement notes the “importance of ensuring the integrity of all ecosystems, including oceans, and the protection of biodiversity”, and a full article is reserved for the Parties’ commitment to “conserve and enhance, as appropriate, sinks and reservoirs of greenhouse gases”.
While the majority of countries, in their climate change strategies and their international commitments–intended nationally determined contributions or “INDCs”–made in anticipation of the Paris Agreement, still largely treat coastal conservation and restora-tion efforts exclusively within the scope of adaptation and resilience, there are early movers and pioneers that have explicitly mentioned coastal blue carbon ecosystems as part of their mitigation efforts.57 An increasing number of governments and non-govern-ment institutions have also started to conceptualize specific opportunities presented when linking blue
Blue Carbon as a Climate Intervention Concept: UNFCCC, Kyoto Protocol and the Paris Agreement
55 McLeod, Elizabeth and Rodney V. Salm. 2006. “Managing mangroves for resilience to climate change.” World Conservation Union (IUCN), Gland. http://cmsdata.iucn.org/downloads/managing_mangroves_for_resilience_to_climate_change.pdf. Accessed 2016 December 8.56 Joosten, H. et al. 2016. “Peatlands, forests and the climate architecture: setting incentives through markets and enhanced accounting.” https://www.umweltbundesamt.de/publikationen/peatlands-forests-the-climate-architecture-setting. Accessed 2016 December 8.57 For an overview of blue carbon country commitments in INDCs see D. Herr / E. Landis, Coastal blue carbon ecosystems (IUCN / TNC 2016).
3Photo by SCA/Crooks

18
Understanding Strategic Coastal Blue Carbon Opportunities in the Seas of East Asia
carbon interventions with conservation finance58 and payment-for-ecosystem services (“PES”) schemes,59 on the one hand, and new climate finance tools, such as results-based finance,60 blue bonds61 and debt-swap-for-nature agreements,62 on the other hand. Several country-specific efforts show that there is growing interest in including the carbon value of these three ecosystems in national policy, planning and decision-making.63
History I: Between Mitigation and Adaptation
Climate change policymaking has long been split between climate change mitigation–reducing CO2 and other greenhouse gases (measured by their warming potential as CO2 equivalent or CO2 eq)–and climate change adaptation. This split was never simply a breakdown of tasks. Rather, it always represented a choice of objec-tives, either combating climate change or dealing with its consequences, particularly when focusing on the former allowed for a clear allocation of responsibility of action (for industrialized countries). This paradig-matic choice was always a curious one, not based in the United Nations Framework Convention on Climate Change (UNFCCC), which formulated a functional rela-tionship: to stabilize emissions of greenhouse gases (GHG) in order to allow ecosystems to adapt naturally (Article 2 UNFCCC). Yet, it drove the negotiations of the Kyoto Protocol and was very effective in ensuring that for 20 years of climate change policy making, the focus was on climate change mitigation and what industrialized countries could do on that front. This led to a prioritization of addressing industrial production
and the generation and use of energy, to the disadvan-tage of land-use matters–“LULUCF” in the terminology of climate negotiations: land use, land-use change and forestry—at large.
History II: Blue Carbon Accounting Rules and Practice
This said, the focus on mitigation and energy was also a pragmatic one. While it is fairly easy to measure and calculate GHG emissions from industrial instal-lations, measuring and calculating GHG fluxes from ecosystems is far more complex, involving questions of agency, human-induced or natural, as well as tem-porality (permanence of sequestration). Thus, largely reducing GHG accounting to energy-related activities allowed Parties to the Kyoto Protocol to formulate with certainty historic emissions (using a base year for most countries of 1990) and targets to be reached by 2012.
Still, industrialized countries in calculating GHG emissions had to account for certain land-related activi-ties, such as forestland and cropland management. Following the release of the IPCC Wetland Supplement in 2014 countries were given the opportunity to also recognize emissions and removals with wetland drain-age and rewetting. Accounting for these emissions is voluntary, though countries such as the United State and Australia are amongst a few early adopters in applying the Wetland Supplement guidance.
Developing countries, which host the clear majority of blue carbon ecosystems, have no accounting obliga-tions. They are still requested to report GHG emissions
58 Huwyler, F. et al. 2014. Conservation finance: moving beyond donor funding toward an investor-driven approach. Credit Suisse, WWF, McKinsey & Company: Zurich, Switzerland.59 Locatelli, T. et al. 2014. “Turning the tide: how blue carbon and payments for ecosystem services (PES) might help save mangrove forests.” DOI 10.1007/s13280-014-0530-y. Accessed 2016 December 9.60 For a project-based perspective see S. Crooks et al. 2014. Guiding principles for delivering coastal wetland carbon projects, at http://www.unep.org/pdf/Guiding_principles_for_delivering_coastal_wetland_projects.pdf.61 For the concept on “green bonds” see World Bank Treasury at http://treasury.worldbank.org/cmd/pdf/What_are_Green_Bonds.pdf; the issuance of “blue bonds” is under consideration by, among others, the Seychelles, cf. Bloomberg News of 24 January 2016: “Seychelles Plans Blue Bonds to Develop Sustainable Fisheries, at http://www.bloomberg.com/news/articles/2016-01-24/seychelles-plans-blue-bond-sale-to- develop-sustainable-fisheries.62 Resor, J. 2010. “Debt-for-nature swaps: a decade of experience and new directions for the future.” http://www.fao.org/docrep/w3247e/w3247e06.htm. Accessed 2016 December 9.63 Cf. the “Sustainable Landscapes in Eastern Madagascar” Project, a cooperation between the European Investment Bank and Conservation International, with initial funding provided by the Green Climate Fund to prepare green / blue bond issuance; see also UNDP’s project for Viet Nam (“Improving the resilience of vulnerable coastal communities to climate change related impacts in Viet Nam”), which includes mitigation and adaptation activities rooted in mangrove rehabilitation (funded by the Green Climate Fund).
19
Understanding Strategic Coastal Blue Carbon Opportunities in the Seas of East Asia
64 The two most commonly used definitions of forest are those used by the Food and Agriculture Organization of the United Nations (FAO) – forest means all land spanning more than 0.5 hectares with trees higher than 5 meters and a canopy cover of more than 10% – and the Kyoto Protocol Marrakesh Accords, UNFCCC (2001) COP.7: forest requires minimum area between 0,05 to 1 hectare, a minimum height at maturity of between 2-5 meters, and a crown cover of between 10-30%; countries may freely decide within these scopes.65 Hiraishi, Takahiko, et al. 2014. 2013 supplement to the 2006 IPCC guidelines for national greenhouse gas inventories: Wetlands.66 UNFCCC. [n.d.]. “AR-AM0014: Afforestation and reforestation of degraded mangrove habitats --- Version 3.0.” https://cdm.unfccc.int/methodologies/DB/KMH6O8T6RL3P5XKNBQE2N359QG7KOE. Accessed 2016 December 12.67 UNFCCC. [n.d.]. “Small-scale and low-income community-based mangrove afforestation project on tidal flats of three small islands around Batam City, Riau Islands Province, Republic of Indonesia.” https://cdm.unfccc.int/Projects/Validation/DB/Q94TKNG9V6GRFOTRKPLWD V2GHBCFWW/view.html. Accessed 2016 December 12.68 See the VCS Methodology for Tidal Wetland and Seagrass Restoration, http://database.v-c-s.org/methodologies/methodology-tidal-wetland-and- seagrass-restoration-v10.69 ICAO. 2016. “Draft text for the report on agenda item 22 (Section on Global Market-based Measure Scheme).” http://www.icao.int/Meetings/a39/ Documents/WP/wp_462_en.pdf. Accessed 2016 December 12.
as part of their national inventories and, since recently, in the form of biennial update reports (BURs). But reporting standards remain much weaker than the target-oriented accounting standards. While the methodological report-ing approach is improving, the overall quality of data remains paltry. Mangrove-related data is nominally included in those countries that consider mangroves as forest,64 but the calculation for most areas is incom-plete. The IPCC recently issued a dedicated section on accounting for emissions from wetlands, including man-grove forests, tidal marshes and seagrass meadows in 2013,65 and these up-to-date accounting guidelines are only now starting to be applied by pioneering countries. Blue carbon ecosystems other than mangrove forests are usually not covered.
CDM: Mangrove Afforestation and Reforestation Approaches
The Clean Development Mechanism (CDM) is the most prominent of the so-called “flexible mechanisms” of the Kyoto Protocol. It allows industrialized countries to invest in emission reduction or sequestration projects in developing countries in exchange for the issuance of credits, or Certified Emission Reductions (CERs), which can be used by industrialized countries to offset their emissions and to comply with the Kyoto target.
The CDM is highly restrictive when it comes to land-use based projects. It permits afforestation and reforestation projects only (excluding conservation projects proper) and it issues temporary credits only in acknowledge-ment of the risk that a forest, once planted, may burn, be chopped down or otherwise degrade (Joosten et al. 2016). Still, the CDM led to the development of more than
10 ecosystem-based accounting methodologies (for example on “Afforestation and reforestation of degraded mangroves”)66 and some 50 projects world-wide, among them a “Small-scale and low-income community-based mangrove afforestation project on tidal flats” in Riau Island Province, Indonesia.67
Voluntary Carbon Markets
Voluntary carbon standards spread where the CDM did not provide action formats, notably in the area of ecosystem conservation. The Verified Carbon Standard (VCS), in particular, consolidated blue carbon-related project approaches. Under its sec-toral scope “Wetlands”, it offers a methodology for coastal wetland creation as well as a methodology for tidal wetland and seagrass restoration.68
While the overall value of the voluntary carbon mar-kets has been stable for some years, additional demand is expected to come from the aviation industry, which in 2016 paved the way for a carbon offsetting instrument. In the framework of the International Civil Aviation Organization (ICAO), countries committed to freeze aviation emissions from 2020 onwards.69 To compensate for increasing emissions, a dedicated mechanism will be set up: the Carbon Offsetting and Reduction Scheme for International Aviation (“CORSIA”). Some 65 countries representing more than 80% of international air traf-fic have signed up so far and countries and airlines are given discretion when preparing for the pilot-ing phase (starting, formally, in 2020). The Verified Carbon Standard, in particular, hopes for clearance of VCS projects under CORSIA.

20
Understanding Strategic Coastal Blue Carbon Opportunities in the Seas of East Asia
REDD: Overlapping Concepts
Over recent years, discussions on how to reduce emissions from deforestation and forest degradation (REDD+) have emerged as one of the main negotiation blocks between UNFCCC Parties.70 A comprehensive framework – the Warsaw Framework for REDD+71 – was established, and the Paris Agreement specifi-cally encourages Parties to take actions to promote REDD+.72 While REDD+ remains a complex instrument, important progress has been made over the years on many fronts and many technical details, including the calculation of forest emission reference levels, REDD+ safeguards, REDD+ implementation phases and jurisdictional (sub-national) approaches. A range of bilateral and multilateral activities have supported REDD+ development, among them the United Nations Collaborative Initiative on Reducing Emissions from Deforestation and forest Degradation (UN REDD) and the World-Bank-managed Forest Carbon Partnership Facility (FCPF). Some fifty, mostly tropical, countries–includ-ing the majority of PEMSEA partner countries–have started building country-wide REDD/REDD+ imple-mentation frameworks, with financial support from developed countries. By 2015, almost $9 billion USD had been pledged by donors to support REDD+ activities.73 For an overview of funding facilities with a special focus on REDD+ see the later discussion on linking climate finance and blue carbon (Section IV).
REDD+ and blue carbon interventions share a number of characteristics. They have habitat overlap, as far as mangroves are concerned (and as long as countries consider mangroves as forest, which most, but not all, do). They share many direct drivers of degradation, notably agriculture (for blue carbon habitats, aquacul-ture, in particular), timber extraction and development (construction), as well as indirect causes, including land tenure related challenges.74 Governments increas-ingly design REDD+ projects and toolkits for coastal environments, sometimes highlighting the importance of mangrove forests.75 Nevertheless, REDD+ remains a slow process, and most countries have not yet tapped into the scheme’s full potential.76
It is also noted that REDD+ engagement often holds a certain level of ambiguity for blue carbon ecosystems, which in turn can impede project-level action. First, it is often not clear to what extent blue carbon ecosystems are covered by a country’s REDD+ policy framework. At first sight, several countries, including Indonesia, Malaysia and Viet Nam, cover mangroves for the purpose of defining their REDD+ reference levels. Yet, looking deeper, these countries mostly include above-ground biomass only, leaving the enormous below-ground carbon sink in limbo.77 Then, second, as the primary focus of REDD+ is nation-wide or jurisdic-tional engagement, the role of REDD+ projects remains vague, and carbon project developers have the (at
70 La Viña, A. et al. 2016. “History and future of REDD+ in the UNFCCC: issues and challenges.” In Research Handbook on REDD+ and International Law. Edited by C. Voigt. http://www.e-elgar.com/shop/eep/preview/book/isbn/9781783478316/. Accessed 2017 January 25. See further on REDD and blue carbon and blue carbon commonalities Herr et al. 2017. Pathways for implementation of blue carbon initiatives, Aquatic Conservation (forthcoming).71 Decisions 9-15 of Warsaw Framework for REDD-plus (COP 19, Warsaw), http://unfccc.int/land_use_and_climate_change/redd/items/8180.php. Accessed 2016 December 12.72 Article 5.2 of the Paris Agreement.73 Lee, D. and T. Pistorius. 2015. “The Impacts of International REDD Finance.” http://www.climateandlandusealliance.org/wp-content/ uploads/2015/09/Impacts_of_International_REDD_Finance_Report_FINAL. Accessed 2016 December 15.74 Rotich, B. et al. 2016. Where land meets the sea. A global review of the governance and tenure dimensions of coastal mangrove forests. 75 For a case study in Kenya see L. King, Notes From The Field: Including mangrove forests in REDD+ (CDKN 2012), at http://cdkn.org/wp-content/ uploads/2012/12/Notes-from-the-field-Lesley-King-1.pdf; for a case study in Colombia, see http://bioredd.org/projects/; for a feasibility study on REDD+ and the Japanese Joint Crediting Mechanism (JCM) see Japanese Ministry of Economy, Trade and Industry. 2015. Mangrove REDD+ Reduction of CO2 Emission and Enhancement of Carbon Fixation, at http://www.meti.go.jp/meti_lib/ report/2015fy/000139.pdf.76 For a case study on different countries with stronger and weaker results see Lee/Pistorius, op. cit.77 Malaysia states in its reference level submission that it includes both above-ground and below-ground biomass; however, the assessment team notes that emissions levels of soil organic carbon, among others, may be an “area for future technical improvement” and points to the development of a soil organic database under way in Malaysia, cf. UNFCCC: Report on the technical assessment of the proposed forest reference level of Malaysia submitted in 2014 (17 December 2015), para. 26.
21
Understanding Strategic Coastal Blue Carbon Opportunities in the Seas of East Asia
times arduous) responsibility of clarifying whether the REDD+ architecture permits bottom-up development projects in the first place. This said, various countries have started setting up structures for defining the scope of REDD+ projects and the mechanics of their “nesting” is also established under voluntary stan-dards.78 The efforts will simplify interventions for blue carbon developers, too.
Blue Carbon and NAMAs
National Appropriate Mitigation Actions (NAMAs) were first introduced under the Bali Action Plan as a vehicle for parties in developing countries to develop nationally specific mitigation actions. NAMAs have since evolved to support the implementation of the nationally determined country contributions (NDCs) in the framework of the Paris Agreement, as well as the 2030 Agenda for Sustainable Development (the UN SDGs) alongside national development strategies (see section IV). The land-use sector offers opportunities for NAMA engagement.79
NAMAs are climate change mitigation measures vol-untarily proposed by developing country governments to reduce emissions below business-as-usual levels and to contribute to domestic sustainable develop-ment. While the regulatory framework remains loose, NAMAs can take the form of regulations, standards, programs, policies or financial incentives.
Key categories any NAMA must address relate to governance (central coordination), mitigation output (measurable reduction of CO2eq. and/or CO2eq.
sequestration), coherence and impact within the country policy framework and its sustainability goals, planning and timing, as well as support (technological, capacity, financial, etc.) sought from domestic and/or international sources.
Donors also often point to the need for any NAMA to go beyond project-based approaches both in terms of quantity (mitigation output) and quality (underlying ambition of the host country), to help transform the country towards low-carbon development (trajectory impact), and to work towards long-term sustainable economies. The integration of public and private sector institutions is seen in this regard as a priority.80
While the main focus so far has been on NAMA scop-ing exercises and preparatory assessments, and while key donors, including the Green Climate Fund, are yet to establish a NAMA funding portfolio, a few initiatives and facilities, chiefly the “NAMA Facility”, founded by Germany and the UK and increasingly attracting other donors, have started implementing, and delivering on, NAMAs.
More than 170 NAMAs are under preparation or implementation worldwide. Some 16 NAMAs have received a funding commitment for full implemen-tation.81 Asia has been slower than other regions to embrace the NAMA concept, but has recently caught up. NAMAs under development in the land-use sector of PEMSEA partner countries include the “NAMA for the Sustainable Development of Peatland in Indonesia” (Indonesia);82 “Adaptation and Mitigation Activities in Philippine Rice Cultivation” (Philippines);83 and a
78 Pearson, T. et al. 2016. “Guidance Document: Options for Nesting REDD+ Projects.” (Fundación Natura Colombia 2016). http://www.v-c-s.org/wp-content/uploads/2016/07/Nesting-Options-1-Jul_Eng_final.pdf. Accessed 2016 December 18.79 FAO. 2015. “Learning Tool on Nationally Appropriate Mitigation Actions (NAMAs) in the agriculture, forestry and other land use (AFOLU) sector.” http://www.fao.org/3/a-i4642e.pdf. Accessed 2016 December 20.80 Bosquet, Michelle et al. 2016. “Status Report on Nationally Appropriate Mitigation Actions (NAMAs): Mid-Year Update Report 2016.” Edited by Charlotte Cuntz et al. https://www.international-climate-initiative.com/fileadmin/Dokumente/2016/NAMA-Status-Report- June-2016.pdf. Accessed 2016 December 20. 81 Ibid.82 FAO (2015), op. cit.83 NAMA. 2016. “Adaptation and mitigation initiatives in Philippine rice cultivation.” http://namanews.org/news/2015/03/05/climate-change- adaptation-oriented-nama-option-for-the-rice-sector-in-the-philippines/. Accessed 2017 January 25.
22
Understanding Strategic Coastal Blue Carbon Opportunities in the Seas of East Asia
“NAMA on Sustainable Charcoal Value-Chains in Cambodia” (Cambodia).84 Viet Nam is currently set-ting up a NAMA framework with a sub-window for LULUCF activities.85 In other parts of the world, the first blue carbon NAMAs are under development. The Dominican Republic has registered a NAMA on mangrove conservation and restoration (implementa-
tion ongoing).86 Ecuador is considering a “Mangrove Blue Services NAMA” that would combine the devel-opment of a science and knowledge infrastructure, the establishment of a programmatic roundtable in public-private partnership (inspired by, among others, the Roundtable for Palm Oil) and a community-based management scheme.
84 Association GERES. 2017. “NAMA on sustainable charcoal value-chains in Cambodia.” http://www.geres.eu/en/our-actions/item/481- nama-on-sustainable-charcoal-value-chains-in-cambodia. http://www.geres.eu/en/our-actions/item/481-nama-on-sustainable-charcoal- value-chains-in-cambodia. Accessed 2017 January 25.85 Nguyen Van Huy. [n.d.]. “Towards NAMA/MRV Readiness in Vietnam.” [presentation]. https://unfccc.int/files/focus/mitigation/application/pdf/ towards_nama_readiness_invietnam.pdf. Accessed 2017 January 25.86 Blue Carbon NAMA: Conserve and Restore Mangroves in the Dominican Republic, registered with the UNFCCC as a NAMA seeking international support, at http://www4.unfccc.int/sites/nama/_layouts/un/fccc/nama/NamaSeekingSupportForPreparation.aspx?ID=115&viewOnly=1.
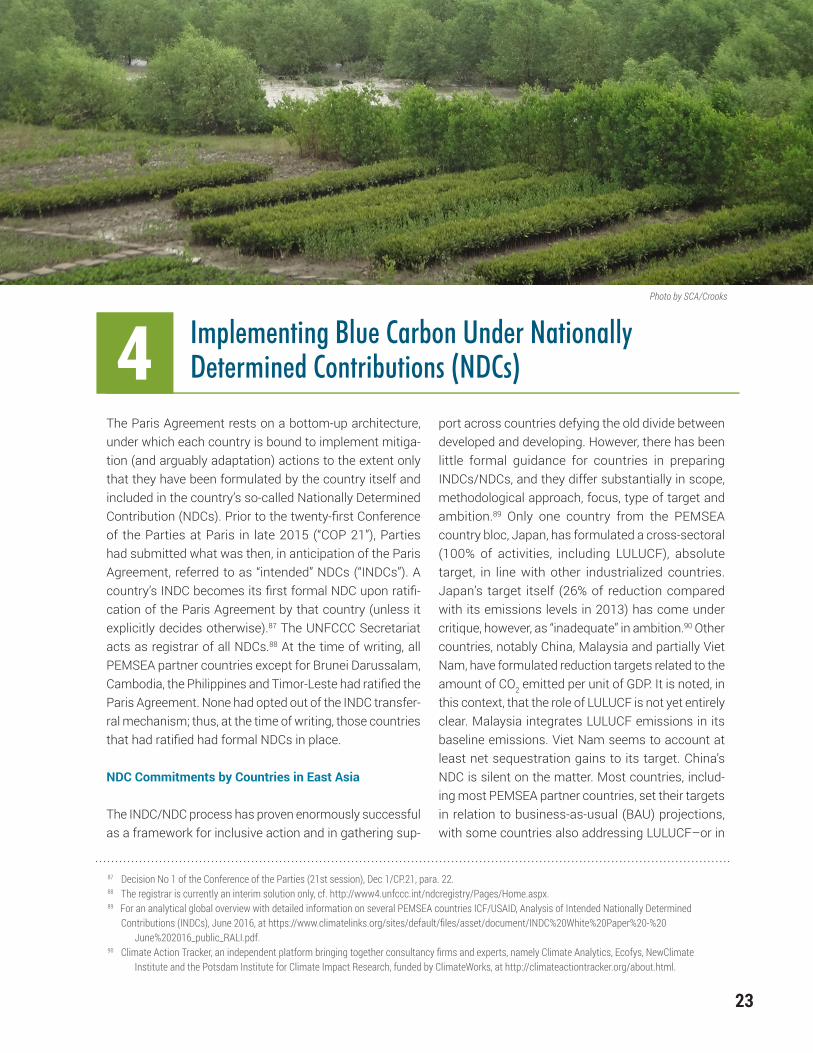
23
Understanding Strategic Coastal Blue Carbon Opportunities in the Seas of East Asia
The Paris Agreement rests on a bottom-up architecture, under which each country is bound to implement mitiga-tion (and arguably adaptation) actions to the extent only that they have been formulated by the country itself and included in the country’s so-called Nationally Determined Contribution (NDCs). Prior to the twenty-first Conference of the Parties at Paris in late 2015 (“COP 21”), Parties had submitted what was then, in anticipation of the Paris Agreement, referred to as “intended” NDCs (“INDCs”). A country’s INDC becomes its first formal NDC upon ratifi-cation of the Paris Agreement by that country (unless it explicitly decides otherwise).87 The UNFCCC Secretariat acts as registrar of all NDCs.88 At the time of writing, all PEMSEA partner countries except for Brunei Darussalam, Cambodia, the Philippines and Timor-Leste had ratified the Paris Agreement. None had opted out of the INDC transfer-ral mechanism; thus, at the time of writing, those countries that had ratified had formal NDCs in place.
NDC Commitments by Countries in East Asia
The INDC/NDC process has proven enormously successful as a framework for inclusive action and in gathering sup-
port across countries defying the old divide between developed and developing. However, there has been little formal guidance for countries in preparing INDCs/NDCs, and they differ substantially in scope, methodological approach, focus, type of target and ambition.89 Only one country from the PEMSEA country bloc, Japan, has formulated a cross-sectoral (100% of activities, including LULUCF), absolute target, in line with other industrialized countries. Japan’s target itself (26% of reduction compared with its emissions levels in 2013) has come under critique, however, as “inadequate” in ambition.90 Other countries, notably China, Malaysia and partially Viet Nam, have formulated reduction targets related to the amount of CO2 emitted per unit of GDP. It is noted, in this context, that the role of LULUCF is not yet entirely clear. Malaysia integrates LULUCF emissions in its baseline emissions. Viet Nam seems to account at least net sequestration gains to its target. China’s NDC is silent on the matter. Most countries, includ-ing most PEMSEA partner countries, set their targets in relation to business-as-usual (BAU) projections, with some countries also addressing LULUCF–or in
Implementing Blue Carbon Under Nationally Determined Contributions (NDCs)
87 Decision No 1 of the Conference of the Parties (21st session), Dec 1/CP.21, para. 22. 88 The registrar is currently an interim solution only, cf. http://www4.unfccc.int/ndcregistry/Pages/Home.aspx.89 For an analytical global overview with detailed information on several PEMSEA countries ICF/USAID, Analysis of Intended Nationally Determined Contributions (INDCs), June 2016, at https://www.climatelinks.org/sites/default/files/asset/document/INDC%20White%20Paper%20-%20 June%202016_public_RALI.pdf.90 Climate Action Tracker, an independent platform bringing together consultancy firms and experts, namely Climate Analytics, Ecofys, NewClimate Institute and the Potsdam Institute for Climate Impact Research, funded by ClimateWorks, at http://climateactiontracker.org/about.html.
4Photo by SCA/Crooks
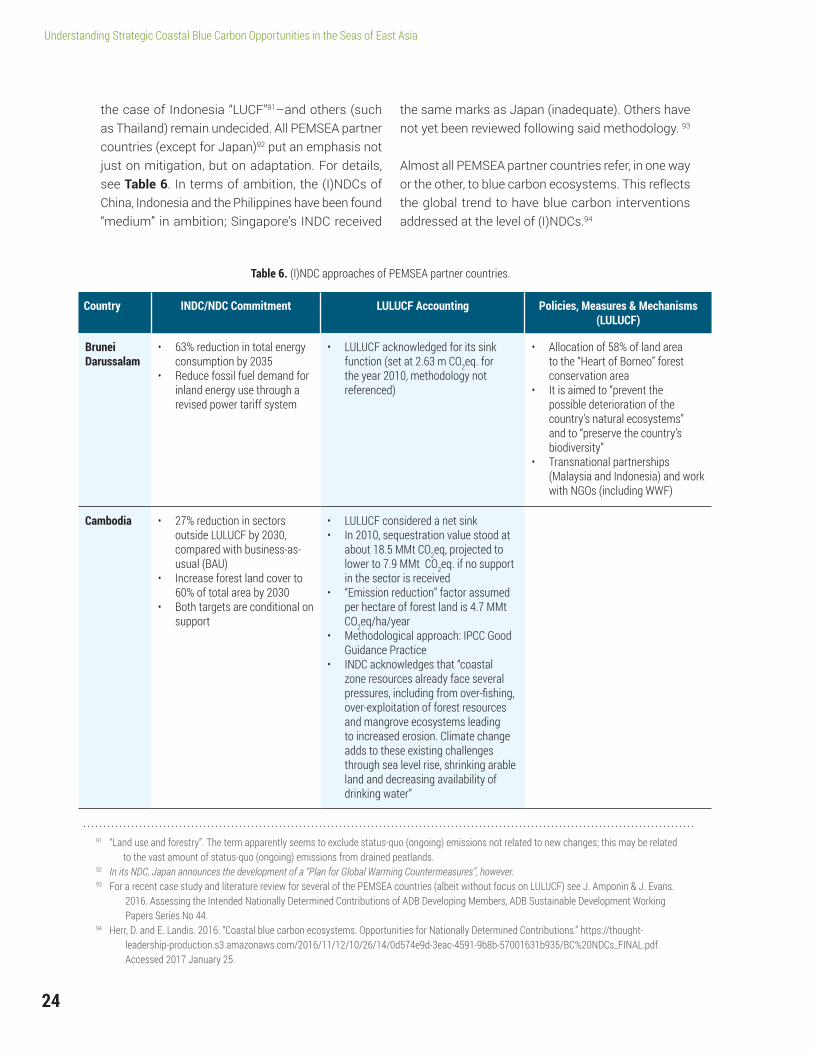
24
Understanding Strategic Coastal Blue Carbon Opportunities in the Seas of East Asia
the case of Indonesia “LUCF”91–and others (such as Thailand) remain undecided. All PEMSEA partner countries (except for Japan)92 put an emphasis not just on mitigation, but on adaptation. For details, see Table 6. In terms of ambition, the (I)NDCs of China, Indonesia and the Philippines have been found “medium” in ambition; Singapore’s INDC received
the same marks as Japan (inadequate). Others have not yet been reviewed following said methodology. 93
Almost all PEMSEA partner countries refer, in one way or the other, to blue carbon ecosystems. This reflects the global trend to have blue carbon interventions addressed at the level of (I)NDCs.94
Table 6. (I)NDC approaches of PEMSEA partner countries.
Country INDC/NDC Commitment LULUCF Accounting Policies, Measures & Mechanisms (LULUCF)
Brunei Darussalam
• 63% reduction in total energy consumption by 2035
• Reduce fossil fuel demand for inland energy use through a revised power tariff system
• LULUCF acknowledged for its sink function (set at 2.63 m CO2eq. for the year 2010, methodology not referenced)
• Allocation of 58% of land area to the “Heart of Borneo” forest conservation area
• It is aimed to “prevent the possible deterioration of the country’s natural ecosystems” and to “preserve the country’s biodiversity”
• Transnational partnerships (Malaysia and Indonesia) and work with NGOs (including WWF)
Cambodia • 27% reduction in sectors outside LULUCF by 2030, compared with business-as-usual (BAU)
• Increase forest land cover to 60% of total area by 2030
• Both targets are conditional on support
• LULUCF considered a net sink• In 2010, sequestration value stood at
about 18.5 MMt CO2eq, projected to lower to 7.9 MMt CO2eq. if no support in the sector is received
• “Emission reduction” factor assumed per hectare of forest land is 4.7 MMt CO2eq/ha/year
• Methodological approach: IPCC Good Guidance Practice
• INDC acknowledges that “coastal zone resources already face several pressures, including from over-fishing, over-exploitation of forest resources and mangrove ecosystems leading to increased erosion. Climate change adds to these existing challenges through sea level rise, shrinking arable land and decreasing availability of drinking water”
91 “Land use and forestry”. The term apparently seems to exclude status-quo (ongoing) emissions not related to new changes; this may be related to the vast amount of status-quo (ongoing) emissions from drained peatlands.92 In its NDC, Japan announces the development of a “Plan for Global Warming Countermeasures”, however.93 For a recent case study and literature review for several of the PEMSEA countries (albeit without focus on LULUCF) see J. Amponin & J. Evans. 2016. Assessing the Intended Nationally Determined Contributions of ADB Developing Members, ADB Sustainable Development Working Papers Series No 44.94 Herr, D. and E. Landis. 2016. “Coastal blue carbon ecosystems. Opportunities for Nationally Determined Contributions.” https://thought- leadership-production.s3.amazonaws.com/2016/11/12/10/26/14/0d574e9d-3eac-4591-9b8b-57001631b935/BC%20NDCs_FINAL.pdf. Accessed 2017 January 25.
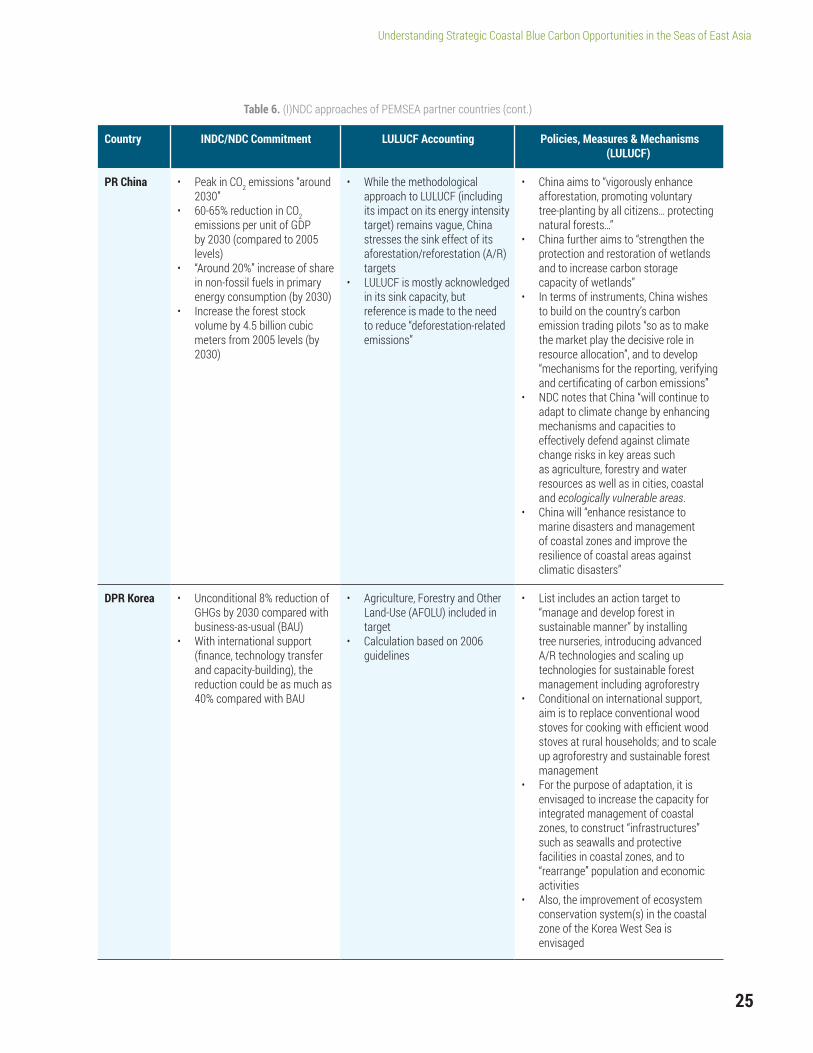
25
Understanding Strategic Coastal Blue Carbon Opportunities in the Seas of East Asia
Table 6. (I)NDC approaches of PEMSEA partner countries (cont.)
Country INDC/NDC Commitment LULUCF Accounting Policies, Measures & Mechanisms (LULUCF)
PR China • Peak in CO2 emissions “around 2030”
• 60-65% reduction in CO2 emissions per unit of GDP by 2030 (compared to 2005 levels)
• “Around 20%” increase of share in non-fossil fuels in primary energy consumption (by 2030)
• Increase the forest stock volume by 4.5 billion cubic meters from 2005 levels (by 2030)
• While the methodological approach to LULUCF (including its impact on its energy intensity target) remains vague, China stresses the sink effect of its aforestation/reforestation (A/R) targets
• LULUCF is mostly acknowledged in its sink capacity, but reference is made to the need to reduce “deforestation-related emissions”
• China aims to “vigorously enhance afforestation, promoting voluntary tree-planting by all citizens… protecting natural forests…”
• China further aims to “strengthen the protection and restoration of wetlands and to increase carbon storage capacity of wetlands”
• In terms of instruments, China wishes to build on the country’s carbon emission trading pilots “so as to make the market play the decisive role in resource allocation”, and to develop “mechanisms for the reporting, verifying and certificating of carbon emissions”
• NDC notes that China “will continue to adapt to climate change by enhancing mechanisms and capacities to effectively defend against climate change risks in key areas such as agriculture, forestry and water resources as well as in cities, coastal and ecologically vulnerable areas.
• China will “enhance resistance to marine disasters and management of coastal zones and improve the resilience of coastal areas against climatic disasters”
DPR Korea • Unconditional 8% reduction of GHGs by 2030 compared with business-as-usual (BAU)
• With international support (finance, technology transfer and capacity-building), the reduction could be as much as 40% compared with BAU
• Agriculture, Forestry and Other Land-Use (AFOLU) included in target
• Calculation based on 2006 guidelines
• List includes an action target to “manage and develop forest in sustainable manner” by installing tree nurseries, introducing advanced A/R technologies and scaling up technologies for sustainable forest management including agroforestry
• Conditional on international support, aim is to replace conventional wood stoves for cooking with efficient wood stoves at rural households; and to scale up agroforestry and sustainable forest management
• For the purpose of adaptation, it is envisaged to increase the capacity for integrated management of coastal zones, to construct “infrastructures” such as seawalls and protective facilities in coastal zones, and to “rearrange” population and economic activities
• Also, the improvement of ecosystem conservation system(s) in the coastal zone of the Korea West Sea is envisaged
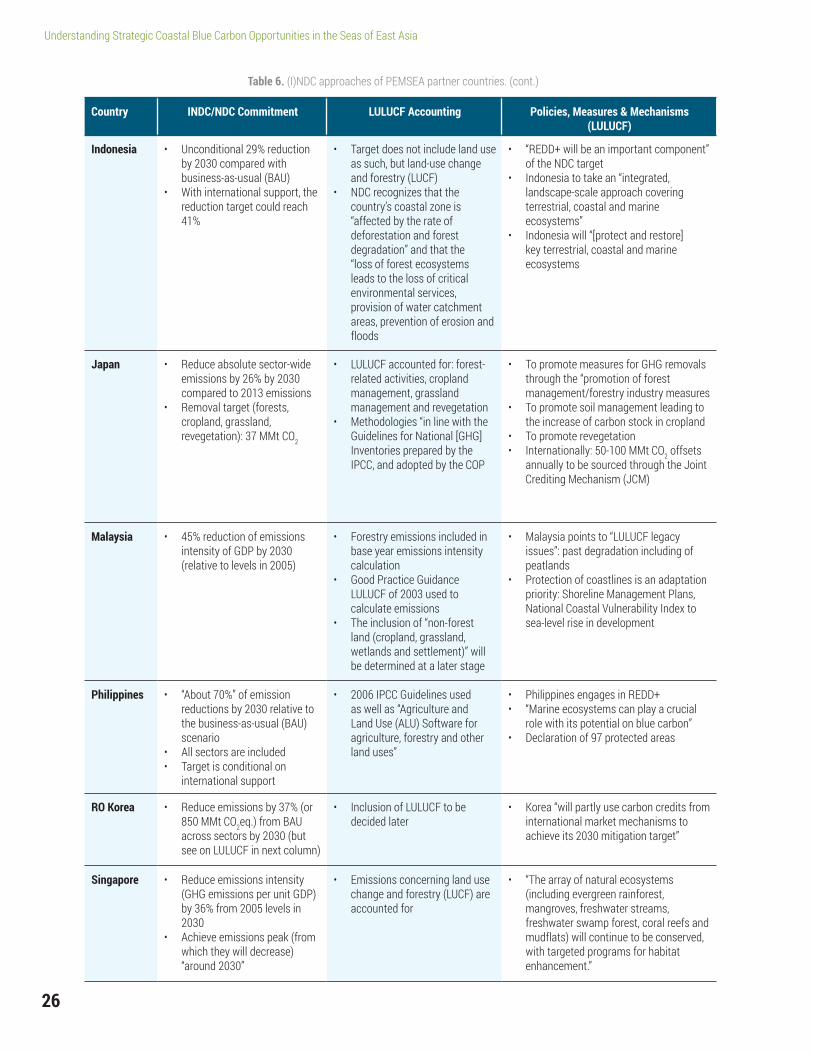
26
Understanding Strategic Coastal Blue Carbon Opportunities in the Seas of East Asia
Table 6. (I)NDC approaches of PEMSEA partner countries. (cont.)
Country INDC/NDC Commitment LULUCF Accounting Policies, Measures & Mechanisms (LULUCF)
Indonesia • Unconditional 29% reduction by 2030 compared with business-as-usual (BAU)
• With international support, the reduction target could reach 41%
• Target does not include land use as such, but land-use change and forestry (LUCF)
• NDC recognizes that the country’s coastal zone is “affected by the rate of deforestation and forest degradation” and that the “loss of forest ecosystems leads to the loss of critical environmental services, provision of water catchment areas, prevention of erosion and floods
• “REDD+ will be an important component” of the NDC target
• Indonesia to take an “integrated, landscape-scale approach covering terrestrial, coastal and marine ecosystems”
• Indonesia will “[protect and restore] key terrestrial, coastal and marine ecosystems
Japan • Reduce absolute sector-wide emissions by 26% by 2030 compared to 2013 emissions
• Removal target (forests, cropland, grassland, revegetation): 37 MMt CO2
• LULUCF accounted for: forest-related activities, cropland management, grassland management and revegetation
• Methodologies “in line with the Guidelines for National [GHG] Inventories prepared by the IPCC, and adopted by the COP
• To promote measures for GHG removals through the “promotion of forest management/forestry industry measures
• To promote soil management leading to the increase of carbon stock in cropland
• To promote revegetation• Internationally: 50-100 MMt CO2 offsets
annually to be sourced through the Joint Crediting Mechanism (JCM)
Malaysia • 45% reduction of emissions intensity of GDP by 2030 (relative to levels in 2005)
• Forestry emissions included in base year emissions intensity calculation
• Good Practice Guidance LULUCF of 2003 used to calculate emissions
• The inclusion of “non-forest land (cropland, grassland, wetlands and settlement)” will be determined at a later stage
• Malaysia points to “LULUCF legacy issues”: past degradation including of peatlands
• Protection of coastlines is an adaptation priority: Shoreline Management Plans, National Coastal Vulnerability Index to sea-level rise in development
Philippines • “About 70%” of emission reductions by 2030 relative to the business-as-usual (BAU) scenario
• All sectors are included• Target is conditional on
international support
• 2006 IPCC Guidelines used as well as “Agriculture and Land Use (ALU) Software for agriculture, forestry and other land uses”
• Philippines engages in REDD+• “Marine ecosystems can play a crucial
role with its potential on blue carbon”• Declaration of 97 protected areas
RO Korea • Reduce emissions by 37% (or 850 MMt CO2eq.) from BAU across sectors by 2030 (but see on LULUCF in next column)
• Inclusion of LULUCF to be decided later
• Korea “will partly use carbon credits from international market mechanisms to achieve its 2030 mitigation target”
Singapore • Reduce emissions intensity (GHG emissions per unit GDP) by 36% from 2005 levels in 2030
• Achieve emissions peak (from which they will decrease) “around 2030”
• Emissions concerning land use change and forestry (LUCF) are accounted for
• “The array of natural ecosystems (including evergreen rainforest, mangroves, freshwater streams, freshwater swamp forest, coral reefs and mudflats) will continue to be conserved, with targeted programs for habitat enhancement.”

27
Understanding Strategic Coastal Blue Carbon Opportunities in the Seas of East Asia
Table 6. (I)NDC approaches of PEMSEA partner countries. (cont.)
Country INDC/NDC Commitment LULUCF Accounting Policies, Measures & Mechanisms (LU-LUCF)
Thailand • Reduce, unconditionally, GHG emissions by 20% by 2030 compared with business-as-usual (BAU)
• With international support, this could be as much as 25%
• Economy-wide, but see LULUCF
• Inclusion of LULUCF to be decided later
• Acknowledges vulnerability to coastline flooding
• Climate change market mechanisms are encouraged
• Thailand considers REDD+ engagement• To increase national forest cover to 40%,
including “in particular, headwater and mangrove forests”
• To develop participatory, integrated marine conservation and coastal rehabilitation plan to protect marine ecosystems and enhance climate proofing infrastructure to strengthen coastal protection against erosion
Timor-Leste • No INDC/NDC submitted yet • The initial National Communication (NC) notes that the country holds “many coastal and marine resources including fish, seagrasses, seaweeds, coral reefs, mangrove forests and beaches…”
• Initial NC includes explicit inclusion of mangroves as forest (primary or secondary)
• Initial NC mentions 400 hectares of mangrove restoration on “swampy shrubland areas” as a “sink enhancement program”
• The list of “key adaptation actions” includes the “protection and rehabilitation of mangrove ecosystems in priority areas to protect economic, social and environmental assets against climate risks”
Viet Nam • Reduce, unconditionally, emissions across sectors by 8%, with the following breakdown Energy intensity per unit of
GDP to be reduced by 20% compared to 2010 levels
Forest cover will increase to the level of 45%
• Reduction will go up to 25% on the condition of international support (30% energy intensity)
• LULUCF covered, namely forest land, cropland, grassland, wetlands, settlements, other land
• IPCC Guidelines are mentioned in general terms
• REDD+• NAMAs• Market experience (CDM)• Use of new market mechanisms are
encouraged• Aims to “protect, restore, plant and
improve the quality of coastal forests, including mangroves, especially in costal estuaries and the Mekong and Red River deltas”
• Plans to increase the area of protection forest in coastal areas to 380,000 hectares, including 20,000 – 50,000 ha of additional mangrove planting
• To implement integrated coastal zone management
• To use sea level rise scenarios in urban and land use planning for infrastructure, industrial parks, coastal and island resettlement areas
• To implement anti-inundation measures for large coastal cities
• To protect the coastline and riverbanks

28
Understanding Strategic Coastal Blue Carbon Opportunities in the Seas of East Asia
Moving Forward Under NDCs in the Region
The Paris Agreement foresees various mechanisms for the implementation and gradual strengthening of country NDCs. At the GHG inventory level, procedures have been set in place to improve, over time, both the completeness and the accurateness of the data.95 Given the recent publication of the IPCC Wetland Supplement,96 it should be possible to cover coastal wetland related removals and emissions within the territorial waters of countries.97 The institution-alization of revision cycles for biennial reports (by industrialized countries) and biennial update reports (by developing countries) will further strengthen the reporting standards (if not in itself the quality of the data).
Other than improving completeness and accuracy, countries are under an obligation to strengthen their mitigation commitments over time. The Paris Agreement includes a dynamic mechanism to that effect (also referred to as the “Ratchet Mechanism”) that triggers procedural milestones to assess and improve a country’s mitigation ambition over time.98 Each Party must prepare, communicate and maintain successive NDCs (Art. 14.2 Paris Agreement). Every five years, countries must update their NDC (Art. 4.9). Each time, the update needs to represent “a progres-
sion beyond the Party’s then current nationally determined contribution” (Art. 4.3), and it needs to consider the five-yearly “global stocktake” exercise (the first to happen in 2023), mandated under Article 14 as an assessment of ”the collective progress towards achieving the purpose of this Agreement and its long-term goals” (ibid.) Note that while countries determine their NDC individually, with-out assuming a legal obligation or liability vis-à-vis the result, they do have an obligation to pursue mitigation actions with the “aim of achieving the objectives” of their NDCs (Art. 4.2).
Countries do not have to do it alone. Rather, the Paris Agreement sets incentives for bilateral and multilateral cooperation, including through emissions trading. The point of departure is what is called “voluntary coopera-tion” of countries to allow for higher mitigation and adaptation ambition and the promotion of “sustainable development and environmental integrity” (Art. 6.1). Article 6 includes three cooperation formats:99
• Cooperative Approaches. Parties may engage in “voluntary cooperation” (Art. 6.1) and “cooperative approaches”, using ”internationally transferred mitiga-tion outcomes” (Art. 6.2), a terminology that is broad enough to allow for different types of trades. It is noted that trades can cover all sectors, including sequestration (removals by sink).100
95 The Paris Agreement and the decision accompanying it (the Paris Decision) lay out several provisions, including: Parties must provide their NDCs with ‘necessary’ levels of ‘clarity, transparency and understanding’ (Paris Decision, para. 13) in accordance with what has been decided under the Paris Decision and what will be decided by the CPA. Furthermore, all Parties shall account for their actions and results achieved in ‘implementing the NDCs (Art. 4.13 Paris Agreement). In accounting for emissions and removals ‘corresponding to’ their NDCs, Parties shall ‘promote environmental integrity, transparency, accuracy, completeness, comparability and consistency, and ensure the avoidance of double-counting’, in accordance with guidance to be adopted (ibid).96 Hiraishi, Takahiko, et al. 2014. 2013 supplement to the 2006 IPCC guidelines for national greenhouse gas inventories: Wetlands.97 Ibid. (op. cit.), Cross-Cutting Issues and Reporting: “Coastal wetlands can occur in any of the six IPCC land-use categories but also in coastal
areas that are not part of the total land area of the country. For example, a mangrove wetland with trees may be classified as Forest Land, a tidal marsh used for grazing may be classified as Grassland, and a seagrass meadow used for aquaculture may be classified as Settlements. Emissions/removals from coastal wetlands that are not part of the total land area (e.g. seagrass meadows) should be reported separately and the associated areas excluded from the total land area and from the land-use example, forest management activities in mangroves classified as Forest Land may need to be split between areas included in the total land area and not included in the total land area. In reporting the emissions/removals from mangrove forest management activities, emissions/removals from both areas would be reported under Forest Land, but only the land areas of the mangroves included in the total land area would be included in the total Forest Land areas and reported in the land area matrix. The classifications of coastal wetlands are country-specific, but in all cases appropriate subcategories should be used in the reporting to reflect the specific land use and management as well as to indicate whether the emissions come from areas included or excluded from the total land area of the country….”
98 For details see C. Streck et al. 2016. The Paris Agreement: A Beginning. Journal for European Environmental & Planning Law, 133-29.99 For details see Streck et al. (op. cit.).100 Paris Decision, para 37.
29
Understanding Strategic Coastal Blue Carbon Opportunities in the Seas of East Asia
101 Paris Decision, para 37 and 38 (the latter provision involving SBSTA).102 UNFCCC Secretariat. “Non-market based approaches: Technical Paper, FCCC/TP/2014/10, 24 November 2014.” http://unfccc.int/resource/docs/2014/tp/10.pdf. Accessed 2017 February 22.103 UNFCCC. [n.d.]. “Subsidiary Body for Scientific and Technological Advice (SBSTA).” http://unfccc.int/bodies/body/6399.php. Accessed 2017 February 23.104 Paris Decision, paras 40 and 41.
• Sustainable Development Mechanism (name still to be formally adopted). Based on a last-minute inter-vention by several countries, the Paris Agreement defines a mechanism that allows private and public entities to support mitigation projects that generate transferrable GHG emissions (Art. 6.4). Programs and projects–the Paris Agreement avoids using either term–developed under this new mechanism can generate “emission reductions” that may be used by another Party to ”fulfill” its NDC. The mechanism is implemented under the “authority and guidance” of the main institutional body of the Paris Agreement, which, according to the Paris Decision, is intended to develop relevant “modalities and procedures.”101 The provision in the Paris Decision links back to the mechanisms of the Kyoto Protocol, namely the CDM, when requesting that the new mechanism be built on their experience (para 38.f). Similar to the CDM, the mechanism addresses subnational public and private entities, and it foresees a “share of proceeds” to cover both administrative costs and adaptation needs for nations most vulnerable to climate change (Article 6.6). This opens a future for the Adaptation Fund, created under the Kyoto Protocol. However, unlike the CDM, the new mecha-nism appears open to all sectors, including blue carbon. The main threshold is that it must “deliver an overall mitigation in global emissions” (Art. 6.4.d), that is, it must go beyond offsetting and have a net positive mitigation effect. Also, emission reductions may be accounted for only once in the context of
NDCs, either by the host Party or by another Party (Article 6.5).
• Framework for non-market approaches. The Paris Agreement recognizes ”the importance of integrated, holistic and balanced non-market approaches” (Art. 6.8) to assist Parties with implementing their NDCs, in the context of sustainable development and poverty eradication. It aims at both mitiga-tion and adaptation, “enhance[s] public and private sector participation” and seeks opportunities for coordination “across instruments and relevant insti-tutional arrangements.” The conceptual scope and meaning of non-market approaches, as opposed to instruments seen as (if no longer called) market mechanisms and for which we find precedence in the Kyoto mechanisms, is hard to gauge. In a technical paper from 2014, the UNFCCC secretar-iat summarized non-market approaches as “any actions that drive cost-effective mitigation without relying on market-based approaches or mechanisms (i.e. without resulting in transferable or tradable units).”102 The technical paper listed as examples, from country experience, fiscal instruments (such as carbon taxes) and regulation, but also voluntary agreements on mitigation action and results-based payments for REDD+. The concept, in this interpre-tation, is very wide, and there will be much work ahead for SBSTA,103 which is charged with pre-paring a draft work programme until next year’s session.104

30
Understanding Strategic Coastal Blue Carbon Opportunities in the Seas of East Asia
Policy Opportunities for PEMSEA Partner Countries
While all PEMSEA partner countries in their emerg-ing climate change architecture put some emphasis on LULUCF and the importance of forests generally, there are substantial differences in the approach to blue carbon ecosystems and the readiness to engage in both adaptation and mitigation mechanisms.
Cambodia, China, Japan and Viet Nam formulate for-est-sector related targets, while five other countries (DPR Korea, Indonesia, Malaysia, the Philippines and Singapore) include LULUCF emissions or LUCF emis-sions (excluding emissions from unchanged land use) as part of their cross-sectoral targets. RO Korea and Thailand will decide on the inclusion of LULUCF in their NDCs at a later stage.
The importance of conserving and/or restoring natu-ral ecosystems–often specifically referring to coastal ecosystems and mangroves–is highlighted in all (I)NDCs from the region. While the policy perspec-tive is mostly one of adaptation, several PEMSEA countries make specific reference to forest mitigation activities, in the form of REDD+ (Cambodia, Indonesia, the Philippines, Thailand) or other interventions, namely afforestation, reforestation or restoration (Viet Nam and Timor-Leste).105
Several PEMSEA countries have been strong per-formers in early emissions trading (especially China and Viet Nam, but also Thailand, the Philippines and Japan), and several of them have established emis-sions trading schemes of their own (China, RO Korea and Japan) or contemplate some form of trading (Thailand). The Philippines explicitly mentions the “blue carbon” potential, and Viet Nam states its strong
interest in developing future market mechanisms, while highlighting the need to protect, restore and improve coastal forests. Both Japan and RO Korea indicate that they may invest in forest carbon emissions projects or programs to offset parts of their national emissions.
Overall, the analysis points to several blue carbon policy and finance opportunities for PEMSEA partner countries:
1. As climate finance support for recipient countries is increasingly guided and shaped by the countries’ NDCs, the fact that coastal ecosystems are featured prominently makes blue carbon interventions a clear finance priority.
2. A range of international climate finance programs–from the Green Climate Fund to programs of international finance institutions to the multi-donor NAMA Facility to single donor platforms–require official vetting by the recipient country government before an intervention is approved.106 An NDC refer-ence facilitates official vetting, just as the failure to be mentioned in a country’s NDC lowers the odds for an intervention type to be approved.
3. Some NDCs are drafted in a way that highlights linkages and interconnectivities between mitiga-tion efforts, adaptation efforts and cross-sectoral approaches, such as coastal planning. Viet Nam, for instance, spelled out what can be seen as a detailed roadmap for cross-sectoral engagement. The text commits to “protect, restore, plant and improve the quality of coastal forests, including mangroves, especially in coastal estuaries and the Mekong and Red River deltas”. Viet Nam plans to increase the protection of forest in coastal areas to 380,000 ha, including 20,000–50,000 ha of additional mangrove
105 Information gathered from the initial NC.106 For an overview of climate finance programs and funding platforms see www.ndcpartnership.org.

31
Understanding Strategic Coastal Blue Carbon Opportunities in the Seas of East Asia
planting; implement integrated coastal zone man-agement; and it proclaims to work with sea level rise scenarios in urban and land use planning for infrastructure, industrial parks and coastal and island resettlement areas, to implement anti-inundation measures for large coastal cities and generally to protect the coastline and riverbanks. Such cross-cut-ting methodology makes NDCs powerful documents to inspire projects and programs and to secure their comprehensive design.107
4. Blue carbon interventions, whether included in all-country REDD+ implementation or carried forward in the form of projects, are driven by local commu-nities, and above all, they involve the improvement of natural environments and livelihoods alike. This makes them strong contenders for any climate funds offered and creates additional value on voluntary carbon markets.
5. Several PEMSEA countries are particularly open to carbon crediting mechanisms–the Philippines and Viet Nam on the side of beneficiaries, and Japan and potentially RO Korea on the side of investor coun-tries. While new mechanisms are still in the design phase, countries have been given a green light to engage bilaterally in transactions, and the group of PEMSEA countries, with PEMSEA, CI and TNC per-haps providing the institutional framework (see next point), are well positioned to take the lead. Japan already has experience with bilateral REDD+ projects, so the design of a dedicated blue carbon project or program would not need to start from scratch.
6. PEMSEA, CI, TNC, the Blue Carbon Initiative and other similar organizations are in the unique position to
advise PEMSEA countries on potential interven-tion formats, to collect and streamline country initiatives and cross-country experience and to operate as focal point and functional interface for regional initiatives. The Partnership for Blue Carbon, supported by the Australian govern-ment, is another potentially important partner in such an activity. This role could extend to the facilitation of bilateral and multilateral initiatives under Article 6.2 of the Paris Agreement: between potential beneficiary and investor countries, but also with a view of developing a “Regional Blue Carbon Facility”, which could ultimately act as a trading platform and clearinghouse among PEMSEA country partners and other countries seeking to engage in blue carbon initiatives in the region.
Difficulties remain: as highlighted in this report, carbon stock, emissions and removals data for blue carbon ecosystems remains incomplete. Guidelines for inventories, monitoring, accounting, etc. are not readily available. And relevant blue carbon eco-systems, notably seagrasses, remain outside any reporting, accounting or NDC framework.
However, this is likely to change, and the new set of NDCs is likely to address blue carbon ecosys-tems with more precision and comprehensive rigor. Regional and global organizations and initiatives, such as PEMSEA, the Blue Carbon Initiative, the Partnership for Blue Carbon and others, can help to facilitate further change.
Table 7 highlights potential priority areas of engage-ment for PEMSEA partner countries.
107 For an example see UNDP’s project for Viet Nam (“Improving the resilience of vulnerable coastal communities to climate change related impacts in Viet Nam”), which includes mitigation and adaptation and urban planning activities.
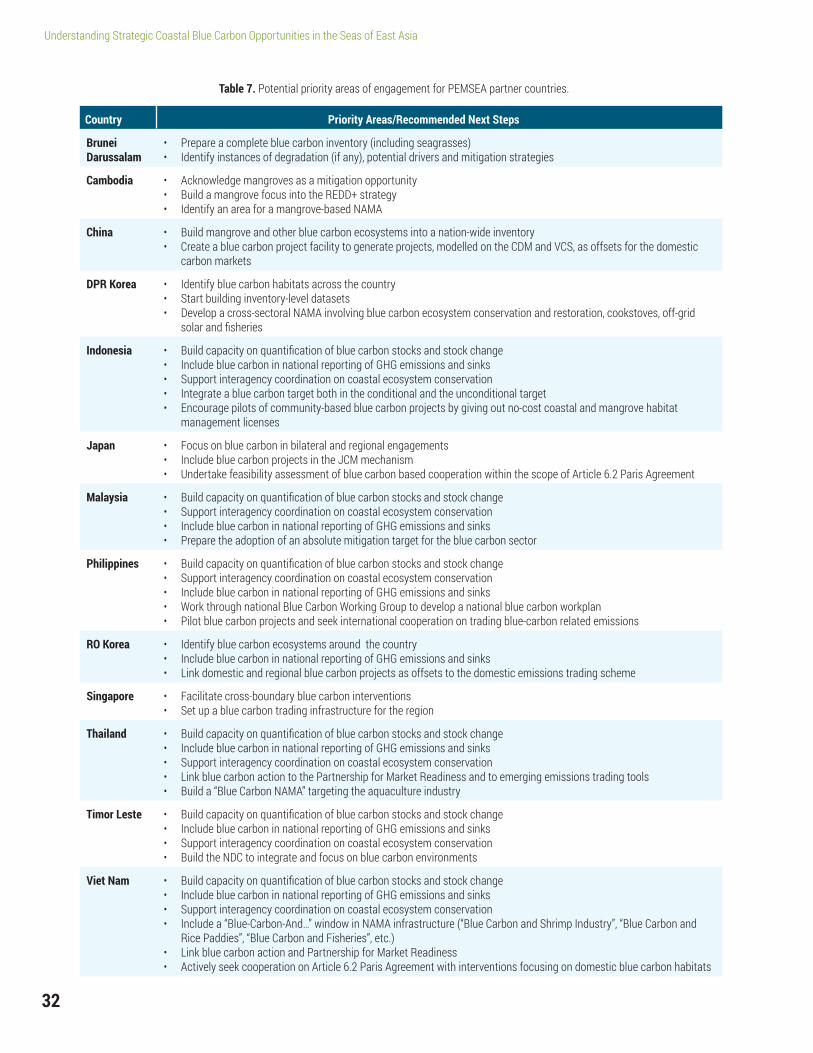
32
Understanding Strategic Coastal Blue Carbon Opportunities in the Seas of East Asia
Table 7. Potential priority areas of engagement for PEMSEA partner countries.
Country Priority Areas/Recommended Next Steps
Brunei Darussalam
• Prepare a complete blue carbon inventory (including seagrasses)• Identify instances of degradation (if any), potential drivers and mitigation strategies
Cambodia • Acknowledge mangroves as a mitigation opportunity• Build a mangrove focus into the REDD+ strategy• Identify an area for a mangrove-based NAMA
China • Build mangrove and other blue carbon ecosystems into a nation-wide inventory• Create a blue carbon project facility to generate projects, modelled on the CDM and VCS, as offsets for the domestic
carbon markets
DPR Korea • Identify blue carbon habitats across the country• Start building inventory-level datasets• Develop a cross-sectoral NAMA involving blue carbon ecosystem conservation and restoration, cookstoves, off-grid
solar and fisheries
Indonesia • Build capacity on quantification of blue carbon stocks and stock change• Include blue carbon in national reporting of GHG emissions and sinks• Support interagency coordination on coastal ecosystem conservation• Integrate a blue carbon target both in the conditional and the unconditional target• Encourage pilots of community-based blue carbon projects by giving out no-cost coastal and mangrove habitat
management licenses
Japan • Focus on blue carbon in bilateral and regional engagements• Include blue carbon projects in the JCM mechanism• Undertake feasibility assessment of blue carbon based cooperation within the scope of Article 6.2 Paris Agreement
Malaysia • Build capacity on quantification of blue carbon stocks and stock change• Support interagency coordination on coastal ecosystem conservation• Include blue carbon in national reporting of GHG emissions and sinks • Prepare the adoption of an absolute mitigation target for the blue carbon sector
Philippines • Build capacity on quantification of blue carbon stocks and stock change• Support interagency coordination on coastal ecosystem conservation• Include blue carbon in national reporting of GHG emissions and sinks• Work through national Blue Carbon Working Group to develop a national blue carbon workplan• Pilot blue carbon projects and seek international cooperation on trading blue-carbon related emissions
RO Korea • Identify blue carbon ecosystems around the country• Include blue carbon in national reporting of GHG emissions and sinks• Link domestic and regional blue carbon projects as offsets to the domestic emissions trading scheme
Singapore • Facilitate cross-boundary blue carbon interventions• Set up a blue carbon trading infrastructure for the region
Thailand • Build capacity on quantification of blue carbon stocks and stock change• Include blue carbon in national reporting of GHG emissions and sinks• Support interagency coordination on coastal ecosystem conservation• Link blue carbon action to the Partnership for Market Readiness and to emerging emissions trading tools• Build a “Blue Carbon NAMA” targeting the aquaculture industry
Timor Leste • Build capacity on quantification of blue carbon stocks and stock change• Include blue carbon in national reporting of GHG emissions and sinks• Support interagency coordination on coastal ecosystem conservation• Build the NDC to integrate and focus on blue carbon environments
Viet Nam • Build capacity on quantification of blue carbon stocks and stock change• Include blue carbon in national reporting of GHG emissions and sinks• Support interagency coordination on coastal ecosystem conservation• Include a “Blue-Carbon-And…” window in NAMA infrastructure (“Blue Carbon and Shrimp Industry”, “Blue Carbon and
Rice Paddies”, “Blue Carbon and Fisheries”, etc.)• Link blue carbon action and Partnership for Market Readiness• Actively seek cooperation on Article 6.2 Paris Agreement with interventions focusing on domestic blue carbon habitats
33
Understanding Strategic Coastal Blue Carbon Opportunities in the Seas of East Asia
Linking Climate Finance and Blue Carbon Investment
The various NAMA initiatives point to an emerging pattern of blue-carbon related investments linking conservation and restoration aims–climate change mitigation and adaptation goals–with activities that promise a return-on-investment. These activities may be related to coastal-based commodities such as fisheries, aquaculture and ocean-based energy, or services such as habitat resilience and flood pre-vention (thus, flood insurance schemes), tourism or emissions trading and biodiversity compensation schemes. Or they involve measures with an indirect effect on habitats (e.g., energy-efficient cookstoves that lower the pressure on coastal timber or off-grid energy production, which adds economic opportuni-ties and may reduce pressure on land).
Other than seeking dual benefits (i.e., conservation and economic opportunities), this coupling presents an important opportunity to attract private capital in an environment that historically was funded almost exclusively by public donors (aid and development) or philanthropists. Natural capital investments are on the rise, with the international climate change architecture acting as an important catalyst. Blue carbon inventories and monitoring systems have become highly regarded proxies for ecosystem evaluation, facilitated by deployment of state-of-the-art technology to track land use change across landscapes (e.g. satellite-based). REDD+ strategy development land tenure assessments provide blueprints for due diligence assessments for land development at large. Public climate finance sources offer senior debt and mezzanine instruments108 to allow on-lending by local financial institutions in the agriculture or fisheries sector, and climate micro-finance supported by public climate finance has become an industry in its own right.
Focused blue carbon engagement allows the PEMSEA countries to bundle scientific, technical, legal and finan-cial actions using existing knowledge facilities, financial support systems and practical blueprints. To be sure, the climate architecture under the Paris Agreement does not offer an automated system of capacity-develop-ment, strategic advice and finance. Rather, true to the methodological paradigm of bottom-up action, it falls to countries and their individual ambition to build their climate change intervention portfolio.
For a pro-active government, the blue carbon environ-ment holds considerable momentum. Table 8 lists several public funds that could directly finance conser-vation and restoration activities in mangroves and other blue carbon ecosystems. Beyond these public funds, however, there is a range of knowledge and funding tools that could be used to enhance and invest in a country’s natural capital. The Climate Risk Early Warning System (CREWS), for instance, embedded in the Global Facility for Disaster Reduction and Recovery (GFDRR), aims at approving meteorological warning systems. A country may apply to this program and link the supported mea-sure to the development of a mangrove-based weather protection response system. If it also traces human-induced carbon fluctuations, it can add a carbon crediting component.
Similar cross-sectoral combinations are possible at the project level. A marine protected area, for instance, that promotes healthy mangrove forests as a means to improve fisheries, should consider developing a carbon project to achieve co-funding. At a higher national or regional level, again, these efforts can be helped by offering crediting mechanisms (REDD+ implementation, say, or a dedicated blue carbon regional mechanism) to project developers, and by setting up institutional struc-tures (such as Roundtables) that help influence drivers of deforestation beyond the reach of the project level (e.g., supply chains).
108 A hybrid of debt and equity financing that gives the lender the rights to convert to an ownership or equity interest in the company in case of default, after venture capital companies and other senior lenders are paid.

34
Understanding Strategic Coastal Blue Carbon Opportunities in the Seas of East Asia
Table 8. Public Climate Funds and Facilities Available for PEMSEA Countries (REDD+ and Blue Carbon Focus) – Examples (bilateral and multilateral)109
Fund Governance Special Focus
Adaptation Fund Adaptation Fund Board (administered by World Bank)
Adaptation
BioCarbon Fund World Bank Sustainable Forest Landscapes
Forest Carbon Partnership Facility World Bank Participating PEMSEA countries:• Cambodia• Indonesia• Thailand• Viet Nam
Forest Investment Program (Strategic Climate Fund)
World Bank (with, among others, Asian Development Bank)
REDD+ support
Global Environment Facility Trust Fund Global Environment Facility Adaptation, Mitigation
Global Climate Change Alliance European Commission • Focus on Least Developed Countries (LDCs) and Small Island States (SIDS)
• Seeks to enhance regional partnerships, in Asia currently the Mekong River Commission
Green Climate Fund Green Climate Fund Board • Mitigation, Adaptation, REDD+
Global Facility for Disaster Reduction and Recovery
World Bank • Supports risk management projects
Global Resilience Partnership Rockefeller Foundation, USAID, Sida • One of three focus regions is South and South East Asia
International Climate Initiative Germany • Mitigation, Adaptation, REDD
International Forest Carbon Initiative Australia • Currently supports Indonesia
International Forest Climate Initiative Norway • Indonesia is currently funded under the initiative
Joint Crediting Mechanism Japan Currently operates in 16 countries, among them:• Cambodia• Indonesia• Thailand• Philippines• Viet Nam
Least Developed Country Fund World Bank • Cambodia• Timor-Leste
NAMA Facility Germany, UK • Innovative climate finance approaches
Pilot Program for Climate Resilience (Strategic Climate Fund)
World Bank Currently funded:• Cambodia• Philippines
Special Climate Change Fund GEF • Adaptation and Technology Transfer
UN REDD UNDP-FAO • REDD+ readiness
109 Excludes Japan and for most purposes the Republic of Korea.
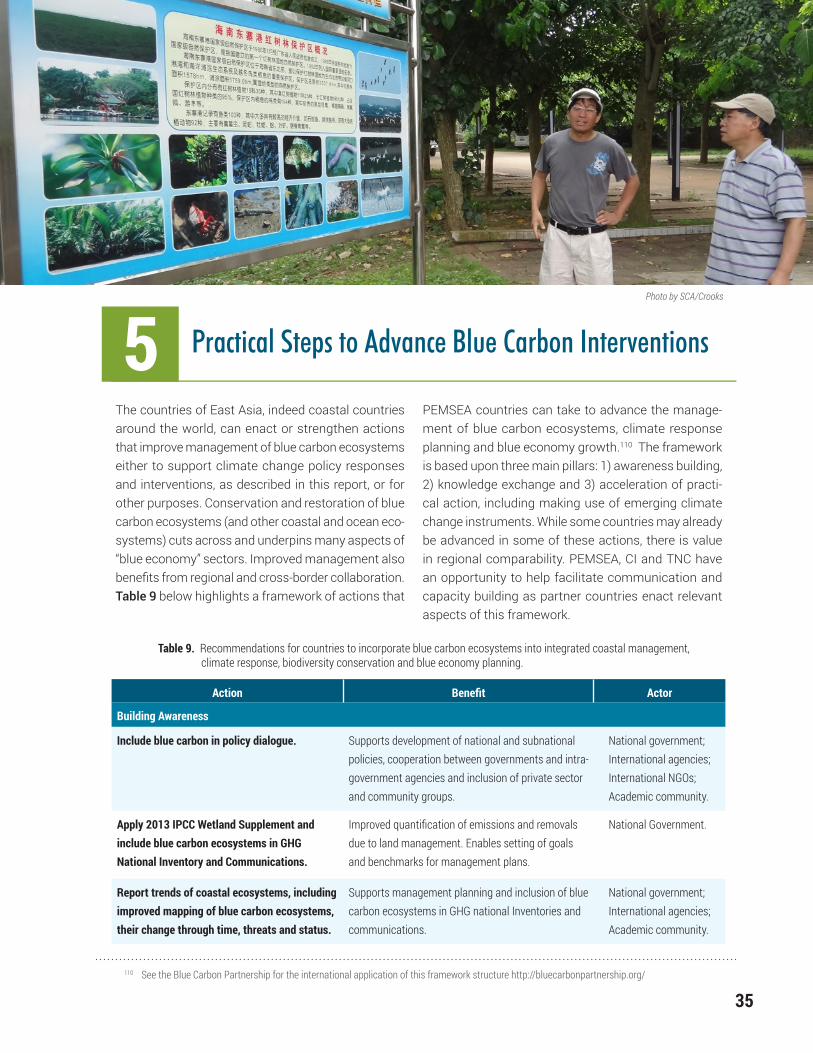
35
Understanding Strategic Coastal Blue Carbon Opportunities in the Seas of East Asia
Table 9. Recommendations for countries to incorporate blue carbon ecosystems into integrated coastal management, climate response, biodiversity conservation and blue economy planning.
Action Benefit Actor
Building Awareness
Include blue carbon in policy dialogue. Supports development of national and subnational policies, cooperation between governments and intra-government agencies and inclusion of private sector and community groups.
National government;International agencies; International NGOs; Academic community.
Apply 2013 IPCC Wetland Supplement and include blue carbon ecosystems in GHG National Inventory and Communications.
Improved quantification of emissions and removals due to land management. Enables setting of goals and benchmarks for management plans.
National Government.
Report trends of coastal ecosystems, including improved mapping of blue carbon ecosystems, their change through time, threats and status.
Supports management planning and inclusion of blue carbon ecosystems in GHG national Inventories and communications.
National government;International agencies;Academic community.
110 See the Blue Carbon Partnership for the international application of this framework structure http://bluecarbonpartnership.org/
The countries of East Asia, indeed coastal countries around the world, can enact or strengthen actions that improve management of blue carbon ecosystems either to support climate change policy responses and interventions, as described in this report, or for other purposes. Conservation and restoration of blue carbon ecosystems (and other coastal and ocean eco-systems) cuts across and underpins many aspects of “blue economy” sectors. Improved management also benefits from regional and cross-border collaboration. Table 9 below highlights a framework of actions that
PEMSEA countries can take to advance the manage-ment of blue carbon ecosystems, climate response planning and blue economy growth.110 The framework is based upon three main pillars: 1) awareness building, 2) knowledge exchange and 3) acceleration of practi-cal action, including making use of emerging climate change instruments. While some countries may already be advanced in some of these actions, there is value in regional comparability. PEMSEA, CI and TNC have an opportunity to help facilitate communication and capacity building as partner countries enact relevant aspects of this framework.
Practical Steps to Advance Blue Carbon Interventions5Photo by SCA/Crooks

36
Understanding Strategic Coastal Blue Carbon Opportunities in the Seas of East Asia
Table 9. Recommendations for countries to incorporate blue carbon ecosystems into integrated coastal management, climate response, biodiversity conservation and blue economy planning. (cont.)
Action Benefit Actor
Facilitate Knowledge Exchange
Join networks such as the International Partnership for Blue Carbon111 and the International Blue Carbon Initiative.112
Bring together key organizations to coordinate international activities.
National government; International NGOs, Academic Community.
Facilitate / contribute to technical and policy workshops (e.g., The Blue Carbon Initiative).113
Enable communication between technical experts and shared science, policy and implementation experience.
National government; International NGOs; Private sector; Academic community.
Support science programs and technical analysis.
Improved quantification of blue carbon benefits and understanding of intervention opportunities.
National government; International NGOs; Private sector; Academic community.
Develop knowledge products and demonstration activities, e.g., activities under GEF Blue Forest Project114 and by Restore America’s Estuaries.115
Demonstration and communication of experience and good practice to support mainstreaming and upscaling of blue carbon interventions.
National government; International NGOs; Private sector; Academic community.
Accelerate Practical Action
Investigate appropriate policy frameworks for including blue carbon ecosystems within national commitments to the Paris Agreement.
Including blue carbon ecosystems within NDCs and related plans provides guidance to coastal planners and assists in securing international funding for climate adaptation and mitigation.
National government.
Include management of blue carbon ecosystems within integrated coastal management plans.
Integrated coastal management plans help to steer on-the-ground climate response and blue economy development. Including the status of, and goals of for, blue carbon ecosystems can provide a foundation for broader coastal management.
National and local government.
Assess and promote national opportunities for conservation and restoration of blue carbon ecosystems, including quantification of GHG benefits.
Blue carbon ecosystems are being lost across East Asia at a high rate. Reversing these losses support components of NDCs, the UN SDGs and blue economy growth.
National and local government.
Provide training and technical support to local and national government agencies, field schools and communities on the value of blue carbon ecosystems and good practice for conservation and restoration.
Experience in restoring blue carbon ecosystems exists, but success rates are still relatively low. Training and improved planning can support more successful delivery.
International development organizations; National government; International NGOs; Private sector.
111 International Partnership for Blue Carbon. 2017. http://bluecarbonpartnership.org/.112 Ibid.113 Ibid.114 GEF Blue Forests. 2016. http://www.gefblueforests.org/.115 Restore America’s Estuaries. 2016. “Blue Carbon Resources.” https://www.estuaries.org/bluecarbon-resources.
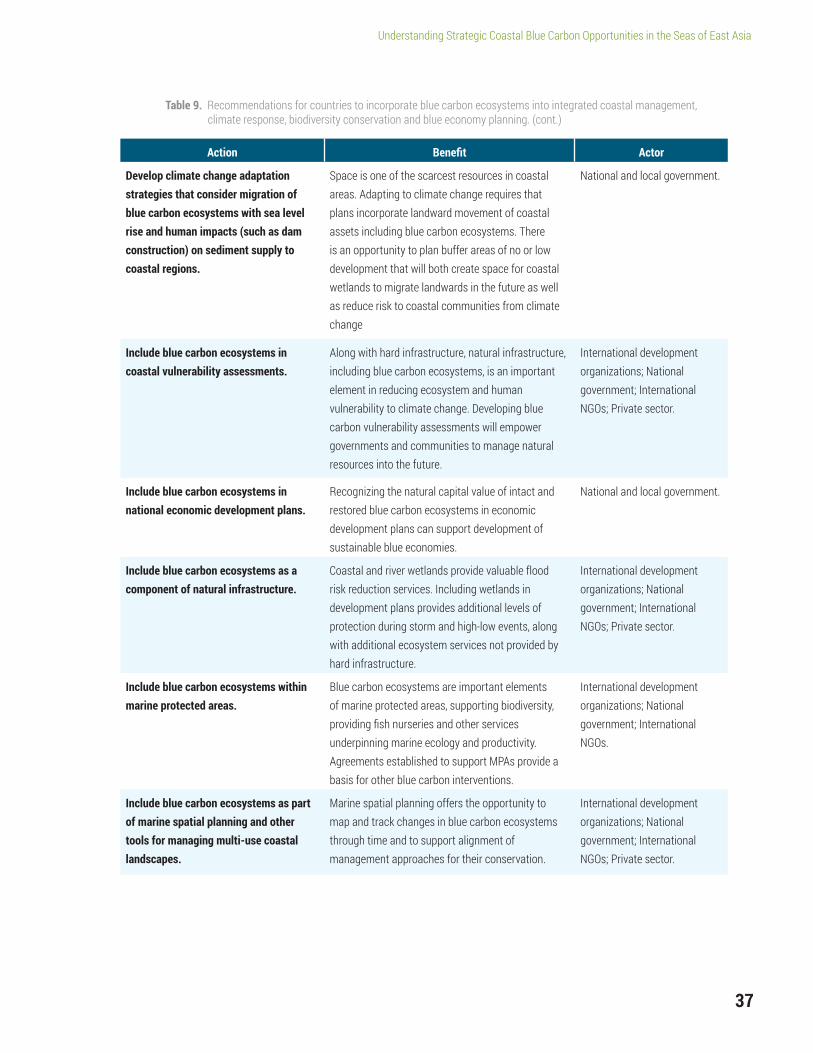
37
Understanding Strategic Coastal Blue Carbon Opportunities in the Seas of East Asia
Table 9. Recommendations for countries to incorporate blue carbon ecosystems into integrated coastal management, climate response, biodiversity conservation and blue economy planning. (cont.)
Action Benefit Actor
Develop climate change adaptation strategies that consider migration of blue carbon ecosystems with sea level rise and human impacts (such as dam construction) on sediment supply to coastal regions.
Space is one of the scarcest resources in coastal areas. Adapting to climate change requires that plans incorporate landward movement of coastal assets including blue carbon ecosystems. There is an opportunity to plan buffer areas of no or low development that will both create space for coastal wetlands to migrate landwards in the future as well as reduce risk to coastal communities from climate change
National and local government.
Include blue carbon ecosystems in coastal vulnerability assessments.
Along with hard infrastructure, natural infrastructure, including blue carbon ecosystems, is an important element in reducing ecosystem and human vulnerability to climate change. Developing blue carbon vulnerability assessments will empower governments and communities to manage natural resources into the future.
International development organizations; National government; International NGOs; Private sector.
Include blue carbon ecosystems in national economic development plans.
Recognizing the natural capital value of intact and restored blue carbon ecosystems in economic development plans can support development of sustainable blue economies.
National and local government.
Include blue carbon ecosystems as a component of natural infrastructure.
Coastal and river wetlands provide valuable flood risk reduction services. Including wetlands in development plans provides additional levels of protection during storm and high-low events, along with additional ecosystem services not provided by hard infrastructure.
International development organizations; National government; International NGOs; Private sector.
Include blue carbon ecosystems within marine protected areas.
Blue carbon ecosystems are important elements of marine protected areas, supporting biodiversity, providing fish nurseries and other services underpinning marine ecology and productivity. Agreements established to support MPAs provide a basis for other blue carbon interventions.
International development organizations; National government; International NGOs.
Include blue carbon ecosystems as part of marine spatial planning and other tools for managing multi-use coastal landscapes.
Marine spatial planning offers the opportunity to map and track changes in blue carbon ecosystems through time and to support alignment of management approaches for their conservation.
International development organizations; National government; International NGOs; Private sector.
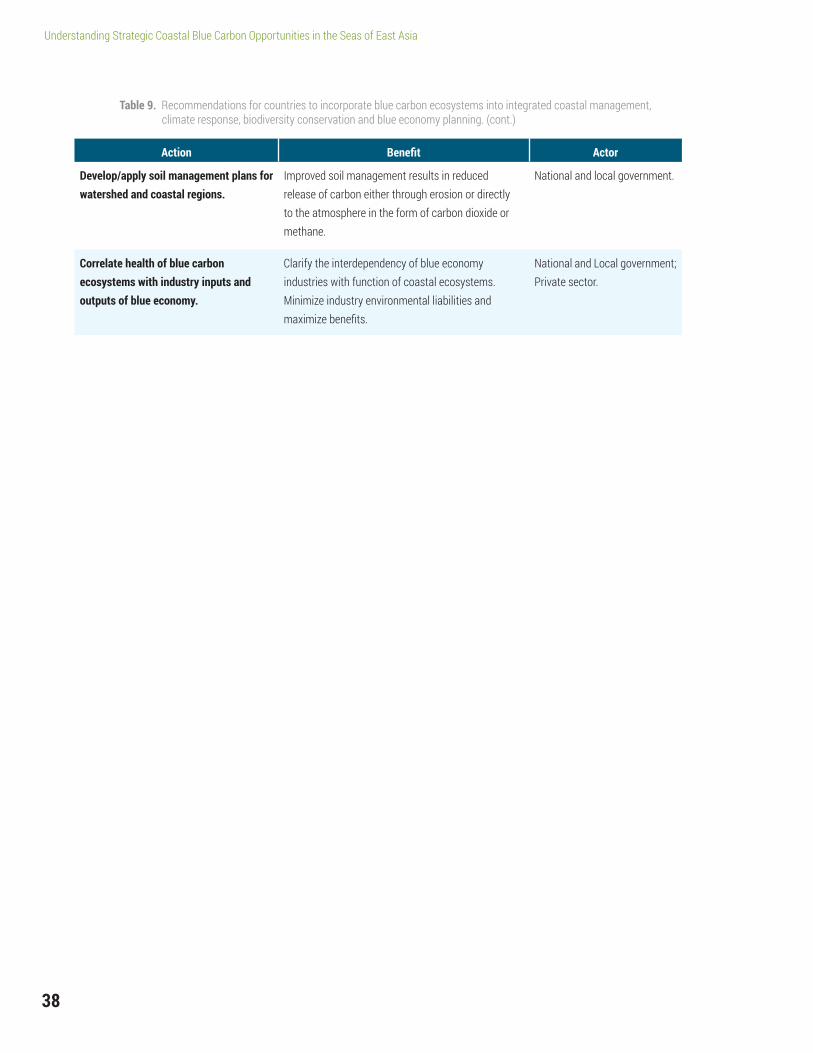
38
Understanding Strategic Coastal Blue Carbon Opportunities in the Seas of East Asia
Table 9. Recommendations for countries to incorporate blue carbon ecosystems into integrated coastal management, climate response, biodiversity conservation and blue economy planning. (cont.)
Action Benefit Actor
Develop/apply soil management plans for watershed and coastal regions.
Improved soil management results in reduced release of carbon either through erosion or directly to the atmosphere in the form of carbon dioxide or methane.
National and local government.
Correlate health of blue carbon ecosystems with industry inputs and outputs of blue economy.
Clarify the interdependency of blue economy industries with function of coastal ecosystems. Minimize industry environmental liabilities and maximize benefits.
National and Local government; Private sector.

39
Understanding Strategic Coastal Blue Carbon Opportunities in the Seas of East Asia
While the economic perspectives of blue carbon ecosys-tems were beyond the scope of this report, the following addendum provides brief background and reference con-cepts to facilitate the inclusion of “blue economy” in the follow-on dialogue and activities around blue carbon by PEMSEA and its partners.
Private Investment for Conserving and Restoring Blue Carbon Ecosystems
PEMSEA’s 2015 report on Blue Economy for Business in East Asia revealed that coastal restoration, protection and climate change adaptation are among the sustain-able development investment priorities for companies surveyed in the region, over a 3 to 5-year time horizon. Blue carbon ecosystems must undoubtedly be factored in as prominent elements of these investments.
Effective approaches for securing private investment and related expertise is critical, as a significant gap exists globally and regionally between the need for conservation and climate related investments and the availability of public and philanthropic funding. The Coalition for Private Investment in Conservation (CPIC)—an effort launched by
Credit Suisse, The Nature Conservancy, International Union for Conservation of Nature (IUCN) and Cornell University116 to develop new investment models to help close the cur-rent conservation funding gap—provides the following perspective on the situation:
In order to deliver the volume of investment needed to address the scale of conservation challenges, investment opportunities that provide measurable, science-based conservation benefits and social impact to participating communities and to biodiversity, while delivering at-scale financial returns for investors, will be necessary.117
Furthermore, finding innovative ways to secure private investment is a particularly important challenge for protec-tion and restoration of blue carbon ecosystems, as noted in the Coastal Blue Carbon report from IUCN:
Finding appropriate funding sources to set up a coastal wetland carbon project or develop a national carbon program (which includes or is solely focused on coastal wetlands) is often a challenge. Additionally, carbon finance alone often cannot support the necessary management activities.118
Addendum: Blue Carbon Ecosystems as Part of an East Asia Blue Economy
116 Others members include (but are not limited to) the Global Environment Facility, Encourage Capital, WWF, the European Investment Bank, Convergence, Conservation Finance Alliance, Conservation Finance Network, Global Ocean Trust and World Forum on Natural Capital.117 Coalition for Private Investment in Conservation. “Statement of Intent accessible.” http://www.conservationfinancenetwork.org/2016/09/28/ coalition-launched-to-scale-up-conservation-finance. 118 Herr, D. T. et al. 2015. Coastal “blue” carbon. A revised guide to supporting coastal wetland programs and projects using climate finance and other financial mechanisms. IUCN, Gland. https://www.iucn.org/sites/dev/files/import/downloads/wetlands_carbon_finance_paper_final_ lr.pdf. Accessed 2017 January 25.
6Photo by SCA/Crooks

40
Understanding Strategic Coastal Blue Carbon Opportunities in the Seas of East Asia
The emerging fields of conservation investment and blended finance, both independently and working together, offer approaches for securing private invest-ment, and in some cases may be able to augment public and philanthropic sources of carbon and/or climate funding.
Conservation Investment
Conservation Investments are investments intended to return principal or generate profit while also resulting in a positive impact on natural resources and ecosystems. In addition, conservation impacts must be the intended moti-vation for making the investment; they cannot be simply a by-product of an investment made solely for financial return.119
Conservation Investment is considered a segment of the wider Impact Investment market and is growing sub-stantially. TNC finds in its 2016 Investing in Conservation report that in just two years (2013-2015), the total private capital committed to conservation investments jumped by 62%, to a total committed private capital of $8.2 billion USD tracked from 2004 to 2015:120
In its report Conservation Finance: Moving Beyond Donor Funding Toward an Investor-driven Approach, Credit Suisse finds that “investors say they are looking for investable projects with clear investment characteristics, run by managers or trusted funds with conservation and financ-ing experience and track record.”121 These can include:
1. Investments in underlying ecosystems with the goal of capital protection. The acquisition of forests, freshwater or deserts, or usage rights tied to a long-term conser-vation commitment only make sense from a financial perspective if they generate a financial return and thereby become actual financial assets (though the underlying ecosystem may have intrinsic value for some investors or generate other benefits, such as tax breaks).
2. Investments in infrastructure and sustainable manage-ment of ecosystem services to achieve financial returns. These investments can create economic value under the constraint of conservation, for example with lodges and trails to foster ecotourism or solar arrays for power genera-tion. Ecosystem services (such as watershed protection) and goods derived from sustainable forestry, agriculture, or aquaculture can also provide cash flows. Such cash flows often depend on regulatory requirements or industry certifications that support premium pricing.
3. Investments in ecosystem market and regulatory mecha-nisms to enhance returns. These are financial instruments such as securities and derivatives, as well as corporate inter-mediaries leveraging regulatory requirements. Examples include voluntary or mandatory offsets, subsidized power production or permit and rights issuance and trading.
Blended Finance
The Organization for Economic Cooperation and Development (OEDC) and World Economic Forum offer the following definition of Blended Finance:
The strategic use of development finance and philanthropic funds to mobilize private capital flows to emerging and frontier markets, characterized by:
– Leverage: Use of development finance and philanthropic funds to attract private capital. – Impact: Investments that drive social, environmental and economic progress. – Returns: Returns for private investors in line with market
expectations based on perceived risk.
Blended Finance can be used across a range of structures, geographies and sectors using a range of instruments. Deals bring together different stakeholders that partner in a fund or transaction, involving a mixture of development funding and private investors.122
119 J.P. Morgan. “State of Private Investment in Conservation 2016 A Landscape Assessment of an Emerging Market.” https://www.cbd.int/financial/privatesector/g-private-wwf.pdf. Accessed 2017 February 22.120 Ibid.121 Credit Suisse. 2014. “Conservation Finance: Moving Beyond Donor Funding Toward an Investor-driven Approach.” https://www.cbd.int/financial/ privatesector/g-private-wwf.pdf. Accessed 2017 February 22.122 World Economic Forum and Organization for Economic Cooperation and Development. 2015. “A how-to guide for Blended Finance: a practical guide for Development Finance and Philanthropic Funders to integrate Blended Finance best practices into their organizations.” http://www3.weforum.org/docs/WEF_Blended_Finance_How_To_Guide.pdf. Accessed 2017 February 25.
41
Understanding Strategic Coastal Blue Carbon Opportunities in the Seas of East Asia
As an example, The Nature Conservancy received a grant from Convergence Design Funding to develop a blended finance proof of concept grant in 2016. TNC will use the funding to design a Blue Bond that will finance debt conversions for Small Island Developing States that face climate change challenges. Debt con-versions provide funding to governments in exchange for their commitment to improve policies and invest in marine conservation and climate adaptation activities.
Developing a substantial number of these types of investment deals in the region will likely require signifi-cant capacity building among a range of stakeholders over time. An opportunity exists for partners in the region to collaborate as a consortium in providing the regional leadership and expertise for developing innovative and systematic investment approaches as described above. This will be essential for attracting and securing the prioritized private investment in blue carbon ecosystems that can support the envisioned growth of a blue economy in East Asia.
Blue Carbon and the Blue Economy
From an integrated coastal management perspective, East Asia’s blue carbon ecosystems are valued for their role as vital resources supporting the develop-ment of a blue economy in the region. As defined by PEMSEA partner countries in the 2012 Changwon Declaration, blue economy is “a practical ocean-based economic model using green infrastructure and technologies, innovative financing mechanisms and proactive institutional arrangements for meeting the twin goals of protecting our oceans and coasts and enhancing its potential contribution to sustainable development, including improving human well-being, and reducing environmental risks and ecological scarcities.”123
In this context, PEMSEA’s Blue Economy for Business in East Asia report identifies four key elements of marine
and coastal economic activities that are considered blue economy:
1. Protects, restores and sustains healthy coastal and marine ecosystem services
2. Generates sustainable, equitable economic benefit and inclusive growth
3. Integrates approaches between multiple industries and government
4. Innovates, informed by the best science
Blue carbon ecosystems’ role aligns most directly with the first of these elements. The rising strategic importance of ecosystems services and natural capital management in blue economy development planning is reflected in the following excerpt from the World Bank assessment Toward a Blue Economy: a Promise for Sustainable Growth in the Caribbean:
“These drivers of change in the status of the Caribbean Sea’s natural capital assets constitute an important constraint and significant risk to the potential growth of the region’s ocean economy, similar to the risks to the global ocean economy. In some cases, the decline of these assets may prevent sectors and industries from reaching their potential in the region; for others, it may create regulatory uncertainty that also presents a significant risk.124
Research is underway by PEMSEA Country Partners to further develop a framework for understanding the blue economy in East Asia. The research will culminate in a set of National State of Oceans and Coasts Reports and a comprehensive Regional Seas of East Asia State of Oceans and Coasts report, planned for release in 2018 that will include:
• Definitions and methodologies for assessing blue economy
• The contribution of blue economy activities to national economies in East Asia, including the value of ecosys-tem services in coastal and ocean areas
123 PEMSEA. 2015. “Blue Economy for business in East Asia: towards an integrated understanding of Blue Economy.” http://www.pemsea.org/publications/reports/blue-economy-business-east-asia-towards-integrated-understanding-blue-economy. Accessed 2017 February 28.124 Patil, P.G. et al. 2016. “Toward a Blue Economy: a promise for sustainable growth in the Caribbean; an overview.” The World Bank, Washington D.C. http://documents.worldbank.org/curated/en/965641473449861013/main-report. Accessed 2017 February

42
Understanding Strategic Coastal Blue Carbon Opportunities in the Seas of East Asia
• Policies and incentives to promote and facilitate investments in blue economy
• Growth sectors and emerging market and invest-ment opportunities
Further research by PEMSEA Country Partners, Non-Country Partners and collaborating organizations is critical for integrating the science, policy and economic
perspectives toward an understanding of blue carbon ecosystems’ strategic value to the region. This report, along with the forthcoming State of Oceans and Coasts reports, can provide the foundation and a catalyst for additional, focused blue economy research to identify the interdependencies, risks and opportunities that blue carbon ecosystems/natural capital present for blue economy industries in the region.

43
Understanding Strategic Coastal Blue Carbon Opportunities in the Seas of East Asia
Appendices
Appendix A: Definitions
Blue carbon – The carbon stored in marine ecosystems. Blue carbon is subdivided into oceanic and coastal blue carbon component. Within this report the term blue carbon is applied only to coastal blue carbon.
Blue carbon ecosystem – A terms commonly applied to coastal vegetated ecosystems (typically mangroves, tidal marshes and seagrass meadows, but may include algal flats in arid settings) that extract carbon dioxide from the atmospheric or coastal waters and store carbon stock in biomass and soil carbon pools.
Blue economy – A practical ocean-based economic model using green infrastructure and technologies, innovative financing mechanisms and proactive institutional arrange-ments for meeting the twin goals of protecting our oceans and coasts and enhancing its potential contribution to sustainable development, including improving human well-being, and reducing environmental risks and eco-logical scarcities.
Carbon sequestration – the process by which carbon is removed directly from the atmosphere, or indirectly from coastal waters, and stored within biomass and soils.
Carbon pool – An accumulation of carbon within an eco-systems component, there are five pools measured in
carbon stock assessments: biomass (above ground, below ground and dead) litter material and soils.
Carbon stock – The amount of carbon in an ecosystem (total carbon stock) or within an individual pool (aboveg-round biomass, belowground biomass, soil, dead wood and litter).
Coastal blue carbon – the carbon stored in mangroves, tidal marshes and seagrass meadows.
Coastal wetland – A wetland found in coastal settings, which may be vegetated or not vegetated, connected or not connected to tides.
Mangrove – A tree, shrub, palm or ground fern that nor-mally grows above mean sea level within the intertidal zone of marine coastal environments.
Marsh – A wetland that is dominated by herbaceous rather than woody plant species.
Salt marsh – A marsh dominated by salt-tolerant plants, such as herbs, grasses and low shrubs. Salt marshes may be terrestrial (e.g., bordering desert salt lakes) or coastal. Coastal salt marshes are found at elevations above mean tide elevation up to the highest elevation of tides.
7Photo by SCA/Crooks
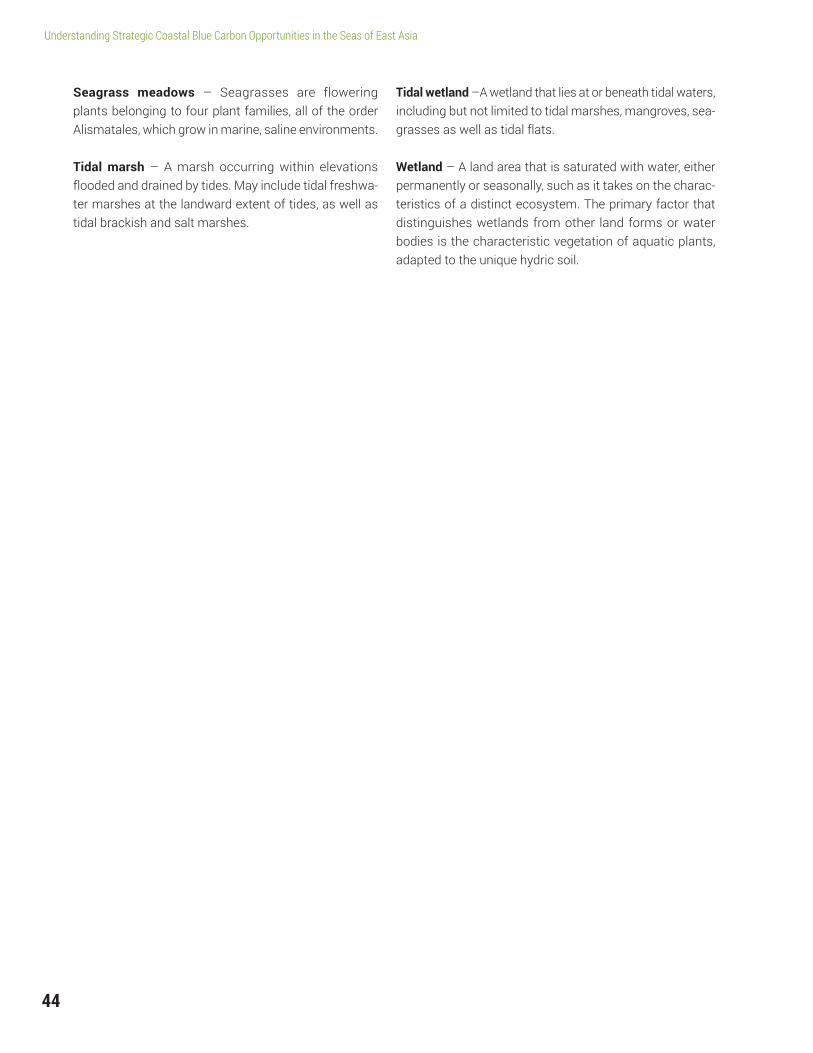
44
Understanding Strategic Coastal Blue Carbon Opportunities in the Seas of East Asia
Seagrass meadows – Seagrasses are flowering plants belonging to four plant families, all of the order Alismatales, which grow in marine, saline environments.
Tidal marsh – A marsh occurring within elevations flooded and drained by tides. May include tidal freshwa-ter marshes at the landward extent of tides, as well as tidal brackish and salt marshes.
Tidal wetland –A wetland that lies at or beneath tidal waters, including but not limited to tidal marshes, mangroves, sea-grasses as well as tidal flats.
Wetland – A land area that is saturated with water, either permanently or seasonally, such as it takes on the charac-teristics of a distinct ecosystem. The primary factor that distinguishes wetlands from other land forms or water bodies is the characteristic vegetation of aquatic plants, adapted to the unique hydric soil.
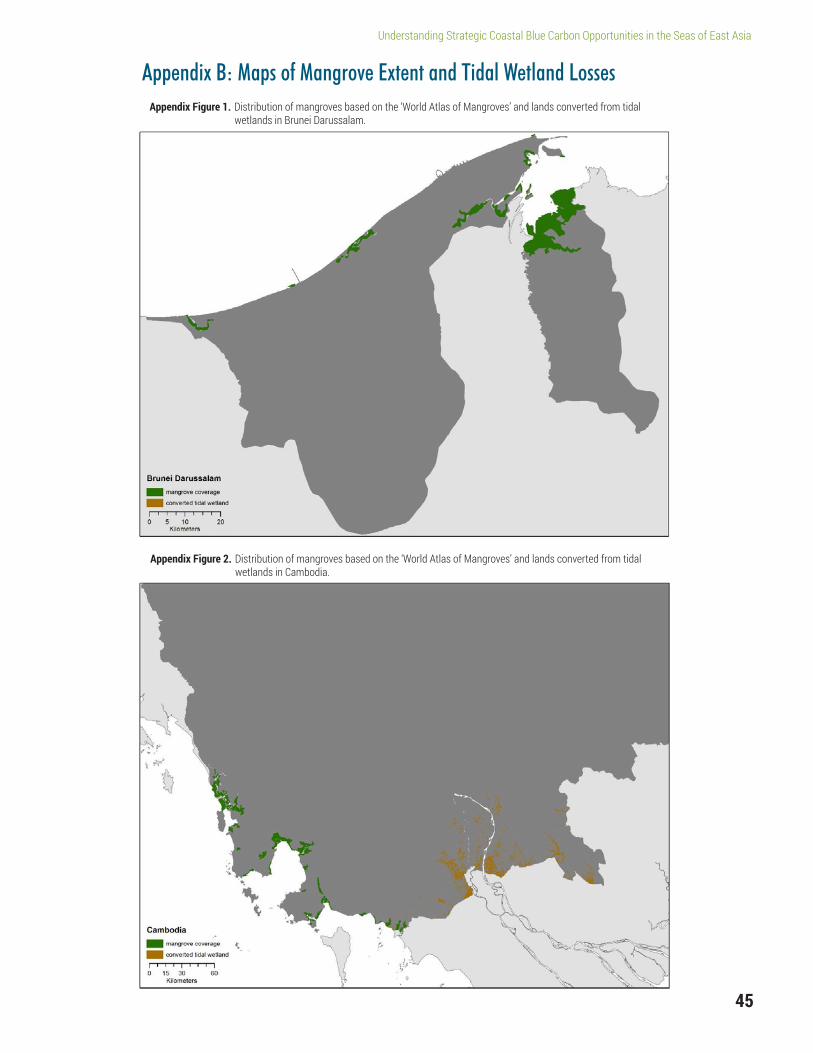
45
Understanding Strategic Coastal Blue Carbon Opportunities in the Seas of East Asia
Appendix B: Maps of Mangrove Extent and Tidal Wetland LossesAppendix Figure 1. Distribution of mangroves based on the ‘World Atlas of Mangroves’ and lands converted from tidal wetlands in Brunei Darussalam.
Appendix Figure 2. Distribution of mangroves based on the ‘World Atlas of Mangroves’ and lands converted from tidal wetlands in Cambodia.
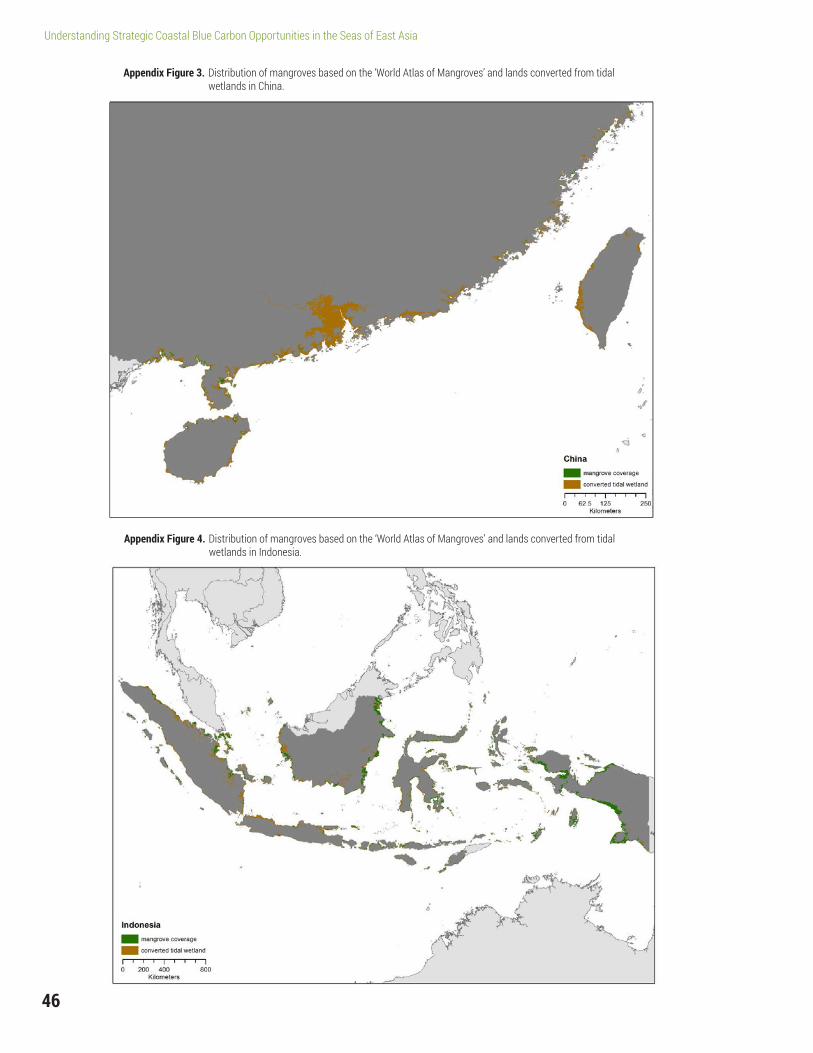
46
Understanding Strategic Coastal Blue Carbon Opportunities in the Seas of East Asia
Appendix Figure 3. Distribution of mangroves based on the ‘World Atlas of Mangroves’ and lands converted from tidal wetlands in China.
Appendix Figure 4. Distribution of mangroves based on the ‘World Atlas of Mangroves’ and lands converted from tidal wetlands in Indonesia.
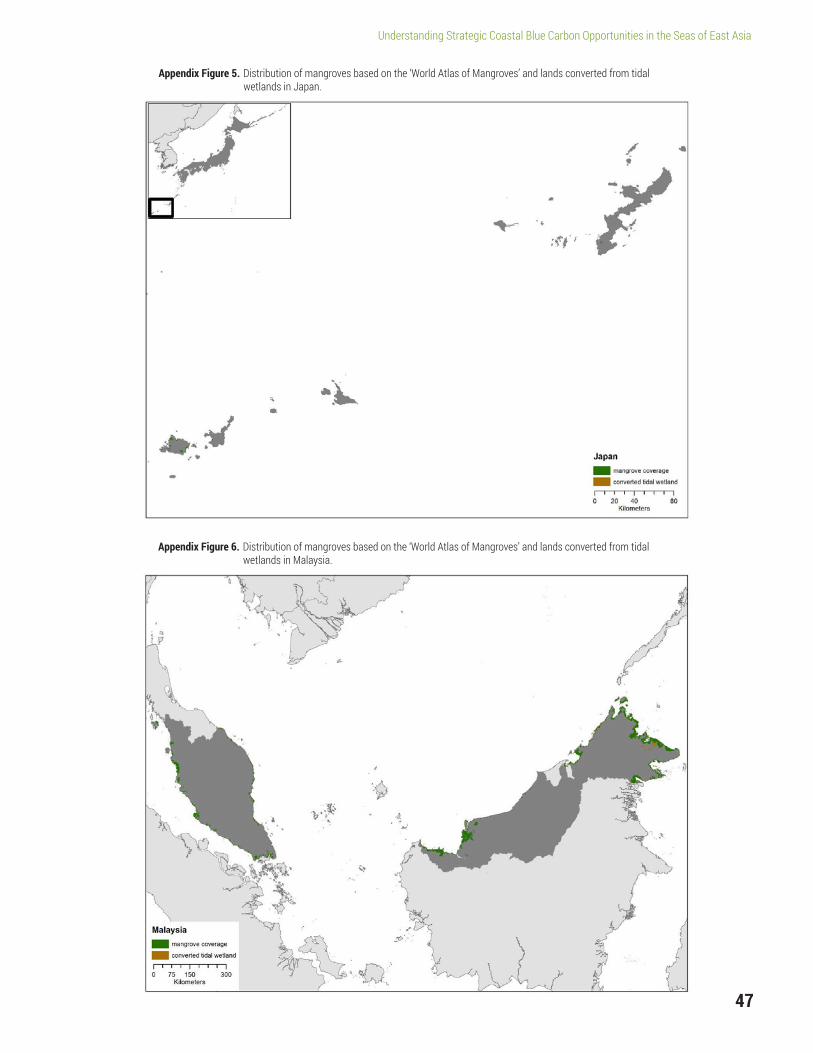
47
Understanding Strategic Coastal Blue Carbon Opportunities in the Seas of East Asia
Appendix Figure 5. Distribution of mangroves based on the ‘World Atlas of Mangroves’ and lands converted from tidal wetlands in Japan.
Appendix Figure 6. Distribution of mangroves based on the ‘World Atlas of Mangroves’ and lands converted from tidal wetlands in Malaysia.
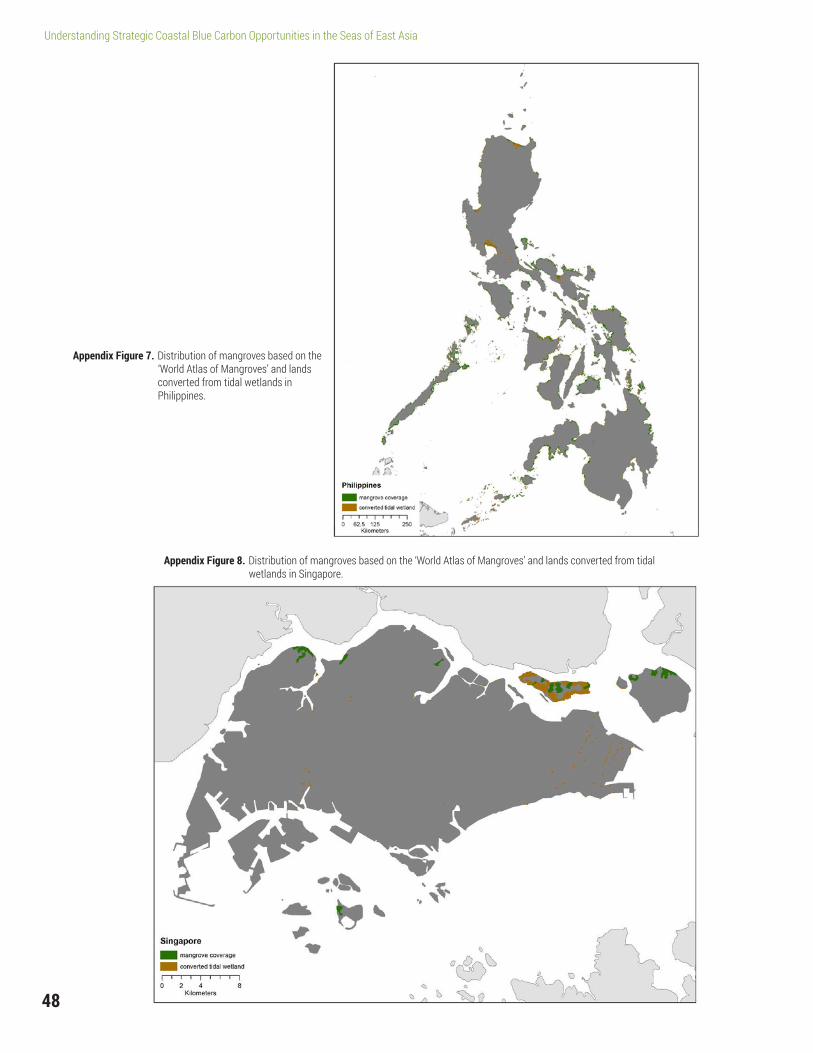
48
Understanding Strategic Coastal Blue Carbon Opportunities in the Seas of East Asia
Appendix Figure 7. Distribution of mangroves based on the ‘World Atlas of Mangroves’ and lands converted from tidal wetlands in Philippines.
Appendix Figure 8. Distribution of mangroves based on the ‘World Atlas of Mangroves’ and lands converted from tidal wetlands in Singapore.
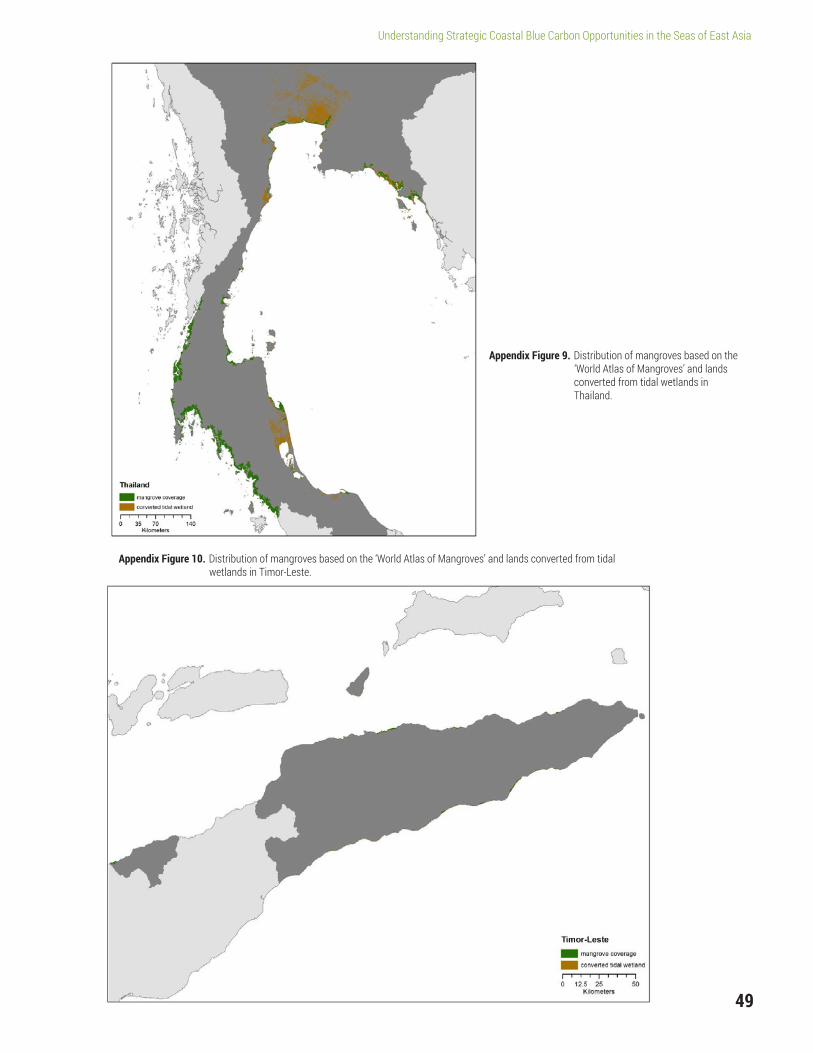
49
Understanding Strategic Coastal Blue Carbon Opportunities in the Seas of East Asia
Appendix Figure 9. Distribution of mangroves based on the ‘World Atlas of Mangroves’ and lands converted from tidal wetlands in Thailand.
Appendix Figure 10. Distribution of mangroves based on the ‘World Atlas of Mangroves’ and lands converted from tidal wetlands in Timor-Leste.
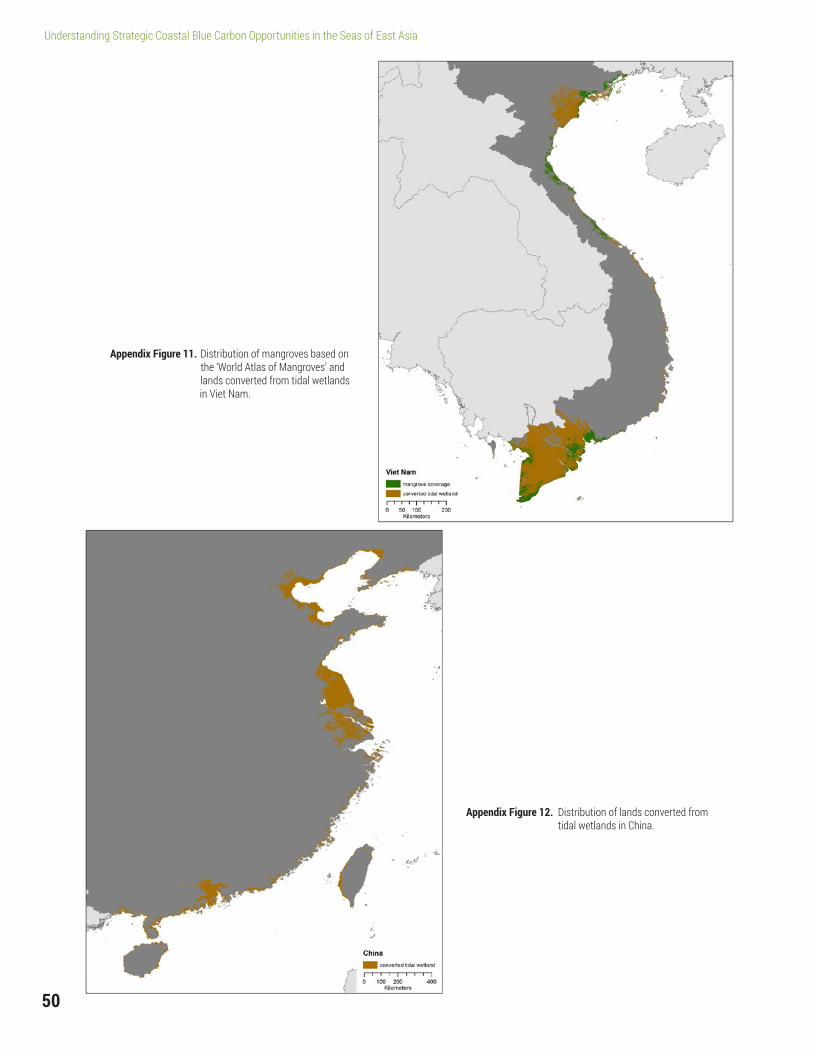
50
Understanding Strategic Coastal Blue Carbon Opportunities in the Seas of East Asia
Appendix Figure 11. Distribution of mangroves based on the ‘World Atlas of Mangroves’ and lands converted from tidal wetlands in Viet Nam.
Appendix Figure 12. Distribution of lands converted from tidal wetlands in China.
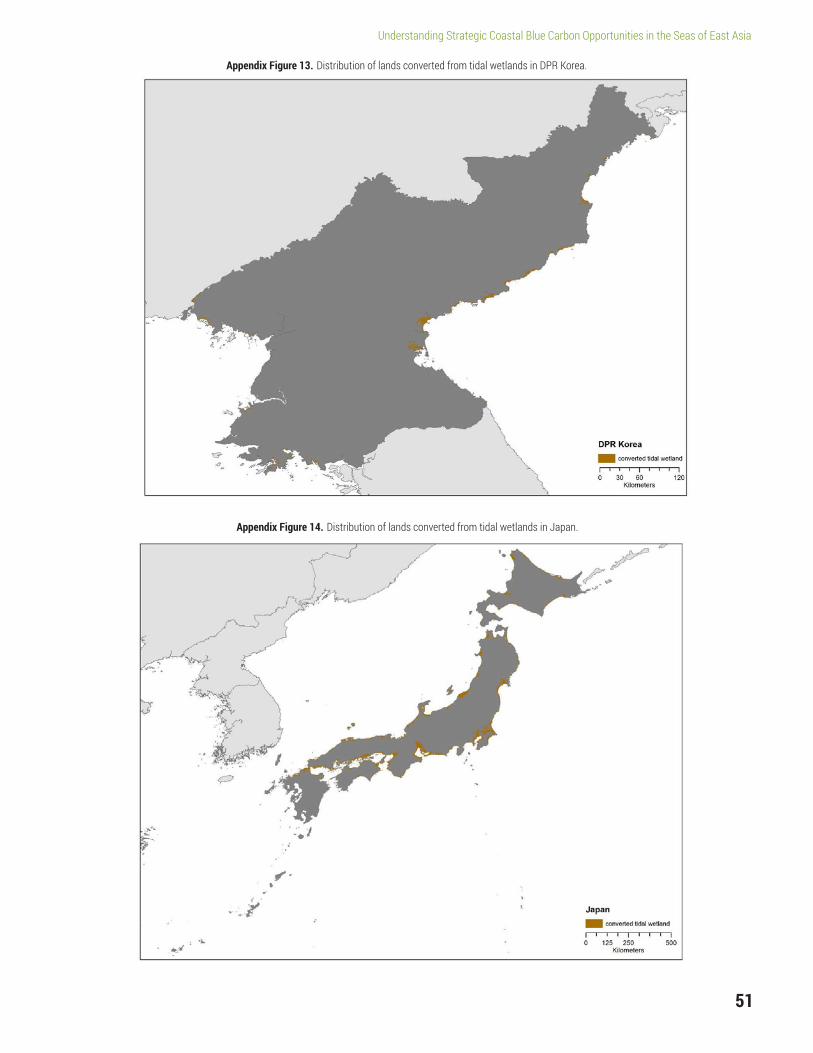
51
Understanding Strategic Coastal Blue Carbon Opportunities in the Seas of East Asia
Appendix Figure 13. Distribution of lands converted from tidal wetlands in DPR Korea.
Appendix Figure 14. Distribution of lands converted from tidal wetlands in Japan.

52
Understanding Strategic Coastal Blue Carbon Opportunities in the Seas of East Asia
Appendix Figure 15. Distribution of lands converted from tidal wetlands in RO Korea.
53
Understanding Strategic Coastal Blue Carbon Opportunities in the Seas of East Asia
Alongi, D. et al. 2015. “Indonesia’s blue carbon: a globally significant and vulnerable sink for seagrass and mangrove carbon.” Wetlands Ecology and Management, 24:3-13.
Arnell, N.W. and Gosling, S. N. 2016. “The impact of climate change on river flood risk at the global scale.” Climate Change, 134(1):387-401.
Association GERES. 2017. “NAMA on sustainable charcoal value-chains in Cambodia.” http://www.geres.eu/en/our-actions/item/481-nama-on-sustainable-charcoal-value-chains-in-cambodia. http://www.geres.eu/en/our-actions/item/481-nama-on-sustainable-charcoal-value-chains-in-cambodia. Accessed 2017 January 25.
Bosquet, Michelle et al. 2016. “Status Report on Nationally Appropriate Mitigation Actions (NAMAs): Mid-Year Update Report 2016.” Edited by Charlotte Cuntz et al. https://www.international-climate-initiative.com/fileadmin/Dokumente/2016/NAMA-Status-Report-June-2016.pdf. Accessed 2016 December 20.
Bujang, J. et al. 2006. “Distribution and significance of seagrass ecosystems in Malaysia.” Aquatic Ecosystem Health & Management, 9:1-14.
Costanza, R. et al. 1997. “The value of the world’s ecosystem services and natural capital.” Nature, 387:253–260.
Costanza, R. et al. 2014. “Changes in the global value of ecosystem services.” Global Environmental Change, 26:152-158.
Credit Suisse. 2014. “Conservation Finance: Moving Beyond Donor Funding Toward an Investor-driven Approach.” https://www.cbd.int/financial/privatesector/g-private-wwf.pdf. Accessed 2017 February 22.
Creel, Liz. 2003. “Ripple Effects: Population and Coastal Regions.” http://www.prb.org/Publications/Reports/2003/RippleEffectsPopulationandCoastalRegions.aspx. Accessed 2016 November 3.
Crooks, S. et al. 2011. “Mitigating climate change through restoration and management of coastal wetlands and near-shore marine ecosystems: challenges and opportunities.” Environment Department Paper 121. World Bank, Washington, DC.
Duarte, C.M. et al. 2005. “Major role of marine vegetation on the oceanic carbon cycle.” Biogeosciences, 2:1–8.
FAO. 2015. “Learning Tool on Nationally Appropriate Mitigation Actions (NAMAs) in the agriculture, forestry and other land use (AFOLU) sector.” http://www.fao.org/3/a-i4642e.pdf. Accessed 2016 December 20.
Fortes, M. 1990. Seagrasses: a resource unknown in the ASEAN region. Vol. 5. WorldFish.
Fourqurean, J.W. et al. 2012. “Seagrass ecosystems as a globally significant carbon stock.” Nature Geoscience, 5:505-509.
GEF Blue Forests. 2016. http://www.gefblueforests.org/.
Giri, C. et al. 2011. “Status and distribution of mangrove forests of the world using earth observation satellite data.” Global Ecology and Biogeochemistry, 20: 154-159.
Green, E. and F. Short. 2003. World atlas of seagrasses. Prepared by the UIMEP World Conservation Monitoring Centre. University of California Press, Berkeley, USA.
Hamilton, S. and D. Casey. 2016. “Creation of a high spatio-temporal resolution global database of continuous mangrove forest cover for the 21st century (CGMFC-21).” Global Ecology and Biogeochemistry, 25: 729-738.
Appendix C: Bibliography
54
Understanding Strategic Coastal Blue Carbon Opportunities in the Seas of East Asia
Hamilton, S. E. and D. Friess. 2016. “High-resolution annual maps of whole system mangrove carbon stocks from 2000 to 2012.” arXiv preprint arXiv:1611.00307.
Hansen, M. et al. 2013. “High-resolution global maps of 21st century forest cover change.” Science, 342:850-853.
Herr, D. and E. Landis. 2016. “Coastal blue carbon ecosystems. Opportunities for Nationally Determined Contributions.” https://thought-leadership-production.s3.amazonaws.com/2016/11/12/10/26/14/0d574e9d-3eac-4591-9b8b-57001631b935/BC%20NDCs_FINAL.pdf. Accessed 2017 February 22.
Herr, D. T. et al. 2015. Coastal “blue” carbon. A revised guide to supporting coastal wetland programs and projects using climate finance and other financial mechanisms. IUCN, Gland. https://www.iucn.org/sites/dev/files/import/downloads/wetlands_carbon_finance_paper_final_lr.pdf. Accessed 2017 January 25.
Hiraishi, Takahiko, et al. 2014. 2013 supplement to the 2006 IPCC guidelines for national greenhouse gas inventories: Wetlands. IPCC, Switzerland.
Hoekstra, J. M. et al. 2010. The atlas of global conservation: changes, challenges, and opportunities to make a difference. Ed. J. L. Molnar. Berkeley: University of California Press.
Howard, J. et al. 2017. “Clarifying the role of coastal and marine systems in climate mitigation.” Frontiers in Ecology and the Environment, 15:42-50.
Huang, X. et al. 2006. “Main seagrass beds and threats to their habitats in the coastal sea of South China.” Chinese Science Bulletin, 51 Supp. II 136-142.
Hutchinson, J. et al. 2013. “Predicting global patterns in mangrove forest biomass.” Conservation Letters, 7:233-240.
Hutomo, M. and M. Moosa. 2005. “Indonesian marine and coastal biodiversity: present status.” Indian Journal of Marine Sciences, 34:88-97.
Huwyler, F. et al. 2014. Conservation finance: moving beyond donor funding toward an investor-driven approach. Credit Suisse, WWF, McKinsey & Company: Zurich, Switzerland.
ICAO. 2016. “Draft text for the report on agenda item 22 (Section on Global Market-based Measure Scheme).” http://www.icao.int/Meetings/a39/Documents/WP/wp_462_en.pdf. Accessed 2016 December 12.
International Partnership for Blue Carbon. 2017. http://bluecarbonpartnership.org/.
J.P. Morgan. “State of Private Investment in Conservation 2016 A Landscape Assessment of an Emerging Market.” https://www.cbd.int/financial/privatesector/g-private-wwf.pdf. Accessed 2017 February 22.
Jardine, S. and J. Siikamäki. 2014. “A global predictive model of carbon in mangrove soils.” Environmental Research Letters, 9:104013.
Joosten, H. et al. 2016. “Peatlands, forests and the climate architecture: setting incentives through markets and enhanced accounting.” https://www.umweltbundesamt.de/publikationen/peatlands-forests-the-climate-architecture-setting. Accessed 2017 February 22.
Kauffman, J. B. and D. Donato. 2012. Protocols for the measurement, monitoring and reporting of structure, biomass and carbon stocks in mangrove forests. (CIFOR Working Paper no. 86, p. 40p). Center for International Forestry Research (CIFOR), Bogor, Indonesia.
La Viña, A. et al. 2016. “History and future of REDD+ in the UNFCCC: issues and challenges.” In Research Handbook on REDD+ and International Law. Edited by C. Voigt. http://www.e-elgar.com/shop/eep/preview/book/isbn/9781783478316/. Accessed 2017 January 25.
55
Understanding Strategic Coastal Blue Carbon Opportunities in the Seas of East Asia
Lee, D. and T. Pistorius. 2015. “The Impacts of International REDD Finance.” http://www.climateandlandusealliance.org/wp-content/uploads/2015/09/Impacts_of_International_REDD_Finance_Report_FINAL. Accessed 2016 December 15.
Locatelli, T. et al. 2014. “Turning the tide: how blue carbon and payments for ecosystem services (PES) might help save mangrove forests.” DOI 10.1007/s13280-014-0530-y. Accessed 2016 December 9.
McLeod, Elizabeth and Rodney V. Salm. 2006. “Managing mangroves for resilience to climate change.” World Conservation Union (IUCN), Gland. http://cmsdata.iucn.org/downloads/managing_mangroves_for_resilience_to_climate_change.pdf. Accessed 2016 December 8.
Murray, B. et al. 2011. Green payments for blue carbon: Economic incentives for protecting threatened coastal habitats. Nicholas Institute for Environmental Policy Solutions, Report NI 11.04.
NAMA. 2016. “Adaptation and mitigation initiatives in Philippine rice cultivation.” http://namanews.org/news/2015/03/05/climate-change-adaptation-oriented-nama-option-for-the-rice-sector-in-the-philippines/. Accessed 2017 January 25.
Nguyen Van Huy. [n.d.]. “Towards NAMA/MRV Readiness in Vietnam.” [presentation]. https://unfccc.int/files/focus/mitigation/application/pdf/towards_nama_readiness_invietnam.pdf. Accessed 2017 January 25.
Patil, P.G. et al. 2016. “Toward a Blue Economy: a promise for sustainable growth in the Caribbean; an overview.” The World Bank, Washington D.C. http://documents.worldbank.org/curated/en/965641473449861013/main-report. Accessed 2017 January 22.
Pearson, T. et al. 2016. “Guidance Document: Options for Nesting REDD+ Projects.” (Fundación Natura Colombia 2016). http://www.v-c-s.org/wp-content/uploads/2016/07/Nesting-Options-1-Jul_Eng_final.pdf. Accessed 2016 December 18.
PEMSEA. 2015. “Blue Economy for business in East Asia: towards an integrated understanding of Blue Economy.” http://www.pemsea.org/publications/reports/blue-economy-business-east-asia-towards-integrated-understanding-blue-economy. Accessed 2017 January 25.
Pendleton, L. et al. 2012. “Estimating global “blue carbon” emissions from conversion and degradation of vegetated coastal ecosystems.” PloS One, 7.9:e43542.
Pidgeon, E. 2009. “Carbon sequestration by coastal marine habitats: important missing sinks.” In The management of natural coastal carbon sinks. Edited by Laffoley, D. and Grimsditch, G. IUCN, Gland.
Resor, J. 2010. “Debt-for-nature swaps: a decade of experience and new directions for the future.” http://www.fao.org/docrep/w3247e/w3247e06.htm. Accessed 2016 December 9.
Restore America’s Estuaries. 2016. “Blue Carbon Resources.” https://www.estuaries.org/bluecarbon-resources.
Richards, D. & D. Friess. 2016. “Rates and drivers of mangrove deforestation in Southeast Asia, 2000-2012.” PNAS, 113:344-349.
Rotich, B. et al. 2016. Where land meets the sea. A global review of the governance and tenure dimensions of coastal mangrove forests.
Shi-Jun, Y. and C. Ji-yu. 1995. “Coastal salt marshes and mangrove swamps in China.” Chinese Journal of Oceanology and Limnology, 13: 318-324.
Short, F. et al. 2007. “Global seagrass distribution and diversity: a bioregional model.” Journal of Experimental Marine Biology & Ecology, 350.1:3-20.
56
Understanding Strategic Coastal Blue Carbon Opportunities in the Seas of East Asia
Spalding, M. 2010. World atlas of mangroves. Routledge.Syvitskiet, J. et al. 2009. “Sinking Deltas Due to Human
Activities. Nature Geoscience, 2:681-686.
Twilley, R. et al. 1992. Carbon sinks in mangroves and their implications to carbon budget of tropical coastal ecosystems. In Natural sinks of CO2. Springer, Netherlands, pp. 265-288.
UNFCCC Secretariat. “Non-market based approaches: Technical Paper, FCCC/TP/2014/10, 24 November 2014.” http://unfccc.int/resource/docs/2014/tp/10.pdf. Accessed 2017 February 22.
UNFCCC. [n.d.]. “AR-AM0014: Afforestation and reforestation of degraded mangrove habitats --- Version 3.0.” https://cdm.unfccc.int/methodologies/DB/KMH6O8T6RL3P5XKNBQE2N359QG7KOE. Accessed 2016 December 12.
UNFCCC. [n.d.]. “Small-scale and low-income community-based mangrove afforestation project on tidal flats of three small islands around Batam City, Riau Islands Province, Republic of Indonesia.” https://cdm.unfccc.int/Projects/Validation/DB/Q94TKNG9V6GRFOTRKPLWDV2GHBCFWW/view.html. Accessed 2016 December 12.
UNFCCC. [n.d.]. “Subsidiary Body for Scientific and Technological Advice (SBSTA).” http://unfccc.int/bodies/body/6399.php. Accessed 2017 February 23.
Vo, S. et al. 2013. “Status and trends in coastal habitats of the South China Sea.” Ocean & Coastal Management, 85:153-163.
World Economic Forum and Organization for Economic Cooperation and Development. 2015. “A how-to guide for Blended Finance: a practical guide for Development Finance and Philanthropic Funders to integrate Blended Finance best practices into their organizations.” http://www3.weforum.org/docs/WEF_Blended_Finance_How_To_Guide.pdf. Accessed 2017 January 25.
Zuo, P. et al. 2012. “Distribution of Spartina spp. along China’s coast.” Ecological Engineering, 40:160-166.
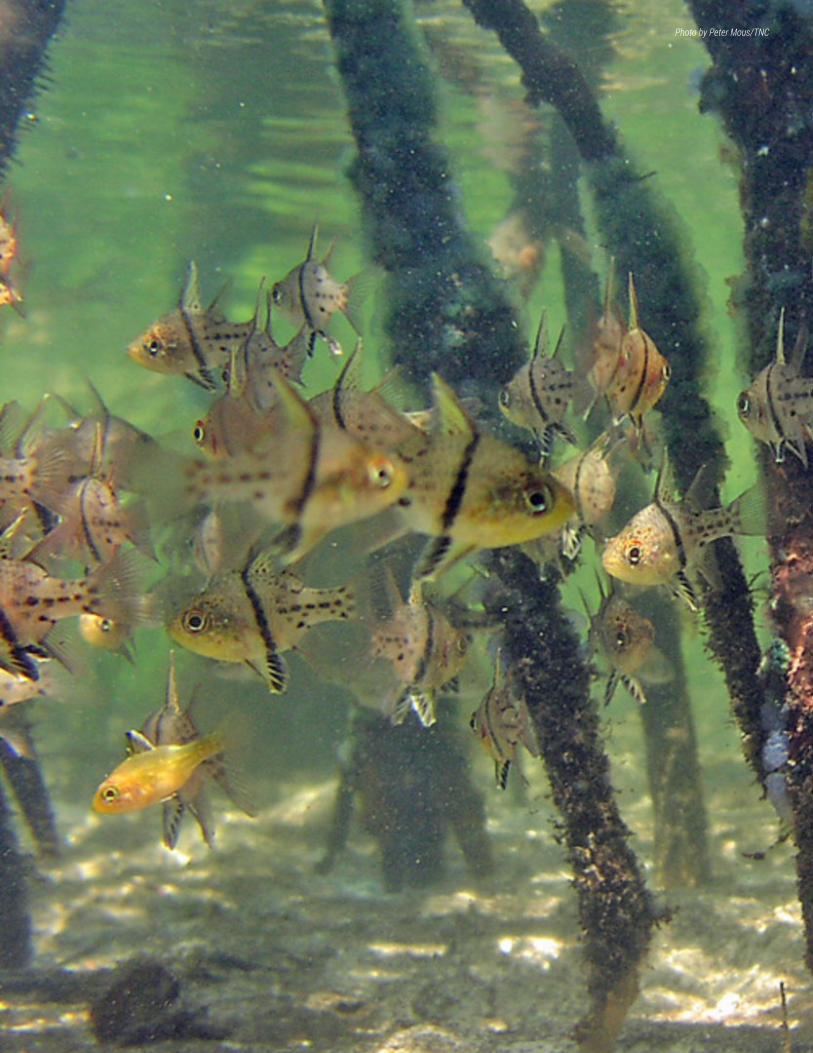
Photo by Peter Mous/TNC


Partnerships in Environmental Management for the Seas of East Asia (PEMSEA) is an intergovernmental
organization operating in East Asia to foster and sustain healthy and resilient oceans, coasts, communities
and economies across the region. Through integrated coastal management solutions and partnerships,
PEMSEA works with local and national governments, international development organizations, companies,
investors and research institutions towards sustainable development of coasts and oceans in East Asia.