Embed Size (px)
Citation preview
Understanding Synthetic Speech and Language Processing of Students With and Without a Reading
Disability
by
Todd Richard Cunningham
A thesis submitted in conformity with the requirements for the degree of Doctorate of Philosophy
Human Development and Applied Psychology University of Toronto
© Copyright by Todd Cunningham 2011
Text-To-Speech and Language Profiles ii
Understanding Synthetic Speech and Language Processing of
Students with and without a Reading Disability
Todd Cunningham
Doctorate of Philosophy
Human Development and Applied Psychology University of Toronto
2011
Abstract
To help circumvent reading disability (RD) decoding difficulty, Text-To-Speech (TTS) software
can be used to present written language audibly. Although TTS software is currently being used
to help RD students, there is a lack of empirically supported literature to inform developers and
users of TTS software on best practices. This dissertation investigated two methods to determine
whether they increase the effectiveness of TTS for RD and typically-developing students. The
first method compared low and high quality TTS voices in regards to understanding. TTS voice
quality was identified by having 40 university students listen to and rate the quality of 10
commonly used TTS voices and 2 human voices. Three voices were chosen for the subsequent
study based on the ratings; one low quality TTS, one high quality TTS, and one natural voice
(Microsoft Mary, AT&T Crystal, and Susan, respectively). Understanding was assessed with
tests of intelligibility and comprehensibility. Forty-five grade 6 to 8 students who were identified
as having a RD were compared to same-age typically-developing peers. Results showed high
quality TTS and natural voice were more intelligible than the low quality TTS voice, and high
quality TTS voice resulted in higher comprehensibility scores than low quality TTS and natural
voice.
Text-To-Speech and Language Profiles iii
The second method investigated whether it is possible to increase a student’s comprehension
when using TTS by modifying the presentation style of the TTS voice. The presentation style
was manipulated in two ways: varying the speed at which the TTS presented the materials (120,
150, 180 words per minute) and the presence of pauses varied (no pauses inserted, random
pauses inserted, or 500 millisecond pauses at the end of noun phrases). Due to a floor effect on
the comprehension of the texts the expected results were not obtained. A follow up analysis
compared the participants’ prosodic sensitivity skills based on whether they had a specific
language impairment, (SLI) a reading impairment (RI), or were typically-developing. Results
suggested that SLI has significantly less auditory working memory then RI impacting their
auditory processing. Recommendations for future research and the use of TTS based on different
learning profiles are provided.
Text-To-Speech and Language Profiles iv
Acknowledgments
It is a pleasure to thank those who made this thesis possible. To my supervisor and mentor, Dr.
Esther Geva, it has been an honor and rich learning experience learning from you over the past 8
years. You have provided me with guidance throughout the process of completing this thesis.
Your encouragement, support for the project, and outstanding analytical skills were essential to
the success of the study. It has also been an honor for me to have Dr. Maureen Lovett as a part
of my committee. It was your 2000 publication on PHASE that inspired me to pursue research in
the area of education, and I thank you for your ongoing support over the years and for your
thoughtful comments on my dissertation. It has also been a pleasure to have Dr. Lesly Wade-
Woolley who introduced me to a new body of research in prosody. Dr. Wade-Woolley’s review
of and suggestions for improving the thesis were very much appreciated. The comments from the
external reviewer, Dr. Dave Edyburn, allowed for a more refined paper, and were very much
appreciated. In addition, the writings of Dr. Edyburn have helped shape my thinking regarding
the use of assistive technology with students that have learning disabilities.
I am grateful for the educational staff that supported the study and welcomed me and the
research assistants into their classrooms. Special thanks are also offered to the students who
participated in the study, particularly for their cooperation throughout the assessments. The
willingness of the students to participate in the research project has enabled us to learn more
about the use of text-to-speech software, and will hopefully lead to more developments in
helping other students learn.
I would like to thank the group of undergraduate research assistants that travelled far and wide to
the various schools to conduct testing, score tests, enter data, and monitor the project. This study
would not have been possible without your commitment and professionalism. I am grateful for
your dedication.
The second section of this thesis would not have been possible if my friend Dr. Stephanie
Timmer did not volunteer her programming talent in developing the UTReader. I enjoy our
common vision of developing new innovative assistive technology tools.
Text-To-Speech and Language Profiles v
This research would not have been possible if it were not for the assistance of Bob Spall at the
Ontario Ministry of Education, and the financial support of this project by the Ontario Ministry
of Education. It is the goal of this research to help with the development of new tools to assist
struggling readers across Ontario.
To my best friend and partner, Julianne, I love you, and I thank you for loving me through this
process. I am also thankful for your support through sharing ideas and giving a great deal of time
to help with editing and revisions. You have shown me unconditional love and have filled my
life with joy. Thank you for helping to keep me a balanced person.
Text-To-Speech and Language Profiles vi
Table of Contents
Acknowledgments .......................................................................................................................... iv
Table of Contents ........................................................................................................................... vi
List of Tables ................................................................................................................................. ix
List of Figures ................................................................................................................................ xi
List of Appendices ........................................................................................................................ xii
Chapter 1 ........................................................................................................................................ 1
Abstract ...................................................................................................................................... 1
Experiment One ....................................................................................................................... 10
Method ..................................................................................................................................... 10
Results ...................................................................................................................................... 12
Experiment 2 ............................................................................................................................ 13
Methods .................................................................................................................................... 15
Results ...................................................................................................................................... 22
Discussion ................................................................................................................................ 28
Working Memory and the Intelligibility and Comprehensibility of TTS ................................ 35
Educational Implications .......................................................................................................... 37
Implications for use of TTS ..................................................................................................... 38
Chapter 2 ....................................................................................................................................... 39
Abstract .................................................................................................................................... 39
Presentation Rate ...................................................................................................................... 41
Pause When Reading Test ........................................................................................................ 44
Method ..................................................................................................................................... 47
Participants ............................................................................................................................... 47
Materials ................................................................................................................................... 48
Text-To-Speech and Language Profiles vii
Passage Comprehension ........................................................................................................... 48
Procedures ................................................................................................................................ 55
Statistics ................................................................................................................................... 55
Results ...................................................................................................................................... 56
Discussion ................................................................................................................................ 58
Chapter 3 ....................................................................................................................................... 64
METHOD ................................................................................................................................. 68
Participants ........................................................................................................................ 68
Materials ................................................................................................................................... 69
Procedures ................................................................................................................................ 71
Setting ...................................................................................................................................... 71
Results ...................................................................................................................................... 71
Discussion ................................................................................................................................ 74
Conclusions .............................................................................................................................. 77
Chapter 4 ....................................................................................................................................... 79
Overall Discussion ........................................................................................................................ 79
Education and Design Implementations ................................................................................... 79
Finding the right Voice ..................................................................................................... 81
Bimodal Reading .............................................................................................................. 82
Reading Speed .................................................................................................................. 83
Noun-Phrase Pause ........................................................................................................... 84
Cognitive profiles and TTS ...................................................................................................... 85
Future Research ................................................................................................................ 86
Summary .................................................................................................................................. 87
Tables and Figures ................................................................................................................... 89
Text-To-Speech and Language Profiles viii
References .............................................................................................................................. 131
Appendices ............................................................................................................................. 149
Appendix A ..................................................................................................................... 149
Appendix B ..................................................................................................................... 150
Text-To-Speech and Language Profiles ix
List of Tables
Table 1: Demographic Information for Participants in the Voice Quality Testing by Current
Education Level. ........................................................................................................................... 89
Table 2: Voice Name and Developers .......................................................................................... 90
Table 3: Correlations for voice surveys. ....................................................................................... 91
Table 4: Mean and standard deviation for voice survey questions by voice type. ....................... 92
Table 5: Means and Standard Deviations for Voice Quality Grouped by Significant Group
Differences. ................................................................................................................................... 93
Table 6: Number of Participants from Different Schools by Grade and Reading Ability Group. 94
Table 7: Differences in Learning and Language Scores between RD and Control groups. ......... 95
Table 8: Mean and SD for Accuracy of Intelligibility and Comprehensibility Measures for
Reading Ability Group Accuracy recorded as Percent Correct. ................................................... 96
Table 9: Mean Reaction Time and Moment-to-Moment Variability on Pseudoword
Discrimination by Voice and Reading Ability (Summary Statistics). .......................................... 97
Table 10: Mean and Standard Deviation for Mean Reaction Time and Moment-to-Moment
Variability for Voice by Reading Ability for Real Word Discrimination Task. .......................... 98
Table 11: Mean and Standard Deviation of Mean Reaction Time and Moment-to-Moment
Variability for Sentence Comprehension. ..................................................................................... 99
Table 12: ANCOVA Results for Accuracy, Response Latency, Moment to Moment Variability
for Pseudoword Discrimination, Real Word Discrimination, and Sentence Comprehension
between Reading Group and Voice Controlling for Working Memory. .................................... 100
Table 13: Number of Participants by Reading Groups, Gender, and Grade. .............................. 101
Text-To-Speech and Language Profiles x
Table 14: Performance on Cognitive, Language, and Reading Tasks by Reading Groups:
Summary Statistics and T-test Group Comparisons. .................................................................. 102
Table 15: Descriptive Statistics for the 18 Passages Used in the Current Study ........................ 103
Table 16: Words Per Minute for the two TTS Voices based on Presentation Rate Setting ....... 104
Table 17: Differences Between Mean Presentation Rate for TTS Voices. ................................. 105
Table 18: Outline of Conditions Used in the Current Study ....................................................... 106
Table 19: Item Difficulty Statistics by Passage and Individual Questions by Reading Group
presented in Percentage of Item Correct Responses. .................................................................. 107
Table 20: Means and Standard Deviations on Passage Accuracy by Reading Group, Presentation
Rate, and Use of Pause by Reading and TTS Voice. .................................................................. 110
Table 21: Results of 3 (Presentation Rate) by 3 (Use of Pause) between 2 (Reading Group) by 2
(TTS Voice) ANOVA for Passage Accuracy. ............................................................................ 111
Table 22: Student Preferences for Different Presentation Conditions on a Five Point Likert Scale
in Raw Scores. ............................................................................................................................ 112
Table 23: Correlations of Language and Literacy Measures ...................................................... 113
Table 24: Number of Students for Grade, Group, and School .................................................... 114
Table 25: Means and Standard Deviations of Raw and Standard Scores for Group on the
Language and Literacy Measures with Group Comparisons ...................................................... 115
Table 26: Results of One-way ANOVA for Main Effect of Group on Language and Literacy
Measures ..................................................................................................................................... 117
Table 27: Correlations between DEEdee and Freddy/Eddy Tasks and Language and Literacy
Measures by Ability Group ......................................................................................................... 118
Text-To-Speech and Language Profiles xi
List of Figures
Figure 1: Procedure for Pseudoword Discrimination Task. ........................................................ 119
Figure 2: Procedure for Real Word Discrimination Task. .......................................................... 120
Figure 3: Example of Sentence Compression Task item. The target sentence is “There is the sun”
(Markwardt, 1997). ..................................................................................................................... 121
Figure 4: Item Analysis for Accuracy Scores on Pseudoword Discrimination Task by Voice
Type. ........................................................................................................................................... 122
Figure 5: Item Analyses on Accuracy Scores for Real-Word Discrimination Task by Voice. .. 123
Figure 6: UTReader with XML tags inserted at phrase boundaries before rendering. ............... 124
Figure 7: UTReader after rendering XML file. This is the view the students were exposed to. 125
Figure 8: Mean Correct Responses: Interaction between Presentation Rate and TTS Voice by
Reading Group. ........................................................................................................................... 126
Figure 9: Interaction of TTS Voice by Use of Pause on Mean Accuracy Scores. ...................... 127
Figure 10: Comparison of Groups on Language and Literacy Measures ................................... 128
Figure 11: Count of Number of Correct Answers to DEEdee Questions by Ability Group ...... 129
Figure 12: Count of Number of Correct Answers to Freddy/Eddy Questions by Ability Group 130
Text-To-Speech and Language Profiles xii
List of Appendices
Comprehension Test Passages …………………………………………………………………149
TTS Study Passage Comprehension Form and Survey………………………….……………..150
Text-To-Speech and Language Profiles 1
Chapter 1 Intelligibility and Comprehensibility of Low and High Quality Text-To-Speech Voices for Students with and
without a Reading Disability
Abstract
Text-to-speech (TTS) software converts text on a computer screen into audible speech, and may
be used to help students with a reading disability circumvent decoding difficulties. This study
examined the intelligibility and comprehensibility that different TTS voices have for students
with a reading disability and controls. Experiment 1 compared 10 TTS voices and 2 Natural
voices to determine the lowest and highest quality TTS voice, and highest quality Natural voice.
In Experiment 2, grade 6 to 8 students with a reading disability (RD) and controls with no
reading disability were randomly assigned to one of the voice conditions and completed two
intelligibility tasks (pseudoword and real word discrimination) and one comprehensibility task
(sentence comprehension). To assess the cognitive processing load of the voices, response
latencies were compared. The lowest quality TTS voice resulted in the lowest accuracy scores
for intelligibility on the real word discrimination task, and was the least comprehensible on
sentence comprehension. Students with a reading disability performed significantly more poorly
than controls on all voice conditions in the real word discrimination and sentence comprehension
tasks. No interactions between student group and voice conditions were found. Findings support
the use of high quality TTS voices for students with or without a reading disability.
Text-To-Speech and Language Profiles 2
A primary difficulty for people with a reading disability is the decoding of written text. Over the
past decade, TTS programs have become a common tool used to help people with a reading
disability. TTS converts text inputted into a computer into synthetic speech. By circumventing
the need to decode words by presenting them auditorally, TTS is thought to enable people with a
reading disability to comprehend text more easily. Research to date has shown inconsistent
findings on the effectiveness of TTS with regards to passage comprehension (Strangman &
Bridget, 2005). This is surprising, as students with reading disabilities often have stronger
listening comprehension than reading comprehension skills (Badian, 1999).
The discrepancy in findings may be due to different characteristics of the TTS voices used in the
studies (i.e., not all TTS voices are created equal). For example, Mirenda and Beukelman (1990)
compared eight TTS voices with a natural voice and found not only that participants had more
difficulty understanding the TTS voices, but that there was significant variability in their
understanding of different TTS voices. Research on the comprehension of synthetic speech has
also found that the response latencies of adults varied amongst different TTS voices, and were
significantly longer in comparison to natural voices (Hux, Woods, Mercure, Vitko, & Scharf,
1998; Manous et al., 1985 cited in Duffy & Pisoni, 1992; Pisoni, Manous, & Dedian, 1987;
Reynolds & Fucci, 1998; Reynolds & Givens, 2001; Reynolds, Issacs-Duvall, Sheward, &
Rotter, 2000; Reynolds & Jefferson, 1999). This raises the question of what is different between
TTS and natural voices in regards to how well they are understood.
One difference between TTS and natural voices is in the quality of prosodic cues. Natural speech
is full of rich prosodic cues that help listeners identify individual spoken words and understand
the overall meaning and intention of oral communication. Prosody involves the "phonological
system that encompasses the tempo, rhythm and stress of language." (Whalley & Hansen, 2006,
p. 288). Prosody plays a role in the signaling of the boundaries of phonemes, words, phrases,
and sentences; additionally, prosody may reflect the emotional state of a speaker, such as anger
and amusement, and is used for irony and sarcasm. Prosody is used to emphasize an idea, and to
indicate if an utterance is a statement, a question, or a command. Essentially, it allows for the
communication of elements of language that are not encoded by grammar or vocabulary, through
variation in syllable length, loudness, pitch, and the formant of speech sounds (Scherer, 1979).
Text-To-Speech and Language Profiles 3
A great deal of research has been done to try to replicate prosodic cues with TTS. TTS voices,
such as the ones used in this study, are commonly generated through the use of what is known as
the waveform method, which links prerecorded natural speech units together. Although it is
beyond the scope of this paper to describe the waveform method in detail, there are two
important points to mention that relate to how TTS speech is generated and how TTS attempts to
synthesize prosody. Speech units are created from prerecorded natural speech and are divided
into specific segments (in the form of phones, diphones, phonemes, syllables, or words). For
each speech unit, the number of stored representations varies from one to several thousand.
More natural sounding TTS voices have hundreds to thousands of stored representations for each
speech unit (Schroeter, 2005A). When a TTS voice concatenates speech units together, it
performs a “join cost” calculation to minimize discontinuities between speech units. “Join cost”
analysis takes into consideration key features of speech units in order to choose speech units that
best match one another, and to minimize the "cost" or disjointed transition between units, thus
improving intelligibility (O’Shaughnessy, 2007). Because speech units are chosen from diverse
sources and each unit has distinctive acoustic boundaries (e.g., duration, pitch, intensity,
formant), if two speech units are joined together with different acoustic boundaries the result is
disjointed sounding speech. It is for this reason that diphones (the section of speech from the
middle of one phone to the middle of the next phone) make up the majority of speech units in
TTS voices as it is at the point of co-articulation that speech has the most variability. In addition,
acoustic filters are applied to modify the wave (intensity, duration, or pitch) which improves
intelligibility by lowering the join cost (Schroeter, 2005B). On the other hand, with natural
speech, the acoustic wave flows smoothly from phone to phone due to the natural ability of
people to co-articulate. As such, the speaker produces a cohesive utterance in a single speech
unit that does not sound disjointed. To get around the disjointed sound, some TTS voices
standardize the duration, pitch, and intensity throughout the utterance. The results are very low
join costs without disjointed transition, though the voice sounds monotone. In addition, these
voices do not require a large number of speech units as all sorted units are at about the same
pitch, intensity, and formant. In contrast, more dynamic TTS voices that have large number of
stored speech units do try to replicate prosody by having stored units with different pitch and
intensities. Though there are larger number of speech units sorted, the TTS voices needs a
method for trying to understand how to manipulate duration, pitch, and intensity to replicate the
prosodic cues within speech.
Text-To-Speech and Language Profiles 4
TTS voices use different methods to synthesize prosodic cues, with some methods resulting in
better quality prosodic replication (O’Shaughnessy, 2007). However, the prosodic cues of TTS
are not as sophisticated as with natural speech. For example, when a person reads aloud, they
naturally pause at main phrases, use pitch to accent an idea or change the duration of words or
phrases to create interest and draw attention to important information. TTS is not able to analyze
sentences sufficiently to replicate the same acoustic cues used by natural speakers. TTS voices
use a Natural Language Processor (NLP) that examines sentences for punctuation marks to help
determine when to use prosodic cues. For example, when the NLP sees a “?” it increases the
pitch of the last word preceding the “?”. If there is a comma, a pause is added. However,
prosody is not only communicated by grammatical marks. For example, speakers use intonation
to signal the end of a statement by lowering the pitch. For example, the pitch is lowered at the
end of Julianne parked the car to indicate the end of this statement within the sentence Julianne
parked the car in the parking lot.
In addition, prosody is involved in the communication of emotions such as anger, sadness, joy,
and surprise, all of which are not identified by grammatical markers. Thus, the task of TTS
adding prosodic cues is very difficult as text does not provide sufficient markers to inform a TTS
voice how to accurately synthesize prosody. To work around this, modern TTS voices use
statistical models of the sentences to predict the curve that represents the final pitch used to tone
the particular word, the durations of voice phones, and the presence of pauses (Chandak,
Dharaskar, & Thakre, 2010). However, TTS voices still have a long way to go to sound natural
(Eide, et al., 2003). There is considerable variation amongst TTS voices in how they generate
synthetic speech and how natural they sound.
Although developers of TTS voices do not provide detailed descriptions regarding the algorithms
used to reproduce speech, there are three important factors to consider. The first is the number of
speech units stored in a voice. Voices that have a greater number of speech units stored are able
to create smoother sounding speech. When there are more speech units to choose, a voice is able
to create lower joint costs as more samples of a speech unit are available at different pitches. A
second important difference between TTS voices is the quality of prosody replicated. Voices that
poorly replicate prosody may sound monotone and artificial. A third consideration is the NLP
used to create the voice. The NLP influence quality of prosody based on the punctuation and
homophones within a passage. TTS voices differ in regards to number of speech units, ability to
Text-To-Speech and Language Profiles 5
replicate prosody, and NLP, which all contributed to voice quality. As summarized by
O’Shaughnessy (2007), research suggests that proper choice of speech units is the greatest factor
in achieving “excellent naturalness” in TTS voices.In addition to subjective ratings of voice
quality, researchers have tried to compare the intelligibility and comprehensibility of TTS voices.
Intelligibility is the listener’s ability to recognize phonemes and words when presented in
isolation (Moody, Joost, & Rodman, 1987; Ralston, Pisoni, & Mullennix, 1989). In contrast,
comprehension involves a higher order cognitive process in which the listener constructs a
coherent mental representation of the meaningful information contained in a linguistic message
and relates this representation to previously or currently available information in memory
(Kintsch & van Dijk, 1978; Duffy & Pisoni, 1992). In regards to the intelligibility of natural
voices, each human voice is unique, with some being initially more intelligible than others. On
average, female voices and speakers that have larger vowel spaces are more intelligible
(Bradlow, Torretta, & Pisoni, 1996). However, people possess a remarkable ability to adapt to
different voices over a short period of time. Prosodic cues help listeners to identify the individual
spoken words of less intelligible natural voices, enabling them to understand the overall meaning
and intention of oral communication. Prosodic information helps natural voices achieve
intelligibility scores in excess of 99 percent (Hoover, Reichle, van Tassell, & Cole, 1987;
Mirenda & Beukelman, 1990).
Efforts to improve the intelligibility of TTS voices have continued over the last 30 years.
Mirenda and Beukelman (1990) found that TTS voices created prior to 1983 are significantly
less intelligible than voices created after 1983. Despite these improvements, children find TTS
voices to be less intelligible than do adults, whereas with natural voices research has found no
difference between these age groups (Drager, Reichle, & Pinkoski, 2010). For example, Mirenda
and Beukelman (1990) compared TTS voices to a natural voice using word verification and
sentence verification tasks with 7 to 8 year olds, 11 to 12 year olds, and adults. For the word
verification tasks, participants listened to a word presented auditorally and tried to select the
stimulus word from a list of written words. For the sentence verification tasks, the participants
verbally repeated the sentence they heard. Scores for both tasks were based on the number of
words correctly verified. On the word verification task, Mirenda and Beukelman (1990), found
no difference between the three age groups with the natural voice; however, all three age groups
scored significantly lower with the TTS voice, with the children scoring significantly lower than
Text-To-Speech and Language Profiles 6
adults when listening to TTS. On the sentence verification task, the adults showed no difference
in their intelligibility scores between the two types of voices, but children performed
significantly more poorly with TTS, with the 7 to 8 year olds scoring the poorest. Although the
authors suggest caution regarding the interpretation of the children’s results, having used a
difficult task, it is important to note that unlike with TTS, no difference was found between the
children and adults in the natural voice condition for both word and sentence verification.
A possible explanation for the discrepancy in intelligibility scores obtained from child and adult
TTS users may be the less developed language processing and working memory ability of
children. Several models of language processing have argued that working memory is a limited-
capacity system (Baddeley, 1996; Gathercole & Baddeley, 1993; Just & Carpenter, 1992). These
models argue that people have limited cognitive resources available for performing computations
such as listening and understanding. To comprehend speech successfully, one must actively
maintain and integrate the linguistic material in working memory. When the demands of a task
exceed the available cognitive resources, the storage and processing of the information is
compromised. Research on adults has shown that as the syntactic complexity of a sentence
increases, it takes longer to read the sentence, and adults with lower working memory ability
make more comprehension errors (King & Just, 1991). Children have considerably more limited
working memory capacity in comparison to adults (Case, 1985; Dempster, 1981), however this
capacity develops over time (see Gathercole, 1998). Research on children has also found that
auditory working memory ability can be used to distinguish typically developing children from
those with a language impairment (Conti-Ramsden, Botting, & Faragher, 2001; Conti-Ramsden
& Hesketh, 2003; Gray, 2003), and that there is a strong positive correlation between auditory
working memory ability and reading ability (Gathercole, Alloway, Willis, & Adams, 2006).
Due to their more limited working memory ability, it is not surprising that when children are
presented with impoverished acoustic codes such as those generated by TTS, they do not
recognize words and sentences as accurately as adults. This is especially true for students who
have a RD and working memory difficulty (Siegel, 1994; Swanson, 1994; Swanson H. L., 1999;
Swanson, Ashbaker, & Carole, 1996). Having lower working memory may predispose students
with RD to having poorer intelligibility scores when listening to TTS versus a natural voice.
Text-To-Speech and Language Profiles 7
In addition to their working memory weakness, a key trait of students with a RD is difficulty
processing phonological information and poor phonological awareness. Phonological awareness
is the metacognitive and associated skills needed to understand and manipulate the small units of
sound that comprise speech (Shankweiler & Fowler, 2004). The National Reading Panel (2000)
reported that, once letter knowledge has been acquired, phonological awareness is the strongest
predictor of reading ability. Indeed, students with a RD, in comparison to their peers, perform
more poorly on tests of phonological awareness that assess the ability to segment, isolate, and
blend phonemes (Wagner & Torgesen, 1987; Torgesen, et al., 1999). Mitterer and Blomert
(2003) report that when listening to TTS in comparison to natural speech, individuals with a RD
are poorer at identifying two phonemes in a continuous range, for example, /ta/ to /ka/. Age-
matched controls do not have difficulties with the task. In the natural condition (human voice),
there was no different in the accuracy rate between age-matched controls and RD students when
listening to naturally presented sound segments. However, there was a significant difference in
accuracy when sound segments were generated using TTS. The students with a RD had
significantly lower accuracy scores in comparison with the age-matched controls (Mitterer &
Blomert, 2003). These results underscore the possibility that the intelligibility scores of RD
children with poor phonological processing and working memory will be negatively affected by
less than optimal TTS voice quality.
Furthermore, it might be argued that if intelligibility suffers with TTS, so would
comprehensibility. While many studies have examined the intelligibility of TTS voices,
relatively few have investigated their comprehensibility. Studies that have compared the
comprehensibility of TTS with natural voices have found the comprehensibility of TTS voices to
be significantly poorer (Hux, Woods, Mercure, Vitko & Scharf, 1998; Reynolds & Fucci, 1998;
Reynolds, Issacs-Duvall, Sheward & Rotter, 2000; Reynolds & Jefferson, 1999).
Comprehensibility is expected to suffer when TTS voices have poor intelligibility as cognitive
resources are taxed by trying to understand individual words, reducing available resources for
comprehension of the overall meaning of the text. The main measure of comprehensibility has
been the response latency between the end of the presented stimuli and the response by subjects
to a task. Duffy and Pisoni (1992) have postulated that response latency can capture the
processing cost of TTS and natural voices. That is, greater response latencies imply the use of
more cognitive resources in order to comprehend.
Text-To-Speech and Language Profiles 8
Research has found that children’s response latency time is affected by age, ability, and whether
they listen to a natural or TTS voice. One study compared two age groups (6 to7 year olds and 9
to 11 year olds) who listened to either TTS or natural voices. The children listened to three-word
sentences and were instructed to hit a button indicating whether they believed each sentence was
true or false. The response latencies of correct responses were significantly longer with the TTS
voices (Reynolds & Jefferson, 1999). In addition, there was a significant age effect with older
children being faster than younger children. Similar findings were reported in a study comparing
students with a Specific Language Impairment with non-disabled students on a similar task. Both
groups responded significantly faster to natural voices than TTS, with the students with a
Specific Language Impairment having longer response latencies overall (Reynolds & Fucci,
1998).
Research has also found that the comprehension scores of students vary depending on the TTS
voice they listen to (Koul & Hanners, 1997). Participants were 10 individuals with intellectual
disabilities and 10 non-disabled students with a mean age of 8 years – 7 months (SD=5-6). For
the current discussion, only the students’ results will be reported. Using a sentence verification
task, these students listened to three TTS voices: two DECtalk voices (Perfect Paul and Beautiful
Betty) and RealVoice. The students were presented with sentences and asked to indicate whether
they were true or false. Participants had significantly higher accuracy scores (i.e., their
comprehension was better) and shorter response latencies when listening to the two DECtalk
voices than with RealVoice. The authors concluded that students have a harder time
comprehending lower quality TTS voice (RealVoice). In summary, the longer response latencies
observed with TTS in comparison to natural voices, and with low quality in comparison to high
quality TTS voices, may be due to greater demands on cognitive resources (Koul & Hanners,
1997; Reynolds & Jefferson, 1999).
Research has also investigated the effect of increased exposure time to TTS on comprehension,
by allowing the cognitive system to adapt to the impoverished acoustic signal (Reynolds, Isaacs-
Duvall, and Haddox, 2002). In one study, twenty young adults listened to both a recorded natural
voice and the DECtalk synthesized voice (TTS) for 30 minutes a day over 5 consecutive days.
After hearing a sentence read to them they selected a “yes” or “no” button to indicate if they
thought the sentence was true or false. The latency between the end of the sentence and the
correct response was also recorded. Only correct responses were included for analysis as they
Text-To-Speech and Language Profiles 9
suggest comprehension of the sentences. Results showed that with both the natural and TTS
voices, response latency only decreased significantly from day 1 to day 2. Response latencies
continued to shorten throughout the 5 days of practice, but the gap between response latencies of
the different voices did not close. The practice effects from day 1 to day 2 accounted for 88.2%
of the reduction in response latency for the TTS voice across the 5 days (Reynolds, Issaac-
Duvall, & Haddox, 2002). The authors concluded that the participants were able to better
comprehend the TTS on the second day due to more efficiently processing the impoverished
acoustic signal.
Although a significant improvement in response latency only occurred between day 1 and 2, the
response latencies were shorter with each additional day of practice. To determine whether a
more significant practice effect could occur with even more exposure to TTS, Reynolds and his
colleagues (2002) did a linear model analysis to project across time whether enough exposure
could eventually eliminate the difference in response latency between the TTS and natural voice.
It was found that at no point would the response latency between a TTS and natural voice
intersect. Reynolds et al. (2002) concluded that although practice at listening to a voice (natural
or TTS) improves the ability to process its acoustic signals, TTS will always require an
additional cognitive load (see Koul, 2003 for a review).
As such, students with a RD who use TTS software face two difficulties. First, they are presented
with synthetic speech that is less intelligible than natural speech, which is particularly difficult
for them due to their difficulty with phonological processing. Second, compared to natural
speech, the poorer intelligibility of TTS requires additional working memory, which is a deficit
for many students with a RD. Although TTS is often used to help students with a RD overcome
their decoding difficulties, the impoverished intelligibility of TTS voices presents challenges to
other areas of cognitive weaknesses (i.e., phonological processing and working memory) that are
common in this population.
An investigation was required to determine the influence that TTS and natural voices have on
intelligibility and comprehensibility when used by individuals with a reading disability. Two
experiments were conducted to explore this question. Experiment one investigated the perceived
quality of a variety of TTS voices in comparison to two natural voices. Although past research
has compared TTS voices (O’Shaughnessy, 2007), it was important to examine a range of TTS
Text-To-Speech and Language Profiles 10
voices currently used in the education system. As such, a sampling of TTS voices commonly
used in the Ontario education system were chosen for the comparison. It was expected that more
recently developed TTS voices, which have a greater number of speech segments and produce
more prosodic cues, would be rated as higher in quality. The second experiment compared the
intelligibility and comprehensibility of the lowest and highest quality TTS voice and a natural
voice in students with and without RD. Intelligibility and comprehensibility of the voices were
assessed using both accuracy and response latency measures. It was hypothesized that as the
quality of the voices increased, so would intelligibility and comprehensibility. Furthermore, in
comparison to non-disabled students, the intelligibility and comprehensibility scores of students
with a reading disability were expected to be poorer overall.
Experiment One
The aim of this experiment was to rate the perceived quality of commonly used TTS voices in
the Ontario education system. Participants listened to a variety of TTS voices and natural voices,
then rated them. It was hypothesized that newer TTS voices would be rated as higher quality
than older TTS voices.
Method
Forty students (21 females; 19 males) from the University of Toronto participated in the study.
Participants were recruited around the university and consented to take part in the study. The
participants ranged in age from 18-6 to 53 years (M=28-1, SD=11), and all participants endorsed
that they spoke English proficiently, with 62.5% speaking English as their first language.
Twenty-five percent of participants were attending an undergraduate program, and 75% attended
a graduate program (42.5% Bachelors of Education, 25% Masters of Art, and 7.5% in a
Doctorate of Philosophy; see Table 1).
Insert Table 1 about here
Text-To-Speech and Language Profiles 11
Materials:
Materials included MP3 players that stored the 10 computer generated voices and 2 natural
voices, and Sony MDR-V150 headphones. Five different TTS voice developers were chosen,
including AT&T, Acapela, ScanSoft, Microsoft, and NeoSpeech. The voices chosen are widely
used in the Ontario educational system. Each developer produces a variety of voices, and the
newest male and female voices available from each developer were chosen (except for ScanSoft,
for which only a female voice was used). The name and manufacturer of each voice can be
found in Table 2. The chosen TTS voices were compared with a male and female human voice.
The “natural” voices were undergraduate students associated with the project who were deemed
by the primary investigator to have clear articulation.
Insert Table 2 about here
Procedure:
The ten TTS voices recited the same phrase at the default speed (approximately 160wpm), as did
the two natural voices that also approximated 160wpm. The phrase used, "The girl with the bow
in her hair was told to bow deeply when greeting her superiors", is frequently used in TTS
research. The same phrase was used to allow participants to make comparisons across voices.
MP3 players were loaded with the twelve voices, and the presentation of voice order was
randomized. After consenting to take part in the study, participants listened to all 12 voices.
After participants listened to a voice they answered 3 questions, and their responses were
recorded on a 5-point Likert scale. The questions asked were as follows:
1. What does the voice sound like? A response of 1 indicated that the voice sounded like a
computer, and a response of 5 indicated it sounded like a human.
2. How well do you understand the voice? A response of 1 indicated they did not understand
the voice well, and a response of 5 indicated they understood the voice very well.
Text-To-Speech and Language Profiles 12
3. Would you choose to listen to this voice? A response of 1 indicated they would not choose
to listen to this voice at all, and a response of 5 indicated they would definitely choose to
listen to this voice.
Results
First, a correlation between the three questions was conducted. As shown in Table 3, all
questions correlated highly with each other, ranging between r=.53 and r=.71. Due to the high
correlation values, scores from the three questions were averaged to create a Voice Quality
Index. Voices with a high Voice Quality Index score had been rated as sounding more like a
human, as being easier to understand, and as being a voice that participants were more willing to
listen to. As shown in Table 4, the voices are ranked from highest to lowest quality based on
their Voice Quality Index score.
Insert Table 3 about here
Insert Table 4 about here
A one-way repeated ANOVA between voices was carried out on the Voice Quality Index score.
The results indicate a significant voice effect on the Voice Quality Index, F(11, 370)=37.43
MSE=.67, p<.001, η2=.53. Post hoc tests using the Tukey HSD test indicated that the natural
voices had significantly higher Voice Quality Index scores than any of the TTS voices. AT&T
Crystal, AT&T Mike, Acapela Ryan, Neospeech Kate, and Neospeech Paul had significantly
lower Voice Quality Index scores than the natural voices, but did not significantly differ from
each other. All of the Microsoft voices (Mary, Sam, and Michael) had significantly lower Voice
Quality Index scores compared to the other voices, with none of the Microsoft voices being
significantly different from each other (see Table 5). As such, AT&T Crystal was selected as the
High Quality TTS voice as it received the highest Voice Quality Index score of the TTS voices.
Microsoft (MS) Mary, having achieved the lowest female TTS Voice Quality Index score, was
selected as the Low Quality TTS voice.
Text-To-Speech and Language Profiles 13
Insert Table 5 about here
Experiment 2
The goal of the second experiment was to compare the intelligibility and comprehensibility of
high and low quality TTS voices and a natural voice with both reading disabled and non-reading
disabled middle school students. All of the voices compared in Experiment 2 are female, as
research has shown that female voices are more intelligible than male voices (Bardlow, Torretta,
& Pisoni, 1996). Three voices were compared that vary in the extent to which they provide
prosodic cues. The lowest and highest quality female TTS voices from the first experiment were
compared with the highest overall rated voice (a natural voice). It was expected that the natural
voice would have the greatest intelligibility and comprehensibility, followed by the high quality
and low quality TTS voices, respectively, with the controls outperforming the RD students in all
three voice conditions.
Intelligibility was assessed with a pseudoword discrimination task and a word discrimination
task. Pseudowords are phonetically accurate but are not actual words in the English language. It
was hypothesized that all students would have greater difficulty discriminating pseudowords
produced by the low quality or high quality TTS voices, respectively, in comparison with the
natural voice. It was also expected that students with a RD would perform more poorly in each
condition. This would be consistent with research that has found that students with a reading
disability perform more poorly on pseudoword naming tasks in comparison to students who do
not have a reading disability (Stanovich, Siegel, & Gottardo, 1997).
Regarding the word discrimination task, it was hypothesized that there would be a main effect
for voice, such that students listening to the natural or high quality TTS voice would have greater
intelligibility scores than those who listened to the low quality TTS voice. There would also be a
significant interaction in that both students with a RD and controls would have lower
intelligibility scores for the low quality TTS voice. Higher quality voices should yield an
increase in intelligibility scores, with RD students showing consistently lower performance than
controls. No group difference was expected for the natural voice. It is thought that the high
Text-To-Speech and Language Profiles 14
quality TTS voices and the natural voices would not put the same demands on working memory;
this interaction is expected given that the WM demands of the low quality TTS voices will
exceed the cognitive resources of students with a RD.
Comprehensibility was assessed with a task where participants were asked to listen to sentences,
and following each sentence they were asked to select a picture from a set of four that best
matched the sentence. An interaction between the two reading groups and the voices was
expected. It was hypothesized that due to the increased demand on WM, RD students would
have a significantly lower comprehension score when listening to the low quality TTS than
controls. For the high quality TTS, both RD and controls were expected to have significantly
improved comprehension scores with the RD students showing greater positive change from the
low quality TTS. That is, the gap between RD and control scores would decrease from the low to
the high TTS condition. With the Natural voice, no change in comprehension scores was
expected in the control condition, but the RD students were expected to show gains in
comprehension scores to the extent that there would be no significant difference between RD and
controls.
In addition, the cognitive load involved in processing the three intelligibility and
comprehensibility tasks was evaluated based on response latencies. It was expected that students
with a RD would have longer response latencies than controls due to their working memory
difficulty. It was also hypothesized that an interaction would be found between Voice and Group.
That is, a greater difference in response latency was expected between the two student groups
when listening to the low quality TTS, with a smaller difference when listening to the high
quality TTS and Natural voice, respectively. This is expected as the low quality TTS voices will
place greater working memory demands on the students. RD students who have impoverished
working memory will have substantially greater difficulties comprehending the low quality TTS
voice. As the quality of the voice increases (high quality TTS and Natural), then the demands on
working memory for these students will decrease and they will have substantially higher
comprehension scores. The controls are thought to also have a significantly harder time
comprehending the low quality TTS voices, though the high quality TTS and natural voices are
thought to be similar. As the RD students’ comprehension scores will continue to increase over
the three voice conditions, and the controls will remain the same for high quality TTS and
natural, the differences between the RD and the controls will decrease.
Text-To-Speech and Language Profiles 15
The Moment-to-Moment Variability in response latency was also investigated. Moment-to-
Moment Variability analysis assesses within-subject variability on a task. This is measured by
examining the within-subject standard deviation. If a participant has a very small standard
deviation it indicates a very consistent response pattern as the response latency remains about the
same. However, if a participant has a greater standard deviation on the reaction time scores, this
indicates that their response latency is quicker for some items and longer for other items. It was
assumed that greater Moment-to-Moment Variability in response latency suggests that some
items required less cognitive processing and therefore lead to quick responses, whereas more
cognitively challenging items demand longer processing time and results in longer response
latency. It was expected that students with a RD would have greater Moment-to-Moment
Variability in response latency due to their difficulty with processing auditory information and
limited WM.
The hypothesized response latency and Moment-to-Moment Variability results for Voice
conditions was as follows:
1) The low quality TTS voice would result in longer response latencies due to poor
intelligibility, but less Moment-to-Moment Variability due to consistently producing a
poor speech signal, in comparison to the high quality TTS and Natural voice.
2) The high quality TTS voice would result in a shorter response latency and would have
less Moment-to-Moment Variability than the low quality TTS voice due to greater
intelligibility.
3) The Natural voice would have the shortest response latency of the three voice conditions
due to its superior intelligibility, and the least Moment-to-Moment Variability as it would
produce the most consistent speech signal.
Methods
Participants
The participants, middle school students (grade 6, 7, and 8) in the Greater Toronto Area, came
from nine schools within two school boards. Students were nominated to take part in the study
by their teacher. Teachers who nominated students with a reading disability were asked to
Text-To-Speech and Language Profiles 16
nominate other students from the same classroom to be control students. The students were
divided into two groups based on their Ellision and Word ID scores. Students whose scaled
scores were one standard deviation below the mean on both Ellision and Word Identification
were placed in the RD group. Students who scored in the average range or higher on Ellision and
Word Identification were placed in the Control group. Those who scored one standard deviation
below the mean on only one of the measures were not included in the analysis. As such, a total of
10 students were removed as they did not meet the criteria. The RD group was comprised of 45
students (21 female, 19 males), with a mean age of 12 years – 3 months (SD=13.38 months). The
Control group was comprised of 45 students (30 female, 15 males), with a mean age of 12 years
– 2 months (SD=10.304 months). There were no differences between the two groups on age;
however, there was a significant group difference for schools, Pearson χ2(5, n=90)=18.62, p<.01.
As can be seen in Table 6, more RD students came from school 4 and 5, whereas more of the
Control Students came from school 3.
Insert Table 6 about here
Materials
Language and Literacy tests
Nonverbal reasoning: Nonverbal reasoning will be measured using the Matrix Analogies Test
(Naglieri, 1989). The task requires that the students point to the design that completes the
pattern. This measure was administered to all participants to ensure that their reasoning ability
was broadly within the average range.
Working Memory: Digit Span from the Wechsler Intelligence Scale for Children-Fourth
Edition (WISC-IV) was used to assess working memory. In Digits Forward, students are asked
to repeat back number strings starting with four digits. The number of digits is increased until
the student makes errors on both trials of a given length. Digits Backwards has students repeat
back a string of digits in reversed order. Digits Forward and Digits Backward were added
together to create the overall Digit Span score, and will be referred to as WM.
Text-To-Speech and Language Profiles 17
Phonological Awareness: The Ellision subtest of the Comprehensive Test of Phonological
Processing (Wagner, Torgesen, & Rashotte, 1999) was administered. In the Ellision subtest,
students say a word without saying a part of the word (e.g., “Say toothbrush without saying
tooth”). Testing is discontinued after three consecutive errors.
Listening Comprehension: The Listening Comprehension subtest of the Woodcock Language
Proficiency Battery (Woodcock, 1991) was used to evaluate oral language proficiency. Students
are asked to provide the final word of orally-presented sentences (e.g., “this is a snake”). After
six consecutive errors, testing is discontinued.
Decoding Skill: The Word Attack subtest of the Woodcock Reading Mastery Test-Revised
(WRMT-R; Woodcock, 1987) was used to evaluate students’ ability to sound out words. The
Word Attack subtest consists of 50 pseudowords (e.g., “tat” and “op”) that comply with English
phonology. Testing stops after 6 consecutive errors. It should be noted that the WRMT-R was
used and not the Woodcock Reading Mastery Test-Revised/Normative Update (WRMT-R/NU;
(Woodcock , 1998). It has been reported elsewhere that the WRMT-R/NU systematic inflates 5
to 9 standard scores from the WRMT-R (Pae, et al., 2005) and that the WRMT-R better reflects
the true ability of student.
Word Reading: The Word Identification subtest of the WRMT-R will be used to evaluate the
children’s word recognition and pseudoword reading skills (Woodcock, 1987). On this subtest
students read as many real words as they can.
Reading comprehension: The Passage Comprehension subtest of the Woodcock Language
Proficiency Battery—Revised (WLPB-R; Woodcock, 1991) was used to evaluate reading
comprehension. This closed passage test has students read brief but progressively more difficult
passages and fill in the missing words (“The house is bigger than the…”). Testing is
discontinued after six consecutive errors.
TTS and Natural Voices
Two TTS voices and one Natural voice were used for comparison in the study. The lowest and
highest quality female TTS voices were chosen based on the results of Experiment One. The
highest quality TTS voice was AT&T Crystal (AT&T, 2007), which is an example of more
Text-To-Speech and Language Profiles 18
recently developed synthetic speech, and is a commercially available synthetic voice production
software that has greater pitch and intonation control. AT&T Crystal received the highest ratings
in the first study for sounding the most like a human voice, being perceived as easier to
understand, and being the TTS voice to which participants were most willing to listen. The
lowest rated TTS voice was Microsoft (MS) Mary (Microsoft, 1998). This voice received the
lowest ratings in the first study, indicating it sounded more like a computer, was perceived to be
harder to understand, and participants indicated they were least likely to want to listen to this
voice. Both AT&T Crystal and MS Mary use a wave concatenation approach to string diphones,
phonemes, diphthongs, or syllables together to form words. AT&T Crystal has a larger number
of stored wave segments to choose from and is able to better approximate the prosody within text
(Beutnagel, Conkie, Schroeter, Stylianou, & Syrdal, 1998). In addition, AT&T Crystal has a
procedure that allows the TTS voice to examine the text structure to assign prosodic cues before
concatenation occurs. This allows for better production of prosodic cues in the TTS voice.
All auditory stimuli were synthesized using TextAloud TTS software (NextUp, 2008) at a
sampling rate of 16 kHz and 16-bits quantization and stored in a wave file.
For the Natural voice, a female college student with a Canadian (Mideast) English accent was
recorded. The student spoke into a Samson C03U Multi-Pattern USB Studio Condenser
Microphone positioned approximately 2 cm away from and slightly below her mouth.
The volume level of all sound files was set to a mean between 735.5 dB and 735 dB power using
Audacity (SourceForge.net, 2008) sound editing software. Apart from controlling for the overall
power of each sound file, the intensity of individual words and sounds varied depending on the
values used by the TTS program.
All wave files were saved on a hard drive for later playback.
Computer Hardware
The study used IBM Personal Computers 300PL with an Intel Pentium M, 2Ghz processor with
2GB of RAM, and a 70GB hard drive. The computer was loaded with Microsoft Windows XP
Professional Service Pack 2. E-Prime1 (Psychology Software Tools, INC, 2008) was also
installed. No other software was installed.
Text-To-Speech and Language Profiles 19
Headphones
The Sony Dynamic Stereo Headphones (MDR-Vi50) headset was used. The headphones have
frequency responses of 18Hz – 22,000Hz, a power handling capacity of 550Mw and a sensitivity
of 98dB/Mw.
Stimulus Presentation
The intensity level was set to a conversational level, at 79 dB (Bess & Humes, 1995). The rate
was set to 170 words per minute.
Intelligibility Measures:
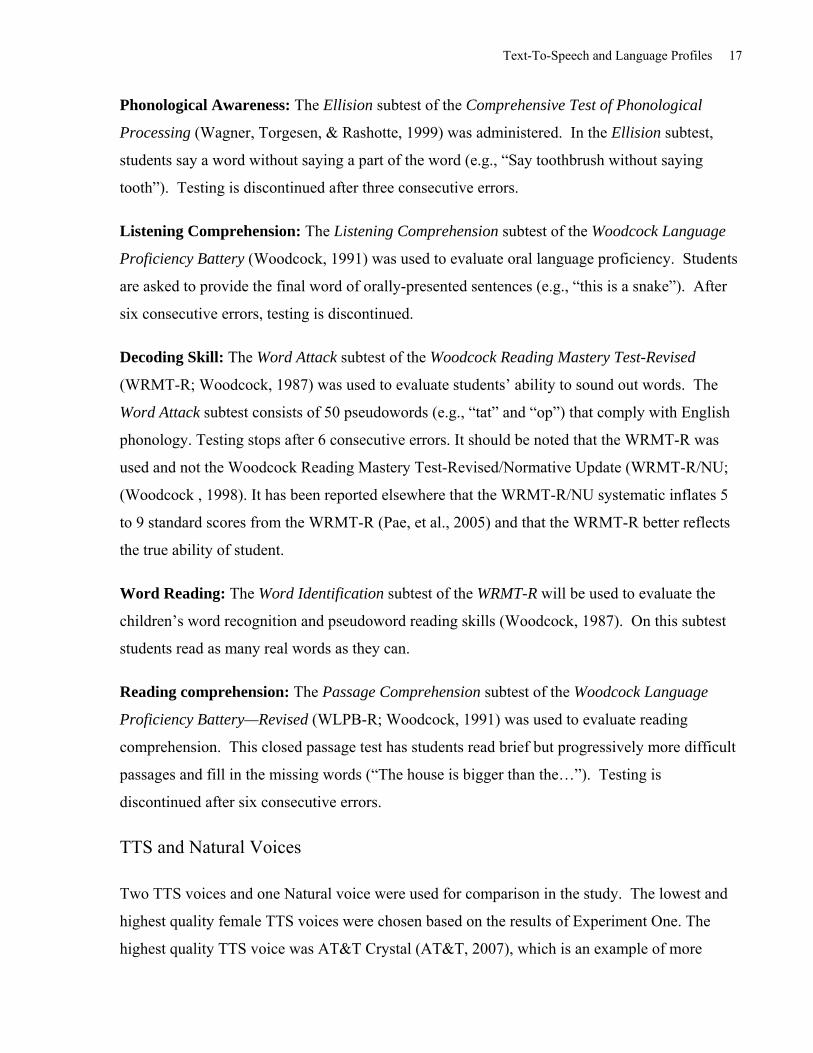
Pseudoword Discrimination Task: This task assessed intelligibility by testing the students’ ability
to discriminate between pairs of pseudowords (e.g. same: togg / togg or different: bish/ biss).
The pseudoword discrimination task was used as previously published studies have linked
discrimination to phonological skills (Moore, Rosenberg, & Coleman, 2005; Snowling, Chiat, &
Hulme, 1991; Van Bon & Van Der Pijl, 1997). In addition, administration of pseudoword
discrimination has been shown to consistently activate Brodmann’s areas 44 and 45, which have
been associated with the processing of phonological information among control individuals
(Medler, Medler, Desai, Conant, & Liebenthal, 2005; Mechelhi, et al., 2005). Therefore, the task
was used to investigate the different voices’ intelligibility for phonemes (phonological
awareness). In the present study, students were presented with a priming pseudoword, followed
by the sound of a bell for 500ms, and then the target pseudoword. Students were asked to
indicate if the two pseudowords were the same or different. To indicate that the words were the
same they pressed the [v] key, and pressed the [n] key to indicate that the words were different
(see for diagram). Students first had to achieve an 80% accuracy rate on trial items before the
program allowed them to begin the main test. They were then presented with 34 test items, which
were adopted from the WEPMAN Pseudoword Task (see (Wang & Geva, 2003). The software e-
Prime V1.0 (Psychology Software Tools Inc, 2008) was used to record reaction time in
hundredths of milliseconds. Two scores were gathered: accuracy and reaction time.
Insert Figure 1 about here
Text-To-Speech and Language Profiles 20
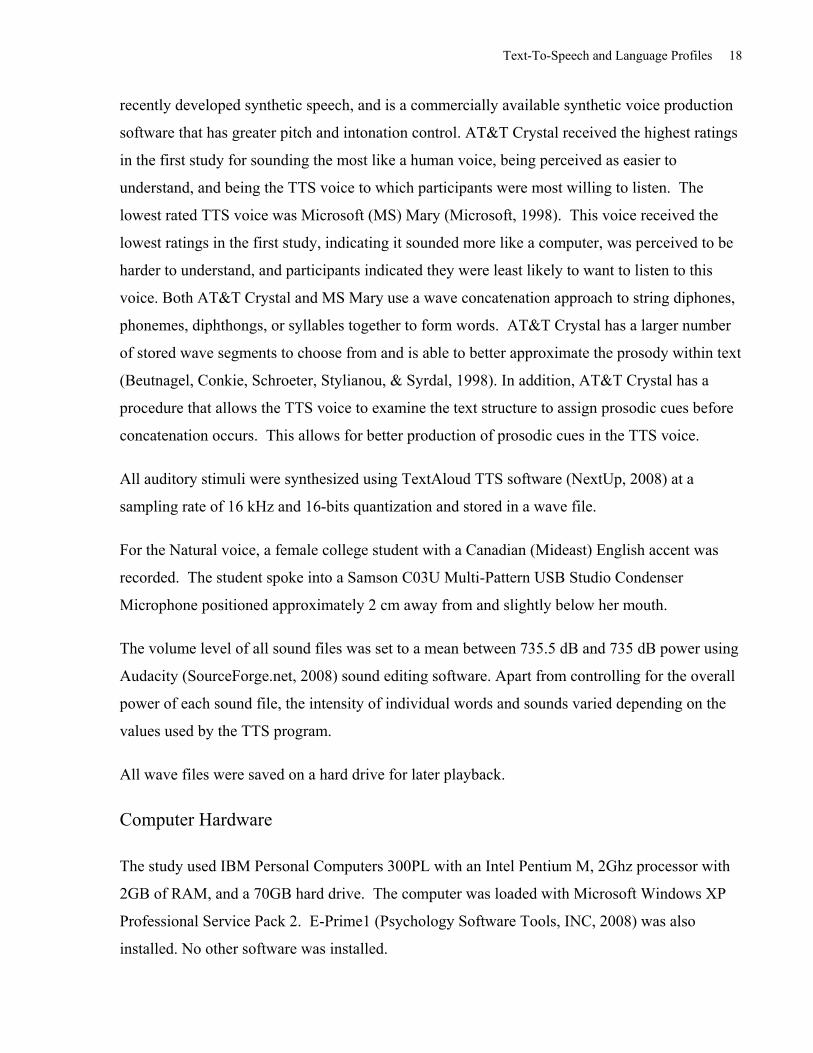
Word Discrimination Task: This task assessed intelligibility by measuring the students’ ability
to discriminate between real word pairs (e.g. book / book or coast/ toast). This task was chosen to
investigate word intelligibility between the different voices. Like the pseudoword discrimination
task, a student first heard a priming word followed by a bell for 500 ms, and were then presented
with the target word (see Figure 2for diagram). Similar to the Pseudoword Discrimination Task,
the participants had to achieve an 80% accuracy rate on trial items before proceeding to the main
task. Students were asked to press the [v] key if the words were the same, or the [n] key if they
were different. For this test, 53 word pairs were presented For this task e-Prime V1.0
(Psychology Software Tools Inc, 2008) was also used to record reaction time. Again, accuracy
and reaction time scores were gathered.
Insert Figure 2 about here
Comprehensibility Measure:
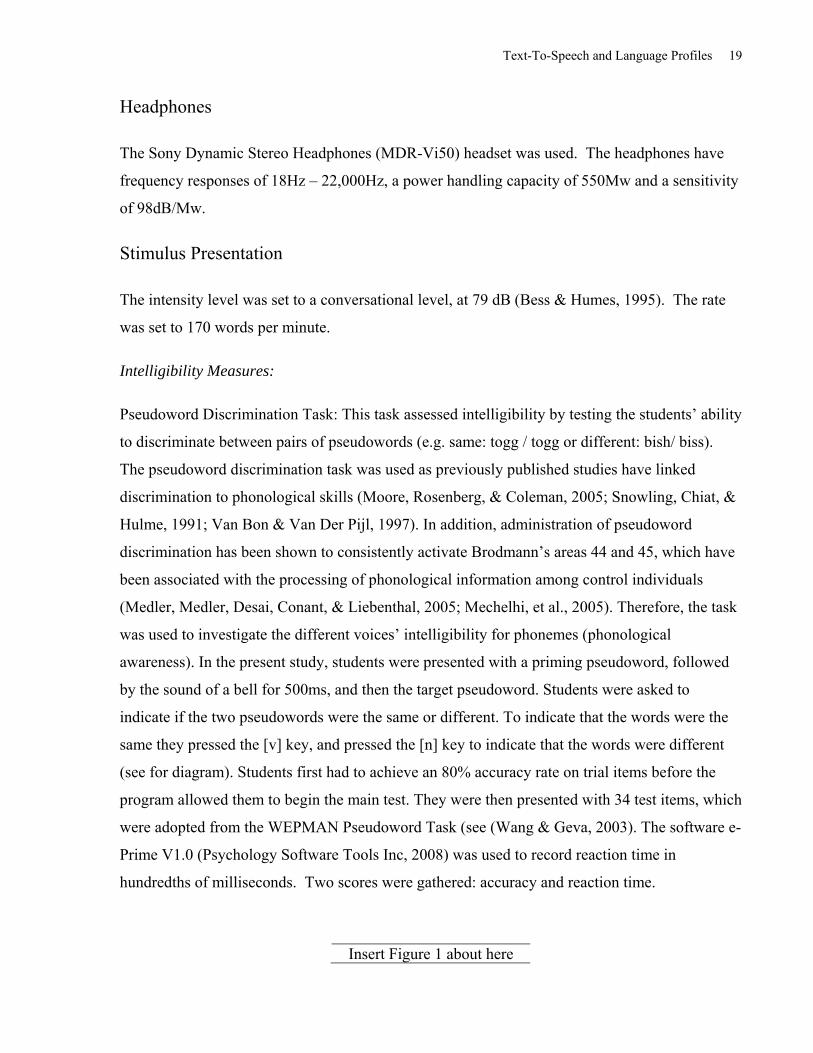
Sentence Comprehension Task: The aim of this task is to assess the ability to understand spoken
sentences (see Figure 3 for an example for the statement “Here is the sun”). This is achieved by
having a student listen to a sentence spoken aloud, after which the student chooses from 4 line
drawings the one that accurately represents the sentence. Students used their dominant hand to
hit the keys from 1 to 4 on the computer keyboard. Recent research into the comprehensibility of
TTS has used the method of presenting a sentence then having the listener choose a
corresponding picture (Koul & Clapsaddle, 2006) as it provides both an accuracy score and
reaction time score. In the current study, the Reading Comprehension subtest of the Peabody
Individual Achievement Test – Revised (PIAT-R; Markwardt, 1997) was modified for the study
in that only the first 70 items were used as the remaining 30 were deemed to be too difficult. The
first 70 items were chosen based on the norms which have shown that 75% of grade 7 students
answer them correctly. The items were scanned onto a computer. E-Prime V1.0 (Psychology
Software Tools Inc, 2008) was used for the recording of reaction times. Two scores were
gathered; accuracy and reaction time. Accuracy scores were based on the number of correctly
identified images, with reaction time being the period between the end of the stimulus and the
selection of one of the drawings.
Text-To-Speech and Language Profiles 21
Insert Figure 3 about here
Setting
Sessions were carried out in a room at the participating schools. The rooms used were often in
the main offices or close to the participants’ classrooms. Only the experimenter and participant
were present during experimental sessions. Environmental noise was measured at the beginning
of each testing session with a sound level meter (Scosche SPL1000F), and the average noise
level was 62 (SD=11) dB.
Procedure
After school board officials, school principals, and classroom teachers agreed to participate in
the study, classroom teachers distributed a letter and consent form to students that described the
study. Students whose parents consented were enrolled in the study. The students participated
over two sessions. Trained research assistants and the author worked with the students. In the
first session, students were informed about the study, assent was obtained, and language and
literacy test batteries were administered. During the second session, students were randomly
assigned to one of the voice conditions (MS Mary, AT&T Crystal, Natural) and listened to their
assigned voice read for 30-minutes to expose the students to the voice. Research has shown that
with 30 minutes of exposure to high quality TTS voice, the intelligibility scores of non-disabled
adults increased by 88.2%. After listening to the TTS voice for an additional 30 minutes,
however, no significant increase in intelligibility was found (Reynolds et al. 2000). Following
the voice familiarization process, the students completed the Pseudoword Discrimination Task,
the Word Discrimination Task, and the Sentence Comprehension Task. Testing took place
between March and June of 2009 and was conducted by research assistants and the principal
investigator.
Statistics
The aim of the second experiment was to identify if there was a difference in accuracy, mean
reaction time, and Moment-to-Moment Variability in reaction time scores on the Pseudoword
and Word Discrimination Tasks, and the Sentence Comprehension Task as a result of listening to
Text-To-Speech and Language Profiles 22
the different voices (MS Mary, AT&T Crystal, and Natural). In particular, the goal was to
identify whether students with a reading disability perform more poorly on these tasks under
these condition than controls.
To answer these questions a 2 (Group) by 3 (Voice) two-way ANOVA was conducted for each
of the tasks. All assumptions of the two-way ANOVAs were met prior to running the analyses.
Post-hoc analyses were conducted on main effects and interactions that were significant.
Accuracy scores were converted to percentage of items correct for comparison purposes (see
Table 8).
To evaluate cognitive load, two aspects of reaction time were analyzed: mean reaction time for
Response Latency and the average standard deviation for Moment-to-Moment Variation.
Reaction time was measured in milliseconds (ms), and only correct responses were analyzed. A
minimum reaction time of 100 ms was set for responses to be included in the analysis as it has
been demonstrated (Segal-Seiden, 1997) that this is shortest time possible for the psychological
processes of stimulus perception and motor response. The maximum reaction time limit was set
at 3000 ms as it may be argued that any additional time may indicate that a participant did not
pay adequate attention and correct responses could be attributed to lucky guesses.
Results
Cognitive and Language Profile of RD and Controls
The language and literacy skills of the participants were assessed. The test battery measured their
nonverbal reasoning, oral language comprehension, phonological awareness, decoding, sight
recognition of individual words, and reading comprehension. Comparisons between the RD and
Control groups were carried out using multiple paired t-tests using the Bonferroni multiple-
significance-test correction. Means and standard deviations of raw scores are presented in Table
7. On all tests, students with a RD scored significantly lower than Controls.
Insert Table 7 about here
Text-To-Speech and Language Profiles 23
The results of the language and literacy tests demonstrate significantly lower performance for the
RD group in all areas assessed. This is surprising as extant literature suggests that in the areas of
nonverbal reasoning, listening comprehension, and receptive vocabulary, the groups would not
have differed. However, this RD group appears to represent a lower functioning group of RD
students than would be typically found in the regular population.
Pseudoword Discrimination Task
Prior to analyzing pseudoword scores, items 1, 2, 24, and 26 were removed due to systematic
errors in computer scoring.
A 2 (Group: RD vs. Control) x 3(Voice” Low Quality TTS, High Quality TTS, Natural)
between-subjects ANOVA was conducted on Accuracy of the Pseudoword Discrimination Task.
The means and standard deviations for accuracy (percentage correct) for the two groups are
presented in Table 8. The ANOVA indicates no significant interaction between Group and
Voice, F(2, 85)=.69, MSE=1.28, p=.69. The Group main effect was also not significant, F(1,
85)=.02, MSE=3.37 p=.88, however, there was a significant main effect for Voice, F(2,
85)=6.85, MSE=89.92, p<.01, Partial η2=.14. Post hoc tests revealed that the students who
listened to the Natural and MS Mary voices had significantly higher accuracy scores than those
that listened to AT&T Crystal.
Insert Table 8 about here
The finding that MS Mary voices had significantly higher pseudoword discrimination scores than
AT&T Crystal were unexpected. To explore the unexpected finding, an item analysis was
conducted. As can be seen in Figure 4, there was an overall pattern of lower accuracy scores for
AT&T Crystal; however, there was one item (konn/komm) resulted in a considerably lower score
for MS Mary. Reanalysis of the konn/komm item showed that MS Mary did not articulate
/komm/ properly. As can also be seen in Figure 4, there was less item-to-item variability among
the voices when the same pseudowords were presented. When different pseudowords were
presented in a pair, there was greater item-to-item variability among the voices. However, MS
Text-To-Speech and Language Profiles 24
Mary produced the opposite pattern, as this voice resulted in the least item-to-item variability
when the items were different rather than when they were the same.
In addition, accurate response rate for AT&T Crystal on the Pseudoword discrimination task was
not better than chance for both the RD (z=.97, p>.05) or Control (z=1.31, p>.05). When students
were listening to AT&T Crystal presenting the pairs of pseudowords, they had a fifty percent
change at guessing if they were the same or different. As the two groups were not better then
chance, then it would be assumed that students were not able to distinguish between the pairs due
to the poor phonetic representation of the pseudowords.
Insert Figure 4 about here
Response Latency on the Pseudoword discrimination task was investigated. Descriptive statistics
for the two-way ANOVA for are presented in Table 9. There was no significant interaction
between Group and Voice regarding the Response Latency of correct responses, F(2, 89)=.02,
MSE=1042.20, p>.05. There was also no significant main effects for either Group (F(1,
89)=1.24, MSE=86158/18, p>.05) or Voice F(2, 89)=1.9, MSE=132445.03, p>.05. In regards to
Moment-to-Moment Variability, students that listened to MS Mary had significantly less
variability in their responses compared to the other voices. This was indicated through the main
effect for Voice F(2,89)=3.41, P<.05 η2=.077. Both the main effect for group and the interaction
of Group and Voice were not significant for Moment-to-Moment Variability (F(1, 89)=1.88,
MSE=47159.31, p>.05 and F(2, 89)=.147, MSE=3687.95, p>.05, respectively).
Insert Table 9 about here
Real Word Discrimination Task
Transformations were conducted for Accuracy and Mean Reaction Time for the Real Word
Discrimination Task. The Response Latency data were slightly skewed, therefore a squared
Text-To-Speech and Language Profiles 25
transformation was used. The transformed data resulted in no significant differences in results,
and therefore the untransformed data are reported.
No significant interaction between Group and Voice was found for Accuracy with the Real Word
Discrimination Task. There was a significant main effect for Voice F(88,2)=8.83, MSE=233.85,
p<.001, η2=.18 (see Table 10). Students who listened to either the Natural voice or AT&T
Crystal voice were significantly more accurate on the Real Word Discrimination Task than those
who listened to MS Mary. There was also a trend for Group effect F(88,1)=3.14, MSE=83.09,
p=.08. Overall, students with a RD obtained poorer Accuracy scores than controls.
No significant difference was found for Response Latency with the Real Word Discrimination
Task: main effect Group (F(1, 88)=.452, MSE=39279.65, p>.05), main effect Voice (F(2,
88)=.36, MSE=31213.94, p>.05), interaction between voice and group (F(2,88)=.05,
MSE=3958.88, p>.05). Regarding Moment-to-Moment Variability, there was a significant main
effect for Voice, F(82,2)=4.57, MSE-153103.29, p<.05, η2=.10 (see Table 10). Students who
listened to the Natural voice or AT&T Crystal had less Moment-to-Moment Variability in their
responses, showing they were more consistent in their speed of response. However, individuals
who listened to MS Mary had greater Moment-to-Moment Variability. There was no significant
main effect for Group (F(1,88)=1.38, MSE=47637.77, p>.05) and the interaction of Group and
Voices was also nonsignificant (F(2,88)=3.07, MSE=105882.23, p>.05).
Insert Table 10 about here
An item analysis was conducted to examine the interplay between individual Real Word
Discrimination task items by the different Voices. As can be seen in Figure 5, a similar overall
finding is observed for the Real Word Discrimination task as for the Pseudoword discrimination
task. When the pairs included “same” words or pseudowords there was no less variability then
when the pairs were “different”. In addition, there were more items that presented greater
difficulties for MS Mary (e.g. thought vs. taught; bale vs. gale) and less for AT&T Crystal and a
Natural voice. There was no one item that all three voices had low responses on consistently.
Text-To-Speech and Language Profiles 26
Insert Figure 5 about here
Regarding the intelligibility of the voices, the Pseudoword and Real Word Discrimination Task
produce different results. Students that listened to the Natural or MS Mary voices were more
accurate at the Pseudoword Discrimination Task than those who listened to AT&T Crystal. MS
Mary had significantly less Moment-to-Moment Variability in Response Latency. An item
analysis conducted to follow up on this unexpected finding revealed that when the pairs were
“different”, students listening to MS Mary were more accurate than when pseudowords were the
“same”. The pattern for Natural and AT&T Crystal voices was the opposite. For the Real Word
Discrimination Task, there was a trend for RD to have lower scores then controls. Both groups
of students listening either to the Natural or AT&T Crystal scored significantly higher than MS
Mary. This pattern was also reflected in the Moment-To-Moment Variability scores. MS Mary
had greater Moment-To-Moment Variability in Reaction Time over the other two voices. Unlike
the Pseudoword Discrimination task, all voices showed less item difficulty when the words pairs
were the “same” than when they were “different”.
Comprehensibility
A two-way ANOVA for Accuracy with the Sentence Comprehension Task revealed no
significant interaction of Group and Voice (F(2,88)=.145, MSE=17.491, p>.05; See Table 8 for
descriptive statistics). There was a significant main effect for Group F(83,1)=3.72, MSE=679.29,
p=.05 η2=.05. Comparing the means of the Groups revealed that RDs had lower accuracy scores
on the Sentence Comprehension Task than controls. There was a significant difference between
Voices on Accuracy, F(2, 85)= 7.54,MSE=609.51 p<.001 η2=.15. Post hoc tests indicated a
significant difference between all three Voices with AT&T Crystal receiving highest Accuracy
scores, followed by the Natural voice and MS Mary, respectively. The interaction, main effect
for Group, and the main effect for Voice were all not significant for Response Latency on the
Sentence Comprehension Task F(2, 88)=1.591, MSE=517502.42, p>.05 , F(1,88)= 1.73,
MSE=563897.82, p>.05, and F(2,88)=.792, MSE=256258.88, p>.05, respectively. A follow up
analysis was conducted to investigate the Response Latency of correct responses and the Item
Difficulty of the Sentence Comprehension Task. Accuracy scores for all participants were
summed for each item of the Sentence Comprehension Task to generate a Total Item Accuracy
Text-To-Speech and Language Profiles 27
score. A Pearson’s correlation coefficient was conducted between Total Item Accuracy and
average Response Latency. A significant negative relationship was found between Total Item
Accuracy and Response Latency, r=-.65, p (two-tailed) <.01. As the Total Item Accuracy score
decreased, Response Latency increased for Sentence Comprehension
Regarding Moment-to-Moment Variability, there was not a significant interaction or Group
effect (F(1,88)=3.78, MSE=286737.41, p>.05 and F(2,88)=, 1.46, MSE=111007.18, p>.05
respectively). However, there was a significant main effect for Voice F(2, 83)=4.32,
MSE=324761.01, P<.05, η2=.10 (see Table 11). Post hoc analyses revealed that students who
listened to the Natural voice had significantly greater Moment-to-Moment Variability in
comparison to those who listened to either of the TTS voices.
Insert Table 11 about here
In summary, students with a RD obtained lower comprehension scores then typically developing
controls. Also, students who listened to AT&T Crystal had significantly higher comprehension
scores than those that listened to the Natural voice or MS Mary. The Natural voice also had
significantly greater moment-to-moment variability indicating that the consistency in response
latency varied more than either of the TTS voices. The Natural voice was also associated with
significantly higher comprehensibility scores than MS Mary.
The Role of Working Memory
Earlier in this paper, it was reported that RDs had significantly poorer Working Memory scores
than Controls. In addition, it was hypothesized that the Working Memory difficulties of the RDs
would contribute to poorer performance on the intelligibility and comprehensibility tasks. To
determine the role of Working Memory, separate 2 (Group) by 3 (Voice) ANCOVAs were
conducted with the Accuracy, Response Latency, and Moment-to-Moment Variability scores for
the three tasks (Pseudoword and Real Word Discrimination Tasks, and the Sentence
Comprehension Task), controlling for Working Memory. The results of the ANVOCAs showed
that for all experimental tasks the main effect for Voice remained significant, however, the main
effect for Group on all comparisons were not significant (see Table 12). To address the question
Text-To-Speech and Language Profiles 28
of whether Working Memory accounts for the differences between RDs and Controls on
Listening Comprehension, a one-way Between Groups ANCOVA was conducted on Listening
Comprehension while controlling for Working Memory. The results showed a significant
difference between Group F(88, 1)=15.02, MSE=114.65, p<.001. In summary, students with a
RD had significantly poorer Listening Comprehension scores even after controlling for Working
Memory. However, Working Memory was found to influence comprehensibility and
intelligibility when listening to the different Voices in the experiment.
Insert Table 12 about here
Discussion
In the past, research on the effect that TTS has on the comprehension of students with a reading
disability (RD) has produced mixed results with some studies showing that TTS increases
comprehension scores and other studies finding no effect on performance (Strangman & Bridget,
2005). The aim of the current research was to investigate whether the quality of voice used to
present text auditorally impacts students’ (with or without a RD) comprehension of text. The first
step (Experiment 1) was to evaluate the different TTS voices to identify whether they were
perceived to be of low or high quality in comparison to natural voices. The second step
(Experiment 2) was to compare the intelligibility and comprehensibility of the lowest and highest
ranked TTS voices from Experiment 1 with a natural voice. In addition, the cognitive load
associated with these three voices for students with and without a RD was assessed by examining
response latencies. It was hypothesized that low quality TTS voices would result in lower
intelligibility and comprehensibility scores as well have long response latency and more
moment-to-moment variability. It was hypothesized that RD students would demonstrate overall
lower performance, but that the gap between control and RD performance would decrease as
voice quality increased.
To investigate this goal, the first step was to ascertain low and high TTS voices. Comparisons of
ten TTS and two Natural voices revealed that listeners perceived a difference in the quality of the
Text-To-Speech and Language Profiles 29
voices. The TTS voice called MS Mary was the female voice that received the lowest overall
ratings from participants, and was used in Experiment 2 as the low quality TTS voice. Overall, it
was rated as sounding the most like a computer, being the hardest to understand, and was the
least preferred voice for listening. The highest rated TTS voice, AT&T Crystal, was the highest
rated female TTS voice, and was used in Experiment 2 as the high quality TTS voice. In contrast
to the low quality TTS, this high quality TTS voice was rated overall as sounding the most like a
human, being easier to understand, and being a voice that participants are more willing to listen
to. The Natural voices received higher ratings than all TTS voices. Therefore, the female Natural
voice was used for Experiment 2.
The finding that TTS voices received lower ratings when compared to natural voices is
consistent with previous studies. Research with adults found that TTS voices were less
intelligible than natural speech (Mirenda & Beukelman, 1990; Reynolds, Issacs-Duvall,
Sheward, & Rotter, 2000) and that some TTS voices are perceived as more intelligible than other
TTS voices (Greene, Logan, & Pisoni, 1986; Mirenda & Beukelman, 1990; venKatagiri, 2004)
However, the key is in how well the voices are able to replicate a variety of natural speech
conditions. Handley (2009) argued that the different methods used to generate the voices are
responsible for the between voice differences. Although it is beyond the scope of this paper to
explain the technological differences in TTS voice generation processes, it is likely that the
poorer ratings for the low quality TTS relative to the high quality TTS voices are related to an
inability to generate smoother transitions and replicate prosody. For instance, the low quality
TTS voices were developed prior to certain advances in TTS voice generation technology.
Namely, the low quality TTS voice uses a smaller library of speech samples, which have been
found to result in TTS voices that sound more monotone when linking speech samples together
(Dutoit, 1997). In contrast, newer, higher-quality TTS draw from a significantly larger library of
speech samples, allowing for smoother transitions between speech units (O'Shaughnessy, 2007).
The newer TTS programs also use methods to generate prosody based on the prosodic context
within text (Beutnagel, Conkie, Schroeter, Stylianou, & Syrdal, 1998; Campbell & Black, 1997).
This suggests that users of TTS should listen to a variety of voices to determine which one they
prefer. The findings also suggest that users prefer to listen to TTS that sounds more natural and
has a more sophisticated prosody synthesizer.
Text-To-Speech and Language Profiles 30
Despite technological advances, TTS voices continue to be rated as inferior to Natural voices,
suggesting that there is considerable room for improvement of the TTS voices. In light of the
limitations of TTS, the second experiment assessed the intelligibility and comprehensibility of
the low quality TTS and high quality TTS, relative to a natural voice, when listened to by
students with a RD and by controls. In addition, the second experiment aimed to determine the
extent of cognitive load that was required by the voices.
It is important to note that in Experiment 2, students with an RD were compared to typically
developing control students. The profiles of the typically developing children were representative
of other children their age in regards to working memory, phonological awareness, word reading,
and word decoding. As expected, the students with an RD scored one standard deviation below
the controls on working memory, word reading, and decoding and 1.5 standard deviations below
the controls on phonological awareness. This profile is similar to that reported by Fletcher,
Morris, and Lyon (2003) who found that students identified as having a learning disability in the
area of reading were 1 standard deviation below the mean on phonological awareness. The RD
group in the present study, however, had lower receptive vocabulary scores than typically
developing children, which was different than expected based on the study of Fletcher and
colleagues (2003). This suggests that the RD students in the present study may have more
language impairment than expected. This needs to be taken into consideration when making
interpreting the findings of the present study.
Regarding the comparisons of the voices, it was expected that the natural voice would produce
the most intelligible pseudowords, followed by the high quality TTS and low quality TTS,
respectively. Instead, the Natural and low quality TTS were found to be comparable, and the
high quality TTS was the least intelligible. In contrast to the high quality TTS, the low quality
TTS produced the pseudowords in a way that made it easier for participants to identify when
they were different. This was found in an item-by-item analysis (see Figure 4). This analysis
indicated that when presented with pseudoword pairs in the low quality TTS voice, students were
more likely to correctly identify identical items such as /togg/-/togg/; /nush/-/nush/, or /tekk/-
/tekk/. On the other hand, when a high quality TTS or natural voice was used, students were
much less accurate in their ability to distinguish between different word pairs (e.g. /bish/-/biss/;
/ting/- /tig/; or /thop/- /zop/). Although the low quality TTS produced pseudowords in such a way
that the students could differentiate between pseudowords as well as when listened to a Natural
Text-To-Speech and Language Profiles 31
voice, this does not mean that the low quality TTS produced the pseudowords as well as a human
would. Rather, the low quality TTS mispronounced the pseudoword pairs. The mispronunciation
did not impact results when the pseudowords pairs were the same as the TTS voice consistently
mispronounced the same pseudoword. When the pseudowords were differing on one phoneme,
what should have been a subtle manipulation of sound became a pronounced difference as a
result of the mispronunciation. The pseudowords were made to differ only on one phoneme (e.g
/biss/-/bish/), but when pronounced by low quality TTS, the phonemic information was
perceived differently. In comparison, the high quality TTS voice had a larger store of speech
samples and allowed for a smoother transition between speech sounds. Although the high quality
TTS also did a poor job articulating the pseudowords, its intelligibility was likely undermined by
the fact that it produced the pseudowords with a shorter duration of utterance. It is notable that in
this condition, the high quality TTS had a shorter duration of utterance than the natural voice and
low quality TTS voice (articulating the pseudowords 40.79% faster than the Natural voice, and
18.94% faster than the low quality TTS). As a result, the high quality TTS provided less acoustic
information to help participants discriminate between pseudowords.
In contrast, the intelligibility of the TTS programs when producing real words showed the
opposite results. With real words, the high quality TTS was found to be as intelligible as the
natural voice, and the low quality TTS was found to be less intelligible then either the high
quality TTS or Natural voice. It is surprising that although the high quality TTS voice was rated
as less preferable than the Natural voice in Experiment 1, the intelligibility of these two voices
for real words was identical. This may be due to advancements in TTS voice generation
technology used by the high quality TTS, such as the larger library of speech sounds permitting
better transitions between speech units. The fact that the high quality TTS outperformed the low
quality TTS in the real word condition was expected as it has a newer, more sophisticated
method of voice generation. The difference between the TTS voices with pseudowords and real
words does not necessarily indicate that the low quality TTS is superior at producing
pseudowords. Rather, it may be argued that both TTS voices had incorrect articulation, but the
low quality TTS produced them in a way that made pairs of different pseudowords sound more
distinct (making it easier to differentiate between pseudowords). In contrast to the distinct sounds
of the pairs of pseudowords, the high quality TTS voice also did not create intelligible
pseudowords as students did not perform better then chance responding. The high quality TTS
Text-To-Speech and Language Profiles 32
applies a more advanced process of smoothing the coarticulation leading to aquatic sounds that
were hard to discriminate.
An interaction was also not found between the two groups for all three voices. This suggests that
although students with a RD, in general, have more difficulty due to their weakness in
phonological processing, when pseudowords are produced by either the high or low quality TTS,
both RD and control students are equally challenged. This discrepancy is likely due to the TTS
programs failing to pronounce the pseudowords properly. When listening to the TTS voices
create pseudowords, one can hear the misrepresentation of the pseudowords. The findings on the
intelligibility of pseudowords suggest that the TTS voices were not created to produce
pseudowords and should not be used in to do so. As TTS use diphones, some of the phoneme
patterns within the pseudowords are not represented in English. Therefore, the TTS presents the
phones in isolation. This creates a choppy sounding word as the coarticulation between the
phones is not replicated. In addition, TTS voices would not be appropriate for use in software
that models the production of phonemes, as they are not reliable for this task. Instead, a human
voice should be recorded to ensure accuracy.
It was interesting that the comprehensibility of the high quality TTS assessed with Sentence
Comprehension was higher than when the sentences were uttered by a human voice or by low
quality TTS. The difference in the comprehensibility of the two TTS voices was expected as the
high quality TTS was also found to be more intelligible with real words, and in Study 1 as being
perceived as being more understandable. What was unexpected, however, was that the high
quality TTS voice was more comprehensible than a Natural voice. It was anticipated that the
Natural voice would be more comprehensible, as research has found that the prosodic
information produced by natural voice help achieve intelligibility scores in excess of 99 percent
(Hoover & Gough, 1990; Mirenda & Beukelman, 1990). Amongst other things, prosody plays a
role in the signaling of the boundaries of phonemes, words, phrases, and sentences. TTS voices,
in contrast, have been found to have less prosodic cues than natural voices (O'Shaughnessy,
2007). The advantage of high quality TTS over the human voice may be attributed to
technological advances in TTS voice. Past research that has found TTS voices to be less
comprehensible than human voices was conducted over five years ago with adults (Hux,
Mercure, Wood, Scharf, & Vitko, 1998; Manous et al., 1985 cited in Duffy & Pisoni, 1992;
Pisoni, Manous, & Dedina, 1987; Reynolds & Fucci, 1998; Reynolds & Givens, 2001; Reynolds,
Text-To-Speech and Language Profiles 33
Isaacs-Duvall, Sheward, & Rotter, 2000; Reynolds & Jefferson, 1999), and children (Reynolds &
Jefferson, 1999; Reynolds & Fucci, 1998). In the present study, the high quality TTS
comprehensibility scores were on average 10% higher than with the natural voice. Perhaps it is
the case that the high quality TTS voice used in this study articulates all of the phonemes in
words with more accuracy and consistency than the natural voice. In contrast to the high quality
TTS voice, the natural voice had greater moment-to-moment variability. When listening to the
natural voice, it was discovered that the person who recorded the voice did not pronounce final
phoneme position consistently, had a rate of speech that varied within the utterance, and
provided less distinction between the boundaries of words (e.g. slurred between some words).
Past research has shown that even in ideal recording conditions, natural voices vary in regards to
such things as pitch, loudness and articulation, and degree of vowel nasalization (Harrington &
Cassidy, 1999). As such, it may have been the case that the voice of the woman who recorded
the natural voice was more variable in regards to certain factors than the high quality TTS.
Clearly, a follow-up study is required that compares aspects of natural speech variability with the
high quality TTS voice to better comprehend what features of high quality TTS that might make
it advantageous over natural voice. On the positive hand, in terms of developing intervention
software, it is promising to find out that some more recently developed synthetic voices are now
equivalent and perhaps surpass the human voice in comprehensibility.
The findings for the comprehensibility of the voices was not as predicted, although the findings
are understandable based on the cognitive and language profiles of the students participating in
this study. It was hypothesized that there would be an interaction between the two groups and the
different voices. This interaction would consist of a larger comprehension gap with RD having
significantly lower scores then controls for the lower quality TTS with this gap closing for the
high quality TTS and then no significant differences for natural voices. It was found that for all
three voice conditions the RD students were significantly lower on the comprehension task than
controls. The fact that RD students have phonological processing difficulties is well established
(e.g., Snowling, 2000; Stanovich & Siegel, 1994; Torgesen, et al., 1999).
As for the comprehension task, many of the answers depended on the correct recognition of a
single phoneme. For example, take the element of “There is the sun” (see Figure 3). The
participant is presented with 4 pictures representing: sun, saw, sub, and sing. The rhyme /un/ is
the key to the comprehension of the sentences. In this case, the comprehension task resembles
Text-To-Speech and Language Profiles 34
an intelligibility task in that participants had to correctly recognize all the phonemic elements,
which is a weakness of the RD population(Snowling, 2000). The RDs performance on the
comprehension task is expected based on their cognitive profiles, which found they have poorer
phonological awareness, oral language comprehension, and receptive vocabulary ability than the
typically developing students. .
It was expected that when the students with a RD, in comparison to controls, listened to low
quality TTS, the low quality voice would yield lower intelligibility and comprehensibility
overall, and that the difference between these groups would reduce as voice quality improved.
This was expected as students with a RD have poorer working memory ability than typically
developing students (Siegel, 1994; Swanson L. , 1994; Swanson, 1999; Swanson, Ashbaker, &
Carole, 1996) as well as phonological processing difficulties (Wagner & Torgesen, 1987),
making the low quality TTS particularly difficult for them to understand. However, it was
surprising that for intelligibility and comprehensibility alike, no interaction was found between
reading group (i.e., controls vs. RDs), and the effect of the type of voice to which they listened.
In other words, regardless of the quality of the voice that the RDs listened to, they had the same
intelligibility scores as controls, but lower comprehensibility scores than controls.
One possible explanation for the finding that RDs had lower comprehensibility scores is their
poorer WM. Past research has shown that WM contributes to difficulty when listening to text-to-
speech voices (Duffy & Pisoni, 1992). Therefore, students with poorer WM would be expected
to have lower accuracy scores when listening to TTS voices. Although this was not true for the
intelligibility task, it was the case for the comprehensibility task. When controlling for WM, the
difference between RDs and controls on comprehensibility became nonsignificant. Therefore,
WM contributes to the discrepancy between the comprehensibility of RDs and controls when
listening to TTS voices.
It was originally thought that students with an RD would have the same comprehensibility scores
as control students when listening to the natural and high quality TTS voices. However, this was
not found as the RD students always performed more poorly on the comprehensibility task
regardless of TTS voice. This unexpected finding may be due to the fact that the RDs in the
present study overall had poorer cognitive and language abilities than expected. That is, they
may have performed more poorly due to having greater weaknesses overall (i.e., lower oral
Text-To-Speech and Language Profiles 35
vocabulary, lower working memory ability, and lower nonverbal intelligence) .These cognitive
abilities have been found to contribute to comprehension (see Rapp, van den Broek, McMaster,
Kendeou, & Espin, 2007). Further research in the area of TTS needs to match students on
nonverbal intelligence or listening comprehension. This research design may provide the
opportunity to test specific hypotheses regarding the role of underlying cognitive abilities such as
WM. In the present study, the RDs and controls were not matched on these variables, and
therefore this comparison could not be conducted.
Working Memory and the Intelligibility and Comprehensibility of TTS
The response latency of participants was also measured for the different voices on the
intelligibility and comprehensibility tasks. It was assumed that the response latencies reflect
cognitive load. That is, an item that results in short response latency may reflect less of a
cognitive load than a task that results in longer response latency (Duffy & Pisoni, 1992). In this
study the response latency is based on the time interval between the end of the stimulus (i.e., the
pseudoword, real word, or sentence) and the participant's response. In the pseudoword and real
word discrimination tasks, as well as for the sentence comprehension task, it was hypothesized
that the shortest response latency would be found with the natural voice, followed by the high
quality TTS and low quality TTS, respectively. In addition, it was expected that regardless of
task and voice quality condition, students with a RD would have longer response latencies than
the controls. These hypotheses were not supported in the current study; no difference in
response latency was found between the students with a RD and controls, regardless of the type
of voice to which they listened. This finding is different from previous research involving
children and adults, where RD had longer reaction times when they listened to TTS voices in
comparison to a natural voice (Duffy & Pisoni, 1992). This difference was maintained even after
participants had practice listening to TTS voices over several days (Reynolds et al., 2002;
Reynolds et al., 2000; Reynolds & Jefferson, 1999).
A number of possible explanations can be considered for the contradictory results. One
explanation concerns the differences in the nature of the comprehension measure used in the
present study and in previous research. Whereas previous research used a sentence verification
task (Axmear, Reichle, Alamsaputra, Kohnert, Drager, & Sellnow, 2005), the current study used
a sentence comprehension task. In general, with sentence verification tasks, participants listen to
Text-To-Speech and Language Profiles 36
a 3-word sentence and indicate whether they believe the sentence is true or false (e.g., dogs can
fly). The 3-word sentences are developed so that the responses of participants are highly accurate
and there is often a ceiling effect. As such, the task requires very little cognitive processing,
ensuring that only the manipulated condition is being measured. In contrast, the current study
used the Peabody Individual Achievement Test-Revised (PIAT-R), whose sentences become
increasingly more difficult to comprehend as one progresses through the test. The complexity of
the sentences in the test is modified based on vocabulary, number of clauses, and syntax. As the
sentences become more difficult to comprehend, latency response time was expected to become
longer as participants tried to process the sentence information. Indeed, the present study found a
highly significant negative correlation between sentence accuracy and response latency (r=-.65).
This high correlation suggests that as the sentence difficulty increased, there was an increase in
cognitive load resulting in students taking more time to respond. This was the case for both
reading ability groups and all three voices. In other words, sentence difficulty, comprehensibility
of voice, and reading ability may have all contributed to the observed response latencies. The
influence of multiple variables on a sensitive measure could explain why nonsignificant results
were found, as there was too much within-subject variability. In future research, two different
measures of listening comprehension need to be used to assess the accuracy and response latency
of comprehension separately, and the response latency measure should require minimal levels of
cognitive load. Not taking into consideration the effect of the test items, the non-significant
findings for response latency suggests that cognitive load (as represented by response latency) is
equivalent for all the voices independent of reading ability.
Although no significant difference for response latency was found among the students or voices,
a difference was found in regard to moment-to-moment variability. An interesting pattern
emerged when moment-to-moment variability and accuracy scores were considered together.
When the pseudowords were uttered by low quality TTS, there was less moment-to-moment
variability compared to other voices. On the other hand, when the low quality TTS uttered real
words, greater moment-to-moment variability was noted, than when the other two voices uttered
these items. This was somewhat consistent with what was expected. As suggested earlier, the
low quality TTS did not produce phonologically accurate pseudowords, and as a result the
participants were more accurate when the pseudoword pairs were different. As this made the
discrimination task easier, it is understandable that a more consistent speed of response was
Text-To-Speech and Language Profiles 37
found with low quality TTS. In contrast, when real words were produced by the low quality TTS
it was less consistent at producing intelligible words. When low quality TTS uttered real words
intelligibility scores decreased, and this was concomitant with an increase in moment-to-moment
variability.
An examination of moment-to-moment variability with regard to comprehensibility data supports
the overall conclusion that the high quality TTS voices are more consistent in their production of
speech than natural voices. The Natural voice had significantly greater moment-to-moment
variability, indicating that listeners did not perceive this voice as consistently as either of the
TTS voices. The greater comprehension scores with the high quality TTS may be attributed to it
having a more consistently intelligible voice. Although users may prefer to listen to a natural
voice, listening to a high quality TTS appears to result in clearer and more consistent
comprehension of short passages by all learners.
Background noise in the testing environment could have also contributed to the non-significant
difference found in response latency for the two intelligibility and the comprehensibility tasks.
The testing rooms were usually located next to classrooms or in the main office of the
elementary schools. The background noise in elementary classrooms is often significant and can
appropriate 55-65 dB (Nelson, Soli, & Seitz, 2002). In the current study, background noise was
rated to be within this range. This may have been a limitation as past research has found that a
signal-to-noise differential as small as 10 dB can result in significant differences in intelligibility
when listening to TTS speech output. The regular classroom environment was chosen as the
current study wanted to simulate the environment in which the TTS software would be used. To
investigate response latency, a sound controlled environment may be needed and the study needs
to be replicated. In addition, listening comprehension of students who use TTS in elementary
classrooms may be negatively impacted by background noise. The current study used a high
quality head-phone to help reduces background noise. This would suggest that high quality head-
phones that have good noise cancelation or reduction properties should be used by students when
listening to TTS voices in the classroom.
Educational Implications
Text-To-Speech and Language Profiles 38
The findings suggest ways students with a reading disability can better use TTS. The current
study found that the TTS voice rated as preferable by listeners was more intelligible and
comprehensible, and sounded more like a human voice than the less preferred TTS voices. Users
of TTS should be encouraged to select the type of voice they prefer to listen to, which is likely to
be the most natural sounding. Importantly, voice quality was found to influence listeners'
willingness to listen to the voice, and newer voices received higher ratings in comparison to
older voices.
Implications for use of TTS
TTS software is often recommended for use by students that have a RD to enable them to better
understand printed text, however, past research has produced mixed findings regarding the
effectiveness of TTS for reading comprehension with students with a RD (Strangman & Bridget,
2005). As the present study has shown, the quality of the TTS voice influences the extent to
which an individual understands what they hear. For all students, a low quality TTS voice results
in poorer intelligibility and comprehensibility in comparison to a natural voice. Therefore,
students who use TTS, regardless of whether they have a RD or not, should be advised to use a
high quality TTS voice to improve their understanding of what the voice. As much of the
research on TTS with individuals with a RD has either not reported the TTS voice used, or has
given participants the option to choose a voice, the contribution of type of voice to the mixed
results of these studies is unknown. Therefore, it is important that future research identify what
TTS voices were studied to allow for comparisons, as this may help explain discrepancies in
findings between different studies. In addition, it is important to replicate the work of Elking and
his colleagues (2003) and Higgins and Raskind (1997) who compared the unaided reading ability
of students with an RD to their aided reading ability. A replication study should measure the
students’ reading comprehension and reading rate without the use of any accommodations
(unaided condition) and with the use of TTS (aided condition). For the aided condition, a high
quality TTS voice which has a large number speech units, the ability to replicate prosody,
utilizes an advanced NLP, and has been rated as high quality, should be used. With these
conditions, it is expected that students with an RD will show gains in reading comprehension.
Text-To-Speech and Language Profiles 39
Chapter 2
Increasing the Effectiveness of Text-To-Speech Software for Students with Reading Disabilities
Abstract
Text-to-speech (TTS) software is used by children with reading disabilities (RD) to help them
comprehend written text by “reading aloud”, and thereby circumventing the need to decode. Past
research has shown mixed results regarding the effect of TTS on reading comprehension. The
present study examined two modifications of the way TTS presents text: presentation rate of text
and the use of pauses within sentences. Forty-seven students with a RD and 54 typically
developing students between grades 6 and 8 were presented with passages by TTS at a slow,
medium, and fast presentation rate, and with no pauses, random pauses, or noun-phrase pauses.
Students listened to two passages in each condition for a total of 18 passages. At the end of each
passage, the students answered three factual and two inferential multiple-choice questions.
Unfortunately, due to a floor effect with the multiple choice questions the analysis could not be
carried out. Explanations regarding the floor effect and changes to the study are provided.
Text-To-Speech and Language Profiles 40
Individuals with a reading disability (RD) have a weakness in the ability to fluently decode and
recognize words, which often leads to poorer comprehension. Having a computer read text
auditorily via text-to-speech software (TTS) has been considered a means to circumvent this
weakness, and has led to TTS being widely used as an academic accommodation for students
with reading disabilities (Dalton & Strangman, 2006). However, research on the effectiveness
of TTS at increasing comprehension for students with a RD has produced mixed results, with
some studies finding it to be effective (Elbro, Rasmussen, & Spelling, 1996; Elking, Cohen, &
Murray, 1993; Lundberg & Olofsson, 1993; Montali & Lewandowski, 1996), and other studies
finding it to be ineffective (Farmer, Klein, & Bryson, 1992; Leong, 1995; Wise & Olson, 1995).
One possible explanation for these inconsistent findings is differences in the impact that TTS
voice quality has on students with a RD compared to age-matched controls. As prior research has
shown (see study 1), a high quality TTS voice resulted in greater intelligibility and
comprehensibility than a low quality TTS voice for both students with a RD and age-matched
controls, however, students with a RD demonstrated poorer comprehension overall.
The discrepancy in listening comprehension may be due to differences in the working memory
(WM) ability of RD and typically developing students, and the WM demands of different voices.
WM is often described as a “mental workspace” with the ability to hold task relevant information
in mind during processing of information or problem solving (Just & Carpenter, 1992). It is a
limited-capacity system (Baddeley, 1996; Gathercole & Baddeley, 1990; Just & Carpenter, 1992)
that has a direct impact on listening comprehension. Most models of WM describe two systems,
one for short-term maintenance of information and one for the manipulation of information
during complex cognitive tasks. The short-term maintenance system is often described as having
the two functions of maintaining verbal and visual-spatial information (Baddeley, 1996), with
verbal information maintained in the phonological loop, and visual information held in the
visual-spatial sketchpad. The information in the short-term maintenance system is manipulated
by the central executive in order to carry out complex cognitive functions. To comprehend
speech, one must actively maintain and integrate the linguistic material in WM. When the
demands of a task exceed the available WM, the storage and processing of the information is
compromised. WM has also been linked with a number of language outcomes, such as reading
comprehension (Nation, Adams, Bowyer-Crane, & Snowling, 1999; Swanson, 1999), vocabulary
Text-To-Speech and Language Profiles 41
acquisition (Baddeley, Gathercole, & Papagno, 1998), and early academic achievement
(Gathercole & Pickering, 2000).
The lower WM capacity of students with a RD puts them at a disadvantage when using TTS, as
TTS demands more WM than natural voices for listening comprehension (see Study 1). Research
has found that adults with low WM who are presented with increasingly complex syntactic text
have poorer comprehension than controls (King & Just, 1991). Furthermore, in regards to TTS,
research found that a low quality TTS voice requires more WM capacity and results in poorer
intelligibility and comprehensibility than a high quality TTS or natural voice for both RD and
typically developing children (see Study 1). In Study 1, RD students who listened to low quality
TTS, high quality TTS, or natural voices had more difficulty identifying pictures that
corresponded to statements they heard than controls. When WM was controlled for, this
difference between RD and controls was no longer significant. This indicates that the lower WM
capacity of RD students impairs their listening comprehension in comparison to controls, with
comprehension particularly reduced with low quality TTS.
In light of the fact that TTS voices, particularly low quality TTS, place greater demands on WM,
and this is a disadvantage for students with a RD as they have lower WM, the question arises as
to how the demand on WM may be reduced when using TTS. The current study investigated two
methods intended to reduce the demands on WM when listening to TTS: varying presentation
rate (i.e., the speed at which the computer reads the text), and the use of pauses. To examine this
possibility, the present study investigated whether slowing the rate of TTS speech and having the
TTS voice pause at the end of phrases would compensate for the lower WM capacity of RD
students, and thereby improve comprehension.
Presentation Rate
Research conducted over 50 years ago found that when the speed of a voice exceeds a certain
threshold, comprehension of the speech decreases. These early studies showed that adults are
able to repeat short sentences they have heard at a rate between 125 wpm and 225 wpm
(Harwood, 1955; Nelson, 1948). However, once 225 wpm is exceeded, there is an accelerating
decline in comprehension (Foulke & Sticht, 1969). In addition, it has been established that for
Text-To-Speech and Language Profiles 42
children, there is a linear relationship between natural speech rate and working memory (Henry,
1994).
In addition, it has been argued that TTS presentation rate has an impact on comprehension. That
is, even if users recognize individual words, if the presentation rate is too fast they may not be
able to comprehend text even if the individual words are intelligible. One way of reducing the
processing demands of TTS may be to slow down the presentation rate of the TTS voice. Early
research on TTS voices lends support to this idea. A study by (Marics & Williges, 1988), had
adults listen to a short sentence, press a bar to indicate they were ready to respond, and then write
down what they heard. The passages were presented at 3 rates: 150 words-per-minute (WPM),
180 WPM, and 210 WPM. The response latency of correct responses was examined. The study
found that the presentation rates of 150 and 180 WPM, in comparison to 210 WPM, resulted in
shorter response latencies. The quicker responses suggest that when TTS reads text at a slower
rate, adults are able to process the information more efficiently into meaningful idea units.
In contrast, a study by Reynolds and Givens (Reynolds & Givens, 2001) did not find a difference
in response latency when TTS or natural speech was presented at different rates. In the study, 8
groups of college students listened to a natural or TTS voice at 4 speech presentation rates: 130,
150, 170, or 190 WPM. Thirty sentences were presented with the last word either making the
sentence plausible (e.g., scissors, that cut paper, are sharp) or implausible (fire, that burns wood,
is cold). Participants hit one of two keys to indicate if sentences were plausible or not. The
response latency of correct responses was recorded. No significant difference was found
between the four speech presentation rates for either voice.
Differences in the cognitive demands needed for tasks in the Marics and Williges (1988) and
Reynolds and Givens (2001) studies may account for the discrepancy in findings. In the study by
Marics and Williges (1988), response latency was measured between the end of the stimulus
(i.e., the voice had finished reading the sentence) and when participants pressed a bar to indicate
they were ready to write. Reynolds and Givens (2001) point out that it may take more working
memory and processing time to rehearse sentences before writing them down than to make a
judgment of whether a sentence is plausible, resulting in the significant difference in response
latency between 150 and 180 WPM, and 210 WPM found in the Marics and Willages (1988)
study. In contrast, the Reynolds and Givens (2001) study used a judgment task that may have
Text-To-Speech and Language Profiles 43
required less cognitive resources (e.g., working memory), making speech presentation rate less
influential as participants did not need to retain each word in memory, but could simply make a
judgment about what they heard before responding.
Another difference between the two studies is the presentation rate of the speech. Marics and
Willages (1988) used the fastest presentation rate of 210 WPM. At 210 WPM, WM may be
overtaxed such that it does not retain auditory information in short-term memory as well as at
slower presentation rates. In the Reynolds and Givens (2001) study, the fastest presentation rate
was 180 WPM, which is approximately the rate of speech during natural conversation, and may
not have been fast enough to exceed the WM capacity. The 15% faster presentation rate of 210
WPM, on the other hand, appears to have exceeded WM capacity and thereby prolonged the time
needed to prepare to write down the sentence.
Additional research has found support for the hypothesis that comprehension suffers when the
presentation rate of TTS is sufficiently faster than that of natural speech (Greenspan, Nusbaum,
& Pisoni, 1988; Mirenda & Beukelman, 1987; Venkatagiri, 1991;Higginbotham, Drazek,
Kowarsky, Scally, & Segal, 1994). In one study, Venkatagiri (1991) had college students do a
sentence verification task when listening to TTS or a natural voice, and TTS was found to result
in lower intelligibility scores. To try to improve intelligibility, two slower presentation rates were
compared to the normal rate. Early TTS could not manipulate the rate of word utterance, so to
slow down the presentation rate the delay interval between words was increased. The non-
manipulated presentation rate of the TTS voice had a delay interval of approximately 50
milliseconds between words. This rate was compared with “slow” and “very slow” presentation
rates that had a delay interval of approximately 200 and 650 milliseconds, respectively. Eleven
college students listened to the TTS produce sentences and wrote down what they heard, with the
presentation rate randomly varied. Venkatagiri (1991) found that the TTS had significantly
higher intelligibility scores at the slow and very slow presentation rates in comparison to the
natural rate. He concluded that at a rate of about 139 syllables per minute (about 109.81wpm)
resulted in more intelligible TTS.
One group that commonly uses TTS to read is the visually impaired population. In contrast to
non-disabled adults, adults who have a visual impairment tend to listen to TTS at a significantly
faster rate (Torihara, Nakamura, Ueda, Wada & Ishizaki, 2006). It is hypothesized that the
Text-To-Speech and Language Profiles 44
visually impaired students who took part in the Torihara and colleagues (2006) study had been
using TTS for some time. If this was the case, they would have been very familiar with the
voices. It has been shown that with practice, one’s cognitive system is better able to process TTS
voices (Reynolds, Isaacs-Duvall, & Haddox, 2002) . The study also did not provide information
about the visually impaired participants’ cognitive abilities. It is assumed that the participants in
Torihara and colleagues (2006) study did not have auditory working memory or processing
weaknesses which would otherwise impair the understanding of TTS. It is thought that due to
their experience listening to TTS voices and not having a cognitive weakness in the area of
auditory working memory and processing, these visually impaired participants were able to use a
significantly faster presentation rate than their non-disabled peers.
Unlike typically developing students and visually impaired adults, it is hypothesized that
students with a RD would have greater comprehension with a slower TTS presentation rate
which reduces the load on their poorer WM capacity. Furthermore, as a low quality TTS voice
particularly taxes WM (study 1), it is expected that the presentation rate of low quality TTS
would need to be even slower than high quality TTS to facilitate the comprehension of students
with a RD.
Pause When Reading Test
In contrast to unaided reading, text presentation by TTS is uninterrupted. That is, after loading
text into TTS software and selecting the “read” command, the selected text is presented
continuously from beginning to end. Although most TTS software pauses briefly at sentence
boundaries before presenting the next sentence, this is nevertheless a very restricted way of
“reading” text. Research on eye movements when reading unaided has found that the gaze of
proficient readers does not glide across the page, but rather, makes a series of saccades from one
place on the text to another. Furthermore, as the complexity of text increases, eye fixation time
lengthens and the distance between saccades becomes shorter. About 10% to 15% of the time,
regressions are made to reread sections of text (see Rayner & Slattery, 2009), for a review of eye
moments and reading comprehension). Hence, unlike unaided reading which enables readers to
naturally pause for longer eye fixations to allow for cognitive processing of a difficult idea, or to
make regressions to check comprehension, TTS users are presented with text in a continuous,
uninterrupted manner.
Text-To-Speech and Language Profiles 45
Research suggests that a combination of a TTS presentation rate that is too fast and has
insufficient pausing may impair comprehension. Higgins and Raskind (1997) found a strong
negative correlation between reading ability and comprehension scores of college students when
using TTS. Whereas very poor readers showed a significant improvement in their comprehension
scores with TTS compared to unaided reading, the comprehension scores of proficient readers
were poorer. In contrast, a study by Montali and Lewandowski (1996) found that listening to a
TTS system did not hinder the comprehension of proficient readers. The discrepancy in findings
may be explained by differences between the studies in terms of presentation rate and pausing.
Whereas Higgins and Raskind (1997) allowed participants to select the TTS reading speed,
Montali and Lewandowski (1996) controlled for speed of presentation. Although neither study
reported the reading speed, if the controlled speed in the Montali and Lewandowski (1996) study
was slower it may have led to the improved comprehension of the proficient readers. In addition,
Montali and Lewandowski (1996) presented one sentence of text at a time on the screen, whereas
Higgins and Raskind (1997) had a full text document open and the computer read continuously.
The greater comprehension scores in the Montali and Lewandowski (1996) study may be due to
the text being presented in smaller segments with a pause between sentences, enabling
participants to focus on small amounts of information at a time, reducing demands on their WM.
Returning to the eye-movement studies, it has been shown that in normal reading conditions,
there are positions within text that proficient readers pause at for longer periods of time. The
normal pause or fixation time is about 225 millisecond (ms) and 275ms when reading aloud (see
Rayner, 1998). Fixation times are longer on words that end a clause (Hill & Murray, 2000;
Rayner, Kambe, & Duffy, 2000) or a sentence (Rayner & Pollatsek, 1989). This longer fixation,
or pause, is known as the wrap-up effect and is signaled by a comma, period, or clause boundary.
The wrap-up is thought to be a period of time when unfinished interpretive processing and
updating of discourse representation takes place. That is, to insure that any within clause
information has been comprehended and any comprehension problems resolved (Rayner,
Kambe, & Duffy, 2000). For example, when sentences are manipulated by stretching the clause
boundary, or when sentences are more ambiguous, the wrap-up time at the end of the sentence is
longer. Although text-to-speech software does provide a longer pause at grammatical markers
(e.g. periods, comas, semicolons), the software does not recognize clause boundaries. Therefore,
when a TTS program is reading to an individual it violates the natural pauses that proficient
Text-To-Speech and Language Profiles 46
readers insert that support efforts at comprehension. In addition, TTS always provides the same
length of wrap-up time no matter how simple or complex the sentence. That is, TTS is not
sensitive to grammatical complexity. This may have an impact on students’ comprehension of
the information they listen to by TTS. If students are presented with a simple sentence and have a
long pause time they may become frustrated with the software. On the other hand, if the
computer does not provide sufficient pause time their comprehension could be impaired.
Therefore, it is thought that the insertion of pauses at meaningful boundaries within text should
aid in students’ comprehension of TTS voices.
Building on previous research that has shown that the quality of TTS voices influences
comprehension (study 1), the aim of the present study was to investigate methods that may
reduce demands on WM for students with a RD and thereby improve their comprehension. The
methods investigated included manipulation of presentation rate, use of pauses, and the quality
of TTS voice. Students with a RD were compared with typically developing students. The
participants listened to passages that were read at a slow, medium, and fast rate, with no pauses
added, random pauses, and phrase pauses, by either a high quality TTS or low quality TTS voice.
The study examined the following questions:
1. How does presentation rate, use of pauses, and TTS voice quality, differentially impact
the comprehension of students with a RD in comparison with typically developing
students?
2. What presentation rate is optimal for comprehension?
3. What type of pause (i.e., random pauses or phrase pauses) is optimal for comprehension?
4. Do the recommended settings (i.e., voice quality, presentation rate, use of phrase pauses)
differ from the settings preferred by participants?
To test these hypotheses, students with a RD and typically developing students were assigned to
either a low or high quality TTS voice. They listened to a total of 18 passages read aloud that
varied in regards to presentation speed (slow, medium, and fast), and use of pause (no additional
pauses, additional random pauses inserted within sentences, and additional pauses inserted at the
end of noun phrases). The students heard two passages in each condition and were asked to
answer 5 multiple choice questions after each passage.
Text-To-Speech and Language Profiles 47
It was hypothesized that the comprehension scores of students with a RD would be higher when
listening to a high quality TTS voice than a low quality TTS, and when text is presented at the
slowest rate along with the use of phrase pauses (in comparison to a fast presentation rate along
with random pauses or no pauses). Typically developing students are expected to have higher
comprehension scores overall. The condition leading to the highest comprehension scores for
typically developing students is expected to be high quality TTS reading at the medium
presentation rate with the use of phrase pauses.
Method
Participants
The participants, middle school students (grade 6, 7, and 8) in the Greater Toronto Area, came
from nine schools within two school boards (see Table 13). Consent to participate was obtained
from the parents of the participants, and assent was obtained from the students. The group was
divided into RD and typically developing students (Controls) based on their Ellision and WordID
scores. Students who scored one standard deviation below the mean on scale scores for both
Elison and WordID were placed in the RD group. A total of 10 students were not included in the
analysis as they scored below one standard deviation on only one of the measures. There were 47
(21 females; 26 males) students with a RD, with a mean age of 146.68(13.38) months. The
Controls were comprised of 54 students (30 female, 24 males) with a mean age of 146.41
(10.304) months. There were no differences between the two groups on age.
Insert Table 13 about here
The language and literacy skills of the participants were assessed. The test battery measured their
nonverbal reasoning, oral language comprehension, phonological awareness, decoding, sight
recognition of individual words, and reading comprehension. Comparisons between students
with a RD and Controls were carried out using multiple paired t-tests using the Bonferroni
multiple-significance-test correction. Means and standard deviations of raw scores are presented
in Table 14. On all tests, students with a RD scored significantly lower than Controls.
Text-To-Speech and Language Profiles 48
Insert Table 14 about here
Materials
Passage Comprehension
Passage comprehension was assessed using expository passages of approximately 150 words in
length. Expository texts were chosen to avoid genre effects and simulate textbook reading in
order to focus on relevant school learning. At the end of each of the passages was a series of five
multiple-choice questions to assess explicit and inferential comprehension.
Passage Selection Procedures
Due to the large number of passages, a “passage effect” was possible (i.e., some passages could
be more difficult than others). To prevent passage effects, text structure, vocabulary, and overall
readability levels were controlled to ensure the same level of difficulty among the passages
(Foorman, Francis, Davidson, Harm, & Griffin, 2004).
The following steps were taken to select passages:
1. Assessing the expository text, number of words per passage, and number of syllables per
sentence.
2. Vocabulary level was calculated.
3. The overall readability level of the passages was assessed.
Expository passages were selected from grade 6 textbooks in the subjects of science, history,
social studies, and geography, which were not being used at the time in the participating schools.
Once a large selection of passages were scanned into the computer, the passages were analyzed
to identify those that fell within 1 standard deviation of the target readability range. Text
properties (i.e., number of words per passage, average number of words per sentence, and
average number of syllables per sentence) were calculated using the Word Calculator
(WordCalc.com, 2010), which provides counts and averages for the number of syllables, words,
Text-To-Speech and Language Profiles 49
sentences, and paragraphs in each passage. The information was entered into the Statistical
Package for the Social Sciences (SPSS). The mean and standard deviation was calculated for the
average number of syllables per text. Any text that fell outside one standard deviation was
removed from the study.
One way of creating text equivalency is measuring word frequency. Word frequency was
measured by comparing the number of words in the passages to a standard vocabulary list. The
Biemiller vocabulary list for grade 6 was used, which is a list of words that 40-80 percent of
grade 6 students know (Biemiller, 2009). For each passage, the percentage of words on the list
was calculated, and passages that fell outside of a 95% confidence interval were discarded.
Passages close to the cutoff had difficult words replaced with more common synonyms. For
example, the word conciliate which according to Biemiller (2009) is typically not known by
grade 6 students, could be replaced by the word satisfy which is known by most grade 6 students.
The final step was calculating the Lexile for each passage (Lennon & Burdick, 2010). A Lexile
score is determined through a linear equation based on word frequency and sentence length, and
represents the readability of the passage. Students in a grade that corresponds with the readability
level of the Lexile score are expected to comprehend at least 75% of the text (Lennon & Burdick,
2010). Lexile scores range from 0 to 1800, with a Lexile score of 200 representing grade 1
reading level, and a Lexile score of 1200 representing grade 10 reading level. Lexile scores have
been shown to have good construct validity (Stenner, Burdick, Sanford, & Burdick, 2006;
Walpole, Hayes, & Robnolt, 2006), and are widely used by book, magazine, and newspaper
publishers (National Center for Education Statistics, 2001). The passages used in the present
study had a Lexile score between 90l and 95l, so that participants in grade 7 were expected to
comprehend at least 75 to 80 percent of the text. Correspondingly, participants in grade 6 were
expected to obtain lower comprehension scores than those in grade 7, whereas the grade 8
participants were expected to obtain higher comprehension scores. In total, 27 passages met the
criteria, and of those 18 were selected for the study to reflect a wide range of topics (See Table
15 and Appendix A for passages)
Insert Table 15 about here
Text-To-Speech and Language Profiles 50
Following each passage participants were presented with 5 multiple choice questions. Three of
the questions referred to information explicitly mentioned in the text, and 2 required inferences
based on the texts. The explicit questions asked students to recognize a specific fact presented in
the text, with answers found in the beginning, middle, and end of the passages. The inferential
questions asked the student to make an inference based on the facts presented in the text. All the
questions were presented on a computer screen and were read one at a time by the research
assistant to the student. The students were allowed to ask to have questions repeated, however,
the research assistants did not provide additional information. The research assistants recorded
the responses (See Appendix B for response book).
Computer Hardware
The study used IBM Thinkpad Laptop Computers, T43, with an Intel Pentium M 750 processor
(1.86GHz, 2MB L2 Cache, 533MHz FSB), with 2GB of RAM and a 70GB hard drive. The
following software was installed on the computers: Microsoft Windows XP Professional Service
Pack 2, E-Prime2 (Psychology Software Tools, 2008), and UTReader.
TTS Voices
The lowest and highest quality female TTS voices as established in Study 1 were used in the
current study. The highest quality TTS voice, AT&T Crystal (AT&T, 2007), is an example of
more recently developed synthetic speech, and is a commercially available synthetic voice
production software that has greater pitch and intonation control. In Study 1, AT&T Crystal
received the highest ratings for sounding the most like a human voice, was perceived as easier to
understand, and was rated as the TTS voice participants were most willing to listen to. The
lowest rated TTS voice was Microsoft Mary (MS Mary) by Microsoft (1998). This voice
received the lowest ratings, indicating it sounded more like a computer, was perceived to be
harder to understand, and participants indicated they were least likely to want to listen to this
voice. Both AT&T Crystal and MS Mary use a wave concatenation approach to string diphones,
phonemes, diphthongs, or syllables together to form words. AT&T Crystal has a larger number
of stored wave segments to choose from and is able to better approximate the prosody within text
(Beutnagel, Conkie, Schroeter, Stylianou, & Syrdal, 1998). In addition, AT&T Crystal has a
Text-To-Speech and Language Profiles 51
procedure to examine text structure in order to assign prosodic cues before concatenation occurs.
This allows for better production of prosodic cues by the TTS voice.
Phrasing Parsing Software
The Stanford Parser (The Stanford Natural Language Processing Group, 2010), an open source
JAVA based application, informed the placement of phrase pauses by determining noun and verb
phrase boundaries. The Stanford Parser can be downloaded from The Stanford Natural Language
Processing Group (2010) website. When a sentence is inputted, the parser works out the
grammatical structure. For example, it determines what groups of words go together such as
noun phrases, verb phrases, and inflections, and which words are the subjects or objects of a
verb. The grammatical structure is returned as the parse structure tree with all the components
and words of the sentence tagged. The Stanford Parser works on a probabilistic model based on
40,000 sentences in the Penn Treebank (for overview of project see (Marcus, Santorini, &
Marcinkiewicz, 1993). The Penn Treebank was developed at the University of Pennsylvania by
researchers who, using articles from the Wall Street Journal and Brown Corpus, parsed and
annotated all 40,000 sentences in a format that could be read by a computer. The Stanford
Natural Language Processing Group then developed probabilistic grammatical rules that are
applied to novel sentences in order to parse them (Klein & Manning, 2003). Twenty-five percent
of the noun phrases were checked by an individual trained in linguistics to ensure reliability of
the Stanford Parser for the current study. A 100% reliability score was obtained.
UTReader
To minimize variations in the presentation of passages, a “Wizard of Oz” procedure (see (Kelley,
1983) for description) was used. In this procedure, instead of using software in real time, parsing
of the passages was done off-line. XML tags were inserted within the passages, and software
(see Figure 6). The defined period used in the study was 500 ms. Once the pause tags were
added, the document was parsed into an XML document that retained the pause tag but did not
make it visible to the user (see Figure 7).
Insert Figure 6 about here
Text-To-Speech and Language Profiles 52
Insert Figure 7 about here
Use of Bimodal Presentation
Research on bimodal reading has shown the importance of presenting passages in both visual and
auditory formats. In one study, the comprehension scores of poor and proficient readers using
TTS were significantly lower when text was presented auditorily, in comparison to when text
was presented bimodally (Montali & Lewandowski, 1996). Furthermore, in the bimodal
condition, there was no significant difference between the poor and proficient readers’
comprehension scores, in contrast to when text was presented in auditory or visual only
conditions (for which the poor readers had lower comprehension scores than the proficient
readers). Based on these findings, in the present study, as each word was presented auditorily it
was simultaneously highlighted yellow on the computer screen. This is a common default setting
used in commercial TTS products (e.g., Kurzweil Educational Systems, 2006; Freedom
Scientific Group, 2010).
Presentation Rate
UTReader has a built in presentation rate adjuster. The software could adjust the presentation
rate from -5 to +5 with 0 as the default presentation rate. To determine WPM for each setting the
software was loaded up with a passage rated at the grade 7 level and containing11,840 words.
Next, the software created a wave file of the TTS voice reading aloud. To determine the
presentation rate, the length (in time) of the wave file was divided by the number of words in the
passage (see Table 16 for the presentation rate of each setting for the two voices).
Insert Table 16 about here
Presentation rates were randomized to prevent an order effect. Based on the work of Reynolds
and Givens (2001), the planned presentation rates were 130, 150, and 170 WPM. As the low
quality TTS and high quality TTS voices were unable to present the words at those exact speeds,
Text-To-Speech and Language Profiles 53
the average speeds of 117, 148, and 185 WPM were used, and coded as Slow, Medium, and Fast,
respectively (see Table 17 for the exact presentation rates of each voice).
Insert Table 17 about here
Types of Pauses
Text files were loaded into the Stanford Parser (The Stanford Natural Language Processing
Group, 2010), which output a parse structure tree for each sentence. Based on the parse structure
tree, XML tags were placed at the end of noun phrases using the UTReader. The UTReader
converted each XML tag to a 500ms pause. Therefore, a 500ms pause was inserted at the end of
all noun phrase boundaries.
A 500ms pause was chosen based on findings of eye-movement research, as well as studies that
have used pauses to enhance oral language communication. Eye-movement research has found
that the length of time for pauses at natural linguistic breaks (e.g., at clause boundaries and
commas), is approximately 500ms. Specifically, there is approximately a 444ms pause with
commas (Hirotani, Frazier, & Rayner, 2006), and a 627ms pause with noun phrases and at the
beginning of sentences (Staub, 2007). In one study, elderly participants who listened to time-
compressed speech1 that had silent intervals (i.e., pauses) inserted at the end of clause and
sentence boundaries had greater comprehension than when listening to time-compressed speech
without the pauses. The pause time of 125% of a normal pause yielded the best comprehension
scores. Unfortunately, the actual pause time was not reported (Wingfield, Tun, Kon, & Rosen,
1999). Another study found that an inter-clause pause of 40ms to 100ms was insufficient to
enhance the comprehension of elderly participants who listened to time-compressed speech
(Grdo-Salant, Fitzgibbons, & Friedman, 2007). Although the pause time is not reported in
Wingfield and colleagues (1999) study, the pause time they used was 125% longer than a regular
1 Time-compressed speech involves the process of taking an original recording and reducing the length of the
recording by shortening spacing between words. Therefore, the articulation of words remains the same but the speed at which phrases are presented increases. For the elderly who have slower processing speeds, time-compressed speech has been shown to impair their comprehension (Gordon-Salant & Fitzgibbons, 1993).
Text-To-Speech and Language Profiles 54
pause. If a regular pause is about 500 ms at the end of a sentence or clause boundary, they would
be expected the insert pause was about 625 ms. Taken together, these findings suggest that the
length of pauses differentially impacts comprehension. For the present study, a 500ms pause was
used in the hopes of maximizing comprehension.
To control for whether the presence of pauses alone improves comprehension, another condition
was presented to participants in which 500ms pauses were randomly inserted into passages.
Approximately the same number of random pauses were inserted as were presented in the phrase
pause condition. The randomized pauses were not closer than 3 words apart or further than 10
words apart.
In the third condition, only the pauses automatically generated by TTS were presented. This
condition is labeled the “no pause” condition as no additional pauses were added. The TTS
system automatically inserts pauses at grammatical markers, such as following a period or
comma. Therefore, these automatically inserted pauses were present in all conditions.
For both presentation rate and use of pauses, there were a total of 9 different conditions. That is,
3 Presentation Rates (Slow, Medium, Fast) by 3 Uses of Pauses (No Pause, Random Pause,
Phrase Pause). Two passages were presented in each condition for a total of 18 passages (see
Table 18).
Insert Table 18 about here
Listening Environment
Students wore headphones with the volume level equated to a mean of 735.5 dB. This is
consistent with the volume level used in the study by VenKatagiri (2004). Sessions were carried
out in a room at the participating schools. The rooms used were often in the main offices or close
to the participants’ classrooms. Only the experimenter and participant were present during
experimental sessions. Environmental noise was measured at the beginning of each testing
session with a sound level meter (Scosche SPL1000F), and the average noise level was 62
(SD=11) dB.
Text-To-Speech and Language Profiles 55
Procedures
Participants were welcomed and given an introductory briefing which informed them that
the test would take between forty to sixty minutes, and that they could take a brief break at any
point. They were informed that the first task involved listening to a computer read text that was
simultaneously presented on a computer screen. After having been randomly assigned to MS-
Mary or AT&T Crystal, the students listened to a passage presented to them by their assigned
voice for 30 minutes to allow them to become familiarized with the voice. Research has shown
that with 30 minutes of exposure to a TTS voice, the intelligibility scores of non-disabled adults
increased by 80%. This research also found that listening to the TTS voice for an additional 30
minutes resulted in no additional significant improvement in intelligibility (Reynolds et al.,
2000).
After listening to the sample text read by the computer, participants were told they would
then listen to the computer read passages at a slow, medium, and fast rate, and that in each
passage there would be either no additional pauses (No Pause), additional pauses inserted
randomly (Random Pause), or pauses inserted at the end of noun phrases (Phrase Pause). At the
end of each passage they were asked to answer 5 multiple choice questions about each passage.
Research assistants read the questions aloud to each participant. The text was left on the
computer screen and students were informed that they could refer to the text when answering the
questions. The text was displayed using Times New Roman 14-point font. Passages were
randomly ordered to control for practice effect.
After testing was completed, user preferences were obtained by asking participants what
presentation rate and use of pauses they preferred.
Testing was completed over one 90 minute session, and the students were allowed to take
breaks as needed. Upon completion, participants were thanked for their time. At a later date, the
classrooms that participants were drawn from received a one-hour training session on how to use
TTS and other literacy software when completing schoolwork.
Statistics
Text-To-Speech and Language Profiles 56
Item analysis of the questions was conducted to ensure appropriate level of difficulty. To
explore how presentation rate and use of pauses impacted comprehension scores, a 2 (Reading
Group) by 2 (TTS Voice) between subjects by 3 (Presentation Rate) by 3 (Type of Pause) within
subjects ANOVA was used. Post hoc comparisons were based on paired-t tests. The same
ANOVA design was used to examine user preferences.
Results
The 18 passages and corresponding multiple choice questions were piloted on a sample of grade
6 students before being used in the study. For multiple-choice questions with 4 alternatives, as
used in the present study, the desirable item difficulty is 63% correct responses (Goodwin,
1998). Item difficulty found to result in less than 30% or more than 90% correct responses needs
attention. Although the desired item difficulty was obtained in the pilot study, after analyzing the
data from the 101 participants, the item difficulty was not favorable. For the 18 passages and
corresponding multiple choice questions, the mean percentage of correct answers per question
was 26.29% (SD=6.45%), with item difficulty ranging from 11.9% to 40.6% correct responses,
and the median and mode were 26.73% and 25.70%, respectively (see Table 19). Given that each
multiple choice question had four possible answers, overall performance was not better than
chance responding. These results indicate that the items that were presented to the students were
too difficult and a floor effect was obtained. However, item difficulty may have been different
between the RDs and Controls. To investigate this, a 2 (Group) between by 90 (Items) within
subjects ANOVA was conducted on Item Accuracy. There was a significant main effect for
GROUP, F(1, 8460)=6.00, MSE=1.14, p>.05, л2=.00. Comparing the means, RDs had
significantly lower overall accuracy scores on all items (M=24.89%, SD=42.76%) than Controls
(M=27.19%, SD=43.73%). Although this was a significant difference, the power is very low due
to very large inter group variability in their responses to the items. As expected, there was also
significant inter Item differences, F(89, 8460)=2.09, MSE=.40, p<.001, л2=.02. Although post
hoc tests were completed, the pattern of item differences was not meaningful and therefore is not
reported. There was also a significant interaction between Group and Items, F(89, 8460)=1.39,
MSE=0.19, p<.01, л2=.01. Post hoc tests showed that there were 11 items that Controls had
significantly higher accuracy scores on than RDs, and 5 Items for which RDs had significantly
higher accuracy scores than Controls (See Table 19 for means and standard deviations). These
Text-To-Speech and Language Profiles 57
results suggest that the test was too difficult for the participants in this study, and as such, the
results are not interpretable.
Insert Table 19 about here
Nevertheless, for reporting in this dissertation, the following analyses were conducted to
investigate the effect that manipulating Presentation Rate, Pauses, and Voice had on the
comprehension scores of the RD and Control students. A 2 (Group) by 2 (TTS Voice) between
subjects and 3 (Presentation Rate) by 3 (Type of Pause) ANOVA was conducted with overall
passage comprehension score as the dependent variable (See Table 20 for descriptive statistics).
There was a significant main effect for Reading Group (F(1, 79)=41.21, MSE=699.28, p<.001,
л2=.05) with RD students scoring lower overall (M=4.48, SD=.22) than Controls (M=6.42,
SD=.21). In addition, two significant interactions were found. The first interaction was between
Pause and Voice (F=3.98, MSE=,p<.05). Post hoc pairwise comparisons revealed a significant
difference between Random Pause and the two Voices (low quality and high quality TTS
voices). When the computer presented text with a Random Pause, students that were assigned to
MS-Mary (M=5.82, SD=.25) had higher comprehension scores than students who listened to
AT&T Crystal (M=5.05, SD=.25; See Figure 8). A second significant interaction was found
between Presentation Rate, TTS Voice, and Group (F(2,158)=4.39, MSE=11.74, p<.01, л2=.05).
Post hoc pairwise comparisons indicated that for all comparisons RD students had lower
accuracy scores than Controls. In addition, amongst the RD students, those who listened to MS-
Mary had higher comprehension scores than those who listened to AT&T Crystal at the Slow
and Medium Presentation Rate (see Figure 9). Furthermore, in the RD group there was a
significant difference between Slow and Fast Presentation Rate while listening to AT&T Crystal,
with the Fast Presentation Rate resulting in significantly higher comprehension scores. As such,
the power of the results is very low and therefore the results could be spurious.
Insert Table 20 about here
Insert Table 21 about here
Text-To-Speech and Language Profiles 58
Insert Figure 8 about here
Insert Figure 9 about here
As the main findings of the study are not interpretable, an examination of group differences was
carried out. Analyses were conducted to compare user preferences in regards to their preferred
presentation rate and use of pause. A 2 (Group) by 2 (TTS Voice) between subjects by 3 (Pause)
within subjects ANOVA was conducted on participants' ratings. There was a significant main
effect for Pause, F(2,84)=32.34, MSE=42.93, p<.001. Post hoc showed Random Pause (M=2.36,
SD=1.28) was less favoured than No Pause (M=3.68, SD=1.12) or Phrase Pause (M=3.45,
SD=1.24). A 2 (Group) by 2 (TTS Voice) between subjects by 3 (Presentation Rate) within
subjects ANOVA was also run for participants' preference. A significant difference was found
for presentation rate, F(2, 84)=28.89, MSE=48.36, p<.001. Post hoc comparisons showed that
students did not prefer the Slow presentation rate (M=2.36, SD=.13) over the Medium (M=3.78,
SD=.12) and Fast (M=3.54, SD=.16; see Table 22) presentation rates. No other significant
differences were found.
Insert Table 22 about here
Discussion
When TTS software presents text auditorily it does so at a consistent rate starting at the
beginning of a sentence until it reaches a grammatical marker (e.g., periods, commas, colons, and
semi colons). It was thought that the continuous presentation of text may tax working memory
(WM), and may explain why studies have produced inconsistent findings in regards to
comprehension of connected discourse presented via TTS. In addition, the use of a lower quality
TTS voice has been shown to also tax WM (see Study 1). The aim of the present study was to
investigate methods that may reduce demands on WM and thereby improve comprehension, by
Text-To-Speech and Language Profiles 59
manipulating presentation rate, use of pauses, and the quality of the TTS voice. To this end, the
study set out to establish an equivalent readability level and appropriate item difficulty of
eighteen expository text passages. A great effort was dedicated to establish text difficulty
equivalence and to ensure acceptable item difficulty. Unfortunately, the resultant item difficulty
was not acceptable, and therefore the results need to be interpreted with caution. In what follows
a number of possible interpretations for the lack of effect are raised and discussed.
The 18 passages and the comprehension questions that were presented after each passage was
listened to were piloted on five students in grade 6 who reported not have any reading
difficulties, and the passages were found to have an acceptable item difficulty. It is possible that
the passages and questions were too difficult, but that this was not identified due to the pilot
group having different characteristics leading to better comprehension (e.g., greater motivation,
higher IQ, better reading ability, the activation of metacognitive strategies such as taking more
time to answer the questions, rereading the passages, and so on). It is also possible that an
acceptable level of item difficulty would have been found if the participants were given the
opportunity to read them unaided (as was done in the pilot condition), or if they were able to
employ comprehension enhancing strategies such as varying eye fixation times and carrying out
regressions. It has been well documented that strategies such as predicting upcoming text
content, constructing self-explanations and clarifications, generating and answering questions,
identifying the gist of the meaning, and self monitoring of comprehension, results in improved
reading comprehension (McNamara, 2007; National Reading Panel, 2000; Pressley & Harris,
2006). When passages were presented by TTS, participants who may have tried to use these
strategies would have concurrently heard the text presented auditorily without interruption. This
may have created a condition of dual codes (e.g., auditory listening and visual reading), taxing
WM and interfering with the use of comprehension enhancing strategies, and may explain the
poor comprehension scores of the passages when presented by TTS. Although phrase pauses of
500ms were inserted in one of the TTS conditions, students did not have control over when to do
such things as pause and regress, and for how long, as they would with unaided reading.
This hypothesis most likely applies to typically developing students, whereas students with a RD
would nevertheless be expected to benefit from TTS in comparison to unaided reading. That is,
students with a RD do not employ these reading comprehension strategies as effectively, so the
dual code present with TTS is not expected to significantly interfere with their comprehension.
Text-To-Speech and Language Profiles 60
In fact, it has been shown that when text is presented simultaneously in auditory and visual form
to students with a RD their comprehension is better than when their reading is unaided (Montali
& Lewandowski, 1996). This was also supported by a study by Higgins and Raskind (1997), who
compared the reading comprehension of college students with severe, mild, moderate, or no
reading difficulties when reading unaided or using TTS. That study found that only those with
severe reading difficulties had improved comprehension when using TTS, whereas the other
participants experienced a decline in comprehension scores when using TTS in comparison to
unaided reading. Unfortunately, in the current study it was not feasible to have the students read
the same passages without the assistance of TTS in order to compare their unaided and TTS
reading comprehension. A follow up study to determine this is needed. It is also possible that the
passages and questions were indeed too difficult. Again, a follow up study using different
passages is needed. As Fletcher (2006) stated in a special issue of the Scientific Study of
Reading dedicted to reading comprehension, “The clear consensus across these articles is that the
measurement issues are complicated, reflecting the complex, multidimensional nature of reading
comprehension” (p. 323). Indeed, developing 18 passages that yield the same readability levels
and have questions of equivalent difficulty is remarkably complex. The process followed to
develop the passages was in line with past recommendations. Foorman et al. (2004) and Hiebert
(2002) have showed that vocabulary, number of syllables per sentence, and variations in text
characteristics are related to the readability of a passage. In the current project, great effort was
taken to follow these recommendations and yet the desired comprehension scores were not
obtained.
It is possible that the length of the passages and density of information in these texts may have
been too demanding. In contrast to the 150 word passages used in the current study, many
previous studies that have investigated comprehension of TTS voices have had participants listen
to short, 4 to 8 word sentences, and that task was to indicate whether the last word of the
sentence is plausible (Paris, Gilson, & Thomas, 1995; Reynolds & Givens, 2001; Reynolds,
Issaac-Duvall, & Haddox, 2002; Venkatagiri, 1991). For example, an implausible sentence
would be “The ice is hot”. In these studies, response latency of correct answers is used to assess
item difficulty.
Perhaps, had short statements requiring a yes/no response been used in the current study, it
would have been possible to measure the impact that presentation rate and use of pauses had on
Text-To-Speech and Language Profiles 61
response latency. Response latency would be used in this condition instead of accuracy scores as
participants in all conditions would be expected to achieve a high accuracy score due to the
simple nature of the task. Response latency, however, would be expected to vary as more
demanding conditions would require additional cognitive processing. This would indicate which
conditions reduce WM load as shown by shorter response latencies, and would therefore be
expected to facilitate comprehension. At the same time, note that it is possible to respond
correctly to such statements on the basis of prior knowledge without relying on the text. It can be
hypothesized that text presented by TTS at a slower rate and/or with phrase pauses would result
in shorter response latency. In addition, an interaction would be expected between phrase pause
and presentation rate, such that phrase pauses would result in shorter response latency even with
a fast presentation rate. This finding would be expected as the pauses would allow for short-term
memory to retain the presented acoustic information, and during the pause, the central executive
could facilitate integration of the information into a comprehension schema. Therefore, when the
last word (making the sentence plausible or not) is heard, the individual would already have a
conceptual understanding of the passage leading to a quicker response.
Plausible sentences are an interesting paradigm and were considered during the
conceptualization of this study; however they do not reflect how TTS is commonly used. It was
desirable to replicate the actual conditions students encounter when using TTS for academic
work. Therefore, the current study aimed to go beyond short sentences and investigate
comprehension of passages from grade appropriate textbooks. Longer passages are commonly
used in reading comprehension tests such as the WIAT-IV, GORT, and the Iowa Test of Basic
Reading Ability. These standardized reading comprehension measures could not be used as their
passages increase in difficulty throughout the tests, whereas the design of the current study
required 18 passages at the same readability level.
The passages created were very dense with factual information, to an extent that they may have
been a better test of memory than reading comprehension. A common reading strategy of
proficient readers is to reread sections of text to find the answers to questions (e.g., Daneman &
Hannon, 2001; Farr, Pritchard, & Smitten, 1990; Skakum, Maguire, & Cook, 1994; Pressley &
Harris, 1995). An observation made during the administration of the tests was that the
participants did not review the passages when presented with questions, despite the fact that the
texts remained accessible on the computer screen and the fact that the participants were informed
Text-To-Speech and Language Profiles 62
that they could reread the text before responding to the comprehension questions. The
participants in this study probably relied on the information they had listened to with only one
exposure per passage. The combination of the use of TTS, text length, density of facts,
compounded with lack of experience with or motivation to activate comprehension monitoring
strategies probably overtaxed their WM and ability to respond to the comprehension questions.
Andreeassen (2010) has shown that WM accounts for a significant amount of variance in
reading comprehension, even after controlling for gender, word recognition, comprehension
strategies, and motivation for long passages (i.e., 95 word passages). The even greater length of
the passages in the current study, at 150 words, probably exceeded the WM capacity of
participants, resulting in poorer comprehension.
Future research that looks at the comparison of TTS and unaided reading should use a
combination of plausible sentences and passages to assess comprehension. The plausible
sentences will allow for the assessing of the cognitive load that TTS or unaided reading places on
the reading ability groups, while the longer passages will assess the interaction of compression
strategies, motivation, WM capacity, with the modality of reading (TTS vs unaided).
It is also possible that problems associated with the construction of the multiple choice questions
contributed to the results. Each multiple choice question consisted of 4 options, with one correct
answer, two plausible distractors, and one non-plausible distractor. The item analysis revealed
that many questions had two responses with the same level of endorsement, indicating that
participants found it difficult to distinguish between the correct answer and one of the distractors.
In a follow up study, questions need to be further developed to ensure that participants are better
able to distinguish the correct response.
For many individuals with a RD, the use of TTS is recommended as a tool that can help them
access information and close the learning gap created when a student's ability is not sufficient to
meet the requirements of the curriculum (Edyburn, 2005). It is necessary to try to both remediate
academic weaknesses and provide technology to compensate for these weaknesses. When both
are done, students should show gains in academic performance. The current study proposed that
a third component is essential to improve academic performance. That is, it was proposed that
the settings of TTS should be customized based on the learning profiles of users. It was thought
that customizing TTS presentation rate, use of pause, and quality of voice, would influence the
Text-To-Speech and Language Profiles 63
comprehension of students with a RD by impacting the extent of demands on their WM. It was
hypothesized that presenting the text at a slow or medium rate, with high quality TTS and phrase
pauses, would reduce WM load and increase the comprehension of students with a RD.
Unfortunately, due to the passages having an item difficulty level that was too high, the study
was not able to establish if this was the case.
It is important to evaluate how to match TTS customizations to learning profiles, as students may
not necessarily select settings best suited for them. Participants were asked which presentation
rate and use of pause condition they preferred. There was no significant difference between the
controls and students with a RD. Both groups indicated that their preferred presentation rate was
at the medium or fast speed, which is understandable as it approximates a normal conversational
rate of speech. However, as noted above, these speeds may be in fact too demanding on WM for
students with a RD.
As for the use of inter-clause pauses, the participants were not unanimous in their preferences.
Surprisingly, students with a RD did not prefer the use of phrase pauses over no pauses, nor did
they prefer the slow presentation rate, even though these customizations were hypothesized to
reduce WM load. It is thought that students may choose presentation rate based on natural
conversation rates, wanting the TTS voice to speak faster to finish the reading material more
quickly, or at a speed they perceive they can comprehend well at. Although students may prefer a
faster reading speed than the rate hypothesized to improve their comprehension, research is still
needed to ascertain whether presentation rate impacts comprehension.
Past research has shown that TTS has the potential to be a useful tool that can help students with
a RD improve comprehension, but additional research is needed to identify methods to optimize
their comprehension when using TTS. Replication of this study, with modifications based on the
above recommendations, is warranted. In order to address the possibility that the hypothesized
results were not found due to measurement issues it is necessary to replicate this research with
easier passages that are less dense in terms of information, and with different, reliable modes of
testing comprehension. In addition, the comprehension of the passages in an unaided versus TTS
condition is required to clarify whether the comprehension of students with a RD improves with
TTS.
Text-To-Speech and Language Profiles 64
Chapter 3
Language Profiles of Language Impaired, Specific Reading Impaired, and Typically-Developing Students
In studies 1 and 2, the intelligibility and comprehensibility of text-to-speech (TTS) software was
evaluated with students who either had a reading disability or were typically-developing. The
language and literacy ability of the two groups was assessed to understand whether differences in
their abilities may explain their differing TTS intelligibility and comprehensibility scores. In
conducting this analysis it was observed that the reading disabled group was in fact comprised of
two separate groups. The first group conformed to the reading disabled classification (i.e., 1
standard deviation below the mean on ellision and word attack standard scores), whereas the
second group had much greater language impairments, and was identified based on scoring 1
standard deviation of a standard score below the mean on sentence repetition, receptive
vocabulary, and oral language comprehension. Due to the unexpected presence of students with
specific language impairment (SLI), an analysis was conducted to compare their profile with the
reading disabled and typically-developing students.
Although there are 3 distinct groups within this data set, the profiles of the three groups could not
be analyzed in study 1 and 2 as there was a significant difference in the number of participants in
the between-subject conditions. Non-parametric statistics could not be used as the 3 (Voice) by 3
(Group) design could not be supported. Therefore, this analysis investigated the prosodic
sensitivity of SLI, reading impaired (RI; formerly referred to as reading disabled), and typically-
developing students between grades 6 to 8.
Students who have a SLI have been reported to have difficulty with speech intelligibility, with
their oral language lagging behind other areas of development (Leonard, 1998). These
individuals often experience impairment in language processing, such as vocabulary and
grammar, and have difficulty with phonological skills. These weaknesses lead to difficulty
acquiring basic word reading abilities (Bishop & Snowling, 2004; Snowling & Hayiou-Thomas,
2006). It has been argued that these difficulties may be due to limitations in the capacity of the
Text-To-Speech and Language Profiles 65
phonological short-term memory of SLI students (Gathercole & Baddeley, 1990). In comparison
to typically-developing students, SLI students store less phonological information in short-term
memory (Elizabeth, Lambon Ralph, & Baddeley, 2004). To help identify students with SLI,
Conti-Ramsde, Botting, and Faragher (2001) investigated a set of psycholinguistic markers.
Based on previous literature, Conti-Ramsde and colleagues (2001) used a third person singular
task, a past-tense task, a nonword repetition task, and a sentence repetition task. Although the
group of psycholinguistic markers showed high levels of sensitivity (90%), specificity (85%),
and overall accuracy (88%), the sentence repetition task was shown to be the most useful. It is
thought that this may be due to having to hold in memory the complete sentence before repeating
it. This would rely heavily on short-term auditory memory to hold the sentence verbatim to
reproduces it. As sentence repetition is a good identifier of students with SLI, then a key
cognitive difficulty to examine would be short-term auditory memory.
Similarly to SLI students, RI students also have difficulty with phonological skills and word
reading. These weaknesses cannot be accounted for by low intelligence, poor educational
opportunities, or acquired neurological damage (Snowling, 2000). The reading and spelling
difficulties of RI students have been attributed to two core cognitive deficits: phonological
awareness and naming speed. Phonological awareness is the understanding that language is
comprised of small units of sound and the ability to manipulate these sounds (Shankweiler &
Fowler, 2004). RI students, in comparison to their typically-developing peers, score lower on
phonological awareness tests that assess the ability to segment, isolate, and blend phonemes
(Wagner & Torgesen, 1987; Wagner, Torgesen, & Rashotte, 1999). The National Reading Panel
(2000) stated that combined with letter knowledge, phonological awareness is the strongest
predictor of reading ability.
Prosody is the phonological system comprised of the tempo, rhythm, and stress of language, and
plays an important role in language and reading. One common measure of prosody is sensitivity
to speech rhythm (Wood, 2006; Wodd & Terrelly, 1998) (Wood C. , 2006; Wood & Terrell,
1998). Infants are able to detect rhyming as early as 7.5 months of age, which is thought to
support development of their lexicon (Jusczyk, Houston, & Newsome, 1999) and initial reading
development (Wood & Terrell, 1998). Rhyming also supports the development of reading skills,
with children’s pre-literate rhyme detection ability being a predictor of initial reading
development (Wood & Terrell, 1998). Furthermore, prosodic ability has been linked to both
Text-To-Speech and Language Profiles 66
word-level reading and reading comprehension (Whalley & Hansen, 2006). For word-level
reading, research has found a relationship between the prosodic skills and decoding speed of
both children and adults (Schwanenflugel, Hamilton, & Kuhn, 2004; Kitzen, 2001). One study
found that rhythm production (an aspect of prosody) correlates significantly with the reading
ability of children from grades 1 to 5 (David, Wade-Woolley, Kirby, & Smithrim, 2007). In
addition, the study found that rhythm production predicted significant variance in the reading
ability of grade 5 students when phonological awareness or naming speed is controlled for. In
addition, Whalley and Hansen (2006) found that the performance of children on a component
nouns task predicted unique variance in word identification. The component nouns task assesses
the prosodic features of intonation, stress, and pauses by having children distinguish between
phonemically identical compound nouns (e.g., ‘ice-cream’) and noun phrases (e.g., ‘ice, cream’).
It may be that prosodic information supports word reading by helping access words from the
mental lexicon (Lindfield, Wingfield, & Goodglass, 1999).
Prosody is also important for reading comprehension. In one study of grade 4 students, prosodic
skills were shown to explain a unique part of the variance in reading comprehension scores after
controlling for word reading accuracy, phonological awareness, and non-phonemic rhythmic
sensitivity (Whalley & Hansen, 2006). The contribution of prosodic skills to reading
comprehension may be mediated through oral language comprehension, which is consistent with
the simple view of reading. The simple view of reading argues that language skills used for
listening comprehension are the same as those needed for reading comprehension (Hoover &
Gough, 1990). If the simple view of reading is correct, individuals with difficulty reading may
also have difficulty processing prosodic information.
Both SLI and RI students have difficulty with processing phonological information and word
reading (Bishop & Snowling, 2004). The current study investigated whether these two
populations also have difficulty with processing prosodic information. To compare the prosodic
ability of SLI, RI, and typically-developing students, two measures of prosodic sensitivity were
administered. The first measure, the sensitivity to phrase rhythm task, assesses prosodic
sensitivity at the phrase level. This measure is a reiterative speech task which retains the prosodic
patterns of phrases (e.g., stress, rhythm, and intonational pattern) by replacing phonemic
information with a single meaningless syllable, in this case ‘dee’ (Nakatani & Schaffer, 1978).
Students listened to a nondistorted phrase, followed by two distorted phrases using the “dee”
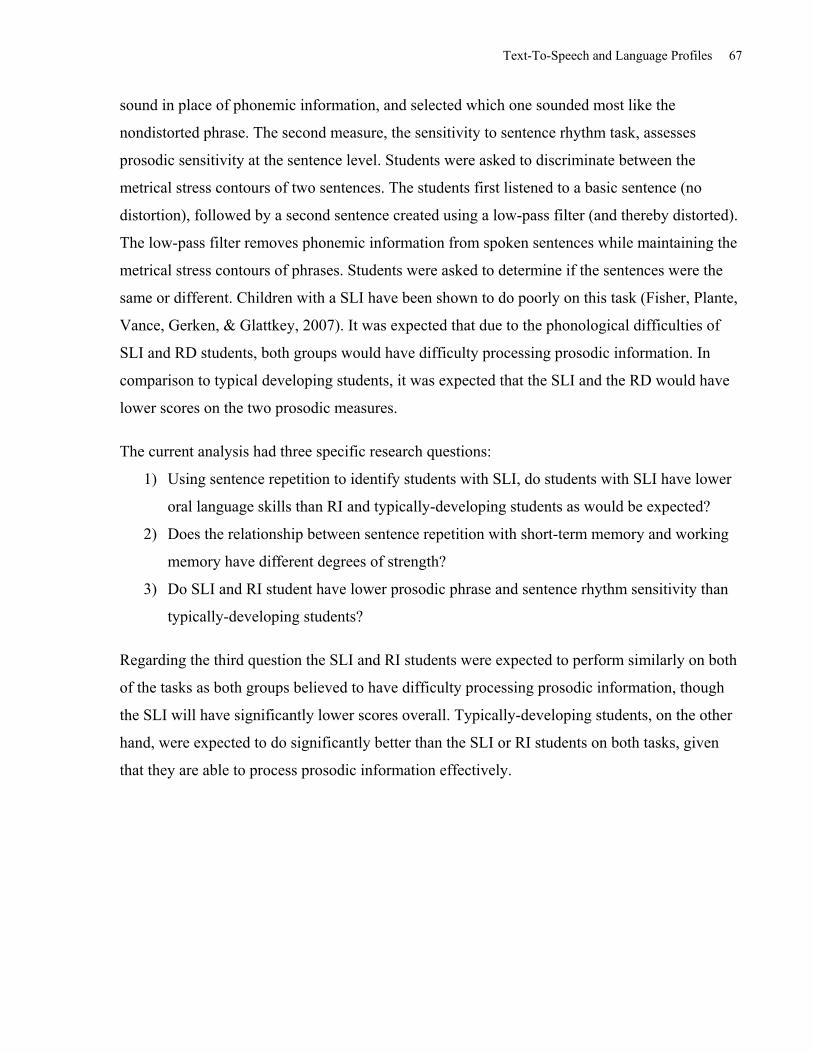
Text-To-Speech and Language Profiles 67
sound in place of phonemic information, and selected which one sounded most like the
nondistorted phrase. The second measure, the sensitivity to sentence rhythm task, assesses
prosodic sensitivity at the sentence level. Students were asked to discriminate between the
metrical stress contours of two sentences. The students first listened to a basic sentence (no
distortion), followed by a second sentence created using a low-pass filter (and thereby distorted).
The low-pass filter removes phonemic information from spoken sentences while maintaining the
metrical stress contours of phrases. Students were asked to determine if the sentences were the
same or different. Children with a SLI have been shown to do poorly on this task (Fisher, Plante,
Vance, Gerken, & Glattkey, 2007). It was expected that due to the phonological difficulties of
SLI and RD students, both groups would have difficulty processing prosodic information. In
comparison to typical developing students, it was expected that the SLI and the RD would have
lower scores on the two prosodic measures.
The current analysis had three specific research questions:
1) Using sentence repetition to identify students with SLI, do students with SLI have lower
oral language skills than RI and typically-developing students as would be expected?
2) Does the relationship between sentence repetition with short-term memory and working
memory have different degrees of strength?
3) Do SLI and RI student have lower prosodic phrase and sentence rhythm sensitivity than
typically-developing students?
Regarding the third question the SLI and RI students were expected to perform similarly on both
of the tasks as both groups believed to have difficulty processing prosodic information, though
the SLI will have significantly lower scores overall. Typically-developing students, on the other
hand, were expected to do significantly better than the SLI or RI students on both tasks, given
that they are able to process prosodic information effectively.
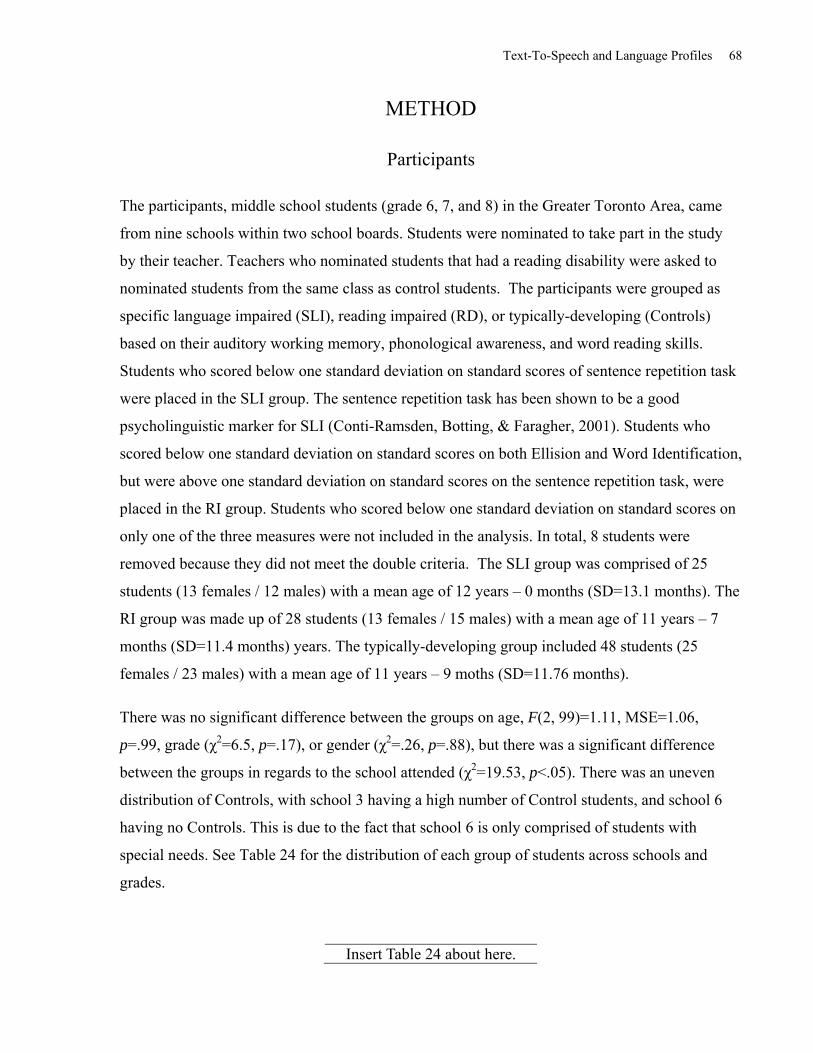
Text-To-Speech and Language Profiles 68
METHOD
Participants
The participants, middle school students (grade 6, 7, and 8) in the Greater Toronto Area, came
from nine schools within two school boards. Students were nominated to take part in the study
by their teacher. Teachers who nominated students that had a reading disability were asked to
nominated students from the same class as control students. The participants were grouped as
specific language impaired (SLI), reading impaired (RD), or typically-developing (Controls)
based on their auditory working memory, phonological awareness, and word reading skills.
Students who scored below one standard deviation on standard scores of sentence repetition task
were placed in the SLI group. The sentence repetition task has been shown to be a good
psycholinguistic marker for SLI (Conti-Ramsden, Botting, & Faragher, 2001). Students who
scored below one standard deviation on standard scores on both Ellision and Word Identification,
but were above one standard deviation on standard scores on the sentence repetition task, were
placed in the RI group. Students who scored below one standard deviation on standard scores on
only one of the three measures were not included in the analysis. In total, 8 students were
removed because they did not meet the double criteria. The SLI group was comprised of 25
students (13 females / 12 males) with a mean age of 12 years – 0 months (SD=13.1 months). The
RI group was made up of 28 students (13 females / 15 males) with a mean age of 11 years – 7
months (SD=11.4 months) years. The typically-developing group included 48 students (25
females / 23 males) with a mean age of 11 years – 9 moths (SD=11.76 months).
There was no significant difference between the groups on age, F(2, 99)=1.11, MSE=1.06,
p=.99, grade (χ2=6.5, p=.17), or gender (χ2=.26, p=.88), but there was a significant difference
between the groups in regards to the school attended (χ2=19.53, p<.05). There was an uneven
distribution of Controls, with school 3 having a high number of Control students, and school 6
having no Controls. This is due to the fact that school 6 is only comprised of students with
special needs. See Table 24 for the distribution of each group of students across schools and
grades.
Insert Table 24 about here.
Text-To-Speech and Language Profiles 69
Materials
Nonverbal Reasoning: Nonverbal reasoning will be measured using the Matrix Analogies Test
(Naglieri, 1989). The test involves having students point to the design that completes a pattern.
Working Memory: Digits Forward and Digits Backwards from the Wechsler Intelligence Scale
for Children-Fourth Edition (WISC-IV) was used to assess working memory. In Digits Forward,
students are asked to repeat back number strings starting with four digits. The number of digits
is increased until the student makes three consecutive errors. Digits Backwards has students
repeat back a string of digits in the opposite order than the order they were presented.
Rapid Automatized Naming: The Number and Letter Stimuli Subtest, taken from the CTOPP,
consists of 36 digits presented in a 9 x 4 array (Wagner, Torgesen, & Rashotte, 1999). This task
was scored according to naming time in seconds as well as the number of uncorrected naming
errors.
Phonological Awareness: The Ellision subtest of the Comprehensive Test of Phonological
Processing (Wagner, Torgesen, & Rashotte, 1999) was administered. For the Ellision subtest,
students say a word without saying a part of the word (e.g., “Say toothbrush without saying
tooth”). Testing is discontinued after three consecutive errors.
Sensitivity to Phrase Rhythm: The DEEdee task developed by Whalley and Hansen (2006) as
used to assess sensitivity to phrase rhythm. In this task, students listen to phrases consisting of
the titles of cartoon movies or television shows (e.g., “The Simpsons”). The title is followed by
two DEEdee phrases. One DEEdee phrase retains the prosodic structure of the original phrase
(e.g., “deeDEEdee”), whereas the other does not (e.g. “DEEdeeDEE”). In the study, the students
were asked to indicate which of the two phrases matched the original phrase. There were two
practice trials and 18 test trials.
Sensitivity to Sentence Rhythm: This task was taken from Clin, Wade-Woolley, and Heggie
(2009), who had adapted it from Wood and Terrell (1998). The Freddy/Eddy task involves
having to discriminate between the metrical stress contours of two sentences. Students heard two
Text-To-Speech and Language Profiles 70
basic sentences: the first with no distortions (e.g., “She made many balloons for the party”),
whereas the second sentence was created using a low-pass filter to create distortions. The low-
pass filter removed phonemic information while maintaining the prosodic contour of the
sentences. The Pratt audio editing computer software (Boersma & Weenink, 2008; Praat: Doing
Phonetics by Computer, Version 4.6.34) was used to create the low-pass filter. The low-pass
filtered sentences were either the same or different (e.g., “She played higher tunes than her
brother did”, in comparison to the example sentence given above). After hearing the two
sentences, students were asked to state if they had the same rhythm. All sentences in the task
were 10 syllables in length. There were two practice trials and 14 test trials.
Sentence Repetition: The Recalling Sentences task of the Clinical Evaluation of Language
Fundamentals – 4th edition (CELF-4) was used to assess language processing and auditory
working memory (Semel, Wiig, & Secord, 2003). Participants listened to spoken sentences of
increasing length and complexity and orally repeated the sentences.
Decoding Skill: The Word Attack subtest of the Woodcock Reading Mastery Test-Revised
(WRMT-R) was used to evaluate the ability to sound out words. The Word Attack subtest
consists of 50 pseudowords (e.g., “tat” and “op”) that comply with English phonology.
Word Reading: The Word Identification subtest of the WRMT-R was used to evaluate the word
recognition skills of the students (Woodcock, 1987). On this subtest students read as many real
words as they could.
Receptive Vocabulary: The Peabody Picture Vocabulary Test – III (PPVT-III; Dunn & Dunn,
1997) was used to evaluate receptive vocabulary. The students were asked to select one of four
pictures that matched the meaning of orally-presented words.
Reading Comprehension: The Passage Comprehension subtest of the Woodcock Language
Proficiency Battery—Revised (WLPB-R; Woodcock, 1991) was used to evaluate reading
comprehension. On this closed subtest, students read brief but progressively more difficult
passages and filled in a missing word.
Listening Comprehension: The Listening Comprehension subtest of the WLPB-R (Woodcock,
1991) was used to evaluate oral language proficiency. Students were asked to provide the final
word of orally-presented sentences.
Text-To-Speech and Language Profiles 71
Procedures
Following agreement to participate in the study from school board officials, school principals,
and classroom teachers, teachers distributed a letter and consent form to students that described
the study. Students whose parents consented were enrolled in the study. During the school day,
students were excused from class to participate in the project. The study was explained to each
student and assent was obtained. Following this, the language and literacy test battery was
administered. Testing lasted one hour on average, and students were allowed to take breaks at
any time. Testing took place between March and June of 2009 and was conducted by research
assistants and the principal investigator.
Setting
Testing was carried out in rooms at each school which were often near the main office or the
students’ classrooms. Only the experimenter and student were present during testing. Noise
levels were established by using a sound level meter, with the average noise level being 62 db.
Past research has shown that classroom noise levels vary between 47 to 73.3 dB, with a mean of
62.6 dB (Sisto et al, 2007).
Results
The first goal of this analysis was to determine whether the sentence repetition task could
differentiate between individuals with a SLI, a RI, and who are typically-developing. To
investigate whether the Ability Groups (SLI RI, and Controls) scored differently on the language
and literacy measures, a One-way MANOVA was conducted. The means and standard
deviations are presented in Table 25. Raw scores for the language and literacy measures were
used as dependent variables, and Ability Groups were used as independent variables. The
multivariate test of differences between groups used the Wilks’ Lambda criteria, and was
statistically significant (Λ=.094, F(30, 163) =12.37; p<.001). Follow-up multivariate
comparisons showed that there was a significant group effect for all language and literacy
measures, except for RAN Digits and RAN Letters (see Table 26 for Main Effect of Ability
Group on Language and Literacy measures).
Text-To-Speech and Language Profiles 72
Insert Table 26 about here
Post hoc tests (Games-Howell) within conditions were conducted to examine individual group
differences. (See Table 25 for Ability Group differences on the dependent variables). The results
revealed clear differences between the three groups. The Controls obtained the highest scores on
all language and literacy measures. The RI group had specific weaknesses in Ellision, Word
Identification, Word Attack, and RAN scores. In contrast, the SLI group showed the greatest
weakness in the language-related areas of Vocabulary, Listening Comprehension, Sentence
Repetition, and Working Memory. Regarding the prosody measures, an interesting finding
appeared; on the DEEdee task, there was no significant difference between the SLI and RI
groups, although both groups scored significantly lower than Controls. Both the SLI and RI
groups scores also were not significantly better than chance responding (z=1.66, p>.05 and
z=.99, p>.05 respectively) whereas the Control group did have significantly better than chance
scores (z=2.06, p<.05). Furthermore, on the Freddy/Eddy task there was no difference between
the RI and Control groups with both groups scoring significantly above chance (z=2.21, p<.05
and z=3.11, p<.01 respectively), however the SLI group scored significantly lower. Like on the
DEEdee task, the SLI group did not score above chance (z=1.79, p>.05). To help illustrate
comparisons between the three groups, all scores were converted to z-scores and the individual
group means were calculated for each measure (see Figure 10).
Insert Figure 10 about here.
In addition, Pearson’s r correlations showed that both the DEEdee and Freddy/Eddy tasks
correlated significantly with all of the language and literacy measures (see Table 23). Of
particular interest, the Sentence Repetition had a stronger correlation with the Freddy/Eddy task
than the DEEdee task. This indicates that Freddy/Eddy has a stronger relationship with Sentence
Repetition, such that as a student’s score on Sentence Repetition increases, so does their score on
the Freddy/Eddy task.
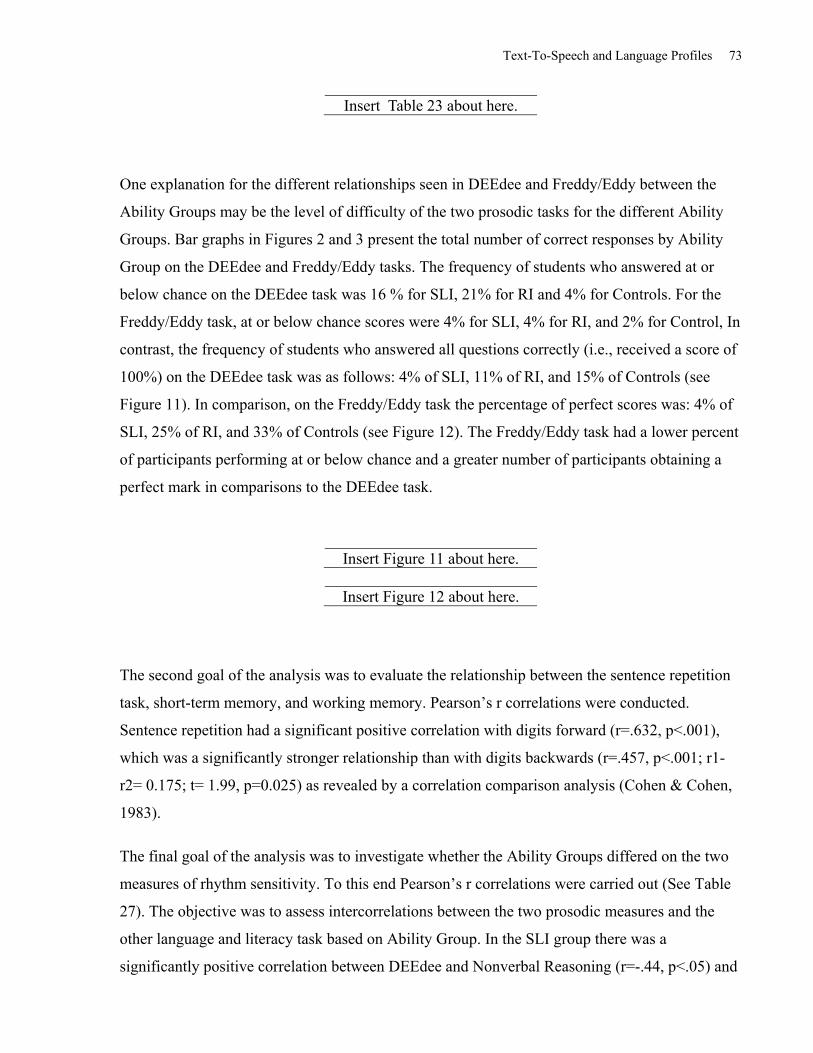
Text-To-Speech and Language Profiles 73
Insert Table 23 about here.
One explanation for the different relationships seen in DEEdee and Freddy/Eddy between the
Ability Groups may be the level of difficulty of the two prosodic tasks for the different Ability
Groups. Bar graphs in Figures 2 and 3 present the total number of correct responses by Ability
Group on the DEEdee and Freddy/Eddy tasks. The frequency of students who answered at or
below chance on the DEEdee task was 16 % for SLI, 21% for RI and 4% for Controls. For the
Freddy/Eddy task, at or below chance scores were 4% for SLI, 4% for RI, and 2% for Control, In
contrast, the frequency of students who answered all questions correctly (i.e., received a score of
100%) on the DEEdee task was as follows: 4% of SLI, 11% of RI, and 15% of Controls (see
Figure 11). In comparison, on the Freddy/Eddy task the percentage of perfect scores was: 4% of
SLI, 25% of RI, and 33% of Controls (see Figure 12). The Freddy/Eddy task had a lower percent
of participants performing at or below chance and a greater number of participants obtaining a
perfect mark in comparisons to the DEEdee task.
Insert Figure 11 about here.
Insert Figure 12 about here.
The second goal of the analysis was to evaluate the relationship between the sentence repetition
task, short-term memory, and working memory. Pearson’s r correlations were conducted.
Sentence repetition had a significant positive correlation with digits forward (r=.632, p<.001),
which was a significantly stronger relationship than with digits backwards (r=.457, p<.001; r1-
r2= 0.175; t= 1.99, p=0.025) as revealed by a correlation comparison analysis (Cohen & Cohen,
1983).
The final goal of the analysis was to investigate whether the Ability Groups differed on the two
measures of rhythm sensitivity. To this end Pearson’s r correlations were carried out (See Table
27). The objective was to assess intercorrelations between the two prosodic measures and the
other language and literacy task based on Ability Group. In the SLI group there was a
significantly positive correlation between DEEdee and Nonverbal Reasoning (r=-.44, p<.05) and
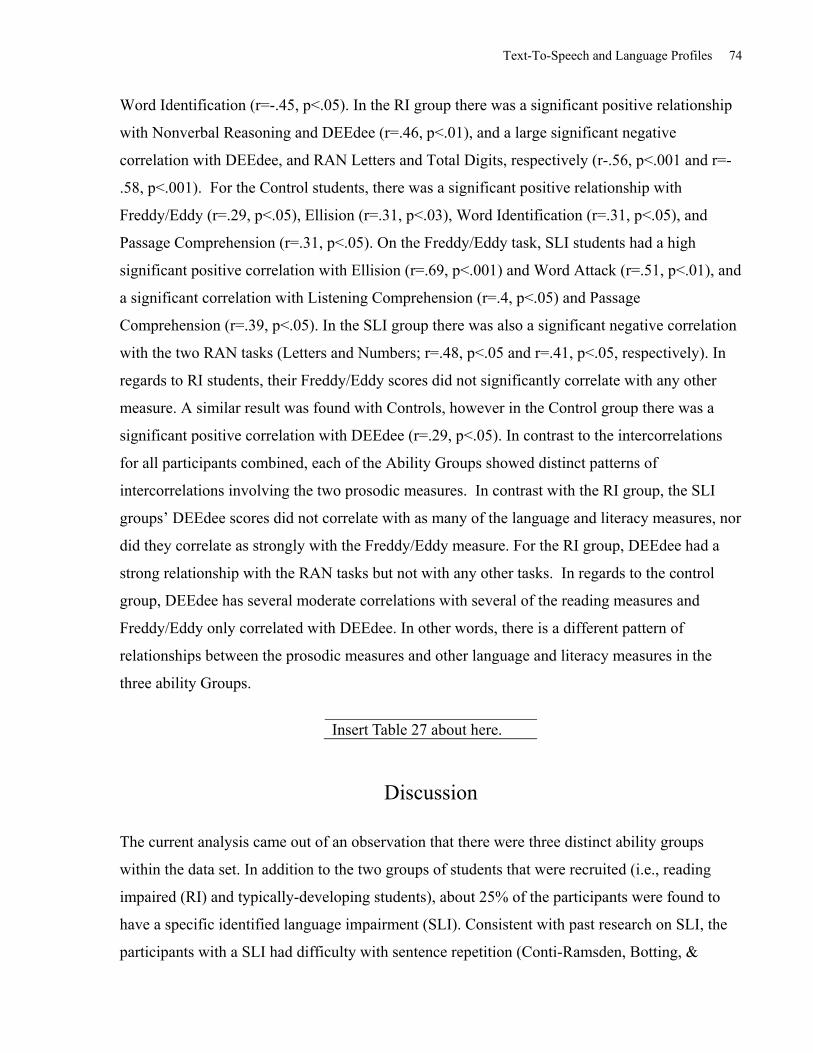
Text-To-Speech and Language Profiles 74
Word Identification (r=-.45, p<.05). In the RI group there was a significant positive relationship
with Nonverbal Reasoning and DEEdee (r=.46, p<.01), and a large significant negative
correlation with DEEdee, and RAN Letters and Total Digits, respectively (r-.56, p<.001 and r=-
.58, p<.001). For the Control students, there was a significant positive relationship with
Freddy/Eddy (r=.29, p<.05), Ellision (r=.31, p<.03), Word Identification (r=.31, p<.05), and
Passage Comprehension (r=.31, p<.05). On the Freddy/Eddy task, SLI students had a high
significant positive correlation with Ellision (r=.69, p<.001) and Word Attack (r=.51, p<.01), and
a significant correlation with Listening Comprehension (r=.4, p<.05) and Passage
Comprehension (r=.39, p<.05). In the SLI group there was also a significant negative correlation
with the two RAN tasks (Letters and Numbers; r=.48, p<.05 and r=.41, p<.05, respectively). In
regards to RI students, their Freddy/Eddy scores did not significantly correlate with any other
measure. A similar result was found with Controls, however in the Control group there was a
significant positive correlation with DEEdee (r=.29, p<.05). In contrast to the intercorrelations
for all participants combined, each of the Ability Groups showed distinct patterns of
intercorrelations involving the two prosodic measures. In contrast with the RI group, the SLI
groups’ DEEdee scores did not correlate with as many of the language and literacy measures, nor
did they correlate as strongly with the Freddy/Eddy measure. For the RI group, DEEdee had a
strong relationship with the RAN tasks but not with any other tasks. In regards to the control
group, DEEdee has several moderate correlations with several of the reading measures and
Freddy/Eddy only correlated with DEEdee. In other words, there is a different pattern of
relationships between the prosodic measures and other language and literacy measures in the
three ability Groups.
Insert Table 27 about here.
Discussion
The current analysis came out of an observation that there were three distinct ability groups
within the data set. In addition to the two groups of students that were recruited (i.e., reading
impaired (RI) and typically-developing students), about 25% of the participants were found to
have a specific identified language impairment (SLI). Consistent with past research on SLI, the
participants with a SLI had difficulty with sentence repetition (Conti-Ramsden, Botting, &
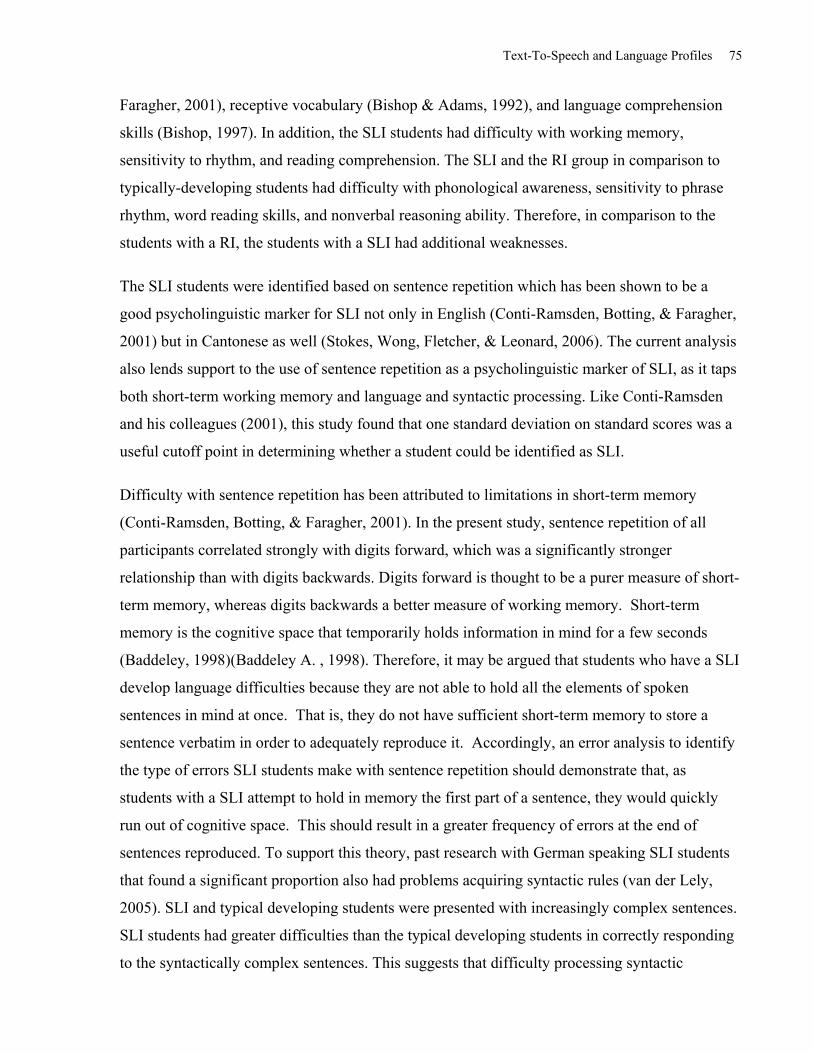
Text-To-Speech and Language Profiles 75
Faragher, 2001), receptive vocabulary (Bishop & Adams, 1992), and language comprehension
skills (Bishop, 1997). In addition, the SLI students had difficulty with working memory,
sensitivity to rhythm, and reading comprehension. The SLI and the RI group in comparison to
typically-developing students had difficulty with phonological awareness, sensitivity to phrase
rhythm, word reading skills, and nonverbal reasoning ability. Therefore, in comparison to the
students with a RI, the students with a SLI had additional weaknesses.
The SLI students were identified based on sentence repetition which has been shown to be a
good psycholinguistic marker for SLI not only in English (Conti-Ramsden, Botting, & Faragher,
2001) but in Cantonese as well (Stokes, Wong, Fletcher, & Leonard, 2006). The current analysis
also lends support to the use of sentence repetition as a psycholinguistic marker of SLI, as it taps
both short-term working memory and language and syntactic processing. Like Conti-Ramsden
and his colleagues (2001), this study found that one standard deviation on standard scores was a
useful cutoff point in determining whether a student could be identified as SLI.
Difficulty with sentence repetition has been attributed to limitations in short-term memory
(Conti-Ramsden, Botting, & Faragher, 2001). In the present study, sentence repetition of all
participants correlated strongly with digits forward, which was a significantly stronger
relationship than with digits backwards. Digits forward is thought to be a purer measure of short-
term memory, whereas digits backwards a better measure of working memory. Short-term
memory is the cognitive space that temporarily holds information in mind for a few seconds
(Baddeley, 1998)(Baddeley A. , 1998). Therefore, it may be argued that students who have a SLI
develop language difficulties because they are not able to hold all the elements of spoken
sentences in mind at once. That is, they do not have sufficient short-term memory to store a
sentence verbatim in order to adequately reproduce it. Accordingly, an error analysis to identify
the type of errors SLI students make with sentence repetition should demonstrate that, as
students with a SLI attempt to hold in memory the first part of a sentence, they would quickly
run out of cognitive space. This should result in a greater frequency of errors at the end of
sentences reproduced. To support this theory, past research with German speaking SLI students
that found a significant proportion also had problems acquiring syntactic rules (van der Lely,
2005). SLI and typical developing students were presented with increasingly complex sentences.
SLI students had greater difficulties than the typical developing students in correctly responding
to the syntactically complex sentences. This suggests that difficulty processing syntactic
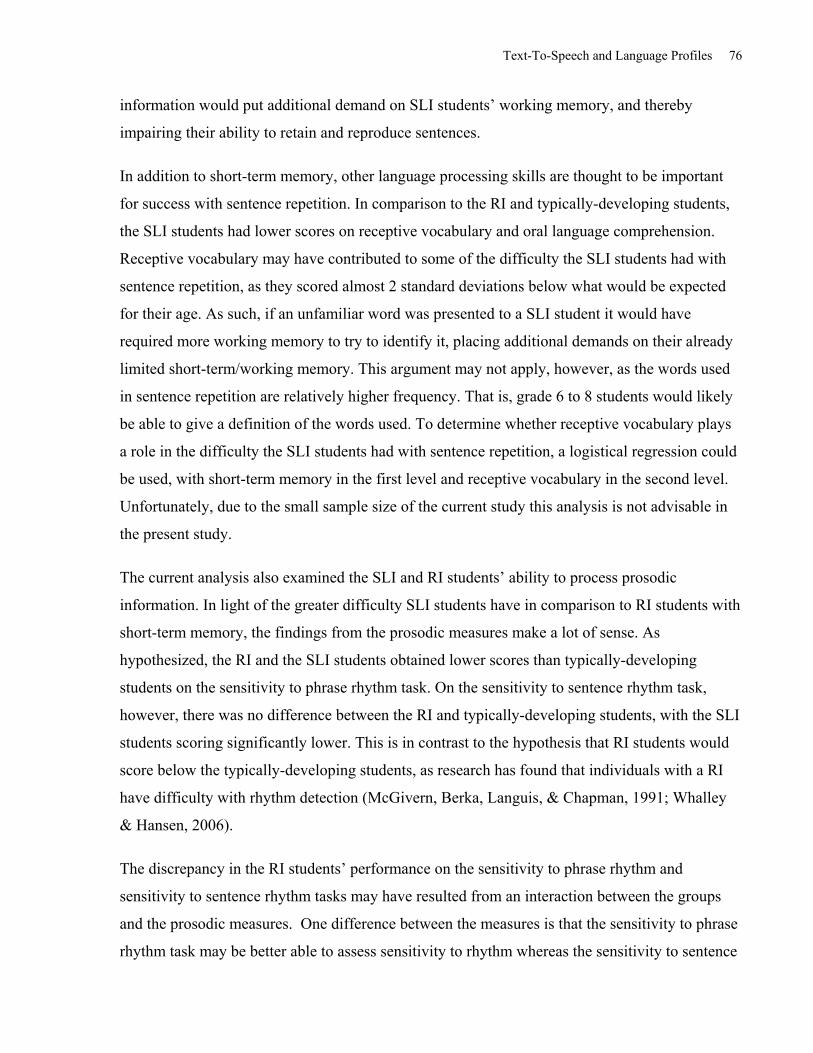
Text-To-Speech and Language Profiles 76
information would put additional demand on SLI students’ working memory, and thereby
impairing their ability to retain and reproduce sentences.
In addition to short-term memory, other language processing skills are thought to be important
for success with sentence repetition. In comparison to the RI and typically-developing students,
the SLI students had lower scores on receptive vocabulary and oral language comprehension.
Receptive vocabulary may have contributed to some of the difficulty the SLI students had with
sentence repetition, as they scored almost 2 standard deviations below what would be expected
for their age. As such, if an unfamiliar word was presented to a SLI student it would have
required more working memory to try to identify it, placing additional demands on their already
limited short-term/working memory. This argument may not apply, however, as the words used
in sentence repetition are relatively higher frequency. That is, grade 6 to 8 students would likely
be able to give a definition of the words used. To determine whether receptive vocabulary plays
a role in the difficulty the SLI students had with sentence repetition, a logistical regression could
be used, with short-term memory in the first level and receptive vocabulary in the second level.
Unfortunately, due to the small sample size of the current study this analysis is not advisable in
the present study.
The current analysis also examined the SLI and RI students’ ability to process prosodic
information. In light of the greater difficulty SLI students have in comparison to RI students with
short-term memory, the findings from the prosodic measures make a lot of sense. As
hypothesized, the RI and the SLI students obtained lower scores than typically-developing
students on the sensitivity to phrase rhythm task. On the sensitivity to sentence rhythm task,
however, there was no difference between the RI and typically-developing students, with the SLI
students scoring significantly lower. This is in contrast to the hypothesis that RI students would
score below the typically-developing students, as research has found that individuals with a RI
have difficulty with rhythm detection (McGivern, Berka, Languis, & Chapman, 1991; Whalley
& Hansen, 2006).
The discrepancy in the RI students’ performance on the sensitivity to phrase rhythm and
sensitivity to sentence rhythm tasks may have resulted from an interaction between the groups
and the prosodic measures. One difference between the measures is that the sensitivity to phrase
rhythm task may be better able to assess sensitivity to rhythm whereas the sensitivity to sentence
Text-To-Speech and Language Profiles 77
rhythm task is more a measure of working memory. With the sensitivity to sentence rhythm,
students were presented with two sentences and had to indicate whether they were the same or
different. The first sentence was presented undistorted, whereas the second sentence was
distorted with a low-pass filter which removed phonemic information. In contrast to the short
phrase utterances of the sensitivity to phrase rhyme, the greater length of the sentences may have
provided additional auditory information to help students decide whether the sentences were the
same or different. For example, the RI and typically developing students may have utilized their
greater short-term memory ability to compare the length of the sentences rather than relying on
their ability to detect prosody. As such, the relatively stronger short-term memory of the RI
students, in contrast to the SLI students, may have enabled them to perform as well as the
typically-developing students on the sensitivity to sentence rhythm task.
On the other hand, for the sensitivity to phrase rhythm task, students were presented with short
utterances (phrases) that were more similar in length to one another. Students were presented
with a non-distorted phrase followed by two distorted phrases that had their phonemic
information replaced with the sound “dee”, and were asked to indicate which of the distorted
sentences had the same rhythm as the first sentence. In contrast to the sensitivity to sentence
rhythm task, the sensitivity to phrase rhythm task may require more short-term memory to hold
both the non-distorted and the two distorted phrases in mind for comparison. As such, RI
students may not have been able to use an alternative strategy, such as comparing the length of
the utterances. Therefore, unlike the sentence rhythm task, the phrase rhythm task would have
limited them to the use of prosodic information to make the comparison.
Consistent with the current study’s findings, Clin and colleagues (2009) used a similar version of
the sentence and phrases rhythm detection tasks with typically-developing students in grades 3,
5, and 7. After correcting for the number of questions on the sentence rhythm task (10 in Clin
and colleagues 2009, and 14 in the current study), the grade 6 to 8 typically-developing students
in the current study had similar raw scores to the grade 7 students in the Clin and colleagues
study (2009). Therefore, performance on the sentence and phrase rhythm detection tasks showed
similar reliability in the two studies.
Conclusions
Text-To-Speech and Language Profiles 78
Three distinct groups were identified in the present study, consisting of SLI, RI, and typically-
developing students. Students with a SLI have specific language, phonological, and reading
difficulties, whereas RI students have only phonological and reading difficulties. The SLI group
was identified using the sentence repetition task, which has been shown to discriminate between
SLI and RI. The sentence repetition task is able to tap into the underlying short-term memory
and syntactic processing difficulties of the SLI group, which are either not present or not as
severe in students with a RI. Based on these analyses, it is recommended that the sensitivity to
phrase rhythm task be used with grade 6 to 8 students when assessing their prosodic ability. In
contrast to the sensitivity to sentence rhythm task, the sensitivity to phrase rhythm task is better
able to discriminate between RI, SLI, and typically-developing students in regards to their
prosodic ability.
Text-To-Speech and Language Profiles 79
Chapter 4
Overall Discussion
Education and Design Implementations
The purpose of the current thesis was to investigate ways of increasing the effectiveness of text-
to-speech (TTS) software for students with a reading disability as well as for typically
developing readers. Research has shown that students who are diagnosed with a reading
disability have specific cognitive weaknesses. These cognitive weaknesses include the ability to
process phonological information. For example, individuals with RD have a hard time
manipulating phonemes effectively (Wagner & Torgesen, 1987; Wagner, Torgesen, & Rashotte,
1999). Students with a RD also have a weakness in rapid automatized naming (RAN). RAN is an
indicator of cognitive speed, particularly associated with naming highly rehearsed units such as
digits, letters or colour names. Individuals who have both a phonological awareness and a RAN
weakness have difficulty decoding words. Students who have this “double-deficit” are inaccurate
decoders and much of their cognitive resources are used sounding out unfamiliar words they read
(Bowers & Wolf, 1993). In addition, students with RD are poor at automatically recognizing
words as full units. Because of their poor word recognition skills and slow decoding skills, RD
students also have a weakness in reading fluency, making them slow readers. It has been shown
in the literature that for an individual to have good reading comprehension they must have well-
developed decoding and fluent reading skills, as well as good language skills (Kirby, 2007).
To help students who have decoding and reading fluency difficulties, two different approaches
can be taken: remediation and compensatory programming. Remediation focuses on the
development of the students’ natural decoding and fluency skills. At present, there have been
several empirically supported programs that foster the reading skills of RD students (Cohen,
Sevcik, Woll, Lovett, & Morris, 2008; Swanson, 1999). These empirically supported programs
target the underlying skill deficits with sufficient intensity and duration and lead to significant
growth in reading skills. Although this is an exciting and important approach to help students
with reading disabilities, the present study focused on specific research questions pertaining to a
compensatory approach.
Text-To-Speech and Language Profiles 80
In contrast to remediation programs, compensatory programs comprise of accommodations,
learning strategies, and assistive technologies that a student can use to help them circumvent an
area of weakness to perform more independently. Accommodations refer to special teaching and
assessment strategies, augmented with human support that enables students to learn and to
demonstrate learning without altering the curriculum expectations for the grade (Ontario
Ministry of Education, 2004, p. 24). In this context assistive technology is define as any “item,
piece of equipment, or product system, whether acquired commercially off-the-shelf, modified,
or customized, that is used to increase, maintain or improve the functional capabilities of
individuals with disabilities” (US technology-related assistance for individuals with disabilites
act, 1998).
A specific assistive technology that is used for students who have RD is TTS. TTS software
assists students who have reading disabilities by circumventing their area of weakness. Instead of
having to decode words inaccurately and slowly, a student can listen to a computer with TTS
reading the text aloud (Strangman & Dalton, 2005). However, as was discussed in Chapter 1,
research to date does not demonstrate the comprehension gains expected for students with
reading disabilities who use TTS.
Past research has shown that poor readers do benefit from TTS in the area of reading fluency.
For example, college students with reading difficulties were found to significantly increase their
reading rate when using TTS. Unexpectedly, no significant difference in comprehension scores
was found for those reading with or without TTS (Elking, Cohen, & Murray, 1993). Relatedly,
Raskine and Hingines (1997) report that only students with reading comprehension scores that
were one standard deviation below on a standard measure seemed to benefit from this software.
These results suggest that the effect of the use of TTS is not uniform across different groups of
learners.
It is possible that TTS in fact may have a facilitating effect but that poor TTS comprehension
outcome scores may be attributed to the features of the TTS voices used. It has been found that
TTS voices place a greater demand on cognitive resources to facilitate understanding in
comparison to natural voices. Several studies have shown that compared to natural voices,
listening to TTS voices, yields longer response latencies (Koul & Hanners, 1997; Reynolds &
Jefferson, 1999). For example, even after being exposed to TTS over five consecutive days, users
Text-To-Speech and Language Profiles 81
had significantly longer response latencies when listening to TTS voices than to a natural voice
(Reynolds, Issaac-Duvall, & Haddox, 2002).
The purpose of the present series of studies was to investigate how to increase the effectiveness
of TTS software for students who have a reading disability as well as typical developing
students. Considering jointly the findings from the current series of studies and past research,
four key points have emerged that can help inform developers and users of TTS. To maximize
the effectiveness of TTS it is important to 1) utilize a high quality voice, 2) use a bimodal
reading system, 3) control the reading speed of the software, and 4) have the program insert
pauses at meaningful point such as the end of noun phrases.
Finding the right Voice
Based on the findings from the current studies, using a newer, high quality TTS voice is
important. A primary characteristic of this high quality TTS voice is that it has a large number of
phonemic stored units that it is able to link together to create speech. For example, as
demonstrated in Study 1, when comparing the two main voices used in the current study, MS
Mary (low quality TTS) and AT&T Crystal (high quality TTS), AT&T Crystal has about 19.5
times more sorted speech units than MS Mary. This allows AT&T Crystal to choose speech units
that fall within a more natural pitch range and string these unites together to create a dynamic
voice (varying pitch), instead of a monotone sounding voice. When a voice has a large number of
speech samples to choose from, the next key feature is the ability of the voice to replicate
prosody.
Accurately reproducing prosodic cues involves the "phonological system that encompasses the
tempo, rhythm and stress of language" (Whalley & Hansen, 2006, p. 288) and is another
essential component of a high quality TTS voice. Prosody plays a role in the signalling of the
boundaries of phonemes, words, phrases, and sentences, and allows for the communication of
elements of language, which are not encoded by grammar or vocabulary. These acoustic cues
are communicated through variation in syllable length, loudness, pitch, and the format
frequencies of speech sounds (Scherer, 1979). For example, prosody may reflect the emotional
state of a speaker, such as anger or amusement, and can reflect the use of irony and sarcasm in
speech. It is used to emphasize an idea, as well as to indicate if an utterance is a statement, a
question, or a command. To synthesize prosody, TTS voices use different algorithms to generate
Text-To-Speech and Language Profiles 82
a prosodic curve for the sentence. Though the actual algorithm is proprietary knowledge,
research has shown that when listening to a variety of TTS voices one is able to distinguish
between different auspices of prosody (Handley, 2009). TTS voices that are better able to
replicate prosody have been identified as sounding more like a human (O'Shaughnessy, 2000).
Finally, TTS voices that have more refined Natural Language Processing (NLP) capacities are
more highly rated on indices of voice quality. NLP works with prosody synthesizing to help
handle grammatical markers. For example, when the computer comes across a question mark, it
is able to increase the pitch at the end of the sentence. In addition, NLP also helps address
homographs within a sentence. To illustrate, words such as /bow/ need NLP to analyze the word
in the context of its surrounding words. This is necessary for the computer to know whether it
should pronounce /bow/ as “the bow in the girl’s hair” or “make sure you bow when you see the
queen”.
High quality TTS voices possessing more speech units, ability to reproduce prosodic cues, and
integrated NLP capabilities are not only perceived as being of higher quality, but are also better
understood. The present research has shown that in comparison to low quality TTS voices, high
quality TTS voices are more intelligible at the word level and result in higher comprehension
scores. Notably, students with an RD who listened to high TTS voices had over a 10% higher
comprehension score then those that listened to low quality TTS voices. This finding supports
the recommendation that when using a TTS system for students with reading disabilities or
typically developing students, it is essential that they are provided with newer, high-quality TTS
voices that are perceived as being of a high quality. When a student has chosen a high quality
TTS voices, it is also recommended they practice listening to the voice for over 30 minutes. Past
research has shown that when listening to a TTS voices for 30 minutes or more leads to better
processing of the voices (Reynolds, Issaac-Duvall, & Haddox, 2002).
Bimodal Reading
Research has previously shown the importance of presenting a passage in both a visual and
auditory format. In bimodal reading students can see the text and hear the word simultaneously
spoken aloud. Previous research has shown that when text was presented in an auditory only
condition, comprehension scores for both poor and proficient readers were significantly lower
than when the text was presented simultaneously in both a visual and auditory form (Montali &
Text-To-Speech and Language Profiles 83
Lewandowski, 1996). In the bimodal condition, there was no significant difference between the
poor and proficient readers' comprehension scores, whereas this was the case when text was
presented in auditory or visual only conditions. Many of today's TTS programs have the ability
to allow for bimodal reading. If the TTS program does not enable bimodal reading, it is
important that the student follows along on the screen as the computer reads aloud. The same is
also important for those who create MP3 or audio files of the computer reading. When the
student is listening to the TTS voice on a portable audio player, they should have a copy of the
text in front of them to follow along. This is important in order to maximize their comprehension
of the passage.
Reading Speed
A key feature in TTS software is the ability to change the rate at which the computer “speaks”.
At the same time, this setting is thought to pose some challenges. Early work on the effectiveness
of TTS software showed that for poor readers, the use of TTS software led to an increase in the
rate at which they read. For example, (Elking, Cohen, & Murray, 1993) found that college
students who were poor readers had an average reading speed of 155 words per minute (wpm)
without the aid of TTS. When they used TTS, their reading speed increased to an average speed
of 180wpm. Despite this significant increase in speed, the comprehension scores of the poor
readers did not change significantly between the unaided and the TTS aided condition.
A possible explanation for the lack of gains in comprehension scores could be that TTS voices
were still intelligible though they were no longer comprehensible at high speeds. TTS software
starts at the beginning of a sentence and continues presenting at about the same rate until it
reaches a grammatical marker such as a full stop. This is a very unnatural way to read, as eye
tracking studies show proficient readers move through a sentence at a variable rate. Not only do
readers spend more time around punctuation marks, but they also spend significantly more time
at clause boundaries. In addition, if understanding decreases, proficient readers will move their
eyes to earlier sections of the text to look for clarification before moving on (Rayner, 1998).
Using TTS does not allow for this natural style of reading to take place. Therefore, it is thought
that if TTS may be presenting the information at a speed which exceeds the cognitive system a
lack of understanding would occur. This explanation could be relevant to the discrepancy
Text-To-Speech and Language Profiles 84
findings in the Elking, Cohen, and Murray’s (1993) and Elking (1998) studies with regard to the
lack of significant change in comprehension scores in spite of increases in reading rate.
Indeed, for students without a RD, having the presentation rate set to the same speed they read
unaided (100%) has been shown to maximize their comprehension. Students that had a RD also
had significant higher completion scores when TTS was set to a slower reading rate at 50% of
their unaided reading speed (Cunningham & Watson, 2003).
Study 2 was developed to build upon past research with intermediate RD students to identify a
recommended presentation rate. Due to measurement difficulties, it was not possible to answer
this question. It is hypothesized that having a TTS present at a speed between 120 and 160wpm
will optimize comprehension. Just as it is important to identify an ideal voice for an individual
student, it is also necessary to identify the ideal presentation rate of the software. This is
especially important given that the presentation rate of voices varies at the same setting.
Correctly identifying a suitable presentation rate is thought to increase the comprehension of
students using the software, as the computer will then present at a speed that will not exceed the
student’s cognitive processing abilities. It is thought that students that have lower auditory
working memory and language processing speeds will need to have the computer present at
slower presentation rates. At the slower presentation rate will compensate for the cognitive
weaknesses.
Noun-Phrase Pause
The same cognitive load justification can be applied to presentation rates at the level of inter
phrase pauses. Proficient readers take small inter-sentence breaks when reading. They may not
be aware that they take these pauses, but these pauses allow them to integrate what they have just
read with prior knowledge. When a TTS voice reads to a student, it does not pause until it
reaches a grammatical marker (e.g., commas, periods, question marks, or colons). By inserting
phrase pauses, it was hypothesized that students’ comprehension scores would increase. It was
hypothesized that an increase in comprehension scores would be the result of providing the
student's cognitive system with time to integrate what they have just heard with prior knowledge
at the phrase pauses. Due to measurement issues this hypothesis could not be evaluated yet it
serves additional attention in future research.
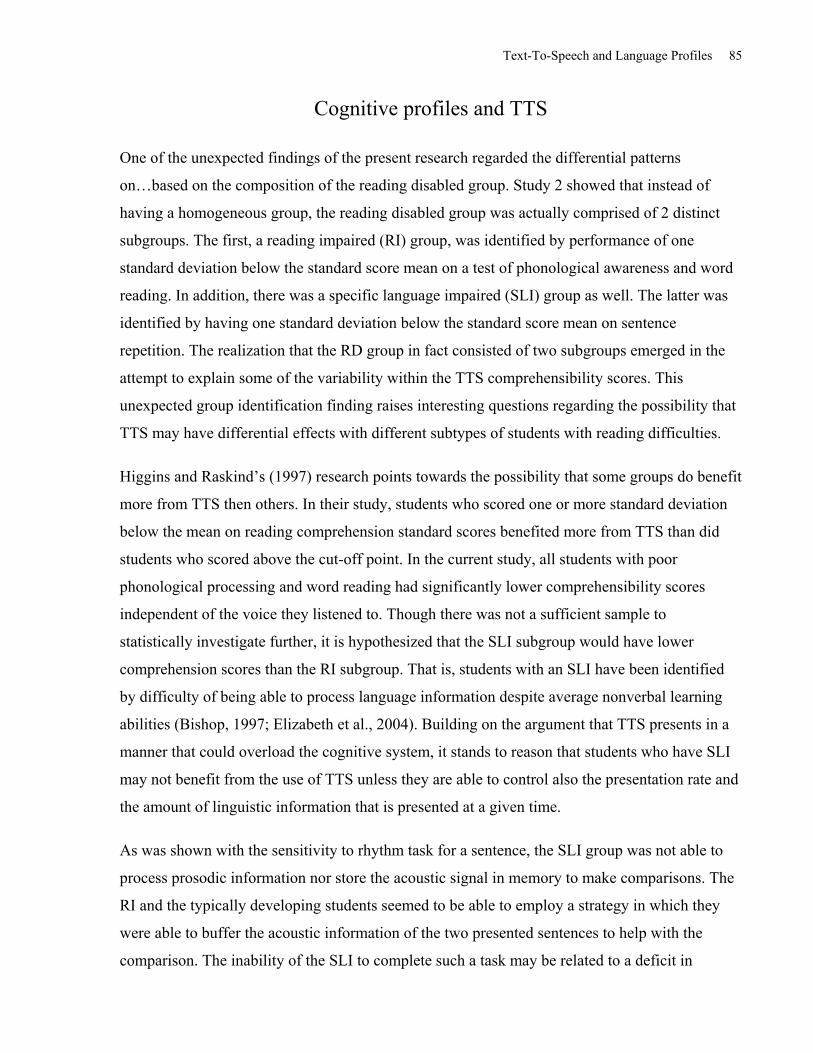
Text-To-Speech and Language Profiles 85
Cognitive profiles and TTS
One of the unexpected findings of the present research regarded the differential patterns
on…based on the composition of the reading disabled group. Study 2 showed that instead of
having a homogeneous group, the reading disabled group was actually comprised of 2 distinct
subgroups. The first, a reading impaired (RI) group, was identified by performance of one
standard deviation below the standard score mean on a test of phonological awareness and word
reading. In addition, there was a specific language impaired (SLI) group as well. The latter was
identified by having one standard deviation below the standard score mean on sentence
repetition. The realization that the RD group in fact consisted of two subgroups emerged in the
attempt to explain some of the variability within the TTS comprehensibility scores. This
unexpected group identification finding raises interesting questions regarding the possibility that
TTS may have differential effects with different subtypes of students with reading difficulties.
Higgins and Raskind’s (1997) research points towards the possibility that some groups do benefit
more from TTS then others. In their study, students who scored one or more standard deviation
below the mean on reading comprehension standard scores benefited more from TTS than did
students who scored above the cut-off point. In the current study, all students with poor
phonological processing and word reading had significantly lower comprehensibility scores
independent of the voice they listened to. Though there was not a sufficient sample to
statistically investigate further, it is hypothesized that the SLI subgroup would have lower
comprehension scores than the RI subgroup. That is, students with an SLI have been identified
by difficulty of being able to process language information despite average nonverbal learning
abilities (Bishop, 1997; Elizabeth et al., 2004). Building on the argument that TTS presents in a
manner that could overload the cognitive system, it stands to reason that students who have SLI
may not benefit from the use of TTS unless they are able to control also the presentation rate and
the amount of linguistic information that is presented at a given time.
As was shown with the sensitivity to rhythm task for a sentence, the SLI group was not able to
process prosodic information nor store the acoustic signal in memory to make comparisons. The
RI and the typically developing students seemed to be able to employ a strategy in which they
were able to buffer the acoustic information of the two presented sentences to help with the
comparison. The inability of the SLI to complete such a task may be related to a deficit in
Text-To-Speech and Language Profiles 86
auditory working memory and in the ability to process acoustic information. These cognitive
weaknesses would then make it inherently more difficult for SLI to benefit from the use of TTS.
Another implication of the identification of the SLI within the current sample involves the
process of diagnosing learning disorders in the education system. During the recruitment phase
and approaching participating schools, one of the criteria for a student to participate was that the
individuals had to be diagnosed with a learning disability in the area of reading. Students with
comorbid conditions such as ADHD, language impairments, or other mental health conditions
were excluded. Therefore, based on the identification of the reading impaired group, none of the
students should have had SLI. However, based on the psychoeducational assessment conducted,
it would seem that a detailed language assessment is not part of the assessment process. Though
the specified criteria used by the school system for diagnosing a reading disability where not
obtained, it is thought that students were identified by having poor word decoding and word
reading skills. As Snowling and colleges have stated (2006), students who have SLI also have
impairment in phonological processing, word decoding, and word reading. Therefore, it is not
sufficient to be able to identify these individuals based on reading achievement measures. As
TTS is often recommended to students who have been diagnosed with an RD, the misidentified
SLI students may not be benefit from the use of this tool.
Future Research
Future research needs to look closer at the different cognitive profiles of individuals using TTS.
For example, it is thought that students with combined auditory working memory and auditory
processing difficulties may not benefit from standard TTS software provided by the
manufacturer. Yet, they might benefit from choosing a high quality TTS voice. This may be
augmented with then having the computer present a small amount of information (e.g. a phrase
or clause) at a time in combination with learning strategies designed to aid in their understanding
of the text.
Ongoing research into the effectiveness of text-to-speech software for both RD and typically
developing students is warranted. The current series of studies provides the foundation for more
specific questions. Future research in RD use of TTS needs to address the cognitive and learning
profiles of these students so a better understanding of how groups of RD students with specific
cognitive profiles can process and benefit from the auditory information. In addition, models
Text-To-Speech and Language Profiles 87
need to be developed to investigate what the influence of phonological awareness, working
memory, and other cognitive process might have on the understanding of TTS. In addition, this
type of research also needs to be done on other disability populations that rely on TTS.
Research that brings together the development of software based on cognitive and neural theory
lends itself to the use of multidisciplinary teams. The current project is an example of how a
multidisciplinary team can come together to help with the development of a research project. In
the design of the current study, disciplines such as speech and language pathology, education
psychology, computer science, and education were consulted. It is this type of multidisciplinary
team with diverse knowledge, skills, and experiences that can provide guidance to a project
which leads to the development of new effective tools for educating students.
The direction that the development of TTS tools is taking is that of creating more features. With
newer versions of assistive technology software, developers are adding more options to their
product such as bimodal reading; however, it is rare to find any developers that are refining the
essence of their product. As previously demonstrated, the key variable that a user has to modify
to meet learning needs is the type of voice, presentation rate, and pitch. Through looking at RD
and other TTS user populations, recommendations and innovations need to occur to better
adjusting TTS presentation to meet the cognitive profile of this population. Guidelines could be
developed that recommend particular voices or reading speed. Some possible methods could
include the following:
1. Adding pauses at phrase or clauses boundaries to allow time for the cognitive system to
integrate newly presented information.
2. Use of arrow keys to move from one sentence to the next. This would allow users to
move on when they feel they have understood what was just presented to them.
3. Integration of TTS with eye tracking. It is known that proficient readers do not
continuously move from left to right across the page where TTS does. Integrating eye
tracking would allow for reading a word aloud when the user focuses on a given word,
This feature would allow for a natural style of reading.
Summary
Text-To-Speech and Language Profiles 88
These studies set out to investigate methods that would increases the effectiveness of TTS
software for students with and without an RD. The methods focused on ways to presenting the
auditory information to students which would match that of their cognitive profile. Additional
research needs to take into consideration the cognitive profile and how the auditory information
is processed when developing. The same recommendation is also provided for developers of TTS
to insure the target populations are achieving maximum benefit from the TTS tools they use.
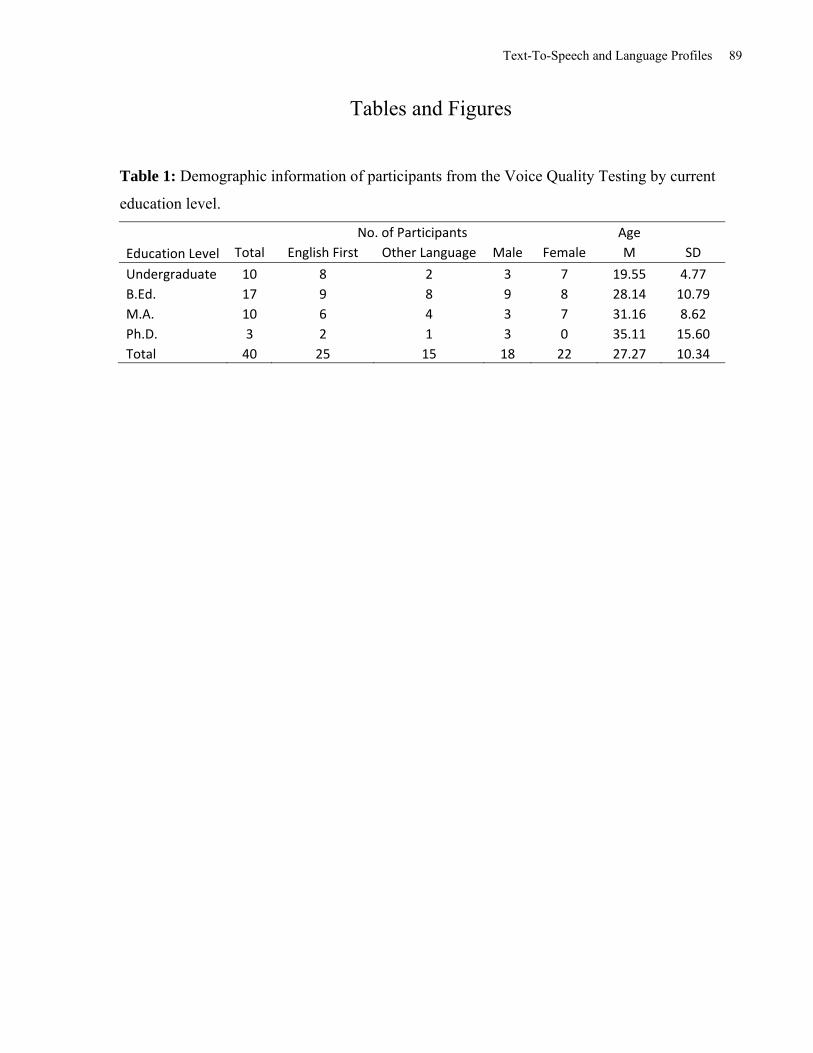
Text-To-Speech and Language Profiles 89
Tables and Figures
Table 1: Demographic information of participants from the Voice Quality Testing by current
education level.
No. of Participants Age
Education Level Total English First Other Language Male Female M SD
Undergraduate 10 8 2 3 7 19.55 4.77
B.Ed. 17 9 8 9 8 28.14 10.79
M.A. 10 6 4 3 7 31.16 8.62
Ph.D. 3 2 1 3 0 35.11 15.60
Total 40 25 15 18 22 27.27 10.34
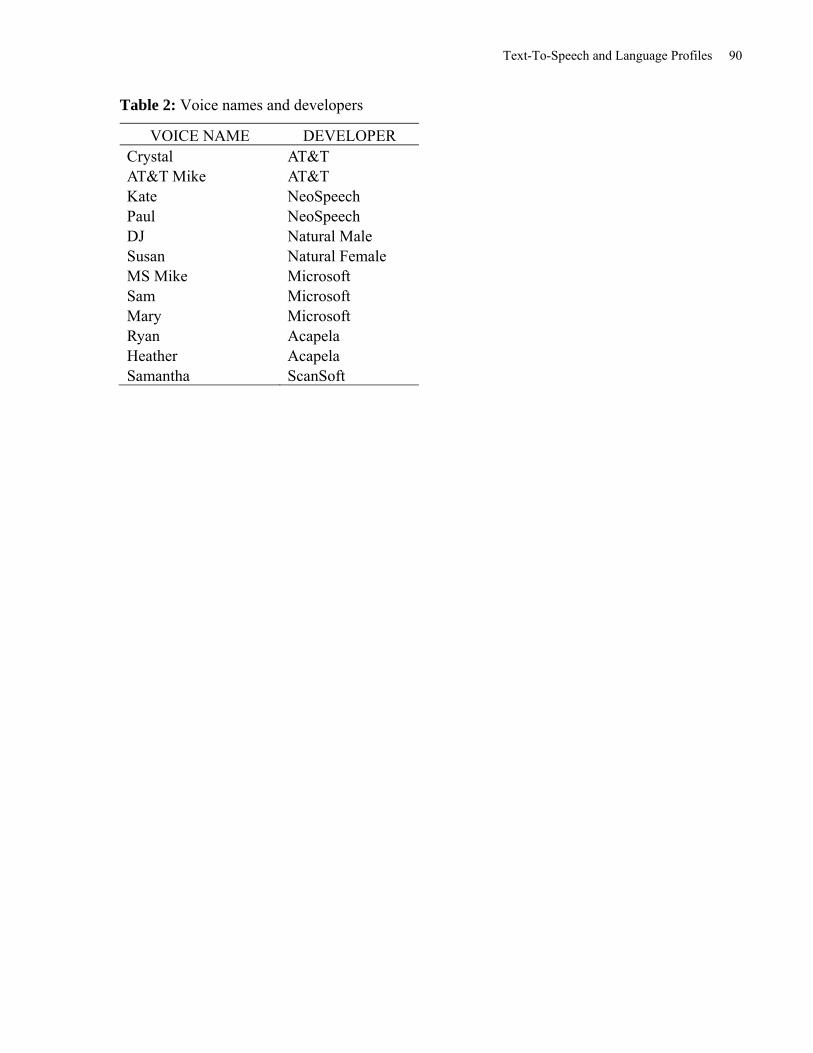
Text-To-Speech and Language Profiles 90
Table 2: Voice names and developers
VOICE NAME DEVELOPER Crystal AT&T AT&T Mike AT&T Kate NeoSpeech Paul NeoSpeech DJ Natural Male Susan Natural Female MS Mike Microsoft Sam Microsoft Mary Microsoft Ryan Acapela Heather Acapela Samantha ScanSoft
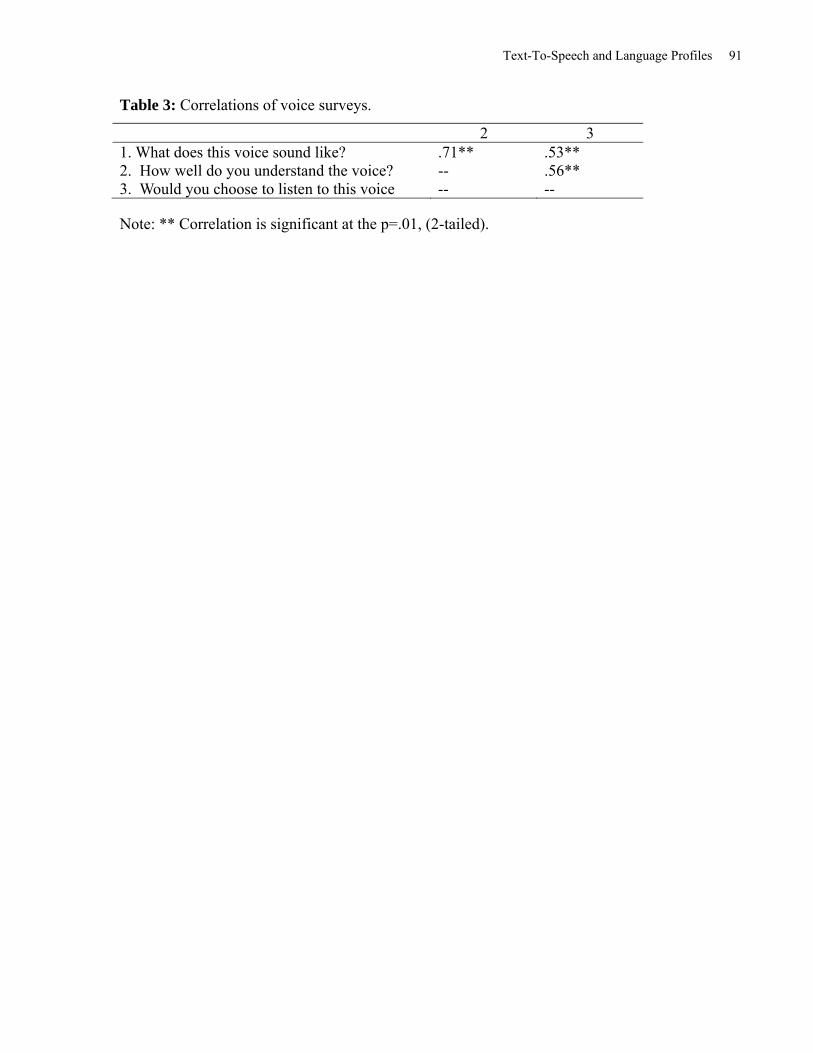
Text-To-Speech and Language Profiles 91
Table 3: Correlations of voice surveys.
2 3 1. What does this voice sound like? .71** .53** 2. How well do you understand the voice? -- .56** 3. Would you choose to listen to this voice -- --
Note: ** Correlation is significant at the p=.01, (2-tailed).
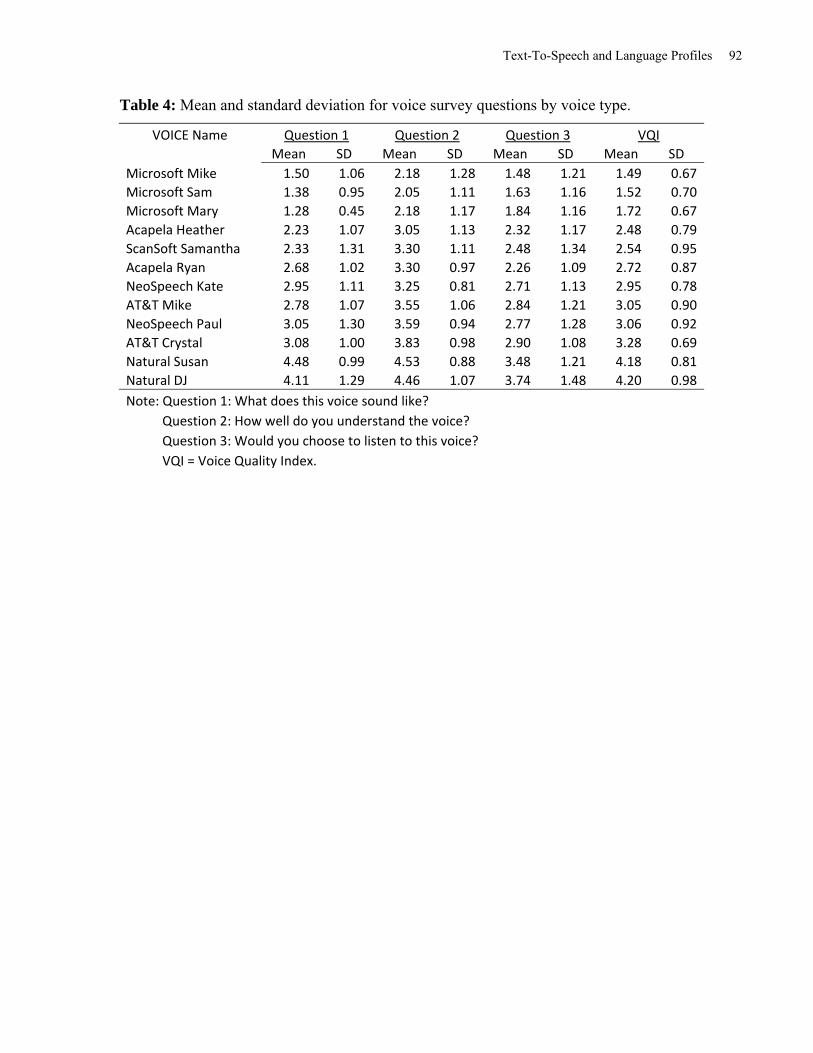
Text-To-Speech and Language Profiles 92
Table 4: Mean and standard deviation for voice survey questions by voice type.
VOICE Name Question 1 Question 2 Question 3 VQI
Mean SD Mean SD Mean SD Mean SD
Microsoft Mike 1.50 1.06 2.18 1.28 1.48 1.21 1.49 0.67
Microsoft Sam 1.38 0.95 2.05 1.11 1.63 1.16 1.52 0.70
Microsoft Mary 1.28 0.45 2.18 1.17 1.84 1.16 1.72 0.67
Acapela Heather 2.23 1.07 3.05 1.13 2.32 1.17 2.48 0.79
ScanSoft Samantha 2.33 1.31 3.30 1.11 2.48 1.34 2.54 0.95
Acapela Ryan 2.68 1.02 3.30 0.97 2.26 1.09 2.72 0.87
NeoSpeech Kate 2.95 1.11 3.25 0.81 2.71 1.13 2.95 0.78
AT&T Mike 2.78 1.07 3.55 1.06 2.84 1.21 3.05 0.90
NeoSpeech Paul 3.05 1.30 3.59 0.94 2.77 1.28 3.06 0.92
AT&T Crystal 3.08 1.00 3.83 0.98 2.90 1.08 3.28 0.69
Natural Susan 4.48 0.99 4.53 0.88 3.48 1.21 4.18 0.81
Natural DJ 4.11 1.29 4.46 1.07 3.74 1.48 4.20 0.98
Note: Question 1: What does this voice sound like?
Question 2: How well do you understand the voice?
Question 3: Would you choose to listen to this voice?
VQI = Voice Quality Index.
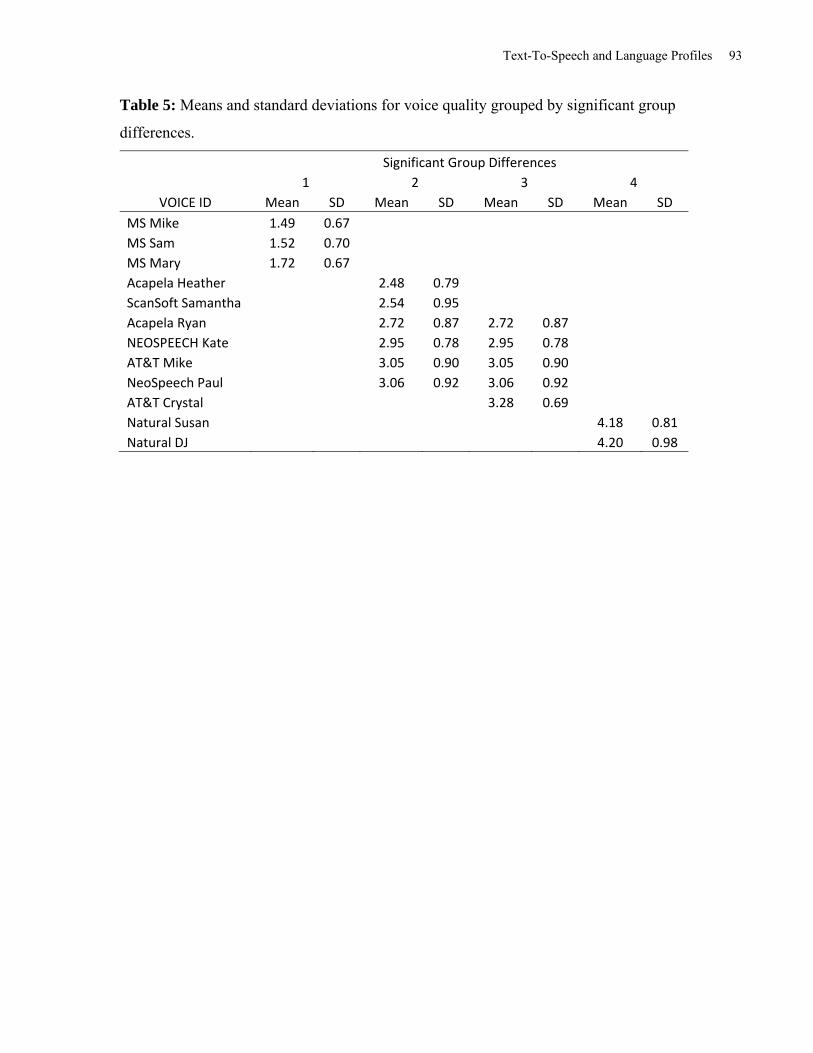
Text-To-Speech and Language Profiles 93
Table 5: Means and standard deviations for voice quality grouped by significant group
differences.
Significant Group Differences
1 2 3 4
VOICE ID Mean SD Mean SD Mean SD Mean SD
MS Mike 1.49 0.67
MS Sam 1.52 0.70
MS Mary 1.72 0.67
Acapela Heather 2.48 0.79
ScanSoft Samantha 2.54 0.95
Acapela Ryan 2.72 0.87 2.72 0.87
NEOSPEECH Kate 2.95 0.78 2.95 0.78
AT&T Mike 3.05 0.90 3.05 0.90
NeoSpeech Paul 3.06 0.92 3.06 0.92
AT&T Crystal 3.28 0.69
Natural Susan 4.18 0.81
Natural DJ 4.20 0.98
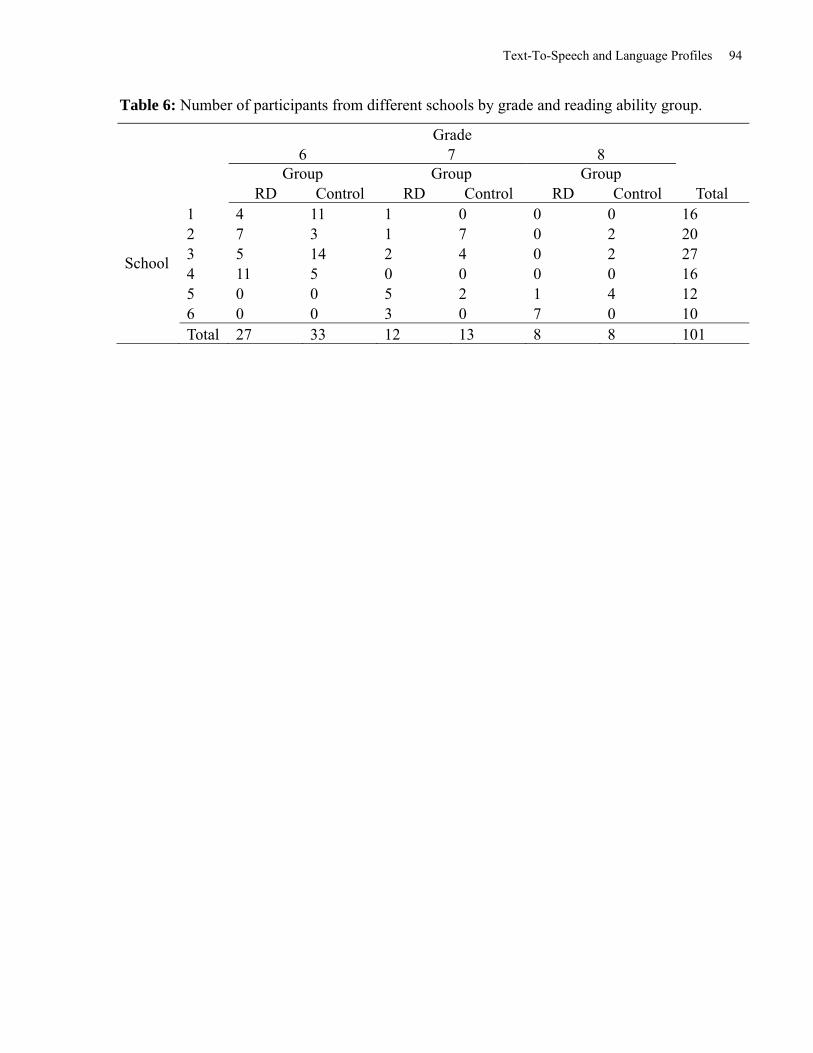
Text-To-Speech and Language Profiles 94
Table 6: Number of participants from different schools by grade and reading ability group.
Grade 6 7 8 Group Group Group RD Control RD Control RD Control Total
School
1 4 11 1 0 0 0 16 2 7 3 1 7 0 2 20 3 5 14 2 4 0 2 27 4 11 5 0 0 0 0 16 5 0 0 5 2 1 4 12 6 0 0 3 0 7 0 10
Total 27 33 12 13 8 8 101
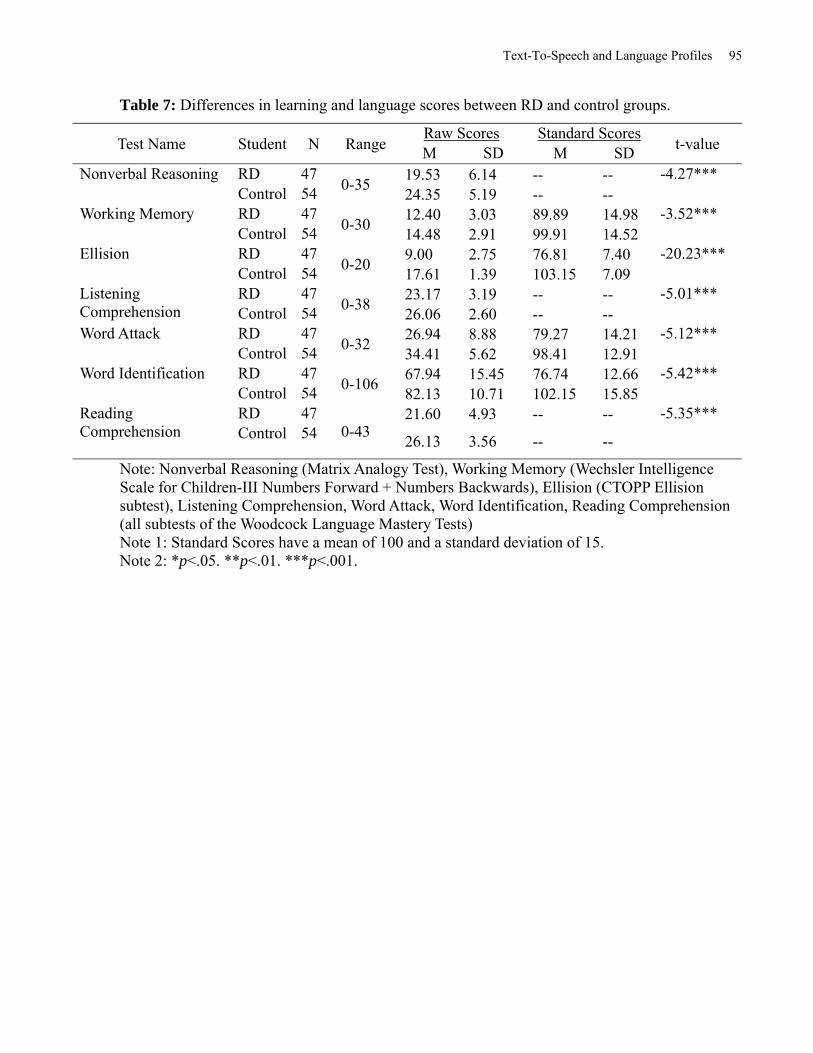
Text-To-Speech and Language Profiles 95
Table 7: Differences in learning and language scores between RD and control groups.
Test Name Student N Range Raw Scores Standard Scores
t-value M SD M SD
Nonverbal Reasoning RD 47 0-35
19.53 6.14 -- -- -4.27*** Control 54 24.35 5.19 -- -- Working Memory RD 47
0-30 12.40 3.03 89.89 14.98 -3.52***
Control 54 14.48 2.91 99.91 14.52 Ellision RD 47
0-20 9.00 2.75 76.81 7.40 -20.23***
Control 54 17.61 1.39 103.15 7.09 Listening Comprehension
RD 47 0-38
23.17 3.19 -- -- -5.01*** Control 54 26.06 2.60 -- --
Word Attack RD 47 0-32
26.94 8.88 79.27 14.21 -5.12*** Control 54 34.41 5.62 98.41 12.91
Word Identification RD 47 0-106
67.94 15.45 76.74 12.66 -5.42*** Control 54 82.13 10.71 102.15 15.85
Reading Comprehension
RD 47 0-43
21.60 4.93 -- -- -5.35*** Control 54 26.13 3.56 -- --
Note: Nonverbal Reasoning (Matrix Analogy Test), Working Memory (Wechsler Intelligence Scale for Children-III Numbers Forward + Numbers Backwards), Ellision (CTOPP Ellision subtest), Listening Comprehension, Word Attack, Word Identification, Reading Comprehension (all subtests of the Woodcock Language Mastery Tests) Note 1: Standard Scores have a mean of 100 and a standard deviation of 15. Note 2: *p<.05. **p<.01. ***p<.001.
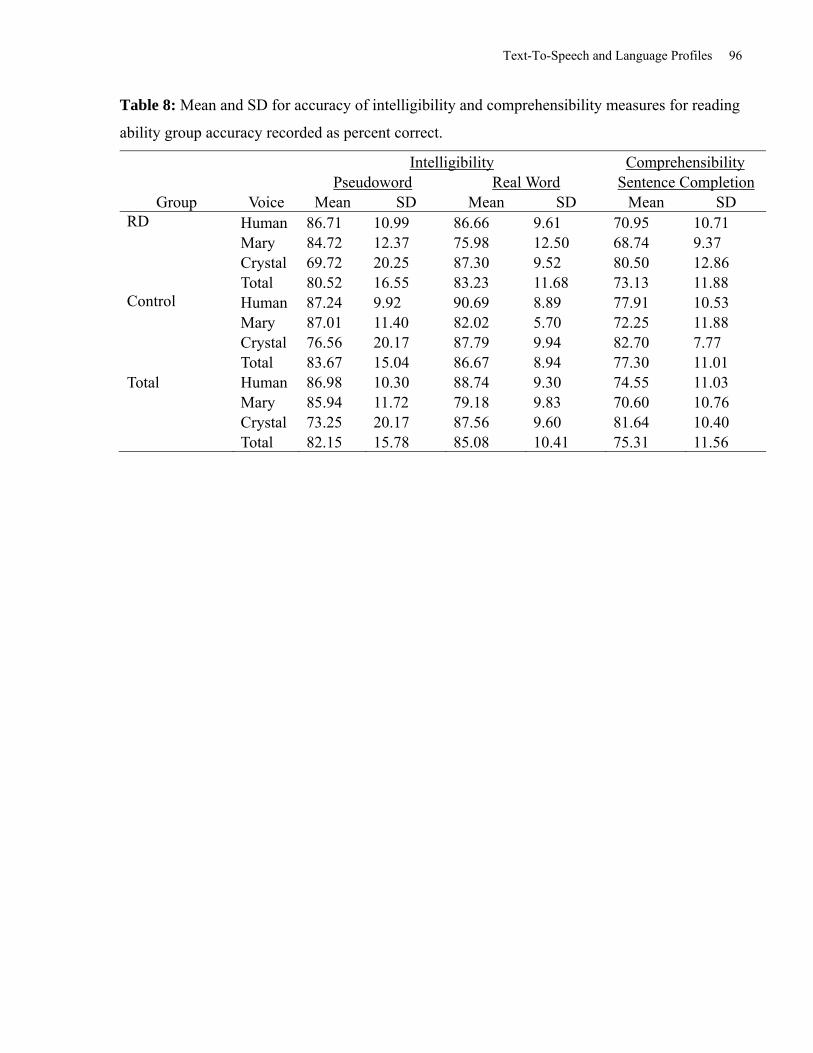
Text-To-Speech and Language Profiles 96
Table 8: Mean and SD for accuracy of intelligibility and comprehensibility measures for reading
ability group accuracy recorded as percent correct.
Intelligibility Comprehensibility Pseudoword Real Word Sentence Completion
Group Voice Mean SD Mean SD Mean SD RD Human 86.71 10.99 86.66 9.61 70.95 10.71
Mary 84.72 12.37 75.98 12.50 68.74 9.37 Crystal 69.72 20.25 87.30 9.52 80.50 12.86 Total 80.52 16.55 83.23 11.68 73.13 11.88
Control Human 87.24 9.92 90.69 8.89 77.91 10.53 Mary 87.01 11.40 82.02 5.70 72.25 11.88 Crystal 76.56 20.17 87.79 9.94 82.70 7.77 Total 83.67 15.04 86.67 8.94 77.30 11.01
Total Human 86.98 10.30 88.74 9.30 74.55 11.03 Mary 85.94 11.72 79.18 9.83 70.60 10.76 Crystal 73.25 20.17 87.56 9.60 81.64 10.40 Total 82.15 15.78 85.08 10.41 75.31 11.56
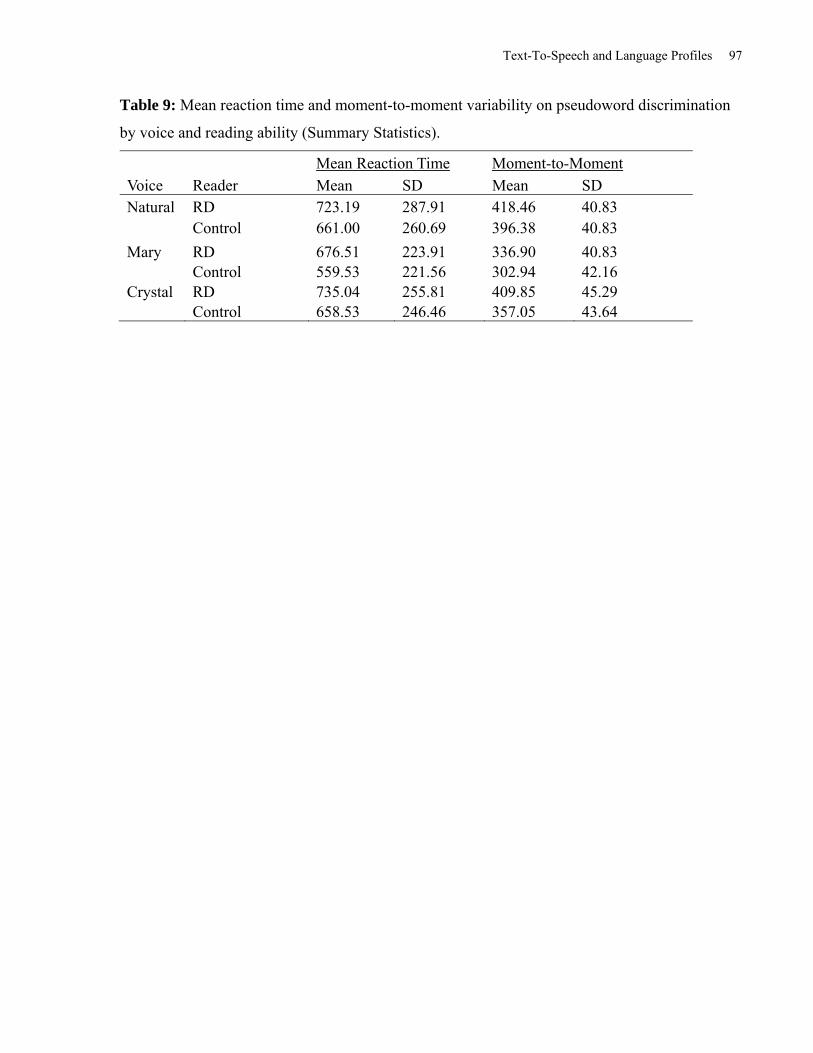
Text-To-Speech and Language Profiles 97
Table 9: Mean reaction time and moment-to-moment variability on pseudoword discrimination
by voice and reading ability (Summary Statistics).
Mean Reaction Time Moment-to-Moment
Voice Reader Mean SD Mean SD Natural RD 723.19 287.91 418.46 40.83 Control 661.00 260.69 396.38 40.83
Mary RD 676.51 223.91 336.90 40.83 Control 559.53 221.56 302.94 42.16 Crystal RD 735.04 255.81 409.85 45.29 Control 658.53 246.46 357.05 43.64
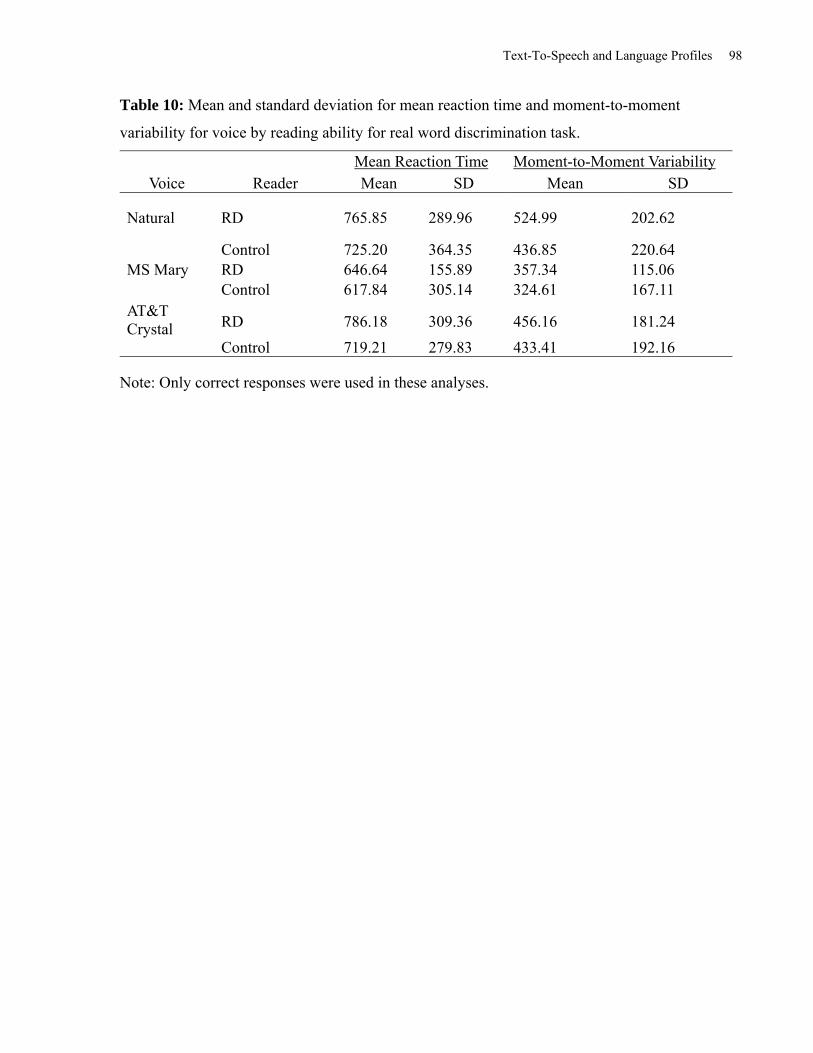
Text-To-Speech and Language Profiles 98
Table 10: Mean and standard deviation for mean reaction time and moment-to-moment
variability for voice by reading ability for real word discrimination task.
Mean Reaction Time Moment-to-Moment Variability Voice Reader Mean SD Mean SD
Natural RD 765.85 289.96 524.99 202.62
Control 725.20 364.35 436.85 220.64 MS Mary RD 646.64 155.89 357.34 115.06 Control 617.84 305.14 324.61 167.11 AT&T Crystal
RD 786.18 309.36 456.16 181.24
Control 719.21 279.83 433.41 192.16
Note: Only correct responses were used in these analyses.
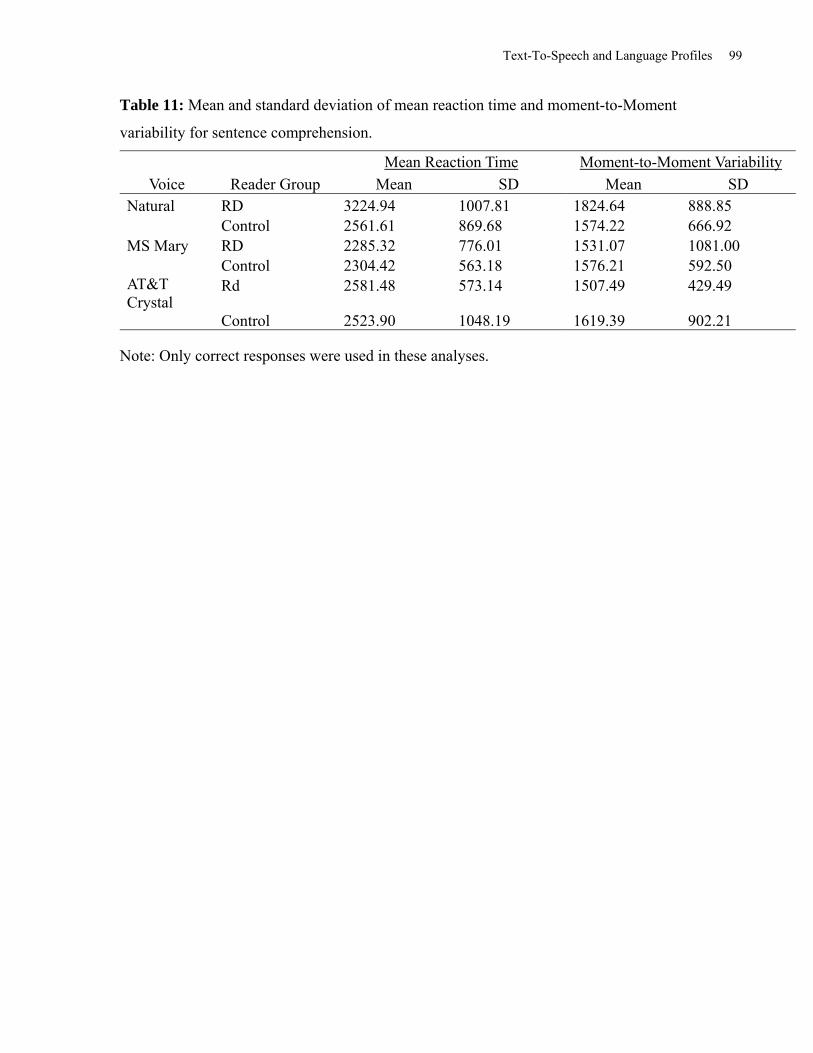
Text-To-Speech and Language Profiles 99
Table 11: Mean and standard deviation of mean reaction time and moment-to-Moment
variability for sentence comprehension.
Mean Reaction Time Moment-to-Moment Variability
Voice Reader Group Mean SD Mean SD Natural RD 3224.94 1007.81 1824.64 888.85 Control 2561.61 869.68 1574.22 666.92 MS Mary RD 2285.32 776.01 1531.07 1081.00 Control 2304.42 563.18 1576.21 592.50 AT&T Crystal
Rd 2581.48 573.14 1507.49 429.49
Control 2523.90 1048.19 1619.39 902.21
Note: Only correct responses were used in these analyses.
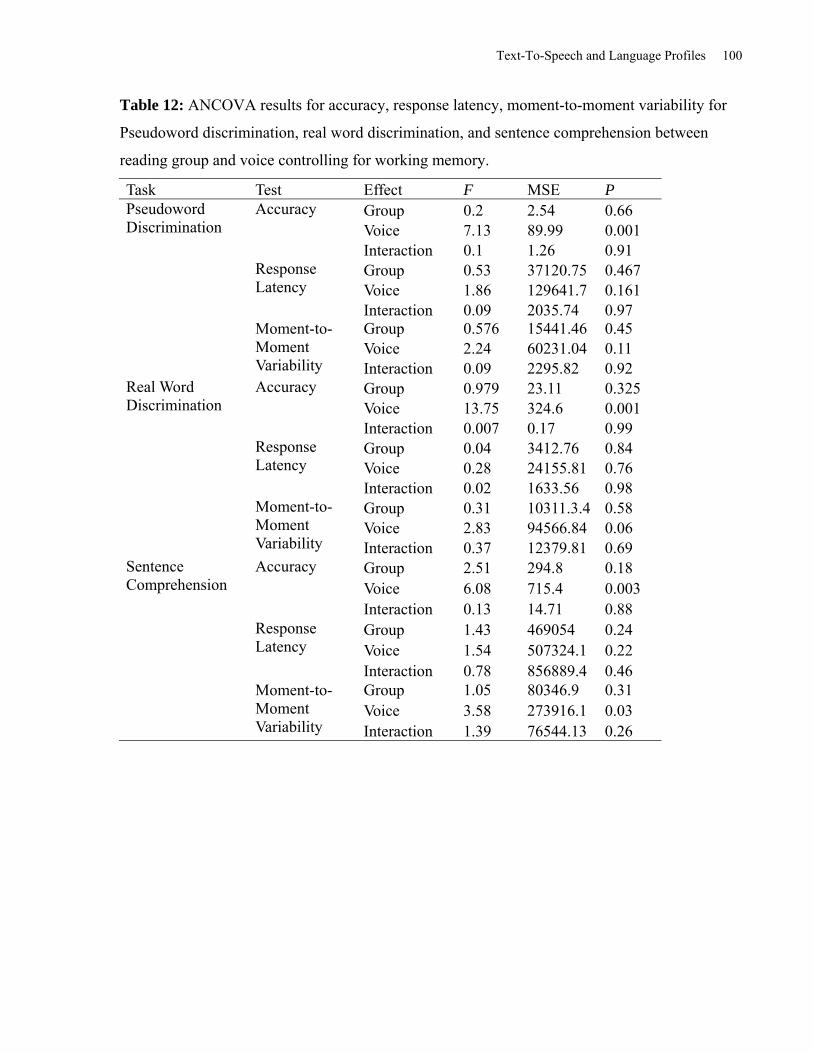
Text-To-Speech and Language Profiles 100
Table 12: ANCOVA results for accuracy, response latency, moment-to-moment variability for
Pseudoword discrimination, real word discrimination, and sentence comprehension between
reading group and voice controlling for working memory.
Task Test Effect F MSE P Pseudoword Discrimination
Accuracy Group 0.2 2.54 0.66 Voice 7.13 89.99 0.001 Interaction 0.1 1.26 0.91
Response Latency
Group 0.53 37120.75 0.467 Voice 1.86 129641.7 0.161 Interaction 0.09 2035.74 0.97
Moment-to-Moment Variability
Group 0.576 15441.46 0.45 Voice 2.24 60231.04 0.11 Interaction 0.09 2295.82 0.92
Real Word Discrimination
Accuracy Group 0.979 23.11 0.325 Voice 13.75 324.6 0.001 Interaction 0.007 0.17 0.99
Response Latency
Group 0.04 3412.76 0.84 Voice 0.28 24155.81 0.76 Interaction 0.02 1633.56 0.98
Moment-to-Moment Variability
Group 0.31 10311.3.4 0.58 Voice 2.83 94566.84 0.06 Interaction 0.37 12379.81 0.69
Sentence Comprehension
Accuracy Group 2.51 294.8 0.18 Voice 6.08 715.4 0.003 Interaction 0.13 14.71 0.88
Response Latency
Group 1.43 469054 0.24 Voice 1.54 507324.1 0.22 Interaction 0.78 856889.4 0.46
Moment-to-Moment Variability
Group 1.05 80346.9 0.31 Voice 3.58 273916.1 0.03 Interaction 1.39 76544.13 0.26
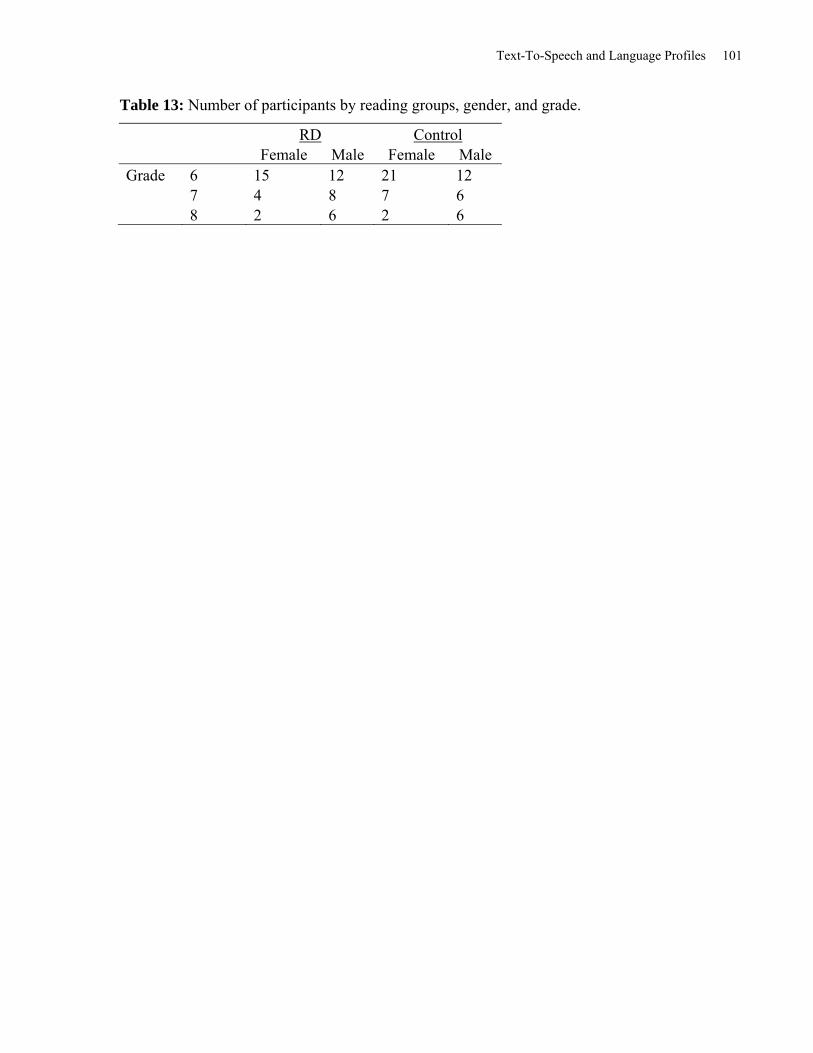
Text-To-Speech and Language Profiles 101
Table 13: Number of participants by reading groups, gender, and grade.
RD Control Female Male Female Male Grade 6 15 12 21 12 7 4 8 7 6 8 2 6 2 6
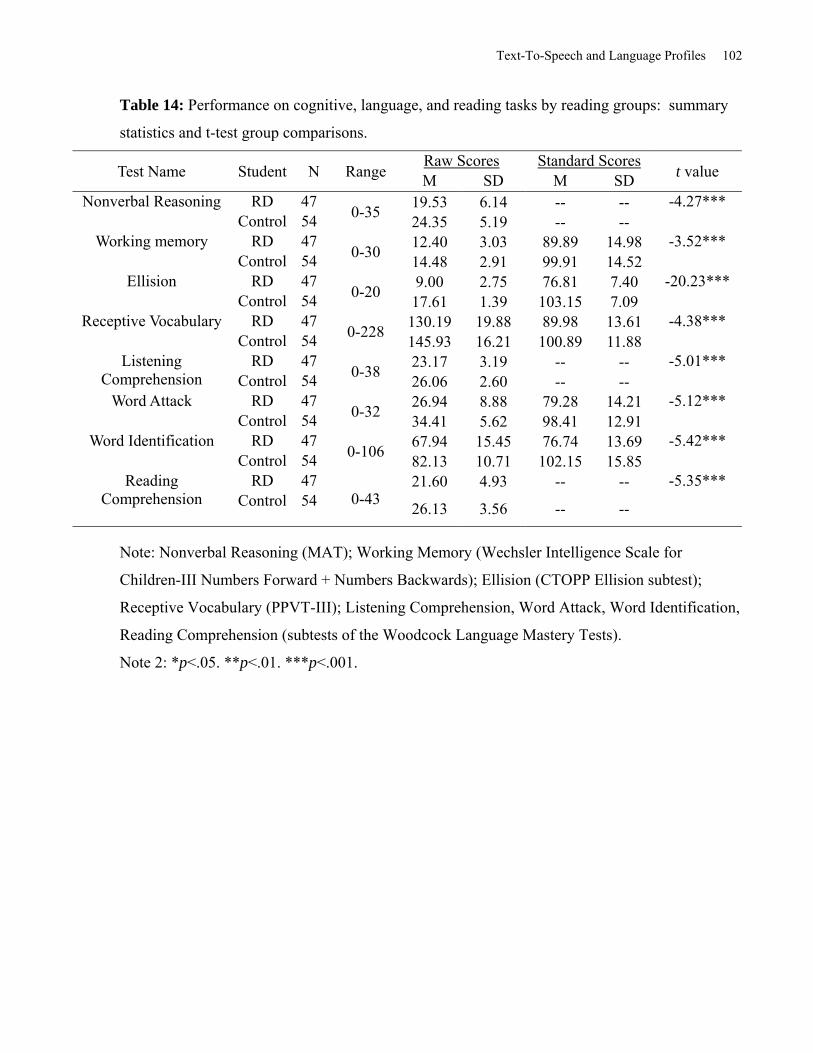
Text-To-Speech and Language Profiles 102
Table 14: Performance on cognitive, language, and reading tasks by reading groups: summary
statistics and t-test group comparisons.
Test Name Student N Range Raw Scores Standard Scores
t value M SD M SD
Nonverbal Reasoning RD 47 0-35
19.53 6.14 -- -- -4.27*** Control 54 24.35 5.19 -- --
Working memory RD 47 0-30
12.40 3.03 89.89 14.98 -3.52*** Control 54 14.48 2.91 99.91 14.52
Ellision RD 47 0-20
9.00 2.75 76.81 7.40 -20.23*** Control 54 17.61 1.39 103.15 7.09
Receptive Vocabulary RD 47 0-228
130.19 19.88 89.98 13.61 -4.38*** Control 54 145.93 16.21 100.89 11.88
Listening Comprehension
RD 47 0-38
23.17 3.19 -- -- -5.01*** Control 54 26.06 2.60 -- --
Word Attack RD 47 0-32
26.94 8.88 79.28 14.21 -5.12*** Control 54 34.41 5.62 98.41 12.91
Word Identification RD 47 0-106
67.94 15.45 76.74 13.69 -5.42*** Control 54 82.13 10.71 102.15 15.85
Reading Comprehension
RD 47 0-43
21.60 4.93 -- -- -5.35*** Control 54 26.13 3.56 -- --
Note: Nonverbal Reasoning (MAT); Working Memory (Wechsler Intelligence Scale for
Children-III Numbers Forward + Numbers Backwards); Ellision (CTOPP Ellision subtest);
Receptive Vocabulary (PPVT-III); Listening Comprehension, Word Attack, Word Identification,
Reading Comprehension (subtests of the Woodcock Language Mastery Tests).
Note 2: *p<.05. **p<.01. ***p<.001.
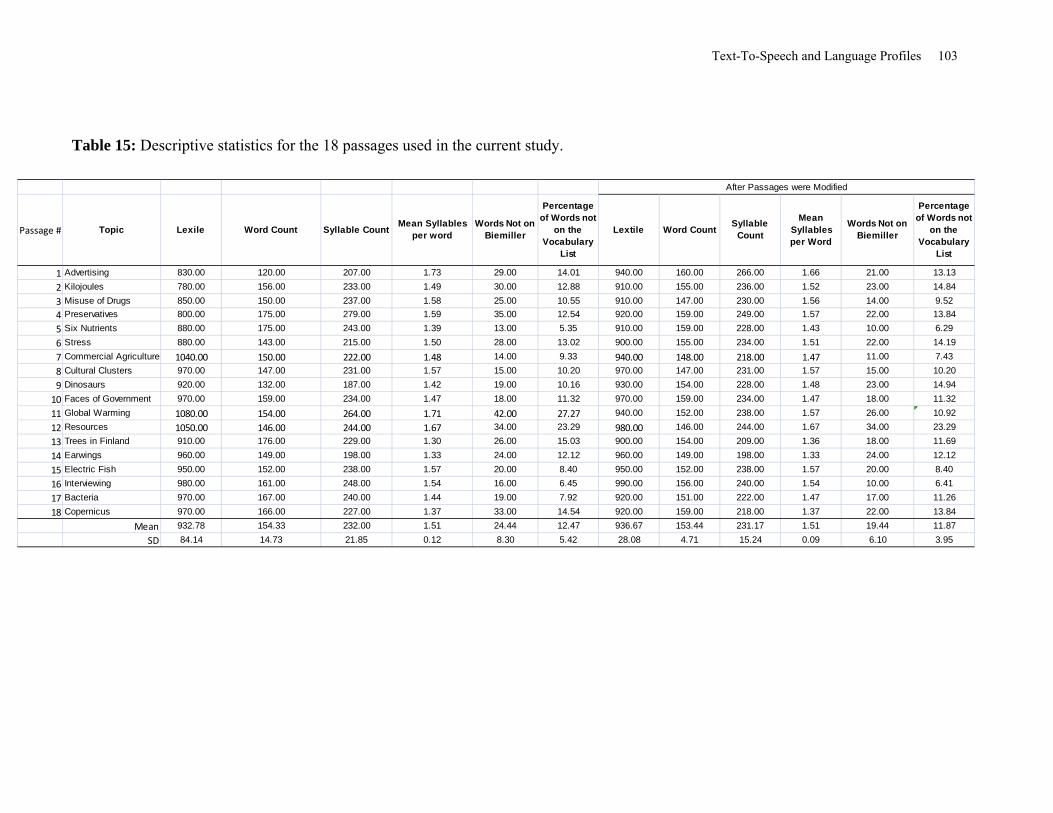
Text-To-Speech and Language Profiles 103
Table 15: Descriptive statistics for the 18 passages used in the current study.
Passage # Topic Lexile Word Count Syllable CountMean Syllables
per wordWords Not on
Biemiller
Percentage of Words not
on the Vocabulary
List
Lextile Word CountSyllable
Count
Mean Syllables per Word
Words Not on Biemiller
Percentage of Words not
on the Vocabulary
List
1 Advertising 830.00 120.00 207.00 1.73 29.00 14.01 940.00 160.00 266.00 1.66 21.00 13.13
2 Kilojoules 780.00 156.00 233.00 1.49 30.00 12.88 910.00 155.00 236.00 1.52 23.00 14.84
3 Misuse of Drugs 850.00 150.00 237.00 1.58 25.00 10.55 910.00 147.00 230.00 1.56 14.00 9.52
4 Preservatives 800.00 175.00 279.00 1.59 35.00 12.54 920.00 159.00 249.00 1.57 22.00 13.84
5 Six Nutrients 880.00 175.00 243.00 1.39 13.00 5.35 910.00 159.00 228.00 1.43 10.00 6.29
6 Stress 880.00 143.00 215.00 1.50 28.00 13.02 900.00 155.00 234.00 1.51 22.00 14.19
7 Commercial Agriculture 1040.00 150.00 222.00 1.48 14.00 9.33 940.00 148.00 218.00 1.47 11.00 7.43
8 Cultural Clusters 970.00 147.00 231.00 1.57 15.00 10.20 970.00 147.00 231.00 1.57 15.00 10.20
9 Dinosaurs 920.00 132.00 187.00 1.42 19.00 10.16 930.00 154.00 228.00 1.48 23.00 14.94
10 Faces of Government 970.00 159.00 234.00 1.47 18.00 11.32 970.00 159.00 234.00 1.47 18.00 11.32
11 Global Warming 1080.00 154.00 264.00 1.71 42.00 27.27 940.00 152.00 238.00 1.57 26.00 10.92
12 Resources 1050.00 146.00 244.00 1.67 34.00 23.29 980.00 146.00 244.00 1.67 34.00 23.29
13 Trees in Finland 910.00 176.00 229.00 1.30 26.00 15.03 900.00 154.00 209.00 1.36 18.00 11.69
14 Earwings 960.00 149.00 198.00 1.33 24.00 12.12 960.00 149.00 198.00 1.33 24.00 12.12
15 Electric Fish 950.00 152.00 238.00 1.57 20.00 8.40 950.00 152.00 238.00 1.57 20.00 8.40
16 Interviewing 980.00 161.00 248.00 1.54 16.00 6.45 990.00 156.00 240.00 1.54 10.00 6.41
17 Bacteria 970.00 167.00 240.00 1.44 19.00 7.92 920.00 151.00 222.00 1.47 17.00 11.26
18 Copernicus 970.00 166.00 227.00 1.37 33.00 14.54 920.00 159.00 218.00 1.37 22.00 13.84
Mean 932.78 154.33 232.00 1.51 24.44 12.47 936.67 153.44 231.17 1.51 19.44 11.87
SD 84.14 14.73 21.85 0.12 8.30 5.42 28.08 4.71 15.24 0.09 6.10 3.95
After Passages were Modified
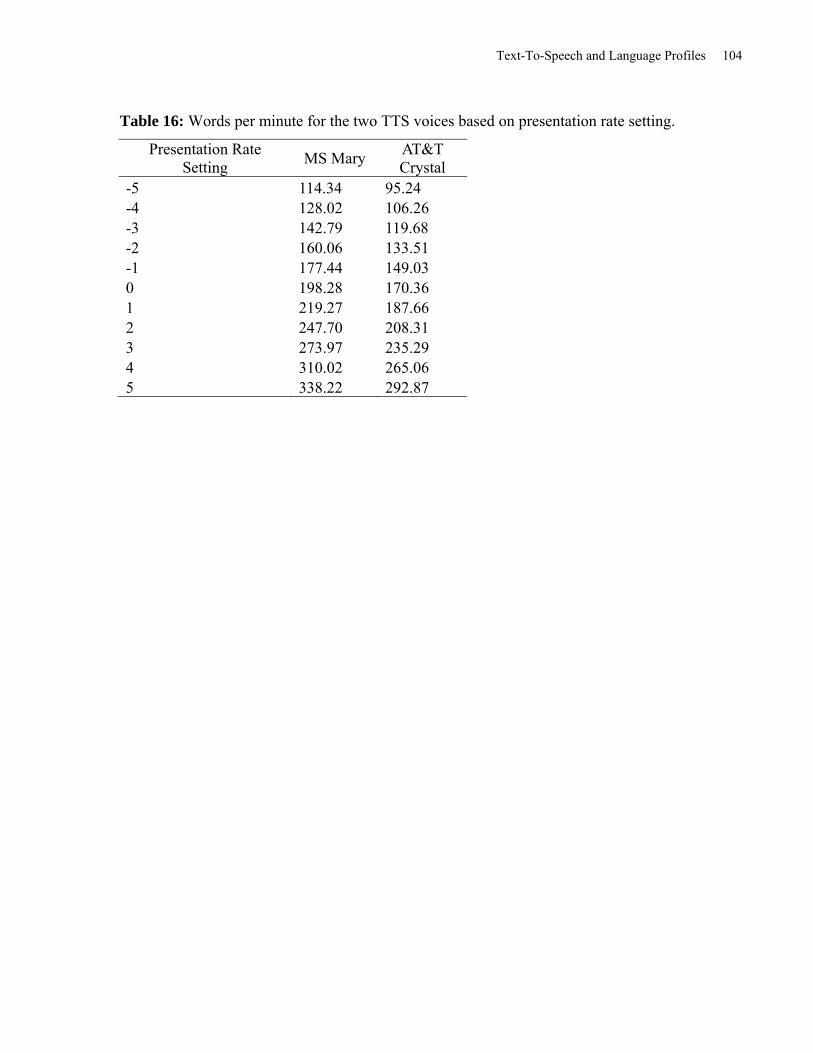
Text-To-Speech and Language Profiles 104
Table 16: Words per minute for the two TTS voices based on presentation rate setting.
Presentation Rate Setting
MS Mary AT&T Crystal
-5 114.34 95.24 -4 128.02 106.26 -3 142.79 119.68 -2 160.06 133.51 -1 177.44 149.03 0 198.28 170.36 1 219.27 187.66 2 247.70 208.31 3 273.97 235.29 4 310.02 265.06 5 338.22 292.87
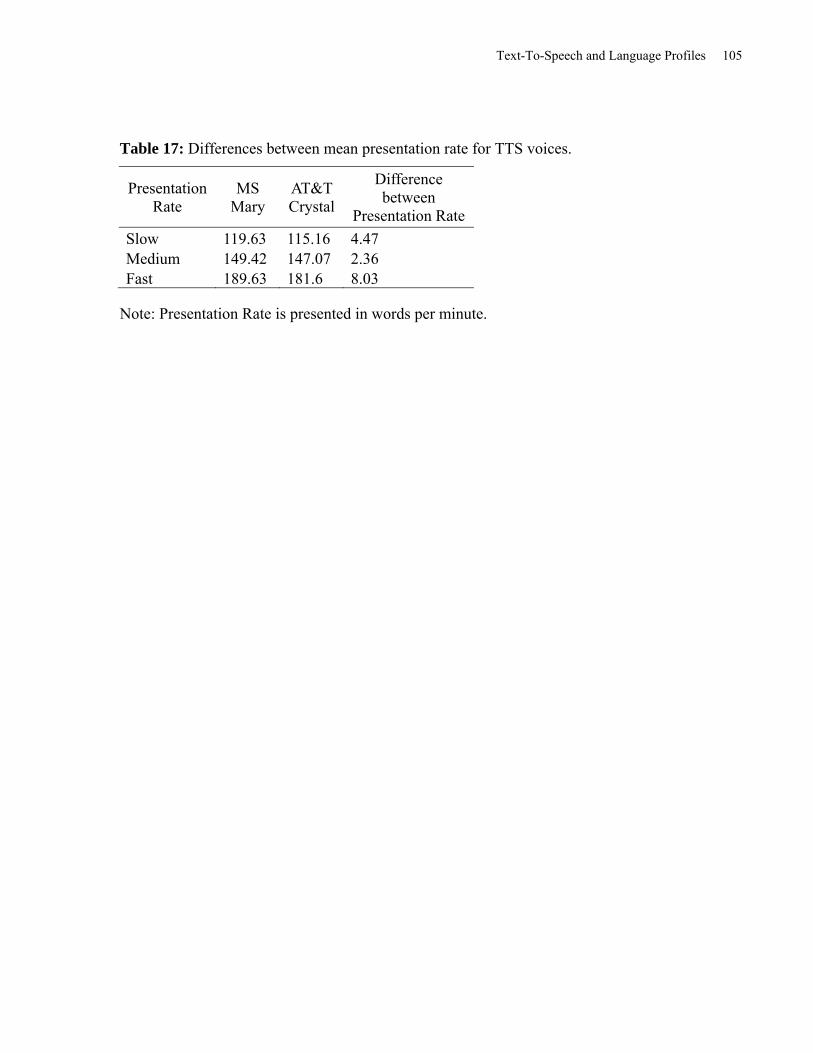
Text-To-Speech and Language Profiles 105
Table 17: Differences between mean presentation rate for TTS voices.
Presentation Rate
MS Mary
AT&T Crystal
Difference between
Presentation Rate
Slow 119.63 115.16 4.47 Medium 149.42 147.07 2.36 Fast 189.63 181.6 8.03
Note: Presentation Rate is presented in words per minute.
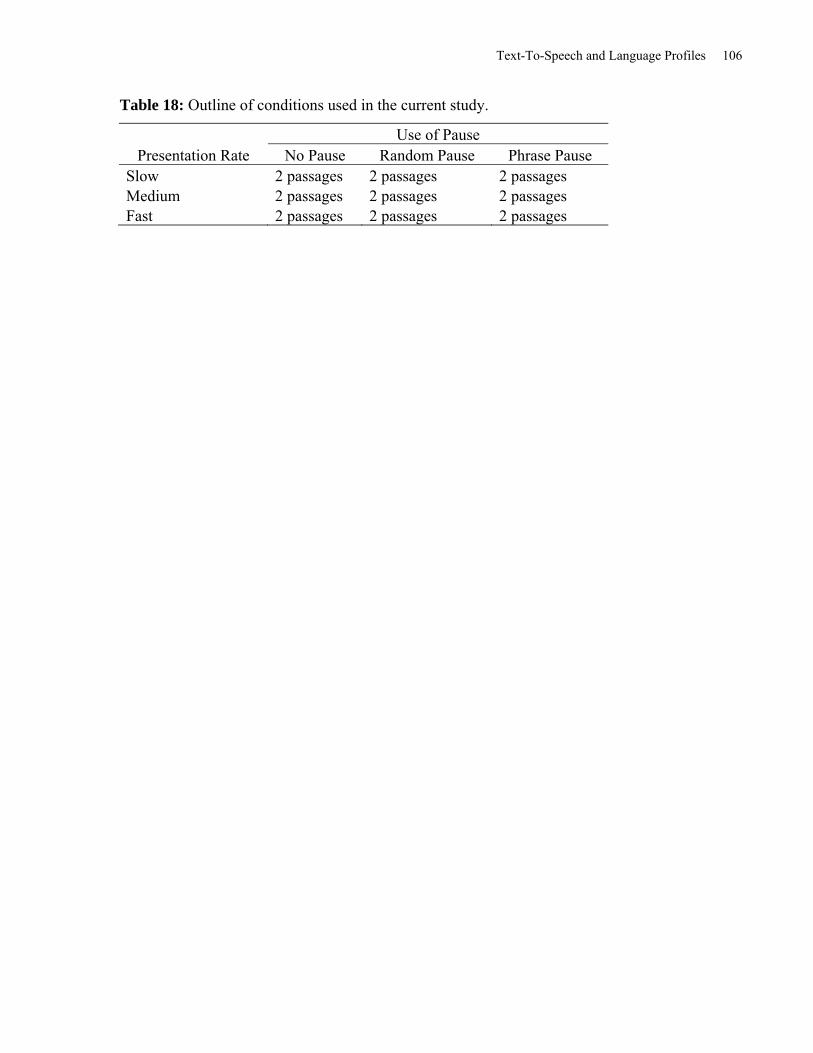
Text-To-Speech and Language Profiles 106
Table 18: Outline of conditions used in the current study.
Use of Pause Presentation Rate No Pause Random Pause Phrase Pause
Slow 2 passages 2 passages 2 passages Medium 2 passages 2 passages 2 passages Fast 2 passages 2 passages 2 passages
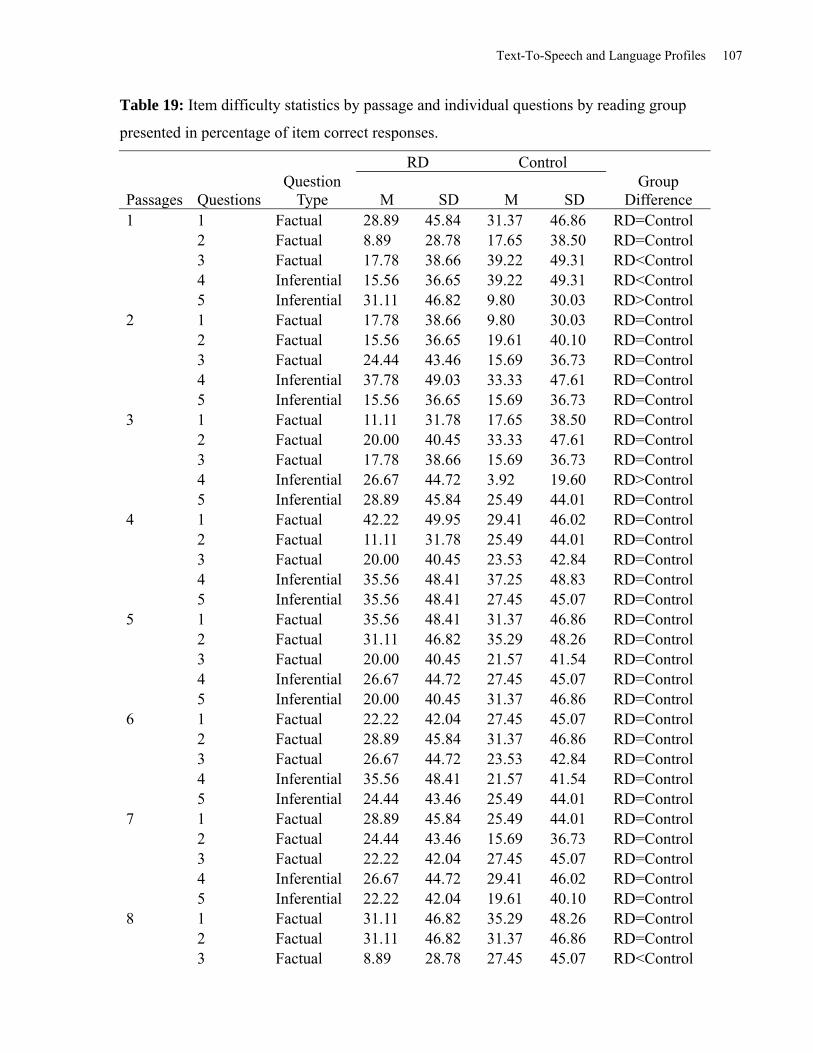
Text-To-Speech and Language Profiles 107
Table 19: Item difficulty statistics by passage and individual questions by reading group
presented in percentage of item correct responses.
RD Control
Passages Questions Question
Type M SD M SD Group
Difference 1 1 Factual 28.89 45.84 31.37 46.86 RD=Control
2 Factual 8.89 28.78 17.65 38.50 RD=Control 3 Factual 17.78 38.66 39.22 49.31 RD<Control 4 Inferential 15.56 36.65 39.22 49.31 RD<Control 5 Inferential 31.11 46.82 9.80 30.03 RD>Control
2 1 Factual 17.78 38.66 9.80 30.03 RD=Control 2 Factual 15.56 36.65 19.61 40.10 RD=Control 3 Factual 24.44 43.46 15.69 36.73 RD=Control 4 Inferential 37.78 49.03 33.33 47.61 RD=Control 5 Inferential 15.56 36.65 15.69 36.73 RD=Control
3 1 Factual 11.11 31.78 17.65 38.50 RD=Control 2 Factual 20.00 40.45 33.33 47.61 RD=Control 3 Factual 17.78 38.66 15.69 36.73 RD=Control 4 Inferential 26.67 44.72 3.92 19.60 RD>Control 5 Inferential 28.89 45.84 25.49 44.01 RD=Control
4 1 Factual 42.22 49.95 29.41 46.02 RD=Control 2 Factual 11.11 31.78 25.49 44.01 RD=Control 3 Factual 20.00 40.45 23.53 42.84 RD=Control 4 Inferential 35.56 48.41 37.25 48.83 RD=Control 5 Inferential 35.56 48.41 27.45 45.07 RD=Control
5 1 Factual 35.56 48.41 31.37 46.86 RD=Control 2 Factual 31.11 46.82 35.29 48.26 RD=Control 3 Factual 20.00 40.45 21.57 41.54 RD=Control 4 Inferential 26.67 44.72 27.45 45.07 RD=Control 5 Inferential 20.00 40.45 31.37 46.86 RD=Control
6 1 Factual 22.22 42.04 27.45 45.07 RD=Control 2 Factual 28.89 45.84 31.37 46.86 RD=Control 3 Factual 26.67 44.72 23.53 42.84 RD=Control 4 Inferential 35.56 48.41 21.57 41.54 RD=Control 5 Inferential 24.44 43.46 25.49 44.01 RD=Control
7 1 Factual 28.89 45.84 25.49 44.01 RD=Control 2 Factual 24.44 43.46 15.69 36.73 RD=Control 3 Factual 22.22 42.04 27.45 45.07 RD=Control 4 Inferential 26.67 44.72 29.41 46.02 RD=Control 5 Inferential 22.22 42.04 19.61 40.10 RD=Control
8 1 Factual 31.11 46.82 35.29 48.26 RD=Control 2 Factual 31.11 46.82 31.37 46.86 RD=Control 3 Factual 8.89 28.78 27.45 45.07 RD<Control
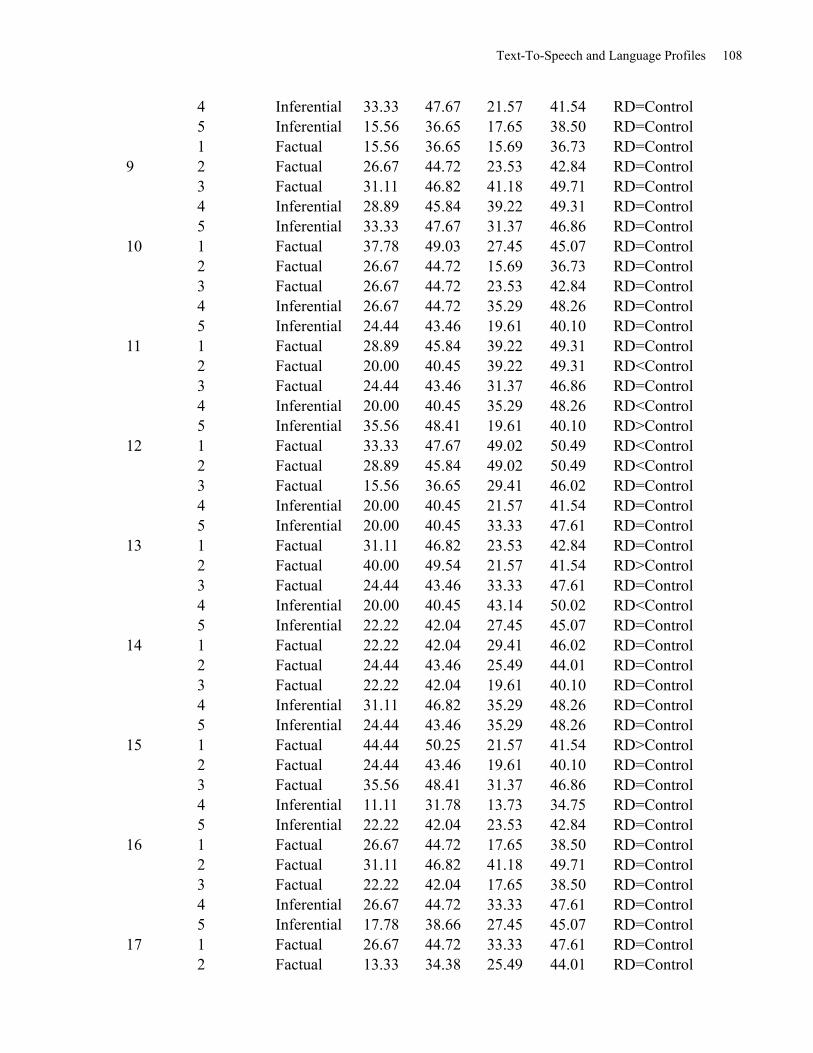
Text-To-Speech and Language Profiles 108
4 Inferential 33.33 47.67 21.57 41.54 RD=Control 5 Inferential 15.56 36.65 17.65 38.50 RD=Control 1 Factual 15.56 36.65 15.69 36.73 RD=Control
9 2 Factual 26.67 44.72 23.53 42.84 RD=Control 3 Factual 31.11 46.82 41.18 49.71 RD=Control 4 Inferential 28.89 45.84 39.22 49.31 RD=Control 5 Inferential 33.33 47.67 31.37 46.86 RD=Control
10 1 Factual 37.78 49.03 27.45 45.07 RD=Control 2 Factual 26.67 44.72 15.69 36.73 RD=Control 3 Factual 26.67 44.72 23.53 42.84 RD=Control 4 Inferential 26.67 44.72 35.29 48.26 RD=Control 5 Inferential 24.44 43.46 19.61 40.10 RD=Control
11 1 Factual 28.89 45.84 39.22 49.31 RD=Control 2 Factual 20.00 40.45 39.22 49.31 RD<Control 3 Factual 24.44 43.46 31.37 46.86 RD=Control 4 Inferential 20.00 40.45 35.29 48.26 RD<Control 5 Inferential 35.56 48.41 19.61 40.10 RD>Control
12 1 Factual 33.33 47.67 49.02 50.49 RD<Control 2 Factual 28.89 45.84 49.02 50.49 RD<Control 3 Factual 15.56 36.65 29.41 46.02 RD=Control 4 Inferential 20.00 40.45 21.57 41.54 RD=Control 5 Inferential 20.00 40.45 33.33 47.61 RD=Control
13 1 Factual 31.11 46.82 23.53 42.84 RD=Control 2 Factual 40.00 49.54 21.57 41.54 RD>Control 3 Factual 24.44 43.46 33.33 47.61 RD=Control 4 Inferential 20.00 40.45 43.14 50.02 RD<Control 5 Inferential 22.22 42.04 27.45 45.07 RD=Control
14 1 Factual 22.22 42.04 29.41 46.02 RD=Control 2 Factual 24.44 43.46 25.49 44.01 RD=Control 3 Factual 22.22 42.04 19.61 40.10 RD=Control 4 Inferential 31.11 46.82 35.29 48.26 RD=Control 5 Inferential 24.44 43.46 35.29 48.26 RD=Control
15 1 Factual 44.44 50.25 21.57 41.54 RD>Control 2 Factual 24.44 43.46 19.61 40.10 RD=Control 3 Factual 35.56 48.41 31.37 46.86 RD=Control 4 Inferential 11.11 31.78 13.73 34.75 RD=Control 5 Inferential 22.22 42.04 23.53 42.84 RD=Control
16 1 Factual 26.67 44.72 17.65 38.50 RD=Control 2 Factual 31.11 46.82 41.18 49.71 RD=Control 3 Factual 22.22 42.04 17.65 38.50 RD=Control 4 Inferential 26.67 44.72 33.33 47.61 RD=Control 5 Inferential 17.78 38.66 27.45 45.07 RD=Control
17 1 Factual 26.67 44.72 33.33 47.61 RD=Control 2 Factual 13.33 34.38 25.49 44.01 RD=Control
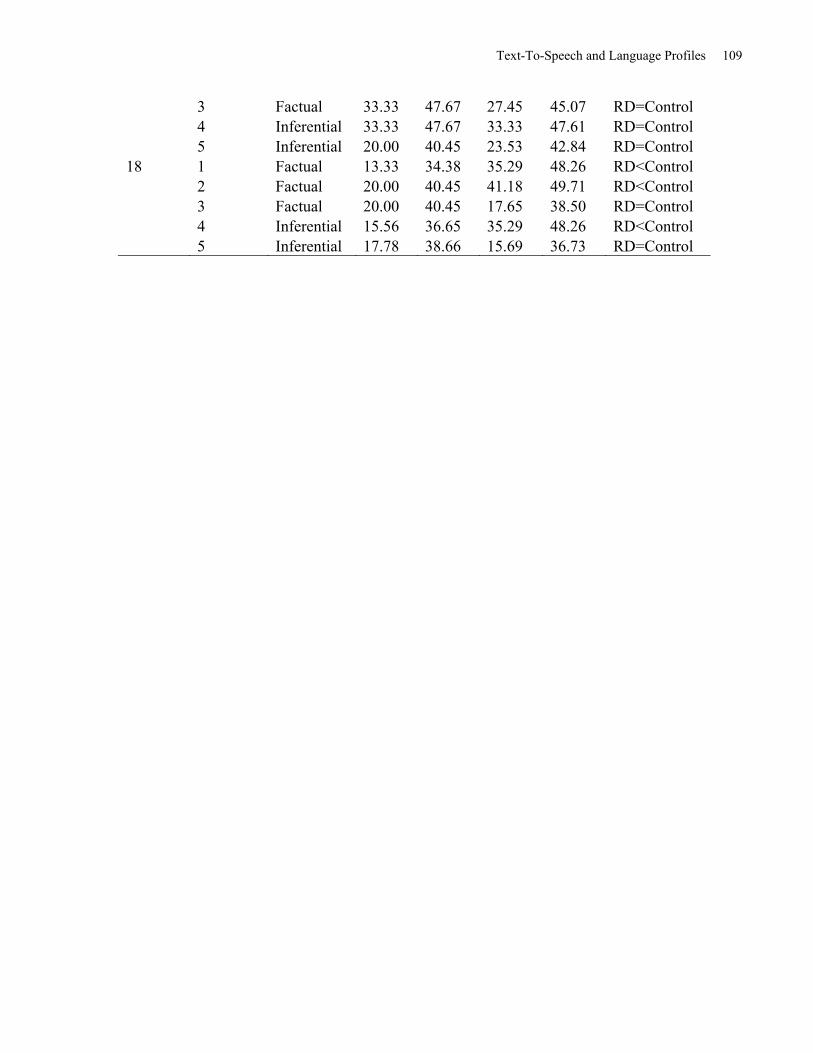
Text-To-Speech and Language Profiles 109
3 Factual 33.33 47.67 27.45 45.07 RD=Control 4 Inferential 33.33 47.67 33.33 47.61 RD=Control 5 Inferential 20.00 40.45 23.53 42.84 RD=Control
18 1 Factual 13.33 34.38 35.29 48.26 RD<Control 2 Factual 20.00 40.45 41.18 49.71 RD<Control 3 Factual 20.00 40.45 17.65 38.50 RD=Control 4 Inferential 15.56 36.65 35.29 48.26 RD<Control
5 Inferential 17.78 38.66 15.69 36.73 RD=Control
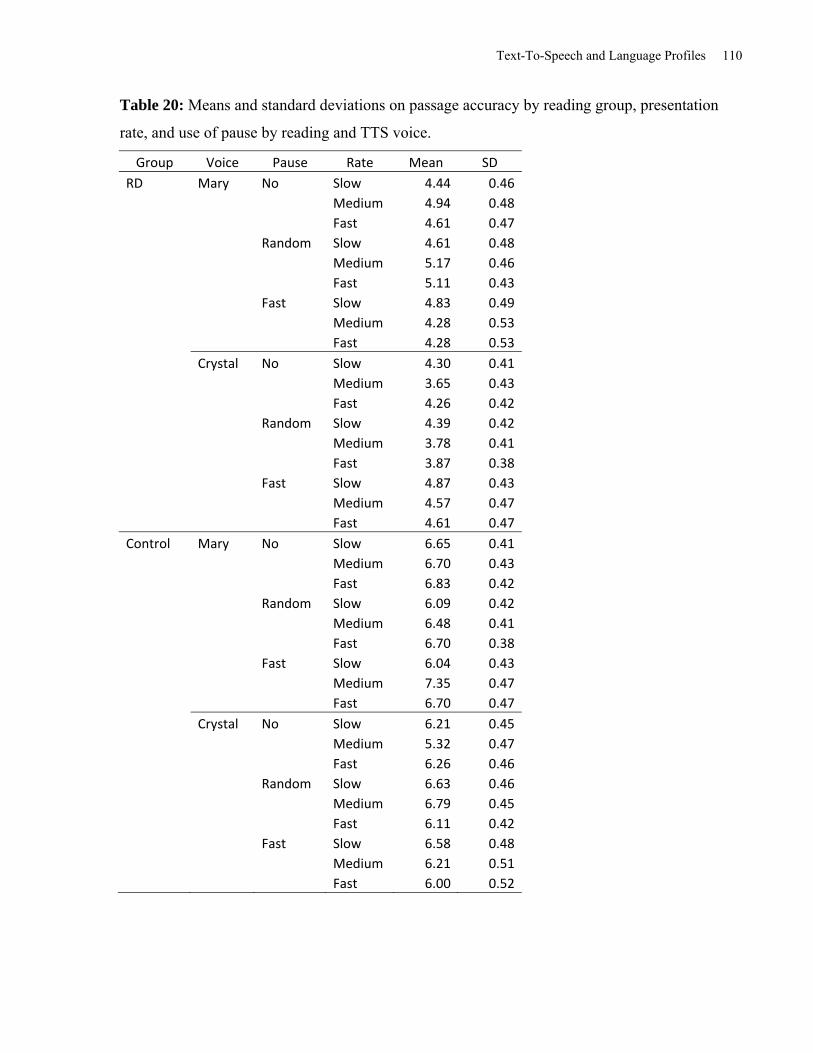
Text-To-Speech and Language Profiles 110
Table 20: Means and standard deviations on passage accuracy by reading group, presentation
rate, and use of pause by reading and TTS voice.
Group Voice Pause Rate Mean SD
RD Mary No Slow 4.44 0.46
Medium 4.94 0.48
Fast 4.61 0.47
Random Slow 4.61 0.48
Medium 5.17 0.46
Fast 5.11 0.43
Fast Slow 4.83 0.49
Medium 4.28 0.53
Fast 4.28 0.53
Crystal No Slow 4.30 0.41
Medium 3.65 0.43
Fast 4.26 0.42
Random Slow 4.39 0.42
Medium 3.78 0.41
Fast 3.87 0.38
Fast Slow 4.87 0.43
Medium 4.57 0.47
Fast 4.61 0.47
Control Mary No Slow 6.65 0.41
Medium 6.70 0.43
Fast 6.83 0.42
Random Slow 6.09 0.42
Medium 6.48 0.41
Fast 6.70 0.38
Fast Slow 6.04 0.43
Medium 7.35 0.47
Fast 6.70 0.47
Crystal No Slow 6.21 0.45
Medium 5.32 0.47
Fast 6.26 0.46
Random Slow 6.63 0.46
Medium 6.79 0.45
Fast 6.11 0.42
Fast Slow 6.58 0.48
Medium 6.21 0.51
Fast 6.00 0.52
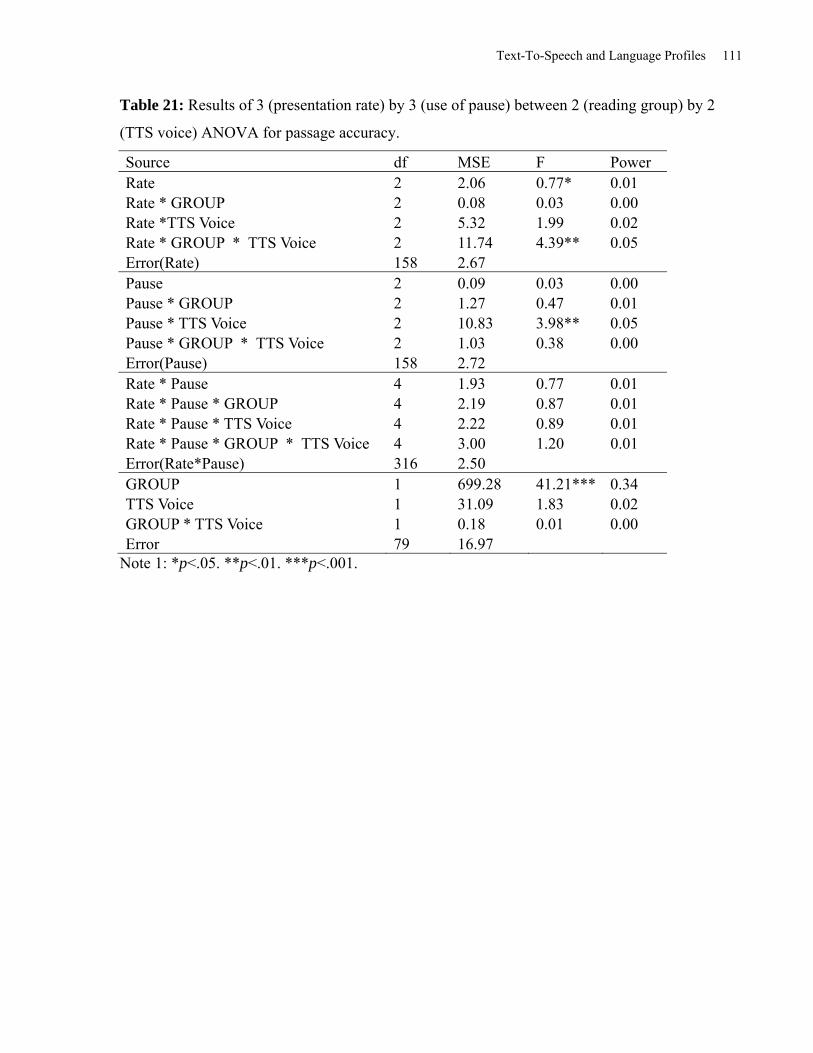
Text-To-Speech and Language Profiles 111
Table 21: Results of 3 (presentation rate) by 3 (use of pause) between 2 (reading group) by 2
(TTS voice) ANOVA for passage accuracy.
Source df MSE F Power Rate 2 2.06 0.77* 0.01 Rate * GROUP 2 0.08 0.03 0.00 Rate *TTS Voice 2 5.32 1.99 0.02 Rate * GROUP * TTS Voice 2 11.74 4.39** 0.05 Error(Rate) 158 2.67 Pause 2 0.09 0.03 0.00 Pause * GROUP 2 1.27 0.47 0.01 Pause * TTS Voice 2 10.83 3.98** 0.05 Pause * GROUP * TTS Voice 2 1.03 0.38 0.00 Error(Pause) 158 2.72 Rate * Pause 4 1.93 0.77 0.01 Rate * Pause * GROUP 4 2.19 0.87 0.01 Rate * Pause * TTS Voice 4 2.22 0.89 0.01 Rate * Pause * GROUP * TTS Voice 4 3.00 1.20 0.01 Error(Rate*Pause) 316 2.50 GROUP 1 699.28 41.21*** 0.34 TTS Voice 1 31.09 1.83 0.02 GROUP * TTS Voice 1 0.18 0.01 0.00 Error 79 16.97
Note 1: *p<.05. **p<.01. ***p<.001.
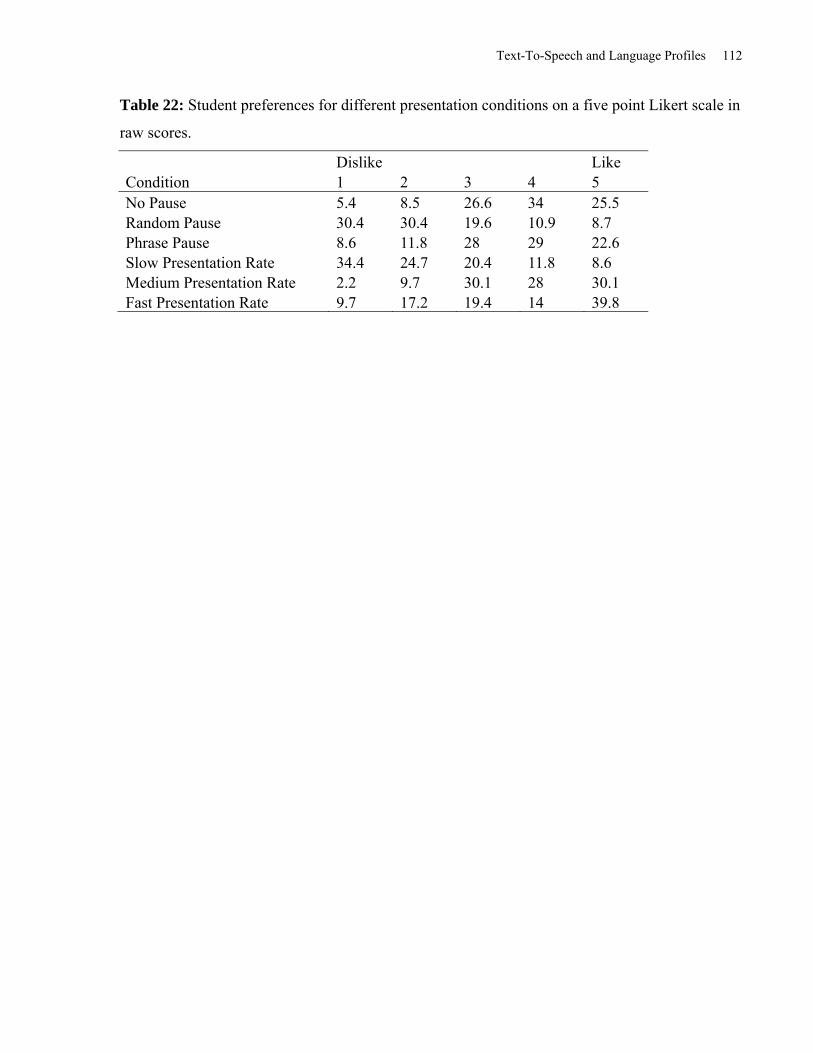
Text-To-Speech and Language Profiles 112
Table 22: Student preferences for different presentation conditions on a five point Likert scale in
raw scores.
Dislike Like Condition 1 2 3 4 5 No Pause 5.4 8.5 26.6 34 25.5 Random Pause 30.4 30.4 19.6 10.9 8.7 Phrase Pause 8.6 11.8 28 29 22.6 Slow Presentation Rate 34.4 24.7 20.4 11.8 8.6 Medium Presentation Rate 2.2 9.7 30.1 28 30.1 Fast Presentation Rate 9.7 17.2 19.4 14 39.8
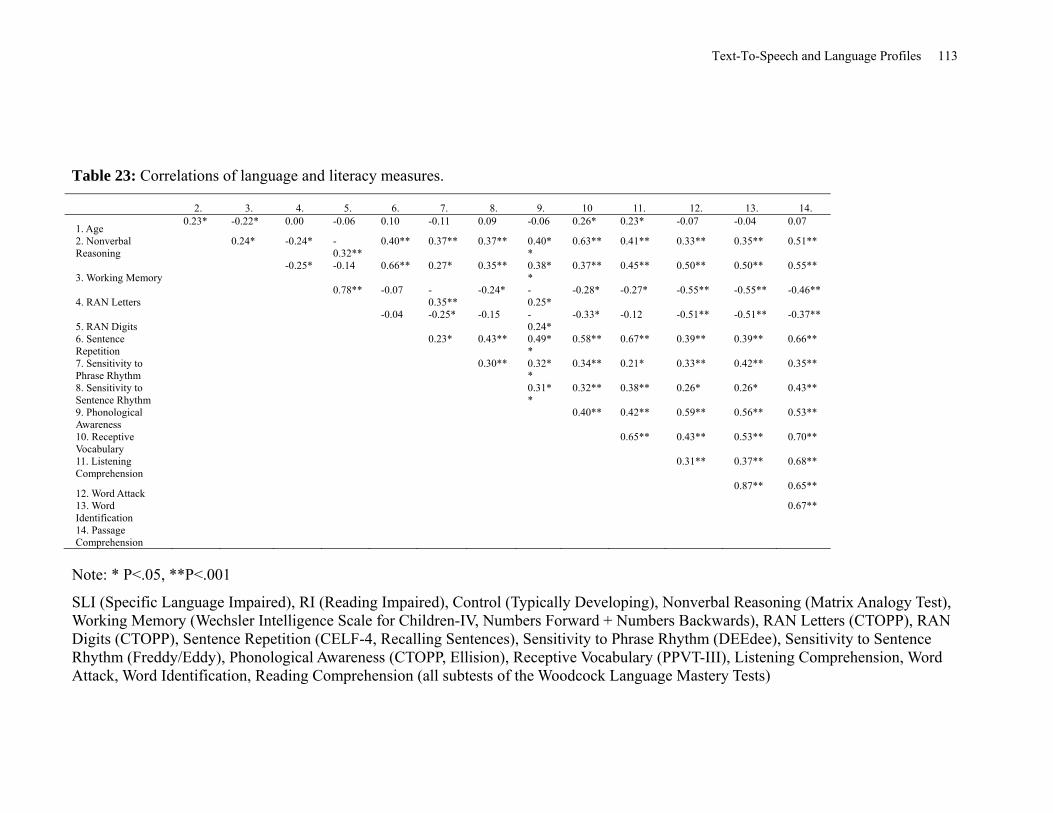
Text-To-Speech and Language Profiles 113
Table 23: Correlations of language and literacy measures.
2. 3. 4. 5. 6. 7. 8. 9. 10 11. 12. 13. 14.
1. Age 0.23* -0.22* 0.00 -0.06 0.10 -0.11 0.09 -0.06 0.26* 0.23* -0.07 -0.04 0.07
2. Nonverbal Reasoning
0.24* -0.24* -0.32**
0.40** 0.37** 0.37** 0.40**
0.63** 0.41** 0.33** 0.35** 0.51**
3. Working Memory -0.25* -0.14 0.66** 0.27* 0.35** 0.38*
* 0.37** 0.45** 0.50** 0.50** 0.55**
4. RAN Letters 0.78** -0.07 -
0.35** -0.24* -
0.25* -0.28* -0.27* -0.55** -0.55** -0.46**
5. RAN Digits -0.04 -0.25* -0.15 -
0.24* -0.33* -0.12 -0.51** -0.51** -0.37**
6. Sentence Repetition
0.23* 0.43** 0.49**
0.58** 0.67** 0.39** 0.39** 0.66**
7. Sensitivity to Phrase Rhythm
0.30** 0.32**
0.34** 0.21* 0.33** 0.42** 0.35**
8. Sensitivity to Sentence Rhythm
0.31**
0.32** 0.38** 0.26* 0.26* 0.43**
9. Phonological Awareness
0.40** 0.42** 0.59** 0.56** 0.53**
10. Receptive Vocabulary
0.65** 0.43** 0.53** 0.70**
11. Listening Comprehension
0.31** 0.37** 0.68**
12. Word Attack 0.87** 0.65**
13. Word Identification
0.67**
14. Passage Comprehension
Note: * P<.05, **P<.001
SLI (Specific Language Impaired), RI (Reading Impaired), Control (Typically Developing), Nonverbal Reasoning (Matrix Analogy Test), Working Memory (Wechsler Intelligence Scale for Children-IV, Numbers Forward + Numbers Backwards), RAN Letters (CTOPP), RAN Digits (CTOPP), Sentence Repetition (CELF-4, Recalling Sentences), Sensitivity to Phrase Rhythm (DEEdee), Sensitivity to Sentence Rhythm (Freddy/Eddy), Phonological Awareness (CTOPP, Ellision), Receptive Vocabulary (PPVT-III), Listening Comprehension, Word Attack, Word Identification, Reading Comprehension (all subtests of the Woodcock Language Mastery Tests)
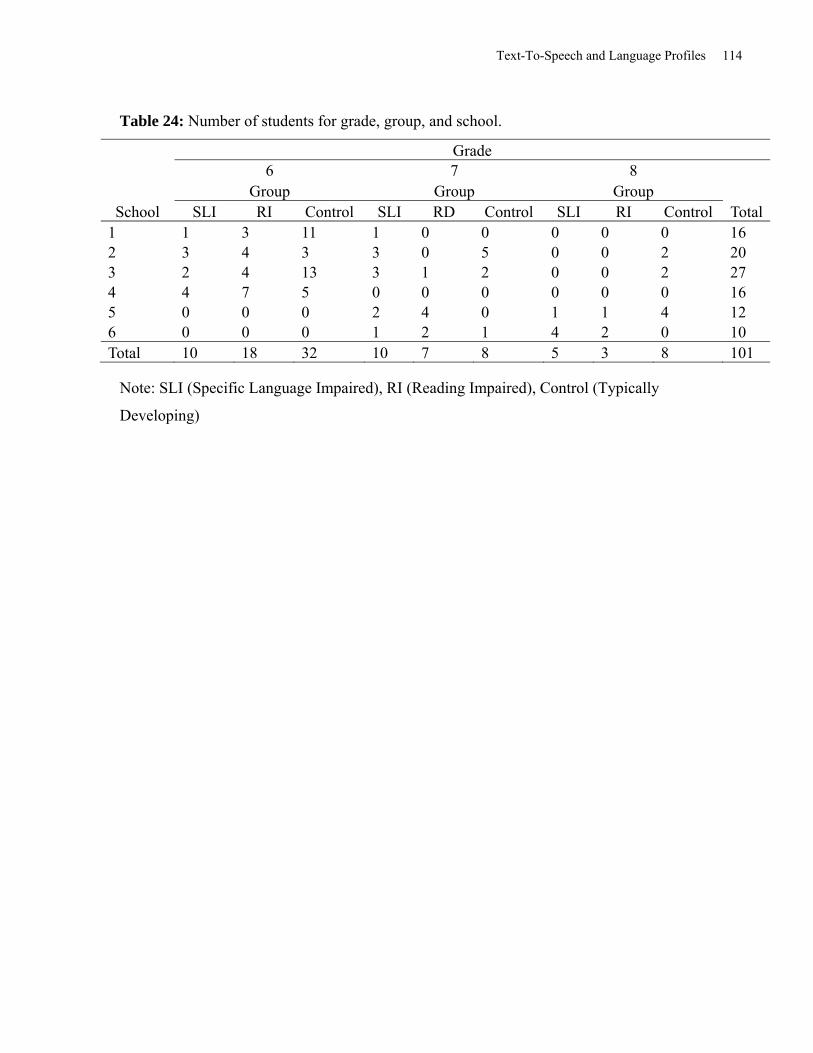
Text-To-Speech and Language Profiles 114
Table 24: Number of students for grade, group, and school.
Grade 6 7 8 Group Group Group School SLI RI Control SLI RD Control SLI RI Control Total
1 1 3 11 1 0 0 0 0 0 16 2 3 4 3 3 0 5 0 0 2 20 3 2 4 13 3 1 2 0 0 2 27 4 4 7 5 0 0 0 0 0 0 16 5 0 0 0 2 4 0 1 1 4 12 6 0 0 0 1 2 1 4 2 0 10 Total 10 18 32 10 7 8 5 3 8 101
Note: SLI (Specific Language Impaired), RI (Reading Impaired), Control (Typically
Developing)
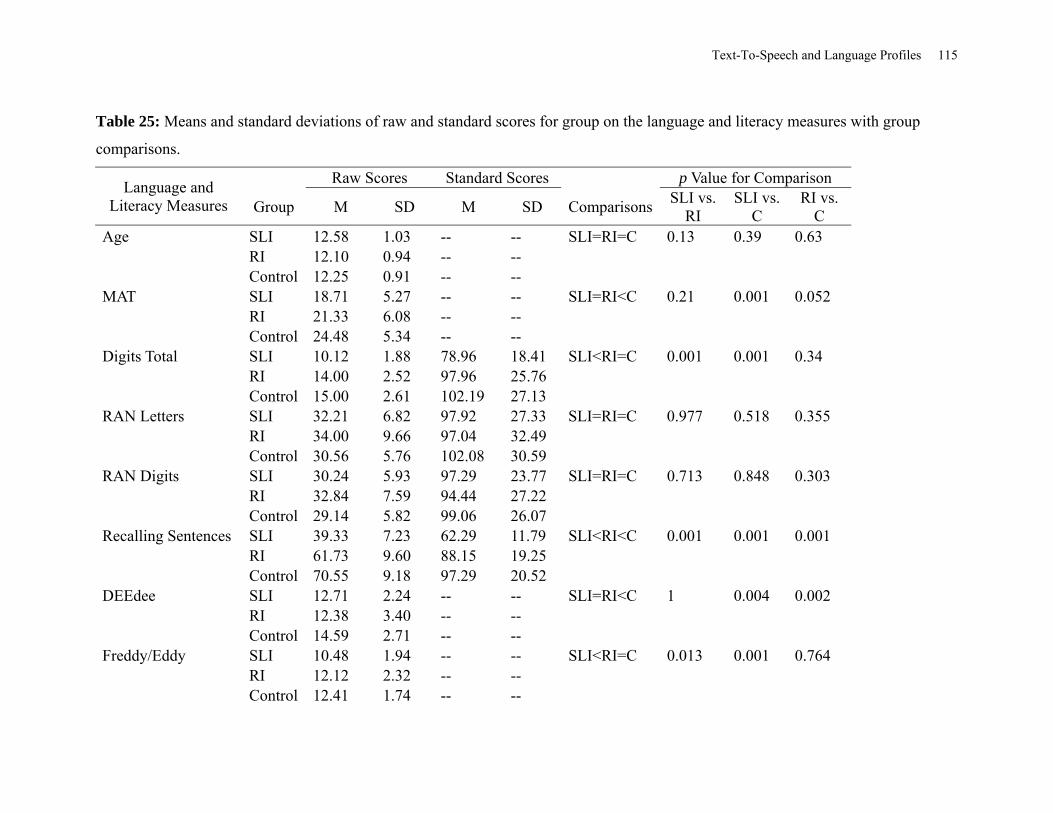
Text-To-Speech and Language Profiles 115
Table 25: Means and standard deviations of raw and standard scores for group on the language and literacy measures with group
comparisons.
Language and Literacy Measures
Raw Scores Standard Scores p Value for Comparison
Group M SD M SD Comparisons SLI vs.
RI SLI vs.
C RI vs.
C Age SLI 12.58 1.03 -- -- SLI=RI=C 0.13 0.39 0.63 RI 12.10 0.94 -- -- Control 12.25 0.91 -- -- MAT SLI 18.71 5.27 -- -- SLI=RI<C 0.21 0.001 0.052 RI 21.33 6.08 -- -- Control 24.48 5.34 -- -- Digits Total SLI 10.12 1.88 78.96 18.41 SLI<RI=C 0.001 0.001 0.34 RI 14.00 2.52 97.96 25.76 Control 15.00 2.61 102.19 27.13 RAN Letters SLI 32.21 6.82 97.92 27.33 SLI=RI=C 0.977 0.518 0.355 RI 34.00 9.66 97.04 32.49 Control 30.56 5.76 102.08 30.59 RAN Digits SLI 30.24 5.93 97.29 23.77 SLI=RI=C 0.713 0.848 0.303 RI 32.84 7.59 94.44 27.22 Control 29.14 5.82 99.06 26.07 Recalling Sentences SLI 39.33 7.23 62.29 11.79 SLI<RI<C 0.001 0.001 0.001 RI 61.73 9.60 88.15 19.25 Control 70.55 9.18 97.29 20.52 DEEdee SLI 12.71 2.24 -- -- SLI=RI<C 1 0.004 0.002 RI 12.38 3.40 -- -- Control 14.59 2.71 -- -- Freddy/Eddy SLI 10.48 1.94 -- -- SLI<RI=C 0.013 0.001 0.764 RI 12.12 2.32 -- -- Control 12.41 1.74 -- --
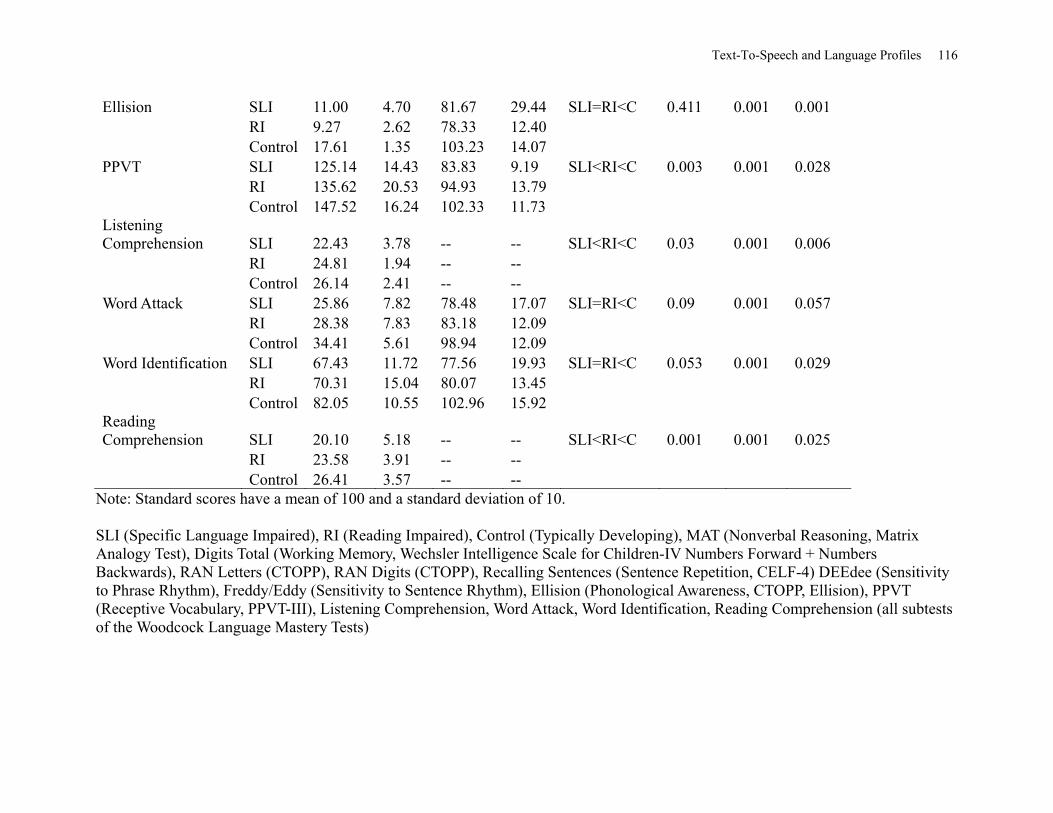
Text-To-Speech and Language Profiles 116
Ellision SLI 11.00 4.70 81.67 29.44 SLI=RI<C 0.411 0.001 0.001 RI 9.27 2.62 78.33 12.40 Control 17.61 1.35 103.23 14.07 PPVT SLI 125.14 14.43 83.83 9.19 SLI<RI<C 0.003 0.001 0.028 RI 135.62 20.53 94.93 13.79 Control 147.52 16.24 102.33 11.73 Listening Comprehension SLI 22.43 3.78 -- -- SLI<RI<C 0.03 0.001 0.006 RI 24.81 1.94 -- -- Control 26.14 2.41 -- -- Word Attack SLI 25.86 7.82 78.48 17.07 SLI=RI<C 0.09 0.001 0.057 RI 28.38 7.83 83.18 12.09 Control 34.41 5.61 98.94 12.09 Word Identification SLI 67.43 11.72 77.56 19.93 SLI=RI<C 0.053 0.001 0.029 RI 70.31 15.04 80.07 13.45 Control 82.05 10.55 102.96 15.92 Reading Comprehension SLI 20.10 5.18 -- -- SLI<RI<C 0.001 0.001 0.025 RI 23.58 3.91 -- -- Control 26.41 3.57 -- --
Note: Standard scores have a mean of 100 and a standard deviation of 10. SLI (Specific Language Impaired), RI (Reading Impaired), Control (Typically Developing), MAT (Nonverbal Reasoning, Matrix Analogy Test), Digits Total (Working Memory, Wechsler Intelligence Scale for Children-IV Numbers Forward + Numbers Backwards), RAN Letters (CTOPP), RAN Digits (CTOPP), Recalling Sentences (Sentence Repetition, CELF-4) DEEdee (Sensitivity to Phrase Rhythm), Freddy/Eddy (Sensitivity to Sentence Rhythm), Ellision (Phonological Awareness, CTOPP, Ellision), PPVT (Receptive Vocabulary, PPVT-III), Listening Comprehension, Word Attack, Word Identification, Reading Comprehension (all subtests of the Woodcock Language Mastery Tests)
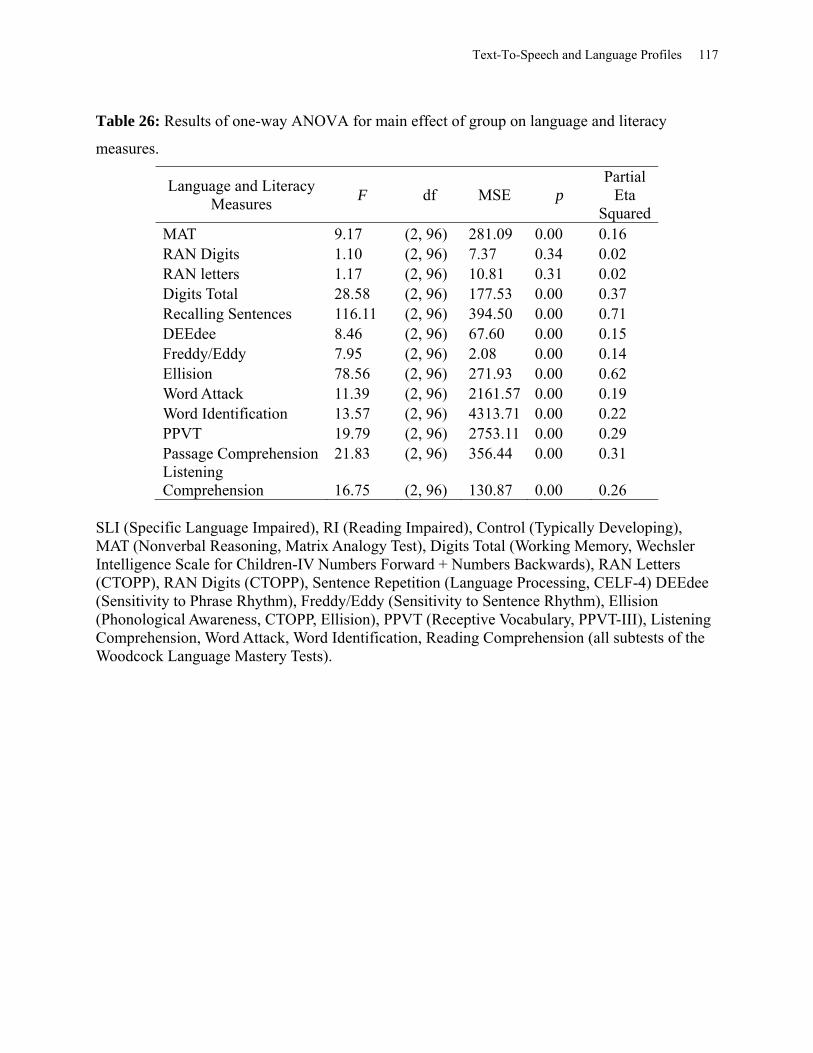
Text-To-Speech and Language Profiles 117
Table 26: Results of one-way ANOVA for main effect of group on language and literacy
measures.
Language and Literacy Measures
F df MSE p Partial
Eta Squared
MAT 9.17 (2, 96) 281.09 0.00 0.16 RAN Digits 1.10 (2, 96) 7.37 0.34 0.02 RAN letters 1.17 (2, 96) 10.81 0.31 0.02 Digits Total 28.58 (2, 96) 177.53 0.00 0.37 Recalling Sentences 116.11 (2, 96) 394.50 0.00 0.71 DEEdee 8.46 (2, 96) 67.60 0.00 0.15 Freddy/Eddy 7.95 (2, 96) 2.08 0.00 0.14 Ellision 78.56 (2, 96) 271.93 0.00 0.62 Word Attack 11.39 (2, 96) 2161.57 0.00 0.19 Word Identification 13.57 (2, 96) 4313.71 0.00 0.22 PPVT 19.79 (2, 96) 2753.11 0.00 0.29 Passage Comprehension 21.83 (2, 96) 356.44 0.00 0.31 Listening Comprehension 16.75 (2, 96) 130.87 0.00 0.26
SLI (Specific Language Impaired), RI (Reading Impaired), Control (Typically Developing), MAT (Nonverbal Reasoning, Matrix Analogy Test), Digits Total (Working Memory, Wechsler Intelligence Scale for Children-IV Numbers Forward + Numbers Backwards), RAN Letters (CTOPP), RAN Digits (CTOPP), Sentence Repetition (Language Processing, CELF-4) DEEdee (Sensitivity to Phrase Rhythm), Freddy/Eddy (Sensitivity to Sentence Rhythm), Ellision (Phonological Awareness, CTOPP, Ellision), PPVT (Receptive Vocabulary, PPVT-III), Listening Comprehension, Word Attack, Word Identification, Reading Comprehension (all subtests of the Woodcock Language Mastery Tests).
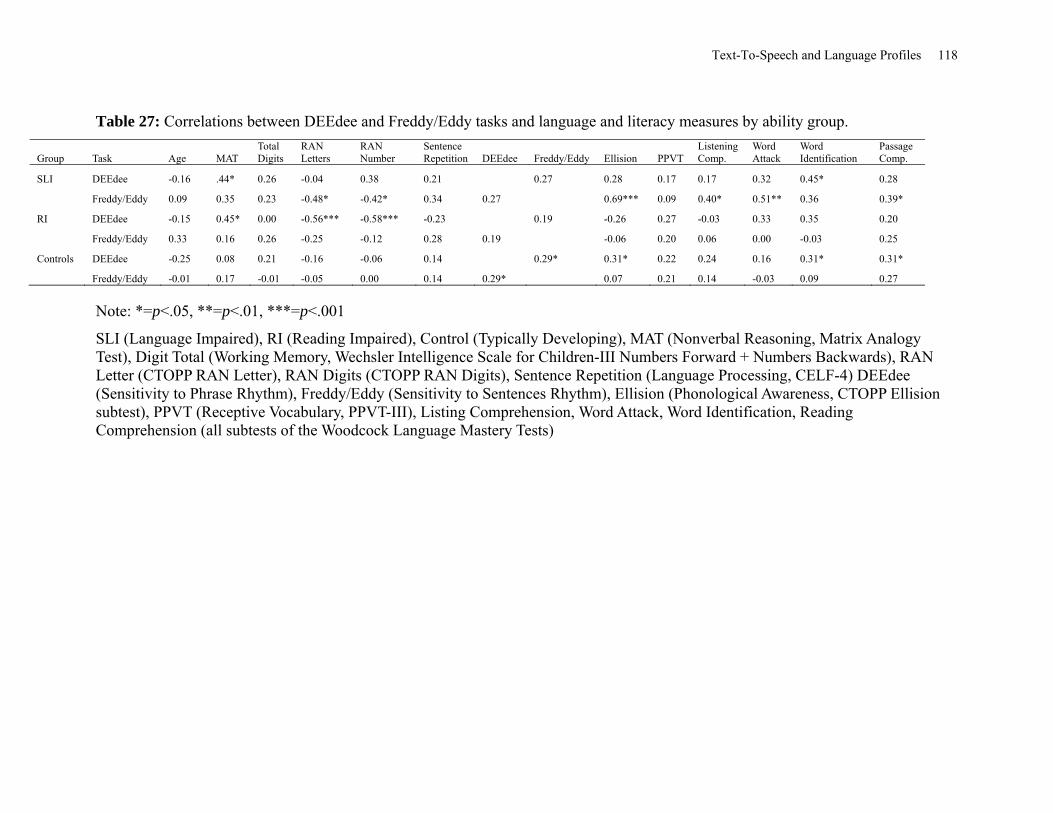
Text-To-Speech and Language Profiles 118
Table 27: Correlations between DEEdee and Freddy/Eddy tasks and language and literacy measures by ability group.
Group Task Age MAT Total Digits
RAN Letters
RAN Number
Sentence Repetition DEEdee Freddy/Eddy Ellision PPVT
Listening Comp.
Word Attack
Word Identification
Passage Comp.
SLI DEEdee -0.16 .44* 0.26 -0.04 0.38 0.21 0.27 0.28 0.17 0.17 0.32 0.45* 0.28
Freddy/Eddy 0.09 0.35 0.23 -0.48* -0.42* 0.34 0.27 0.69*** 0.09 0.40* 0.51** 0.36 0.39*
RI DEEdee -0.15 0.45* 0.00 -0.56*** -0.58*** -0.23 0.19 -0.26 0.27 -0.03 0.33 0.35 0.20
Freddy/Eddy 0.33 0.16 0.26 -0.25 -0.12 0.28 0.19 -0.06 0.20 0.06 0.00 -0.03 0.25
Controls DEEdee -0.25 0.08 0.21 -0.16 -0.06 0.14 0.29* 0.31* 0.22 0.24 0.16 0.31* 0.31*
Freddy/Eddy -0.01 0.17 -0.01 -0.05 0.00 0.14 0.29* 0.07 0.21 0.14 -0.03 0.09 0.27
Note: *=p<.05, **=p<.01, ***=p<.001
SLI (Language Impaired), RI (Reading Impaired), Control (Typically Developing), MAT (Nonverbal Reasoning, Matrix Analogy Test), Digit Total (Working Memory, Wechsler Intelligence Scale for Children-III Numbers Forward + Numbers Backwards), RAN Letter (CTOPP RAN Letter), RAN Digits (CTOPP RAN Digits), Sentence Repetition (Language Processing, CELF-4) DEEdee (Sensitivity to Phrase Rhythm), Freddy/Eddy (Sensitivity to Sentences Rhythm), Ellision (Phonological Awareness, CTOPP Ellision subtest), PPVT (Receptive Vocabulary, PPVT-III), Listing Comprehension, Word Attack, Word Identification, Reading Comprehension (all subtests of the Woodcock Language Mastery Tests)
Text-To-Speech and Language Profiles 119
Figure 1: Procedure for pseudoword discrimination task.
Text-To-Speech and Language Profiles 120
Figure 2: Procedure for real word discrimination task.
Text-To-Speech and Language Profiles 121
Figure 3: Example of sentence comprehension task.
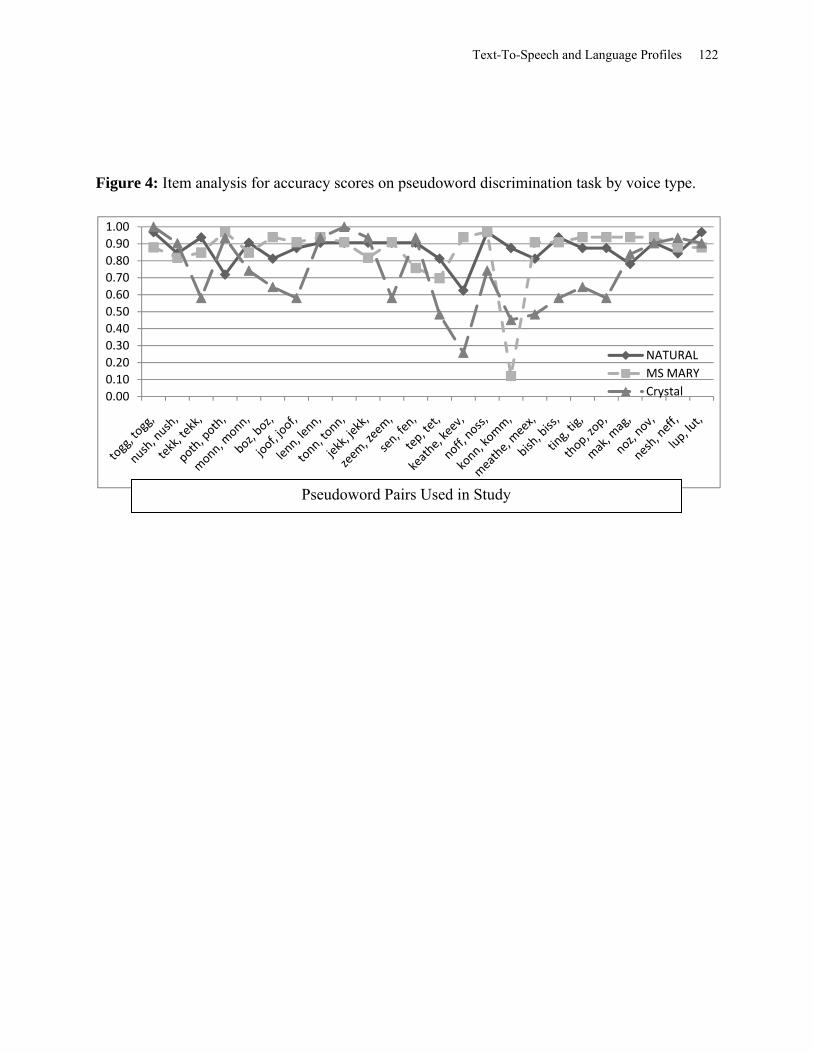
Text-To-Speech and Language Profiles 122
Figure 4: Item analysis for accuracy scores on pseudoword discrimination task by voice type.
0.00
0.10
0.20
0.30
0.40
0.50
0.60
0.70
0.80
0.90
1.00
NATURAL
MS MARY
Crystal
Pseudoword Pairs Used in Study
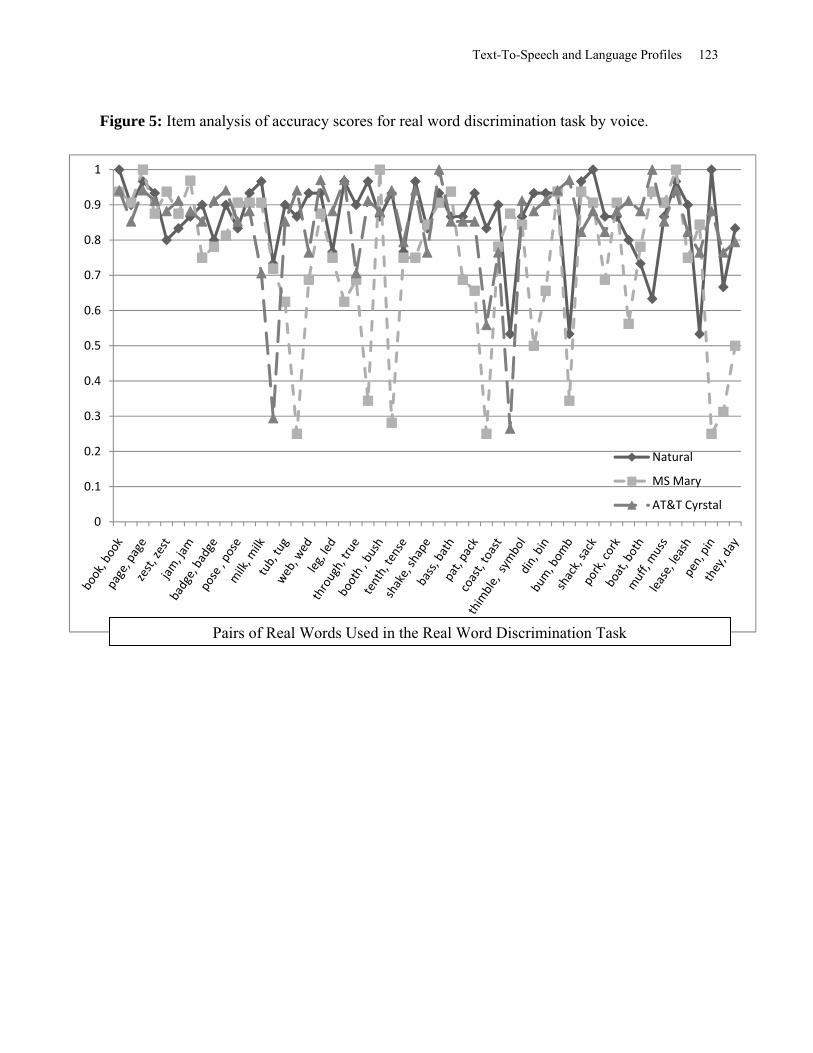
Text-To-Speech and Language Profiles 123
Figure 5: Item analysis of accuracy scores for real word discrimination task by voice.
0
0.1
0.2
0.3
0.4
0.5
0.6
0.7
0.8
0.9
1
Natural
MS Mary
AT&T Cyrstal
Pairs of Real Words Used in the Real Word Discrimination Task
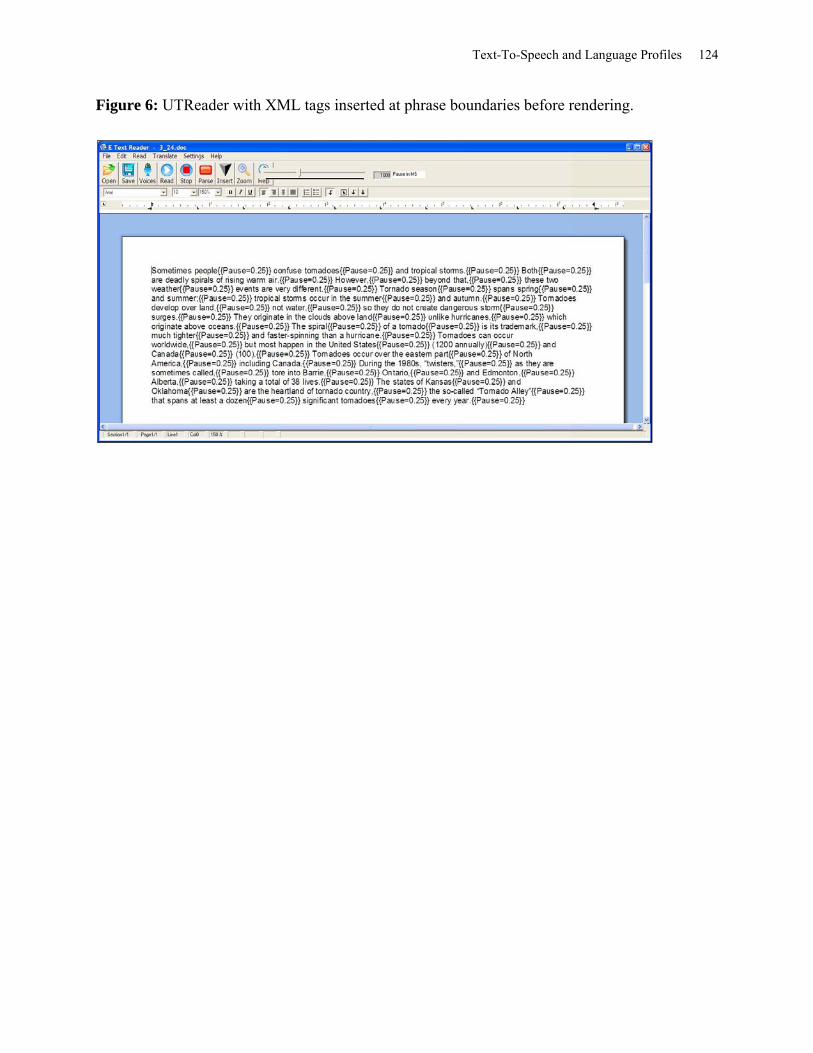
Text-To-Speech and Language Profiles 124
Figure 6: UTReader with XML tags inserted at phrase boundaries before rendering.
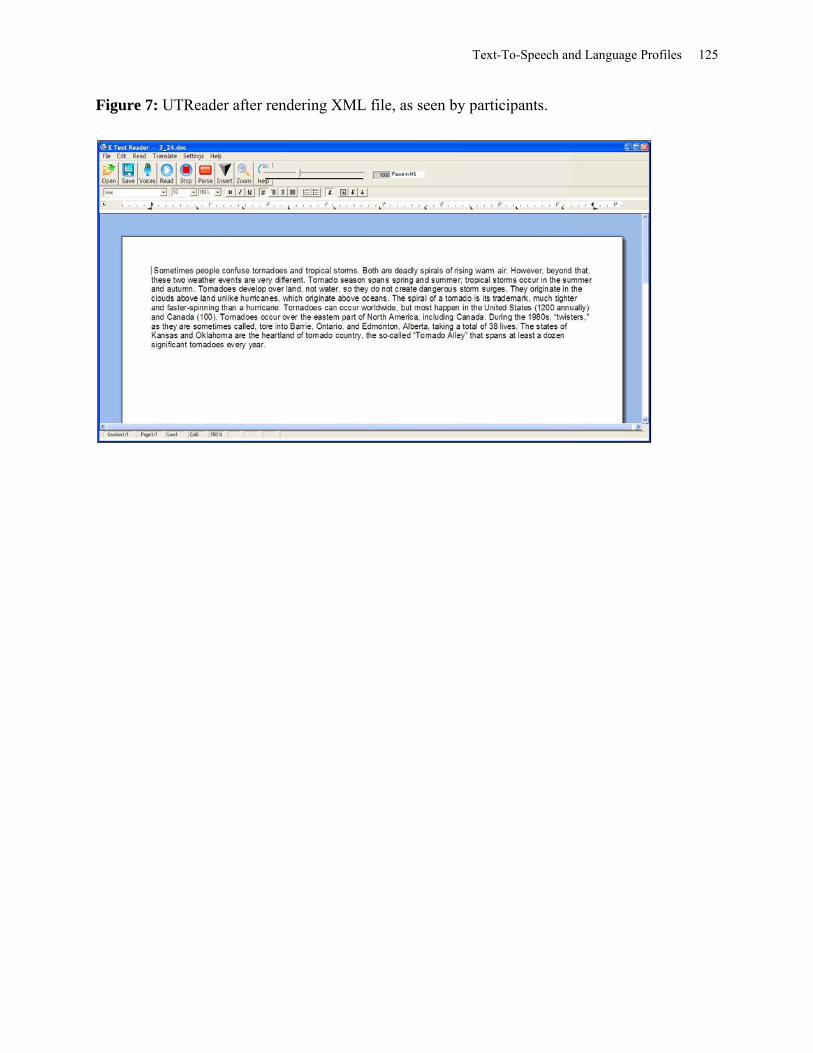
Text-To-Speech and Language Profiles 125
Figure 7: UTReader after rendering XML file, as seen by participants.
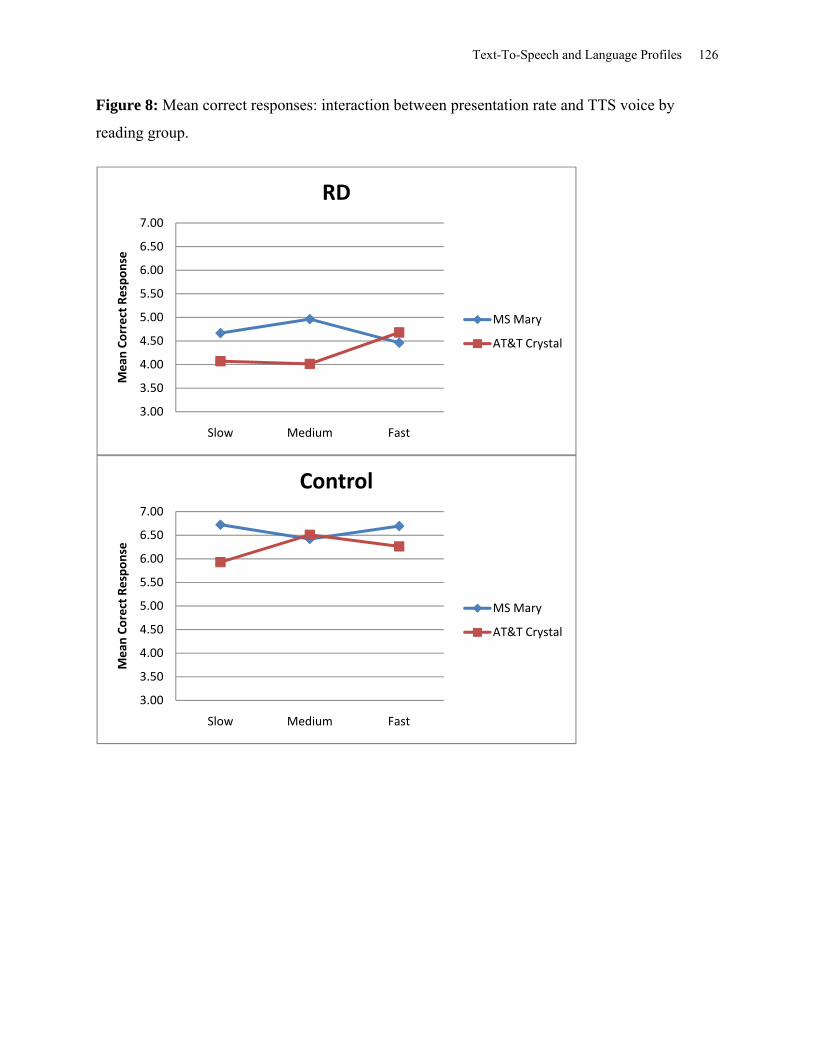
Text-To-Speech and Language Profiles 126
Figure 8: Mean correct responses: interaction between presentation rate and TTS voice by
reading group.
3.00
3.50
4.00
4.50
5.00
5.50
6.00
6.50
7.00
Slow Medium Fast
Mean
Correct Response
RD
MS Mary
AT&T Crystal
3.00
3.50
4.00
4.50
5.00
5.50
6.00
6.50
7.00
Slow Medium Fast
Mean
Corect Response
Control
MS Mary
AT&T Crystal
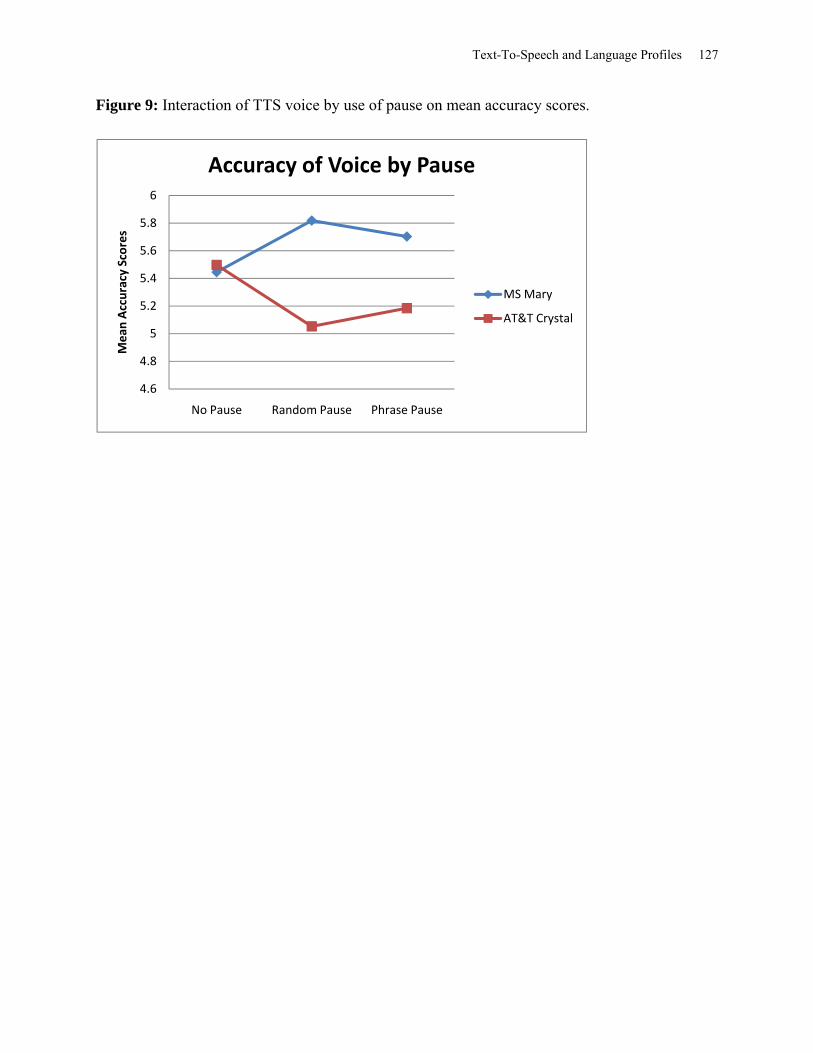
Text-To-Speech and Language Profiles 127
Figure 9: Interaction of TTS voice by use of pause on mean accuracy scores.
4.6
4.8
5
5.2
5.4
5.6
5.8
6
No Pause Random Pause Phrase Pause
Mean
Accuracy Scores
Accuracy of Voice by Pause
MS Mary
AT&T Crystal
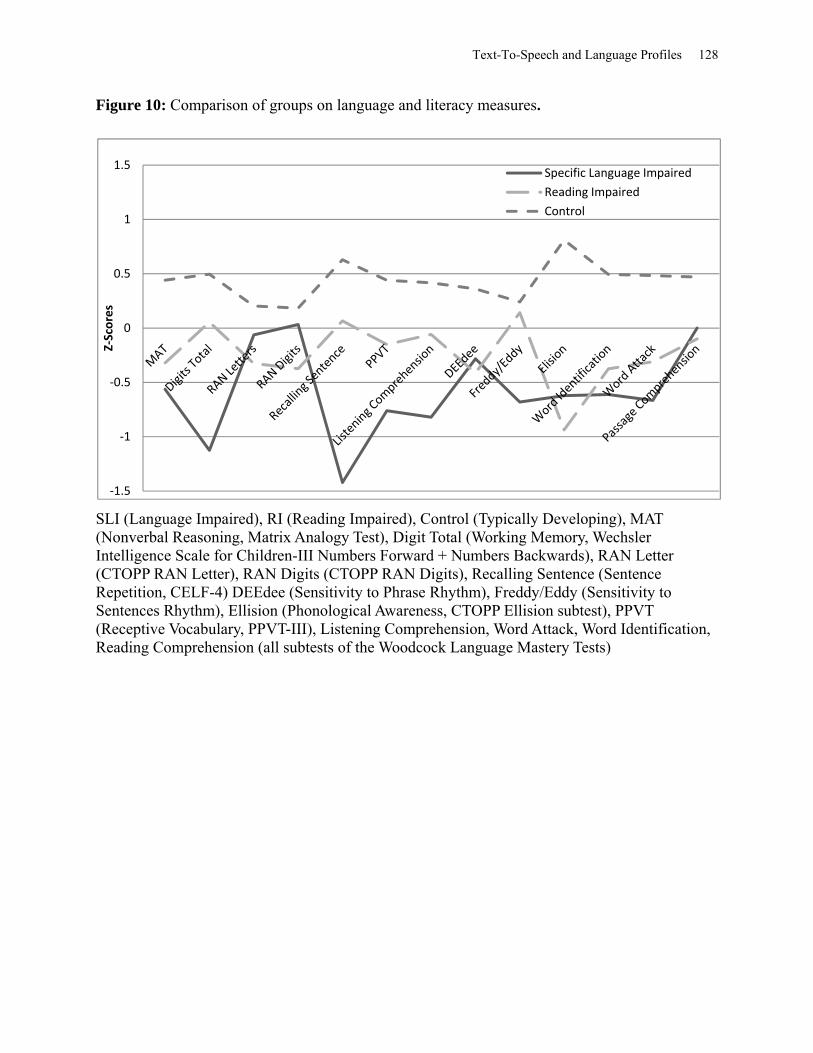
Text-To-Speech and Language Profiles 128
Figure 10: Comparison of groups on language and literacy measures.
SLI (Language Impaired), RI (Reading Impaired), Control (Typically Developing), MAT (Nonverbal Reasoning, Matrix Analogy Test), Digit Total (Working Memory, Wechsler Intelligence Scale for Children-III Numbers Forward + Numbers Backwards), RAN Letter (CTOPP RAN Letter), RAN Digits (CTOPP RAN Digits), Recalling Sentence (Sentence Repetition, CELF-4) DEEdee (Sensitivity to Phrase Rhythm), Freddy/Eddy (Sensitivity to Sentences Rhythm), Ellision (Phonological Awareness, CTOPP Ellision subtest), PPVT (Receptive Vocabulary, PPVT-III), Listening Comprehension, Word Attack, Word Identification, Reading Comprehension (all subtests of the Woodcock Language Mastery Tests)
‐1.5
‐1
‐0.5
0
0.5
1
1.5
Z‐Scores
Specific Language Impaired
Reading Impaired
Control
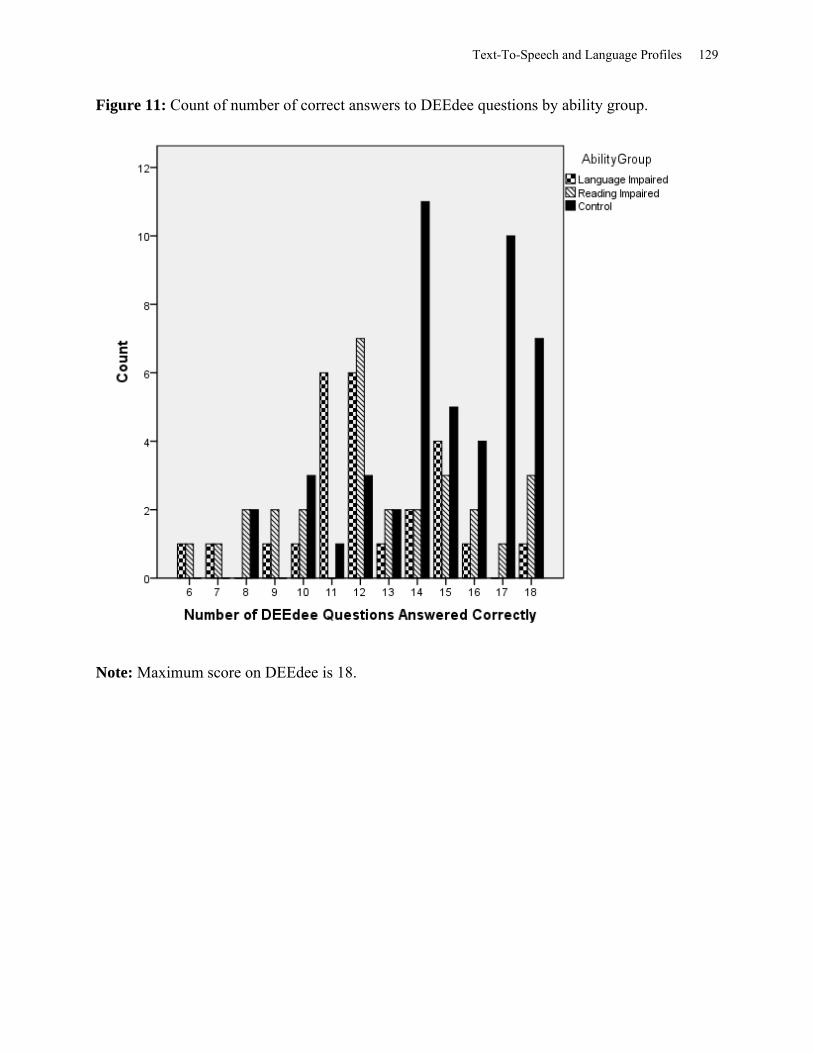
Text-To-Speech and Language Profiles 129
Figure 11: Count of number of correct answers to DEEdee questions by ability group.
Note: Maximum score on DEEdee is 18.
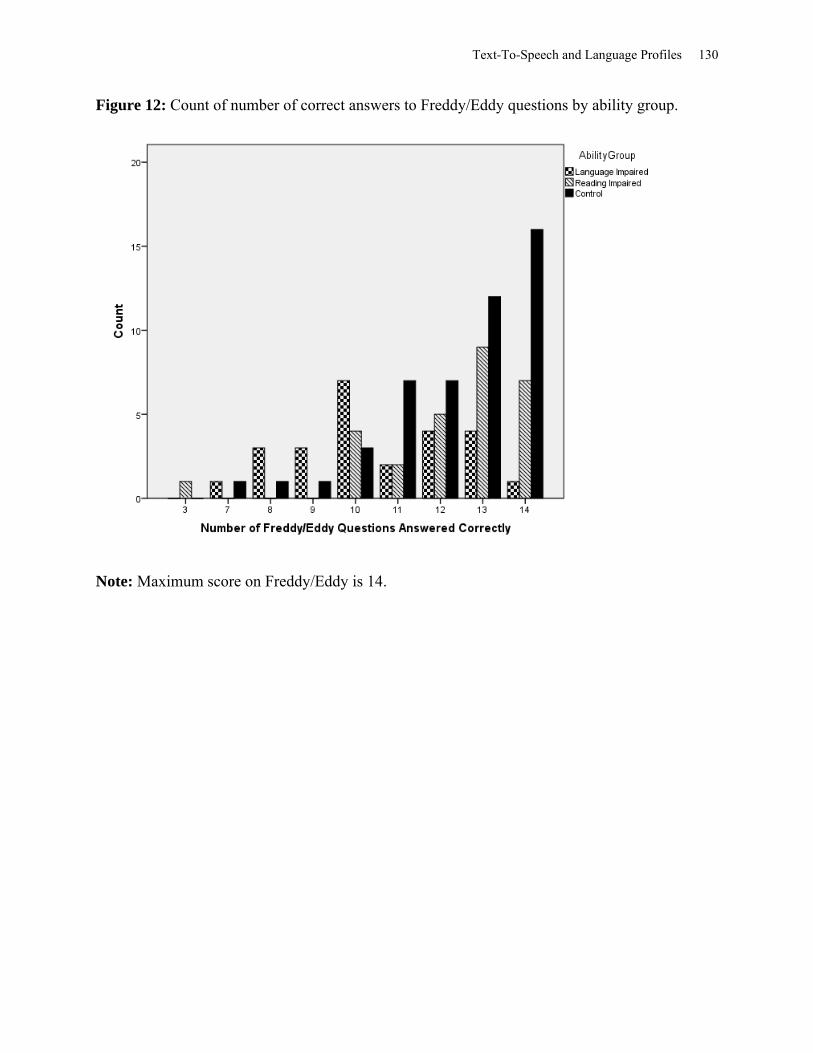
Text-To-Speech and Language Profiles 130
Figure 12: Count of number of correct answers to Freddy/Eddy questions by ability group.
Note: Maximum score on Freddy/Eddy is 14.
Text-To-Speech and Language Profiles 131
References
Andreassen, R. (2010). Examining the prediction of reading comprehension on different
multiple-choice tests. Journal of Research in Reading, 33(3) , 263-283.
AT&T Speech Labs. (2007). Crystal TTS Voice. Florham Park, NJ: AT&T Speech Labs.
Axmear, E., Reichle, J., Alamsaputra, M., Kohnert, K., Drager, K., & Sellnow, K. (2005).
Synthesized speech intelligibility in sentences: A comparison of monolingual English-
speaking and bilingual children. Language, Speech, and Hearing Services in Schools, 36 ,
244-250.
Baddeley, A. D., Gathercole, S. E., & Papagno, C. (1998). The phonological loop as a language
learning device. Psychological Review, 105(1) , 158-173.
Baddeley, A. (1998). Human Memory: Theory and Practice Revised Edition. Boston, MA: Allyn
and Bacon.
Baddeley, A. (1996). Working memory and executive control. Philosophical Transactions of the
Royal Society of London, 351 , 1397-1404.
Badian, N. A. (1999). Reading disability defined as a discrepancy between listening and reading
comprehension: A longitudinal study of stability, gender differences, and prevalence. Journal
of Learning Disability, 32(2) , 138-148.
Balota, D. A., Cortese, M. J., Hutchison, K. A., Neely, J. H., Nelson, D., Simpson, G. B., et al.
(2008, 06 01). The English Lexicon Project: A web-based repository of descriptive and
behavioral measures for 40,481 English words and nonwords. Retrieved 06 01, 2008, from
elexicon.wust1.edu
Bess, F. H., & Humes, L. E. (1995). Audiology: The fundamentals. Baltimore, MD: Williams &
Wilkins.
Beutnagel, M., Conkie, A., Schroeter, J., Stylianou, Y., & Syrdal, A. (1998). The AT&T Next-Gen
TTS System. Florham Park, NJ: AT&T Speech Lab.
Text-To-Speech and Language Profiles 132
Biemiller, A. (2005). Size and Sequence in Vocabulary Development: Implications for Choosing
Words for Primary Grade Vocabulary Instruction. In E. H. Hiebert, & M. L. Kamil, Teaching
and learning vocabulary: Bringing research to practice (pp. 223-242). Mahwah: NJ:
Lawrence Erlbaum Associates Publishers.
Biemiller, A. (2009). Words Worth Teaching. Columbus, OH: SRA/McGraw-Hill.
Bishop, D. (1997). Uncommon Understanding: Development and Disorders of Language
Comprehension in Children. Hove: Psychology Press.
Bishop, D. V., & Adams, C. (1992). Comprehnsion problems in children with specific language
impairment: literal and inferential meaning. Journal of Speech and Hearing Research, 35 ,
119-129.
Bishop, D. V., & Snowling, M. J. (2004). Developmental dyslexia and specific language
impairment: Same or different? Psychological Bulletin, 130(6) , 858-886.
Boersma, P., & Weenink, D. (2008). PRAAT software Version 5.2.10. Phonetic Sciences,
University of Amsterdam.
Bowers, P. G., & Wolf, M. (1993). Theoretical links among naming speed, precise time
mechanisms and orthographic skill in dyslexia. Reading and Writing, 5 , 69-85.
Bradlow, A. R., Torretta, G. M., & Pisoni, D. B. (1996). Intelligibility of normal speech I: Global
and fine-grained acoustic-phonetic talker characteristics. Speech Communication, 20 , 255-
272.
Campbell, N., & Black, A. (1997). Prosody and the selection of source units for concatenative
synthesis. In J. van Santen, R. Sproat, J. Olive, & J. Hirschberg, Progress in Speech Synthesis
(pp. 279-292). London: Springer-Verlag.
Case, R. (1985). Intellectual Development: Birth to Adulthood. New York: Academic Press.
Chandak, M. B., Dharaskar, R. V., & Thakre, V. M. (2010). Text to speech synthesis with
prosody feature: Implementation of emotion in speech output using forward parsing.
International Journal of Computer Science and Security, 4(3) , 352-360.
Text-To-Speech and Language Profiles 133
Clin, E., Wade-Woolley, L., & Heggie, L. (2009). Prosodic sensitivity and morphological
awareness in children’s reading. Journal of Experimental Child Psychology, Vol 104(2) , 197-
213.
Cohen, E. A., Sevcik, R. A., Woll, M., Lovett, M. W., & Morris, R. D. (2008). Integration the
PHAST and RAVE-O programs for stuggling readers. In M. R. Kuhn, & P. J.
Schwanenflugel, Fluency in the Classroom (pp. 92-123). New York: Guilford Press.
Cohen, J., & Cohen, P. (1983). Applied multiple Regession/Correlation Analysis for the
Behavroral Sciences. Hillsdale, NY: Lawerence Erlbaum Assoc.
Conti-Ramsden, G., & Hesketh, A. (2003). Risk markers for SLI: A study of young language-
learning children. International Journal of Language & Communication Disorders, 38 , 251-
263.
Conti-Ramsden, G., Botting, N., & Faragher, B. (2001). Psycholinguistic markers for specific
language impairment (SLI). Journal of Child Psychology and Psychiatry, 42(6) , 741-748.
Cunningham, T., & Watson, P. (2003). If you hear a word and see a word do you know it? The
effects of a text-to-speech program on both non disabled and disabled post-secondary
students. Peterborough: Trent University.
Dalton, B., & Strangman, N. (2006). Improving Struggling Readers' Comprehension Through
Scaffolded Hypertexts and Other Computer-Based Literacy Programs. In M. C. McKenna, L.
D. Labbo, R. D. Kieffer, & D. Reinking, International handbook of literacy and technology
(Vol 2) (pp. 75-92). Mahwah, NJ: Lawrence Erlbaum Associates Publishers.
Daneman, M., & Hannon, B. (2001). Using working memory theory to investigate the construct
validity of multiple-choice reading comprehension test such as the SAT. Journal of
Experimental Psychology: General, 130 , 208-223.
David, D., Wade-Woolley, L., Kirby, J. R., & Smithrim, K. (2007). Rhythm and reading
development in school-age children: A longitudinal study. Journal of Research in Reading ,
169-183.
Text-To-Speech and Language Profiles 134
Dempster, F. N. (1981). Memory Span: Sources of individual and developmental differences.
Psychol Bull, 89 , 63-100.
Drager, K. D., Reichle, J., & Pinkoski, C. (2010). Synthesized speech output and children: A
scoping review. American Journal of Speech and Language Pathology, 19 , 259-273.
Duffy, S. A., & Pisoni, D. B. (1992). Comprehension of synthetic speech produced by rule: A
review and theoretical interpretation. Language and Speech , 351-389.
Dunn, L. M., & Dunn, L. M. (1997). Peadbody Picture Vocabulary Test - 3rd edition. PsychCorp.
Dutoit, T. (1997). An Introduction to Text-To-Speech Synthesis. London: Kluwer Academic
Publishers.
Edyburn, D. L. (2005). Assistive technology and students with mild disabilities: From
consideration to outcome measurement. In D. K. Edyburn, K. Higgins, & R. (. Boone,
Handbook of Special Education Technology Research and Practice (pp. 239-269). Whitefish
Bay, WI: Knowledge by Design.
Eide, E., Aaron, A., Bakis, B., Cohen, P., Donovan, D., Hamza, W., et al. (2003). Recent
Improvements to the IBM trainable speech synthesis system. ICASSP, 1 , 708-711.
Elbro, C., Rasmussen, I., & Spelling, B. (1996). Teaching reading to disabled readers with
language disorders: A controlled evaluation of synthetic speech feedback. Scandinavian
Journal of Psychology, 32(2) , 140-155.
Elizabeth, J., Lambon Ralph, M. A., & Baddeley, A. D. (2004). Automatic and controlled
processing in sentence recall: The role of long-term and working memory. Journal of memory
and language, 51(4), 623-643.
Elking, J. (1998). Computer reading machines for poor readers. Lexia Institute, 1-21.
Elking, J., Cohen, K., & Murray, C. (1993). Using computer-based readers to improve reading
comprehension of students with Dyslexia. Annals of Dyslexia, 43, 238-259.
Farmer, M. E., Klein, R., & Bryson, S. E. (1992). Computer-assisted reading: Effects of whole-
word feedback on fluency and comprehension in readers with severe disabilities. Remedial
and Special Education, 13(2), 50-60.
Text-To-Speech and Language Profiles 135
Farr, R., Pritchard, R., & Smitten, B. (1990). A description of what happens when an examinee
takes a multiple-choice reading comprehension test. Journal of Educational Measurment, 27,
209-226.
Fernald, A. (1992). Human maternal vocalizations to infants as biologically relevant signals: an
evolutionary perspective. In J. H. Barkow, L. Cosmides, & J. Topby (Eds.), The Adaptive
Mind: Evolutionary Psychology and the Generation of Culture (pp. 391-428). Osford: UK:
Oxford University Press.
Fisher, J., Plante, E., Vance, R., Gerken, L., & Glattkey, T. J. (2007). Do children and adults with
language impairment recognize prosodic cues? Journal of Speech and Langue, Hearing,
Research, 50, 746-758.
Fletcher, J. M. (2006). Measuring Reading Comprehension. Scientific Studies of Reading, 10(3),
323-330.
Foorman, B. R., Francis, D. J., Davidson, K. C., Harm, M. W., & Griffin, J. (2004). Variability in
text features in six grade 1 basal reading programs. Scientifc Studies of Reading, 8(2), 167-
197.
Foulke, E., & Sticht, T. (1969). Review of research on the intelligibility and comprehension of
accelerated speech. Psychological Bulletion, 72, 50-62.
Francis, A. L., Nusbaum, H. C., & Fenn, K. (2007). ). Effects of training on the acoustic-phonetic
representation of synthetic speech. Journal of Speech, Language, and Hearing Research,
50(6), 1445-1465.
Freedom Scientific Group. (2010). WYNN for Windows 7. St. Petersurg, FL: Freedom Scieni,
Learning Group.
Gathercole, S. E. (1998). The development of memory. The Journal of Child Psychology and
Psychiatry, 39(1), 3-27.
Gathercole, S. E., & Pickering, S. J. (2000). Working memory deficits in children with low
achievements in the national curriculum at seven years of age. Journal of Educational
Psychology, 70, 177-194.
Text-To-Speech and Language Profiles 136
Gathercole, S. E., Alloway, T. P., Willis, C. S., & Adams, A. M. (2006). Working memory in
children with reading disabilities. Journal of Experimental Child Psychology, 93, 265-281.
Gathercole, S., & Baddeley, A. D. (1990). Phonological memory deficits in language disordered
children: Is there a causal connection? Journal of Memory and Language, 29(3), 336-360.
Gathercole, S., & Baddeley, A. (1993). Working Memroy and Language. Hillsdale, NJ: Lawrence
Erlbaum.
Good, R. H., & Kaminski, R. A. (2007). Dynamic Indicators of Basic Early Literacy Skiils (6th
ed.). Retrieved from Institute for the Development of Educational Achievement:
http://dibels.uoregon.edu
Goodwin, C. J. (1998). Research in Psychology: Methods and Design 2nd Edition. New York,
NY: John Wiley & Sons, Inc.
Gough, P. B., Hoover, W. A., & Peterson, C. L. (1996). Some observations on a simple view of
reading. In C. Cornoldi, & J. Oakhill, Reading comprehension difficulties: Processes and
intervention (pp. 1-13). Mahwah, NJ: Lawrence Erlbaum Associates Publishers.
Gray, S. (2003). Diagnostic accuracy and test-retest reliability of nonword repetition and digit
span task administered to preschool children with speoific language impariment. Journal of
Communication Disorders, 36, 129-151.
Grdo-Salant, S., Fitzgibbons, P. J., & Friedman, S. A. (2007). Recognition of Time-Compressed
and Natural Speech With Selective Temporal Enhancements by Young and Elderly Listeners.
Journal of Speech, Language, and Hearing Research, 50(5), 1181-1193.
Greene, B. G., Logan, J. S., & Pisoni, D. B. (1986). Perception of synthetic speech produced
atomatically by rule: Intelligibility of eight text-to-speech systems. Behavior research
methods, Instruments & Computers, 18(2), 100-107.
Greenspan, S. L., Nusbaum, H. C., & Pisoni, D. B. (1988). Perceptual learning of synthetic
speech produced by rule. Journal of Experimental Psychology: Learning, Memory, &
Cognition, 14, 421-433.
Text-To-Speech and Language Profiles 137
Handley, Z. (2009). Is text-to-speech synthesis ready for use in computer-assisted language
learning? Speech Communication (51), 906-919.
Harrington, J., & Cassidy, S. (1999). Techniques in Speech Acoustics. Boston: Kluwer.
Harwood, K. (1955). Listenability and rate of presentation. Speech Monographs, 22, 57-59.
Henry, L. A. (1994). The relationship between speech rate and memory span in children.
International Journal of Behavioral Development, 17(1), 37-56.
Hiebert, E. H. (2002). Standards, assessments, and text difficulty. In A. E. Farstrup, & S. J.
Sauels, What Research has to say about Reading Instrution (pp. 337-391). Newark, DE:
International Reading Association.
Higginbotham, D. J., Drazek, A. L., Kowarsky, K., Scally, C., & Segal, E. (1994). Discourse
comprehension of synthetic speech delivered at normal and slow presentation rates.
Augmentative and Alternative Communication, 10, 191-202.
Higgins, E. L., & Raskind, M. H. (1997). The comprensatory effectivenss of optical character
reconition/speech synthesis on the reading comprehension of post-secondary students with
learning disabilities. Learing Disabilities: A mutidisciplinary Journal, 8, 76-87.
Hill, R. L., & Murray, W. S. (200). Commas and spaces: effects of punctuation on eye
movements and sentence parsing. In A. Kennedy, R. Radach, & D. (. Heller, Reading as a
Perceptaul Process (pp. 565-589). Amsterdam: Elsevier.
Hirotani, M., Frazier, L., & Rayner, K. (2006). Punctuation and intonation effects on clause and
sentence wrap-p: Evdence from eye movements. Journal of Memory and Language, 54, 425-
443.
Hoover, J., Reichle, J., van Tassell, D., & Cole, D. (1987). The intelligibility of synthesized
speech: Echo II versus votrax. Journal of Speech and Hearing Research, 30, 425-431.
Hoover, W. A., & Gough, P. B. (1990). The simple view of reading. Reading and Writing, 2(2) ,
127-160.
Text-To-Speech and Language Profiles 138
Hux, K., Woods, M., Mercure, M., Vitko, C., & Scharf, S. (1998). Synthetic and natural speech
processing by persons with or without aphasia: An investigation of attention allocation.
Journal of Medical Speech-Language Pathology, 6 .
Jilka, M., Syrdal, A. K., Conkie, A. D., & Kapilow, D. A. (2003). Effects on TTS quality of
methods of realizing natural prosodic variations. Research Update from the AT&T Labs
Research.
Jusczyk, P. W., Houston, D. M., & Newsome, M. (1999). The beginnings of word segmentation
in English-learning infants. Cognitive Psychology, 39(3-4), 159-207.
Jusczyk, P. W., Houston, D. M., & Newsome, M. (1999). The beginnings of word segmentation
in enhlish-learning infants. 159-207: Cognitive Psychology, 39(3-4).
Just, M., & Carpenter, P. (1992). A capacity theory of comprehension: Individual differences in
working memory. Psychological Review, 99, 122-149.
Kelley, J. F. (1983). An empirical methodology for writing user-friendly natural language
computer applications. 26-41: AMC Transactions of Office Information Systems, 2(1).
King, J., & Just, M. A. (1991). Individual differences in syntactic processing: The role of
working memory. Journal of Memory and Language, 30, 580-602.
Kintsch, W., & van Dijk, T. (1978). Toward a model of text comprehension and production.
Psychological Review, 85, 363-394.
Kirby, J. R. (2007). Reading comprehension: Its nature and development. In Encyclopedia of
Language and Literacy Development. Canadian Language and Literacy Research Network ,
www.literacyencyclopedia.ca.
Kitzen, K. (2001). Prosodic sensitivity, morphological ability, and reading ability in young adults
with and without childhood histories of reading difficulty. issertation Abstracts International
Section A: Humanities and Social Sciences, 62(2-A), 460.
Klatt, D. (1987). Review of text-to-speech conversion for English. Journal of the Acoustrical
Society of America, 82, 737-793.
Text-To-Speech and Language Profiles 139
Klein, D., & Manning, C. D. (2003). Accurate unlexicelized parsing. Teh Association for
Computational Lingustics, 423-430.
Klein, D., & Manning, C. D. (2003). Fast exact inference with a factored model of natural
language parsing. Advance in Neural Information Processing Systems, 16, 3-10.
Koul, R. K., & Hanners, J. (1997). Word identification and sentence verification of two synthetic
speech systems by individuals with intellectual disabilites. Augmentative and Alternative
Communication, 13, 99-107.
Koul, R. (2003). Synthetic speech perception in indiviudals with and without disabilites.
Augmentative and Alternative Communication, 19(1), 49-58.
Koul, R., & Clapsaddle, K. C. (2006). Effects of repeated listening experiences on the perception
of synthetic speech by individuals with mild-to-moderate intellectual disabilites.
Augmentative and Alternative Communication, 22(2), 112-122.
Kuhl, P. K. (2004). Early language acquisition: Cracking the speech code. Nature Reviews
Neuroscience, 83(5), 831-843.
Kurzweil Educational Systems. (2006). Kurzweil 3000 v8.0. Bedford MA: Kurzweil Educational
Systems.
Lennon, C., & Burdick, H. (2010). The Lexile Framework As An Approach for Reading
Measurement and Success. Retrieved September 05, 2008, from Lexile:
http://www.lexile.com/research
Leonard, L. B. (1998). Children with Specific Language Impairment. Cambridge, MA: MIT
Press.
Leong, C. K. (1995). Effects on on-line reading and simultancous DECtalk auding in helping
belowaverage and ppor readers comprehend and summarize text. Learning Disability
Quarterly, 18(2), 101-116.
Levinson, S. E., Olive, J. R., & Tschingi, J. S. (1993). Speech synthesis in telecommunications.
Institute of Electrical and Electronics Engineers Communications Magazine, 3(11), 46-53.
Text-To-Speech and Language Profiles 140
Lindfield, K. C., Wingfield, A., & Goodglass, H. (1999). The contribution of prosody to spoken
word recognition. Applied Psycholinguistics, 20(3), 395-405.
Lindfield, K. C., Wingfield, A., & Goodglass, H. (1999). The role of prosody in the mental
lexicon, 20(3). Brain and Language. Special Issue: Mental Lexicon, 68(1-2), 312-317.
Lindfield, K., Wingfield, A., & Goodglass, H. (1999). The role of prosody in the mental lexicon.
Brain and Language, 68, 312-317.
Lundberg, I., & Olofsson, A. (1993). Can computer speech support reading comprehension?
Computers in Human Behavior. Special Issue: Swedish research on learning and instruction
with computers, 9(2-3), 283-293.
Marcus, M. P., Santorini, B., & Marcinkiewicz, M. A. (1993). Building a large annotated corpus
of English: the Penn Treebank. Computational Linguistics, 19, 1-22.
Marics, M. A., & Williges, B. H. (1988). The intelligibility of synthesized speech in data inquiry
systems. Human Factors, 30, 719-732.
Markwardt, F. C. (1997). Peadbody Indiviudal Achievement Test-Revised. New York, NY:
PsychCorp.
McGivern, R. F., Berka, C., Languis, M. L., & Chapman, S. (1991). Detection of deficits in
temporal pattern discrimination using the Seashore Rhythm Test in young children with
reading impairments.Journal of Learning Disabilities, 24(1), 58-62.
McNamara, D. S. (2007). Reading Comprehension Strategies: Theories, interventions, and
Technologies. New York, NY: Erlbaum.
Mechelhi, A., Crinion, J. T., Long, S., Friston, K. J., Lambon Ralph, M. A., Patterson, K., et al.
(2005). Dissociating reading processes on the basis of neuronal interactions. Jounal of
Cognitive Neuroscience, 17(11), 1753-1765.
Medler, D., Medler, D. A., Desai, R., Conant, L. L., & Liebenthal, E. (2005). Some
neurophysiological constraints on models of word naming. Neuroimage, 27(3), 677-693.
Microsoft. (1998). Mary TTS Voice. Mountain View, CA: Microsoft Research.
Text-To-Speech and Language Profiles 141
Mirenda, P., & Beukelman, D. (1990). A comparison of intelligibility among natural speech and
seven speech synthesizers with listeners from three age groups. Augmentative and Alternative
Communication, 6, 61-68.
Mirenda, P., & Beukelman, D. R. (1987). A comparison of speech synthesis intelligibility with
listeners from thre age groups. Augmentative and Alternative Communication, 3, 120-128.
Mitterer, H., & Blomert, L. (2003). Coping with phonological assimilation in speech perception:
Evidence for early comprensation. Perception & Psychophysics, 65(6), 956-969.
Montali, J., & Lewandowski, L. (1996). Bimodal reading: Benefits of a talking computer for
average and less skilled readers. Journal of Learning Disabilities, 29(3), 271-279.
Moody, T., Joost, N., & Rodman, R. (1987). Vigilance and its role in AI technology: How smart
is too smart? In G. Salvendy, S. L. Sauter, & J. J. Hurrell, Social, Ergonomic and Stress
Aspects of Work Wwith Computers (pp. 263-270). Amsterdam: Elsevier.
Moore, D. R., Rosenberg, J. F., & Coleman, J. S. (2005). Discrimination training of phonemic
contrasts enhances phonological processing in mainstream school children. Brain and
Language, 94, 72-85.
Nakatani, L. H., & Schaffer, J. A. (1978). Hearing ‘words’ without words: Prosodic cues for
word perception. Journal of the Acoustical Society of America, 63, 234-245.
Nation, K., Adams, J. W., Bowyer-Crane, C. A., & Snowling, M. J. (1999). Working memory
deficits in poor comprehenders reflect underlying language impairments. Journal of
Experimental Child Psychology, 139-158.
National Center for Education Statistics. (2001). Assessing the Lexile Framework: Results of a
Panel Meeting. Working Paper No. 2001-08. Washington, DC: U.S. Department of Education.
National Institute of Child Health and Human Development. (2000). Report of the National
Reading Panel. Teaching Children to Read. An evidence-based assessment of the scientifc
research literature on reading and its implications for reading insturction. Washiongton, D.C.:
NIC Pubilication No. 00-4769. Goverment Printing Office.
Text-To-Speech and Language Profiles 142
National Reading Panel. (2000). Teaching children to read: An evidence-based assessment of the
scientific research literature on reading and its implications for reading instruction.
Washinten DC: Department of Education of the United States of America.
Nelson, H. (1948). The effect of variation of rate on the recall by radio listeners of "straight"
newscasts. Speech Monographs, 15, 173-180.
Nelson, P., Soli, S., & Seitz, A. (2002). Acoustical Barriers to Learning. Melville, NY: Technical
Committee on of the Acoustical Society of America.
NextUp. (2008). TextAloud V2.285. Clemmons, NC: NextUP.
Ontario Ministry of Education. (2004). The individual education plan (IEP): a resource guide.
Toronto: Ontario Ministry of Education.
O’Shaughnessy, D. (2007). Modern Methods Speech Synthesis. IEEE Circuits and Systems
magazine, 1109(3), 6-23.
O'Shaughnessy, D. (2000). Speech Communication: Human and Machine, 2nd ed. New Jersey:
Institute of Electrical and Electronics Engineers Communications Magazine Press.
O'Shaughnessy, D., Bardeau, L., Bernardi, D., & Archambault, D. (1988). Diphone speech
synthesis. Speech Communication, 7, 55-65.
Pae, H. K., Wise, J. C., Cirino, P. T., Sevcik, R. A., Lovett, M. W., Wolf, M., et al. (2005). The
woodcock reading mastery test impact of normative changes. Assessment, 12(3), 347-367.
Panel, N. R. (2000). Teaching children to read: An evidence-based assessment of the scientific
research literature on reading and its implications for reading instruction. Washinten DC:
Department of Education of the United States of America.
Paris, C. R., Gilson, R. D., & Thomas, M. H. (1995). Effect of synthetic voice intelligibility on
speech comprehension. Human Factors, 37(2), 335-340.
Pisoni, D. B., Manous, L. M., & Dedian, M. J. (1987). Comprehnsion of natural and synthetic
speech: Effects of predictability on the verification of sentences controlled for intelligibility.
Computer Speech and Language, 2, 303-320.
Text-To-Speech and Language Profiles 143
Pressley, M., & Harris, K. R. (2006). Cognitive strategies instruction: From basic research to
classroom instruction. In P. A. Alexander, & P. H. Winne, Handbook of Educational
Psychology, (2nd ed.) (pp. 265-286). Mahwah, NJ: Erlbaum.
Pressley, M., & Harris, K. R. (1995). Verbal protocols of reading: The nature of constructively
responsive reading. Hillsdale, NJ: Erlbaum.
Psychology Software Tools, INC. (2008). E-Prime V1. Sharpsburg, PA, USA.
Ralston, J. V., Pisoni, D. B., & Mullennix, J. W. (1989). Comprehension of synthetic speech
produced by rule (Reserch on Speech Perception Progress Report No. 15). Bloomington:
Indiana University.
Ralston, J., Pisoni, D., Lively, S., Greene, B., & Mullenix, J. (1991). Comprehension of synthetic
speech produced by rule: Word monitoring and sentence-by-sentence listening times. Human
Factors, 33, 471-491.
Rapp, D. N., van den Broek, P., McMaster, K. L., Kendeou, P., & Espin, C. A. (2007). Higher-
order comprehension processes in struggling readers: A perspective for research and
intervention. Scientific Studies of reading, 11(4), 289-312.
Rayner, K. (1998). Eye movements in reading and information processing: 20 years of research.
Psychological Bulletin, 124(3), 372-422.
Rayner, K., & Pollatsek, A. (1989). The Psychology of Reading. Englewood Cliffs, NJ: Prentice
Hall.
Rayner, K., & Slattery, T. J. (2009). Eye movements and moment-to-moment comprehension
processes in reading. In R. K. Wagner, C. Schatshneider, & C. Phythian-Sence, Beyond
Decoding: The Behavioral and Biological Foundations of Reading Comprehension. New
York, NY: The Guilford Press.
Rayner, K., Kambe, G., & Duffy, S. A. (2000). The effect of clause wrap-up on eye movements
during reading. The Quarterly journal of Experimental Psychology: Human Experimental
Psychology 53A, 1061-1080.
Text-To-Speech and Language Profiles 144
Reynolds, M. E., & Fucci, D. (1998). Synthetic speech comprehension: A comparison of children
with normal and impaired language skills. Journal of Speech, Language and Hearing
research, 41, 458-466.
Reynolds, M. E., & Givens, J. (2001). Presentation rate in comprehension of natural and
synthetic speech. Perceptual and Montor Skills, 92, 958-968.
Reynolds, M. E., & Jefferson, L. (1999). Natural and syntetic speech comprehension:
comparison of children from two age groups. Augmentative and Alternative Communication,
15, 174-182.
Reynolds, M. E., Issaac-Duvall, C., & Haddox, M. L. (2002). A comparison of learning curves in
natural and synthesized speech comprehension. Journal of Speech, Language, and Hearing
Research, 45(4), 802-811.
Reynolds, M. E., Issacs-Duvall, C., Sheward, B., & Rotter, M. (2000). Examination of the effects
of listening practice on synthesized speech comprehension. Augmentative and Alternative
Communication, 250-259.
Scherer, K. R. (1979). Non-linguistic vocal indicators of emotion an psychopathology. In C. E.
Izard, Emotions in Personality and Psychopathology (pp. 485-529). New York: Plenum Press.
Schmidt-Nielsen, A. (1995). Intelligibility and acceptability testing for speech technology. In R.
W. Bennett, A. K. Syrdal, & S. L. Greenspan, Behaviroral Aspects of Speech Tehcnology:
Theory and Application (pp. 41-63). Boca Raton, FL: CRC.
Schroeter, J. (2005A). Text-to-Speech (TTS) synthesis. Electrical Engineering Handdbook, 3rd
Edition, 1-13.
Schroeter, J. (2005B). Voice Modification for Applications in Speech Synthesis. AT&T Labs -
Research, 1-20.
Schwanenflugel, P. J., Hamilton, A. M., & Kuhn, M. R. (2004). Becoming a Fluent Reader:
Reading Skill and Prosodic Features in the Oral Reading of Young Readers. Journal of
Educational Psychology, 96(1), 119-129.
Segal-Seiden, L. (1997). Perception and spelling of strange speech sounds by Polish-Canadian
Text-To-Speech and Language Profiles 145
L2 speakers of English. Unpublished doctoral dissertation, University of Toronto, Ontario.
Semel, E., Wiig, E. H., & Secord, W. A. (2003). Clinical Evaluationof Language Fondamentals-
fourth Edition. New York: Pearson.
Shankweiler, D., & Fowler, A. E. (2004). Questions people ask about the role of phonological
processes in learning to read. Reading and Writing, 17(5), 483-515.
Siegel, L. (1994). Working memory and reading: A lifespan perspective. International Journal of
Behavioral Development, 17, 109-124.
Sisto, R., Pieroni, A., Delucis, C. (2007). Noise exposure and speech intelligibility in elementary
schools in Tuscany. 19th International Congress on Acoustics, Madrid
Skakum, E. N., Maguire, T., & Cook, D. A. (1994). Strategy choices in multiple-choice items.
Academic Medicine Supplement, 69(10), S7-S9.
Snowling, M. J. (2000). Dyslexia. Oxford: Blackwell.
Snowling, M. J. (2000). Language and literacy skills: Who is at risk and why? In D. V. Bishop, &
L. B. Leonard, Speech and language impairments in children: Causes, characteristics,
intervention and outcome (pp. 245-259). New York, NY: Psychology Press.
Snowling, M. J., & Hayiou-Thomas, M. E. (2006). The Dyslexia Spectrum: Continuities
Between Reading, Speech, and Language Impairments. Topics in Language Disorders, 26(2),
110-126.
Snowling, M., Chiat, S., & Hulme, C. (1991). Words, nonwords, and phonological processes:
Some comments on Gathercole, Willis, Emslie, and Baddeley. Applied Psycholinguistics, 12,
369-373.
SourceForge.net. (2008). Audacity V 1.2.6. www.sourceforge.net: SourceForge.net.
Stanovich, K. E., & Siegel, L. S. (1994). Phenotypic performance profile of children with
reading disabilities: A regression-based test of the phonological-core variable-difference
model. Journal of Educational Psychology, 86(1), 24-53.
Text-To-Speech and Language Profiles 146
Stanovich, K. E., Siegel, L. S., & Gottardo, A. (1997). Converging evidence for phonological
and surface subtypes of reading disablity. Journal of Educational Psychology, 89(1): 114-127.
Staub, A. (2007). The return of the repressed: A bandoned parses facilitate syntactic reanalysis.
Journal of Memory and Language, 57, 299-323.
Stenner, A. J., Burdick, J., Sanford, E. E., & Burdick, D. (2006). How accurate are lexile text
measures? Journal of Applied Measurement, 7(3), 307-322.
Stokes, S. F., Wong, A. M.-Y., Fletcher, P., & Leonard, L. B. (2006). Nonword repetition and
sentence repetition as clincal markers of SLI: the case of cantonese. Journal of Speech,
Language, and Hearing Research, 49, 219-236.
Strangman, N., & Dalton, B. (2005). Using technology to support struggling readers: a review of
the research. In D. Edyburn, K. Higgins, & R. Boone (eds), Handbook of Special Education
Technology Research and Practice. Wisconsin: Knowledge by Design.
Swanson, H. L. (1999). What develops in working memory? A life span perspective.
Developmental Psychology, 35(4), 986-1000.
Swanson, H. L. (1999). Reading research for students with LD: A meta-analysis of intervention
outcomes. Journal of Learning Disabilites, 32 , 504-532.
Swanson, H. L., Ashbaker, M. H., & Carole, L. (1996). Learning-disabiled readers' working
memory as a function of processing demands. Journal of Experimental child Psychology,
61(3), 242-275.
Swanson, L. (1994). Working memory and phonological processing as predictors of children's
mathematical problem solving at differnt ages. Memory and Cognition, 32, 648-661.
The Stanford Natural Language Processing Group. (2010). The Stanford Natural Language
Processing Group. Retrieved March 13, 2011, from http://nlp.stanford.edu
Timmer, S. (2008). University of Toronto Reader. USA.
Torgesen, J. K., Wagner, R. K., Rashotte, C. A., Rose, E., Lindamood, P., Conway, T., et al.
(1999). Preventing reading failure in young children with phonological processing disabilities:
Text-To-Speech and Language Profiles 147
Group and individual responses to instruction. Journal of Educational Psychology, 91(4),
579-593.
US technology-related assistance for indiviudals with disabilites act. (1998). Section 3.1 Public
Law 100-407.
Van Bon, W. H., & Van Der Pijl, J. M. (1997). Effects of word length and wordlikeness on
pseudoword repetition by poor and normal readers. Applied Psycholoinguistics, 18, 101-114.
van der Lely, H. K. (2005). Domain-specific cogntive systems: insigt from Grammatical-SLI.
Trends in Cognitive Sciences, 9, 53-59.
Venkatagiri, H. S. (1991). Effects of rate and pitch variations on the intelligibility of synthesized
speech. Augmentative and Alternative Communication, 7, 284-289.
venKatagiri, H. S. (2004). Segmental intelligibility of three text-to-speech synthesis methods in
reverberant enviroments. Augmentaive and Alternative Communication, 20(3), 150-163.
Wagner, R. K., & Torgesen, J. K. (1987). The nature of phonological processing and its causal
role in the acquisition of reading skills. Psychological Bulletin, 101(2), 192-212.
Wagner, R., Torgesen, J., & Rashotte, C. (1999). Commprehensive Test of Phonological
Processing (CTOPP). New York: NY: Pearson.
Walpole, S., Hayes, L., & Robnolt, V. (2006). Matching second graders to text: The utility of a
group-administered comprehension measure. Reading Research and Instruction, 46, 1-22.
Wang, M., & Geva, E. (2003). Spelling acquisition of novel English phonems in chinese
children. Reading and Writing: An Interdisciplinary Journal, 16, 325-348.
Wagner, R. K., & Torgesen, J. K. (1987). The nature of phonological processing and its causal
role in the acquisition of reading skills. Psychological Bulletin, 101(2) , 192-212.
Wagner, R., Torgesen, J., & Rashotte, C. (1999). Commprehensive Test of Phonological
Processing (CTOPP). New York: NY: Pearson.
Whalley, K., & Hansen, J. (2006). The role of prosodic sensitivity in children's reading
development. Journal of Research in Reading, 29(3), 288-303.
Text-To-Speech and Language Profiles 148
Wise, B. W., & Olson, R. K. (1995). Computer-based phonological awareness and reading
instruction. Annals of Dyslexia, 45, 99-122.
Wood, C. (2006). Sensitivity to speech rhythm and the decelopment of reading: Thrends in
cognitive psychology research. New York, NY: Nova Science.
Wood, C., & Terrell, C. (1998). Poor readers' ability to deetect speech rhythm and perceive rapid
speech. British Jounral of Developmental Psychology, 16, 397-413.
Wood, C., & Terrell, C. (1998). Pre-school phonological awarenss and subsequent literacy
development. Educational Psychology, 18(3), 253-274.
Woodcock. (1987). Woodcock Reading Mastery Test - Revised-Normative Update. New York:
NY: PsychCorp.
Woodcock, R. W. (1991). Woodcock Language Proficiency Battery - Revised. New York: NY:
Nelson.
Woodcock, R. W. (1998). Woodcock Reading Master Test-Revised/Normative Update. Circle
Pines, MN: American Guidance Service.
WordCalc.com. (2010). Syllable Counter & Word Count. Retrieved March 13, 2010, from
www.wordcalc.com
Text-To-Speech and Language Profiles 149
Appendices
Appendix A
Do to copyright restrictions; the comprehension passages cannot be presented.
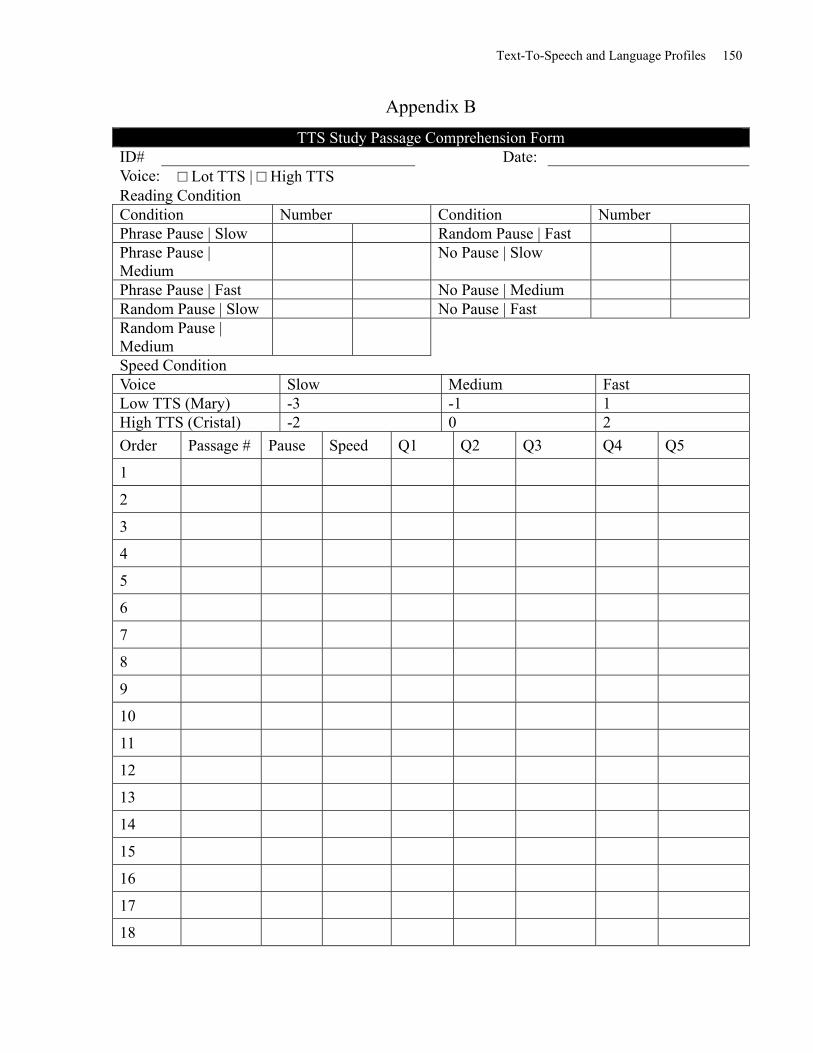
Text-To-Speech and Language Profiles 150
Appendix B
TTS Study Passage Comprehension Form ID# Date: Voice: □ Lot TTS | □ High TTS Reading Condition Condition Number Condition Number Phrase Pause | Slow Random Pause | Fast Phrase Pause | Medium
No Pause | Slow
Phrase Pause | Fast No Pause | Medium Random Pause | Slow No Pause | Fast Random Pause | Medium
Speed Condition Voice Slow Medium Fast Low TTS (Mary) -3 -1 1 High TTS (Cristal) -2 0 2
Order Passage # Pause Speed Q1 Q2 Q3 Q4 Q5
1
2
3
4
5
6
7
8
9
10
11
12
13
14
15
16
17
18
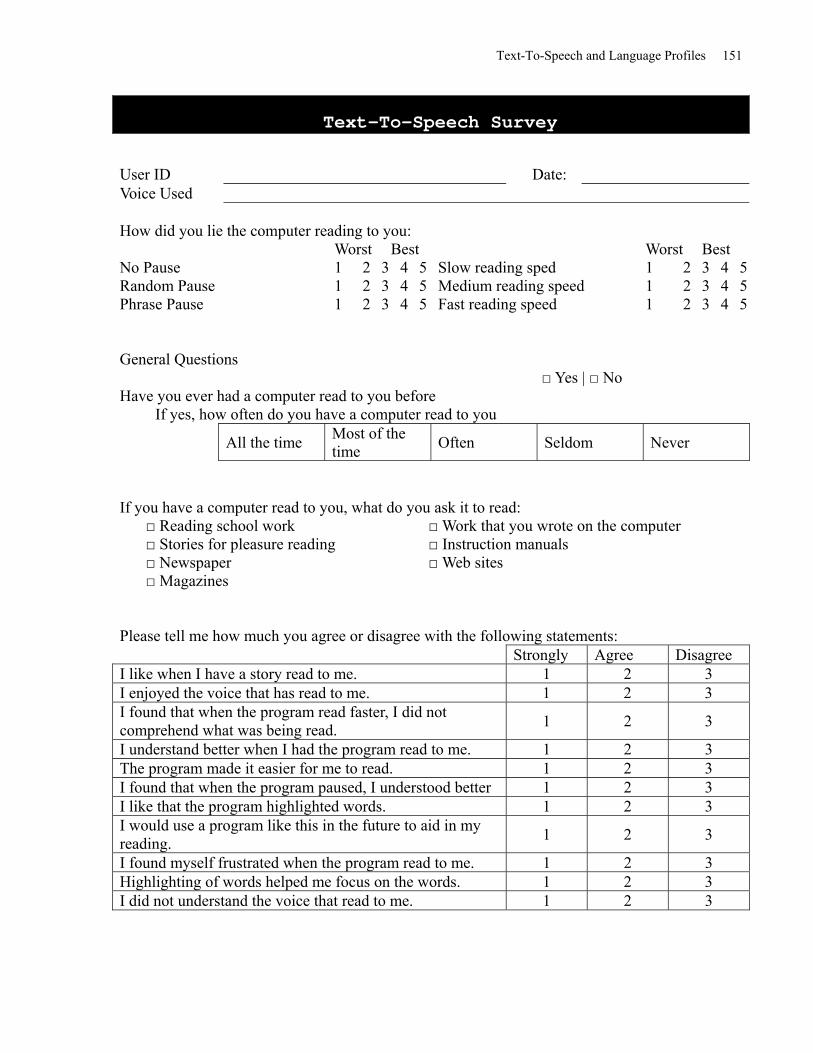
Text-To-Speech and Language Profiles 151
Text-To-Speech Survey
User ID Date: Voice Used How did you lie the computer reading to you: Worst Best Worst Best No Pause 1 2 3 4 5 Slow reading sped 1 2 3 4 5Random Pause 1 2 3 4 5 Medium reading speed 1 2 3 4 5Phrase Pause 1 2 3 4 5 Fast reading speed 1 2 3 4 5 General Questions Have you ever had a computer read to you before
□ Yes | □ No
If yes, how often do you have a computer read to you
All the time Most of the time
Often Seldom Never
If you have a computer read to you, what do you ask it to read: □ Reading school work □ Work that you wrote on the computer □ Stories for pleasure reading □ Instruction manuals □ Newspaper □ Web sites □ Magazines Please tell me how much you agree or disagree with the following statements: Strongly Agree Disagree I like when I have a story read to me. 1 2 3 I enjoyed the voice that has read to me. 1 2 3 I found that when the program read faster, I did not comprehend what was being read.
1 2 3
I understand better when I had the program read to me. 1 2 3 The program made it easier for me to read. 1 2 3 I found that when the program paused, I understood better 1 2 3 I like that the program highlighted words. 1 2 3 I would use a program like this in the future to aid in my reading.
1 2 3
I found myself frustrated when the program read to me. 1 2 3 Highlighting of words helped me focus on the words. 1 2 3 I did not understand the voice that read to me. 1 2 3