Embed Size (px)
Citation preview
Understanding the Brazilian success in
reducing child labour:
empirical evidence and policy lessons
Drawing policy lessons from the Brazilian experience
June 2011
Un
der
sta
nd
ing C
hil
dre
n’s
Wo
rk
Pro
gra
mm
e W
ork
ing
Pa
per
Seri
es,
Ju
ne
2011
Understanding the Brazilian success in
reducing child labour:
empirical evidence and policy lessons
Drawing policy lessons from the Brazilian experience
June 2011
Understanding Children’s Work (UCW) Project
ILO Office for Italy and San Marino
Villa Aldobrandini
Via Panisperna 28
00184 - Rome
Tel: +39 06.4341.2008
Fax: +39 06.2020.687
Email: [email protected]
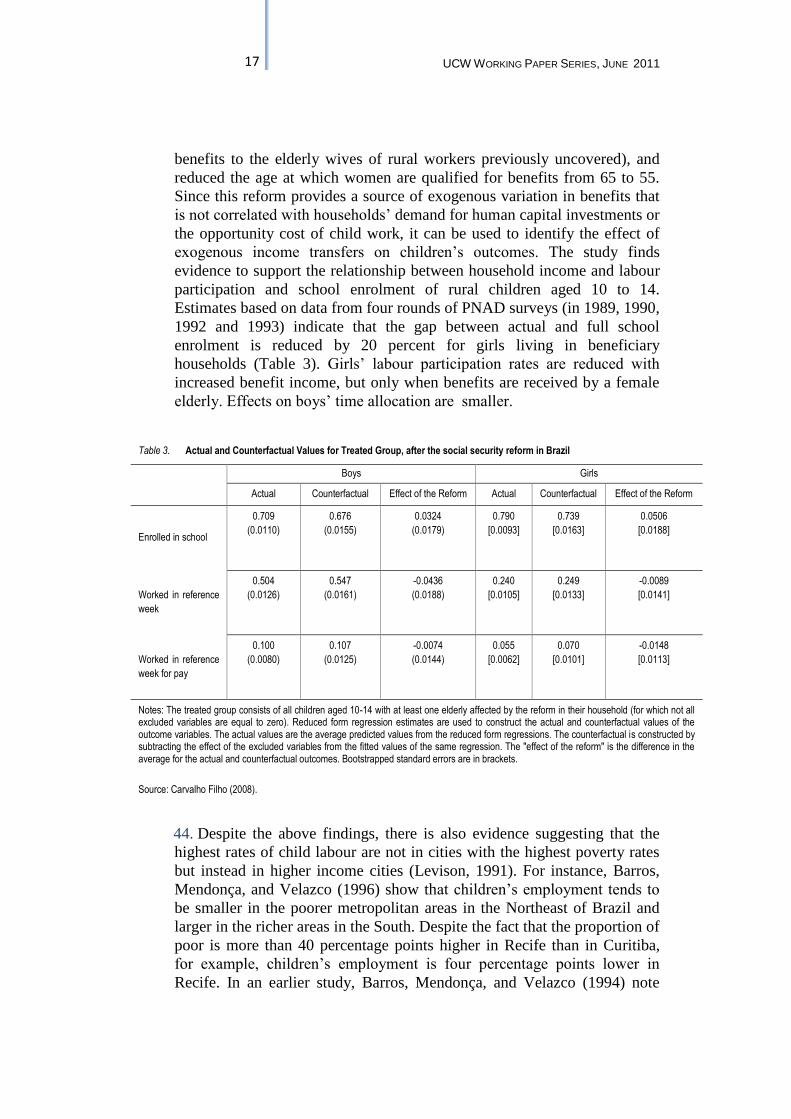
As part of broader efforts toward durable solutions to child labour, the International
Labour Organization (ILO), the United Nations Children’s Fund (UNICEF), and the World
Bank initiated the interagency Understanding Children’s Work (UCW) Programme in
December 2000. The Programme is guided by the Oslo Agenda for Action, which laid out
the priorities for the international community in the fight against child labour. Through a
variety of data collection, research, and assessment activities, the UCW Programme is
broadly directed toward improving understanding of child labour, its causes and effects,
how it can be measured, and effective policies for addressing it. For further information,
see the Programme website at www.ucw-project.org.
This paper is part of the research carried out within UCW (Understanding Children's
Work), a joint ILO, World Bank and UNICEF project. The views expressed here are those
of the authors' and should not be attributed to the ILO, the World Bank, UNICEF or any of
these agencies’ member countries.
Understanding the Brazilian success in
reducing child labour:
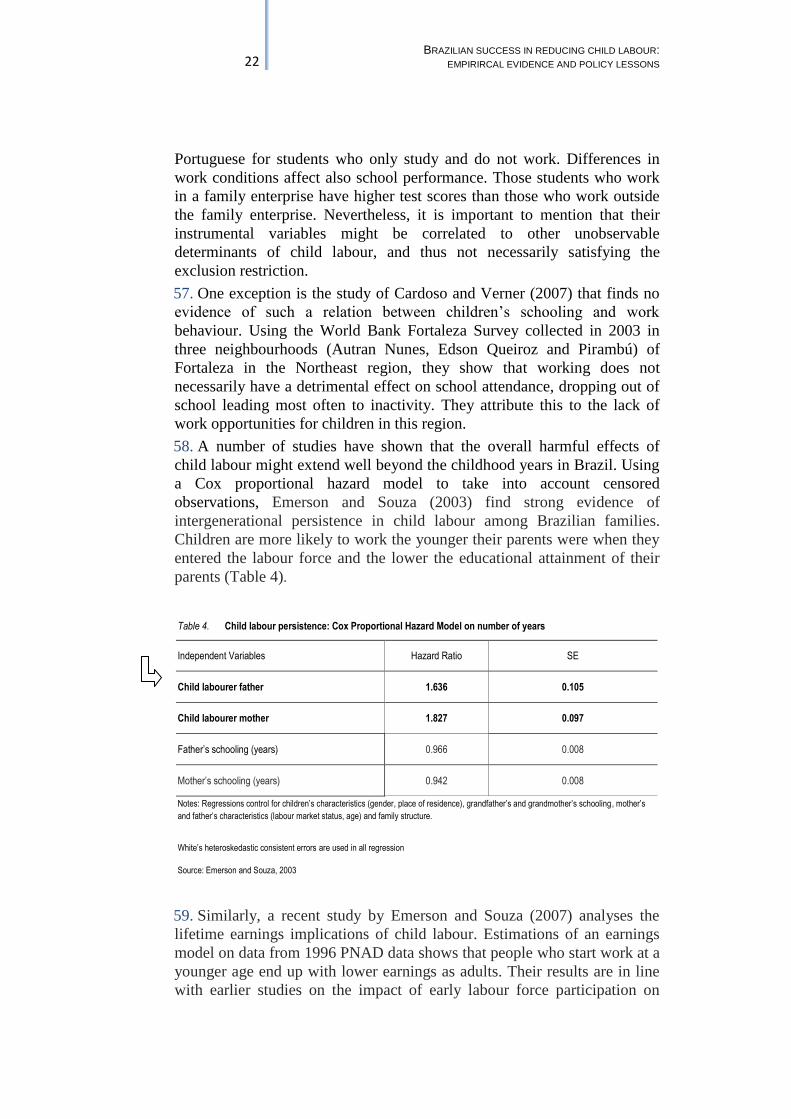
empirical evidence and policy lessons
Drawing policy lessons from the Brazilian experience
June 2011
ACKNOWLEDGEMENTS
This report has been prepared by a team led by Furio C. Rosati, comprising
Marco Manacorda, Irina Kovrova, Nihan Koseleci and Scott Lyon.
UCW is particularly grateful to Angela Martins-Oliveira (ILO), Renato
Mendes (ILO, Brasilia), Maria Claudia Falcao (ILO, Brasilia), Ana Claudia
Farranha (ILO, Brasilia) who provided guidance and advice at various
stages of this report.
Understanding the Brazilian success in
reducing child labour:
empirical evidence and policy lessons
Drawing policy lessons from the Brazilian experience
June 2011
ABSTRACT
Brazil has witnessed dramatic progress towards eliminating child labour and
achieving universal basic school enrolment in the last two decades. Indeed, in the
period from 1992 to 2009, economic activity among 7-15 year-olds fell by more
than half, from 18 percent to less than seven percent, while school attendance rose
from 85 percent to 97 percent. What were the factors underlying this success? Was
it driven primarily by policy? And, if so, which policies were most influential? Or,
alternatively, was the progress more a product of demographic trends, or of
broader changes in the Brazilian macro-economy and labour market?
The current report takes up these questions using data from the multi-year
Pesquisa Nacional por Amostra de Domicilios (PNAD) survey programme. It
looks in detail at trends in child labour and schooling over the 1992-2008 period,
and analyses the reasons behind these trends, in an attempt to draw concrete
policy lessons from the Brazilian experience applicable in countries lagging
behind in terms of child labour elimination efforts.
Understanding the Brazilian success in
reducing child labour:
empirical evidence and policy lessons
Drawing policy lessons from the Brazilian experience
June 2011
CONTENTS
1. INTRODUCTION .............................................................................................................. 1
2. RESPONDING TO CHILD LABOUR: NATIONAL AND STATE-LEVEL
POLICIES AND PROGRAMMES ..................................................................................... 2
2.1 National Education Strategy .............................................................................................. 2
2.2 Social protection strategy: conditional cash transfer programmes .............................. 5
2.3 Policy and programmatic responses to child labour .................................................... 12
3. CHILD LABOUR IN BRAZIL: A REVIEW OF EXISTING ANALYSES ...................... 16
3.1 Determinants and consequences of child labour ......................................................... 16
3.1.1 Child labour and household income poverty ...................................................... 16
3.1.2 Child labour and labour market conditions ......................................................... 18
3.1.3 Child labour and shocks .......................................................................................... 19
3.1.4 Child labour and household characteristics ......................................................... 20
3.1.5 Consequences of child labour ................................................................................ 21
3.1.6 Understanding child labour trends in Brazil ........................................................ 23
3.2 Impact of conditional cash transfer programmes ........................................................ 24
3.2.1 Impact of Bolsa Escola/Familia programmes..................................................... 24
3.2.2 Impact of PETI programme .................................................................................. 28
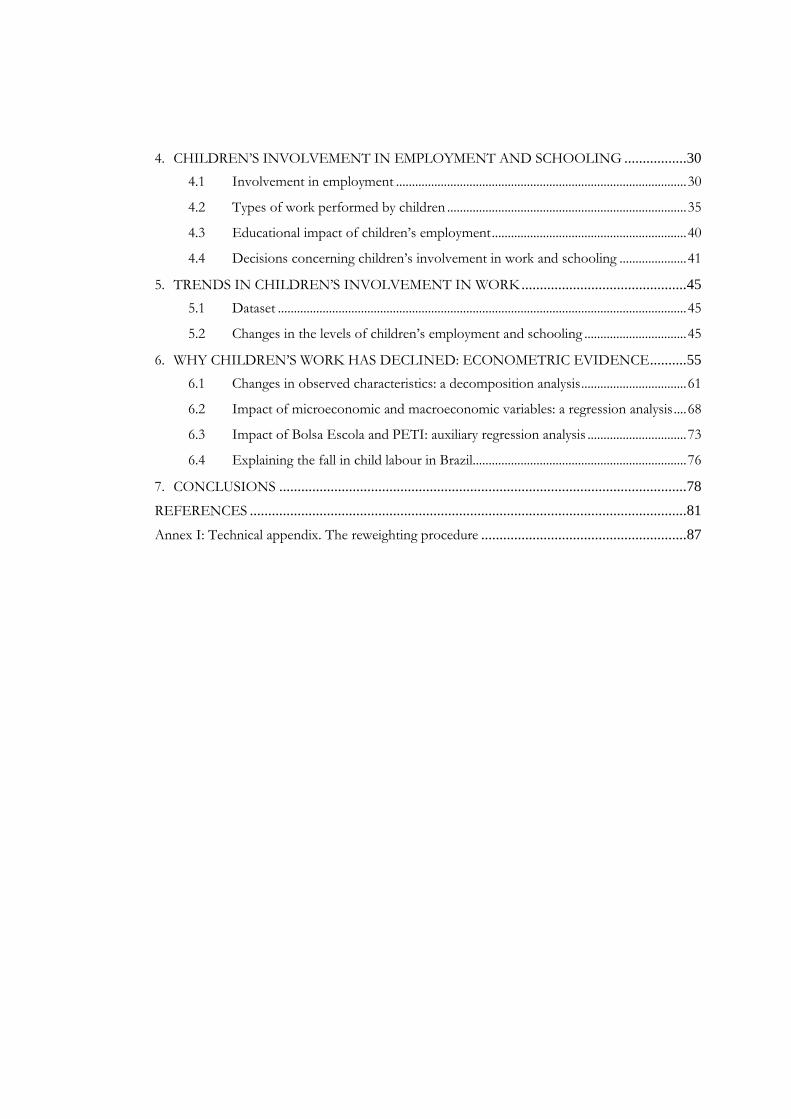
4. CHILDREN’S INVOLVEMENT IN EMPLOYMENT AND SCHOOLING ................. 30
4.1 Involvement in employment ........................................................................................... 30
4.2 Types of work performed by children ........................................................................... 35
4.3 Educational impact of children’s employment ............................................................. 40
4.4 Decisions concerning children’s involvement in work and schooling ..................... 41
5. TRENDS IN CHILDREN’S INVOLVEMENT IN WORK ............................................. 45
5.1 Dataset ................................................................................................................................ 45
5.2 Changes in the levels of children’s employment and schooling ................................ 45
6. WHY CHILDREN’S WORK HAS DECLINED: ECONOMETRIC EVIDENCE .......... 55
6.1 Changes in observed characteristics: a decomposition analysis ................................. 61
6.2 Impact of microeconomic and macroeconomic variables: a regression analysis .... 68
6.3 Impact of Bolsa Escola and PETI: auxiliary regression analysis ............................... 73
6.4 Explaining the fall in child labour in Brazil................................................................... 76
7. CONCLUSIONS ............................................................................................................... 78
REFERENCES ....................................................................................................................... 81
Annex I: Technical appendix. The reweighting procedure ........................................................ 87
1 UCW WORKING PAPER SERIES, JUNE 2011
1. INTRODUCTION
1. Brazil has witnessed dramatic progress towards eliminating child labour
and achieving universal basic school enrolment in the last two decades.
Indeed, in the period from 1992 to 2008, economic activity among 7-15
year-olds fell by more than half, from 18 percent to seven percent, while
school attendance rose from 85 percent to 97 percent. What were the
factors underlying this success? Was it driven primarily by policy? And, if
so, which policies were most influential? Or, alternatively, was the progress
more a product of demographic trends, or of broader changes in the
Brazilian macro-economy and labour market?
2. The current report takes up these questions using data from the multi-
year Pesquisa Nacional por Amostra de Domicilios (PNAD) survey
programme. It looks in detail at trends in child labour and schooling over
the 1992-2008 period, and analyses the reasons behind these trends, in an
attempt to draw concrete policy lessons from the Brazilian experience
applicable in countries lagging behind in terms of child labour elimination
efforts.
3. The empirical evidence presented in the report corroborates other
research pointing to the central role of policy in the decline in child labour
and in the increase in school attendance over the 1992-2008 period. The
report shows that the decline in child labour in Brazil did not happen by
itself – only a small proportion can be explained by changes in the
population structure unrelated to policy – while much of the decline can be
traced to active efforts across a range of policy areas.
4. The remainder of the report is organised as follows. The next section
outlines the national response to child labour, on the levels of both
legislation and policy. Section 3 reviews the existing literature on child
labour in Brazil and the factors underlying it. Section 4 presents descriptive
data on the extent and characteristics of children’s economic activity,
including the sectors where child workers are concentrated, the intensity of
work and its hazardousness. Section 5 analyses the trends in children’s
work and school attendance over the 1992-2008 period. Section 6 looks at
major determinants of the changes in child labour incidence and school
attendance, based on an economic model of household behaviour. Section 7
concludes.
2
UNDERSTANDING THE BRAZILIAN SUCCESS IN REDUCING CHILD LABOUR: EMPIRIRCAL EVIDENCE AND POLICY LESSONS
2. RESPONDING TO CHILD LABOUR: NATIONAL AND STATE-LEVEL POLICIES AND PROGRAMMES
5. Since the mid-1990s, access to basic educational opportunities in Brazil
has improved sharply. Moreover, Brazil has made significant progress
towards the elimination of child labour. The policies implemented over this
period fostered educational opportunities through a well-balanced use of
three complementary pillars: improvement in the availability and quality of
school system, conditional income transfers to families aimed at giving
them effective conditions and incentives to maintain their children’s
attendance in school, and a number of national and local policies and
programmes implemented to eliminate child labour.
6. Given the large number of national policies and programmes in place,
this section will not be exhaustive and consider only the main ones. Section
2.1 briefly discusses Fundef/Fundeb and Fundescola, which aims at
improving the education supply by establishing minimum public education
standards and levelling the disparities among various regions in the
country. Section 2.2 then turns to the demand side policies in the area of
education and discusses the evolution of the conditional cash transfer
programmes in Brazil, such as the Bolsa Escola, subsequently incorporated
into the Bolsa Familia scheme. Section 2.3 reviews major policies and
programmes related to the elimination of child labour.
2.1 National Education Strategy
7. The federal government has given its highest priority to improving
access and quality in education. It has initiated a number of reforms
including: (a) the amendment of the constitution to guarantee a minimum
spending level on primary education everywhere in the country; (b) the
support for a law that sets the standards redefining the roles and
responsibilities of each government level; (c) implementing a programme
to directly transfer funds to the schools, in an effort to increase school
autonomy and effectiveness; and (d) the development of information and of
a communication programme about education quality and performance
through a national assessment system and an annual school census; and (e)
the development and dissemination of new and national curriculum
parameters. These reforms are designed to decentralize the funding of
education system, diminish regional and local disparities, and increase
coordination among the various systems (for a more detailed discussion see
World Bank, 2002).
8. Increased resources for education. The new Brazilian constitution,
ratified in 1988, stated that all states, municipalities and the Federal
Government had to spend a fixed share of their tax and transfer revenues in
their public education system. This share was equal to 25% for states and
3 UCW WORKING PAPER SERIES, JUNE 2011
municipalities and to 18% for the federal government. With this new
legislation, the amount of resources allocated to education increased, but so
did the heterogeneity of public schools, since richer states with a small
share of students in their system were spending a higher amount per pupil
than were poor municipalities with a large share of students. Furthermore,
there was no mechanism to guarantee that education resources were
effectively being spent on the educational system itself and not on other
activities that could be remotely linked to education (Menezes-Filho and
Pazello, 2007).
9. Defining roles and responsibilities. The highly decentralised system of
educational provision in Brazil suffered from overlapping and imprecise
responsibilities among levels of government, and large spending and
quality differentials across regions and providers. The approval of the
National Education Law (LDB) in 1996 clarified the roles and
responsibilities of the state and municipal governments with respect to
educational provision. The law also established minimum quality standards
(including curriculum and teacher qualifications standards), and further
decentralises service provision to sub-national governments. More
specifically, the National Institute for Educational Research and Studies
was made responsible for the creation and production of educational
statistics and student assessment. State and municipal governments were
assigned joint responsibility in the provision of primary education (Grades
1-8).1 Municipal governments were also put in charge of pre-school
education and state governments for secondary education (Grades 9-11).
10. Reducing the disparities in education finance. Fundef (Fundo de
Mantenção e Desenvolvimento do Ensino Fundamental e de Valorização
do Magistério), a fund for financing sub-national spending on primary and
lower-secondary education was created in 1996, and subsequently
implemented in 1997-98. The introduction of Fundef aimed at changing the
structure of funding in fundamental education. Through Fundef, a national
floor was set on a per student basis for government spending on primary
(1st to 4
th grades) and lower-secondary education (5
th to 8
th grades) at all
levels of government. The Federal Government is required to top up
spending in those states and municipalities that cannot afford the national
spending floor by redistributing resources among them depending on the
size of each. Fundef also established a floor of 60% on the percentage of
public spending in teachers’ wages out of total resources. The
implementation of Fundef contributed significantly to the rapid increase in
enrolment rates in primary and lower-secondary education, particularly in
small municipalities, which rely more heavily on transfers from higher
1 Brazil's basic education system is divided into: educação infantil,, offered in crèches (for 0-3 year-
olds) and in pre-schools (for children aged 4-6); an eight-year elementary school cycle called ensino fundamental (for 7-14 year olds), which is commonly divided into two stages(grades 1-4 and 5-8); and a three-year secondary cycle, ensino médio (grades 9-11 for 15-17 year olds).
4
UNDERSTANDING THE BRAZILIAN SUCCESS IN REDUCING CHILD LABOUR: EMPIRIRCAL EVIDENCE AND POLICY LESSONS
levels of government as a source of revenue (de Mello and Hoppe, 2005).
Moreover, the rise in teachers’ relative wages across municipalities brought
about by Fundef (Barros, Mendonça, and Blanco, 2001) is found to have a
positive impact on the proficiency of public school pupils (Menezes-Filho
and Pazello, 2007). Fundef was expanded to upper-secondary and pre-
school education from 2007, through the creation of Fundeb (Fundo de
Manutenção e Desenvolvimento da Educação Básica e de Valorização dos
Profissionais da Educação). Fundeb is an important step to reduce access
bottlenecks at the upper-secondary level and remove constraints on child
care for working mothers and pre-school education, making labour force
participation easier for prime-age females (OECD, 2006; Neri and
Buchman, 2007).
11. School improvement. Fundescola (Fundo de Fortalecimento da
Escola) is a federal programme that has been useful for municipalities
beyond the transfer of federal resources. Fundescola is a programme of
school improvement that started in 1998 and is currently in its third phase
(see Table 1). It aims to improve primary education in the poorest regions
of the country – the North, Northeast, and Center-West regions. Fundescola
has set minimum operational standards that all schools have to meet,
strengthened local empowerment and planning through the school
development plan and greater community participation, promoted
institutional development in state and municipal secretariats (Secretariats of
Education) and introduced special learning programmes such as Escola
Ativa and accelerated classes.
12. Improving quality through assessment and standards. Two other
strategies for improving education quality and equity are the enhancement
of the education indicator system and the development of National
Curriculum Parameters. The indicator system includes the SAEB (National
Basic Education Evaluation System), the annual school census system, and
comprehensive programmes to disseminate educational results. The
development and publication of the National Curriculum Parameters serve
as a complement to these efforts by establishing learning standards for
every grade level, facilitating the design of the SAEB instruments. These
standards were published and distributed to all primary school teachers
(World Bank, 2002). The Quality Basic Education Development Index
(IDEB), created in 2007, represents a pioneering initiative to bring together
in one display two concepts that are equally important for the quality of
education: school flows and average performance evaluations. The
indicator is computed from data on school approval, obtained in the school
census, and average performance in the SAEB.
13. Institutional developments related to Fundeb and Fundescola have been
complemented by an array of policies to address additional demand issues.
The Bolsa Escola/Bolsa Familia programmes are among the most important
governmental efforts to stimulate educational demand through direct
subsidization of attendance. These programmes are now a relevant part of a
5 UCW WORKING PAPER SERIES, JUNE 2011
larger social assistance strategy in Brazil to promote the demand for social
programmes in a socio-political climate of improved access and
transparency.
Table 1. Fundescola program phasing
Fundescola I (June 1998)
It developed and piloted the first set of school-based tools, including especially the "school development plan" for improving the effectiveness of school strategic management, and Escola Ativa for improving the quality of instruction and learning in rural, multi-grade schools.
This project inaugurated the school "minimum operational standards" model for improving school system equity.
It disseminated information on these initiatives to state and municipal schools and secretariats throughout the North and Center-West regions.
It launched the "priority attention zone" approach, in which neighbouring municipalities, grouped in microregions. collaborate with one another, with their state governments, and with the Ministry of Education on improving schooling in their jurisdictions.
Fundescola II (December 1999)
The first secretariat-based tool was developed and tested.
A comprehensive school improvement strategy was also introduced with this Project.
It broadened the testing of these school improvement tools, including the new ones, and added an additional region into the project (the Northeast).
It continued to support Fundescola I schools in order to promote the sustainability of the earlier interventions.
Awareness of the need to improve school effectiveness and the availability of the new tools was promoted by means of seminars, workshops, research studies, and especially through the demonstration effect associated with the testing of the school improvement strategy in thousands of schools
Fundescola III It provides additional assistance to schools that had begun to introduce Fundescola's schooling improvement reforms to consolidate these reforms under the responsibility and support of their Secretariats of Education.
It helps hundreds of local governments expand these reforms into thousands of additional schools.
It develops and uses a new set of teaching/learning models, in addition to Escola Ativa and Gestar, for diverse types of schools and population groups.
It builds the capacity of local governments to support continuous improvement in schooling quality, and through incentives and partnerships, promotes the financial, administrative, and managerial permanence of these reforms.
Source: World Bank, 2002
2.2 Social protection strategy: conditional cash transfer programmes
14. Concerns about redistribution are reflected in Brazil’s Constitution,
which places great emphasis on poverty reduction and the creation of a
more just and equitable society. The Constitution established a legal
foundation of social assistance as guaranteed “rights” for the needy - and
also an obligation of the state to provide health and education services,
among others. In this framework, conditional cash transfer (CCT)
programmes serve as a social policy instrument that seeks to integrate these
rights to education, health and social assistance. CCT programmes help
reduce short-term poverty through cash transfers, while giving households
6
UNDERSTANDING THE BRAZILIAN SUCCESS IN REDUCING CHILD LABOUR: EMPIRIRCAL EVIDENCE AND POLICY LESSONS
the incentives to invest in the human capital of their children and thereby
reduce poverty in the long-run.
15. Brazil was the first country to pioneer the instrument of CCTs in Latin
America. Several Brazilian states and municipalities began to experiment
with new forms of social assistance in the mid-1990s. In 1995, two
programmes (Bolsa Escola and the Guaranteed Minimum Family Income
Programme) were initiated in the Distrito Federal (Brasilia) and in the
Campinas Municipality. Over the same period, and with design similar to
the Bolsa Escola programmes, another major Federal Programme
(Programa de Erradicação do Trabalho Infantil - PETI) has been instituted
(see below for further details). These programmes became a model that
spread rapidly to many municipalities and states.
16. By 2001, cash transfers programmes with education conditionalities
were in force in more than 100 municipalities and provided support to
approximately 200,000 families. All of these programmes had three key
features in common: they were targeted to the poor through means testing;
they paid cash to families (usually to women) in exchange for counterpart
actions (see Table 2). Most programmes also included minimum residency
requirements (five years) in the municipality or state, out of fear that the
lack of a national programme would attract poor migrants to their
jurisdictions (Lindert et al. 2007).
17. In 2001, the Bolsa Escola programme was scaled up to the national
level, building on earlier municipal-level programme initiatives. Bolsa
Escola Federal provided female heads of poor households a monthly
stipend conditional on their children’s regular school attendance. Many
aspects of programme implementation were delegated to municipal
governments, including the identification and selection of programme
beneficiaries, the monitoring and enforcement of conditionalities, and the
management of local accountability mechanisms. Under the Bolsa Escola
programme, poor families, with per capita income less than R$90 (US$43)
or half the minimum wage at that time, received R$15 (US$7) per month
per child up to a maximum of three children, conditional on school
attendance of at least 85 percent. By late 2003, Bolsa Escola had been
implemented in almost all of Brazil’s 5,561 municipalities, covering over
8.6 million school aged children from 5 million families (De Janvry et al.,
2005).
18. In 2001, the federal government also initiated Bolsa Alimentação
(2001), a CCT programme for pregnant and lactating women. Programme
conditionalities consisted of complying with a minimum schedule of pre-
natal and post-natal care visits, monitoring the growth of children, and
keeping their vaccinations up to date, as well as participation in nutritional
education seminars. In 2002, the federal government introduced the
unconditional cash transfer, Auxílio Gás (Cooking Gas Subsidy ), intended
to support the support of gas for domestic consumption as existing cooking
gas subsidies were phased out. In 2003, Cartão Alimentação (Food Card), a
7 UCW WORKING PAPER SERIES, JUNE 2011
general cash transfer for food consumption to the extremely poor
population, was launched.
19. In 2003, the newly-elected government of Brazil decided to develop an
integrated approach to replace and consolidate the existing array of income
transfer programmes. Bolsa Escola, Bolsa Alimentação together with other
subsidies (Auxílio Gás and Cartão Alimentação) were consolidated into a
single cash transfer programme, Bolsa Familia, which became the basis of
Brazil’s reformed social protection system. The rationale for integration
was to promote efficiency in the use of public resources, improve the
system for identifying the target population, avoid duplication of services,
foster better coordination, and expand coverage (Lindert et al. 2007). Bolsa
Familia is managed by the Ministry of Social Development and Hunger
Eradication (MDS), in coordination with the Ministries of Health and
Education, the state-owned bank Caixa Econômica Federal, the states,
municipalities and social partners at the local level.
20. The Bolsa Familia programme targets “moderately poor” and
“extremely poor” families with pregnant, lactating woman and/or children
from up to 15 years old and adolescents from 16 to 17 years old. The
income ceilings for eligibility to the Bolsa Familia programme are set at a
fixed monthly per capita income of R$140 (US$75) for moderately poor
families and R$70 (US$38) for extremely poor families.
21. Targeting of the Bolsa Familia programme is based on a combination of
geographic and household criteria (per capita income). Geographic
targeting is applied at both federal and municipal levels. First, the federal
government allocates quotas to municipalities according to estimates of
poverty for the municipal level. These municipal level quotas are
established by applying eligibility criteria to household survey and census
data. Second, within municipalities, poverty maps, vulnerability and other
indices of living standards are used to identify and target geographic
concentrations of the poor. This geographic targeting mechanisms aims at
increasing the likelihood that interviewed and registered families are poor.
22. In addition to geographic targeting mechanisms, the principal
instrument for determining eligibility is the registry of low income families
called the Cadastro Unico. Families meeting the eligibility criteria present
themselves to the local authorities, accredited and trained by the MDS, to
be registered into the central database of the Cadastro Unico. Municipalities
are responsible for collecting data and registering families into the Cadastro
Unico. In the interviews with these local authorities, applicants self-declare
their household income2 and municipalities are required to conduct ex-post
2 Data collected during these interviews include (a) identification numbers; (b) household
characteristics; (c) dwelling identification (address) and characteristics (tenure, type, total number of rooms, construction materials, water source and purification, type of lighting, sanitation, garbage collection); (d) incomes and expenses (rent, housing loans, food, water, electricity, transport, medicines, gas, and other expenditures); and (e) a variety of other information (land holdings, membership in social organizations, hired labor, and agricultural losses).
8
UNDERSTANDING THE BRAZILIAN SUCCESS IN REDUCING CHILD LABOUR: EMPIRIRCAL EVIDENCE AND POLICY LESSONS
random home visits to at least 10 percent of the beneficiaries to validate the
information. After the municipality documents the relevant information, it
registers the family and enters the information into the Cadastro Unico.
23. While municipalities are responsible of data collection and beneficiary
registry, operation and maintenance of the database are centralized at
federal level. The MDS has the responsibility for determining family
eligibility. Beneficiary selection is carried out automatically by the
Cadastro Unico, which compares self-reported income to the official
eligibility thresholds, prioritizing families and assigning benefits according
to income and family composition. The MDS runs additional consistency
checks to verify information and finalise the beneficiary list. An important
variable is the municipality level quotas. Municipalities are allowed to
register as many families as necessary in the Cadastro Unico. However, the
MDS maintains municipal quotas for the Bolsa Familia programme benefits
which arise from a detailed poverty map of Brazil.3
24. If the MDS accepts a family into the programme, the payments by the
Caixa Economica Federal are transacted through the national banking
system. Around 32,000 pay points altogether are run independently or in
cooperation with banks. An electronic card is given to the family to enable
the access to the monthly payment at a pay point. While the assistance unit
is defined as the family as a whole, payments are made to the woman in
each family as the legally responsible beneficiary.
25. The Bolsa Familia programme provides two types of benefits. The
transfer amount depends on income levels and household composition.
Bolsa Familia provides a base benefit to all families in extreme poverty,
regardless of their demographic composition (moderately poor families do
not receive this base benefit). Both extreme poor and moderately poor
families receive a variable benefit according to the number of children in
the family and whether the mother is pregnant or breast-feeding. With this
benefits menu, the extremely poor families receive a fix amount (R$68) and
a variable cash transfer depending on the family composition. For these
families, the variable cash transfer of R$22 per children from 0 to 6 years
of age and teenagers until 15 years old, up to three and R$33 per
adolescents from 16 to 17 years old with the condition that they attend
school, up to two. The total transfer for the extremely poor families ranges
from R$68 to R$200 (US$37-109). Moderately poor families receive the
variable cash transfer ranging from R$22 to R$132(US$12-72).
26. When the Bolsa Familia was created, it adopted the menu of
conditionalities from Bolsa Escola (for education conditionalities) and
Bolsa Alimentação (for health conditionalities). The families enrolled in the
Bolsa Familia programme are required to fulfil three conditions: attendance
for prenatal and postnatal monitoring, ensuring access to nutrition and
3 This process differs from that used by Bolsa Escola. Under Bolsa Escola, the municipalities were in
charge of determining eligibility and selecting beneficiaries.
9 UCW WORKING PAPER SERIES, JUNE 2011
vaccination monitoring for their children from 0 to 7 years old and ensuring
school attendance levels of at least of 85 percent for children aged 6 to 15
years and of at least 75 percent for teenagers from 16 to 17 years old. A
relevant feature of the program is its focus on the family unit, rather than on
the individual or on the community. By 2009, Bolsa Familia had reached
12.4 million families, almost 50 million people, corresponding to a quarter
of Brazil’s population at an annual cost of over USD 5 billion (0.4 percent
of the GDP). Further description of Bolsa Familia programme can be found
in ILO (2009) and Lindert et al. (2007).
27. A major challenge to be addressed through Bolsa Escola/Bolsa Familia
programmes is the elimination of child labour. The earlier Programme for
the Eradication of Child Labour (PETI) was merged into the new
conditional cash transfer scheme in order to optimize the efficiency. A
range of complementary socio-educational measures have also been
implemented in cooperation with other institutions.
10 BRAZILIAN SUCCESS IN REDUCING CHILD LABOUR: EMPIRIRCAL EVIDENCE AND POLICY LESSONS
Table 2. Evolution of Brazilian Conditional Cash Transfer Programmes
Programme and Agency Eligibility Criteria Monthly benefits Conditionalities Number of Beneficiaries
Early Municipal Programmes (by 2001 there were over 100 municipal programmes)
Renda Minima Campinas Municipality 1995-Present
Max. income R$140 per month (or max. R$35 per capita). Resident in Campinas at least 2 years prior to programme creation.
Monthly benefit equals difference between total family income and the sum of family members multiplied by the value of R$35.
Children under 6 must receive medical care and undergo nutritional monitoring. Children between 7 and 14 must attend school. One of the parents must attend a monthly group meeting with social workers and psychologists to discuss their problems, how to use the program transfers (though there are no conditions on how they are spent) and receive family planning guidance.
2 500 families in 2001
Bolsa Escola Federal District 1995-1998
Max per capita family income of ½ minimum wage, R$50. Resident in DF at least 5 years prior to program’s creation.
1 minimum wage per family per month, R$100.
School aged children (age 7 to 14) must have 90% school attendance minimum. 25 680 families in 1998
Pre-Bolsa Familia Federal Programmes (2001-03)
Bolsa Escola Federal (BE) Ministry of Education 2001-2003
Per capita family income below R$90 (US$43)
R$15-45 (US$7-21)
School aged children (age 6 to 15) must have 85% school attendance minimum. 15.2 million beneficiaries in 2003
Bolsa Alimentação (BA)
Ministry of Health 2001-2003
Per capita family income below R$90 (US$43)
R$15-45 (US$7-21)
Family must access basic health care, pre and post-natal care, vaccination, nutritional and growth monitoring of children age 0 to 7 years.
1.5 million beneficiaries in 2003.
Auxilio Gas (AG)
Ministry of Mines &Energy 2002-2003
Per capita family income below ½ minimum wage, or R$90 and (1) be registered in the Cadastro Único; or (2) be a beneficiary of BE or BA
R$7.50 per family
None
28.7 million beneficiaries in 2003.
Programa Cartão Alimentação (PCA)
(former) Ministry of Food Security February-December 2003
Per capita family income below ½ minimum wage, or R$90.
R$50 per family
Benefits to be spent on food
1.4 million beneficiaries in 2003.
11 UCW WORKING PAPER SERIES, JUNE 2011
Programme to Eradicate Child Labour (PETI)
Ministry of Social Development, MDS 1996- present (cash transfer part of PETI merged into BFP as of January 2006)
Families with children and adolescents between the ages of 7 and 15 years old involved the worst forms of child labour.
R$25-40 per family plus a transfer of R$10-20 per child to schools for afterschool activities. For 15-year olds at extreme risk, transfer of R$65 per month and transfer for school activities R$220 per year.
Minimum attendance of children and adolescents in school and other activities of 75%. Families must participate in social education and income generating activities, and must ensure that their children are not involved in child labour.
3.3 million beneficiaries in 2002.
Bolsa Familia Programme (2003-present) (BFP)
Ministry of Social Development October 20, 2003- present
Per capita family income below R$140 (US$77)
R$68-200 for extremely poor families R$22-132 for moderately poor families
Family must access basic health care, pre and post-natal care, vaccination, nutritional and growth monitoring of children age 0 to 7 years. School aged children (age 6 to 15) must have 85% school attendance minimum and adolescents (age 16 to 17) must have 75% of school attendance minimum.
50 million beneficiaries (12.4 million families) as of 2009
Source: Lindert et al., 2007 and ILO, 2009.
12 BRAZILIAN SUCCESS IN REDUCING CHILD LABOUR:
EMPIRIRCAL EVIDENCE AND POLICY LESSONS
2.3 Policy and programmatic responses to child labour
28. Brazilian Government's efforts to eliminate child labour are coordinated
around the following actions: reinforcing regulations and legislation to
eliminate child labour, supporting institutions and activities related to child
labour eradication, providing scholarships to working children and
adolescents, providing social services to working children and adolescents,
conducting child labour focused inspections, conducting public awareness
campaigns, updating the Map of Areas with Child Labour.
29. Legal framework for combating child labour. Brazil ratified
Convention No. 138, the Minimum Age Convention, in 2001 and
Convention No. 182, the Worst Forms of Child Labour Convention in
2000. In 2004, Brazil has ratified the Optional Protocol to the CRC on the
sale of children, child prostitution and child pornography, the Optional
Protocol to the CRC on the involvement of children in armed conflict,
United Nations Convention against Transnational Organized Crime
(CTOC), Human Trafficking Protocol, supplementing the CTOC and
Smuggling of Migrants Protocol, supplementing the CTOC.
30. Brazil has also implemented a series of legal reforms to help bring
national laws into full compliance with the conventions. The 1988 Brazilian
Federal Constitution (Constituição Federal) and the 1990 Statute on
Children and Adolescents1 (Estatuto da Criança e do Adolescente) provide
the legal framework that defines and implements children’s rights policy in
Brazil. According to the national legislation, the minimum age for general
employment in Brazil is 16 years.2 This minimum age was raised from 14
years after an amendment in 1998. The minimum age for apprenticeships is
14 years. Minors who work as apprentices are required to attend school
through the primary cycle and to provide proof of parental permission to
work. The law prohibits employees less than 18 years from working in
unhealthy, dangerous, painful, or arduous conditions; at night; or in settings
where their physical, moral, or social well-being is adversely affected.3
31. The Ministry of Labour and Employment (MTE) is responsible for
inspecting work sites for child labour violations, while its regional offices
gather data from the inspections to develop plans to combat child labour.
Most inspections result from complaints to labour inspectors by workers,
NGOs, teachers, the media, and other sources. While inspections mostly
take place in the formal sector, most children work in farms and private
homes. The MTE reported that from January to November 2008, inspectors
1Law Nº 8,069 of 1990.
2Article 7 (paragraph XXXIII) of the Federal Constitution of 1988, as amended by Constitutional
Amendment No. 20 of 15 December 1998. Employment of children under 16 is also prohibited under the terms of section 403 of the Consolidated Labour Act, as amended by Act No. 10.097/2000, and section 60 of the Statute of the Child and Adolescent, Act No. 8.069 of 13 July 1990, as amended by Amendment No. 20 of 1998. 3 Article 7 (paragraph XXXIII), of the Federal Constitution and section 403 of the Consolidated Labour
Act, as amended by Act No. 10.097 of 19 December 2000.
13 UCW WORKING PAPER SERIES, JUNE 2011
found over 5,000 children under 16 working illegally, an approximately 35
percent decrease when compared with 2007 (US Department of State,
2009).
32. National policy framework. The MTE set up the National Council for
the Eradication of Child Labour4 (CONAETI) and the Ministry of Justice
set up the National Council for Children’s and Young Persons’ Rights
(CONANDA)5. CONAETI is in charge of proposing mechanisms to ensure
the implementation and enforcement of Convention No. 138 and
Convention No. 138. CONAETI also was in charge of promoting the
National Plan for the Eradication of Child Labour. Additionally,
CONANDA's role includes: preparation of general principles of national
policy on the protection of children's and young persons' rights; overseeing
the implementation of the national policy on the protection of children and
young people; assessing state and municipal policies and the performance
of the state and municipal councils for children's and young persons' rights;
supporting educational campaigns on promotion of children's and young
persons' rights; and managing the National Fund for Children's and Young
Persons' Rights.
33. The MTE set up the National Forum for the Elimination of Child
Labour (FNPETI) set up in 1994 with the support of ILO and UNICEF.
FNPETI is a non-governmental institution that aims to i) discuss public
policies and matters relating to preventing and combating child labour in
Brazil; ii) coordinate the activities of its members (i.e. governmental
organization as well as representatives of workers and employers, and
NGOs) and iii) achieve an integrated policy for protecting children and
adolescents. It sets forth the priorities for the prevention and elimination of
the worst forms of child labour.
34. The MTE periodically publishes the Map of Areas with Child Labour.
With the support of the ILO, MTE has designed a new format and
methodology for the map and has developed the Child Labour Information
System (SITI). SITI is an online monitoring tool, used by the labour
inspectors to inform on the inspection actions and the child labour
identified cases. Moreover, a subcommittee of CONAETI composed of
members from the Federal Government, worker and employer
organizations, and civil society, has revised the country's list of the worst
forms of child labour, as stipulated by ILO Convention No. 182 on the
Worst Forms of Child Labour As a consequence of this, President Lula
signed, in June 2008, Decree no.6481/08 establishing the new Brazilian list
of hazardous occupations, which adapts the legal framework by the ILO
Convention 182. This act should be considered one of the greatest child
4 CONAETI is set up under Order No. 365 of 12 September 2002 and reformed under Order No. 952 of
8 July 2003. 5 CONANDA was set up by Decree No. 8.242 of 12 October 1992. The competencies of CONANDA
were established by Decree No. 5.089 of 20 May 2004.
14 BRAZILIAN SUCCESS IN REDUCING CHILD LABOUR:
EMPIRIRCAL EVIDENCE AND POLICY LESSONS
labour legal advances on the Brazilian legislation, since the ratification of
ILO Conventions 138 and 182..
35. The Government of Brazil, in coordination with ILO-IPEC,
implemented a Time-bound Programme to eliminate the worst forms of
child labour in domestic service, prostitution, hazardous work in
agriculture, and other informal sector activities. The project, ended in
September 2008, withdrawn over 5,000 children from exploitive labour and
prevent an additional 2,000 from becoming involved in such activities.
Another Time-bound Programme, implemented in coordination with the
Government of Brazil, ended in 2007. The programme worked to eliminate
the worst forms of child labour in both illicit drug cultivation and the
commercial sexual exploitation of children, by providing basic quality
education in areas of north-eastern Brazil. The project targeted 10,000
children for withdrawal and prevention from exploitive labour.
36. The Government of Brazil and the other governments of MERCOSUL
for food consumption are conducting the "Niño Sur" ("Southern Child")
initiative to defend the rights of children and adolescents in the region. This
initiative includes unified public campaigns against commercial sexual
exploitation, trafficking and child labour; mutual technical assistance in
adjusting the legal framework to international standards on those issues;
and the exchange of best practices related to victim protection and
assistance.
37. The National Plan to Fight Sexual Violence against Children and
Adolescents provides the policy framework for the government
programmes to combat the commercial sexual exploitation of children and
adolescents. A number of government agencies are carrying out initiatives
to assist victims and raise awareness. One of the main programmes to assist
child victims of commercial sexual exploitation is the Social Assistance
Specialized Reference Centers Program (CREAS). These municipal
Reference Centers provide psychological assistance and insertion into
social benefits programs for children and their families. CREAS centres
have been established in 1,300 municipalities. The Secretariat of Human
Rights established a telephone hotline in every State to report sexual
exploitation. The Government operates a national trafficking database
designed to document and analyze trafficking-related statistics more
effectively (United States Deparment of Labour, 2008).
38. The Ministry of Justice continued the second phase of a programme
managed by the UNODC that will design the National Plan to Combat
Trafficking in Persons, raise awareness on the issue, and expand the
country's database on trafficking victims and perpetrators. UNODC aims to
expand project implementation to all Brazilian States, and it has established
centres in the principal national airports with personnel trained to receive
possible trafficking victims.
15 UCW WORKING PAPER SERIES, JUNE 2011
39. The centrepiece of the Brazilian Government’s strategy for reducing the
worst forms of child labour is the federal Programme for the eradication of
the worst forms of child labour (PETI). PETI, launched in 1996, is designed
to withdraw children between 7 and 15 years of age from dangerous, heavy,
unhealthy or degrading forms of labour. The programme explicitly states as
a condition that “all children who are less than 16 years old must be
withdrawn from any form of child labour” (ILO, 2008). The programme
began as a pilot experience implemented in the coal production areas of the
State of Mato Grosso do Sul, assisting children who worked in the coal
kilns and in the harvest of mate tea leaves, covering 14 municipalities. In
1997, it was implemented in the sugar cane plantations of Pemambuco and
the sisal region of Bahia. Assistance in the States of Amazonas and Goiás
was also initiated. In 1998, it was extended to the citrus region of Sergipe,
to mining areas in Rondônia and sugar cane areas on the coast of Rio de
Janeiro (Brazilian Court of Audit, 2003). In 1999, the programme had
managed to reach over 140,000 children. By February 2008, the
programme was extended to various activities in over 3,300 municipalities
(61% of total municipalities of Brazil) and it provides assistance to almost
900,000 children (Castelo Magalhães, 2008). This programme targeted
children in the worst forms of child labour by providing a combination of
conditional cash transfers to poor households and after-school activities.
The transfer is targeted at households with per capita income lower than
half the minimum wage, and is conditional on children stopping to work,
having a school attendance record of at least 85 percent and participating in
a range of after-school activities. The main purpose of after-school
activities is to increase the time children and adolescents spend in school,
promoting a second shift focusing on culture, play, art and sport activities
complementing regular education. The activities are carried out in the
municipal school units or other appropriate locations. The extended school
day is meant to prevent children from working, and to provide remedial
education and training for future work. Parents are also encouraged to
participate in complementary programmes, such as PRONAGER
(Generation of Employment and Income in Poor Areas Programme), in
order to improve household income and thus reduce in the long term
household dependence on income from child labour.
16 BRAZILIAN SUCCESS IN REDUCING CHILD LABOUR:
EMPIRIRCAL EVIDENCE AND POLICY LESSONS
3. CHILD LABOUR IN BRAZIL: A REVIEW OF EXISTING ANALYSES
3.1 Determinants and consequences of child labour
40. A relatively large literature has analysed or discussed the determinants
of child labour in Brazil. This section briefly describes this literature. While
we do not pretend to be exhaustive, we have tried to reflect the main
contributions in this area. We largely concentrate on studies in English.
41. We start by focusing on the relationship between child labour and
household income poverty in the first section. The studies discussed below
show that, even if relevant, poverty alone cannot explain the evolution of
child labour in Brazil. Section 3.1.2 then present results relative to the role
of local labour market conditions on children’s work and schooling
behaviour. As it has been increasingly recognized household vulnerability
plays a relevant role, besides poverty and labour market conditions. Section
3.1.3 briefly presents the results about the impact of shocks on children’s
labour supply. This is followed by a discussion of other household and
children’s characteristics such as children’s gender and birth order,
household composition and parents’ education. Section 3.1.5 looks at the
consequences of child labour with a special focus on its impact on
education and on adults’ labour market outcomes. The last section reviews
the limited number of studies aimed to explain the declining incidence of
child labour in Brazil over the 1990s. Section 3.2 focused specifically on
the effect of the policies and programs described above.
3.1.1 Child labour and household income poverty
42. There is a large and growing body of empirical evidence that addresses
the potential link between household income (and wealth) and child labour.
A negative relationship between family income and child labour in an
empirical regularity found in several studies of child labour Brazil (Spindel,
1985; Fausto and Cervini, 1991; Rizzini, Rizzini and de Holanda, 1998).
Essentially, these studies emphasize that child labour is most frequently a
result of household poverty that forces parents to send their children to the
labour market. However, as most of these studies rely on cross-sectional
data, their results should only be considered suggestive.
43. Using the social security reform as a source of exogenous variation in
household income, Carvalho Filho (2008) identifies the causal effect of
changes in household income separately from the effect of differences in
unobserved variables that may be correlated with both income and child
labour. The Brazilian social security reform of 1991 reduced the minimum
eligibility age for rural old-age benefits for men from 65 to 60, increased
the minimum benefit paid to rural old-age beneficiaries from 50 percent to
100 percent of the minimum wage, extended old-age benefits to female
rural workers who were not heads of households (thereby extending the
17 UCW WORKING PAPER SERIES, JUNE 2011
benefits to the elderly wives of rural workers previously uncovered), and
reduced the age at which women are qualified for benefits from 65 to 55.
Since this reform provides a source of exogenous variation in benefits that
is not correlated with households’ demand for human capital investments or
the opportunity cost of child work, it can be used to identify the effect of
exogenous income transfers on children’s outcomes. The study finds
evidence to support the relationship between household income and labour
participation and school enrolment of rural children aged 10 to 14.
Estimates based on data from four rounds of PNAD surveys (in 1989, 1990,
1992 and 1993) indicate that the gap between actual and full school
enrolment is reduced by 20 percent for girls living in beneficiary
households (Table 3). Girls’ labour participation rates are reduced with
increased benefit income, but only when benefits are received by a female
elderly. Effects on boys’ time allocation are smaller.
Table 3. Actual and Counterfactual Values for Treated Group, after the social security reform in Brazil
Boys Girls
Actual Counterfactual Effect of the Reform Actual Counterfactual Effect of the Reform
Enrolled in school
0.709
(0.0110)
0.676
(0.0155)
0.0324
(0.0179)
0.790
[0.0093]
0.739
[0.0163]
0.0506
[0.0188]
Worked in reference
week
0.504
(0.0126)
0.547
(0.0161)
-0.0436
(0.0188)
0.240
[0.0105]
0.249
[0.0133]
-0.0089
[0.0141]
Worked in reference
week for pay
0.100
(0.0080)
0.107
(0.0125)
-0.0074
(0.0144)
0.055
[0.0062]
0.070
[0.0101]
-0.0148
[0.0113]
Notes: The treated group consists of all children aged 10-14 with at least one elderly affected by the reform in their household (for which not all excluded variables are equal to zero). Reduced form regression estimates are used to construct the actual and counterfactual values of the outcome variables. The actual values are the average predicted values from the reduced form regressions. The counterfactual is constructed by subtracting the effect of the excluded variables from the fitted values of the same regression. The "effect of the reform" is the difference in the average for the actual and counterfactual outcomes. Bootstrapped standard errors are in brackets.
Source: Carvalho Filho (2008).
44. Despite the above findings, there is also evidence suggesting that the
highest rates of child labour are not in cities with the highest poverty rates
but instead in higher income cities (Levison, 1991). For instance, Barros,
Mendonça, and Velazco (1996) show that children’s employment tends to
be smaller in the poorer metropolitan areas in the Northeast of Brazil and
larger in the richer areas in the South. Despite the fact that the proportion of
poor is more than 40 percentage points higher in Recife than in Curitiba,
for example, children’s employment is four percentage points lower in
Recife. In an earlier study, Barros, Mendonça, and Velazco (1994) note
18 BRAZILIAN SUCCESS IN REDUCING CHILD LABOUR:
EMPIRIRCAL EVIDENCE AND POLICY LESSONS
also that the years with the highest poverty rates in Brazil are not
necessarily the years with the highest rates of child labour. These findings
suggest that the child labour problem is more severe is regions with better
work opportunities.
3.1.2 Child labour and labour market conditions
45. Improved labour market conditions have, in theory, two different effects
on children’s schooling and work behaviour (for a theoretical model, see
Cigno and Rosati, 2005; Kruger, Soares and Berthelon, 2007). On the one
hand, to the extent that better labour market conditions generate higher
earning for adults and leisure and/or schooling are normal goods, children’s
labour market participation might fall (income effect). On the other hand,
better labour market conditions, both in terms of higher real wages (or
higher returns to family economic activities) and/or employment
opportunities might lead to an increase in returns to work and might induce
households to send children to work (substitution effect). The relative size
of these effects is likely to depend on the characteristics of the household
and of the child. For example, the level of household income is likely to
influence the relative size of income and substitution effects. Similarly,
child productivity, returns to investment in their human capital and parental
preferences over their children’s time use are likely to be differentiated by
age and gender.
46. A relevant body of empirical evidence exists on the effect of local
labour market conditions on young children's labour supply and school
enrolment in Brazil. For example, Parikh and Sadoulet (2005) present
cross-section evidence based on data from the 1992 PNAD survey
suggesting that children from areas with high average adult employment
rates are more likely to work than children from areas with low average
adult employment rates.
47. In a similar vein, using PNAD survey data for the period 1981 to 2002,
Manacorda and Rosati (2009) assess the impact of local labour demand
(proxied by male adult employment in the area of residence) on work and
schooling decisions of children aged 10-15. They find that child work tends
to be “on average” procyclical, while school enrolment is essentially
unaffected by local labour market conditions. As local labour demand
conditions improve, children are more likely to combine work and school
and are less likely to be inactive. Children respond to improvement in their
labour market prospects by increasing their supply of labour to the market
in a fashion similar to adults. Their results indicate, however, substantial
heterogeneity across age groups. Although no substantial heterogeneity
across different age groups is apparent among rural boys, it is largely older
boys who respond positively to increased labour demand in urban areas.
The reverse is true for younger children (ages 10-11) with siblings: for
them a stronger labour demand leads to a fall in labour market
19 UCW WORKING PAPER SERIES, JUNE 2011
participation. Younger children are likely to be treated differently from
older ones, who in turn behave similarly to adults. It appears that parents
want to protect their young children from child work and do so if offered
the opportunity, by shifting the burden of work from younger to older
children when local labour market conditions allow them to do so.
48. Similar effects are observed in the coffee growing areas in Brazil.
Based on data from PNAD surveys from 1992 to 1999, Kruger (2007) uses
variations in the value of coffee production to proxy changes in local
economic conditions. She concludes that child labour increases during
periods of temporary increases in local economic activity driven by positive
coffee production shocks. Again, the impact of labour market conditions on
child labour is differentiated by household income levels. Children of low
and middle income households are more likely to be employed and less
likely to be in school as a result of higher economic activity, while children
of high-income families are not affected from the same economic shock.
49. Other studies analyse separately the impact of increases in children’s
market wages on their labour supply. Using data from 1995 PNAD survey,
an earlier study by Kassouf (1998) indicates that the higher the child’s
estimated wage, the less likely the child would be in school. Moreover, the
higher the child’s estimated wage, the more likely that the child would be
employed. Similar results are found in the study of Barros et al. (2001) that
focuses on 11-to-25-year-old individuals living in urban areas of the
Northeast and Southeast regions. Data from 1996-97 PPV and 1996 PNAD
surveys allow them to compute an individual expected wage. Results from
the PNAD survey data suggest that opportunity costs to households of
sending their children to school rather than to work (or “attractiveness of
labour markets”) are closely related to lower levels of schooling. In their
study covering the urban areas of 25 Brazilian states over 12 years, Duryea
and Arends-Kuenning (2003) find that employment rates for 14-16 years
tend to be pro-cyclical and are greater during times when the wage for
unskilled labour (defined as average wage of men with less than four years
of schooling) is high than when the wage for unskilled labour is low. To
summarise, these findings from various studies clearly imply that child
labour is responsive not only to household income level but also to the
opportunities available in the labour market.
3.1.3 Child labour and shocks
50. The theoretical literature on child labour (Baland and Robinson, 2000;
Cigno and Rosati, 2005) highlights income shocks and borrowing
constraints as a source of inefficiency in the allocation of resources within
the family. Children from poor households with little access to credit
markets are less likely to be in full time school attendance and are more
likely to work when hit by economic shocks. Households in these instances
20 BRAZILIAN SUCCESS IN REDUCING CHILD LABOUR:
EMPIRIRCAL EVIDENCE AND POLICY LESSONS
appear to use child labour as a form of risk coping mechanism, helping to
buffer a transitory income shock.
51. Several empirical studies examine the effect of negative shocks to
household income on children’s work participation and school attendance
in Brazil. The question of whether economic shocks have an adverse
impact on children’s time allocation decisions is especially pertinent now,
at times of a real and financial crisis that are likely to produce large and
possibly lasting worldwide adverse impact (Fallon and Lucas, 2002;
Ferreira and Schady, 2008; Koseleci and Rosati, 2009). The current
economic and financial crisis can potentially reverse the positive trends
observed in Brazil and deepen even further the problem in some regions of
the country, like in the Northeast, where the phenomenon of child labour
has been particularly resilient. In what follows, we briefly discuss available
evidence on the effects of transitory income shocks on children’s schooling
and involvement in child labour in Brazil.
52. Taking advantage of a longitudinal employment survey (Pesquisa
Mensal de Emprego – Monthly Employment Survey) from six metropolitan
areas of Brazil for the period 1982 to 1999, Neri et al. (2005) assess the
effects of adverse shocks to household head’s occupational status
(measured by earning losses) on children’s labour participation and drop-
out probabilities. Their empirical model allows the impact of transitory
economic shocks to differ by household income status. Logistic estimates
show that following a loss of earnings by the household head, children’s
probability of drop-out and labour market entry increases in poorer
households. Children’s time allocation in higher-income households
remains, however, largely unaffected by such a shock.
53. A different estimation strategy using the same dataset is used by
Duryea, Lam and Levison (2007) that incorporate a wider range of
household characteristics. Probit regression results suggest that an
unemployment shock to the male head of household occurring during the
school year has substantial negative effects on children. These shocks
increase the probability that children enter the labour force and that they
drop out of school, and decrease the probability that they advance in
school. Shocks occurring after the end of the school year do not have
significant effects on the observed outcomes, suggesting that unobserved
household heterogeneity that may cause spurious correlations between
shocks and negative child outcome is controlled for. In the same vein,
previous research using the same data by Duryea (1998) finds that children
are less likely to advance to the next grade if their father becomes
unemployed during the school year.
3.1.4 Child labour and household characteristics
54. Empirical studies have emphasized the role of individual and household
characteristics in conjunction with family income and labour market
21 UCW WORKING PAPER SERIES, JUNE 2011
conditions in explain children’s time use decisions. There is an extensive
literature on gender issues in human capital investments and outcomes in
Brazil (among others, see Barros, Fox and Mendonca, 1997; Gustaffson-
Wright and Pyne, 2002). Gender bias in child labour and schooling might
be related to the gender of the parent who controls the distribution of child
resources, social norms, and differences in the returns to schooling and
child labour. Most theoretical work in the literature on child labour has
assumed a unitary family model (Basu, 1999; Emerson and Souza, 2006).
However, according to the intra-household allocation model, fathers and
mothers affect the education investment and the child labour participation
of their sons and daughters differently because of differences in parental
preferences or differences in how additional schooling affects sons’ and
daughters’ acquisition of human capital. Indeed, the results from Emerson
and Souza (2007) suggest that fathers’ characteristics generally have a
greater impact on decisions concerning sons while mothers’ characteristics
generally have a greater impact on decisions concerning daughters.
55. Equally interesting is the relation between siblings’ – i.e., within family
- time allocation and children’s characteristics (Edmonds, 2006). For
example, in a study of urban Brazil, Levison (1991) indicates that child
employment increases with the number of children in the family, especially
when younger and pre-school-aged children are present. She argues that
this may be due to children substituting for the mother in the labour force,
or in childcare, or both. She hypothesizes that “parents of many children
may be diversifying investments in children such that some specialize in
home production, some work in labour force, and others focus on their
education” (Levison 1991, p. 202). Emerson and Souza (2008) also point to
significant birth order effects when families are forced by poverty and/or
capital constraints to send some or all of their children to work in the labour
market. Empirical analyses from PNAD 1998 survey data show that male
and female first-born children are less likely to attend school than their later
born siblings and male last-born children are less likely to work as child
labourers than their earlier born siblings.
3.1.5 Consequences of child labour
56. The literature seems to support the view that in general child labour
impedes the acquisition of education and human capital in Brazil
(Psacharopoulos and Arriagada, 1989; French, 2002; Gunnarsson, Orazem
and Sánchez, 2005; Sedlacek, Duryea, Ilahi and Sasaki, 2005). A recent
study of Bezerra, Kassouf, and Arends-Kuenning (2009) uses school
achievement test data from the 2003 Sistema Nacional de Avaliação da
Educação Básica to analyse the impact of child labour on school
achievement. They attempt to control for the endogeneity of child labour by
instrumenting the latter with the average wage for unskilled male labour in
the state. Their estimates indicate better test results in mathematics and
22 BRAZILIAN SUCCESS IN REDUCING CHILD LABOUR:
EMPIRIRCAL EVIDENCE AND POLICY LESSONS
Portuguese for students who only study and do not work. Differences in
work conditions affect also school performance. Those students who work
in a family enterprise have higher test scores than those who work outside
the family enterprise. Nevertheless, it is important to mention that their
instrumental variables might be correlated to other unobservable
determinants of child labour, and thus not necessarily satisfying the
exclusion restriction.
57. One exception is the study of Cardoso and Verner (2007) that finds no
evidence of such a relation between children’s schooling and work
behaviour. Using the World Bank Fortaleza Survey collected in 2003 in
three neighbourhoods (Autran Nunes, Edson Queiroz and Pirambú) of
Fortaleza in the Northeast region, they show that working does not
necessarily have a detrimental effect on school attendance, dropping out of
school leading most often to inactivity. They attribute this to the lack of
work opportunities for children in this region.
58. A number of studies have shown that the overall harmful effects of
child labour might extend well beyond the childhood years in Brazil. Using
a Cox proportional hazard model to take into account censored
observations, Emerson and Souza (2003) find strong evidence of
intergenerational persistence in child labour among Brazilian families.
Children are more likely to work the younger their parents were when they
entered the labour force and the lower the educational attainment of their
parents (Table 4).
Table 4. Child labour persistence: Cox Proportional Hazard Model on number of years
Independent Variables Hazard Ratio SE
Child labourer father 1.636 0.105
Child labourer mother 1.827 0.097
Father’s schooling (years) 0.966 0.008
Mother’s schooling (years) 0.942 0.008
Notes: Regressions control for children’s characteristics (gender, place of residence), grandfather’s and grandmother’s schooling, mother’s
and father’s characteristics (labour market status, age) and family structure.
White’s heteroskedastic consistent errors are used in all regression
Source: Emerson and Souza, 2003
59. Similarly, a recent study by Emerson and Souza (2007) analyses the
lifetime earnings implications of child labour. Estimations of an earnings
model on data from 1996 PNAD data shows that people who start work at a
younger age end up with lower earnings as adults. Their results are in line
with earlier studies on the impact of early labour force participation on
23 UCW WORKING PAPER SERIES, JUNE 2011
subsequent education and health outcomes from Ilahi, Orazem and
Sedlacek (2000), Kassouf, Mckee and Mossialos (2001) and Giuffrisa,
Iunes and Savedoff (2005). Girls are found to be more adversely affected
by early labour force entry than boys; with the gender difference increasing
the earlier a child begins to work (Gustaffson-Wright and Pyne, 2002).
3.1.6 Understanding child labour trends in Brazil
60. As highlighted in an earlier World Bank report (2001b), household level
data of both urban and rural Brazil shows a declining trend in the incidence
of child labour aged 10 to 14 since the mid 1990s. Despite this clear
evidence, there is still no consensus on the determinants of this decline.
Brazil experienced a sustained economic growth rate during the 1990s after
the stagnation of the 1980s. Therefore, increases in family income might
have increased children’s schooling and decreased child labour. Moreover,
many changes in educational policy were implemented during the 1990s
which might also increase school quality. Furthermore several social
protection policies (like Bolsa Escola/Familia programmes) have been
promoted since mid 1990s. In what follows, we briefly review the
conclusions of some studies aiming to explain child labour and school
attendance trends in Brazil.
61. Ferro and Kassouf (2005b) aim to analyse whether the legislation
restricting the employment of child labour contributed to the decline in the
percentage of working children aged 14 and 15 years. In 1998 the child
labour legislation restricted the employment to minors under 16 instead of
14. Probit estimates based on pooled cross-sectional PNAD data from 1995
to 2003 show a statistically significant effect of the change in legislation on
child labour for both boys and girls in both urban and rural areas. The
legislative change contributed to a decrease in the fraction of teenagers
working in the labour market, although it did not eliminate child labour.
62. A recent study by Santos and Souza (2007) investigates the causes of
improved education indicators and child labour outcomes by using Brazil’s
monthly longitudinal employment survey (Pesquisa Mensal de Emprego –
Monthly Employment Survey) from 1984 to 2001. Specifically, they test
the role of changes in family background (increase in parents’ schooling),
changes of child labour market and changes in educational indicators (as
measured by the average schooling of public school teachers). Multinomial
logit estimations and decompositions techniques suggest that changes in
child employment and school attendance over the 1990s are largely
explained by changes in observable characteristics rather than changes in
unobservable characteristics. Moreover, the phenomenon seems to be more
associated to changes in educational variables (such as the increase in the
level of schooling of public school teachers) and changes in the family
background (increase in parental schooling). These results suggest that
24 BRAZILIAN SUCCESS IN REDUCING CHILD LABOUR:
EMPIRIRCAL EVIDENCE AND POLICY LESSONS
educational policies that try to combat school drop-out have played an
important role.
63. Using data from the 1980, 1991 and 2000 population censuses,
Manacorda and Rosati (2009) investigate the role of changes in the industry
mix in explaining the declining trend of children’s work across Brazilian
states. The authors show that Brazilian children appear to enjoy a
comparative advantage in specific productions, implying that differences in
industrial mix have the potential to explain part of the differential variation
in the incidence of child labour across states. If children are concentrated in
low productivity industries with obsolete production technologies, changes
in the industry mix driven by technological change or shifts in consumers’
preferences can be a major force behind the fall in child labour. They find
that changes in the industry mix are able to account for a significant share
of the differential trends in child employment across Brazilian states. As
child intensive industries decline, child labour falls, suggesting that
household do not fully readjust their children’s labour supply through
endogenous occupational choices. Moreover, the results of the study
indicate that within industry differences in employment are the most
important factor in explaining the large decline in child labour. These
differences might arise from changes in the supply of child labour induced
by changes in living standards and policy interventions. In this context,
governmental efforts to increase school attendance and eliminate child
labour through school promotion programmes might have played some role
in explaining the observed fall in child labour.
64. Results from the above mentioned studies show that educational
policies and the adoption of local and federal policies aimed specifically at
promoting school attendance and curbing child labour might have a
relevant impact on children’s time allocation decisions. Next section
reviews the main conclusions of these studies investigating the role of
CCTs on children’s schooling and work behaviour in Brazil.
3.2 Impact of conditional cash transfer programmes
65. This section presents the main conclusions of some of the CCT
programmes’ evaluations that have been conducted in Brazil. Section 3.2.1
discusses the main conclusions of studies assessing the impact of the Bolsa
Escola/Familia programme while Section 3.2.2 makes use of evaluations of
the other CCT program, PETI, which has the specific objective of reducing
child labour.
3.2.1 Impact of Bolsa Escola/Familia programmes
66. Bolsa Escola was first conceived in the Federal District of Brasilia and
gradually extended to other cities (e.g. Recife), before being scaled up to
25 UCW WORKING PAPER SERIES, JUNE 2011
the national level (see section 2.2). A large number of evaluations have
estimated the impact of the programmes on a range of outcomes. The
findings are broadly positive. World Bank (2009) shows that although the
impacts of Bolsa Escola on the headpoverty and the poverty gap are
modest, the programme reduces substantially the squared poverty gap.
Similarly, Paes de Barros, Foguel and Ulyssea (2006) suggest that there is a
strong link between the introduction of Bolsa Familia and the fall in
inequality in Brazil.
67. There are several studies conducted to analyse the impact of these
earlier programmes on children’s school attendance and labour market
participation. The available evidence points to improved educational
outcomes though the evidence of an impact on child labour remains
inconclusive. For instance, Abramovay et al. (1998) find that dropout rates
are 7 percentage points lower for beneficiary children than for non-
beneficiary children in the Federal District of Brasilia. An earlier evaluation
by the World Bank (2001b) provides also preliminary evidence from the
Bolsa Escola programme in the Federal District of Brasilia using household
data from the 1996 PNAD survey. A simple comparison of beneficiaries
and non-beneficiaries indicates that i) school attendance is higher and drop-
out rates are lower for beneficiaries, ii) children in beneficiary household
exhibit a higher promotion rate and iii) a larger proportion of beneficiary
children enter the school system at the right age compared to non non-
beneficiary children. Despite these improvements in education outcomes,
there is little evidence of a reduction in child labour. In a similar vein,
Aguiar and Araújo (2002) show that dropout rates are lower among
beneficiaries in 1996 compared to non-beneficiaries in the city of Recife
but Lavinas, Barbosa and Tourinho (2001) find no significant impact on the
programme on child labour. However, it is worth mentioning that these
earlier studies have two limitations. First, they ignore pre-program
differences in child labour between beneficiaries and non-beneficiaries.
Second, some of them are conducted in the capital city, a relatively wealthy
area that is not representative of the entire country.
68. A recent ex-ante study simulates the impact of nationwide Bolsa
Escola/Familia programme on children’s school enrolment and labour
participation. Bourguignon et al. (2003) analyse Brazilian household survey
data collected in 1999 to run a multinomial logit estimate of household
behaviour that is then used to simulate the future impact of the Bolsa
Escola programme. They estimate that about 40 percent of 10 to 15 year-
olds currently not enrolled in school would receive enough incentive from
the programme to enrol (Table 5). Among them, more than one-third would
enrol in school remaining employed outside the household. The other two-
thirds would not work anymore outside the household. The program would
reduce the proportion of 10 to 15 year-olds outside school from 6.0 percent
to 3.7 percent. Among poor households the impact is even more
pronounced. Their simulation suggests that the programme would increase
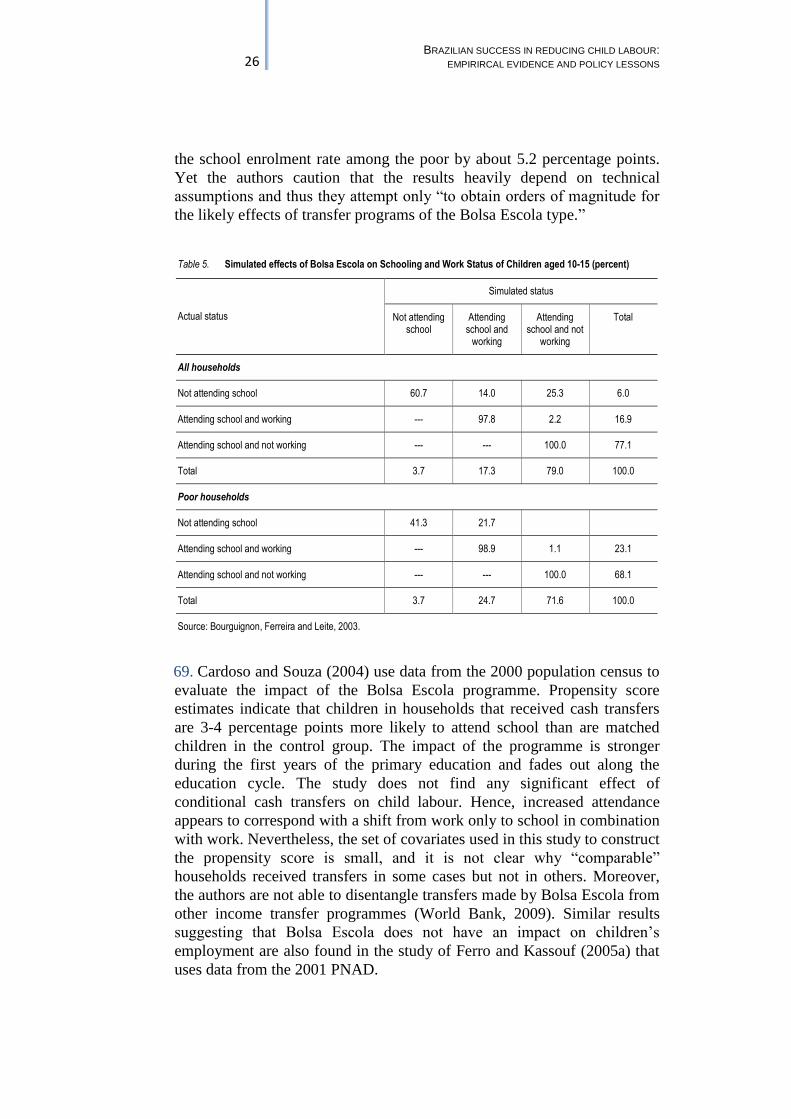
26 BRAZILIAN SUCCESS IN REDUCING CHILD LABOUR:
EMPIRIRCAL EVIDENCE AND POLICY LESSONS
the school enrolment rate among the poor by about 5.2 percentage points.
Yet the authors caution that the results heavily depend on technical
assumptions and thus they attempt only “to obtain orders of magnitude for
the likely effects of transfer programs of the Bolsa Escola type.”
Table 5. Simulated effects of Bolsa Escola on Schooling and Work Status of Children aged 10-15 (percent)
Actual status
Simulated status
Not attending school
Attending school and
working
Attending school and not
working
Total
All households
Not attending school 60.7 14.0 25.3 6.0
Attending school and working --- 97.8 2.2 16.9
Attending school and not working --- --- 100.0 77.1
Total 3.7 17.3 79.0 100.0
Poor households
Not attending school 41.3 21.7
Attending school and working --- 98.9 1.1 23.1
Attending school and not working --- --- 100.0 68.1
Total 3.7 24.7 71.6 100.0
Source: Bourguignon, Ferreira and Leite, 2003.
69. Cardoso and Souza (2004) use data from the 2000 population census to
evaluate the impact of the Bolsa Escola programme. Propensity score
estimates indicate that children in households that received cash transfers
are 3-4 percentage points more likely to attend school than are matched
children in the control group. The impact of the programme is stronger
during the first years of the primary education and fades out along the
education cycle. The study does not find any significant effect of
conditional cash transfers on child labour. Hence, increased attendance
appears to correspond with a shift from work only to school in combination
with work. Nevertheless, the set of covariates used in this study to construct
the propensity score is small, and it is not clear why “comparable”
households received transfers in some cases but not in others. Moreover,
the authors are not able to disentangle transfers made by Bolsa Escola from
other income transfer programmes (World Bank, 2009). Similar results
suggesting that Bolsa Escola does not have an impact on children’s
employment are also found in the study of Ferro and Kassouf (2005a) that
uses data from the 2001 PNAD.
27 UCW WORKING PAPER SERIES, JUNE 2011
70. There are also a number of complementary analyzing the efficiency of
Bolsa Escola’s. Souza (2006) extends Cardoso and Souza’s (2004) earlier
study and finds a significant positive impact of the programme on school
progression and on the extra years of schooling. These results raise the
question of the programme’s efficiency as most of school age children
(even those from poor households) attend school regardless of the transfer.
Impacts of the transfers seem to vary across ages and years of schooling
completed. These results suggest calibrating the rules according to age and
grade might help to improve the efficiency of the programme.
71. Based on a survey of 260 municipalities in four states of the Northeast
region, de Janvry, Finan and Sadoulet (2008) attempt to identify
programme efficiency at the municipal level to establish the municipal
correlates that matter for school performance. Based on a double-difference
method, their analysis shows that Bolsa Escola Federal has a strong overall
impact on beneficiary school attendance, reducing drop-out rates by 8
percentage points. However this study goes beyond the impact evaluation
of the programme. It points out that a number of municipal features and
programme implementation practices are strongly related to differences in
levels of impact of the programme on drop-out rates. Bolsa Escola is
decentralized at the municipal level, with local authorities in charge of
beneficiary identification and program implementation. There seems to be
considerable heterogeneity in the quality of implementation across local
governments (de Janvry et al., 2005). The findings of de Janvry, Finan and
Sadoulet (2008) indicate that a more transparent beneficiary identification
and selection process is associated with higher impact and that expected
electoral rewards for incumbent mayors are associated with larger impacts.
Stricter enforcement of the conditionality is also associated with a higher
level of impact on the drop-out rate.
72. Most of the above-mentioned studies on Bolsa Escola tend to suggest
that conditional cash transfer programmes in Brazil are less effective at
reducing child labour than they are at increasing schooling. These ex-post
evaluations, however, use data from the 2000 population census and the
2001 PNAD survey, which coincides with the widespread implementation
of Bolsa Escola. Hence, there is a need for new research to analyse the
impact of the program after several years have passed. Another caveat is
that in the 2001 PNAD survey, individuals are asked whether they were
“signed-up” or “beneficiaries of” a conditional cash transfer program. Thus,
studies using 2001 PNAD data may have considered as “treated”
households who were not actually receiving the benefit, although
admittedly this variable might help estimate and intent-to-treat effect.
73. Ferro, Kassouf and Levison (2007) and Ferro and Nicollela (2007) use
data from the 2003 PNAD survey to measure the impact of Bolsa Escola on
children’s labour force participation. This survey contains two specific
questions on CCT programme participation: one for whether families were
signed-up for any of the existing programmes at the time of the survey, and
28 BRAZILIAN SUCCESS IN REDUCING CHILD LABOUR:
EMPIRIRCAL EVIDENCE AND POLICY LESSONS
another for whether they were already receiving the programme transfer.
This information allows these studies to create a treatment group (those
receiving the benefits) and a control group (those enrolled but still not
receiving the benefits). Both studies argue that beneficiaries may be
compared with eligible signed-up families who are not yet getting the
benefits (i.e. these individuals have the same propensity to participate and
are eligible). Unlike earlier studies, their probit regressions and propensity
score matching methods show that Bolsa Escola reduces the probability of
work for children aged 6-15 in both urban and rural areas. As for number of
hours worked, the results from Heckman two-step estimations indicate a
negative effect of the programme, though not significant.
74. Studies analysed in this section show that while Bolsa Escola might
have had a positive impact on school attendance, its effect on child labour
remains to be determined. The common explanation given in the studies is
that the programme does not offer enough monetary incentives to deter
children’s participation in the labour market. These cash transfer
programmes need to be complemented with measures that include and
after-school component. Further elimination of child labour depends on
more specific programmes targeted at particular groups and economic
sector. The next section presents evidence on the impact of such a
programme, namely PETI, on child labour incidence in Brazil.
3.2.2 Impact of PETI programme
75. The objective of the PETI programme is to eradicate the worst forms of
child labour by providing cash grants to families with children of school-
going age (7 to 15) and by requiring that children attend school and after-
school activities. The program evaluation assesses this objective by looking
into indicators such as child participation in the labour force, number of
hours worked and employment in risky activities. PETI was first
implemented only in a few municipalities in the state of Pernambuco, and
later expanded to other states including Bahia and Sergipe. The evaluation
was planned after the program started and it was not possible to randomly
allocate municipalities into treatment and control groups. Instead, the
treatment group was composed of three participating municipalities in
separate states, and the comparison group of three similar municipalities
not in the program (Rawlings and Rubio, 2005).
76. Comparing data on children from PETI municipalities and children in a
matched set of control municipalities, Yap et al (2001) show that as a result
of participating in programme, the probability of working fell between 4-7
percentage points in Pernambuco, close to 13 percentage points in Sergipe
and nearly 26 percentage points in Bahia which has the highest child labour
force participation rate. Moreover, PETI also decreased the probability of
children working in hazardous activities. Nonetheless the program was less
successful in reducing the probability of working 10 hours or more. PETI
29 UCW WORKING PAPER SERIES, JUNE 2011
appears to succeed better with part-time child workers than with those who
work longer hours. Another interesting result is that even though the after-
school program was available to all households in PETI municipalities,
only children in households that received the cash transfer spent
significantly more time in school. This suggests that demand incentives
may have a relevant role in accelerating behavioural changes.
77. World Bank (2001b) offers a positive preliminary evaluation of PETI.
The qualitative assessments demonstrate that the program has been
successful in achieving its objectives of reducing rates of child labour.
Pianto and Soares (2003) use the PNAD survey and find that PETI reduced
child labour and increased schooling between 1997 and 1999. They use two
different methodologies: they measure the change from a baseline level in
municipalities where PETI was introduced and they also match
municipalities to form a comparison group. They find that PETI has a
significant role in reducing child labour. This estimated impact is robust to
a difference in difference analysis.
30 BRAZILIAN SUCCESS IN REDUCING CHILD LABOUR:
EMPIRIRCAL EVIDENCE AND POLICY LESSONS
4. CHILDREN’S INVOLVEMENT IN EMPLOYMENT AND SCHOOLING
78. This section uses micro data to examine children’s time use patterns in
Brazil, focusing in particular on the extent of children’s involvement in
employment and schooling. The analysis in this section is based on data
from the 2008 Brazilian National Household Survey (PNAD) designed to
study a variety of socio-economic characteristics. The survey contains a
rich array of information on children’s work activities and schooling,
together with information on a number of individual and household
characteristics.
79. PNAD is run annually (with the exception of 1994 and 2000) and is
representative of the entire Brazil, with the exception of the rural North
between 1992 and 2003. Consistently throughout the period, the survey
collect detailed individual and household socio economic characteristics as
well as information on work and education.
80. Labour market data are available for individuals aged 5 and above. The
data include information on involvement in employment and hours ofwork
in the week preceding the survey. Employment refers to both paid and
unpaid (family or non family) work but excludes household chores. Data on
labour earnings are only available for paid workers, a minority of working
children especially in rural areas.
81. . Labour market data are available for individuals aged 5 and older with
the exception of 1996 and 1997 (when these data only refer to individuals
aged 10 or more). We use data for previous surveys in the next section.
4.1 Involvement in employment
82. Children’s involvement in employment6 is not uncommon in Brazil.
Almost seven percent of children aged 7-15 years, some 2.1 million
children in absolute terms, were in employment in 2008. At the same time,
school attendance was high – 97 percent of children from the 7-15 years
age group attended school in 2008.
83. Brazil appears to have recently achieved remarkable success in reducing
the numbers of children in employment. The incidence of child work
(children’s in employment) fell from 18 per cent in 1992 to 7 per cent in
2009. This decline was mirrored by a large increase in the fraction of
children attending school over the same period (from 85 to 97
percent).Children’s employment and schooling trends are discussed in more
detail in Section 5.
6 Children in employment is a broad concept covering all market production and certain types of non-
market production (principally the production of goods for own use). It includes forms of work in both the formal and informal sectors, as well as forms of work both inside and outside family settings.
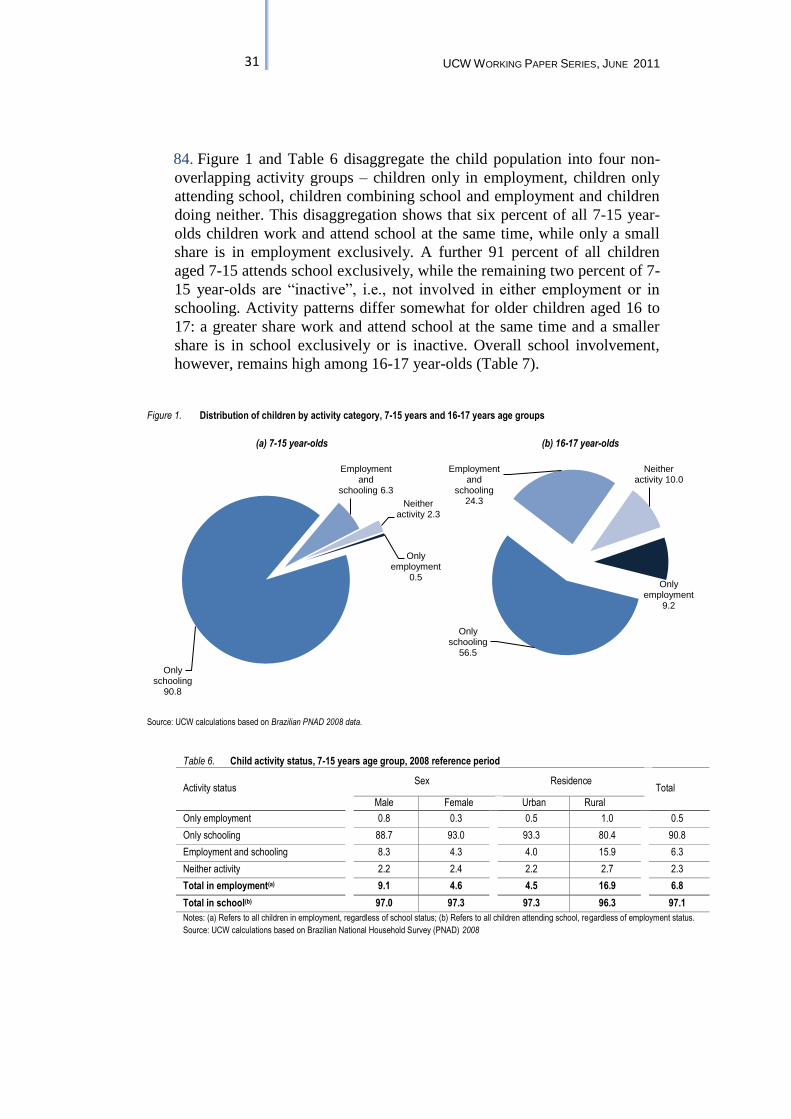
31 UCW WORKING PAPER SERIES, JUNE 2011
84. Figure 1 and Table 6 disaggregate the child population into four non-
overlapping activity groups – children only in employment, children only
attending school, children combining school and employment and children
doing neither. This disaggregation shows that six percent of all 7-15 year-
olds children work and attend school at the same time, while only a small
share is in employment exclusively. A further 91 percent of all children
aged 7-15 attends school exclusively, while the remaining two percent of 7-
15 year-olds are “inactive”, i.e., not involved in either employment or in
schooling. Activity patterns differ somewhat for older children aged 16 to
17: a greater share work and attend school at the same time and a smaller
share is in school exclusively or is inactive. Overall school involvement,
however, remains high among 16-17 year-olds (Table 7).
Figure 1. Distribution of children by activity category, 7-15 years and 16-17 years age groups
(a) 7-15 year-olds (b) 16-17 year-olds
Source: UCW calculations based on Brazilian PNAD 2008 data.
Table 6. Child activity status, 7-15 years age group, 2008 reference period
Activity status Sex Residence
Total
Male Female Urban Rural
Only employment 0.8 0.3 0.5 1.0 0.5
Only schooling 88.7 93.0 93.3 80.4 90.8
Employment and schooling 8.3 4.3 4.0 15.9 6.3
Neither activity 2.2 2.4 2.2 2.7 2.3
Total in employment(a) 9.1 4.6 4.5 16.9 6.8
Total in school(b) 97.0 97.3 97.3 96.3 97.1
Notes: (a) Refers to all children in employment, regardless of school status; (b) Refers to all children attending school, regardless of employment status.
Source: UCW calculations based on Brazilian National Household Survey (PNAD) 2008
Only employment
0.5
Only schooling
90.8
Employment and
schooling 6.3
Neither activity 2.3
Only employment
9.2
Only schooling
56.5
Employment and
schooling 24.3
Neither activity 10.0
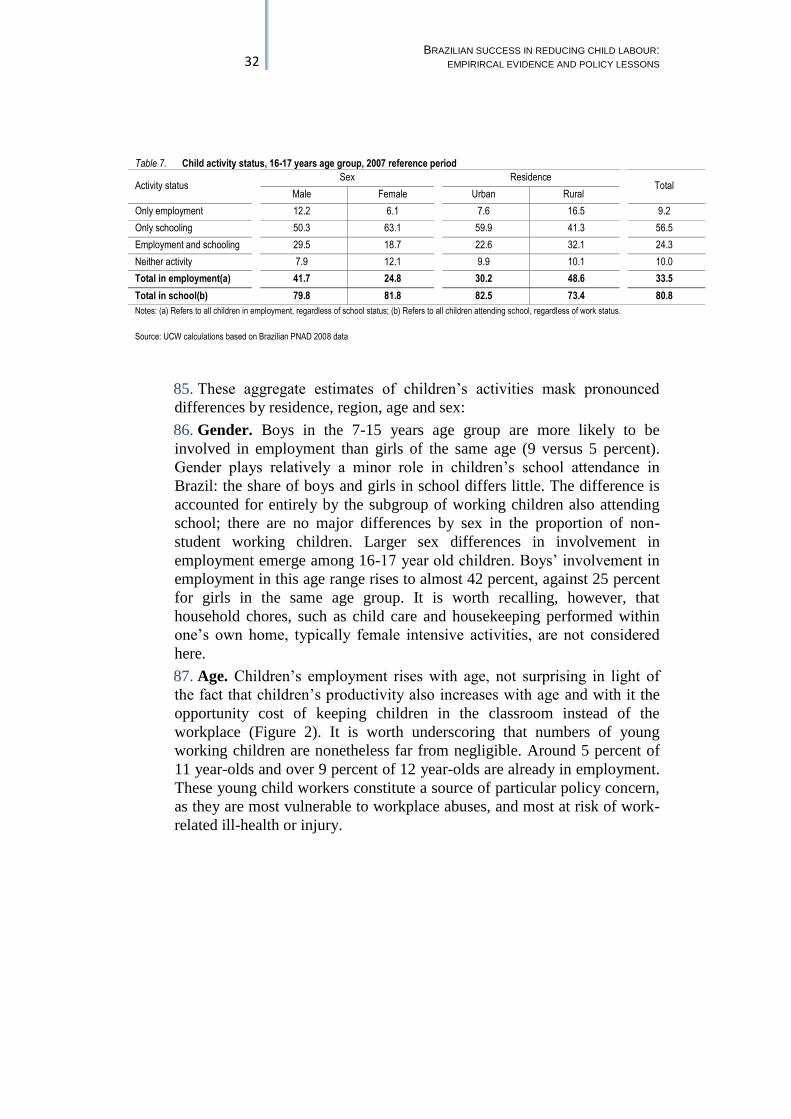
32 BRAZILIAN SUCCESS IN REDUCING CHILD LABOUR:
EMPIRIRCAL EVIDENCE AND POLICY LESSONS
Table 7. Child activity status, 16-17 years age group, 2007 reference period
Activity status Sex Residence
Total Male Female Urban Rural
Only employment 12.2 6.1 7.6 16.5 9.2
Only schooling 50.3 63.1 59.9 41.3 56.5
Employment and schooling 29.5 18.7 22.6 32.1 24.3
Neither activity 7.9 12.1 9.9 10.1 10.0
Total in employment(a) 41.7 24.8 30.2 48.6 33.5
Total in school(b) 79.8 81.8 82.5 73.4 80.8
Notes: (a) Refers to all children in employment, regardless of school status; (b) Refers to all children attending school, regardless of work status.
Source: UCW calculations based on Brazilian PNAD 2008 data
85. These aggregate estimates of children’s activities mask pronounced
differences by residence, region, age and sex:
86. Gender. Boys in the 7-15 years age group are more likely to be
involved in employment than girls of the same age (9 versus 5 percent).
Gender plays relatively a minor role in children’s school attendance in
Brazil: the share of boys and girls in school differs little. The difference is
accounted for entirely by the subgroup of working children also attending
school; there are no major differences by sex in the proportion of non-
student working children. Larger sex differences in involvement in
employment emerge among 16-17 year old children. Boys’ involvement in
employment in this age range rises to almost 42 percent, against 25 percent
for girls in the same age group. It is worth recalling, however, that
household chores, such as child care and housekeeping performed within
one’s own home, typically female intensive activities, are not considered
here.
87. Age. Children’s employment rises with age, not surprising in light of
the fact that children’s productivity also increases with age and with it the
opportunity cost of keeping children in the classroom instead of the
workplace (Figure 2). It is worth underscoring that numbers of young
working children are nonetheless far from negligible. Around 5 percent of
11 year-olds and over 9 percent of 12 year-olds are already in employment.
These young child workers constitute a source of particular policy concern,
as they are most vulnerable to workplace abuses, and most at risk of work-
related ill-health or injury.
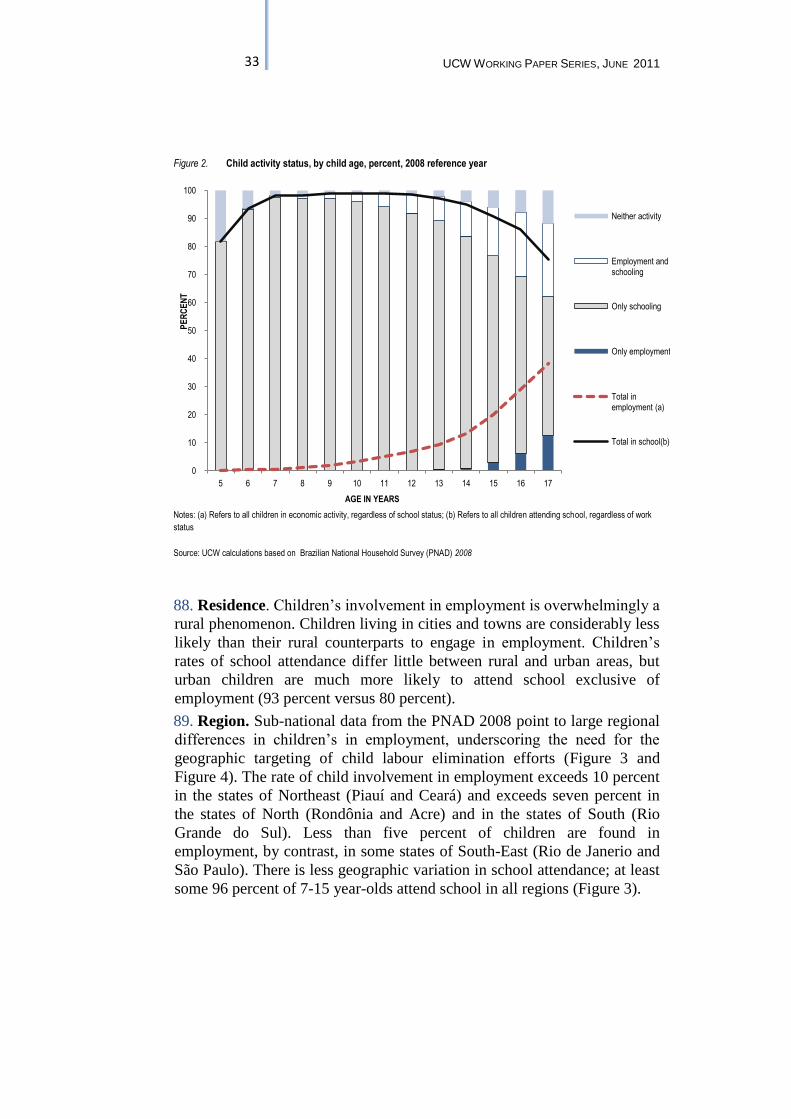
33 UCW WORKING PAPER SERIES, JUNE 2011
88. Residence. Children’s involvement in employment is overwhelmingly a
rural phenomenon. Children living in cities and towns are considerably less
likely than their rural counterparts to engage in employment. Children’s
rates of school attendance differ little between rural and urban areas, but
urban children are much more likely to attend school exclusive of
employment (93 percent versus 80 percent).
89. Region. Sub-national data from the PNAD 2008 point to large regional
differences in children’s in employment, underscoring the need for the
geographic targeting of child labour elimination efforts (Figure 3 and
Figure 4). The rate of child involvement in employment exceeds 10 percent
in the states of Northeast (Piauí and Ceará) and exceeds seven percent in
the states of North (Rondônia and Acre) and in the states of South (Rio
Grande do Sul). Less than five percent of children are found in
employment, by contrast, in some states of South-East (Rio de Janerio and
São Paulo). There is less geographic variation in school attendance; at least
some 96 percent of 7-15 year-olds attend school in all regions (Figure 3).
Figure 2. Child activity status, by child age, percent, 2008 reference year
Notes: (a) Refers to all children in economic activity, regardless of school status; (b) Refers to all children attending school, regardless of work
status
Source: UCW calculations based on Brazilian National Household Survey (PNAD) 2008
0
10
20
30
40
50
60
70
80
90
100
5 6 7 8 9 10 11 12 13 14 15 16 17
PE
RC
EN
T
AGE IN YEARS
Neither activity
Employment and schooling
Only schooling
Only employment
Total in employment (a)
Total in school(b)
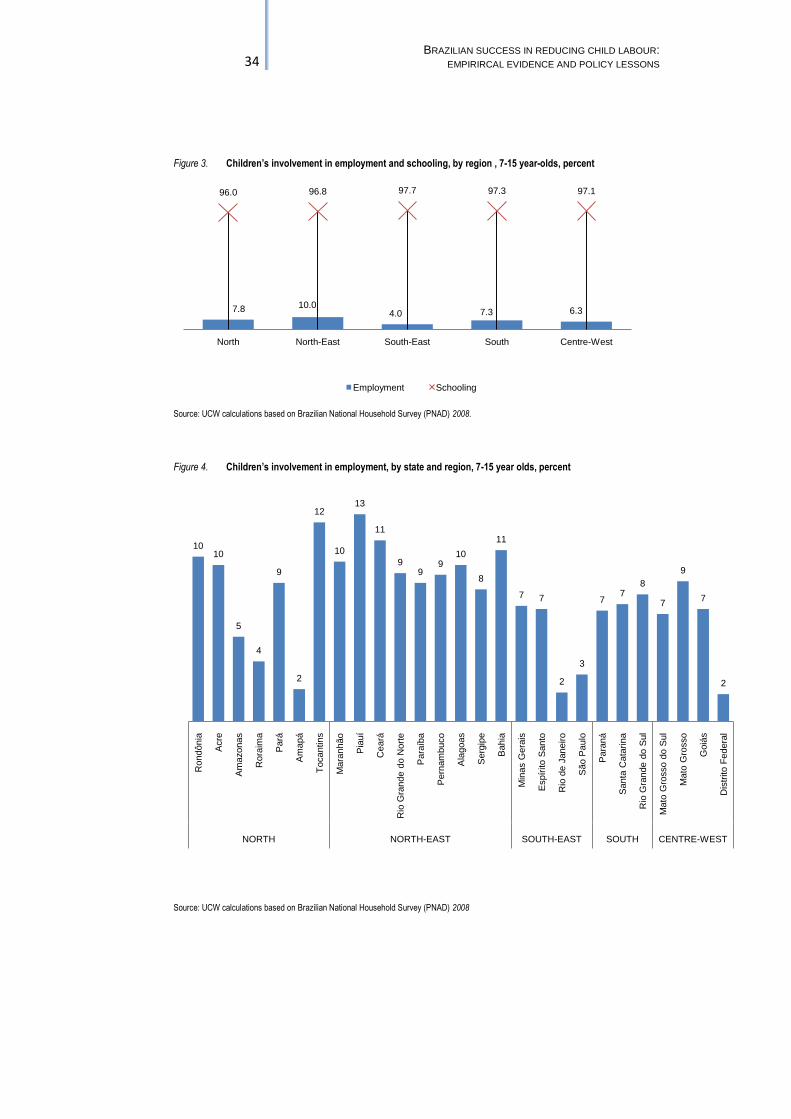
34 BRAZILIAN SUCCESS IN REDUCING CHILD LABOUR:
EMPIRIRCAL EVIDENCE AND POLICY LESSONS
Figure 3. Children’s involvement in employment and schooling, by region , 7-15 year-olds, percent
Source: UCW calculations based on Brazilian National Household Survey (PNAD) 2008.
Figure 4. Children’s involvement in employment, by state and region, 7-15 year olds, percent
Source: UCW calculations based on Brazilian National Household Survey (PNAD) 2008
7.8 10.04.0 7.3 6.3
96.0 96.8 97.7 97.3 97.1
North North-East South-East South Centre-West
Employment Schooling
1010
5
4
9
2
12
10
13
11
99
910
8
11
7 7
2
3
77
8
7
9
7
2
Rondônia
Acre
Am
azonas
Rora
ima
Pará
Am
apá
Tocantins
Mara
nhão
Pia
uí
Ceará
Rio
Gra
nde d
o N
ort
e
Para
íba
Pern
am
buco
Ala
goas
Serg
ipe
Bahia
Min
as G
era
is
Espír
ito S
anto
Rio
de J
aneiro
São P
aulo
Para
ná
Santa
Cata
rina
Rio
Gra
nde d
o S
ul
Mato
Gro
sso d
o S
ul
Mato
Gro
sso
Goiá
s
Dis
trito F
edera
l
NORTH NORTH-EAST SOUTH-EAST SOUTH CENTRE-WEST
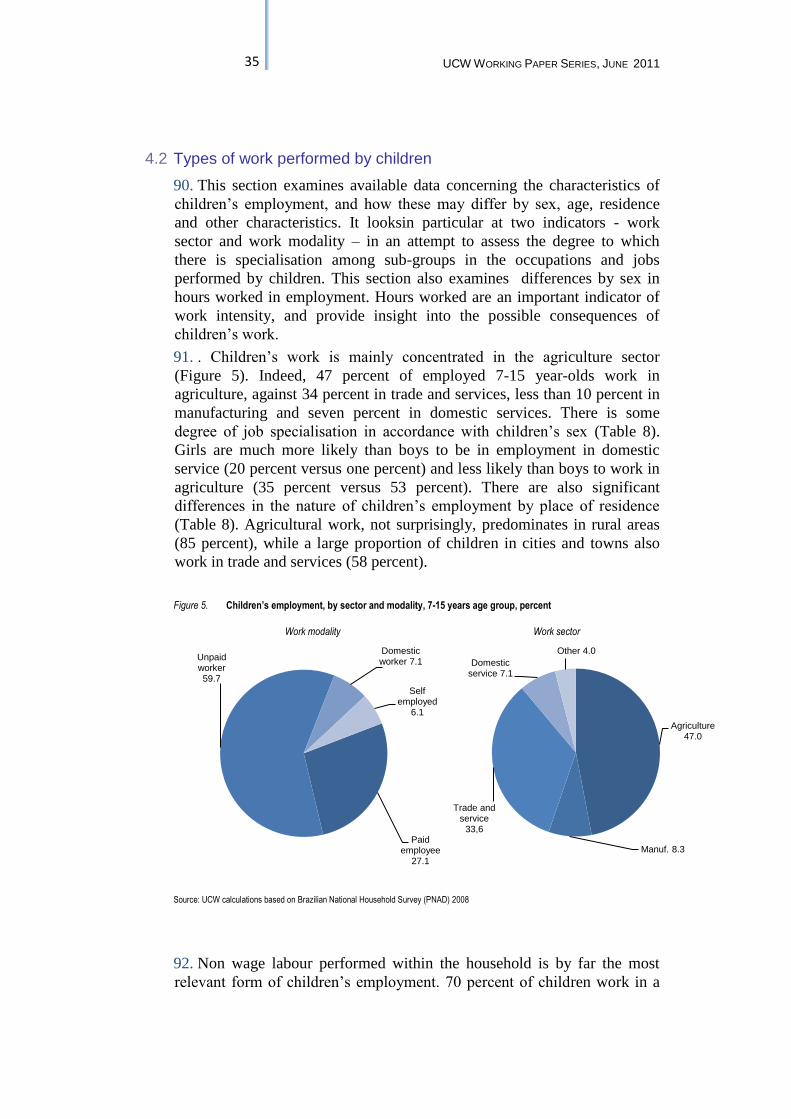
35 UCW WORKING PAPER SERIES, JUNE 2011
4.2 Types of work performed by children
90. This section examines available data concerning the characteristics of
children’s employment, and how these may differ by sex, age, residence
and other characteristics. It looksin particular at two indicators - work
sector and work modality – in an attempt to assess the degree to which
there is specialisation among sub-groups in the occupations and jobs
performed by children. This section also examines differences by sex in
hours worked in employment. Hours worked are an important indicator of
work intensity, and provide insight into the possible consequences of
children’s work.
91. . Children’s work is mainly concentrated in the agriculture sector
(Figure 5). Indeed, 47 percent of employed 7-15 year-olds work in
agriculture, against 34 percent in trade and services, less than 10 percent in
manufacturing and seven percent in domestic services. There is some
degree of job specialisation in accordance with children’s sex (Table 8).
Girls are much more likely than boys to be in employment in domestic
service (20 percent versus one percent) and less likely than boys to work in
agriculture (35 percent versus 53 percent). There are also significant
differences in the nature of children’s employment by place of residence
(Table 8). Agricultural work, not surprisingly, predominates in rural areas
(85 percent), while a large proportion of children in cities and towns also
work in trade and services (58 percent).
Figure 5. Children’s employment, by sector and modality, 7-15 years age group, percent
Work modality Work sector
Source: UCW calculations based on Brazilian National Household Survey (PNAD) 2008
92. Non wage labour performed within the household is by far the most
relevant form of children’s employment. 70 percent of children work in a
Paid employee
27.1
Unpaid worker 59.7
Domestic worker 7.1
Self employed
6.1
Agriculture 47.0
Manuf. 8.3
Trade and service
33,6
Domestic service 7.1
Other 4.0
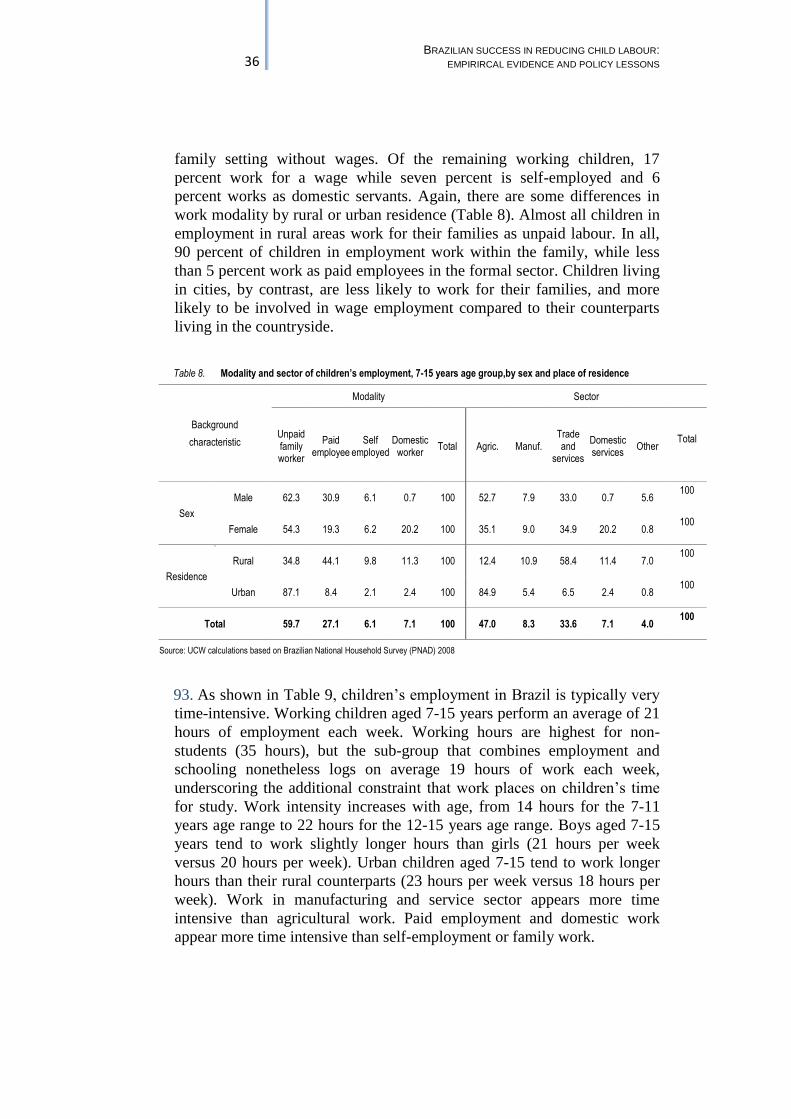
36 BRAZILIAN SUCCESS IN REDUCING CHILD LABOUR:
EMPIRIRCAL EVIDENCE AND POLICY LESSONS
family setting without wages. Of the remaining working children, 17
percent work for a wage while seven percent is self-employed and 6
percent works as domestic servants. Again, there are some differences in
work modality by rural or urban residence (Table 8). Almost all children in
employment in rural areas work for their families as unpaid labour. In all,
90 percent of children in employment work within the family, while less
than 5 percent work as paid employees in the formal sector. Children living
in cities, by contrast, are less likely to work for their families, and more
likely to be involved in wage employment compared to their counterparts
living in the countryside.
Table 8. Modality and sector of children’s employment, 7-15 years age group,by sex and place of residence
Background
characteristic
Modality Sector
Unpaid family worker
Paid employee
Self employed
Domestic worker
Total Agric. Manuf. Trade and
services
Domestic services
Other Total
Sex
Male 62.3 30.9 6.1 0.7 100 52.7 7.9 33.0 0.7 5.6 100
Female 54.3 19.3 6.2 20.2 100 35.1 9.0 34.9 20.2 0.8 100
Residence
Rural 34.8 44.1 9.8 11.3 100 12.4 10.9 58.4 11.4 7.0 100
Urban 87.1 8.4 2.1 2.4 100 84.9 5.4 6.5 2.4 0.8 100
Total 59.7 27.1 6.1 7.1 100 47.0 8.3 33.6 7.1 4.0 100
Source: UCW calculations based on Brazilian National Household Survey (PNAD) 2008
93. As shown in Table 9, children’s employment in Brazil is typically very
time-intensive. Working children aged 7-15 years perform an average of 21
hours of employment each week. Working hours are highest for non-
students (35 hours), but the sub-group that combines employment and
schooling nonetheless logs on average 19 hours of work each week,
underscoring the additional constraint that work places on children’s time
for study. Work intensity increases with age, from 14 hours for the 7-11
years age range to 22 hours for the 12-15 years age range. Boys aged 7-15
years tend to work slightly longer hours than girls (21 hours per week
versus 20 hours per week). Urban children aged 7-15 tend to work longer
hours than their rural counterparts (23 hours per week versus 18 hours per
week). Work in manufacturing and service sector appears more time
intensive than agricultural work. Paid employment and domestic work
appear more time intensive than self-employment or family work.
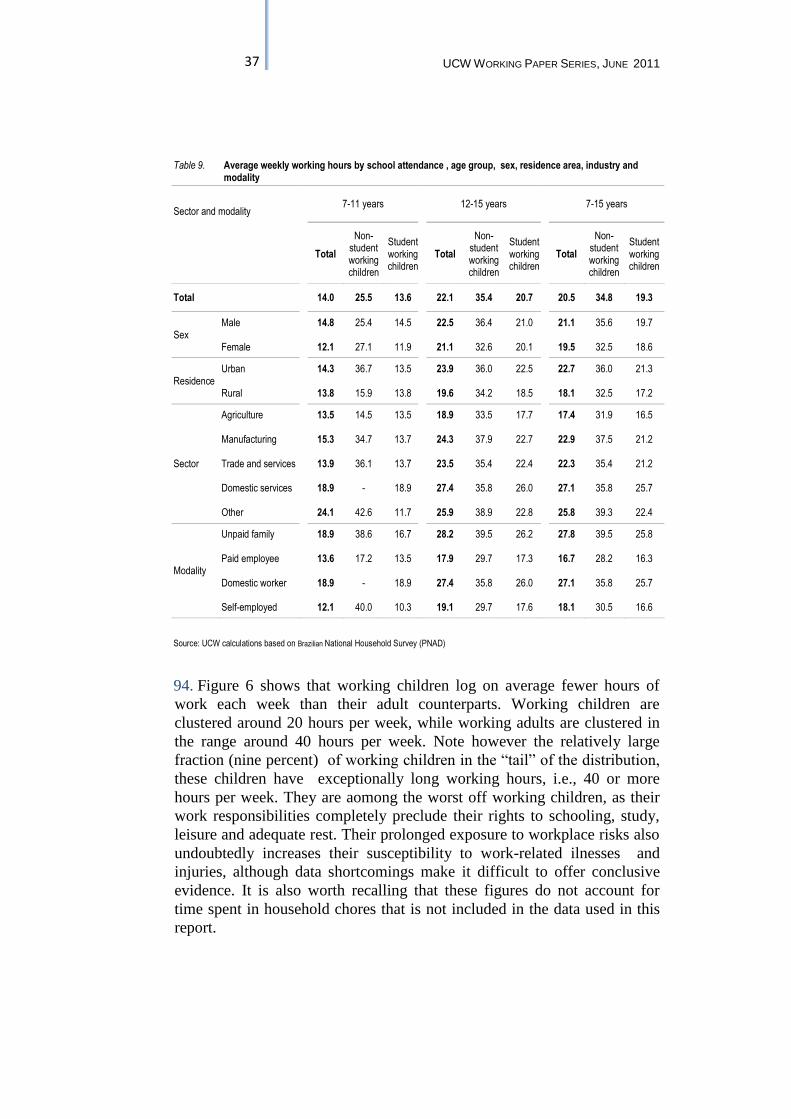
37 UCW WORKING PAPER SERIES, JUNE 2011
Table 9. Average weekly working hours by school attendance , age group, sex, residence area, industry and modality
Sector and modality 7-11 years 12-15 years 7-15 years
Total
Non-student working children
Student working children
Total
Non-student working children
Student working children
Total
Non-student working children
Student working children
Total 14.0 25.5 13.6 22.1 35.4 20.7 20.5 34.8 19.3
Sex Male 14.8 25.4 14.5 22.5 36.4 21.0 21.1 35.6 19.7
Female 12.1 27.1 11.9 21.1 32.6 20.1 19.5 32.5 18.6
Residence Urban 14.3 36.7 13.5 23.9 36.0 22.5 22.7 36.0 21.3
Rural 13.8 15.9 13.8 19.6 34.2 18.5 18.1 32.5 17.2
Sector
Agriculture 13.5 14.5 13.5 18.9 33.5 17.7 17.4 31.9 16.5
Manufacturing 15.3 34.7 13.7 24.3 37.9 22.7 22.9 37.5 21.2
Trade and services 13.9 36.1 13.7 23.5 35.4 22.4 22.3 35.4 21.2
Domestic services 18.9 - 18.9 27.4 35.8 26.0 27.1 35.8 25.7
Other 24.1 42.6 11.7 25.9 38.9 22.8 25.8 39.3 22.4
Modality
Unpaid family 18.9 38.6 16.7 28.2 39.5 26.2 27.8 39.5 25.8
Paid employee 13.6 17.2 13.5 17.9 29.7 17.3 16.7 28.2 16.3
Domestic worker 18.9 - 18.9 27.4 35.8 26.0 27.1 35.8 25.7
Self-employed 12.1 40.0 10.3 19.1 29.7 17.6 18.1 30.5 16.6
Source: UCW calculations based on Brazilian National Household Survey (PNAD)
94. Figure 6 shows that working children log on average fewer hours of
work each week than their adult counterparts. Working children are
clustered around 20 hours per week, while working adults are clustered in
the range around 40 hours per week. Note however the relatively large
fraction (nine percent) of working children in the “tail” of the distribution,
these children have exceptionally long working hours, i.e., 40 or more
hours per week. They are aomong the worst off working children, as their
work responsibilities completely preclude their rights to schooling, study,
leisure and adequate rest. Their prolonged exposure to workplace risks also
undoubtedly increases their susceptibility to work-related ilnesses and
injuries, although data shortcomings make it difficult to offer conclusive
evidence. It is also worth recalling that these figures do not account for
time spent in household chores that is not included in the data used in this
report.
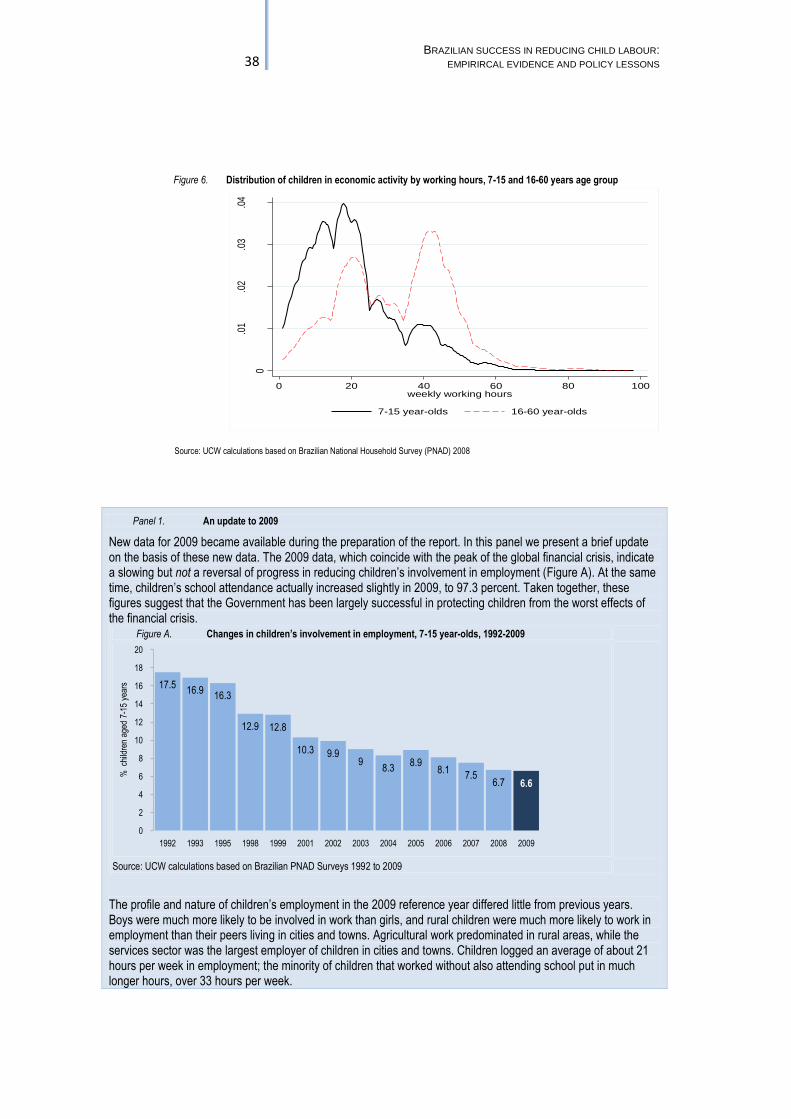
38 BRAZILIAN SUCCESS IN REDUCING CHILD LABOUR:
EMPIRIRCAL EVIDENCE AND POLICY LESSONS
Figure 6. Distribution of children in economic activity by working hours, 7-15 and 16-60 years age group
Source: UCW calculations based on Brazilian National Household Survey (PNAD) 2008
Panel 1. An update to 2009
New data for 2009 became available during the preparation of the report. In this panel we present a brief update on the basis of these new data. The 2009 data, which coincide with the peak of the global financial crisis, indicate a slowing but not a reversal of progress in reducing children’s involvement in employment (Figure A). At the same time, children’s school attendance actually increased slightly in 2009, to 97.3 percent. Taken together, these figures suggest that the Government has been largely successful in protecting children from the worst effects of the financial crisis.
Figure A. Changes in children’s involvement in employment, 7-15 year-olds, 1992-2009
Source: UCW calculations based on Brazilian PNAD Surveys 1992 to 2009
The profile and nature of children’s employment in the 2009 reference year differed little from previous years. Boys were much more likely to be involved in work than girls, and rural children were much more likely to work in employment than their peers living in cities and towns. Agricultural work predominated in rural areas, while the services sector was the largest employer of children in cities and towns. Children logged an average of about 21 hours per week in employment; the minority of children that worked without also attending school put in much longer hours, over 33 hours per week.
0
.01
.02
.03
.04
kden
sity
0 20 40 60 80 100weekly working hours
7-15 year-olds 16-60 year-olds
17.516.9
16.3
12.9 12.8
10.3 9.99
8.38.9
8.17.5
6.7 6.6
0
2
4
6
8
10
12
14
16
18
20
1992 1993 1995 1998 1999 2001 2002 2003 2004 2005 2006 2007 2008 2009
% c
hild
ren
aged
7-1
5 ye
ars
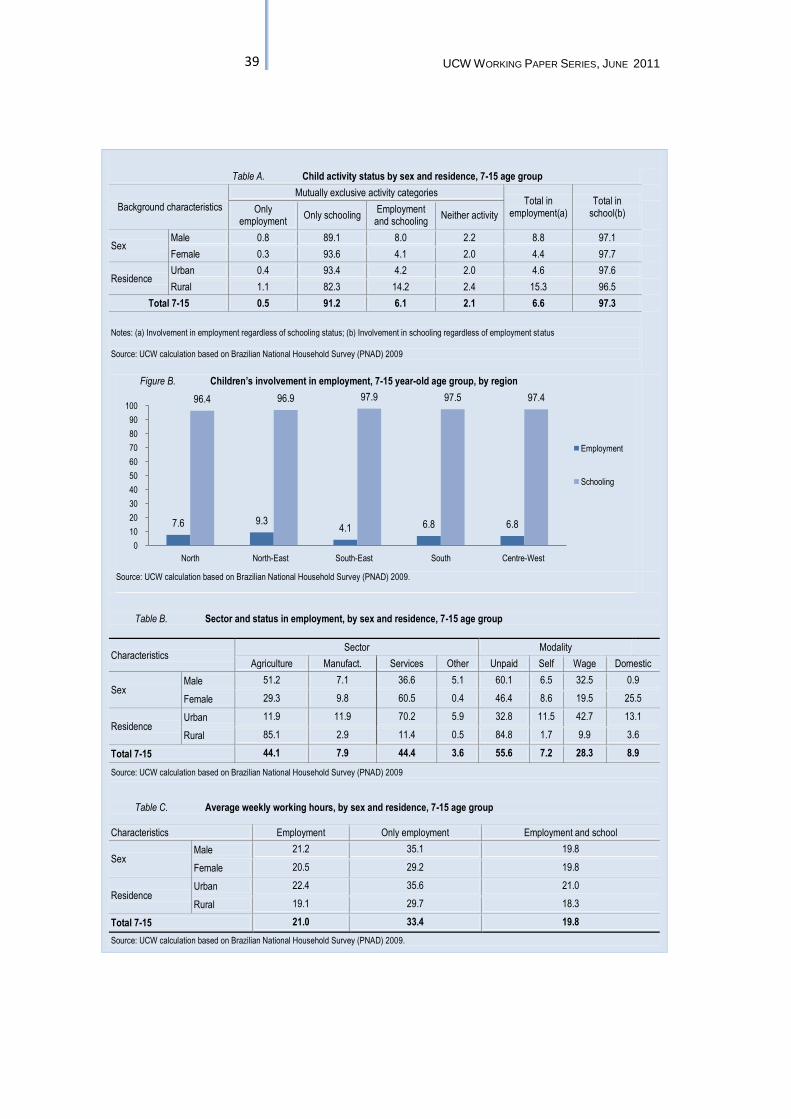
39 UCW WORKING PAPER SERIES, JUNE 2011
Table A. Child activity status by sex and residence, 7-15 age group
Background characteristics
Mutually exclusive activity categories Total in
employment(a) Total in
school(b) Only employment
Only schooling Employment
and schooling Neither activity
Sex Male 0.8 89.1 8.0 2.2 8.8 97.1
Female 0.3 93.6 4.1 2.0 4.4 97.7
Residence Urban 0.4 93.4 4.2 2.0 4.6 97.6
Rural 1.1 82.3 14.2 2.4 15.3 96.5
Total 7-15 0.5 91.2 6.1 2.1 6.6 97.3
Notes: (a) Involvement in employment regardless of schooling status; (b) Involvement in schooling regardless of employment status
Source: UCW calculation based on Brazilian National Household Survey (PNAD) 2009
Figure B. Children’s involvement in employment, 7-15 year-old age group, by region
Source: UCW calculation based on Brazilian National Household Survey (PNAD) 2009.
Table B. Sector and status in employment, by sex and residence, 7-15 age group
Characteristics Sector Modality
Agriculture Manufact. Services Other Unpaid Self Wage Domestic
Sex Male 51.2 7.1 36.6 5.1 60.1 6.5 32.5 0.9
Female 29.3 9.8 60.5 0.4 46.4 8.6 19.5 25.5
Residence Urban 11.9 11.9 70.2 5.9 32.8 11.5 42.7 13.1
Rural 85.1 2.9 11.4 0.5 84.8 1.7 9.9 3.6
Total 7-15 44.1 7.9 44.4 3.6 55.6 7.2 28.3 8.9
Source: UCW calculation based on Brazilian National Household Survey (PNAD) 2009
Table C. Average weekly working hours, by sex and residence, 7-15 age group
Characteristics Employment Only employment Employment and school
Sex Male 21.2 35.1 19.8
Female 20.5 29.2 19.8
Residence Urban 22.4 35.6 21.0
Rural 19.1 29.7 18.3
Total 7-15 21.0 33.4 19.8
Source: UCW calculation based on Brazilian National Household Survey (PNAD) 2009.
7.6 9.34.1 6.8 6.8
96.4 96.9 97.9 97.5 97.4
0
10
20
30
40
50
60
70
80
90
100
North North-East South-East South Centre-West
Employment
Schooling
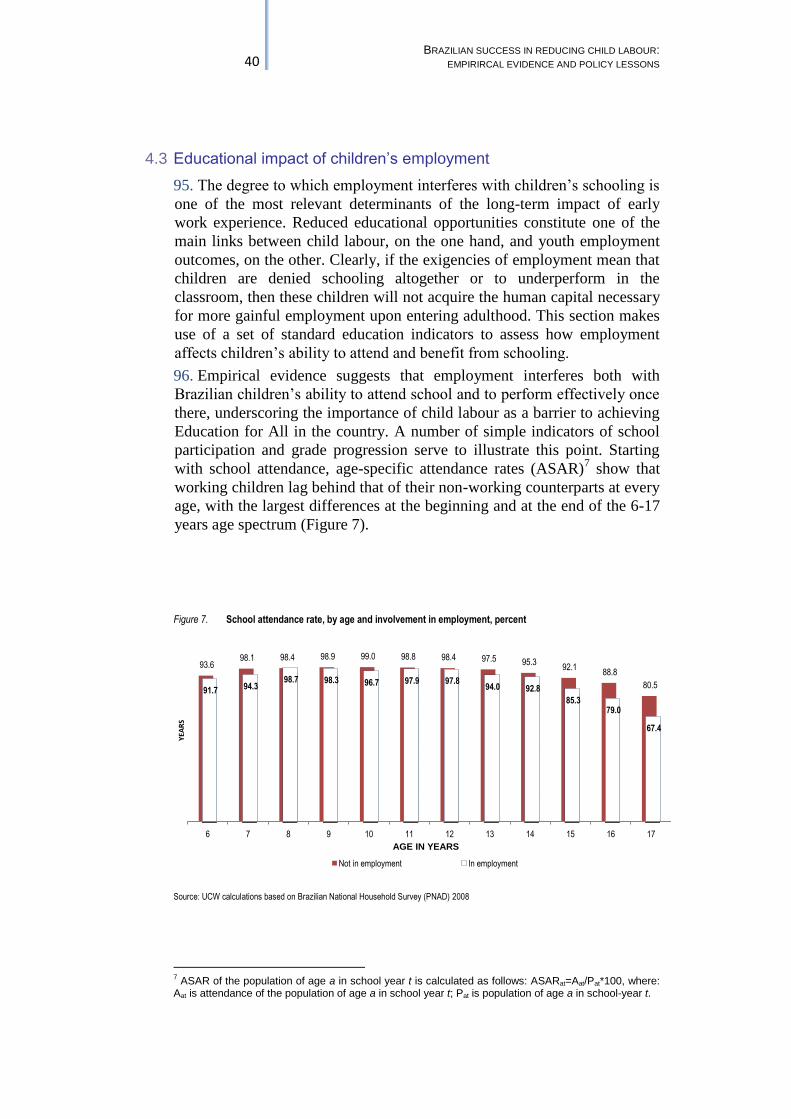
40 BRAZILIAN SUCCESS IN REDUCING CHILD LABOUR:
EMPIRIRCAL EVIDENCE AND POLICY LESSONS
4.3 Educational impact of children’s employment
95. The degree to which employment interferes with children’s schooling is
one of the most relevant determinants of the long-term impact of early
work experience. Reduced educational opportunities constitute one of the
main links between child labour, on the one hand, and youth employment
outcomes, on the other. Clearly, if the exigencies of employment mean that
children are denied schooling altogether or to underperform in the
classroom, then these children will not acquire the human capital necessary
for more gainful employment upon entering adulthood. This section makes
use of a set of standard education indicators to assess how employment
affects children’s ability to attend and benefit from schooling.
96. Empirical evidence suggests that employment interferes both with
Brazilian children’s ability to attend school and to perform effectively once
there, underscoring the importance of child labour as a barrier to achieving
Education for All in the country. A number of simple indicators of school
participation and grade progression serve to illustrate this point. Starting
with school attendance, age-specific attendance rates (ASAR)7 show that
working children lag behind that of their non-working counterparts at every
age, with the largest differences at the beginning and at the end of the 6-17
years age spectrum (Figure 7).
Figure 7. School attendance rate, by age and involvement in employment, percent
Source: UCW calculations based on Brazilian National Household Survey (PNAD) 2008
7 ASAR of the population of age a in school year t is calculated as follows: ASARat=Aat/Pat*100, where:
Aat is attendance of the population of age a in school year t; Pat is population of age a in school-year t.
93.6 98.1 98.4 98.9 99.0 98.8 98.4 97.5 95.3
92.1 88.8
80.5 91.7 94.3
98.7 98.3 96.7 97.9 97.8 94.0 92.8
85.3 79.0
67.4
6 7 8 9 10 11 12 13 14 15 16 17
YEA
RS
AGE IN YEARS
Not in employment In employment
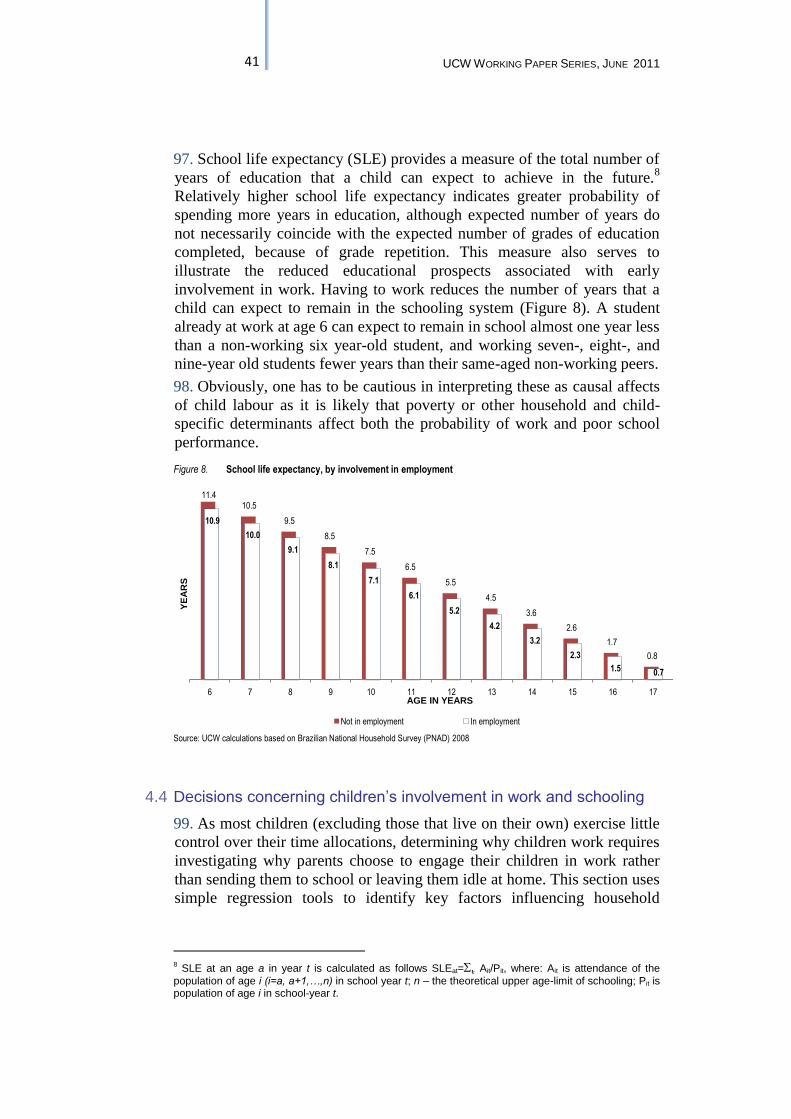
41 UCW WORKING PAPER SERIES, JUNE 2011
97. School life expectancy (SLE) provides a measure of the total number of
years of education that a child can expect to achieve in the future.8
Relatively higher school life expectancy indicates greater probability of
spending more years in education, although expected number of years do
not necessarily coincide with the expected number of grades of education
completed, because of grade repetition. This measure also serves to
illustrate the reduced educational prospects associated with early
involvement in work. Having to work reduces the number of years that a
child can expect to remain in the schooling system (Figure 8). A student
already at work at age 6 can expect to remain in school almost one year less
than a non-working six year-old student, and working seven-, eight-, and
nine-year old students fewer years than their same-aged non-working peers.
98. Obviously, one has to be cautious in interpreting these as causal affects
of child labour as it is likely that poverty or other household and child-
specific determinants affect both the probability of work and poor school
performance.
Figure 8. School life expectancy, by involvement in employment
Source: UCW calculations based on Brazilian National Household Survey (PNAD) 2008
4.4 Decisions concerning children’s involvement in work and schooling
99. As most children (excluding those that live on their own) exercise little
control over their time allocations, determining why children work requires
investigating why parents choose to engage their children in work rather
than sending them to school or leaving them idle at home. This section uses
simple regression tools to identify key factors influencing household
8 SLE at an age a in year t is calculated as follows SLEat= Ait/Pit, where: Ait is attendance of the
population of age i (i=a, a+1,…,n) in school year t; n – the theoretical upper age-limit of schooling; Pit is population of age i in school-year t.
11.4 10.5
9.5
8.5
7.5
6.5
5.5
4.5
3.6
2.6
1.7
0.8
10.9
10.0
9.1
8.1
7.1
6.1
5.2
4.2
3.2
2.3
1.5 0.7
6 7 8 9 10 11 12 13 14 15 16 17
YE
AR
S
AGE IN YEARS
Not in employment In employment
42 BRAZILIAN SUCCESS IN REDUCING CHILD LABOUR:
EMPIRIRCAL EVIDENCE AND POLICY LESSONS
decisions to involve their children in work or school.9 The results of the
analysis are provided in Table 10; some of the key qualitative inferences
from the analysis are presented below.
100. Child age and sex. The analysis shows that the probability of a
child working increases with age. The available information is insufficient
to provide a precise idea of the relative importance of the two probable
reasons for this, i.e., the rising opportunity cost of schooling (i.e. the wage
rate) as a child grows older, or the lack of access to schooling at the post-
primary level. Parents’ decisions concerning whether to involve their
children in school or employment in Brazil appear strongly influenced by
gender considerations. Holding constant household income, parents’
education and other relevant factors, boys more likely to be in employment
only or to combine employment and school than their female counterparts.
On the other hand, girls are more likely to be at school full time than their
male counterparts. It is worth noting, however, that these results do not
extend to involvement in household chores, a variable not included in the
analysis.
101. Education of household head. The effect of an increase in parents’
education on the reduction of child labour is significant and positive.
Holding income and other factors constant, children from households
where the head has primary education are less likely to work full-time, and
more likely to attend school full-time than children from households where
the head is illiterate. Raising the education of the household head from
basic to secondary education appears to have a similar impact on whether
children work or attend school. It is worth reiterating that these results are
obtained holding income constant, i.e., independent of any disguised
income effect. More educated parents might have a better knowledge of the
returns to education, and/or be in a position to help their children exploit
the earning potential acquired through education.
102. Household income. The level of household income appears to play
a relevant role in decisions concerning children’s work and schooling. A
higher income level leads to a decrease in the probability of a child working
full-time and an increase in the likelihood of him or her attending school
full-time. This results underscore that children’s earnings or productivity
play a relevant role in household survival strategies among low-income
families, and point to the need for some form of compensatory income or
earnings schemes as part of a broader effort for encouraging school
attendance and discouraging children’s work among poor households.
9 A bivariate probit model was used to jointly determine the correlated decisions on child schooling and
work. A simple economic model of household behaviour is used to guide the empirical specification. For detailed information on the model, see Cigno, Rosati and Tzannatos, Child Labour Handbook, May 2002. The analysis carried out in this section is, obviously, conditional on the available information. Despite the extensiveness of the survey utilised, potentially relevant variables are missing. In particular, information on the relative price of child work is difficult to capture: indicators for returns to education work and household chores are not easily available (for a discussion of the role played by unobservables please see Deb and Rosati, Determinants of Child Labour and School Attendance: The Role of Household Observables, December 2002).
43 UCW WORKING PAPER SERIES, JUNE 2011
103. Place of residence. Children’s living location is strongly correlated
with their time use, highlighting the importance of targeted, area-specific
approaches to reducing child labour and raising school attendance. Holding
other factors constant, children living in cities and towns are more likely to
be attending school full time, and less likely to be employed full-time,
compared to their counterparts living in the countryside. The likelihood of
school attendance and child labour also depends to a large extent on the
region where they live. Again holding other factors constant, a child living
in the North region, for example, faces a greater probability of working full
time, and a lower probability of studying full-time, compared to a child
living in the Northeast region. Other inter-regional differences in the
likelihood of child labour and school attendance are similarly large. The
level of income inequality within the state of residence (as measured by the
Gini coefficient) has an influence on child time use. A higher level of
inequality in income distribution appears to raise the share of children
combining school with employment
104. Access to water. Access to water is correlated with school
attendance and reduces participation of children to economic activity and
the number of children neither attending school nor working. A better
access to water increases the probability of children’s schooling and
decreases the probability of children’s involvement in employment.
Existing evidence (Guarcello et al. 2004) indicates that access to basic
services (water in the case of our study) can modify the decision of the
household concerning children’s activities, although admittedly this
variable might also pick up unobserved determinants of child labour (i.e.
household wealth).
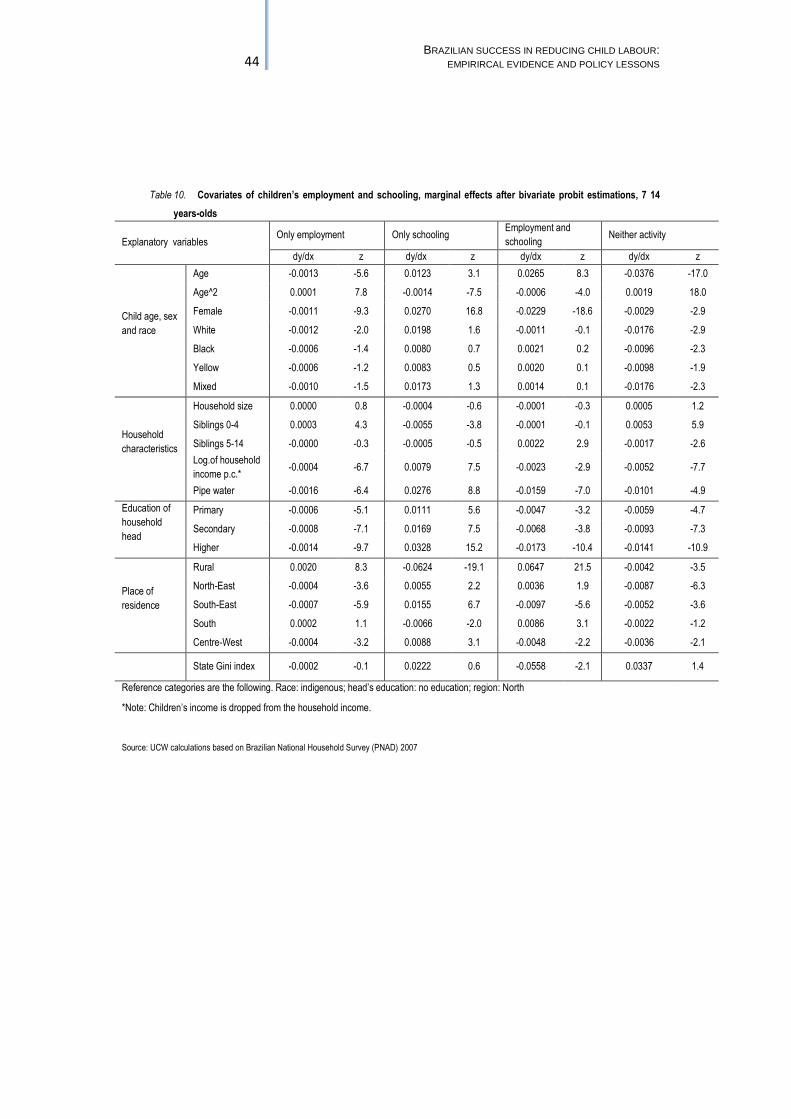
44 BRAZILIAN SUCCESS IN REDUCING CHILD LABOUR:
EMPIRIRCAL EVIDENCE AND POLICY LESSONS
Table 10. Covariates of children’s employment and schooling, marginal effects after bivariate probit estimations, 7 14
years-olds
Explanatory variables Only employment Only schooling
Employment and
schooling Neither activity
dy/dx z dy/dx z dy/dx z dy/dx z
Child age, sex
and race
Age -0.0013 -5.6 0.0123 3.1 0.0265 8.3 -0.0376 -17.0
Age^2 0.0001 7.8 -0.0014 -7.5 -0.0006 -4.0 0.0019 18.0
Female -0.0011 -9.3 0.0270 16.8 -0.0229 -18.6 -0.0029 -2.9
White -0.0012 -2.0 0.0198 1.6 -0.0011 -0.1 -0.0176 -2.9
Black -0.0006 -1.4 0.0080 0.7 0.0021 0.2 -0.0096 -2.3
Yellow -0.0006 -1.2 0.0083 0.5 0.0020 0.1 -0.0098 -1.9
Mixed -0.0010 -1.5 0.0173 1.3 0.0014 0.1 -0.0176 -2.3
Household
characteristics
Household size 0.0000 0.8 -0.0004 -0.6 -0.0001 -0.3 0.0005 1.2
Siblings 0-4 0.0003 4.3 -0.0055 -3.8 -0.0001 -0.1 0.0053 5.9
Siblings 5-14 -0.0000 -0.3 -0.0005 -0.5 0.0022 2.9 -0.0017 -2.6
Log.of household
income p.c.* -0.0004 -6.7 0.0079 7.5 -0.0023 -2.9 -0.0052 -7.7
Pipe water -0.0016 -6.4 0.0276 8.8 -0.0159 -7.0 -0.0101 -4.9
Education of
household
head
Primary -0.0006 -5.1 0.0111 5.6 -0.0047 -3.2 -0.0059 -4.7
Secondary -0.0008 -7.1 0.0169 7.5 -0.0068 -3.8 -0.0093 -7.3
Higher -0.0014 -9.7 0.0328 15.2 -0.0173 -10.4 -0.0141 -10.9
Place of
residence
Rural 0.0020 8.3 -0.0624 -19.1 0.0647 21.5 -0.0042 -3.5
North-East -0.0004 -3.6 0.0055 2.2 0.0036 1.9 -0.0087 -6.3
South-East -0.0007 -5.9 0.0155 6.7 -0.0097 -5.6 -0.0052 -3.6
South 0.0002 1.1 -0.0066 -2.0 0.0086 3.1 -0.0022 -1.2
Centre-West -0.0004 -3.2 0.0088 3.1 -0.0048 -2.2 -0.0036 -2.1
State Gini index -0.0002 -0.1 0.0222 0.6 -0.0558 -2.1 0.0337 1.4
Reference categories are the following. Race: indigenous; head’s education: no education; region: North
*Note: Children’s income is dropped from the household income.
Source: UCW calculations based on Brazilian National Household Survey (PNAD) 2007
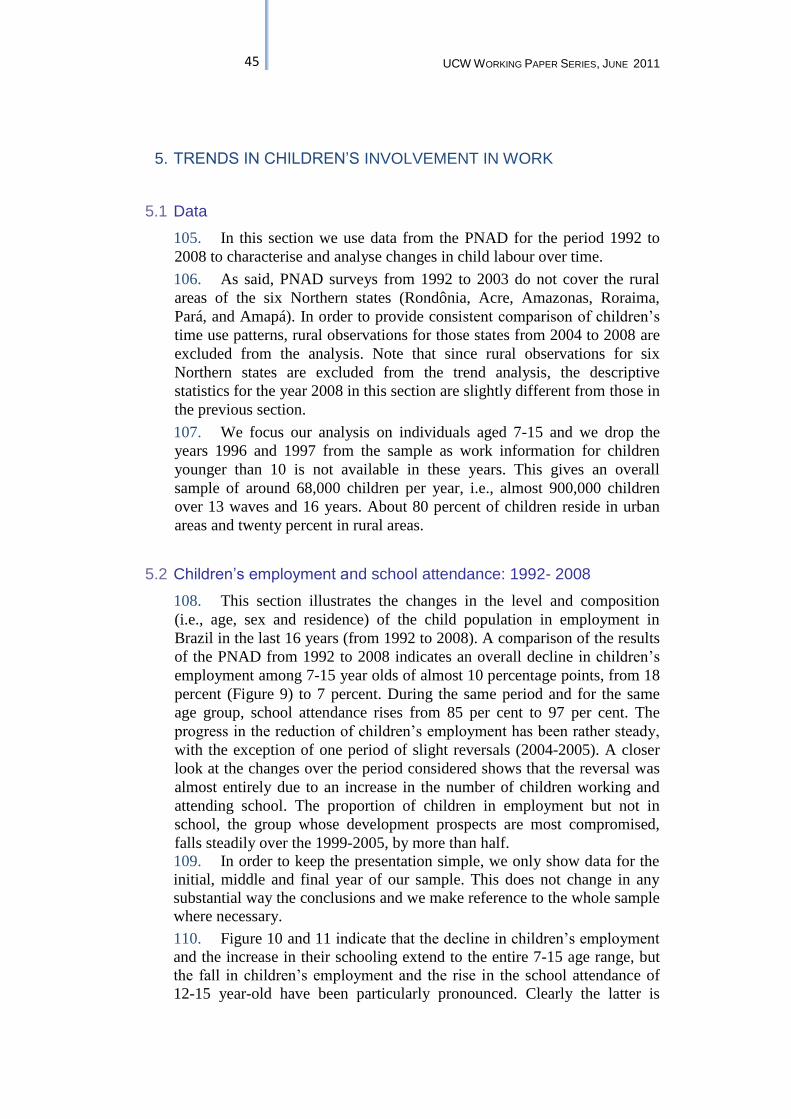
45 UCW WORKING PAPER SERIES, JUNE 2011
5. TRENDS IN CHILDREN’S INVOLVEMENT IN WORK
5.1 Data
105. In this section we use data from the PNAD for the period 1992 to
2008 to characterise and analyse changes in child labour over time.
106. As said, PNAD surveys from 1992 to 2003 do not cover the rural
areas of the six Northern states (Rondônia, Acre, Amazonas, Roraima,
Pará, and Amapá). In order to provide consistent comparison of children’s
time use patterns, rural observations for those states from 2004 to 2008 are
excluded from the analysis. Note that since rural observations for six
Northern states are excluded from the trend analysis, the descriptive
statistics for the year 2008 in this section are slightly different from those in
the previous section.
107. We focus our analysis on individuals aged 7-15 and we drop the
years 1996 and 1997 from the sample as work information for children
younger than 10 is not available in these years. This gives an overall
sample of around 68,000 children per year, i.e., almost 900,000 children
over 13 waves and 16 years. About 80 percent of children reside in urban
areas and twenty percent in rural areas.
5.2 Children’s employment and school attendance: 1992- 2008
108. This section illustrates the changes in the level and composition
(i.e., age, sex and residence) of the child population in employment in
Brazil in the last 16 years (from 1992 to 2008). A comparison of the results
of the PNAD from 1992 to 2008 indicates an overall decline in children’s
employment among 7-15 year olds of almost 10 percentage points, from 18
percent (Figure 9) to 7 percent. During the same period and for the same
age group, school attendance rises from 85 per cent to 97 per cent. The
progress in the reduction of children’s employment has been rather steady,
with the exception of one period of slight reversals (2004-2005). A closer
look at the changes over the period considered shows that the reversal was
almost entirely due to an increase in the number of children working and
attending school. The proportion of children in employment but not in
school, the group whose development prospects are most compromised,
falls steadily over the 1999-2005, by more than half.
109. In order to keep the presentation simple, we only show data for the
initial, middle and final year of our sample. This does not change in any
substantial way the conclusions and we make reference to the whole sample
where necessary.
110. Figure 10 and 11 indicate that the decline in children’s employment
and the increase in their schooling extend to the entire 7-15 age range, but
the fall in children’s employment and the rise in the school attendance of
12-15 year-old have been particularly pronounced. Clearly the latter is
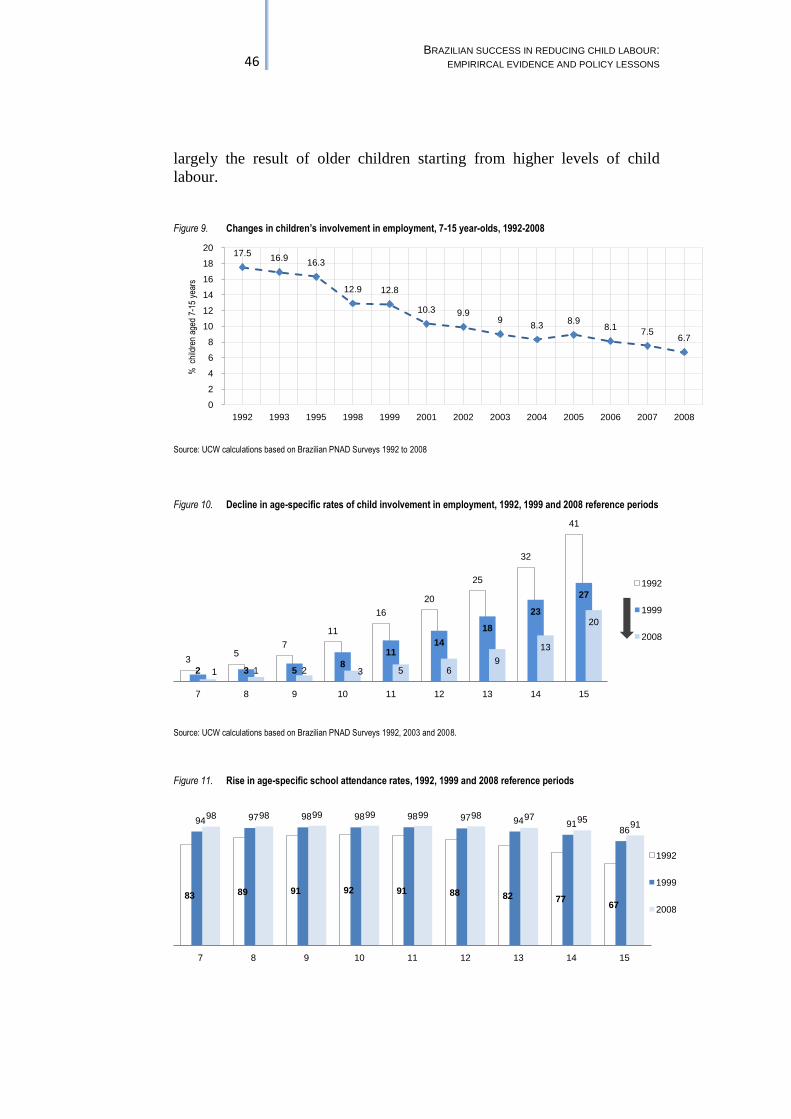
46 BRAZILIAN SUCCESS IN REDUCING CHILD LABOUR:
EMPIRIRCAL EVIDENCE AND POLICY LESSONS
largely the result of older children starting from higher levels of child
labour.
Figure 9. Changes in children’s involvement in employment, 7-15 year-olds, 1992-2008
Source: UCW calculations based on Brazilian PNAD Surveys 1992 to 2008
Figure 10. Decline in age-specific rates of child involvement in employment, 1992, 1999 and 2008 reference periods
Source: UCW calculations based on Brazilian PNAD Surveys 1992, 2003 and 2008.
Figure 11. Rise in age-specific school attendance rates, 1992, 1999 and 2008 reference periods
17.516.9
16.3
12.9 12.8
10.3 9.99
8.38.9
8.17.5
6.7
0
2
4
6
8
10
12
14
16
18
20
1992 1993 1995 1998 1999 2001 2002 2003 2004 2005 2006 2007 2008
% c
hild
ren
aged
7-1
5 ye
ars
35
7
11
16
20
25
32
41
2 3 58
1114
18
23
27
1 1 2 3 5 69
13
20
7 8 9 10 11 12 13 14 15
1992
1999
2008
83 89 91 92 91 88 82 7767
94 97 98 98 98 97 94 9186
98 98 99 99 99 98 97 9591
7 8 9 10 11 12 13 14 15
1992
1999
2008
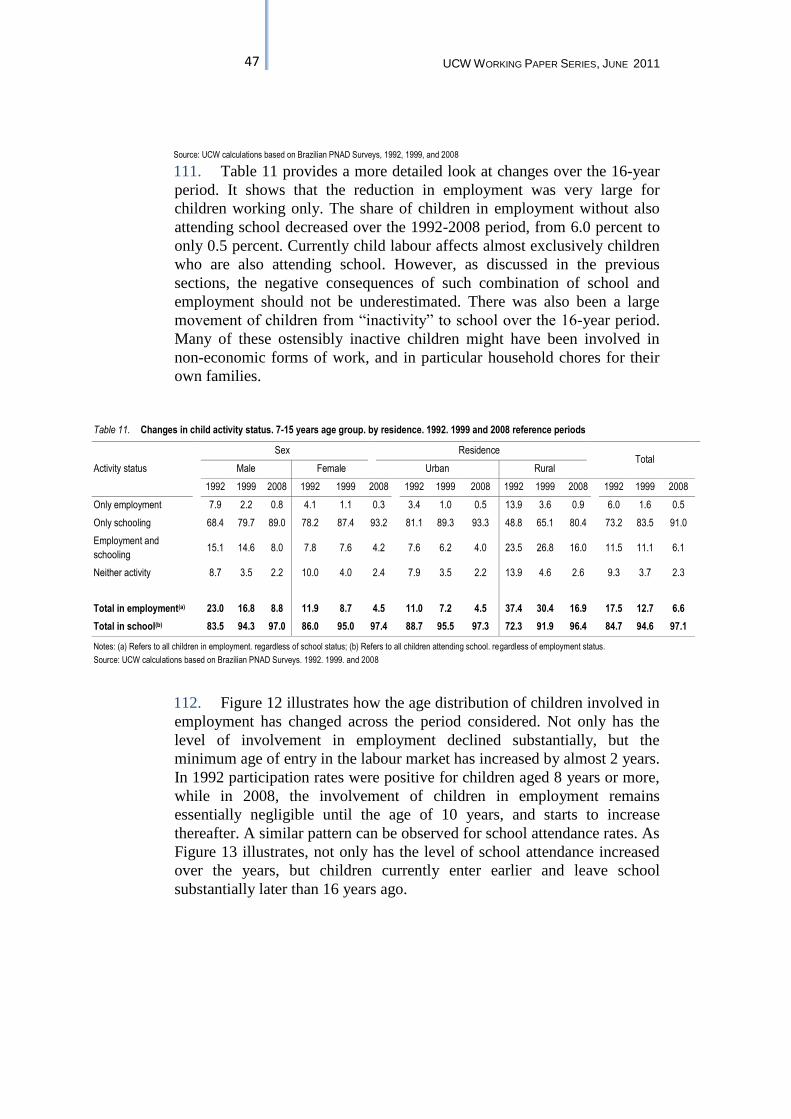
47 UCW WORKING PAPER SERIES, JUNE 2011
Source: UCW calculations based on Brazilian PNAD Surveys, 1992, 1999, and 2008
111. Table 11 provides a more detailed look at changes over the 16-year
period. It shows that the reduction in employment was very large for
children working only. The share of children in employment without also
attending school decreased over the 1992-2008 period, from 6.0 percent to
only 0.5 percent. Currently child labour affects almost exclusively children
who are also attending school. However, as discussed in the previous
sections, the negative consequences of such combination of school and
employment should not be underestimated. There was also been a large
movement of children from “inactivity” to school over the 16-year period.
Many of these ostensibly inactive children might have been involved in
non-economic forms of work, and in particular household chores for their
own families.
112. Figure 12 illustrates how the age distribution of children involved in
employment has changed across the period considered. Not only has the
level of involvement in employment declined substantially, but the
minimum age of entry in the labour market has increased by almost 2 years.
In 1992 participation rates were positive for children aged 8 years or more,
while in 2008, the involvement of children in employment remains
essentially negligible until the age of 10 years, and starts to increase
thereafter. A similar pattern can be observed for school attendance rates. As
Figure 13 illustrates, not only has the level of school attendance increased
over the years, but children currently enter earlier and leave school
substantially later than 16 years ago.
Table 11. Changes in child activity status. 7-15 years age group. by residence. 1992. 1999 and 2008 reference periods
Activity status
Sex Residence Total
Male Female Urban Rural
1992 1999 2008 1992 1999 2008 1992 1999 2008 1992 1999 2008 1992 1999 2008
Only employment 7.9 2.2 0.8 4.1 1.1 0.3 3.4 1.0 0.5 13.9 3.6 0.9 6.0 1.6 0.5
Only schooling 68.4 79.7 89.0 78.2 87.4 93.2 81.1 89.3 93.3 48.8 65.1 80.4 73.2 83.5 91.0
Employment and
schooling 15.1 14.6 8.0 7.8 7.6 4.2 7.6 6.2 4.0 23.5 26.8 16.0 11.5 11.1 6.1
Neither activity 8.7 3.5 2.2 10.0 4.0 2.4 7.9 3.5 2.2 13.9 4.6 2.6 9.3 3.7 2.3
Total in employment(a) 23.0 16.8 8.8 11.9 8.7 4.5 11.0 7.2 4.5 37.4 30.4 16.9 17.5 12.7 6.6
Total in school(b) 83.5 94.3 97.0 86.0 95.0 97.4 88.7 95.5 97.3 72.3 91.9 96.4 84.7 94.6 97.1
Notes: (a) Refers to all children in employment. regardless of school status; (b) Refers to all children attending school. regardless of employment status.
Source: UCW calculations based on Brazilian PNAD Surveys. 1992. 1999. and 2008
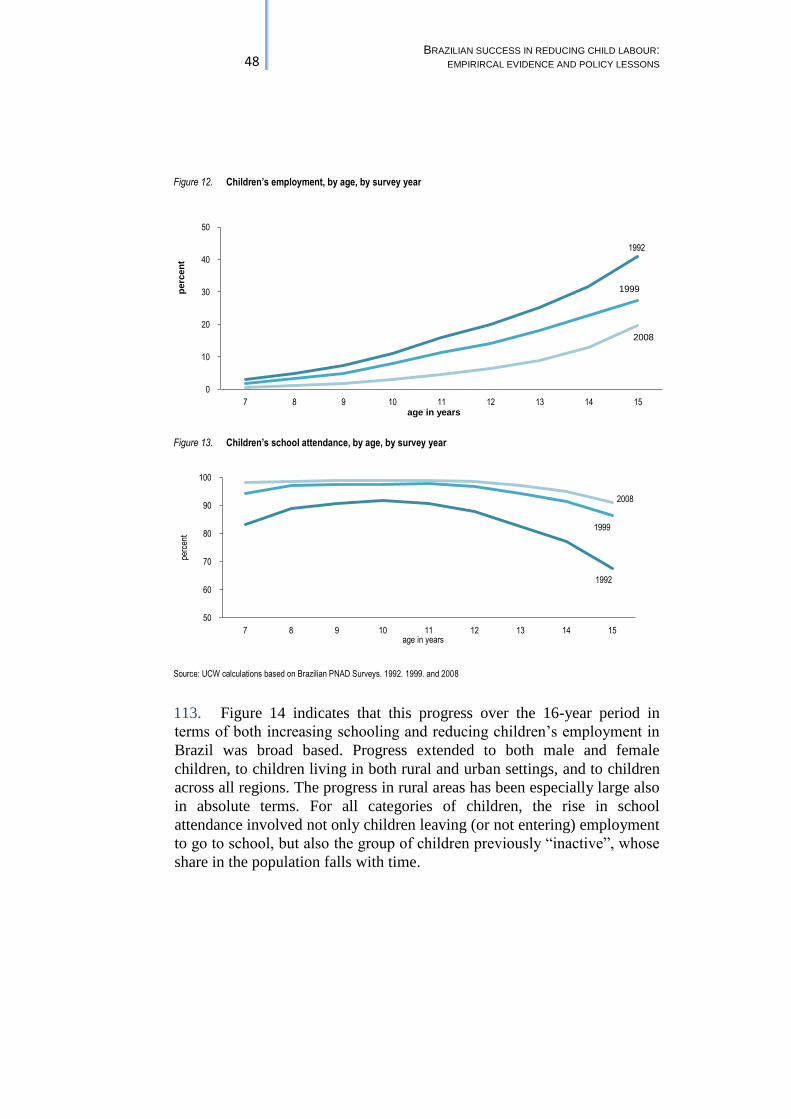
48 BRAZILIAN SUCCESS IN REDUCING CHILD LABOUR:
EMPIRIRCAL EVIDENCE AND POLICY LESSONS
Figure 12. Children’s employment, by age, by survey year
Figure 13. Children’s school attendance, by age, by survey year
Source: UCW calculations based on Brazilian PNAD Surveys. 1992. 1999. and 2008
113. Figure 14 indicates that this progress over the 16-year period in
terms of both increasing schooling and reducing children’s employment in
Brazil was broad based. Progress extended to both male and female
children, to children living in both rural and urban settings, and to children
across all regions. The progress in rural areas has been especially large also
in absolute terms. For all categories of children, the rise in school
attendance involved not only children leaving (or not entering) employment
to go to school, but also the group of children previously “inactive”, whose
share in the population falls with time.
1992
1999
2008
0
10
20
30
40
50
7 8 9 10 11 12 13 14 15
perc
en
t
age in years
1992
1999
2008
50
60
70
80
90
100
7 8 9 10 11 12 13 14 15
perc
ent
age in years
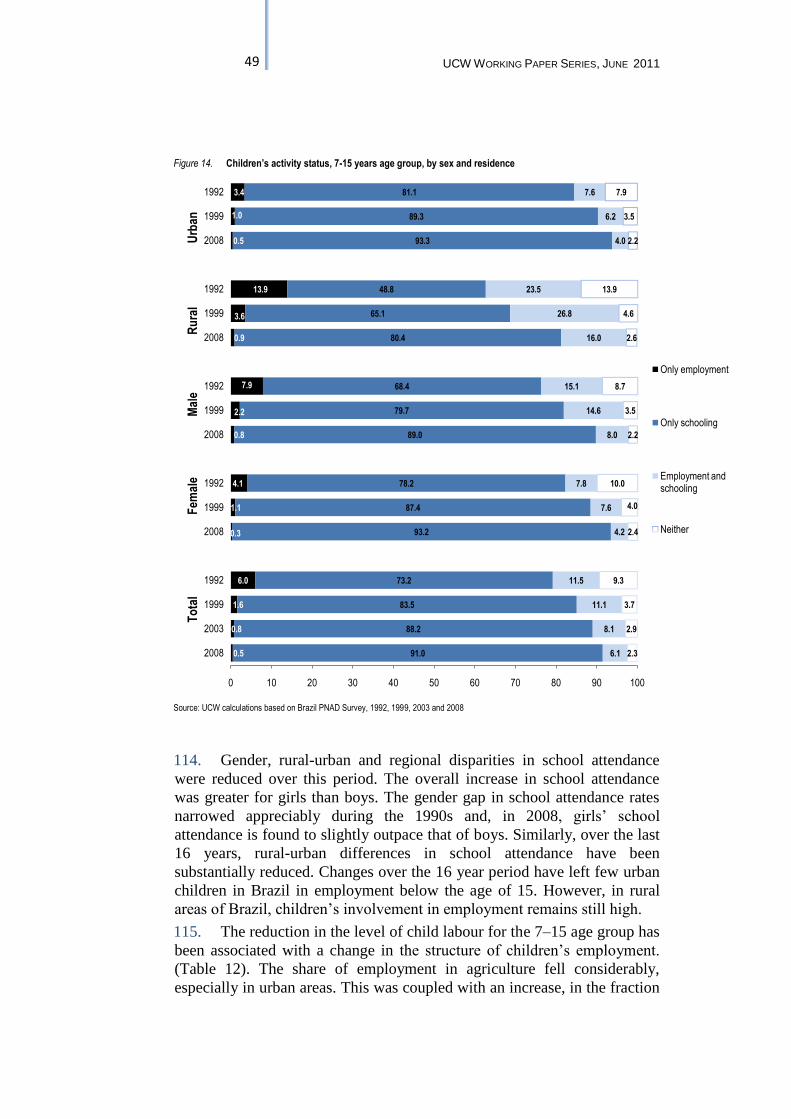
49 UCW WORKING PAPER SERIES, JUNE 2011
Figure 14. Children’s activity status, 7-15 years age group, by sex and residence
Source: UCW calculations based on Brazil PNAD Survey, 1992, 1999, 2003 and 2008
114. Gender, rural-urban and regional disparities in school attendance
were reduced over this period. The overall increase in school attendance
was greater for girls than boys. The gender gap in school attendance rates
narrowed appreciably during the 1990s and, in 2008, girls’ school
attendance is found to slightly outpace that of boys. Similarly, over the last
16 years, rural-urban differences in school attendance have been
substantially reduced. Changes over the 16 year period have left few urban
children in Brazil in employment below the age of 15. However, in rural
areas of Brazil, children’s involvement in employment remains still high.
115. The reduction in the level of child labour for the 7–15 age group has
been associated with a change in the structure of children’s employment.
(Table 12). The share of employment in agriculture fell considerably,
especially in urban areas. This was coupled with an increase, in the fraction
0.5
0.8
1.6
6.0
0.3
1.1
4.1
0.8
2.2
7.9
0.9
3.6
13.9
0.5
1.0
3.4
91.0
88.2
83.5
73.2
93.2
87.4
78.2
89.0
79.7
68.4
80.4
65.1
48.8
93.3
89.3
81.1
6.1
8.1
11.1
11.5
4.2
7.6
7.8
8.0
14.6
15.1
16.0
26.8
23.5
4.0
6.2
7.6
2.3
2.9
3.7
9.3
2.4
4.0
10.0
2.2
3.5
8.7
2.6
4.6
13.9
2.2
3.5
7.9
0 10 20 30 40 50 60 70 80 90 100
2008
2003
1999
1992
2008
1999
1992
2008
1999
1992
2008
1999
1992
2008
1999
1992T
ota
l
F
emal
e
M
ale
Ru
ral
Urb
an
Only employment
Only schooling
Employment and schooling
Neither
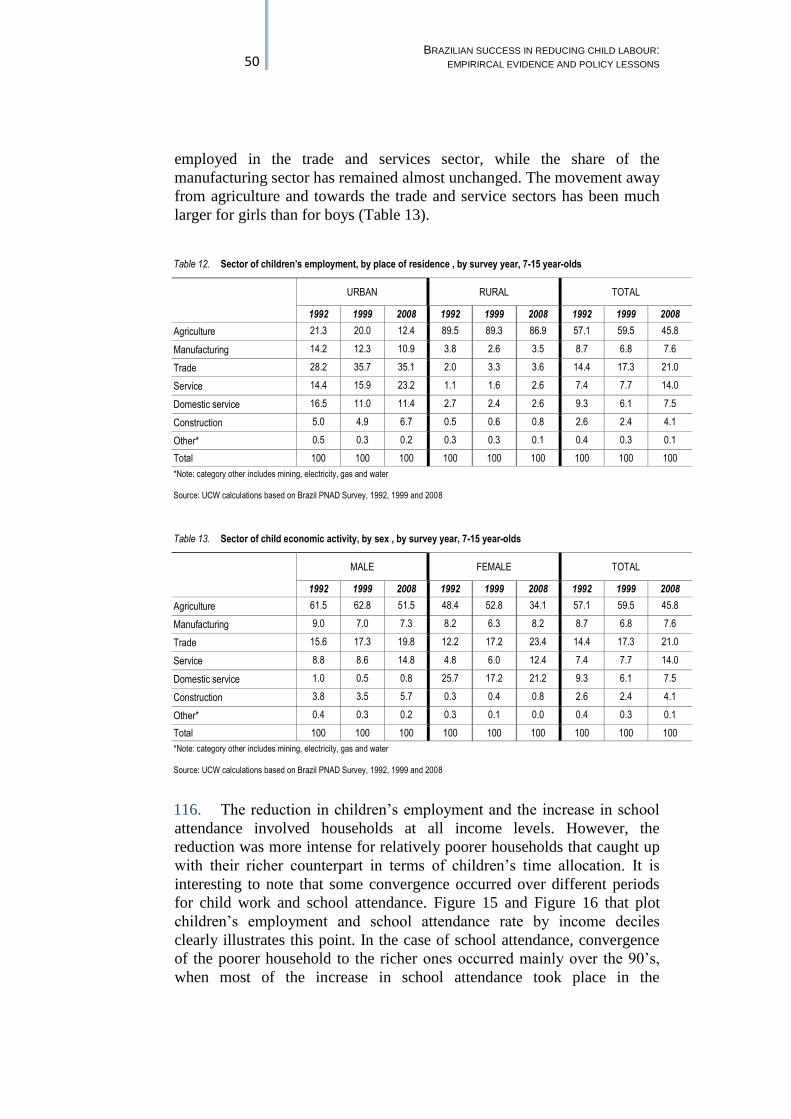
50 BRAZILIAN SUCCESS IN REDUCING CHILD LABOUR:
EMPIRIRCAL EVIDENCE AND POLICY LESSONS
employed in the trade and services sector, while the share of the
manufacturing sector has remained almost unchanged. The movement away
from agriculture and towards the trade and service sectors has been much
larger for girls than for boys (Table 13).
Table 12. Sector of children’s employment, by place of residence , by survey year, 7-15 year-olds
URBAN RURAL TOTAL
1992 1999 2008 1992 1999 2008 1992 1999 2008
Agriculture 21.3 20.0 12.4 89.5 89.3 86.9 57.1 59.5 45.8
Manufacturing 14.2 12.3 10.9 3.8 2.6 3.5 8.7 6.8 7.6
Trade 28.2 35.7 35.1 2.0 3.3 3.6 14.4 17.3 21.0
Service 14.4 15.9 23.2 1.1 1.6 2.6 7.4 7.7 14.0
Domestic service 16.5 11.0 11.4 2.7 2.4 2.6 9.3 6.1 7.5
Construction 5.0 4.9 6.7 0.5 0.6 0.8 2.6 2.4 4.1
Other* 0.5 0.3 0.2 0.3 0.3 0.1 0.4 0.3 0.1
Total 100 100 100 100 100 100 100 100 100
*Note: category other includes mining, electricity, gas and water Source: UCW calculations based on Brazil PNAD Survey, 1992, 1999 and 2008
Table 13. Sector of child economic activity, by sex , by survey year, 7-15 year-olds
MALE FEMALE TOTAL
1992 1999 2008 1992 1999 2008 1992 1999 2008
Agriculture 61.5 62.8 51.5 48.4 52.8 34.1 57.1 59.5 45.8
Manufacturing 9.0 7.0 7.3 8.2 6.3 8.2 8.7 6.8 7.6
Trade 15.6 17.3 19.8 12.2 17.2 23.4 14.4 17.3 21.0
Service 8.8 8.6 14.8 4.8 6.0 12.4 7.4 7.7 14.0
Domestic service 1.0 0.5 0.8 25.7 17.2 21.2 9.3 6.1 7.5
Construction 3.8 3.5 5.7 0.3 0.4 0.8 2.6 2.4 4.1
Other* 0.4 0.3 0.2 0.3 0.1 0.0 0.4 0.3 0.1
Total 100 100 100 100 100 100 100 100 100
*Note: category other includes mining, electricity, gas and water Source: UCW calculations based on Brazil PNAD Survey, 1992, 1999 and 2008
116. The reduction in children’s employment and the increase in school
attendance involved households at all income levels. However, the
reduction was more intense for relatively poorer households that caught up
with their richer counterpart in terms of children’s time allocation. It is
interesting to note that some convergence occurred over different periods
for child work and school attendance. Figure 15 and Figure 16 that plot
children’s employment and school attendance rate by income deciles
clearly illustrates this point. In the case of school attendance, convergence
of the poorer household to the richer ones occurred mainly over the 90’s,
when most of the increase in school attendance took place in the
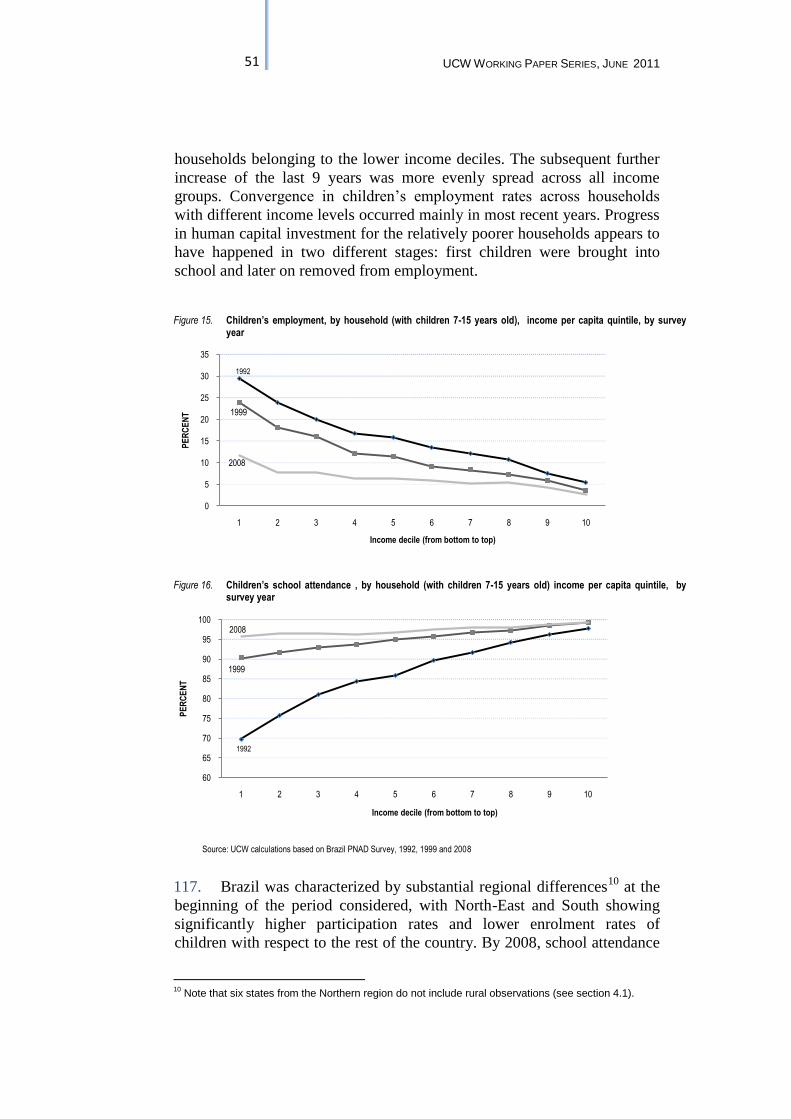
51 UCW WORKING PAPER SERIES, JUNE 2011
households belonging to the lower income deciles. The subsequent further
increase of the last 9 years was more evenly spread across all income
groups. Convergence in children’s employment rates across households
with different income levels occurred mainly in most recent years. Progress
in human capital investment for the relatively poorer households appears to
have happened in two different stages: first children were brought into
school and later on removed from employment.
Figure 15. Children’s employment, by household (with children 7-15 years old), income per capita quintile, by survey year
Figure 16. Children’s school attendance , by household (with children 7-15 years old) income per capita quintile, by survey year
Source: UCW calculations based on Brazil PNAD Survey, 1992, 1999 and 2008
117. Brazil was characterized by substantial regional differences10
at the
beginning of the period considered, with North-East and South showing
significantly higher participation rates and lower enrolment rates of
children with respect to the rest of the country. By 2008, school attendance
10
Note that six states from the Northern region do not include rural observations (see section 4.1).
1992
1999
2008
0
5
10
15
20
25
30
35
1 2 3 4 5 6 7 8 9 10
PE
RC
EN
T
Income decile (from bottom to top)
1992
1999
2008
60
65
70
75
80
85
90
95
100
1 2 3 4 5 6 7 8 9 10
PE
RC
EN
T
Income decile (from bottom to top)
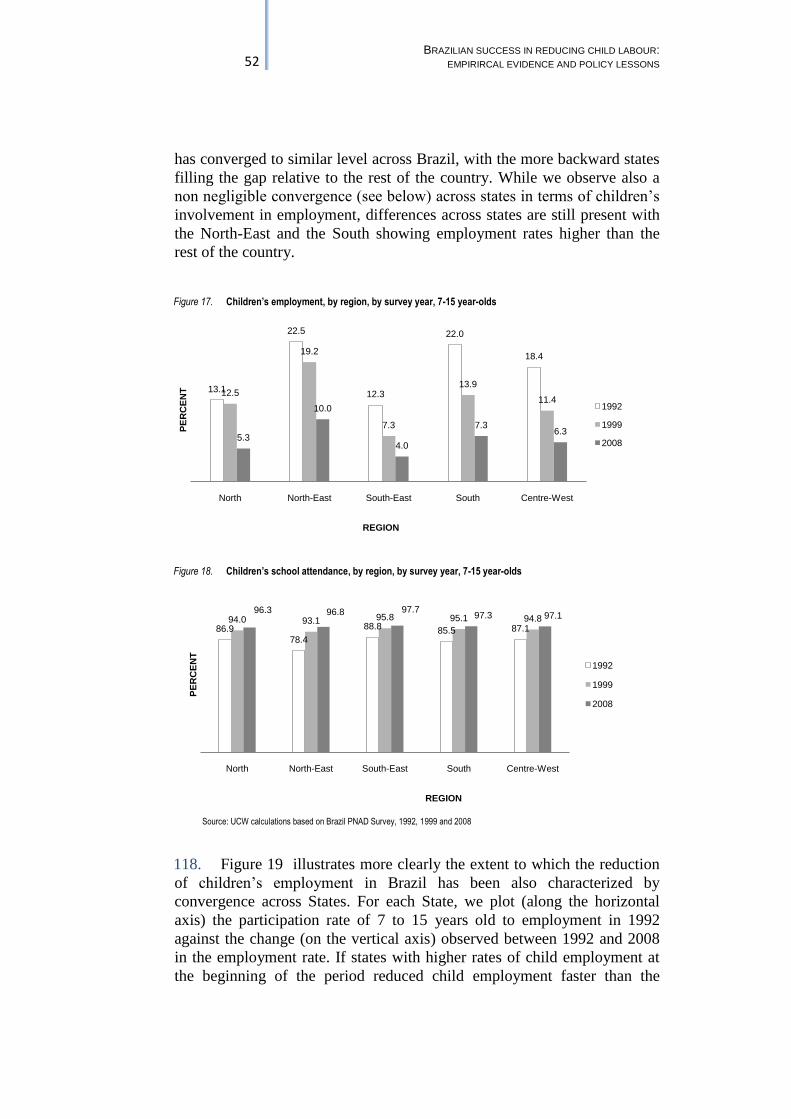
52 BRAZILIAN SUCCESS IN REDUCING CHILD LABOUR:
EMPIRIRCAL EVIDENCE AND POLICY LESSONS
has converged to similar level across Brazil, with the more backward states
filling the gap relative to the rest of the country. While we observe also a
non negligible convergence (see below) across states in terms of children’s
involvement in employment, differences across states are still present with
the North-East and the South showing employment rates higher than the
rest of the country.
Figure 17. Children’s employment, by region, by survey year, 7-15 year-olds
Figure 18. Children’s school attendance, by region, by survey year, 7-15 year-olds
Source: UCW calculations based on Brazil PNAD Survey, 1992, 1999 and 2008
118. Figure 19 illustrates more clearly the extent to which the reduction
of children’s employment in Brazil has been also characterized by
convergence across States. For each State, we plot (along the horizontal
axis) the participation rate of 7 to 15 years old to employment in 1992
against the change (on the vertical axis) observed between 1992 and 2008
in the employment rate. If states with higher rates of child employment at
the beginning of the period reduced child employment faster than the
13.1
22.5
12.3
22.0
18.4
12.5
19.2
7.3
13.9
11.4
5.3
10.0
4.0
7.36.3
North North-East South-East South Centre-West
PE
RC
EN
T
REGION
1992
1999
2008
86.9
78.4
88.8 85.5 87.194.0 93.1 95.8 95.1 94.8
96.3 96.8 97.797.3 97.1
North North-East South-East South Centre-West
PE
RC
EN
T
REGION
1992
1999
2008
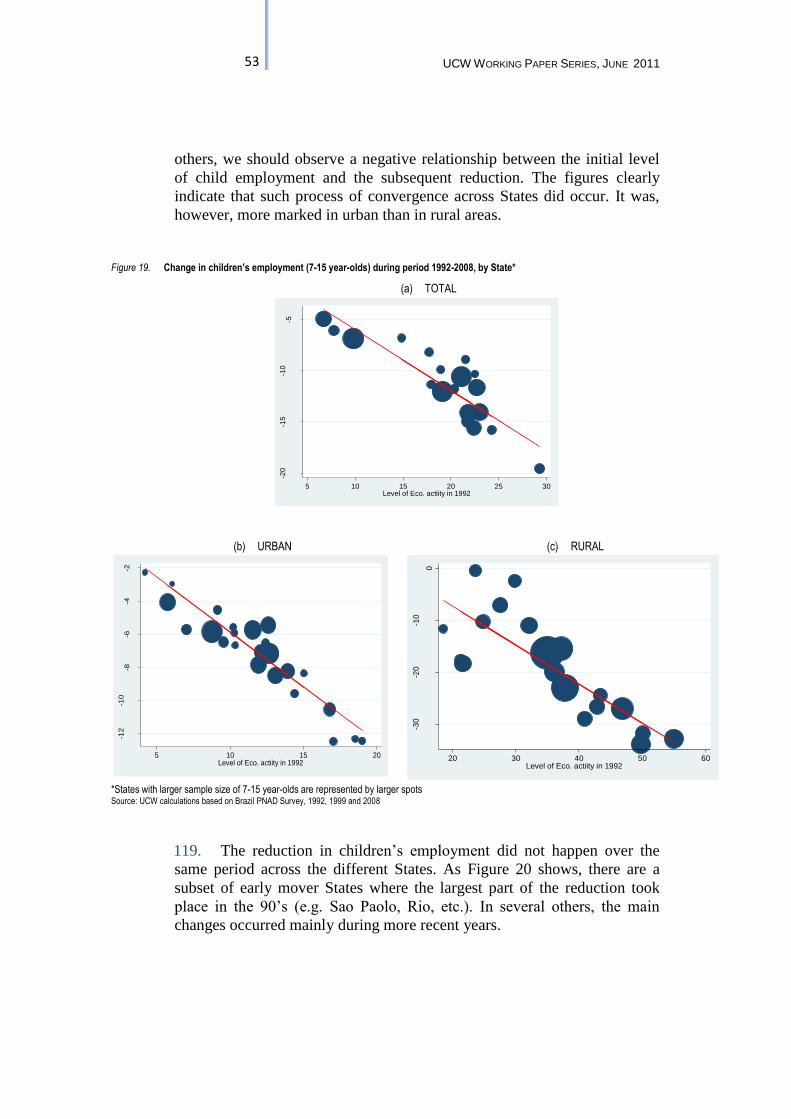
53 UCW WORKING PAPER SERIES, JUNE 2011
others, we should observe a negative relationship between the initial level
of child employment and the subsequent reduction. The figures clearly
indicate that such process of convergence across States did occur. It was,
however, more marked in urban than in rural areas.
Figure 19. Change in children’s employment (7-15 year-olds) during period 1992-2008, by State*
(a) TOTAL
(b) URBAN (c) RURAL
*States with larger sample size of 7-15 year-olds are represented by larger spots Source: UCW calculations based on Brazil PNAD Survey, 1992, 1999 and 2008
119. The reduction in children’s employment did not happen over the
same period across the different States. As Figure 20 shows, there are a
subset of early mover States where the largest part of the reduction took
place in the 90’s (e.g. Sao Paolo, Rio, etc.). In several others, the main
changes occurred mainly during more recent years.
-20
-15
-10
-5
Eco
.activity 2
008
- E
co. a
ctivity 1
992
5 10 15 20 25 30Level of Eco. actiity in 1992
-12
-10
-8-6
-4-2
Eco
.activity 2
008
- E
co. a
ctivity 1
992
5 10 15 20Level of Eco. actiity in 1992
-30
-20
-10
0
Eco
.activity 2
008
- E
co. a
ctivity 1
992
20 30 40 50 60Level of Eco. actiity in 1992
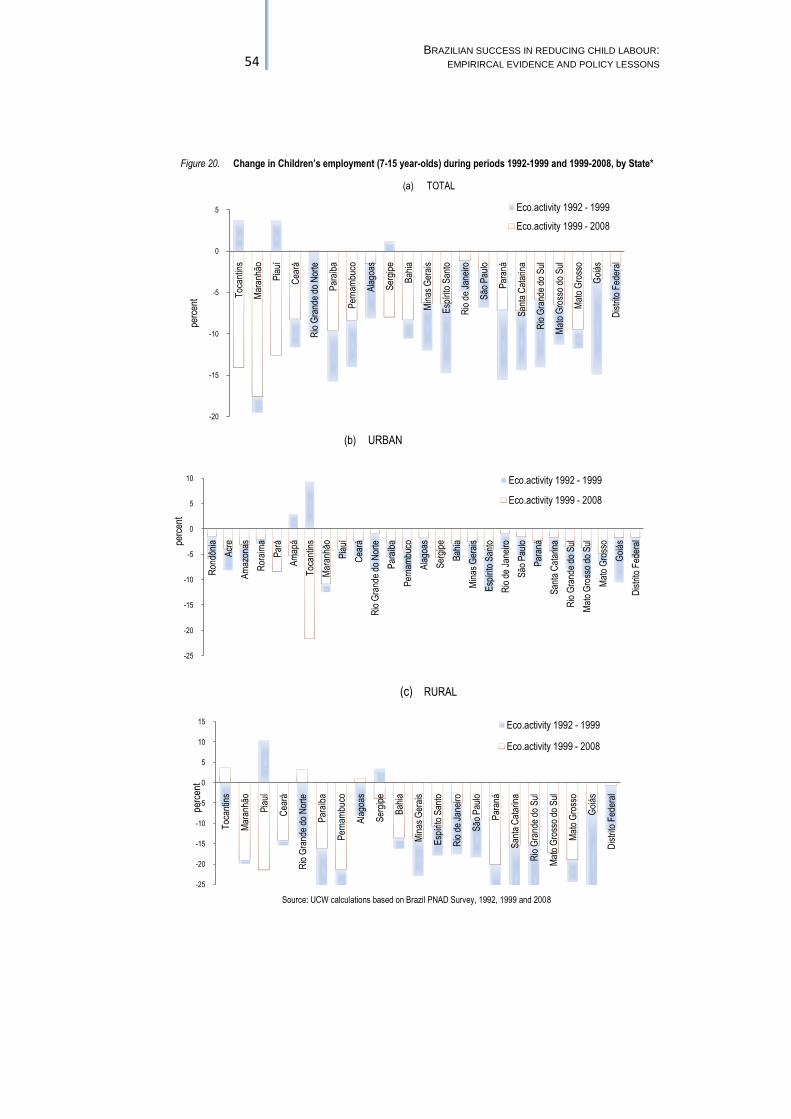
54 BRAZILIAN SUCCESS IN REDUCING CHILD LABOUR:
EMPIRIRCAL EVIDENCE AND POLICY LESSONS
Figure 20. Change in Children’s employment (7-15 year-olds) during periods 1992-1999 and 1999-2008, by State*
(a) TOTAL
(b) URBAN
(c) RURAL
Source: UCW calculations based on Brazil PNAD Survey, 1992, 1999 and 2008
-20
-15
-10
-5
0
5
Toc
antin
s
Mar
anhã
o
Pia
uí
Cea
rá
Rio
Gra
nde
do N
orte
Par
aíba
Per
nam
buco
Ala
goas
Ser
gipe
Bah
ia
Min
as G
erai
s
Esp
írito
San
to
Rio
de
Jane
iro
São
Pau
lo
Par
aná
San
ta C
atar
ina
Rio
Gra
nde
do S
ul
Mat
o G
ross
o do
Sul
Mat
o G
ross
o
Goi
ás
Dis
trito
Fed
eral
perc
ent
Eco.activity 1992 - 1999
Eco.activity 1999 - 2008
-25
-20
-15
-10
-5
0
5
10
Ron
dôni
a
Acr
e
Am
azon
as
Ror
aim
a
Par
á
Am
apá
Toc
antin
s
Mar
anhã
o
Pia
uí
Cea
rá
Rio
Gra
nde
do N
orte
Par
aíba
Per
nam
buco
Ala
goas
Ser
gipe
Bah
ia
Min
as G
erai
s
Esp
írito
San
to
Rio
de
Jane
iro
São
Pau
lo
Par
aná
San
ta C
atar
ina
Rio
Gra
nde
do S
ul
Mat
o G
ross
o do
Sul
Mat
o G
ross
o
Goi
ás
Dis
trito
Fed
eralpe
rcen
t
Eco.activity 1992 - 1999
Eco.activity 1999 - 2008
-25
-20
-15
-10
-5
0
5
10
15
Toc
antin
s
Mar
anhã
o
Pia
uí
Cea
rá
Rio
Gra
nde
do N
orte
Par
aíba
Per
nam
buco
Ala
goas
Ser
gipe
Bah
ia
Min
as G
erai
s
Esp
írito
San
to
Rio
de
Jane
iro
São
Pau
lo
Par
aná
San
ta C
atar
ina
Rio
Gra
nde
do S
ul
Mat
o G
ross
o do
Sul
Mat
o G
ross
o
Goi
ás
Dis
trito
Fed
eral
perc
ent
Eco.activity 1992 - 1999
Eco.activity 1999 - 2008
55 UCW WORKING PAPER SERIES, JUNE 2011
6. WHY CHILDREN’S WORK HAS DECLINED: ECONOMETRIC EVIDENCE
120. The previous section has illustrated the recent trend in children’s
employment and schooling in Brazil. We have seen how children’s work
has fallen and schooling has risen considerably in Brazil since (at least) the
mid-1990s. During the period covered by this study, several strategic
interventions in the area of child labour have been implemented at both the
federal and state level, while at the same time large programs aimed at
increasing school attendance have been put in place (See Section 2). Partly
but not exclusively because of such policies and programs, the country
social and economic characteristics have also substantially changed: living
standards have improved, poverty has fallen, access to basic services has
expanded, while new generations of parents have become increasingly
more educated (see Table 14).
121. In the rest of this section we attempt to assess the impact on child
work of such trends in the economic and of social conditions of the country
and some of the government targeted programmes. In particular we focus
on changes in the supply of education, changes in living standards and
changes in the state of the local labour market.
122. For this purpose we complement data from the PNAD surveys with
information on the number of school and teachers by state and year
separately for urban and rural areas. These data come from the yearly
School Censuses,11
and refer to regular (i.e. excluding adult and special)
basic education (Educação Básica). These cover grades 1 to 11, i.e.
primary (Ensino Fundamental, grades 1 to 8) and middle school (Ensino
Médio, grades 9-11). We use these data to construct a pupil-teacher ratio by
area and time.
123. The evolution of children’s employment and school attendance,
together with a number of relevant individual, household and community
characteristics, is tabulated for 1992 and 2008 for children aged 7-15 years
and for the household to which they belong. The data are presented
separately for the whole sample and for rural and urban areas (Table 14,
Table 15, and Table 16). All data are weighted by sampling weights.
Consistently with the evidence in the previous sections, the data show an
increase in school attendance on the order of 12 percentage points in 16
years (from 85 percent to 97 percent). This growth is especially large in
rural areas, where the increase is of 24 percentage points (compared to 9
percentage points in urban areas). Over the same period, the share of
children in employment halves, going from 17 percent in 1992 to 7 percent
in 2008. Again, the largest fall (more than 20 percentage points) is
observed in rural areas. The probability of combining employment with
school is relatively high but declining (going from 11 percent in 1992 to 6
11
Data come from the Sinopses Estatísticas da Educação Básica for various years. These are available at http://www.inep.gov.br/basica/censo/Escolar/Sinopse/sinopse.asp.
56 BRAZILIAN SUCCESS IN REDUCING CHILD LABOUR:
EMPIRIRCAL EVIDENCE AND POLICY LESSONS
percent in 2008), while the proportion of children in employment only (i.e.
not in combination with school) is relatively low (6.0 percent in 1992) and
also declining (0.5 percent in 2008).
124. There are no appreciable differences across years in children’s sex
ratio, which appears balanced. In line with the fall in fertility that typically
accompanies development, household size falls (from 6 to 5). The ethnic
composition of households with children changes slightly with a reduction
of the fraction of whites and an increase in that of mixed race. The share of
children with access to basic services, such as access to piped water,
increases from 71 percent to 90 percent. The level of education of the head
of household increases over the period of analysis. The proportion of
households headed by individuals with no education decreases from 28
percent to 16 percent, while that of households headed by individuals with
secondary and higher education rises (respectively from 9 percent to 15
percent and from 13 percent to 26 percent).
125. As characteristics that are typically associated with children’s
employment become less frequent in the population as time goes on, one
would expect children’s work to fall. For example, if children of more
educated parents are less likely to be involved in work, a secular increase in
parental education should - everything else being equal - lead to a fall in
children’s work. In the next section we provide a formal procedure to
assess the contribution of changes in such observable characteristics to the
fall in children’s work.
126. Other than potentially due to varying composition of the population,
observed changes in children’s time use in Brazil can be due directly to
policy interventions and to macroeconomic trends. Living standards have
improved substantially in Brazil: real per capita income has increased by
about 30 percent over the 16 years of analysis while income inequality has
declined steadily. The share of children belonging to extreme poor
households (i.e., earning less than 1.25 USD per day) has declined from 24
percent to 9 percent in the period considered, while that of children
belonging to moderately poor households (i.e., earning between 1.25 USD
and 2 USD per day) declined from 15 percent to 11 percent.12
The Gini
coefficient, one of the most used inequality measures, declined from 0.57 in
1992 to 0.54 in 2008 (Table 14). As mentioned, improvements in the
quality of schooling are likely to increase the incentives for school
enrolment and possibly decrease the incentives for children’s work. In
addition, as also discussed above, the government of Brazil actively has
pursued policies aimed at increasing school attendance and reducing
children’s work. Between 1992 and 2006, the last year when these data are
available, the pupil teacher ratio falls by 10 percent (from 21.6 to 19.6
children per teacher) despite a remarkable rise in enrolment. The table
12
Following The World Bank recent estimates of poverty, we use the international poverty lines of $ 1.25 per day per for “extreme” poverty and of $2.00 for moderate poverty at 2005 Purchasing Power Parity (PPP). For more details see Himanshu (2009).
57 UCW WORKING PAPER SERIES, JUNE 2011
finally presents information on the adult (ages 25-55) local open
unemployment rate as derived from the PNAD that in the rest we take as a
measure of local labour demand. The unemployment rate is slightly higher
(at 5.1 percent) in 2008 compared to 1992 (4.6 percent).
127. In the next sub-section we start by presenting an initial analysis of
the role of changes in children’s and their households’ characteristics in
explaining trends in child work. These characteristics, defined above,
change slowly over time and are less likely to be influenced by direct
policy action. Nonetheless, they are potentially relevant in explaining the
trend in children’s work and other dimensions of children’s activities. We
employ a simple reweighting approach that allows us to build a
counterfactual intensity of children’s work in 1992 assuming that the
distribution of household and children characteristics is the one that
prevailed in 2008. In this way can determine what fraction of the observed
changes in child work between 1992 and 2008 can be attributed to changes
in individual characteristics.
128. In the subsequent section we complement this initial descriptive
analysis with a regression approach that exploits the variation over time and
states districts to identify the impact of changes in living standards, local
labour market conditions and other policy variables on children’s work and
school attendance.
’
58 BRAZILIAN SUCCESS IN REDUCING CHILD LABOUR:
EMPIRIRCAL EVIDENCE AND POLICY LESSONS
Table 14. Children’s time use and characteristics: Brazil, 1992, 2006 and 2008, children aged 7-15 years old
1992 2006 2008
School attendance 84.7 96.9 97.1
Child Work 17.5 8.1 6.6
Work exclusively 6.0 0.8 0.5
Study exclusively 73.2 89.6 91.0
School and work 11.5 7.3 6.1
Idleness 9.3 2.3 2.3
Percent in Agriculture 57.1 51.2 45.8
Percent in Manufacturing 8.7 8.0 7.6
Percent in Service & Trade 21.9 31.6 35.0
Percent in Domestic Service 9.3 6.6 7.5
Percent in Construction, Mining, Electr, Gas & Water 3.0 2.7 4.2
Age 10.9 11.0 11.1
Female 0.49 0.49 0.49
Race=
Indigenous 0.1 0.2 0.3
White 49.3 45.1 43.7
Black 4.9 6.1 5.6
Yellow 0.3 0.4 0.4
Mixed 45.5 48.3 50.1
HH size 5.9 5.0 4.9
Number of 0-4 year-olds in the household 0.5 0.3 0.3
Number of 5-14 year-olds in the household 2.4 1.9 1.8
P.c. Income* (2005 Rp.) 235 308 323
Piped water 0.71 0.88 0.90
Household head education =
No education 27.9 17.0 16.0
Primary 50.4 46.1 42.1
Secondary 8.6 13.7 15.4
Higher 13.2 23.2 26.5
Gini index 0.57 0.55 0.54
Adult unemployment rate 0.046 0.059 0.051
Pupil-teacher ratio 21.6 19.6 -
Poverty 1 (share of children with household income per capita <$1.25 per day) 0.24 0.12 0.09
Poverty2 (share of children with household income per capita between $1.25 and $2 per day) 0.15 0.12 0.11
Observations 66,270 67,460 62,586
*Note: Children’s labour income is dropped from the household income.
The PNAD survey for the year 1992 does not include rural observations for 6 states from the North region. In order to provide consistent decomposition results, rural observations for those states were dropped for the year 2008.
Source: UCW calculations based on Brazil PNAD Survey, 1992, 2006 and 2008
59 UCW WORKING PAPER SERIES, JUNE 2011
Table 15. Children’s time use and characteristics: Brazil, 1992, 2006 and 2008, children aged 7-15 years old, URBAN AREAS
1992 2006 2008
School attendance 88.7 97.2 97.3
Child Work 11.0 5.2 4.5
Work exclusively 3.4 0.6 0.5
Study exclusively 81.1 92.6 93.3
School and work 7.6 4.6 4.0
Idleness 7.9 2.2 2.2
Percent in Agriculture 21.3 17.5 12.4
Percent in Manufacturing 14.2 11.8 10.9
Percent in Service & Trade 42.6 55.7 58.4
Percent in Domestic Service 16.5 10.4 11.4
Percent in Construction, Mining, Electr, Gas & Water 5.4 4.6 7.0
Age 11.0 11.0 11.1
Female 0.50 1.49 0.49
Race=
Indigenous 0.1 0.2 0.2
White 52.5 46.9 45.1
Black 4.8 6.4 5.8
Yellow 0.3 0.4 0.5
Mixed 42.2 46.1 48.5
HH size 5.6 4.9 4.7
Number of 0-4 year-olds in the household 0.4 0.3 0.3
Number of 5-14 year-olds in the household 2.3 1.8 1.8
P.c. Income* (2005 Rp.) 278 344 359
Piped water 0.84 0.95 0.96
Household head education =
No education 20.4 12.5 12.3
Primary 52.0 44.7 39.9
Secondary 10.8 15.5 17.2
Higher 16.8 27.3 30.6
Gini index 0.57 0.55 0.53
Adult unemployment rate 0.057 0.067 0.058
Pupil-teacher ratio 21.6 19.5 -
Poverty 1 (share of children with household income per capita <$1.25 per day) 0.17 0.08 0.07
Poverty2 (share of children with household income per capita between $1.25 and $2 per day) 0.14 0.10 0.09
Observations 52,060 56,646 52,633
**Note: Children’s labour income is dropped from the household income.
The PNAD survey for the year 1992 does not include rural observations for 6 states from the North region. In order to provide consistent decomposition results, rural observations for those states were dropped for the year s 2006 and 2008.
Source: UCW calculations based on Brazil PNAD Survey, 1992, 2006 and 2008
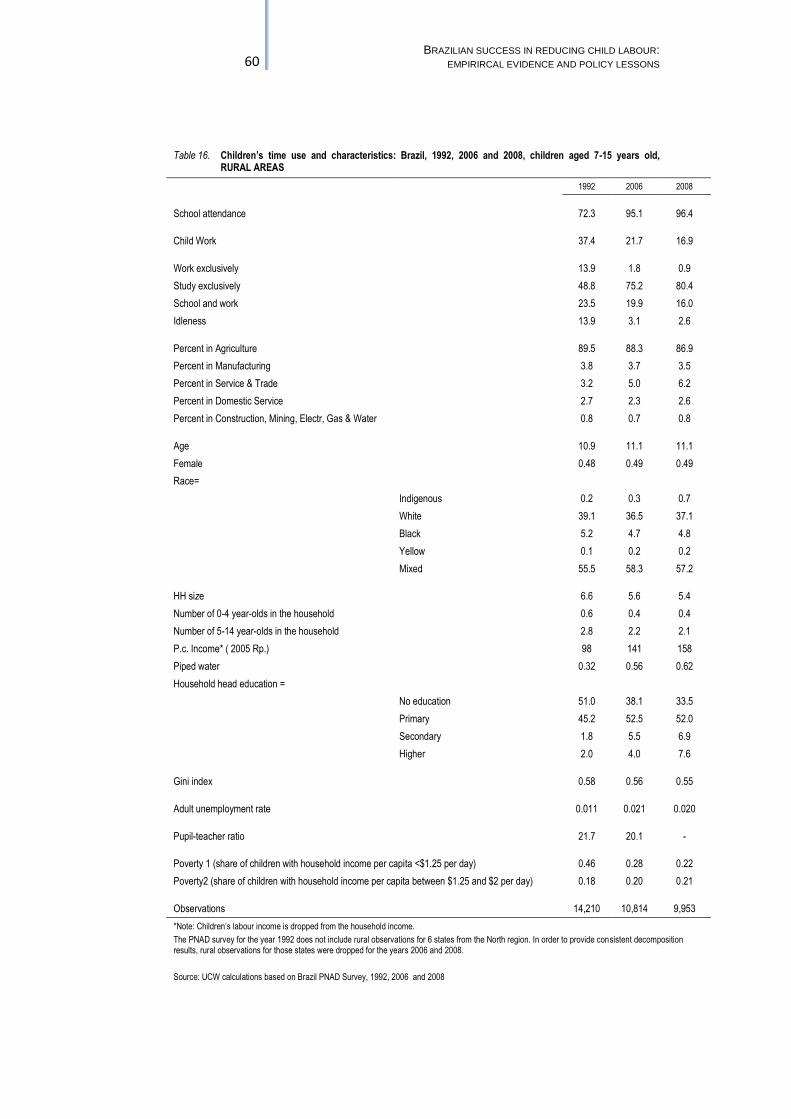
60 BRAZILIAN SUCCESS IN REDUCING CHILD LABOUR:
EMPIRIRCAL EVIDENCE AND POLICY LESSONS
Table 16. Children’s time use and characteristics: Brazil, 1992, 2006 and 2008, children aged 7-15 years old, RURAL AREAS
1992 2006 2008
School attendance 72.3 95.1 96.4
Child Work 37.4 21.7 16.9
Work exclusively 13.9 1.8 0.9
Study exclusively 48.8 75.2 80.4
School and work 23.5 19.9 16.0
Idleness 13.9 3.1 2.6
Percent in Agriculture 89.5 88.3 86.9
Percent in Manufacturing 3.8 3.7 3.5
Percent in Service & Trade 3.2 5.0 6.2
Percent in Domestic Service 2.7 2.3 2.6
Percent in Construction, Mining, Electr, Gas & Water 0.8 0.7 0.8
Age 10.9 11.1 11.1
Female 0.48 0.49 0.49
Race=
Indigenous 0.2 0.3 0.7
White 39.1 36.5 37.1
Black 5.2 4.7 4.8
Yellow 0.1 0.2 0.2
Mixed 55.5 58.3 57.2
HH size 6.6 5.6 5.4
Number of 0-4 year-olds in the household 0.6 0.4 0.4
Number of 5-14 year-olds in the household 2.8 2.2 2.1
P.c. Income* ( 2005 Rp.) 98 141 158
Piped water 0.32 0.56 0.62
Household head education =
No education 51.0 38.1 33.5
Primary 45.2 52.5 52.0
Secondary 1.8 5.5 6.9
Higher 2.0 4.0 7.6
Gini index 0.58 0.56 0.55
Adult unemployment rate 0.011 0.021 0.020
Pupil-teacher ratio 21.7 20.1 -
Poverty 1 (share of children with household income per capita <$1.25 per day) 0.46 0.28 0.22
Poverty2 (share of children with household income per capita between $1.25 and $2 per day) 0.18 0.20 0.21
Observations 14,210 10,814 9,953
*Note: Children’s labour income is dropped from the household income.
The PNAD survey for the year 1992 does not include rural observations for 6 states from the North region. In order to provide consistent decomposition results, rural observations for those states were dropped for the years 2006 and 2008.
Source: UCW calculations based on Brazil PNAD Survey, 1992, 2006 and 2008
61 UCW WORKING PAPER SERIES, JUNE 2011
6.1 Changes in observed characteristics: a decomposition analysis
129. In this section we start by illustrating how compositional changes in
the population of households and individuals contribute to explain trends in
children’s time use over the 16 years of observation.
130. Ex-ante, it is difficult to predict the role of changing household and
children’s characteristics in explaining the trends in children’s work and
schooling. On the one hand, improvements in parental education, say,
should imply a fall in children’s work. Children of more educated parents
are typically less likely to work. On the other hand, say, the observed fall in
the proportion of white children might have acted to counteract this effect:
if white children are less likely to be involved in work and more likely to
attend school, everything else being equal, this should have led to an
increase in children’s work. Similarly, the modest rise in average children’s
age (from 11 to 11.1) should also predict a modest rise in child labour.
131. To ascertain the role of these opposing changes, we use a slightly
modified version of the approach proposed by DiNardo et al. (1996). This
is in turn a simple semi-parametric variation of the Oaxaca decomposition.
We present the methodology in the technical appendix. As mentioned,
following this approach we try to assess what the incidence of children’s
work would have been in 1992 if the distribution of characteristics had
been the one observed in 2008. The difference between the actual
distribution of children’s work in 1992 and this "counterfactual"
distribution provides an estimate of the actual difference in children’s work
between 1992 and 2008 that can be attributed to compositional changes.
The residual variation, i.e. the difference between children’s work
incidence in 2008 and this counterfactual distribution provides an estimate
of the variation in children’s work that is due to both unobserved
compositional changes and to the varying intensity of children’s work
among the groups defined based on observables. In words, if the fall in
children’s work is due - say - to increased living standards or simply to the
fact that parents with any given level of education are less likely to send
their children to work, this variation will be attributed to the residual term.
132. Tables 17 and 18 report, respectively, the actual and counterfactual
level of children’s work and school attendance in 1992 across the five
regions that compose Brazil and for the country as a whole. Tables 19 and
20 provide separate information by State. We present separate
counterfactuals in turn keeping fixed different individual and household
attributes. Column 1 presents the actual 1992 data. Column 2 assumes fixed
child characteristics, column 3 assumes fixed household characteristics,
while column 4 assumes fixed residential location. Finally we compute a
counterfactual distribution assuming all these characteristics are
simultaneously fixed at their 2008 level (column 5).
133. Column 1 of Table 17 shows the actual level of children’s work in
1992: this illustrates substantial heterogeneity in the incidence of children’s
62 BRAZILIAN SUCCESS IN REDUCING CHILD LABOUR:
EMPIRIRCAL EVIDENCE AND POLICY LESSONS
work across the different areas of Brazil. Table 19 shows in particular an
incidence of children’s work in 1992 that varies from as low as 6.1 percent
in the State of Roraima to 29 percent in Maranhao.13
Column 6 of Table 17
reports the incidence of children’s work in 2008. This - as said - is on
average 7 percent. One can observe a generalized fall in children’s work
across all regions.
134. Column 2 of Table 17 reports the counterfactual distribution of
children’s work in 1992 assuming that the demographic characteristics of
children were the ones observed in 2008. In practice we control for
children’s age, sex and ethnicity. Column 2 shows that if the age, gender
and ethnic distribution in 1992 had been the one that was later observed in
2008, children’s work would have been slightly higher (18.3 percent as
opposed to 17.4 percent). This is true across all areas. This should be no
surprise since, as seen in Table 14, the proportion of non-white children
increases over time, implying that, everything else being equal, children’s
work would have risen.
135. Column 3 looks at the role of household characteristics and controls
for the following variables: household size, number of children aged 0-4
and 5-14 in the household and head of household education. Interestingly,
we find quite a significant negative effect of household characteristics on
the incidence of children’s work. In practice, the increase in parental
education among children in Brazil and to a lesser extent the reduction in
family size observed between 1992 and 2008 generate a reduction of about
3.7 percentage points in the incidence of child work, as rural children are
on average more likely to work than urban children (compare columns 1
and 3).
136. Column 4 reports changes in the distribution of children’s work
between 1992 and 2008 that can be attributed to changes in the residential
location of households. Increased urbanization accounts for a reduction in
child work of about 1.75 percentage points (compare columns 1 and 4).
137. In column 5, where we control simultaneously for all the covariates
in columns 2 to 4, we find that the counterfactual distribution of children’s
work is 3.1 percentage points lower than the original one. A comparison of
column 6, where the actual change in child work between 1992 and 2008 is
reported, and column 7, where the change due to differences in observed
characteristics is reported, shows that combined effect of all compositional
effects - such as the varying socio-demographic characteristics of children
and movements between rural and urban areas - explains about one third of
the observed fall in child work.
138. Table 18 reproduces the same exercise for schooling, and Table 20
provides separate information by State. Again we find that changes in
household characteristics and residential location explain a substantial
13
We ignore the Northern States due to the fact that information for these States only refers to urban areas.
63 UCW WORKING PAPER SERIES, JUNE 2011
fraction of the change in school enrolment between 1992 and 2008.
Compositional changes account for around one fourth (3.2 percentage
points) of the 12 percentage point increase in enrolment observed over the
16 years considered.
139. In sum, the characteristics of the population in Brazil have been
changing relatively rapidly since the beginning of the 1990s, and we find
evidence that these changes have played a substantial role in explaining the
fall in children’s work and the rise in schooling that we observe between
1992 and 2008. However, about two thirds of the observed change in
children’s work involvement cannot be explained by compositional
changes in the population. We turn now to identify the role of additional
micro and macro-level economic variables.
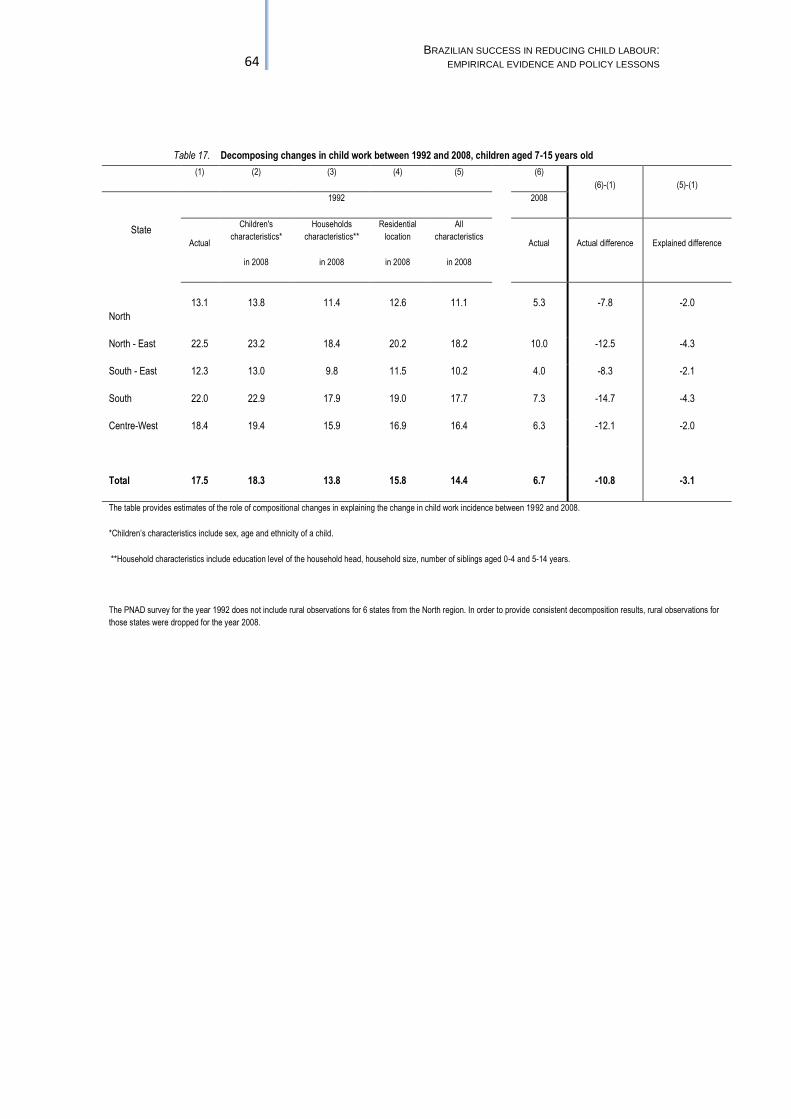
64 BRAZILIAN SUCCESS IN REDUCING CHILD LABOUR:
EMPIRIRCAL EVIDENCE AND POLICY LESSONS
Table 17. Decomposing changes in child work between 1992 and 2008, children aged 7-15 years old
(1) (2) (3) (4) (5) (6)
(6)-(1) (5)-(1)
State
1992 2008
Actual
Children's
characteristics*
in 2008
Households
characteristics**
in 2008
Residential
location
in 2008
All
characteristics
in 2008
Actual Actual difference Explained difference
North
13.1 13.8 11.4 12.6 11.1 5.3 -7.8 -2.0
North - East 22.5 23.2 18.4 20.2 18.2 10.0 -12.5 -4.3
South - East 12.3 13.0 9.8 11.5 10.2 4.0 -8.3 -2.1
South 22.0 22.9 17.9 19.0 17.7 7.3 -14.7 -4.3
Centre-West 18.4 19.4 15.9 16.9 16.4 6.3 -12.1 -2.0
Total 17.5 18.3 13.8 15.8 14.4 6.7 -10.8 -3.1
The table provides estimates of the role of compositional changes in explaining the change in child work incidence between 1992 and 2008.
*Children’s characteristics include sex, age and ethnicity of a child.
**Household characteristics include education level of the household head, household size, number of siblings aged 0-4 and 5-14 years.
The PNAD survey for the year 1992 does not include rural observations for 6 states from the North region. In order to provide consistent decomposition results, rural observations for
those states were dropped for the year 2008.
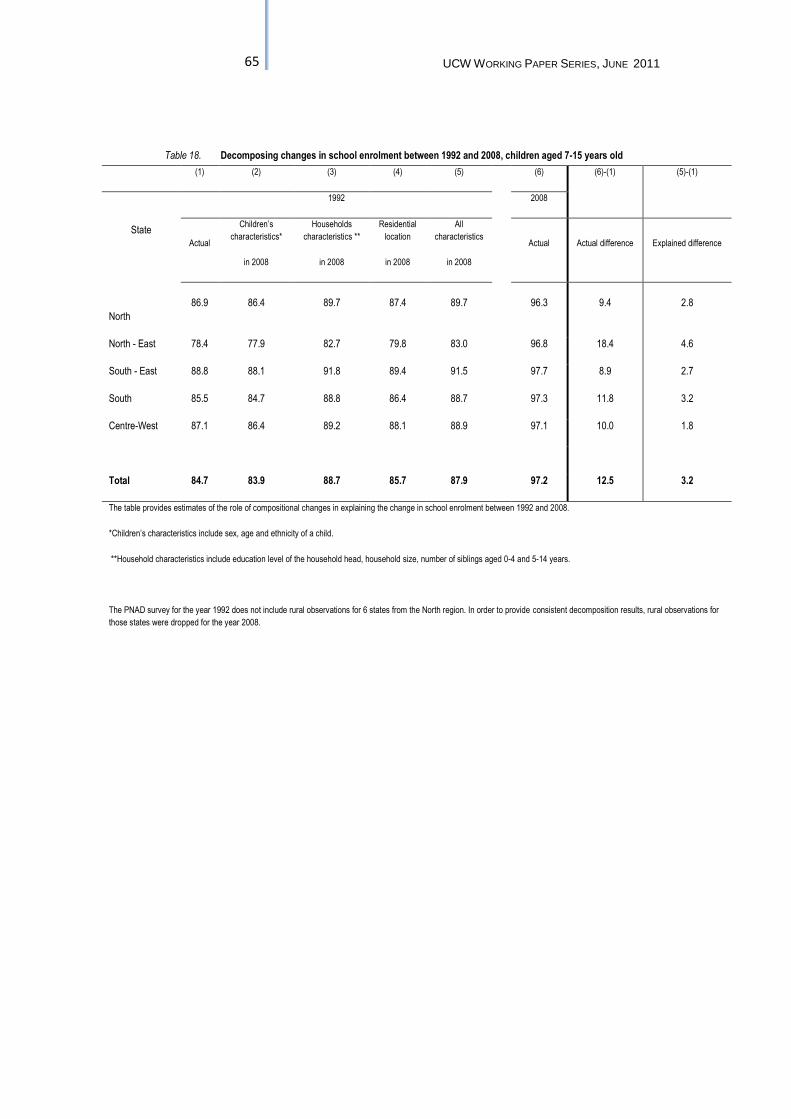
65 UCW WORKING PAPER SERIES, JUNE 2011
Table 18. Decomposing changes in school enrolment between 1992 and 2008, children aged 7-15 years old
(1) (2) (3) (4) (5) (6) (6)-(1) (5)-(1)
State
1992 2008
Actual
Children’s
characteristics*
in 2008
Households
characteristics **
in 2008
Residential
location
in 2008
All
characteristics
in 2008
Actual Actual difference Explained difference
North
86.9 86.4 89.7 87.4 89.7 96.3 9.4 2.8
North - East 78.4 77.9 82.7 79.8 83.0 96.8 18.4 4.6
South - East 88.8 88.1 91.8 89.4 91.5 97.7 8.9 2.7
South 85.5 84.7 88.8 86.4 88.7 97.3 11.8 3.2
Centre-West 87.1 86.4 89.2 88.1 88.9 97.1 10.0 1.8
Total 84.7 83.9 88.7 85.7 87.9 97.2 12.5 3.2
The table provides estimates of the role of compositional changes in explaining the change in school enrolment between 1992 and 2008.
*Children’s characteristics include sex, age and ethnicity of a child.
**Household characteristics include education level of the household head, household size, number of siblings aged 0-4 and 5-14 years.
The PNAD survey for the year 1992 does not include rural observations for 6 states from the North region. In order to provide consistent decomposition results, rural observations for
those states were dropped for the year 2008.
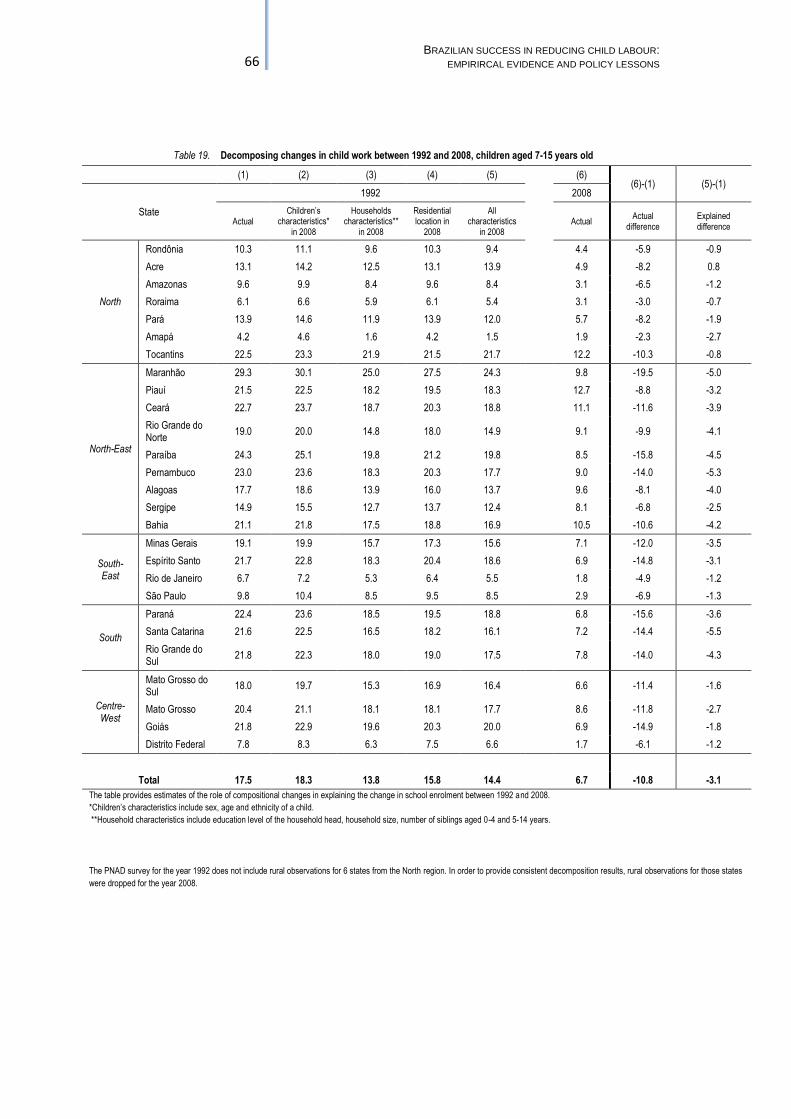
66 BRAZILIAN SUCCESS IN REDUCING CHILD LABOUR:
EMPIRIRCAL EVIDENCE AND POLICY LESSONS
Table 19. Decomposing changes in child work between 1992 and 2008, children aged 7-15 years old
(1) (2) (3) (4) (5) (6) (6)-(1) (5)-(1)
State
1992 2008
Actual Children’s
characteristics* in 2008
Households characteristics**
in 2008
Residential location in
2008
All characteristics
in 2008 Actual
Actual difference
Explained difference
North
Rondônia 10.3 11.1 9.6 10.3 9.4 4.4 -5.9 -0.9
Acre 13.1 14.2 12.5 13.1 13.9 4.9 -8.2 0.8
Amazonas 9.6 9.9 8.4 9.6 8.4 3.1 -6.5 -1.2
Roraima 6.1 6.6 5.9 6.1 5.4 3.1 -3.0 -0.7
Pará 13.9 14.6 11.9 13.9 12.0 5.7 -8.2 -1.9
Amapá 4.2 4.6 1.6 4.2 1.5 1.9 -2.3 -2.7
Tocantins 22.5 23.3 21.9 21.5 21.7 12.2 -10.3 -0.8
North-East
Maranhão 29.3 30.1 25.0 27.5 24.3 9.8 -19.5 -5.0
Piauí 21.5 22.5 18.2 19.5 18.3 12.7 -8.8 -3.2
Ceará 22.7 23.7 18.7 20.3 18.8 11.1 -11.6 -3.9
Rio Grande do Norte
19.0 20.0 14.8 18.0 14.9 9.1 -9.9 -4.1
Paraíba 24.3 25.1 19.8 21.2 19.8 8.5 -15.8 -4.5
Pernambuco 23.0 23.6 18.3 20.3 17.7 9.0 -14.0 -5.3
Alagoas 17.7 18.6 13.9 16.0 13.7 9.6 -8.1 -4.0
Sergipe 14.9 15.5 12.7 13.7 12.4 8.1 -6.8 -2.5
Bahia 21.1 21.8 17.5 18.8 16.9 10.5 -10.6 -4.2
South-East
Minas Gerais 19.1 19.9 15.7 17.3 15.6 7.1 -12.0 -3.5
Espírito Santo 21.7 22.8 18.3 20.4 18.6 6.9 -14.8 -3.1
Rio de Janeiro 6.7 7.2 5.3 6.4 5.5 1.8 -4.9 -1.2
São Paulo 9.8 10.4 8.5 9.5 8.5 2.9 -6.9 -1.3
South
Paraná 22.4 23.6 18.5 19.5 18.8 6.8 -15.6 -3.6
Santa Catarina 21.6 22.5 16.5 18.2 16.1 7.2 -14.4 -5.5
Rio Grande do Sul
21.8 22.3 18.0 19.0 17.5 7.8 -14.0 -4.3
Centre-West
Mato Grosso do Sul
18.0 19.7 15.3 16.9 16.4 6.6 -11.4 -1.6
Mato Grosso 20.4 21.1 18.1 18.1 17.7 8.6 -11.8 -2.7
Goiás 21.8 22.9 19.6 20.3 20.0 6.9 -14.9 -1.8
Distrito Federal 7.8 8.3 6.3 7.5 6.6 1.7 -6.1 -1.2
Total 17.5 18.3 13.8 15.8 14.4 6.7 -10.8 -3.1
The table provides estimates of the role of compositional changes in explaining the change in school enrolment between 1992 and 2008.
*Children’s characteristics include sex, age and ethnicity of a child.
**Household characteristics include education level of the household head, household size, number of siblings aged 0-4 and 5-14 years.
The PNAD survey for the year 1992 does not include rural observations for 6 states from the North region. In order to provide consistent decomposition results, rural observations for those states
were dropped for the year 2008.
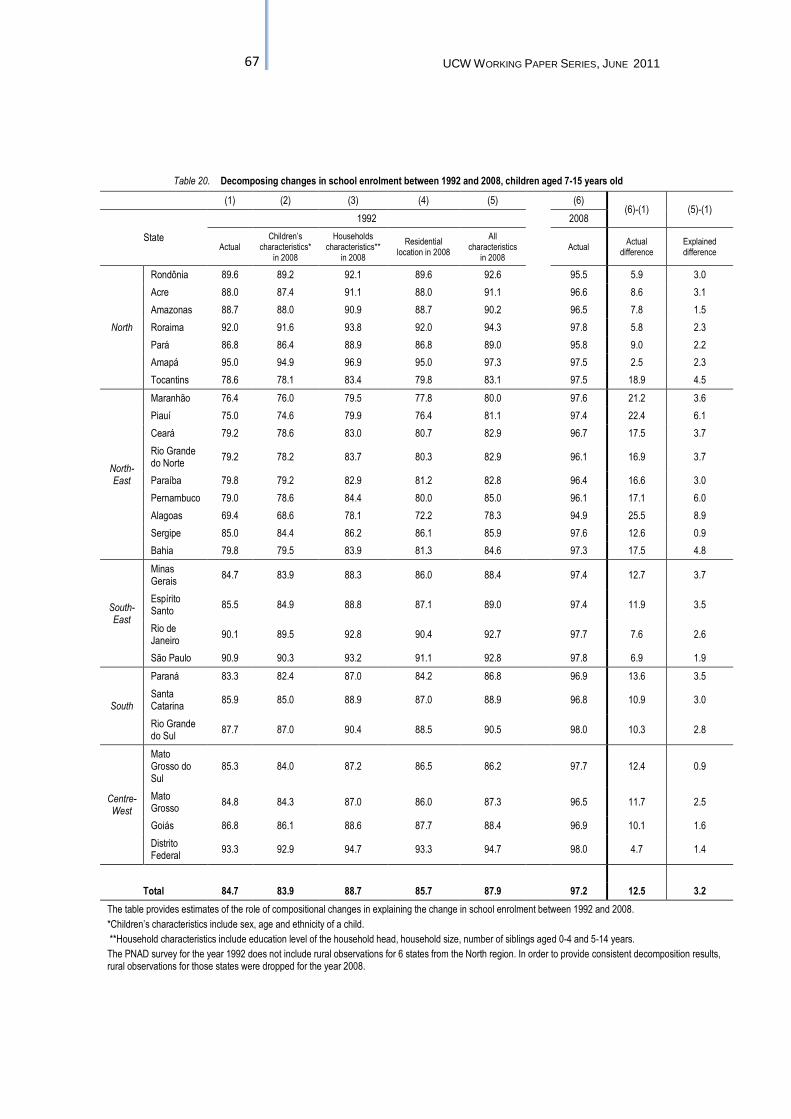
67 UCW WORKING PAPER SERIES, JUNE 2011
Table 20. Decomposing changes in school enrolment between 1992 and 2008, children aged 7-15 years old
(1) (2) (3) (4) (5) (6) (6)-(1) (5)-(1)
State
1992 2008
Actual Children’s
characteristics* in 2008
Households characteristics**
in 2008
Residential location in 2008
All characteristics
in 2008 Actual
Actual difference
Explained difference
North
Rondônia 89.6 89.2 92.1 89.6 92.6 95.5 5.9 3.0
Acre 88.0 87.4 91.1 88.0 91.1 96.6 8.6 3.1
Amazonas 88.7 88.0 90.9 88.7 90.2 96.5 7.8 1.5
Roraima 92.0 91.6 93.8 92.0 94.3 97.8 5.8 2.3
Pará 86.8 86.4 88.9 86.8 89.0 95.8 9.0 2.2
Amapá 95.0 94.9 96.9 95.0 97.3 97.5 2.5 2.3
Tocantins 78.6 78.1 83.4 79.8 83.1 97.5 18.9 4.5
North-East
Maranhão 76.4 76.0 79.5 77.8 80.0 97.6 21.2 3.6
Piauí 75.0 74.6 79.9 76.4 81.1 97.4 22.4 6.1
Ceará 79.2 78.6 83.0 80.7 82.9 96.7 17.5 3.7
Rio Grande do Norte
79.2 78.2 83.7 80.3 82.9 96.1 16.9 3.7
Paraíba 79.8 79.2 82.9 81.2 82.8 96.4 16.6 3.0
Pernambuco 79.0 78.6 84.4 80.0 85.0 96.1 17.1 6.0
Alagoas 69.4 68.6 78.1 72.2 78.3 94.9 25.5 8.9
Sergipe 85.0 84.4 86.2 86.1 85.9 97.6 12.6 0.9
Bahia 79.8 79.5 83.9 81.3 84.6 97.3 17.5 4.8
South-East
Minas Gerais
84.7 83.9 88.3 86.0 88.4 97.4 12.7 3.7
Espírito Santo
85.5 84.9 88.8 87.1 89.0 97.4 11.9 3.5
Rio de Janeiro
90.1 89.5 92.8 90.4 92.7 97.7 7.6 2.6
São Paulo 90.9 90.3 93.2 91.1 92.8 97.8 6.9 1.9
South
Paraná 83.3 82.4 87.0 84.2 86.8 96.9 13.6 3.5
Santa Catarina
85.9 85.0 88.9 87.0 88.9 96.8 10.9 3.0
Rio Grande do Sul
87.7 87.0 90.4 88.5 90.5 98.0 10.3 2.8
Centre-West
Mato Grosso do Sul
85.3 84.0 87.2 86.5 86.2 97.7 12.4 0.9
Mato Grosso
84.8 84.3 87.0 86.0 87.3 96.5 11.7 2.5
Goiás 86.8 86.1 88.6 87.7 88.4 96.9 10.1 1.6
Distrito Federal
93.3 92.9 94.7 93.3 94.7 98.0 4.7 1.4
Total 84.7 83.9 88.7 85.7 87.9 97.2 12.5 3.2
The table provides estimates of the role of compositional changes in explaining the change in school enrolment between 1992 and 2008.
*Children’s characteristics include sex, age and ethnicity of a child.
**Household characteristics include education level of the household head, household size, number of siblings aged 0-4 and 5-14 years.
The PNAD survey for the year 1992 does not include rural observations for 6 states from the North region. In order to provide consistent decomposition results, rural observations for those states were dropped for the year 2008.
68 BRAZILIAN SUCCESS IN REDUCING CHILD LABOUR:
EMPIRIRCAL EVIDENCE AND POLICY LESSONS
6.2 Impact of microeconomic and macroeconomic variables: a regression analysis
140. In this section we turn to consider the effects of changes in living
standards, income distribution, school quality and labour market conditions
on the trends in children’s time use. The analysis is not exhaustive of all the
factors that affect children’s work and schooling since the set of factors we
are able to consider here is limited by the available data.
141. In order to capture the effect of the variables of interest on
children’s activities, we carry out a regression analysis that exploits
variation over time and across states for identification. Let yist be the
outcome variable (children’s work or schooling in different combinations)
for child i in state s at time t.
142. In order to take into account the impact of changing living standards
we consider two measures of household income poverty (excluding
children’s labour income, if any). Poverty1 and Poverty2 are dummy
variables taking, respectively, the value of 1 if the household is in
“extreme” or “moderate” poverty We also introduce a variable measuring
the share of households below the “extreme” poverty line by state and year,
Poor, to proxy for any pro-poor growth. The Gini index of income
inequality by year and State, Gini, controls for changes in the distribution
of income over and above changes in the incidence of poverty. As a
measure of the adult labour market stance we use the unemployment rate
by State and year U . Finally as a proxy for school quality we employ, PTR
, the pupil teacher ratio.
143. In all specifications we also include individual and households
control variables (X) listed in Tables 14-16. We have seen that these
variables explain a non-negligible share of the trends in children’s work
and school enrolment. If they are correlated with changes in living
standards or other macroeconomic and policy variables, ignoring them will
lead to biased regression estimates of the effects of interest. Moreover, by
examining the coefficients associated with them we will also be able to
assess the magnitude of their impact on child work.
144. We can then write our regression model as:
(5) yist = + PTRst + Ust + Poverty1istPoverty2ist Poorst +
+ Ginist + Xist’ + ft + fs + uits
where u is an error term. Model (5) includes time fixed effects (ft) and State
fixed effects (fs). State fixed effects capture permanent differences in the
incidence of children’s work and school enrolment across the 23 States of
69 UCW WORKING PAPER SERIES, JUNE 2011
Brazil, while time fixed effects capture generalized trends in school
attendance and children’s work that are common across states.
145. The model allows us estimate how much of any differential time-
variation across states in children’s work intensity can be attributed to any
of the variables on the right hand side.
146. We report separate estimates for the probability that a child works
and for the probability that a child attends school (Table 21). The estimates
refer to the age group 7 to 15 and are carried out on the period 1992-2006
because, as said, data on the pupil teacher ratio are not available in the last
two years of observation.
147. The top panel in Table 21 shows the effect of children’s and
household characteristics on the probability of working and on that of
attending school. We have discussed the overall role of these variables in
explaining the change in child work and school attendance in the previous
section, we now briefly describe their individual impact.
148. Girls are less likely to work and more likely to be in school than
boys (respectively -7 percentage point and +1 percentage point). Children
in rural areas are more likely to be working and less likely to be attending
school with respect to their urban counterparts. Even conditioning on other
covariates - among which household poverty - there are pronounced
differences across ethnic groups in time use, with indigenous children (the
omitted group) displaying the highest probability of work and the lowest
probability of school attendance (respectively 4 percentage points higher
and 4 percentage points lower than white children).
149. Household characteristics also seem to matter. Larger household
size is associated to a higher propensity to work, although point estimates
are very small in magnitude. The second and third rows of the second panel
report the effect of changes in the number of children aged 0-4 and 5-14.
Because the regressions also include household size, essentially the
coefficients on these variables pick up changes in the number of children at
fixed number of adults. An additional child in the age group 0-4 only
modestly increases the probability of working but it reduces the probability
of attending school by 2 percentage points. This might be due to older
siblings having to take care of their younger siblings and hence being
unable to attend school, a mechanism that is more likely to affect girls.
Parental education is a remarkably strong predictor of children’s time use,
even at fixed household income, with higher parental education being
associated to a lower probability of work and a rise in school attendance.
Children in households headed by university graduates display a 6
percentage points lower probability of work and a 7 percentage points
higher probability of school compared to children in households headed by
an adult with less than completed primary education.
150. Poverty seems to significantly affect children’s time use: a child
belonging to household in extreme poverty sees an increase of 2.3
70 BRAZILIAN SUCCESS IN REDUCING CHILD LABOUR:
EMPIRIRCAL EVIDENCE AND POLICY LESSONS
percentage points in the probability of working and a decrease of 3.3 in that
of attending school. Given the average level of work and school attendance
over the period considered, this implies a fall of about 20 percent in the
probability of working and an increase of about 5 percent in the probability
of attending school. Belonging to a household “moderately” poor has a
significant, but smaller impact on the probability of attending school and
especially of working. Also, the average number of the extreme poor by
state and area has an impact on children’s time allocation with the expected
sign. This is likely to proxy for the overall level of economic development
in that State, increasing decent work opportunities and the effect of poverty
alleviation policies.
151. Rather interesting, access to piped water is a relevant predictor of
children’s time use, being associated with a higher (5 percentage points)
probability of school and a lower (- 5 percentage points) probability of
work. As emphasized above, this large effect might be due to the genuine
effect of water access, as water fetching is often a time consuming activity
delegated to children or most likely the fact that this variable proxies for the
household socio-economic status.
152. Local labour demand and the state of the economic cycle also affect
children’s time use. The unemployment rate has a significant impact on
school attendance: an increase of 1 point in the unemployment rate reduces
school attendance by just less than 1 percentage point. However, it does not
appear to have a significant impact on child work.
153. Increases in the pupil teacher ratio on children’s time use have very
small effects and not always in line with their expected sign.
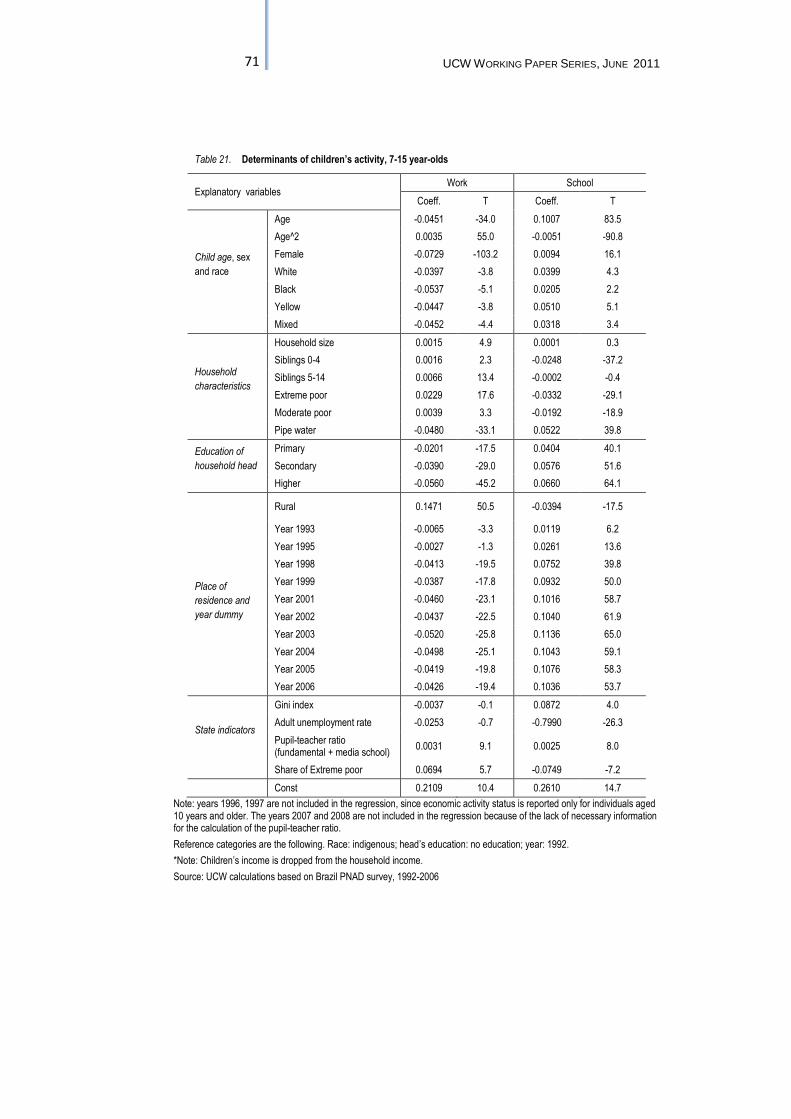
71 UCW WORKING PAPER SERIES, JUNE 2011
Table 21. Determinants of children’s activity, 7-15 year-olds
Explanatory variables Work School
Coeff. T Coeff. T
Child age, sex
and race
Age -0.0451 -34.0 0.1007 83.5
Age^2 0.0035 55.0 -0.0051 -90.8
Female -0.0729 -103.2 0.0094 16.1
White -0.0397 -3.8 0.0399 4.3
Black -0.0537 -5.1 0.0205 2.2
Yellow -0.0447 -3.8 0.0510 5.1
Mixed -0.0452 -4.4 0.0318 3.4
Household
characteristics
Household size 0.0015 4.9 0.0001 0.3
Siblings 0-4 0.0016 2.3 -0.0248 -37.2
Siblings 5-14 0.0066 13.4 -0.0002 -0.4
Extreme poor 0.0229 17.6 -0.0332 -29.1
Moderate poor 0.0039 3.3 -0.0192 -18.9
Pipe water -0.0480 -33.1 0.0522 39.8
Education of
household head
Primary -0.0201 -17.5 0.0404 40.1
Secondary -0.0390 -29.0 0.0576 51.6
Higher -0.0560 -45.2 0.0660 64.1
Rural 0.1471 50.5 -0.0394 -17.5
Place of
residence and
year dummy
Year 1993 -0.0065 -3.3 0.0119 6.2
Year 1995 -0.0027 -1.3 0.0261 13.6
Year 1998 -0.0413 -19.5 0.0752 39.8
Year 1999 -0.0387 -17.8 0.0932 50.0
Year 2001 -0.0460 -23.1 0.1016 58.7
Year 2002 -0.0437 -22.5 0.1040 61.9
Year 2003 -0.0520 -25.8 0.1136 65.0
Year 2004 -0.0498 -25.1 0.1043 59.1
Year 2005 -0.0419 -19.8 0.1076 58.3
Year 2006 -0.0426 -19.4 0.1036 53.7
State indicators
Gini index -0.0037 -0.1 0.0872 4.0
Adult unemployment rate -0.0253 -0.7 -0.7990 -26.3
Pupil-teacher ratio (fundamental + media school)
0.0031 9.1 0.0025 8.0
Share of Extreme poor 0.0694 5.7 -0.0749 -7.2
Const 0.2109 10.4 0.2610 14.7
Note: years 1996, 1997 are not included in the regression, since economic activity status is reported only for individuals aged 10 years and older. The years 2007 and 2008 are not included in the regression because of the lack of necessary information for the calculation of the pupil-teacher ratio.
Reference categories are the following. Race: indigenous; head’s education: no education; year: 1992.
*Note: Children’s income is dropped from the household income.
Source: UCW calculations based on Brazil PNAD survey, 1992-2006
72 BRAZILIAN SUCCESS IN REDUCING CHILD LABOUR:
EMPIRIRCAL EVIDENCE AND POLICY LESSONS
Table 22. Determinants of children’s activity, 7-15 year-olds
Explanatory variables Work only School only Work and school Neither
Coeff. T Coeff. T
Child age, sex
and race
Age -0.03678 -53.81 0.109059 69.53 -0.00832 -6.7 -0.06396 -60.57
Age^2 0.00206 61.31 -0.00652 -89.02 0.001421 24.02 0.003044 63.08
Female -0.01483 -43.54 0.067437 83.62 -0.05806 -87.2 0.005453 10.88
White -0.02391 -3.68 0.056011 4.95 -0.01581 -1.63 -0.01629 -2.18
Black -0.0219 -3.35 0.052557 4.6 -0.03181 -3.24 0.001146 0.15
Yellow -0.02964 -4.35 0.066373 5.12 -0.01506 -1.35 -0.02167 -2.65
Mixed -0.0236 -3.63 0.053671 4.74 -0.02157 -2.22 -0.00851 -1.14
Household characteristics
Household size 0.000278 1.77 -0.00109 -3.14 0.00119 4.24 -0.00038 -1.64
Siblings 0-4 0.005349 13.89 -0.02107 -25.58 -0.00375 -5.79 0.019468 33.11
Siblings 5-14 0.00031 1.19 -0.00649 -11.69 0.006276 13.6 -9.4E-05 -0.27
Extreme poor 0.009466 13.69 -0.04657 -31.19 0.013431 10.98 0.023669 24.33
Moderate poor 0.004767 7.98 -0.01828 -13.49 -0.00089 -0.81 0.014406 16.46
Pipe water -0.01954 -24.83 0.080753 48.03 -0.02853 -21.13 -0.03269 -28.91
Education of household head
Primary -0.01575 -25.87 0.044622 34.01 -0.00432 -4.03 -0.02455 -28.59
Secondary -0.02001 -32.46 0.07657 49.08 -0.01898 -14.98 -0.03758 -38.57
Higher -0.02124 -36.14 0.100642 70.59 -0.0347 -29.9 -0.0447 -50.28
Rural 0.035192 22.9 -0.15131 -48.16 0.111911 40.31 0.004203 2.32
Place of residence and year dummy
Year 1993 -0.00442 -3.58 0.013772 6.02 -0.00205 -1.15 -0.0073 -4.49
Year 1995 -0.00808 -6.52 0.020502 8.71 0.005457 2.91 -0.01787 -11.03
Year 1998 -0.0366 -30.55 0.079704 32.97 -0.00462 -2.35 -0.03848 -24.2
Year 1999 -0.04339 -36.23 0.088241 36.07 0.004741 2.33 -0.04959 -31.83
Year 2001 -0.045 -41.37 0.102345 45.21 -0.00093 -0.5 -0.05642 -38.65
Year 2002 -0.04369 -41.27 0.103834 47 1.68E-05 0.01 -0.06016 -42.35
Year 2003 -0.04877 -44.56 0.116632 50.95 -0.00317 -1.69 -0.06469 -43.69
Year 2004 -0.04295 -38.99 0.11089 48.67 -0.00681 -3.69 -0.06113 -40.78
Year 2005 -0.04245 -36.39 0.106788 44.28 0.000645 0.33 -0.06499 -41.66
Year 2006 -0.03908 -32.15 0.10681 42.62 -0.00343 -1.68 -0.0643 -39.38
State indicators
Gini index -0.04877 -3.74 0.039604 1.36 0.045163 1.85 0.352018 13.67
Adult unemployment rate 0.446949 23.99 -0.32637 -7.71 -0.47259 -13.08 0.352018 13.67
Pupil-teacher ratio (fundamental + media school) -5.9E-05 -0.31 -0.00066 -1.69 0.003141 10.04 -0.00242 -9.04
Share of Extreme poor 0.06857 9.47 -0.07558 -5.75 0.000754 0.07 0.006252 0.74
Const 0.234566 21.07 0.286008 12.46 -0.0237 -1.24 0.50313 33.7
Note: years 1996, 1997 are not included in the regression, since economic activity status is reported only for individuals aged 10 years and older. The years 2007 and 2008 are not included in the regression because of the lack of necessary information for the calculation of the pupil-teacher ratio.
Reference categories are the following. Race: indigenous; head’s education: no education; year: 1992.
*Note: Children’s income is dropped from the household income.
Source: UCW calculations based on Brazil PNAD survey, 1992-2006
73 UCW WORKING PAPER SERIES, JUNE 2011
6.3 Impact of Bolsa Escola and PETI: auxiliary regression analysis
154. As we have seen, changes in living standards appear to have a
substantial impact on trends in children’s activities. Active social protection
policies might have contributed to reduce vulnerability and to raise such
standards. In this section we integrate our previous analysis by including in
the regressions variables that pick up the expansion of Bolsa Familia and
PETI over time.
155. The available evidence based on impact evaluations of these
programs has been already discussed in the previous sections. Because we
have no direct information on household or child-level recipiency or
eligibility for either these programs in the PNAD, we try to identify their
effect by using the take-up ratio of each of these programs in each year and
state. For Bolsa Familia, we use the share of household with children aged
0 to 15 who benefit from the program. For PETI we use a similar measure:
the ratio of children benefitting from the program to the total number of
children in the relevant at-risk age group (7-15).
156. The estimates, however, are only suggestive as information on take
up ratios is only available for the years 2004 to 2007 (recall that Bolsa
Familia only started in 2003).14
157. We use PNAD data for the period 2004-2007 to estimate a model
similar to that estimated in the previous section, where we additionally
control for exposure to these two programs. Table 23 provides the
estimated fraction of Bolsa Familia beneficiary household and PETI
beneficiary children in each state in 2004 and 2007. One can see that while
24% of households benefitted from Bolsa Familia in 2004, i.e. one year
after its inception, in 2007 this number was almost 40%, suggesting a
gradual scaling up of the program. There is substantial heterogeneity in the
levels of Bolsa Familia coverage. In particular one can see a rapid spread of
the programme in the poorer areas in the North and Northeast regions.
Although similar regional patterns can be observed for PETI,
unsurprisingly, this programme was much less widespread than Bolsa
Familia and its coverage remained roughly unchanged between 2004 and
2007. In both years, around 3% of children where benefitting from PETI,
with higher coverage in the North, Northeast, and Center-West regions.
14
Unfortunately, we do not have comparable information on the spread of previous Bolsa Escola/Bolsa Familia programs. As said, these programs were highly decentralized, explaining why systematic data do not exist, and were extremely heterogeneous, explaining why a systematic analysis of their impact might be extremely daunting. Also, data on Bolsa Familia in 2008 are not available.
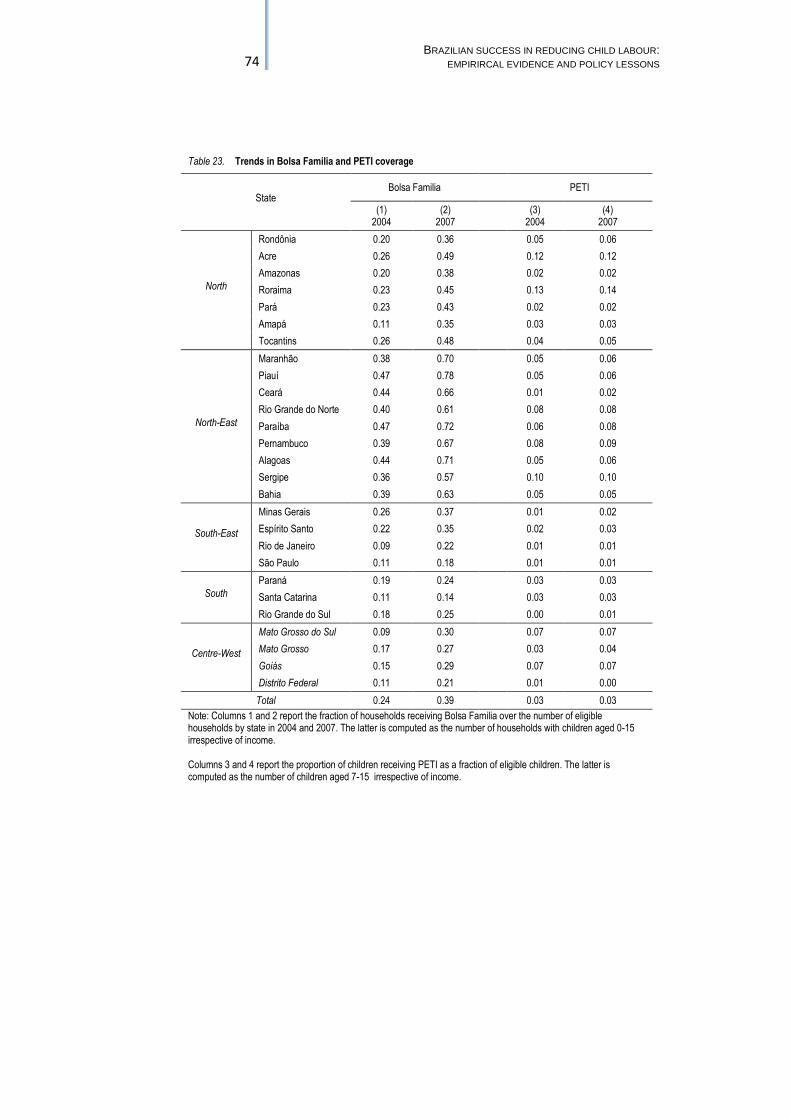
74 BRAZILIAN SUCCESS IN REDUCING CHILD LABOUR:
EMPIRIRCAL EVIDENCE AND POLICY LESSONS
Table 23. Trends in Bolsa Familia and PETI coverage
State Bolsa Familia PETI
(1) 2004
(2) 2007
(3)
2004 (4)
2007
North
Rondônia 0.20 0.36 0.05 0.06
Acre 0.26 0.49 0.12 0.12
Amazonas 0.20 0.38 0.02 0.02
Roraima 0.23 0.45 0.13 0.14
Pará 0.23 0.43 0.02 0.02
Amapá 0.11 0.35 0.03 0.03
Tocantins 0.26 0.48 0.04 0.05
North-East
Maranhão 0.38 0.70 0.05 0.06
Piauí 0.47 0.78 0.05 0.06
Ceará 0.44 0.66 0.01 0.02
Rio Grande do Norte 0.40 0.61 0.08 0.08
Paraíba 0.47 0.72 0.06 0.08
Pernambuco 0.39 0.67 0.08 0.09
Alagoas 0.44 0.71 0.05 0.06
Sergipe 0.36 0.57 0.10 0.10
Bahia 0.39 0.63 0.05 0.05
South-East
Minas Gerais 0.26 0.37 0.01 0.02
Espírito Santo 0.22 0.35 0.02 0.03
Rio de Janeiro 0.09 0.22 0.01 0.01
São Paulo 0.11 0.18 0.01 0.01
South
Paraná 0.19 0.24 0.03 0.03
Santa Catarina 0.11 0.14 0.03 0.03
Rio Grande do Sul 0.18 0.25 0.00 0.01
Centre-West
Mato Grosso do Sul 0.09 0.30 0.07 0.07
Mato Grosso 0.17 0.27 0.03 0.04
Goiás 0.15 0.29 0.07 0.07
Distrito Federal 0.11 0.21 0.01 0.00
Total 0.24 0.39 0.03 0.03
Note: Columns 1 and 2 report the fraction of households receiving Bolsa Familia over the number of eligible households by state in 2004 and 2007. The latter is computed as the number of households with children aged 0-15 irrespective of income. Columns 3 and 4 report the proportion of children receiving PETI as a fraction of eligible children. The latter is computed as the number of children aged 7-15 irrespective of income.
75 UCW WORKING PAPER SERIES, JUNE 2011
158. The numbers in Table 23 provide admittedly imperfect measures of
program exposure, as they reflect both the demand for these programs as
well as their supply. To the extent, for example, that higher child labour
incidence implies that a higher proportion of children in the relevant age
group will benefit from PETI, one will find a positive coefficient on the
PETI exposure variable in a child labour equation, overestimating the
causal effect of the policy. By the opposite token, if, say, a higher
proportion of children in school implies that fewer will benefit from Bolsa
Familia, regression estimates of the impact of Bolsa Familia in a schooling
equation will be downward biased, hence leading to underestimate the
effect of this policy.
159. It is also worth stressing that in the regressions we condition on
household income, poverty status and aggregate poverty and inequality.
The Bolsa Familia and PETI variables hence will pick up any effect of the
policies over and above their effect on parental income and the incidence of
poverty. This is important as these are likely to be relevant channels behind
the effect of these policies.
160. Focusing on the pooled sample, in Table 24, one first observation is
that results are slightly less precise than for the entire period. This should
not be surprising, as the reduction in sample size (from 12 waves to 4
waves of the PNAD) implies essentially that standard errors will roughly
double. In particular differences across ethnic groups in child labour seem
to be insignificant. This might be effectively the result of differences in
sample size or of a substantial time convergence across ethnic groups in the
incidence of child labour, with larger progress among more disadvantaged
groups.
161. Indeed, coefficients on the other household variables are in general
lower in magnitude: this is true for access to piped water, parental
education, the rural dummy and household income. This implies that
differences in school attendance and child labour across socioeconomic
groups have become less pronounced over time.
162. Once we focus on the effect of Bolsa Familia, we find that for extra
100 children in the program, there are 2 additional children in school. The
effect on work is similar in magnitude and of opposite sign but not
statistically significant.
163. The effect is admittedly modest, implying that most Bolsa Familia
beneficiary children would have attended school anyway. As said, though,
our conclusions are tempered by the fact that we are conditioning on
parental income and poverty status. Also, recall that coefficients are
possibly underestimated if higher school attendance implies that a lower
proportion of children benefit from Bolsa Familia due to reverse casualty.
Measurement error in the estimated coverage is also likely to lead to
estimates that are biased towards zero. By all accounts, these regression
results must be taken with a degree of caution.
76 BRAZILIAN SUCCESS IN REDUCING CHILD LABOUR:
EMPIRIRCAL EVIDENCE AND POLICY LESSONS
164. We find no significant effects of PETI, measured by the fraction of
beneficiary children in the relevant age group. This is most likely due to the
modest changes in the size of the programme in the period considered and
to the fact that, as previously mentioned, we control for changes in poverty.
6.4 Explaining the fall in child labour in Brazil
165. In this section we use the evidence from the regressions above to
quantify the extent by which economic variables - both at micro and the
macro level - can explain the decline in child labour observed in Brazil
between 1992 and 2008. To do so, we revert to the results from the main
regression for the entire period in Table 21. We discuss in closing the role
of government policies.
166. One direct way to assess the contribution of observed covariates in
explaining trends in child labour consists in examining the patterns of the
time effects in the regressions in Table 21. The time dummies pick any
change in child labour over time that is unaccounted for by the model.
Estimates show that, conditional on all the included regressors, the time
dummy for 2006, i.e. the unexplained difference in child labour between
the end and the beginning of the period (the omitted time dummy) is -4.46
percentage points. This has to be compared with an overall change in child
labour of approximately 10 percentage points from 1992 to 2006. This
implies that the included regressors explain around 54 percent of the
observed fall in child labour. This is a remarkable result for a relatively
parsimonious model and one that is not typical of comparable analyses for
other countries.
167. One can alternatively compute the individual contribution of
different variables using the regression coefficients in Table 21 together
with observed changes in the exogenous covariates in Table 14. In line with
our initial decomposition, the regression estimates confirm that just below
30 percent of the observed fall in child labour is explained by changes in
the distribution of observable household characteristics, primarily
improvements in parental education. The residual 30 percent is explained
by improvements in living standards and an overall fall in poverty (around
17 per cent), increased access to piped water (8 percent) and improvements
in school quality (5 percent).
168. We are unable to identify a very significant effect of Bolsa Familia
and PETI. This is due to the poor quality of the data and an array of
econometric problems that we are unable to address given these data
restrictions. Most important, our empirical analysis attempts to identify the
role of these policies over and above their mediated effect on poverty, the
single major force behind the fall in child labour in Brazil. To the extent
that government policies, and especially Bolsa Familia, are responsible for
most or all of the fall in poverty observed in the period of analysis, a very
positive evaluation of their role emerges.
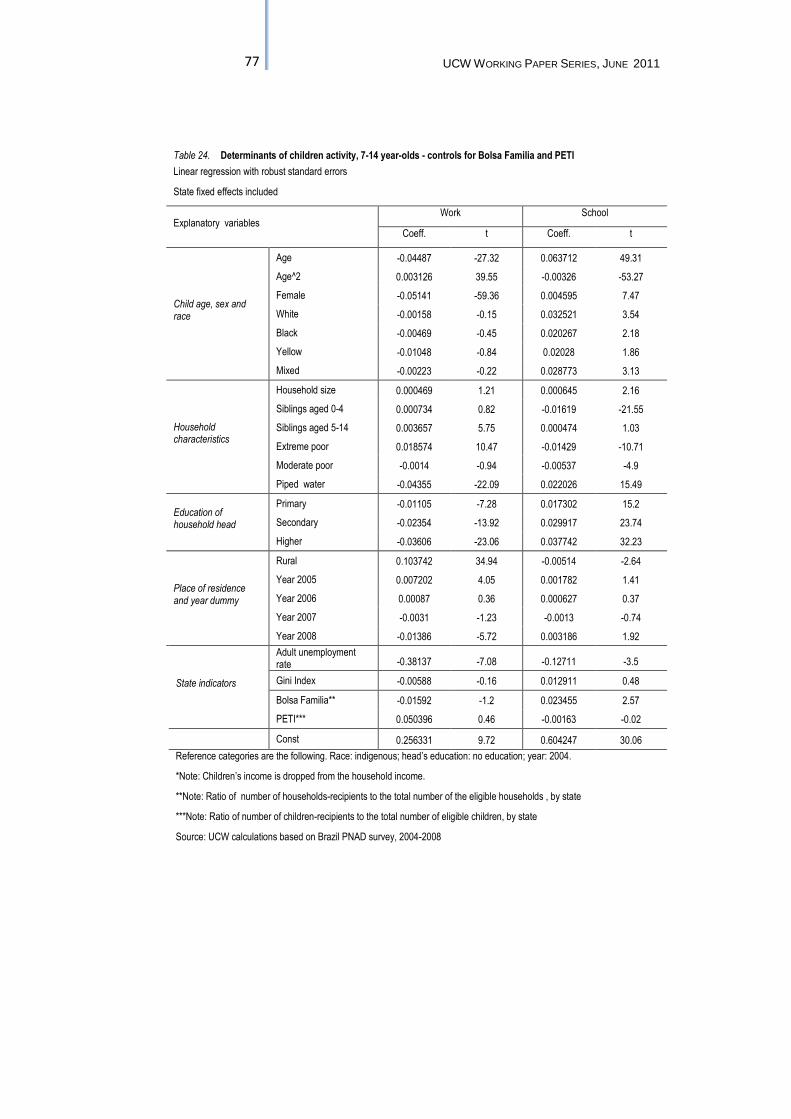
77 UCW WORKING PAPER SERIES, JUNE 2011
Table 24. Determinants of children activity, 7-14 year-olds - controls for Bolsa Familia and PETI
Linear regression with robust standard errors
State fixed effects included
Explanatory variables Work School
Coeff. t Coeff. t
Child age, sex and race
Age -0.04487 -27.32 0.063712 49.31
Age^2 0.003126 39.55 -0.00326 -53.27
Female -0.05141 -59.36 0.004595 7.47
White -0.00158 -0.15 0.032521 3.54
Black -0.00469 -0.45 0.020267 2.18
Yellow -0.01048 -0.84 0.02028 1.86
Mixed -0.00223 -0.22 0.028773 3.13
Household characteristics
Household size 0.000469 1.21 0.000645 2.16
Siblings aged 0-4 0.000734 0.82 -0.01619 -21.55
Siblings aged 5-14 0.003657 5.75 0.000474 1.03
Extreme poor 0.018574 10.47 -0.01429 -10.71
Moderate poor -0.0014 -0.94 -0.00537 -4.9
Piped water -0.04355 -22.09 0.022026 15.49
Education of household head
Primary -0.01105 -7.28 0.017302 15.2
Secondary -0.02354 -13.92 0.029917 23.74
Higher -0.03606 -23.06 0.037742 32.23
Place of residence and year dummy
Rural 0.103742 34.94 -0.00514 -2.64
Year 2005 0.007202 4.05 0.001782 1.41
Year 2006 0.00087 0.36 0.000627 0.37
Year 2007 -0.0031 -1.23 -0.0013 -0.74
Year 2008 -0.01386 -5.72 0.003186 1.92
State indicators
Adult unemployment rate -0.38137 -7.08 -0.12711 -3.5
Gini Index -0.00588 -0.16 0.012911 0.48
Bolsa Familia** -0.01592 -1.2 0.023455 2.57
PETI*** 0.050396 0.46 -0.00163 -0.02
Const 0.256331 9.72 0.604247 30.06
Reference categories are the following. Race: indigenous; head’s education: no education; year: 2004.
*Note: Children’s income is dropped from the household income.
**Note: Ratio of number of households-recipients to the total number of the eligible households , by state
***Note: Ratio of number of children-recipients to the total number of eligible children, by state
Source: UCW calculations based on Brazil PNAD survey, 2004-2008
78 BRAZILIAN SUCCESS IN REDUCING CHILD LABOUR:
EMPIRIRCAL EVIDENCE AND POLICY LESSONS
7. CONCLUSIONS
169. This report has highlighted the long distance that Brazil has
travelled along the road towards child labour elimination over the last
decade and a half. A comparison of the results of the Pesquisa Nacional
por Amostra de Domicilios (PNAD) survey programme from 1992 to 2009
indicates an overall fall in children’s employment among 7-15 year olds by
more than half, from 18 percent to less than seven percent. During the same
period and for the same age group, school attendance rose from 85 percent
to 97 percent. The decline in children’s employment and the increase in
their schooling extended to the entire 7-15 age range, but the fall in
children’s employment and the rise in the school attendance of 12-15 year-
old were particularly pronounced. Gender, rural-urban and regional
disparities in school attendance were substantially reduced if not eliminated
over the 1992 to 2009 period.
170. Not only did the level of involvement in employment decline
substantially, but the age of entry in employment increased by almost two
years. In 1992, participation rates were positive for children aged eight
years or more, while in 2008, the involvement of children in employment
remained essentially negligible until the age of 10 years, and started to only
increase thereafter. A similar pattern can be observed for school attendance
rates – not only did the level of school attendance increase over the years,
but children in 2008 entered earlier and left school substantially later than
16 years prior. The intersection of these two trends has meant a favourable
change in the profile of the (diminishing share of) children in child labour:
they are older (and therefore are less vulnerable) and attend school in
greater proportion (and therefore are less compromised educationally)
compared to child labourers in the past.
171. This progress notwithstanding, the national development milestone
of child labour elimination has not yet been reached in Brazil. PNAD data
for 2008 indicate that some 2.1 million children aged 7-15 years, almost
seven percent of this age group, were still at work in employment in this
reference year, underscoring the scale of remaining challenge posed by
child labour in the country. Who are these children? The PNAD data also
permit a statistical profile of the group still in employment: they are more
likely to boys than girls, to live in the countryside rather than in cities and
town, and to be at the upper end of the 7-15 years age spectrum. The largest
share is found in the agriculture sector and in unpaid family or other
informal sector work, largely beyond the realm of formal labour
inspections. Almost all are also students, but the fact that they must log an
average of almost 20 hours of work per week limits their time and energy
for study, and consequently their ability to keep up with their non-working
peers.
79 UCW WORKING PAPER SERIES, JUNE 2011
172. Understanding the factors underlying Brazil’s success in reducing
child labour over the last decade and a half will be important to extending
this success to the remaining child labour population. What were the
primary contributors to Brazil’s success? A large body of evidence
suggests that the role of policy was critical. The policy reforms and
national-level interventions in the social sphere enacted in Brazil over the
study period (see Section 2) contributed to profound changes in the
country’s socio-economic conditions: living standards improved, poverty
fell, access to basic services expanded, schools improved, and successive
generations of parents became increasingly educated. These positive socio-
economic changes in turn accounted for much of the explained decline in
child labour over the study period.
173. Impact evaluations of Bolsa Escola – the large-scale Government
cash transfer programme conditional on school attendance (but not on
removal from child labour) – indicate that it played a particularly important
role in reducing inequality in the country (World Bank, 2009; Paes de
Barros, Foguel and Ulyssea, 2006) and in raising school attendance rates
(Abramovay et al., 1998; World Bank, 2001b; Aguiar and Araújo, 2002;
Cardoso and Souza, 2004). Early evaluations of Bolsa Escola were
inconclusive in terms of its effect on child labour, but more recent studies,
involving more sophisticated comparisons of treatment and control groups,
indicate that the programme has also succeeded in reducing the probability
of child labour (Ferro, Kassouf and Levison, 2007; Ferro and Nicollela,
2007). Initial impact evaluations of another Government cash transfer
programme – PETI – that does contain removal from child labour as an
explicit eligibility criterion suggest that the programme has also had a
significant effect on child labour rates in the programme sites (Yap et al,
2001; World Bank, 2001b; Pianto and Soares, 2003).
174. Research also points to the importance of policy efforts in other
areas. Ferro and Kassouf (2005b) found that the increase in the minimum
working age in 1998 from 14 to 16 years led to a statistically significant
decline in the share of 14-15 year-olds in child labour. A study by Santos
and Souza (2007) highlighted the important role of addressing school
quality factors such as the average schooling of public school teachers.
Manacorda and Rosati (2009) point to the important role of changes in the
industrial mix and production technologies, in turn partially the product of
Government industrial policy. They found that Brazilian states witnessing
declines in the relative importance child labour-intensive industries (i.e.,
low productivity industries with obsolete production technologies) also saw
declines in child labour.
175. The empirical analysis presented in the current study – based on the
unique PNAD dataset covering the 1992 to 2008 period – corroborates
other research pointing to the central role of policy in the decline in child
labour. In specific terms, the empirical analysis indicated that about 30
percent of the fall child labour was attributable to improvements in parental
80 BRAZILIAN SUCCESS IN REDUCING CHILD LABOUR:
EMPIRIRCAL EVIDENCE AND POLICY LESSONS
education, while only a small percentage was attributable to other changes
in the population structure less susceptible to direct policy intervention,
including smaller family sizes and greater urbanisation. Improvements in
living standards and an overall fall in poverty – spurred by social security
reforms and broad-scale cash transfer schemes such as Bolsa Escola and
PETI – also played a central role, accounting for around 17 percent of the
decline in child labour. Successful efforts to increase piped water access
and to improve school quality, accounted by eight and five percent,
respectively, of the decline in child labour.
176. What lessons does Brazil offer for countries where efforts against
child labour have been less successful? First and foremost, the Brazil
experience highlights the importance of an active Government response.
The decline in child labour in Brazil did not happen by itself – only a small
proportion can be explained by changes in the population structure
unrelated to policy. Much of the decline, on the other hand, can be traced
to active policy efforts to extend and improve schooling, which have led to
more educated generations of parents, efforts to implement broad-scale
cash transfer schemes, which have helped improve living standards and
shift incentives structures in favour of schooling, and efforts to expand
basic services, which have freed children from tasks such as water
collection. This leads to a second key lesson from Brazil – the nature of a
policy response to child labour. The complexity of child labour means that
there is no single answer to it. Brazil’s success has underscored the value
of a comprehensive policy response, addressing in an integrated fashion the
wide range of factors contributing to child labour.
81 UCW WORKING PAPER SERIES, JUNE 2011
REFERENCES
Abramovay, M., C. Andrade, and Waiselfisz J.J. (1998): Bolsa Escola: melhoria educacional e redução da pobreza. UNESCO. Aguiar, M. and Araúja C. (2002): Bolsa Escola: Education to Confront Poverty. UNESCO. Arends-Kuenning M. and Duryea S. (2003): "School Attendance, Child Labor and Local Labor Market Fluctuations in Urban Brazil". World Development, Volume 31, Issue 7, pp 1165-1178. Baland, J. and J. Robinson (2000), “Is Child Labor Inefficient?” Journal of Political Economy, 108 (2000), 663-679. Barros, R., Foguel M.N., & Ulyssea G (2006). “Desigualdade de Renda no Brasil:Uma Análise da Queda Recente”, Instituto de Pesquisa Econômica Aplicada, Brasilia Barros, R., Mendonça, R., & Santos, D., Quintaes G (2001). “Determinantes do desempenho educacional no Brasil”, Instituto de Pesquisa Econômica Aplicada Texto para Discussão, no. 834, Rio de Janeiro:. Barros, R., Mendonça, R., and Blanco, F. (2001), “O Mercado de Trabalho para Professores no Brasil”, Anais do XXIX Encontro Nacional de Economia. Salvador: ANPEC. Barros, R., Mendonça, R., Pereira Deliberalli, P., and Bahia, M. (2000). O trabalho domestico infant juvenil no Brasil, Mimeo. Rio de Janeiro: Instituto de Pesquisa Economica Aplicada. Barros, R., Fox, L and Mendonça, R. (1997): “Female-Headed Households, Poverty, and the Welfare of Children in Urban Brazil”. Economic Development and Cultural Change, The University of Chicago Press ,Vol. 45, No. 2 (Jan., 1997), pp. 231-257. Barros, R.., Mendonça, R., and Velazco, T. (1996): A pobreza é a principal causa do trabalho infantil no Brasil urbano? A Economia Brasileira Em Perspectiva. Barros, R., Mendonça, R., and Velazco, T. (1994), “Is poverty the main cause of child work in urban Brazil?”, Instituto de Pesquisa Econômica Aplicada Texto para Discussão, no. 351. Rio de Janeiro.. Basu, Kaushik. 1999. “Child Labor: Cause, Consequence, and Cure.” Journal of Economic Literature 37(3):1083–119. Bezerra M.E, Kassouf A.L. and Arends-Kuenning M. (2009): "The Impact of Child Labour and School Quality on Academic Achievement in Brazil", IZA Discussion Paper Series, No.4062. Brazilian Court of Audit (2003): TCU Evaluation of the Child Labour Eradication Program, Brazilian Court of Audit – Brasilia: TCU, Government Programs Control and Evaluation Secretariat, 2003.
82 BRAZILIAN SUCCESS IN REDUCING CHILD LABOUR:
EMPIRIRCAL EVIDENCE AND POLICY LESSONS
Bourguignon, F., Ferreira, F. and Leite, P. (2003): "Conditional Cash Transfers, Schooling and Child Labor: Micro-simulating Bolsa Escola". The World Bank Economic Review, vol. 17, no. 2 229-254.
Cardoso, Ana Rute & Verner, Dorte, (2007). "School drop-out and push-out factors in Brazil: the role of early parenthood, child labor, and poverty," The World Bank Policy Research Working Paper Series 4178..
Cardoso E. and Souza A.P, 2004. “The Impact of Cash Transfers on Child Labor and School Attendance in Brazil”, Department of Economics, Vanderbilt University Working Papers, 0407. Carvalho Filho I.E, (2008). "Household Income As A Determinant of Child Labour and School Enrollment in Brazil: Evidence From A Social Security Reform," IMF Working Papers 08/241, International Monetary Fund. Cigno, A and Rosati, F.C. (2005), “The economics of child labor”, Oxford University Press. De Janvry, A.; F. Finan; E. Sadoulet; (2008): “Local Governance and efficiency of conditional cash transfers: Bolsa Escola in Brazil” mimeo, University of California, Berkeley. De Janvry, A.; F. Finan; E. Sadoulet; D. Nelson; K. Lindert; B. de la Brière and P. Lanjouw (2005) : “Brazil’s Bolsa Escola Program: The Role of Local Governance in Decentralized Implementation” World Bank, Social Protection Unit, December. De Mello L. and Hoppe M., (2005): "Education Attainment in Brazil: The Experience of FUNDEF," OECD Economics Department Working Papers 424, OECD, Economics Department. Duryea, S., Lam D., and Levison D. (2007): "Effects of Economic Shocks on Children's Employment and Schooling in Brazil." Journal of Development Economics, 84 (1): 188-214 Duryea, S. and M. Arends-Kuenning (2003): "School attendance, Child labour and Local Labour Market Fluctuations in Urban Brazil", World Development, 31(7), 1165-1177 Duryea, S. (1997): “Children's advancement through school in Brazil: the role of transitory shocks to household income”. Working Paper Series #376, Research Department, Inter-American Development Bank. Edmonds E. (2006). Understanding Sibling Differences in Child Labour, Journal of Population Economics, Vol. 19, No. 4, pp. 795-821. Emerson, P. M., and Souza, A. P. (2008). Birth Order, Child Labor, and School Attendance in Brazil, World Development, Vol. 36, No. 9, pp. 1647–1664.
83 UCW WORKING PAPER SERIES, JUNE 2011
Emerson, P. M., and Souza, A. P. (2007a). Is child labor harmful? The impact of working earlier in life on adult outcomes, mimeo. Emerson, P. M., and Souza, A. P. (2007b). Child labor, school attendance and intra-household gender bias in Brazil. World Bank Economic Review, 21(2), 301–316. Emerson, P. M., and Knabb, S. D. (2006). Opportunity, inequality and the intergenerational transmission of child labor. Economica, 73(291), 413–434. Emerson, P., and Souza, A. P. (2003). Is there a child labor trap? Inter-generational persistence of child labor in Brazil. Economic Development and Cultural Change, 51(2), 375–398 Fallon, P. S. Lucas and Robert E.B. (2002): "The Impact of Financial Crises on Labor
Markets, Household Incomes, and Poverty: A Review of Evidence", The World Bank
Research Observer 17 (1), 21-45
Fausto, A., and Cervini, R. (1991). O trabalho e rua: crianças e adolescents no Brasil urbano dos anos 80. UNICEF/Flasco/CBIA, Cortez Editora, Sao Paolo. Ferreira F. and R. N. Schady (2008): "Aggregate Economic Shocks, Child Schooling
and Child Health", World Bank Policy Research Working Paper, No. 4701
Ferro, A. R. and A. C. Nicollela (2007). The Impact of Conditional Cash Transfers Programs on Household Work Decisions in Brazil. mimeo, Universidade de São Paulo. Ferro, A. R.; Kassouf, A.L. and D. Levison. (2007): The Impact of Conditional Cash Transfer Program in Brazil on Household Work Decisions in Brazil, mimeo.
Ferro, A. R.; Kassouf, A.L. (2005a): Avaliação do impacto dos programas Bolsa
Escola sobre o trabalho infantil no Brasil. Pesquisa e Planejamento Econômico, 35, p.417.
Ferro A.R and Kassouf A.L. (2005b): “Efeitos do aumento da idade mínima legal no
trabalho dos brasileiros de 14 e 15 anos”, Revista de Economia e. Sociologia. Rural, 43 (2),
307-329.
French, J.L. (2002): “Adolescents Workers in the Third World Export Industries:
Attitudes of Young Brazilian Shoe Workers”. Industrial and Labor Relations Review 55
(2) 308-323.
Guiffrida, A., Iunes, R. F. and W. D. Savedoff (2005). Health and Poverty in Brazil:
Estimation by Structural Equation Model with Latent Variables. Inter-American
Development Bank Technical Note on Health No. 1.
Gunnarsson, V., P. F. Orazem, and M. A. Sánchez. (2006). “Child Labor and School Achievement in Latin America”. World Bank Economic Review. 20(1): 31-54.
84 BRAZILIAN SUCCESS IN REDUCING CHILD LABOUR:
EMPIRIRCAL EVIDENCE AND POLICY LESSONS
Gustafsson-Wright, E. and Pyne, H. (2002):” Gender Dimensions of Child Labor and Street Children in Brazil”. The World Bank. Policy Research Working Paper Series, The World Bank, Number 2897. Ilahi, N., Peter Orazem and Guilherme Sedlacek. (2001) “The Implications of Child Labor for Adult Wages, Income and Poverty: Retrospective Evidence from Brazil,” Mimeo, Iowa State University. International Labour Organisation (2009), “Bolsa Familia in Brazil : Context, concept and Impacts”, Geneva. Kassouf, A.L., Mckee, M. and Mossialos, E. (2001). "Early entrance to the job market and its effect on adult health: evidence from Brazil". Health policy and planning, Volume 16, Issue 1 , pp 21-28 .Oxford University Press 2001. Kassouf, A. L. (1998). Child labor in Brazil, Mimeo. London: Department of Economics, London School of Economics. Kruger, D. (2007): “Coffee production effects on child labor and schooling in rural Brazil.”Journal of Development Economics 82: 448-463. Kruger D., Soares R.R and Berthelon M (2007): "Household Choices of Child Labor and Schooling: A Simple Model with Application to Brazil," IZA Discussion Papers 2776, Institute for the Study of Labor (IZA). Lavinas, L., Barbosa, M. L., and Tourinho, O. (2001): Assessing Local Minimum Income Programmes in Brazil. ILO, World Bank & IPEA. Levison, D. (1991). Children’s Labor Force Activity and Schooling in Brazil Unpublished Ph.D. Dissertation, University of Michigan. Manacorda, Marco. and F. Rosati (2009), "Industrial Structure and Child Labor: Evidence from Brazil," forthcoming, Research in Labor Economics . Manacorda, Marco. and F. Rosati (2009), "Local labor demand and child labor", mimeo. UCW. Mello, L. and Hoppe, M. (2005): “Education attainment in Brazil: The experience of
FUNDEF Economics Department”. Organisation for Economic Co-operation and
Development, Working Paper No.424.
Menezes-Filho, N. and Pazello, E. (2007): “Do teachers’ wages matter for
proficiency? Evidence from a funding reform in Brazil”. Economics of Education Review
26 (2007) 660–672.
Menezes-Filho, N. and Pazello, E. (2004):“Evaluating the Effects of FUNDEF on
Wages and Test Scores in Brazil”.
Neri, M., Gustafsson-Wright, E., Sedlacek, and Orazem P., (2005): The Responses of Child Labour, School Enrollment, and Grade Repetition to the Loss of Parental
85 UCW WORKING PAPER SERIES, JUNE 2011
Earnings in Brazil, 1982-1999. World Bank Social Protection Discussion Paper Series, No.512.
Paruzzolo S. (2009): "The Impact of Programs Relating to Child Labour Prevention
and Children’s Protection: a review of impact evaluations up to 2007", UCW Working
Paper Series. Pianto, D., and S. Soares. 2004. “Use of Survey Design for the Evaluation of Social Programs: The PNAD and PETI.” Paper presented at the annual meetings of the Latin American and Caribbean Economic Association, October 2003, Puebla, Mexico Psacharopoulos, G. and A. Arriagada (1989), "The determinants of early age human capital formation: Evidence from Brazil," Economic Development and Cultural Change 37: 683–708. Ranjan, P. (2001), “Credit Constraints and the Phenomenon of Child Labor,” Journal of Development Economics, 64, 81-102. Rawlings L. and G. Rubio (2005): “Evaluating the Impact of conditional cash transfer programs”, The World Bank Research Observer, 20(1):29-55. Rizzini, I., I. Rizzini and de Holanda F. (1998): “Brazil: Children’s Strength is not in Their Work,” in Child Work and Education, Five Case Studies from Latin America, edited by Maria Cristina Salazar and Walter Alarcon Glasinovich, Florence: UNICEF. Santos F.C and Souza A.P (2007): "A Redução Do Trabalho Infantil E O Aumento Da Freqüência Escolar Na Década De 90 No Brasil," Anais do XXXV Encontro Nacional de Economia, 129, ANPEC - Associação Nacional dos Centros de Pósgraduação em Economia. Sedlacek, Guilherme, Suzanne Duryea, Nadeem Ilahi and Masaru Sasaki. 2005. Child Labor, Schooling, and Poverty in Latin America. World Bank Social Protection Discussion Paper No. 0511. Souza, A.P. (2006): “Fighting long-run poverty in Brazil: are conditional cash transfer programs making a difference?”, Sao Paulo school of Economics Getulio Vergas Foundation and Department of Labor Economics, Cornell University, Mimeo.
Spindel, C. R. (1985): O menor trabalhador: um assalariado registrado, Sao Paulo: Nobel. Koseleci N. and Rosati F.C (2009): “Child Labour and the Global Financial Crisis: an Issue Paper”, UCW Working Paper Series. United States Department of Labor, 2008 Findings on the Worst Forms of Child Labor - Brazil, 10 September 2009, available at: http://www.unhcr.org/refworld/docid/4aba3eed8.html [accessed 3 February 2010] World Bank (2009): “Conditional Cash Transfers”, World Bank Policy Research Report, Washington D.C.
86 BRAZILIAN SUCCESS IN REDUCING CHILD LABOUR:
EMPIRIRCAL EVIDENCE AND POLICY LESSONS
World Bank (2002): “Brazil: Fundescola III (Third School Improvement Project) Project Appraisal Document”. Report No. 23297-BR, Washington D.C. World Bank (2001a): “Brazil: An Assessment of the Bolsa Escola Programs”. Report No. 20208-BR, Washington D.C. World Bank (2001b): “Eradicating child labour in Brazil”. Report No. 20208-BR, Washington D.C.
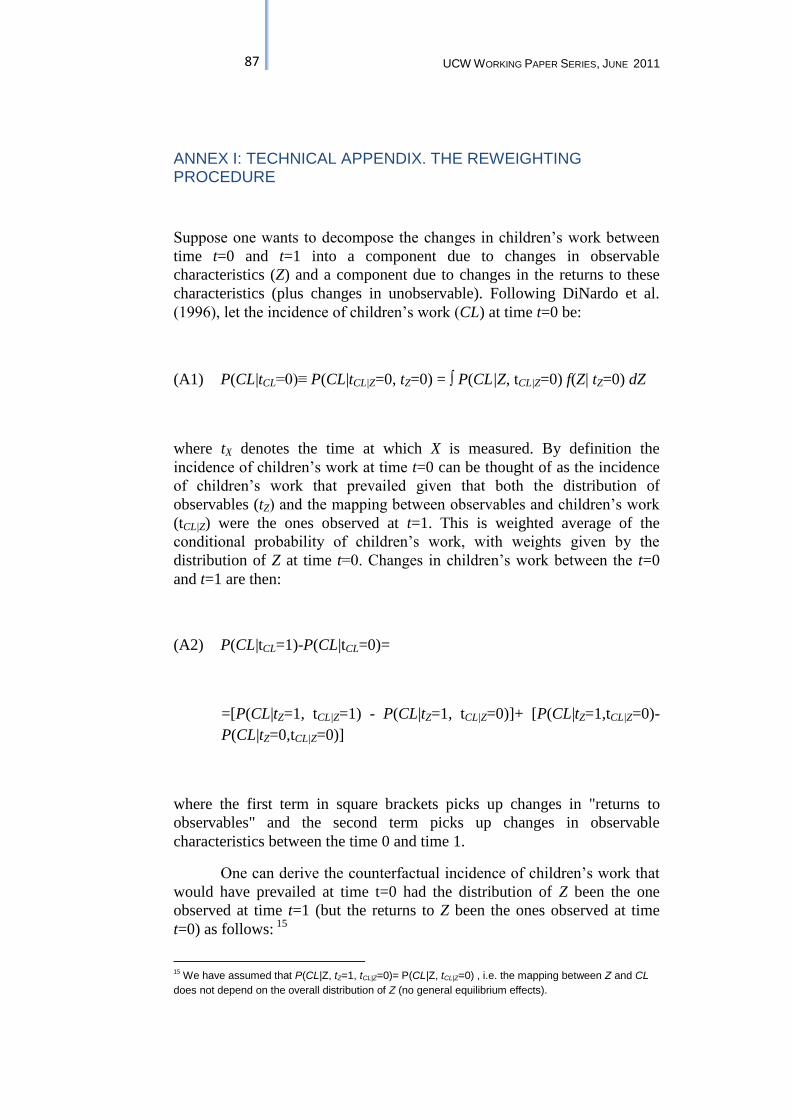
87 UCW WORKING PAPER SERIES, JUNE 2011
ANNEX I: TECHNICAL APPENDIX. THE REWEIGHTING PROCEDURE
Suppose one wants to decompose the changes in children’s work between
time t=0 and t=1 into a component due to changes in observable
characteristics (Z) and a component due to changes in the returns to these
characteristics (plus changes in unobservable). Following DiNardo et al.
(1996), let the incidence of children’s work (CL) at time t=0 be:
(A1) P(CL|tCL=0)≡ P(CL|tCL|Z=0, tZ=0) = P(CL|Z, tCL|Z=0) f(Z| tZ=0) dZ
where tX denotes the time at which X is measured. By definition the
incidence of children’s work at time t=0 can be thought of as the incidence
of children’s work that prevailed given that both the distribution of
observables (tZ) and the mapping between observables and children’s work
(tCL|Z) were the ones observed at t=1. This is weighted average of the
conditional probability of children’s work, with weights given by the
distribution of Z at time t=0. Changes in children’s work between the t=0
and t=1 are then:
(A2) P(CL|tCL=1)-P(CL|tCL=0)=
=[P(CL|tZ=1, tCL|Z=1) - P(CL|tZ=1, tCL|Z=0)]+ [P(CL|tZ=1,tCL|Z=0)-
P(CL|tZ=0,tCL|Z=0)]
where the first term in square brackets picks up changes in "returns to
observables" and the second term picks up changes in observable
characteristics between the time 0 and time 1.
One can derive the counterfactual incidence of children’s work that
would have prevailed at time t=0 had the distribution of Z been the one
observed at time t=1 (but the returns to Z been the ones observed at time
t=0) as follows: 15
15
We have assumed that P(CL|Z, tZ=1, tCL|Z=0)= P(CL|Z, tCL|Z=0) , i.e. the mapping between Z and CL
does not depend on the overall distribution of Z (no general equilibrium effects).
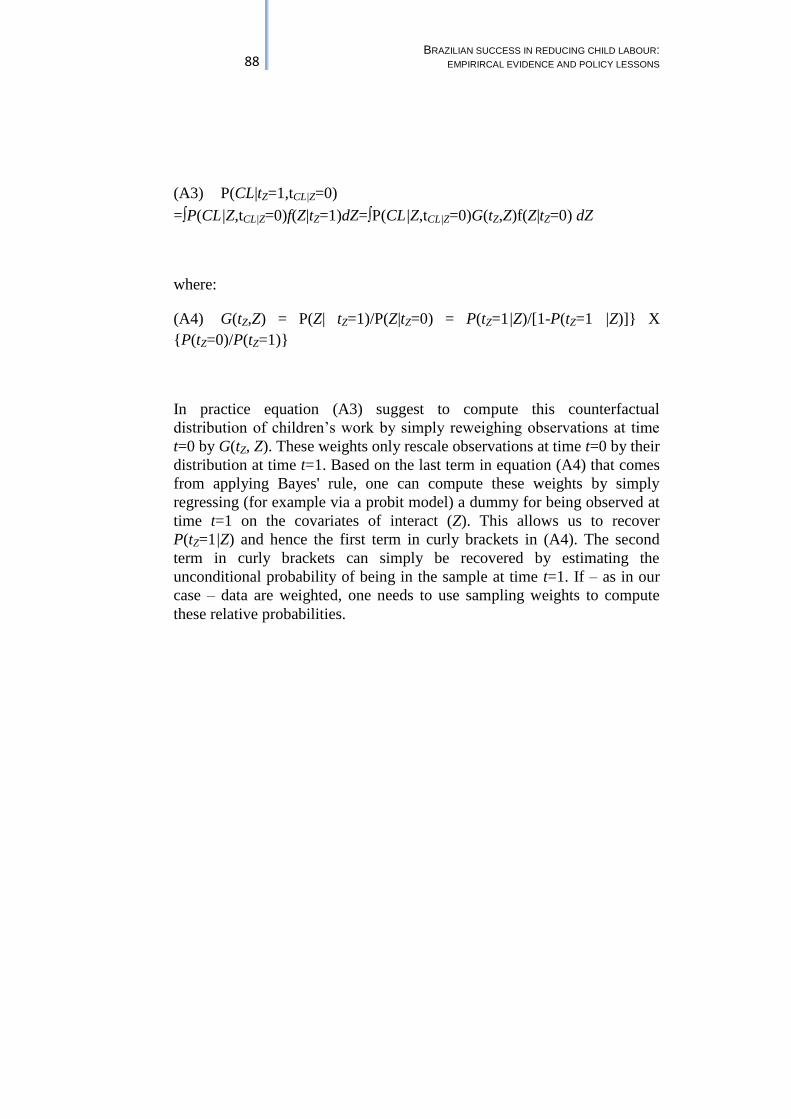
88 BRAZILIAN SUCCESS IN REDUCING CHILD LABOUR:
EMPIRIRCAL EVIDENCE AND POLICY LESSONS
(A3) P(CL|tZ=1,tCL|Z=0)
=P(CL|Z,tCL|Z=0)f(Z|tZ=1)dZ=P(CL|Z,tCL|Z=0)G(tZ,Z)f(Z|tZ=0) dZ
where:
(A4) G(tZ,Z) = P(Z| tZ=1)/P(Z|tZ=0) = P(tZ=1|Z)/[1-P(tZ=1 |Z)]} X
{P(tZ=0)/P(tZ=1)}
In practice equation (A3) suggest to compute this counterfactual
distribution of children’s work by simply reweighing observations at time
t=0 by G(tZ, Z). These weights only rescale observations at time t=0 by their
distribution at time t=1. Based on the last term in equation (A4) that comes
from applying Bayes' rule, one can compute these weights by simply
regressing (for example via a probit model) a dummy for being observed at
time t=1 on the covariates of interact (Z). This allows us to recover
P(tZ=1|Z) and hence the first term in curly brackets in (A4). The second
term in curly brackets can simply be recovered by estimating the
unconditional probability of being in the sample at time t=1. If – as in our
case – data are weighted, one needs to use sampling weights to compute
these relative probabilities.